Richland Parish, LA
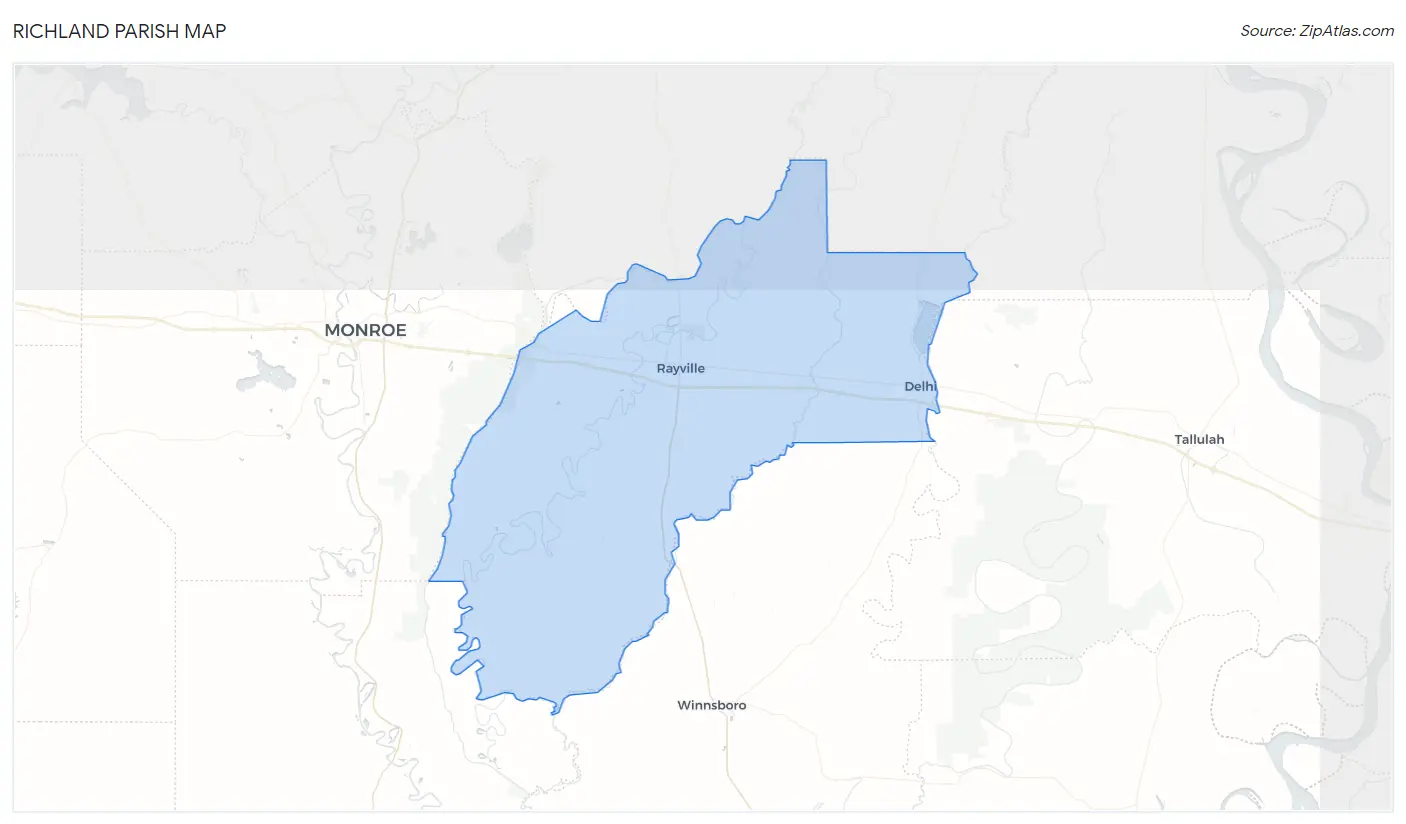
Richland Parish Map
Richland Parish Overview
20,028
TOTAL POPULATION
9,951
MALE POPULATION
10,077
FEMALE POPULATION
98.75
MALES / 100 FEMALES
101.27
FEMALES / 100 MALES
39.5
MEDIAN AGE
3.1
AVG FAMILY SIZE
2.6
AVG HOUSEHOLD SIZE
$25,285
PER CAPITA INCOME
$56,184
AVG FAMILY INCOME
$48,125
AVG HOUSEHOLD INCOME
36.8%
WAGE / INCOME GAP [ % ]
63.2¢/ $1
WAGE / INCOME GAP [ $ ]
$13,771
FAMILY INCOME DEFICIT
0.49
INEQUALITY / GINI INDEX
8,122
LABOR FORCE [ PEOPLE ]
51.3%
PERCENT IN LABOR FORCE
6.8%
UNEMPLOYMENT RATE
Richland Parish Area Codes
Race in Richland Parish
The most populous races in Richland Parish are White / Caucasian (12,270 | 61.3%), Black / African American (7,159 | 35.7%), and Hispanic or Latino (473 | 2.4%).
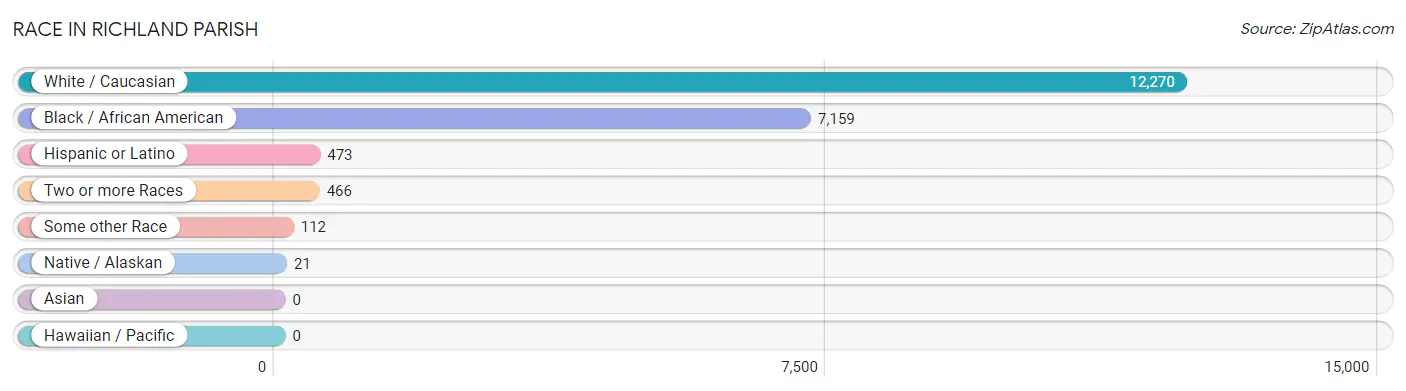
| Race | # Population | % Population |
| Asian | 0 | 0.0% |
| Black / African American | 7,159 | 35.7% |
| Hawaiian / Pacific | 0 | 0.0% |
| Hispanic or Latino | 473 | 2.4% |
| Native / Alaskan | 21 | 0.1% |
| White / Caucasian | 12,270 | 61.3% |
| Two or more Races | 466 | 2.3% |
| Some other Race | 112 | 0.6% |
| Total | 20,028 | 100.0% |
Ancestry in Richland Parish
The most populous ancestries reported in Richland Parish are American (2,279 | 11.4%), Irish (1,883 | 9.4%), English (815 | 4.1%), French (549 | 2.7%), and Scottish (482 | 2.4%), together accounting for 30.0% of all Richland Parish residents.
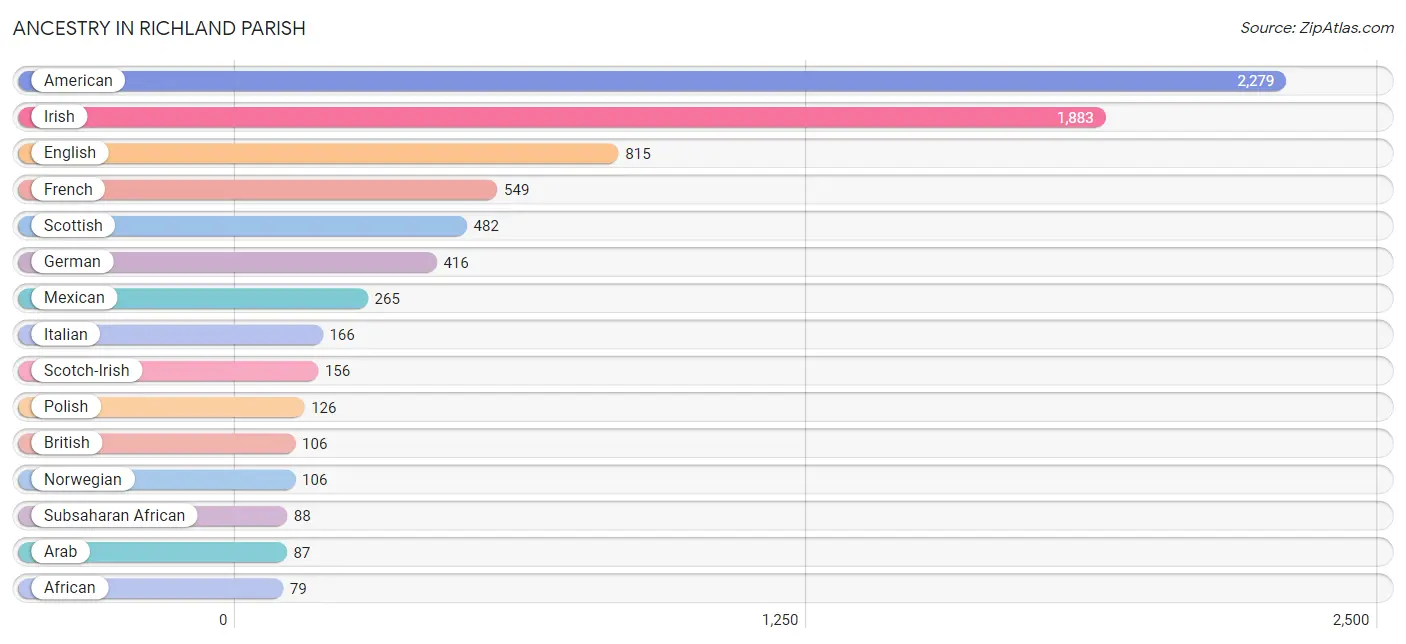
| Ancestry | # Population | % Population |
| African | 79 | 0.4% |
| American | 2,279 | 11.4% |
| Apache | 9 | 0.0% |
| Arab | 87 | 0.4% |
| British | 106 | 0.5% |
| Burmese | 73 | 0.4% |
| Cajun | 32 | 0.2% |
| Central American | 5 | 0.0% |
| Cherokee | 42 | 0.2% |
| Choctaw | 20 | 0.1% |
| Cuban | 21 | 0.1% |
| Czechoslovakian | 31 | 0.2% |
| Danish | 9 | 0.0% |
| Dominican | 10 | 0.1% |
| Dutch | 63 | 0.3% |
| Eastern European | 7 | 0.0% |
| English | 815 | 4.1% |
| European | 55 | 0.3% |
| Finnish | 10 | 0.1% |
| French | 549 | 2.7% |
| French Canadian | 25 | 0.1% |
| German | 416 | 2.1% |
| Honduran | 5 | 0.0% |
| Houma | 1 | 0.0% |
| Irish | 1,883 | 9.4% |
| Italian | 166 | 0.8% |
| Jamaican | 10 | 0.1% |
| Korean | 17 | 0.1% |
| Mexican | 265 | 1.3% |
| Mexican American Indian | 1 | 0.0% |
| Norwegian | 106 | 0.5% |
| Polish | 126 | 0.6% |
| Puerto Rican | 20 | 0.1% |
| Scotch-Irish | 156 | 0.8% |
| Scottish | 482 | 2.4% |
| Sioux | 20 | 0.1% |
| South African | 9 | 0.0% |
| Spanish | 50 | 0.3% |
| Subsaharan African | 88 | 0.4% |
| Swedish | 34 | 0.2% |
| Ukrainian | 11 | 0.1% |
| Welsh | 2 | 0.0% | View All 42 Rows |
Immigrants in Richland Parish
The most numerous immigrant groups reported in Richland Parish came from Asia (93 | 0.5%), Central America (92 | 0.5%), Latin America (92 | 0.5%), Mexico (92 | 0.5%), and Western Asia (87 | 0.4%), together accounting for 2.3% of all Richland Parish residents.
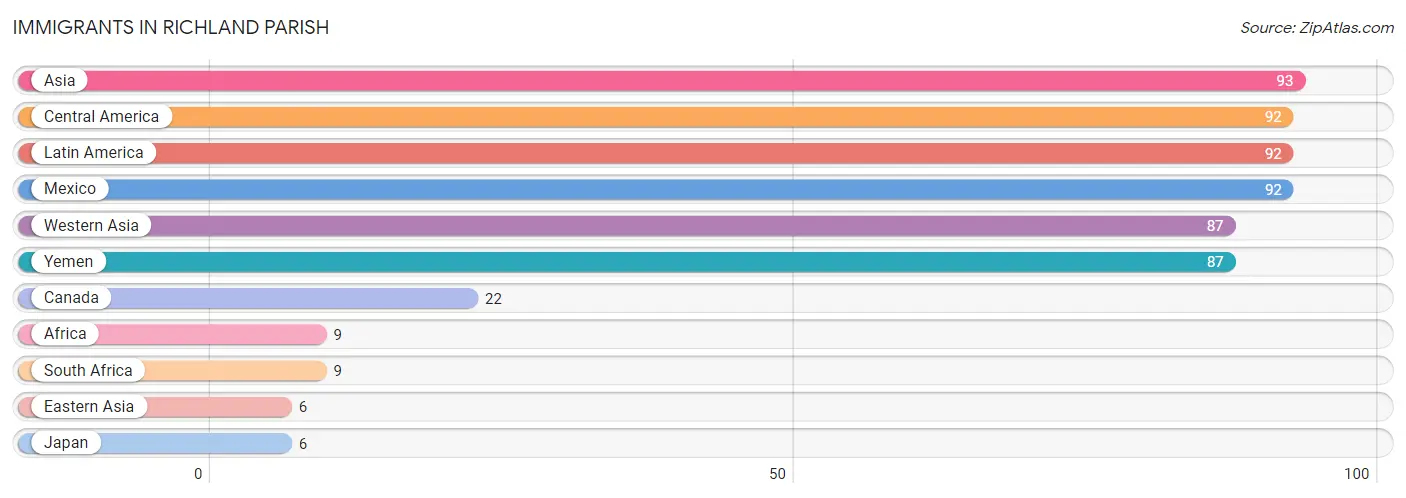
| Immigration Origin | # Population | % Population |
| Africa | 9 | 0.0% |
| Asia | 93 | 0.5% |
| Canada | 22 | 0.1% |
| Central America | 92 | 0.5% |
| Eastern Asia | 6 | 0.0% |
| Japan | 6 | 0.0% |
| Latin America | 92 | 0.5% |
| Mexico | 92 | 0.5% |
| South Africa | 9 | 0.0% |
| Western Asia | 87 | 0.4% |
| Yemen | 87 | 0.4% | View All 11 Rows |
Sex and Age in Richland Parish
Sex and Age in Richland Parish
The most populous age groups in Richland Parish are 10 to 14 Years (834 | 8.4%) for men and 60 to 64 Years (762 | 7.6%) for women.
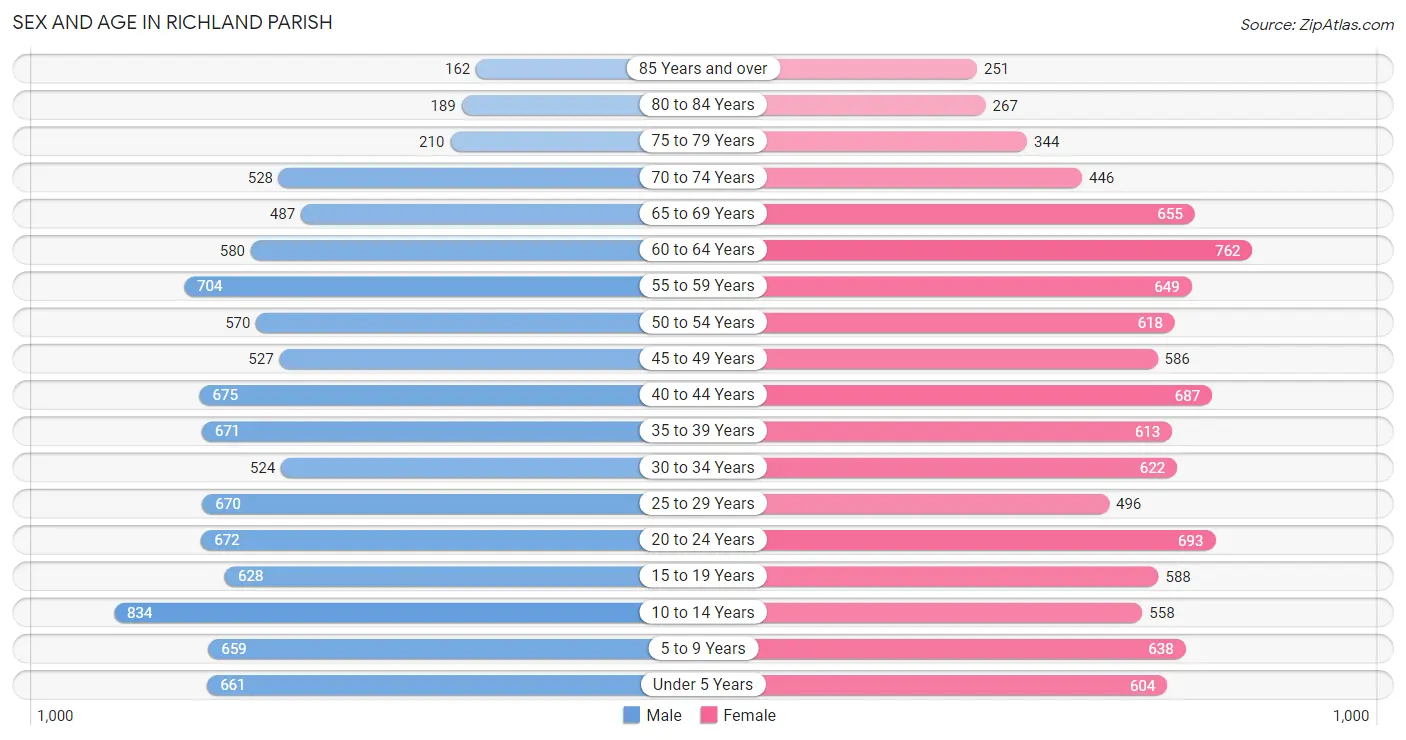
| Age Bracket | Male | Female |
| Under 5 Years | 661 (6.6%) | 604 (6.0%) |
| 5 to 9 Years | 659 (6.6%) | 638 (6.3%) |
| 10 to 14 Years | 834 (8.4%) | 558 (5.5%) |
| 15 to 19 Years | 628 (6.3%) | 588 (5.8%) |
| 20 to 24 Years | 672 (6.8%) | 693 (6.9%) |
| 25 to 29 Years | 670 (6.7%) | 496 (4.9%) |
| 30 to 34 Years | 524 (5.3%) | 622 (6.2%) |
| 35 to 39 Years | 671 (6.7%) | 613 (6.1%) |
| 40 to 44 Years | 675 (6.8%) | 687 (6.8%) |
| 45 to 49 Years | 527 (5.3%) | 586 (5.8%) |
| 50 to 54 Years | 570 (5.7%) | 618 (6.1%) |
| 55 to 59 Years | 704 (7.1%) | 649 (6.4%) |
| 60 to 64 Years | 580 (5.8%) | 762 (7.6%) |
| 65 to 69 Years | 487 (4.9%) | 655 (6.5%) |
| 70 to 74 Years | 528 (5.3%) | 446 (4.4%) |
| 75 to 79 Years | 210 (2.1%) | 344 (3.4%) |
| 80 to 84 Years | 189 (1.9%) | 267 (2.6%) |
| 85 Years and over | 162 (1.6%) | 251 (2.5%) |
| Total | 9,951 (100.0%) | 10,077 (100.0%) |
Families and Households in Richland Parish
Median Family Size in Richland Parish
The median family size in Richland Parish is 3.15 persons per family, with single female/mother families (1,224 | 24.1%) accounting for the largest median family size of 3.44 persons per family. On the other hand, married-couple families (3,250 | 63.9%) represent the smallest median family size with 3.05 persons per family.
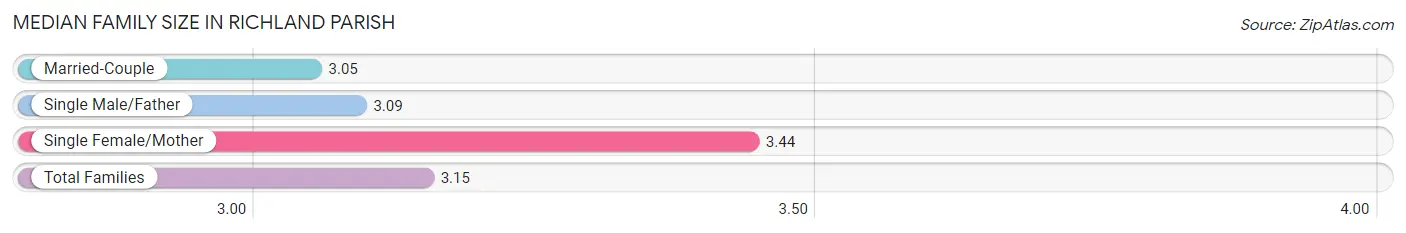
| Family Type | # Families | Family Size |
| Married-Couple | 3,250 (63.9%) | 3.05 |
| Single Male/Father | 611 (12.0%) | 3.09 |
| Single Female/Mother | 1,224 (24.1%) | 3.44 |
| Total Families | 5,085 (100.0%) | 3.15 |
Median Household Size in Richland Parish
The median household size in Richland Parish is 2.59 persons per household, with single male/father households (611 | 8.4%) accounting for the largest median household size of 3.55 persons per household. non-family households (2,210 | 30.3%) represent the smallest median household size with 1.12 persons per household.
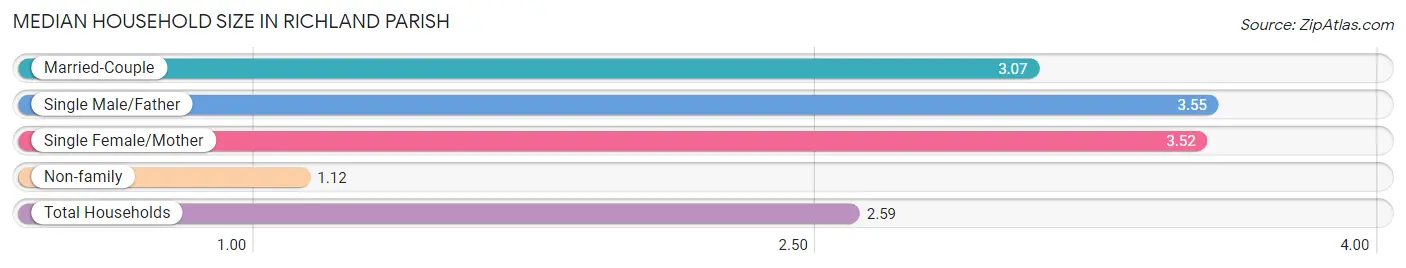
| Household Type | # Households | Household Size |
| Married-Couple | 3,250 (44.6%) | 3.07 |
| Single Male/Father | 611 (8.4%) | 3.55 |
| Single Female/Mother | 1,224 (16.8%) | 3.52 |
| Non-family | 2,210 (30.3%) | 1.12 |
| Total Households | 7,295 (100.0%) | 2.59 |
Household Size by Marriage Status in Richland Parish
Out of a total of 7,295 households in Richland Parish, 5,085 (69.7%) are family households, while 2,210 (30.3%) are nonfamily households. The most numerous type of family households are 2-person households, comprising 2,431, and the most common type of nonfamily households are 1-person households, comprising 1,879.
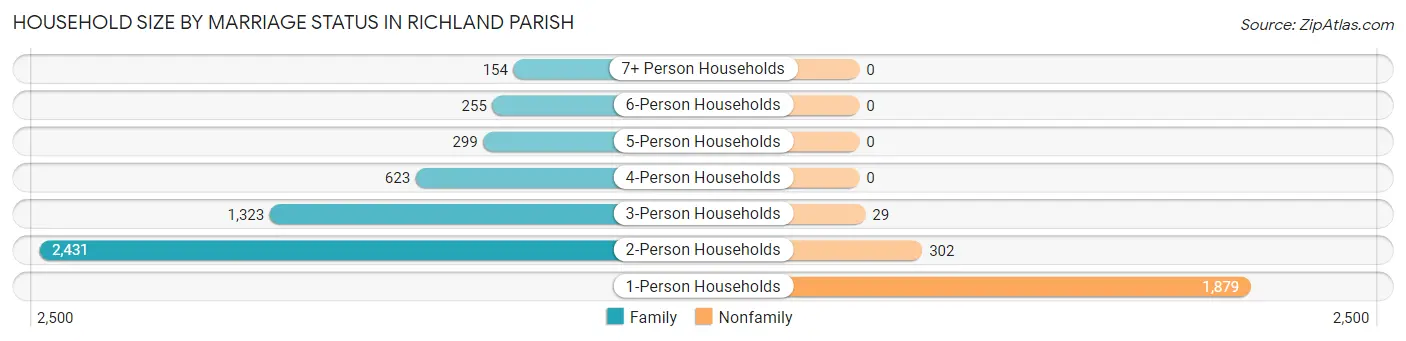
| Household Size | Family Households | Nonfamily Households |
| 1-Person Households | - | 1,879 (25.8%) |
| 2-Person Households | 2,431 (33.3%) | 302 (4.1%) |
| 3-Person Households | 1,323 (18.1%) | 29 (0.4%) |
| 4-Person Households | 623 (8.5%) | 0 (0.0%) |
| 5-Person Households | 299 (4.1%) | 0 (0.0%) |
| 6-Person Households | 255 (3.5%) | 0 (0.0%) |
| 7+ Person Households | 154 (2.1%) | 0 (0.0%) |
| Total | 5,085 (69.7%) | 2,210 (30.3%) |
Female Fertility in Richland Parish
Fertility by Age in Richland Parish
Average fertility rate in Richland Parish is 84.0 births per 1,000 women. Women in the age bracket of 15 to 19 years have the highest fertility rate with 117.0 births per 1,000 women. Women in the age bracket of 20 to 34 years acount for 50.7% of all women with births.
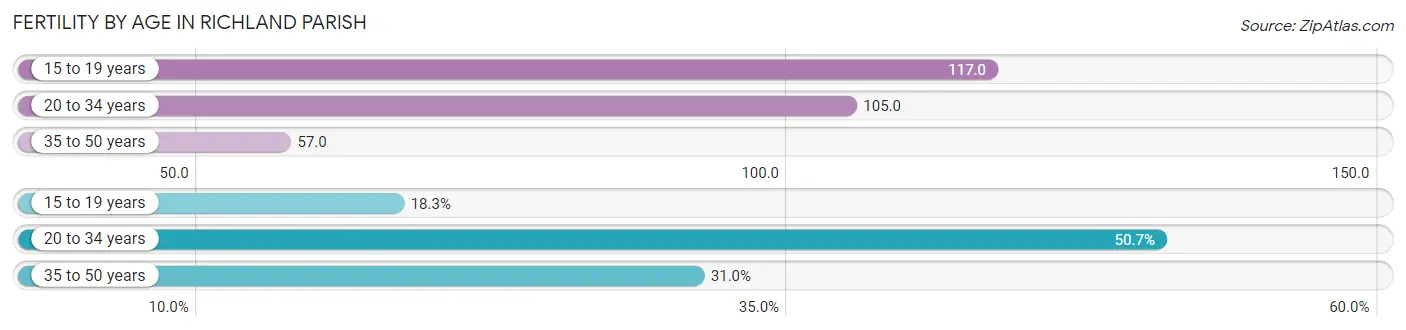
| Age Bracket | Women with Births | Births / 1,000 Women |
| 15 to 19 years | 69 (18.3%) | 117.0 |
| 20 to 34 years | 191 (50.7%) | 105.0 |
| 35 to 50 years | 117 (31.0%) | 57.0 |
| Total | 377 (100.0%) | 84.0 |
Fertility by Age by Marriage Status in Richland Parish
45.9% of women with births (377) in Richland Parish are married. The highest percentage of unmarried women with births falls into 15 to 19 years age bracket with 100.0% of them unmarried at the time of birth, while the lowest percentage of unmarried women with births belong to 35 to 50 years age bracket with 0.0% of them unmarried.
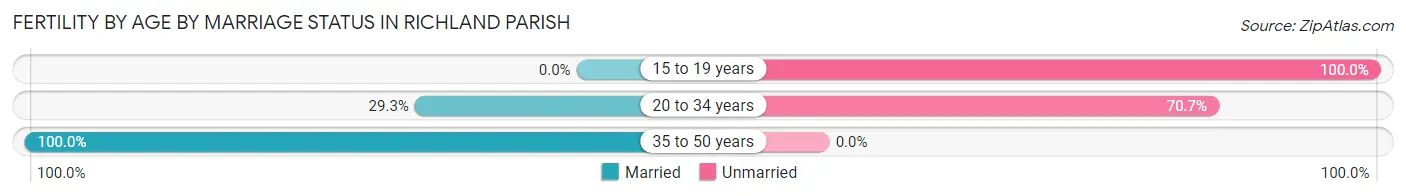
| Age Bracket | Married | Unmarried |
| 15 to 19 years | 0 (0.0%) | 69 (100.0%) |
| 20 to 34 years | 56 (29.3%) | 135 (70.7%) |
| 35 to 50 years | 117 (100.0%) | 0 (0.0%) |
| Total | 173 (45.9%) | 204 (54.1%) |
Fertility by Education in Richland Parish
Average fertility rate in Richland Parish is 84.0 births per 1,000 women. Women with the education attainment of less than high school have the highest fertility rate of 140.0 births per 1,000 women, while women with the education attainment of graduate degree have the lowest fertility at 33.0 births per 1,000 women. Women with the education attainment of high school diploma represent 40.1% of all women with births.
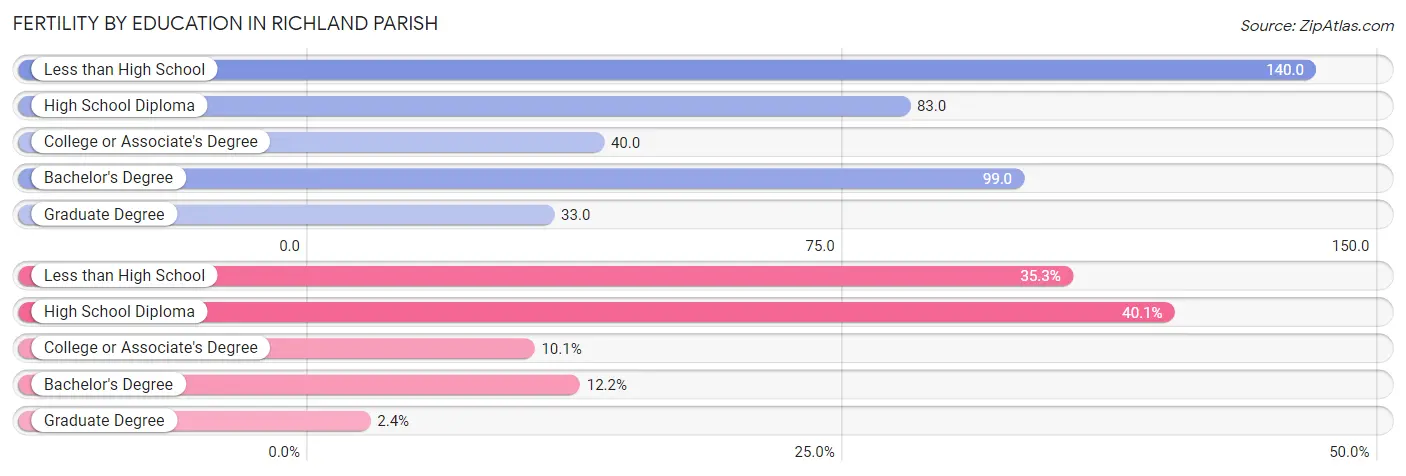
| Educational Attainment | Women with Births | Births / 1,000 Women |
| Less than High School | 133 (35.3%) | 140.0 |
| High School Diploma | 151 (40.1%) | 83.0 |
| College or Associate's Degree | 38 (10.1%) | 40.0 |
| Bachelor's Degree | 46 (12.2%) | 99.0 |
| Graduate Degree | 9 (2.4%) | 33.0 |
| Total | 377 (100.0%) | 84.0 |
Fertility by Education by Marriage Status in Richland Parish
54.1% of women with births in Richland Parish are unmarried. Women with the educational attainment of bachelor's degree are most likely to be married with 100.0% of them married at childbirth, while women with the educational attainment of high school diploma are least likely to be married with 85.4% of them unmarried at childbirth.
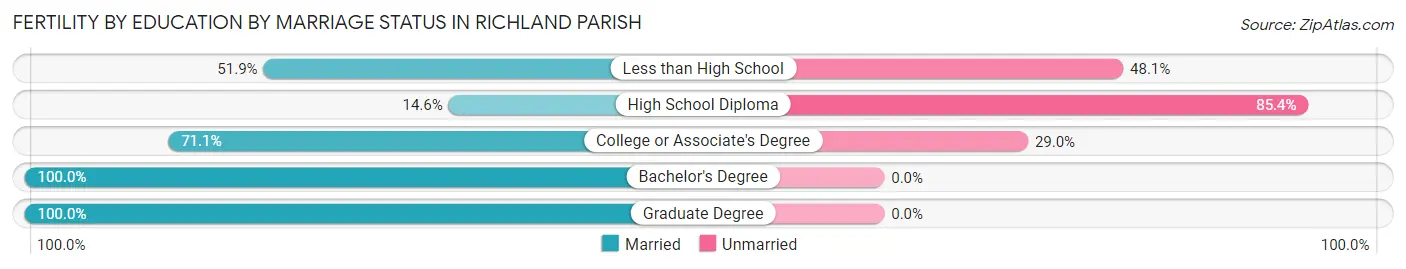
| Educational Attainment | Married | Unmarried |
| Less than High School | 69 (51.9%) | 64 (48.1%) |
| High School Diploma | 22 (14.6%) | 129 (85.4%) |
| College or Associate's Degree | 27 (71.1%) | 11 (28.9%) |
| Bachelor's Degree | 46 (100.0%) | 0 (0.0%) |
| Graduate Degree | 9 (100.0%) | 0 (0.0%) |
| Total | 173 (45.9%) | 204 (54.1%) |
Income in Richland Parish
Income Overview in Richland Parish
Per Capita Income in Richland Parish is $25,285, while median incomes of families and households are $56,184 and $48,125 respectively.
| Characteristic | Number | Measure |
| Per Capita Income | 20,028 | $25,285 |
| Median Family Income | 5,085 | $56,184 |
| Mean Family Income | 5,085 | $77,978 |
| Median Household Income | 7,295 | $48,125 |
| Mean Household Income | 7,295 | $66,114 |
| Income Deficit | 5,085 | $13,771 |
| Wage / Income Gap (%) | 20,028 | 36.77% |
| Wage / Income Gap ($) | 20,028 | 63.23¢ per $1 |
| Gini / Inequality Index | 20,028 | 0.49 |
Earnings by Sex in Richland Parish
Average Earnings in Richland Parish are $35,503, $44,688 for men and $28,257 for women, a difference of 36.8%.
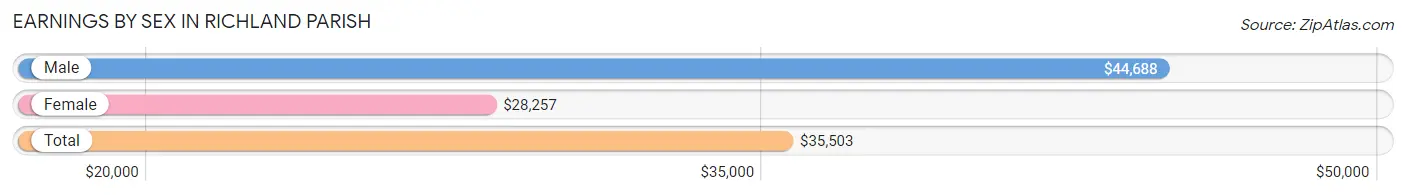
| Sex | Number | Average Earnings |
| Male | 4,136 (49.0%) | $44,688 |
| Female | 4,307 (51.0%) | $28,257 |
| Total | 8,443 (100.0%) | $35,503 |
Earnings by Sex by Income Bracket in Richland Parish
The most common earnings brackets in Richland Parish are $100,000+ for men (524 | 12.7%) and $15,000 to $17,499 for women (436 | 10.1%).
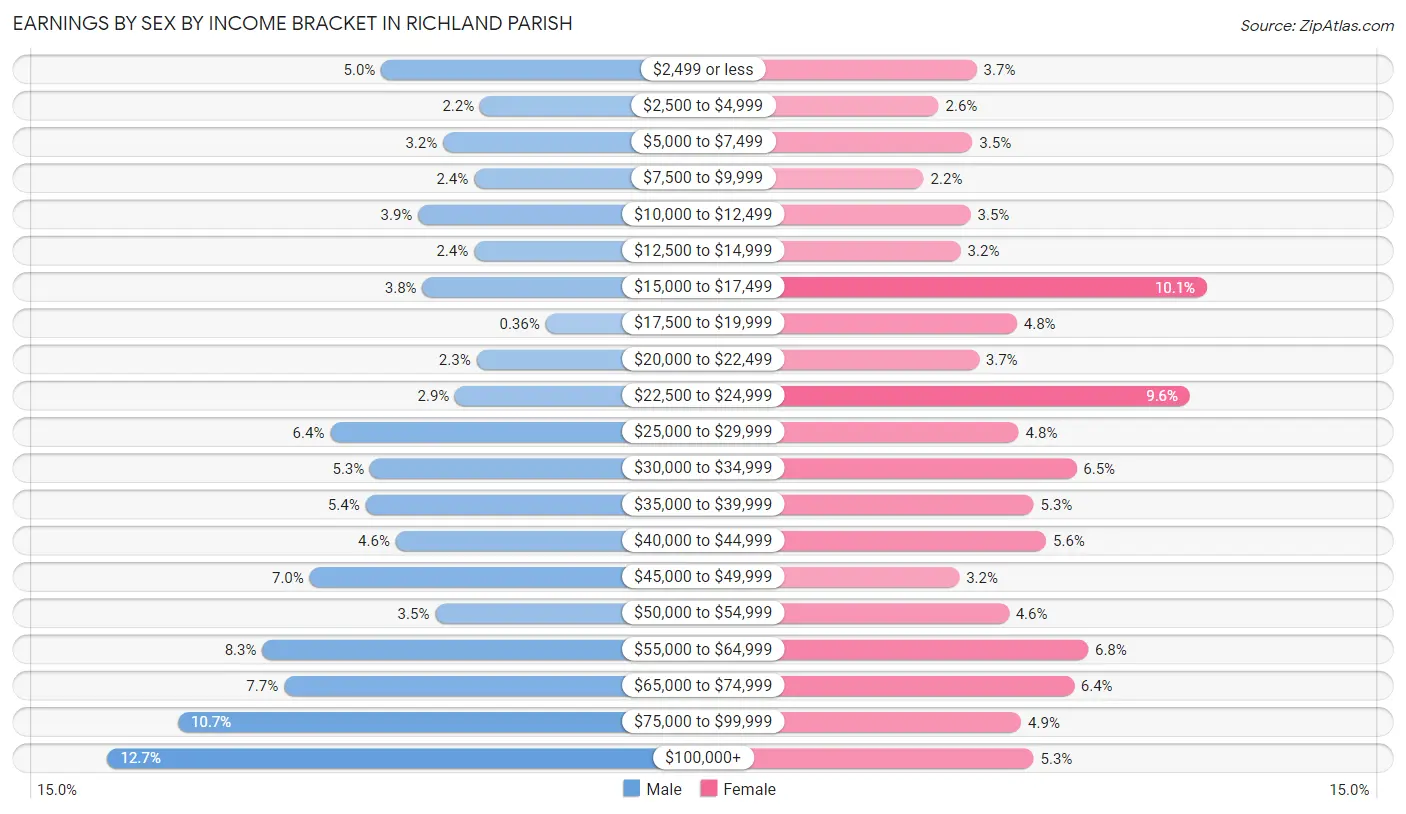
| Income | Male | Female |
| $2,499 or less | 206 (5.0%) | 157 (3.6%) |
| $2,500 to $4,999 | 91 (2.2%) | 111 (2.6%) |
| $5,000 to $7,499 | 134 (3.2%) | 152 (3.5%) |
| $7,500 to $9,999 | 98 (2.4%) | 93 (2.2%) |
| $10,000 to $12,499 | 163 (3.9%) | 150 (3.5%) |
| $12,500 to $14,999 | 98 (2.4%) | 138 (3.2%) |
| $15,000 to $17,499 | 158 (3.8%) | 436 (10.1%) |
| $17,500 to $19,999 | 15 (0.4%) | 206 (4.8%) |
| $20,000 to $22,499 | 95 (2.3%) | 160 (3.7%) |
| $22,500 to $24,999 | 120 (2.9%) | 415 (9.6%) |
| $25,000 to $29,999 | 265 (6.4%) | 208 (4.8%) |
| $30,000 to $34,999 | 219 (5.3%) | 278 (6.5%) |
| $35,000 to $39,999 | 224 (5.4%) | 226 (5.2%) |
| $40,000 to $44,999 | 189 (4.6%) | 241 (5.6%) |
| $45,000 to $49,999 | 289 (7.0%) | 136 (3.2%) |
| $50,000 to $54,999 | 143 (3.5%) | 196 (4.5%) |
| $55,000 to $64,999 | 344 (8.3%) | 292 (6.8%) |
| $65,000 to $74,999 | 319 (7.7%) | 275 (6.4%) |
| $75,000 to $99,999 | 442 (10.7%) | 211 (4.9%) |
| $100,000+ | 524 (12.7%) | 226 (5.2%) |
| Total | 4,136 (100.0%) | 4,307 (100.0%) |
Earnings by Sex by Educational Attainment in Richland Parish
Average earnings in Richland Parish are $46,137 for men and $32,005 for women, a difference of 30.6%. Men with an educational attainment of graduate degree enjoy the highest average annual earnings of $79,211, while those with less than high school education earn the least with $32,071. Women with an educational attainment of graduate degree earn the most with the average annual earnings of $65,771, while those with less than high school education have the smallest earnings of $15,874.
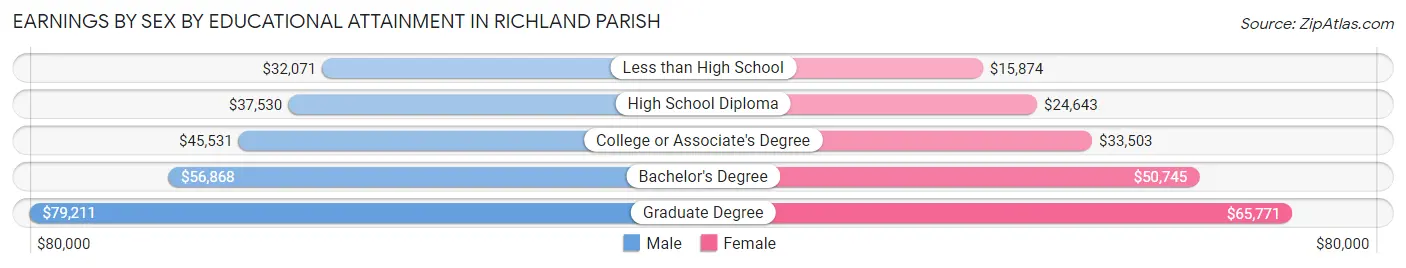
| Educational Attainment | Male Income | Female Income |
| Less than High School | $32,071 | $15,874 |
| High School Diploma | $37,530 | $24,643 |
| College or Associate's Degree | $45,531 | $33,503 |
| Bachelor's Degree | $56,868 | $50,745 |
| Graduate Degree | $79,211 | $65,771 |
| Total | $46,137 | $32,005 |
Family Income in Richland Parish
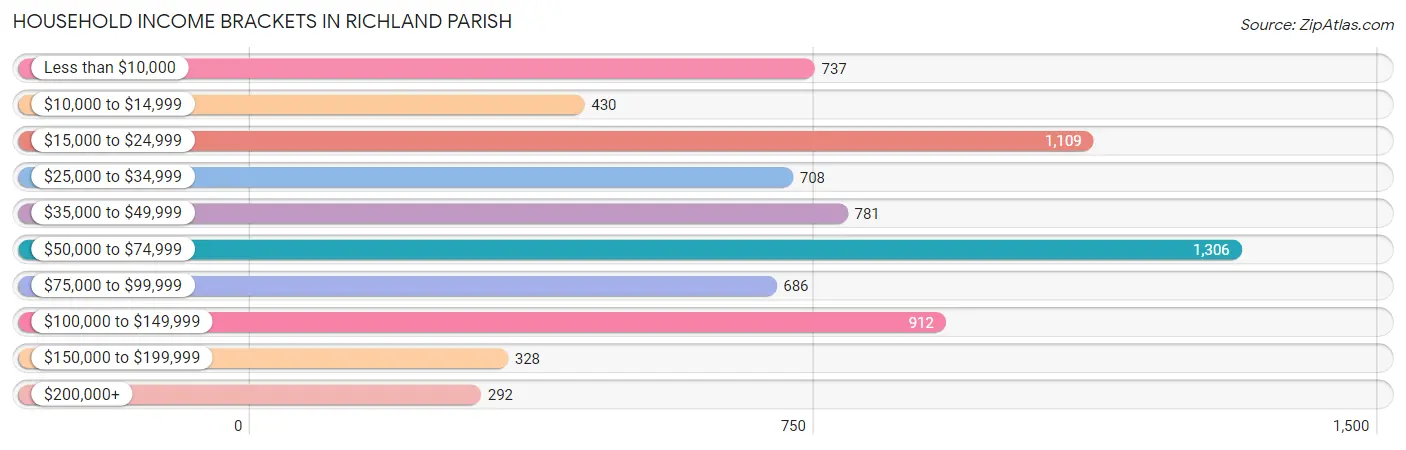
Family Income Brackets in Richland Parish
According to the Richland Parish family income data, there are 895 families falling into the $50,000 to $74,999 income range, which is the most common income bracket and makes up 17.6% of all families. Conversely, the $10,000 to $14,999 income bracket is the least frequent group with only 183 families (3.6%) belonging to this category.
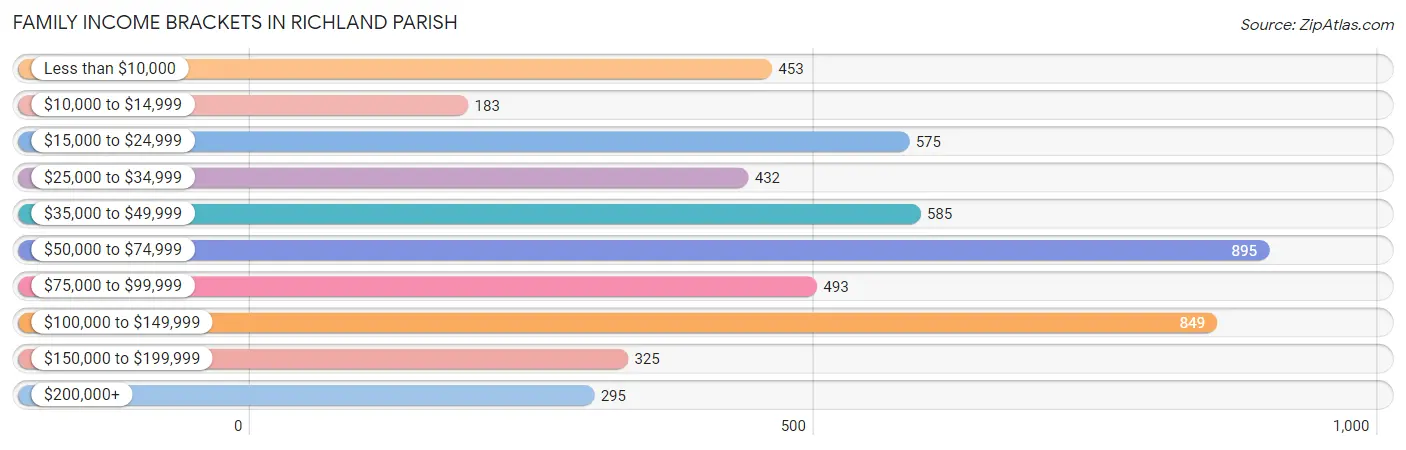
| Income Bracket | # Families | % Families |
| Less than $10,000 | 453 | 8.9% |
| $10,000 to $14,999 | 183 | 3.6% |
| $15,000 to $24,999 | 575 | 11.3% |
| $25,000 to $34,999 | 432 | 8.5% |
| $35,000 to $49,999 | 585 | 11.5% |
| $50,000 to $74,999 | 895 | 17.6% |
| $75,000 to $99,999 | 493 | 9.7% |
| $100,000 to $149,999 | 849 | 16.7% |
| $150,000 to $199,999 | 325 | 6.4% |
| $200,000+ | 295 | 5.8% |
Family Income by Famaliy Size in Richland Parish
5-person families (244 | 4.8%) account for the highest median family income in Richland Parish with $100,724 per family, while 2-person families (2,546 | 50.1%) have the highest median income of $26,671 per family member.
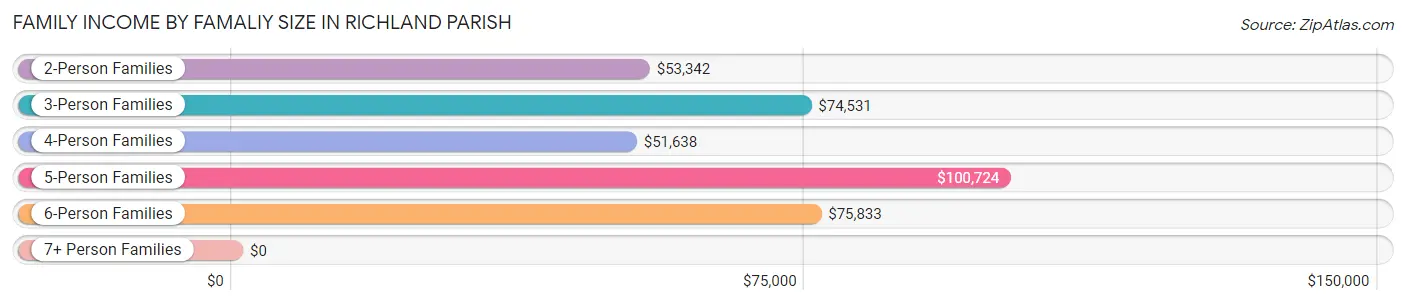
| Income Bracket | # Families | Median Income |
| 2-Person Families | 2,546 (50.1%) | $53,342 |
| 3-Person Families | 1,272 (25.0%) | $74,531 |
| 4-Person Families | 658 (12.9%) | $51,638 |
| 5-Person Families | 244 (4.8%) | $100,724 |
| 6-Person Families | 220 (4.3%) | $75,833 |
| 7+ Person Families | 145 (2.9%) | $0 |
| Total | 5,085 (100.0%) | $56,184 |
Family Income by Number of Earners in Richland Parish
The median family income in Richland Parish is $56,184, with families comprising 3+ earners (419) having the highest median family income of $129,063, while families with no earners (1,064) have the lowest median family income of $25,245, accounting for 8.2% and 20.9% of families, respectively.
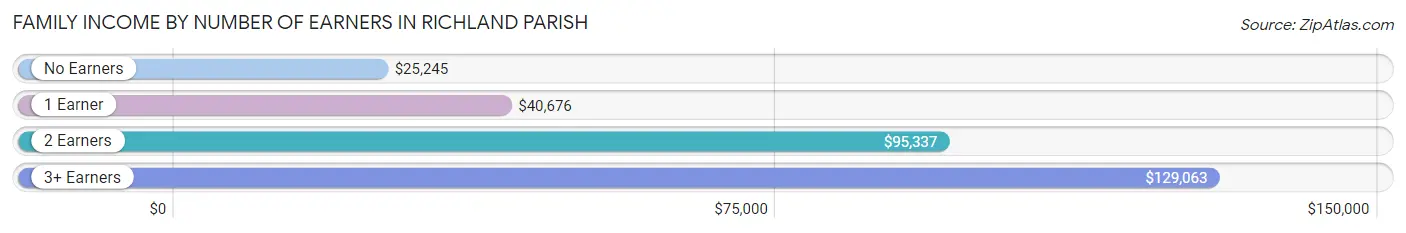
| Number of Earners | # Families | Median Income |
| No Earners | 1,064 (20.9%) | $25,245 |
| 1 Earner | 1,956 (38.5%) | $40,676 |
| 2 Earners | 1,646 (32.4%) | $95,337 |
| 3+ Earners | 419 (8.2%) | $129,063 |
| Total | 5,085 (100.0%) | $56,184 |
Household Income in Richland Parish
Household Income Brackets in Richland Parish
With 1,306 households falling in the category, the $50,000 to $74,999 income range is the most frequent in Richland Parish, accounting for 17.9% of all households. In contrast, only 292 households (4.0%) fall into the $200,000+ income bracket, making it the least populous group.
| Income Bracket | # Households | % Households |
| Less than $10,000 | 737 | 10.1% |
| $10,000 to $14,999 | 430 | 5.9% |
| $15,000 to $24,999 | 1,109 | 15.2% |
| $25,000 to $34,999 | 708 | 9.7% |
| $35,000 to $49,999 | 781 | 10.7% |
| $50,000 to $74,999 | 1,306 | 17.9% |
| $75,000 to $99,999 | 686 | 9.4% |
| $100,000 to $149,999 | 912 | 12.5% |
| $150,000 to $199,999 | 328 | 4.5% |
| $200,000+ | 292 | 4.0% |
Household Income by Householder Age in Richland Parish
The median household income in Richland Parish is $48,125, with the highest median household income of $57,178 found in the 45 to 64 years age bracket for the primary householder. A total of 2,633 households (36.1%) fall into this category. Meanwhile, the 15 to 24 years age bracket for the primary householder has the lowest median household income of $24,035, with 503 households (6.9%) in this group.
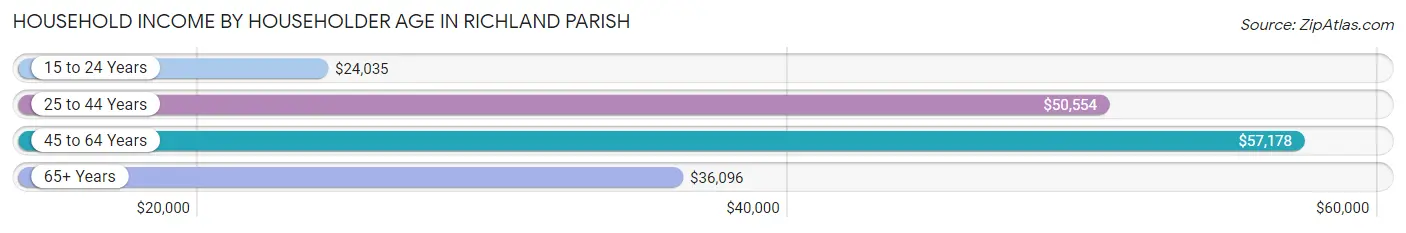
| Income Bracket | # Households | Median Income |
| 15 to 24 Years | 503 (6.9%) | $24,035 |
| 25 to 44 Years | 2,011 (27.6%) | $50,554 |
| 45 to 64 Years | 2,633 (36.1%) | $57,178 |
| 65+ Years | 2,148 (29.4%) | $36,096 |
| Total | 7,295 (100.0%) | $48,125 |
Poverty in Richland Parish
Income Below Poverty by Sex and Age in Richland Parish
With 24.8% poverty level for males and 23.4% for females among the residents of Richland Parish, under 5 year old males and 18 to 24 year old females are the most vulnerable to poverty, with 382 males (57.8%) and 349 females (39.3%) in their respective age groups living below the poverty level.
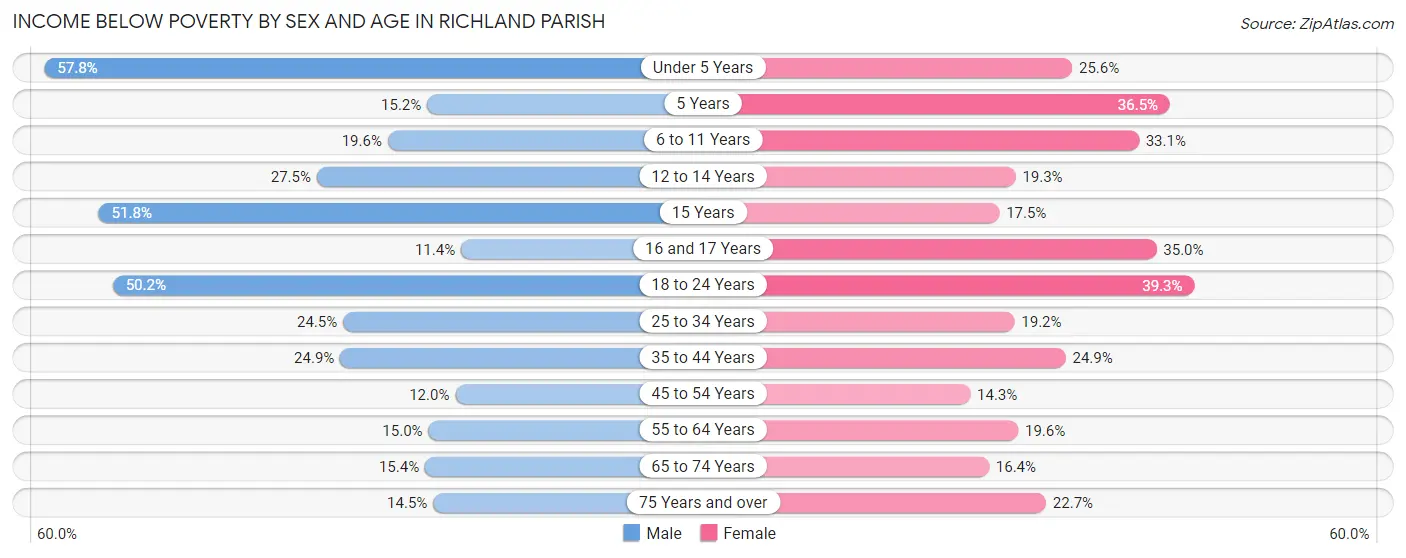
| Age Bracket | Male | Female |
| Under 5 Years | 382 (57.8%) | 150 (25.6%) |
| 5 Years | 22 (15.2%) | 19 (36.5%) |
| 6 to 11 Years | 170 (19.6%) | 297 (33.1%) |
| 12 to 14 Years | 131 (27.5%) | 47 (19.3%) |
| 15 Years | 74 (51.7%) | 17 (17.5%) |
| 16 and 17 Years | 31 (11.4%) | 103 (35.0%) |
| 18 to 24 Years | 414 (50.2%) | 349 (39.3%) |
| 25 to 34 Years | 256 (24.5%) | 213 (19.2%) |
| 35 to 44 Years | 268 (24.9%) | 324 (24.9%) |
| 45 to 54 Years | 119 (12.0%) | 172 (14.3%) |
| 55 to 64 Years | 168 (15.0%) | 277 (19.6%) |
| 65 to 74 Years | 153 (15.4%) | 180 (16.4%) |
| 75 Years and over | 77 (14.5%) | 178 (22.7%) |
| Total | 2,265 (24.8%) | 2,326 (23.4%) |
Income Above Poverty by Sex and Age in Richland Parish
According to the poverty statistics in Richland Parish, males aged 16 and 17 years and females aged 45 to 54 years are the age groups that are most secure financially, with 88.6% of males and 85.7% of females in these age groups living above the poverty line.
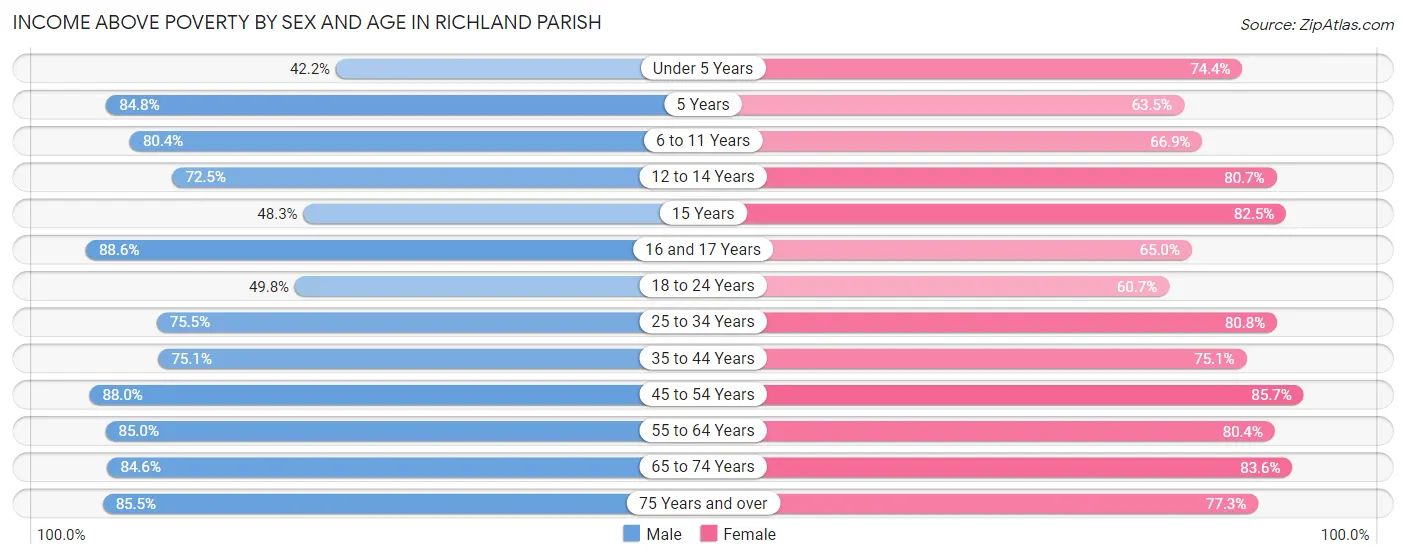
| Age Bracket | Male | Female |
| Under 5 Years | 279 (42.2%) | 435 (74.4%) |
| 5 Years | 123 (84.8%) | 33 (63.5%) |
| 6 to 11 Years | 699 (80.4%) | 601 (66.9%) |
| 12 to 14 Years | 346 (72.5%) | 196 (80.7%) |
| 15 Years | 69 (48.2%) | 80 (82.5%) |
| 16 and 17 Years | 241 (88.6%) | 191 (65.0%) |
| 18 to 24 Years | 411 (49.8%) | 540 (60.7%) |
| 25 to 34 Years | 787 (75.5%) | 895 (80.8%) |
| 35 to 44 Years | 810 (75.1%) | 976 (75.1%) |
| 45 to 54 Years | 869 (88.0%) | 1,032 (85.7%) |
| 55 to 64 Years | 950 (85.0%) | 1,134 (80.4%) |
| 65 to 74 Years | 840 (84.6%) | 919 (83.6%) |
| 75 Years and over | 454 (85.5%) | 605 (77.3%) |
| Total | 6,878 (75.2%) | 7,637 (76.6%) |
Income Below Poverty Among Married-Couple Families in Richland Parish
The poverty statistics for married-couple families in Richland Parish show that 7.0% or 229 of the total 3,250 families live below the poverty line. Families with 3 or 4 children have the highest poverty rate of 26.8%, comprising of 84 families. On the other hand, families with no children have the lowest poverty rate of 3.7%, which includes 74 families.
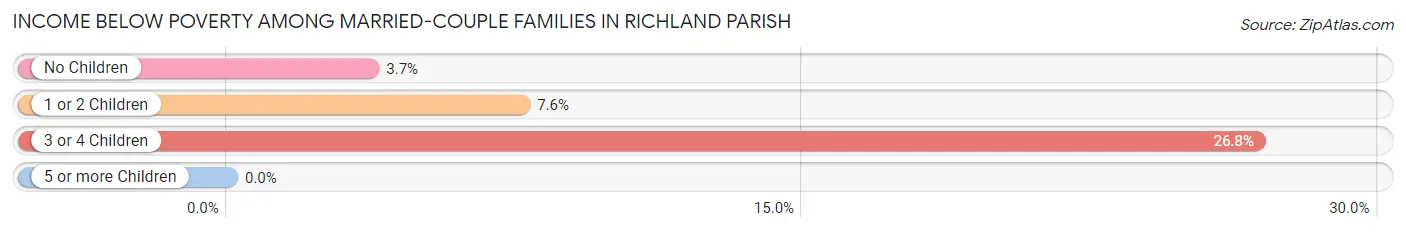
| Children | Above Poverty | Below Poverty |
| No Children | 1,932 (96.3%) | 74 (3.7%) |
| 1 or 2 Children | 860 (92.4%) | 71 (7.6%) |
| 3 or 4 Children | 229 (73.2%) | 84 (26.8%) |
| 5 or more Children | 0 (0.0%) | 0 (0.0%) |
| Total | 3,021 (92.9%) | 229 (7.0%) |
Income Below Poverty Among Single-Parent Households in Richland Parish
According to the poverty data in Richland Parish, 45.3% or 277 single-father households and 41.1% or 503 single-mother households are living below the poverty line. Among single-father households, those with 1 or 2 children have the highest poverty rate, with 214 households (61.9%) experiencing poverty. Likewise, among single-mother households, those with 3 or 4 children have the highest poverty rate, with 104 households (54.2%) falling below the poverty line.
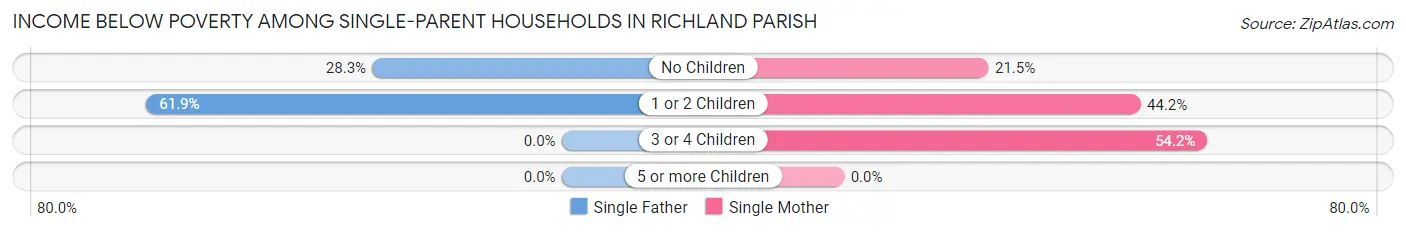
| Children | Single Father | Single Mother |
| No Children | 63 (28.2%) | 54 (21.5%) |
| 1 or 2 Children | 214 (61.9%) | 345 (44.2%) |
| 3 or 4 Children | 0 (0.0%) | 104 (54.2%) |
| 5 or more Children | 0 (0.0%) | 0 (0.0%) |
| Total | 277 (45.3%) | 503 (41.1%) |
Income Below Poverty Among Married-Couple vs Single-Parent Households in Richland Parish
The poverty data for Richland Parish shows that 229 of the married-couple family households (7.0%) and 780 of the single-parent households (42.5%) are living below the poverty level. Within the married-couple family households, those with 3 or 4 children have the highest poverty rate, with 84 households (26.8%) falling below the poverty line. Among the single-parent households, those with 1 or 2 children have the highest poverty rate, with 559 household (49.6%) living below poverty.
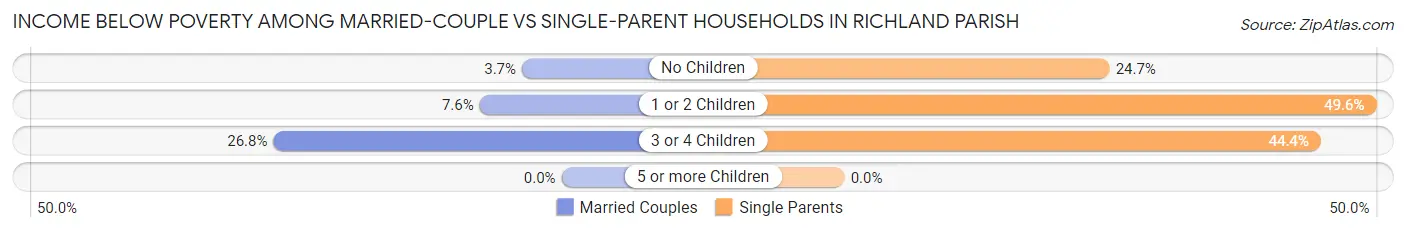
| Children | Married-Couple Families | Single-Parent Households |
| No Children | 74 (3.7%) | 117 (24.7%) |
| 1 or 2 Children | 71 (7.6%) | 559 (49.6%) |
| 3 or 4 Children | 84 (26.8%) | 104 (44.4%) |
| 5 or more Children | 0 (0.0%) | 0 (0.0%) |
| Total | 229 (7.0%) | 780 (42.5%) |
Employment Characteristics in Richland Parish
Employment by Class of Employer in Richland Parish
Among the 7,436 employed individuals in Richland Parish, private company employees (4,835 | 65.0%), local government employees (663 | 8.9%), and self-employed (not incorporated) (571 | 7.7%) make up the most common classes of employment.
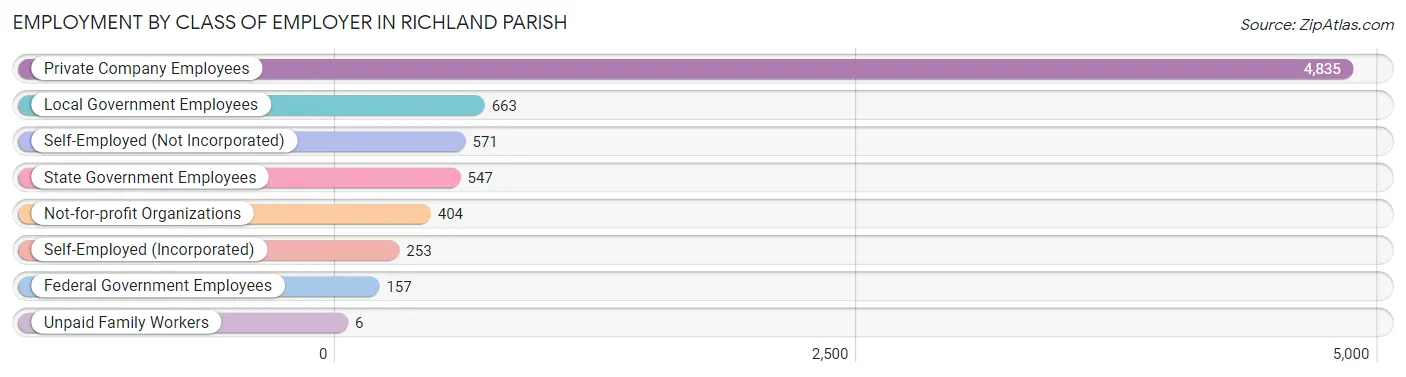
| Employer Class | # Employees | % Employees |
| Private Company Employees | 4,835 | 65.0% |
| Self-Employed (Incorporated) | 253 | 3.4% |
| Self-Employed (Not Incorporated) | 571 | 7.7% |
| Not-for-profit Organizations | 404 | 5.4% |
| Local Government Employees | 663 | 8.9% |
| State Government Employees | 547 | 7.4% |
| Federal Government Employees | 157 | 2.1% |
| Unpaid Family Workers | 6 | 0.1% |
| Total | 7,436 | 100.0% |
Employment Status by Age in Richland Parish
According to the labor force statistics for Richland Parish, out of the total population over 16 years of age (15,832), 51.3% or 8,122 individuals are in the labor force, with 6.8% or 552 of them unemployed. The age group with the highest labor force participation rate is 45 to 54 years, with 76.6% or 1,763 individuals in the labor force. Within the labor force, the 75 years and over age range has the highest percentage of unemployed individuals, with 24.8% or 27 of them being unemployed.
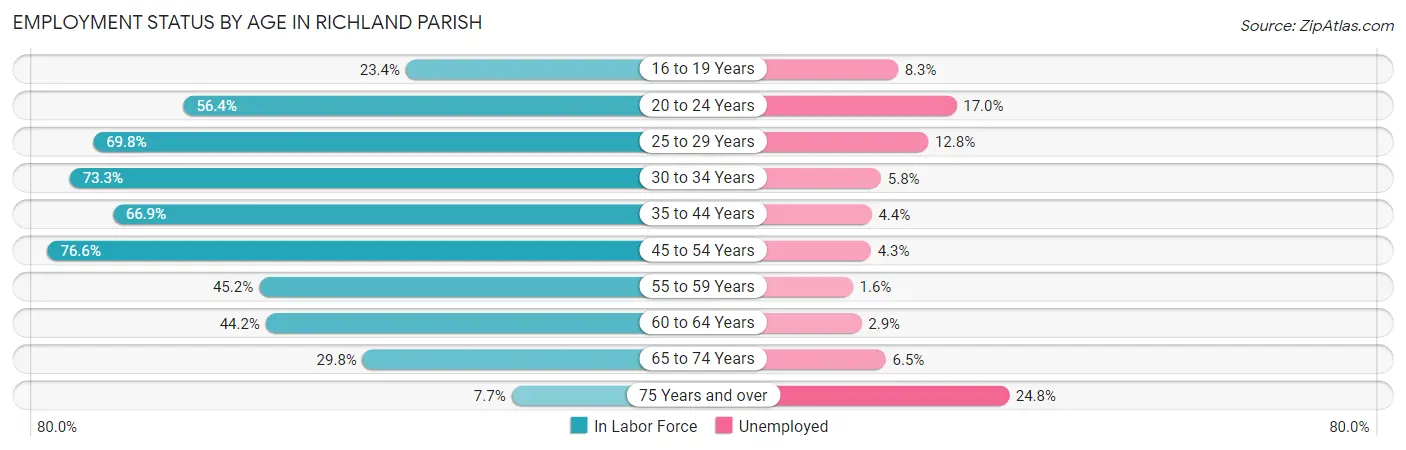
| Age Bracket | In Labor Force | Unemployed |
| 16 to 19 Years | 228 (23.4%) | 19 (8.3%) |
| 20 to 24 Years | 770 (56.4%) | 131 (17.0%) |
| 25 to 29 Years | 814 (69.8%) | 104 (12.8%) |
| 30 to 34 Years | 840 (73.3%) | 49 (5.8%) |
| 35 to 44 Years | 1,770 (66.9%) | 78 (4.4%) |
| 45 to 54 Years | 1,763 (76.6%) | 76 (4.3%) |
| 55 to 59 Years | 612 (45.2%) | 10 (1.6%) |
| 60 to 64 Years | 593 (44.2%) | 17 (2.9%) |
| 65 to 74 Years | 631 (29.8%) | 41 (6.5%) |
| 75 Years and over | 110 (7.7%) | 27 (24.8%) |
| Total | 8,122 (51.3%) | 552 (6.8%) |
Employment Status by Educational Attainment in Richland Parish
According to labor force statistics for Richland Parish, 64.2% of individuals (6,390) out of the total population between 25 and 64 years of age (9,954) are in the labor force, with 5.2% or 332 of them being unemployed. The group with the highest labor force participation rate are those with the educational attainment of bachelor's degree or higher, with 86.3% or 1,408 individuals in the labor force. Within the labor force, individuals with less than high school education have the highest percentage of unemployment, with 10.1% or 88 of them being unemployed.
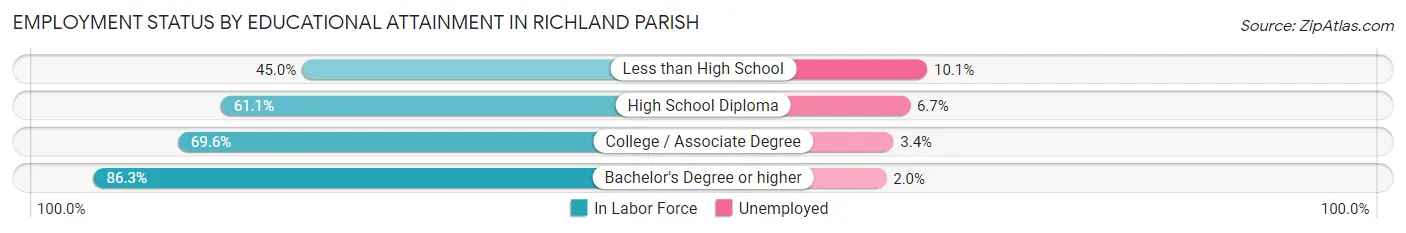
| Educational Attainment | In Labor Force | Unemployed |
| Less than High School | 870 (45.0%) | 195 (10.1%) |
| High School Diploma | 2,402 (61.1%) | 263 (6.7%) |
| College / Associate Degree | 1,709 (69.6%) | 84 (3.4%) |
| Bachelor's Degree or higher | 1,408 (86.3%) | 33 (2.0%) |
| Total | 6,390 (64.2%) | 518 (5.2%) |
Employment Occupations by Sex in Richland Parish
Management, Business, Science and Arts Occupations
The most common Management, Business, Science and Arts occupations in Richland Parish are Community & Social Service (729 | 9.6%), Management (561 | 7.4%), Health Diagnosing & Treating (461 | 6.1%), Education Instruction & Library (446 | 5.9%), and Business & Financial (310 | 4.1%).
Management, Business, Science and Arts Occupations by Sex
Within the Management, Business, Science and Arts occupations in Richland Parish, the most male-oriented occupations are Life, Physical & Social Science (100.0%), Computers, Engineering & Science (88.9%), and Computers & Mathematics (65.4%), while the most female-oriented occupations are Arts, Media & Entertainment (100.0%), Education Instruction & Library (87.7%), and Health Technologists (81.3%).
| Occupation | Male | Female |
| Management | 272 (48.5%) | 289 (51.5%) |
| Business & Financial | 69 (22.3%) | 241 (77.7%) |
| Computers, Engineering & Science | 144 (88.9%) | 18 (11.1%) |
| Computers & Mathematics | 17 (65.4%) | 9 (34.6%) |
| Architecture & Engineering | 6 (40.0%) | 9 (60.0%) |
| Life, Physical & Social Science | 121 (100.0%) | 0 (0.0%) |
| Community & Social Service | 205 (28.1%) | 524 (71.9%) |
| Education, Arts & Media | 104 (55.9%) | 82 (44.1%) |
| Legal Services & Support | 46 (52.3%) | 42 (47.7%) |
| Education Instruction & Library | 55 (12.3%) | 391 (87.7%) |
| Arts, Media & Entertainment | 0 (0.0%) | 9 (100.0%) |
| Health Diagnosing & Treating | 110 (23.9%) | 351 (76.1%) |
| Health Technologists | 42 (18.7%) | 183 (81.3%) |
| Total (Category) | 800 (36.0%) | 1,423 (64.0%) |
| Total (Overall) | 3,671 (48.5%) | 3,895 (51.5%) |
Services Occupations
The most common Services occupations in Richland Parish are Cleaning & Maintenance (377 | 5.0%), Healthcare Support (343 | 4.5%), Security & Protection (316 | 4.2%), Food Preparation & Serving (254 | 3.4%), and Law Enforcement (161 | 2.1%).
Services Occupations by Sex
Within the Services occupations in Richland Parish, the most male-oriented occupations are Law Enforcement (72.7%), Security & Protection (69.3%), and Firefighting & Prevention (65.8%), while the most female-oriented occupations are Food Preparation & Serving (89.4%), Personal Care & Service (86.0%), and Healthcare Support (84.8%).
| Occupation | Male | Female |
| Healthcare Support | 52 (15.2%) | 291 (84.8%) |
| Security & Protection | 219 (69.3%) | 97 (30.7%) |
| Firefighting & Prevention | 102 (65.8%) | 53 (34.2%) |
| Law Enforcement | 117 (72.7%) | 44 (27.3%) |
| Food Preparation & Serving | 27 (10.6%) | 227 (89.4%) |
| Cleaning & Maintenance | 162 (43.0%) | 215 (57.0%) |
| Personal Care & Service | 14 (14.0%) | 86 (86.0%) |
| Total (Category) | 474 (34.1%) | 916 (65.9%) |
| Total (Overall) | 3,671 (48.5%) | 3,895 (51.5%) |
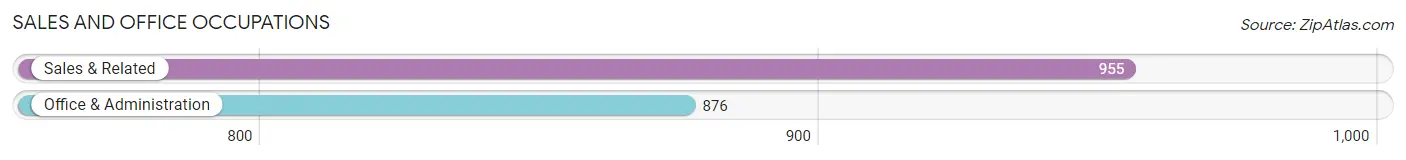
Sales and Office Occupations
The most common Sales and Office occupations in Richland Parish are Sales & Related (955 | 12.6%), and Office & Administration (876 | 11.6%).
Sales and Office Occupations by Sex
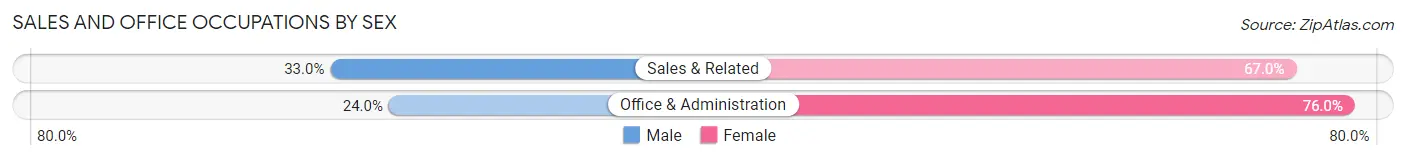
| Occupation | Male | Female |
| Sales & Related | 315 (33.0%) | 640 (67.0%) |
| Office & Administration | 210 (24.0%) | 666 (76.0%) |
| Total (Category) | 525 (28.7%) | 1,306 (71.3%) |
| Total (Overall) | 3,671 (48.5%) | 3,895 (51.5%) |
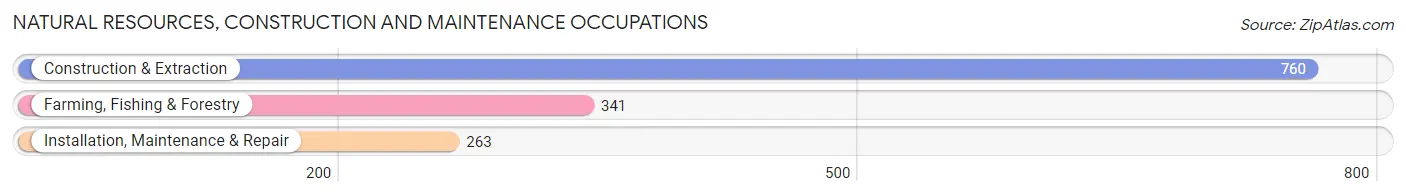
Natural Resources, Construction and Maintenance Occupations
The most common Natural Resources, Construction and Maintenance occupations in Richland Parish are Construction & Extraction (760 | 10.0%), Farming, Fishing & Forestry (341 | 4.5%), and Installation, Maintenance & Repair (263 | 3.5%).
Natural Resources, Construction and Maintenance Occupations by Sex
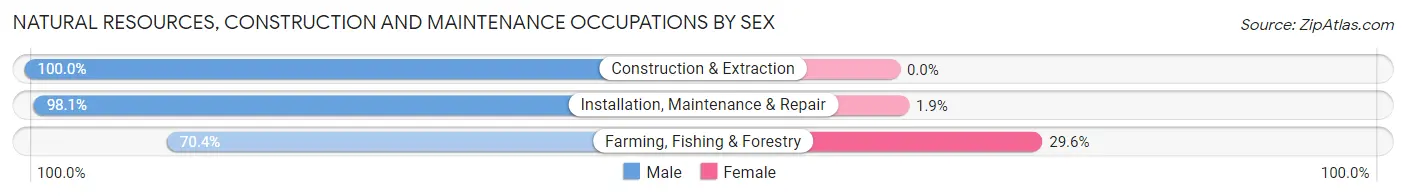
| Occupation | Male | Female |
| Farming, Fishing & Forestry | 240 (70.4%) | 101 (29.6%) |
| Construction & Extraction | 760 (100.0%) | 0 (0.0%) |
| Installation, Maintenance & Repair | 258 (98.1%) | 5 (1.9%) |
| Total (Category) | 1,258 (92.2%) | 106 (7.8%) |
| Total (Overall) | 3,671 (48.5%) | 3,895 (51.5%) |
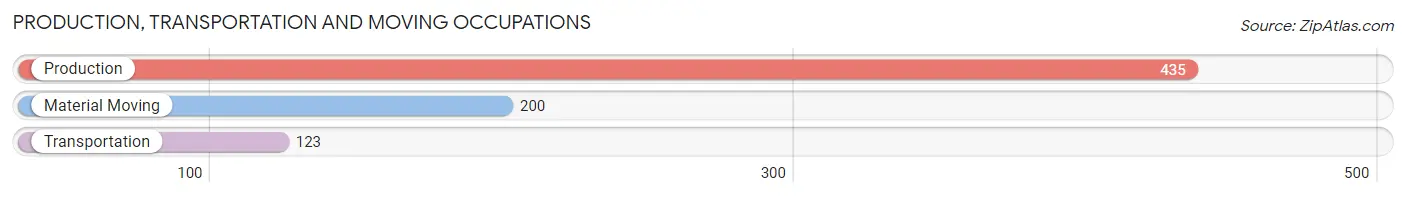
Production, Transportation and Moving Occupations
The most common Production, Transportation and Moving occupations in Richland Parish are Production (435 | 5.8%), Material Moving (200 | 2.6%), and Transportation (123 | 1.6%).
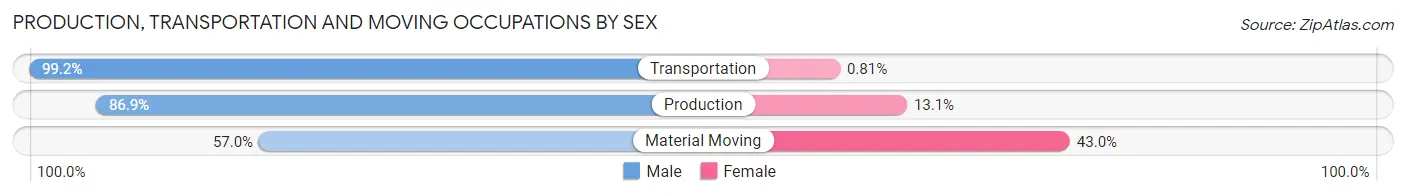
Production, Transportation and Moving Occupations by Sex
| Occupation | Male | Female |
| Production | 378 (86.9%) | 57 (13.1%) |
| Transportation | 122 (99.2%) | 1 (0.8%) |
| Material Moving | 114 (57.0%) | 86 (43.0%) |
| Total (Category) | 614 (81.0%) | 144 (19.0%) |
| Total (Overall) | 3,671 (48.5%) | 3,895 (51.5%) |
Employment Industries by Sex in Richland Parish
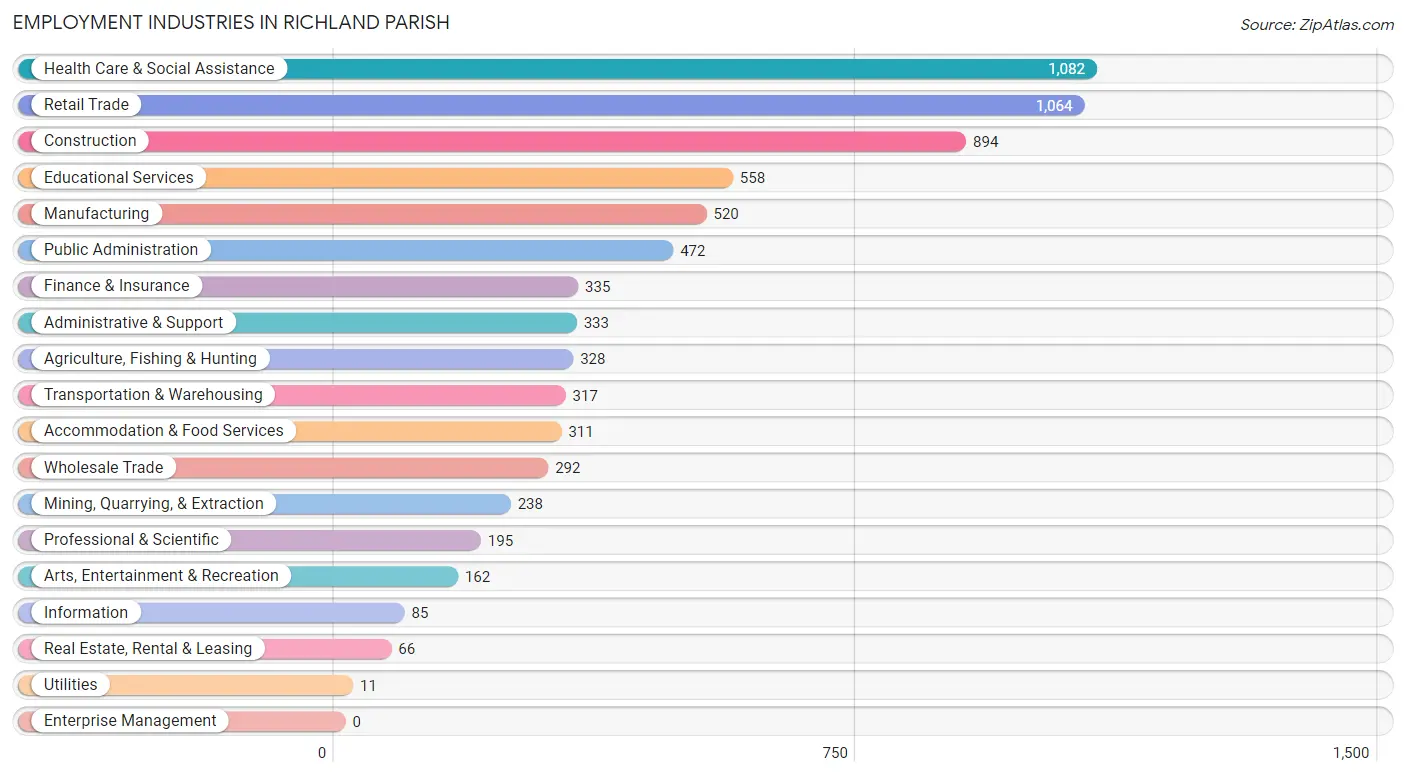
Employment Industries in Richland Parish
The major employment industries in Richland Parish include Health Care & Social Assistance (1,082 | 14.3%), Retail Trade (1,064 | 14.1%), Construction (894 | 11.8%), Educational Services (558 | 7.4%), and Manufacturing (520 | 6.9%).
Employment Industries by Sex in Richland Parish
The Richland Parish industries that see more men than women are Utilities (100.0%), Mining, Quarrying, & Extraction (98.7%), and Construction (89.6%), whereas the industries that tend to have a higher number of women are Information (100.0%), Accommodation & Food Services (94.5%), and Real Estate, Rental & Leasing (90.9%).
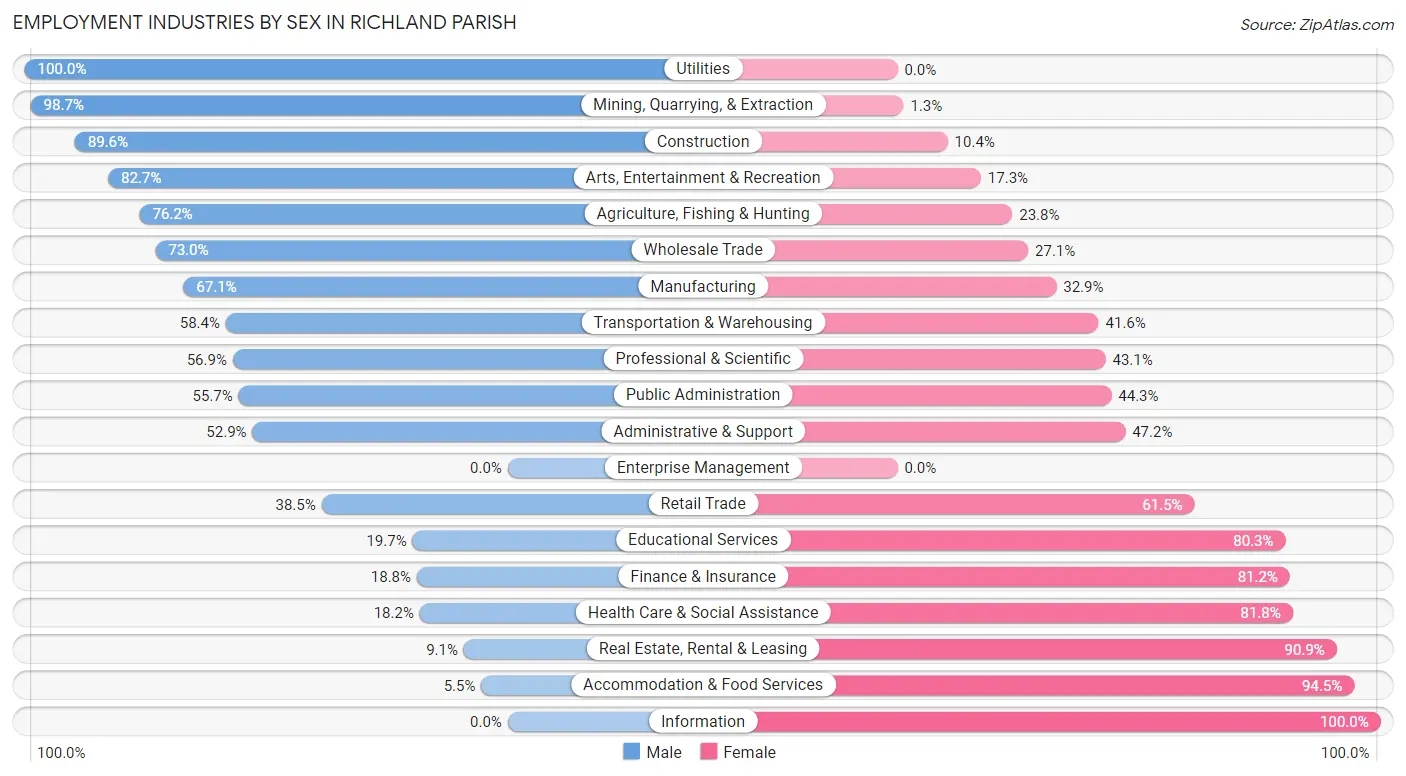
| Industry | Male | Female |
| Agriculture, Fishing & Hunting | 250 (76.2%) | 78 (23.8%) |
| Mining, Quarrying, & Extraction | 235 (98.7%) | 3 (1.3%) |
| Construction | 801 (89.6%) | 93 (10.4%) |
| Manufacturing | 349 (67.1%) | 171 (32.9%) |
| Wholesale Trade | 213 (73.0%) | 79 (27.1%) |
| Retail Trade | 410 (38.5%) | 654 (61.5%) |
| Transportation & Warehousing | 185 (58.4%) | 132 (41.6%) |
| Utilities | 11 (100.0%) | 0 (0.0%) |
| Information | 0 (0.0%) | 85 (100.0%) |
| Finance & Insurance | 63 (18.8%) | 272 (81.2%) |
| Real Estate, Rental & Leasing | 6 (9.1%) | 60 (90.9%) |
| Professional & Scientific | 111 (56.9%) | 84 (43.1%) |
| Enterprise Management | 0 (0.0%) | 0 (0.0%) |
| Administrative & Support | 176 (52.8%) | 157 (47.1%) |
| Educational Services | 110 (19.7%) | 448 (80.3%) |
| Health Care & Social Assistance | 197 (18.2%) | 885 (81.8%) |
| Arts, Entertainment & Recreation | 134 (82.7%) | 28 (17.3%) |
| Accommodation & Food Services | 17 (5.5%) | 294 (94.5%) |
| Public Administration | 263 (55.7%) | 209 (44.3%) |
| Total | 3,671 (48.5%) | 3,895 (51.5%) |
Education in Richland Parish
School Enrollment in Richland Parish
The most common levels of schooling among the 4,199 students in Richland Parish are elementary school (1,105 | 26.3%), middle school (1,073 | 25.6%), and high school (956 | 22.8%).
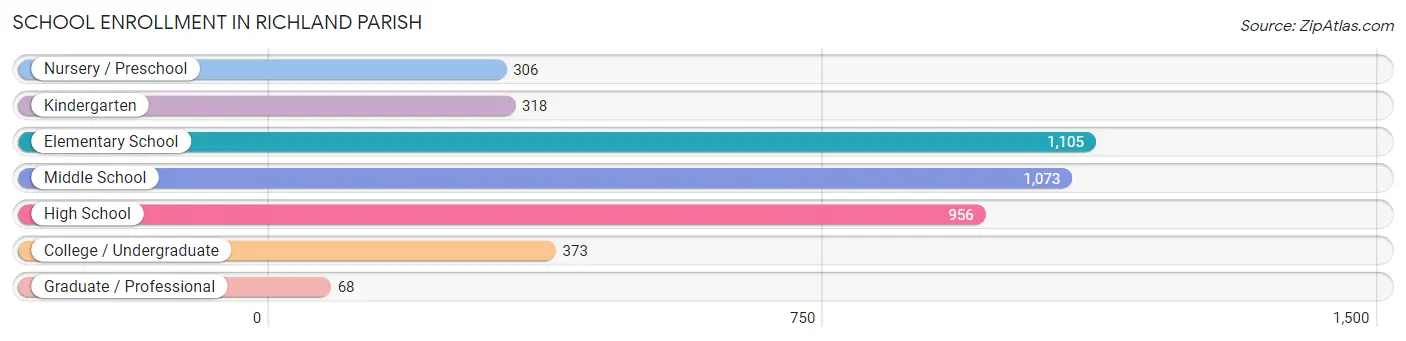
| School Level | # Students | % Students |
| Nursery / Preschool | 306 | 7.3% |
| Kindergarten | 318 | 7.6% |
| Elementary School | 1,105 | 26.3% |
| Middle School | 1,073 | 25.6% |
| High School | 956 | 22.8% |
| College / Undergraduate | 373 | 8.9% |
| Graduate / Professional | 68 | 1.6% |
| Total | 4,199 | 100.0% |
School Enrollment by Age by Funding Source in Richland Parish
Out of a total of 4,199 students who are enrolled in schools in Richland Parish, 668 (15.9%) attend a private institution, while the remaining 3,531 (84.1%) are enrolled in public schools. The age group of 25 to 34 year olds has the highest likelihood of being enrolled in private schools, with 36 (39.1% in the age bracket) enrolled. Conversely, the age group of 20 to 24 year olds has the lowest likelihood of being enrolled in a private school, with 143 (95.3% in the age bracket) attending a public institution.
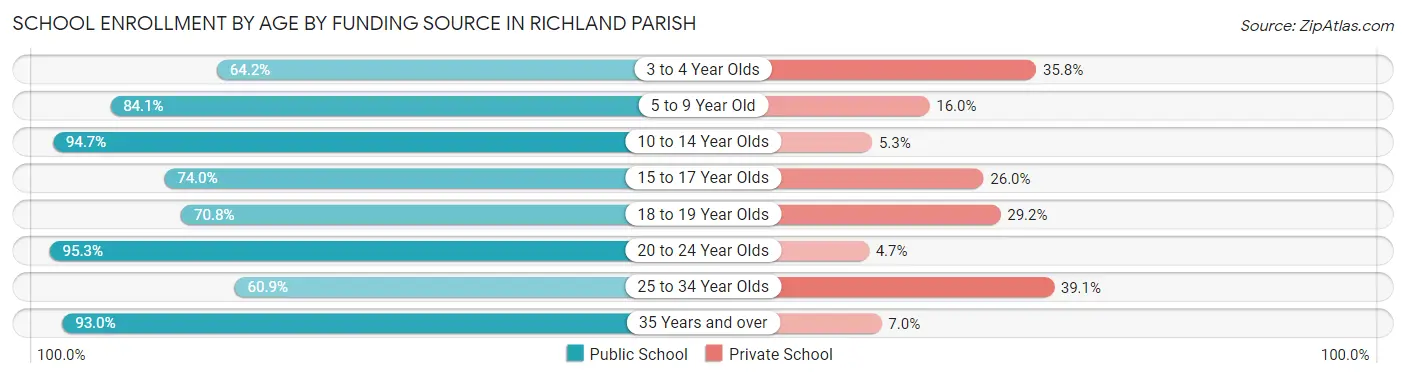
| Age Bracket | Public School | Private School |
| 3 to 4 Year Olds | 197 (64.2%) | 110 (35.8%) |
| 5 to 9 Year Old | 991 (84.1%) | 188 (16.0%) |
| 10 to 14 Year Olds | 1,312 (94.7%) | 73 (5.3%) |
| 15 to 17 Year Olds | 560 (74.0%) | 197 (26.0%) |
| 18 to 19 Year Olds | 102 (70.8%) | 42 (29.2%) |
| 20 to 24 Year Olds | 143 (95.3%) | 7 (4.7%) |
| 25 to 34 Year Olds | 56 (60.9%) | 36 (39.1%) |
| 35 Years and over | 172 (93.0%) | 13 (7.0%) |
| Total | 3,531 (84.1%) | 668 (15.9%) |
Educational Attainment by Field of Study in Richland Parish
Education (581 | 25.3%), business (431 | 18.8%), science & technology (323 | 14.1%), bio, nature & agricultural (247 | 10.7%), and arts & humanities (238 | 10.3%) are the most common fields of study among 2,299 individuals in Richland Parish who have obtained a bachelor's degree or higher.
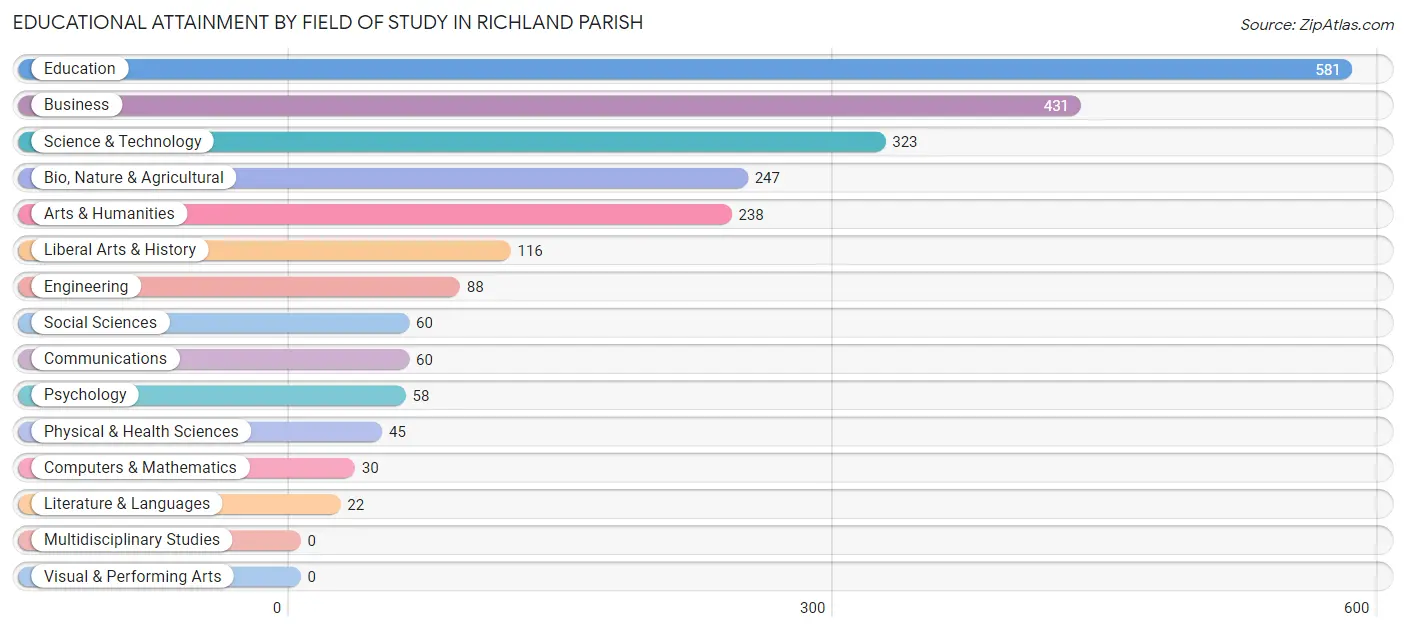
| Field of Study | # Graduates | % Graduates |
| Computers & Mathematics | 30 | 1.3% |
| Bio, Nature & Agricultural | 247 | 10.7% |
| Physical & Health Sciences | 45 | 2.0% |
| Psychology | 58 | 2.5% |
| Social Sciences | 60 | 2.6% |
| Engineering | 88 | 3.8% |
| Multidisciplinary Studies | 0 | 0.0% |
| Science & Technology | 323 | 14.1% |
| Business | 431 | 18.8% |
| Education | 581 | 25.3% |
| Literature & Languages | 22 | 1.0% |
| Liberal Arts & History | 116 | 5.1% |
| Visual & Performing Arts | 0 | 0.0% |
| Communications | 60 | 2.6% |
| Arts & Humanities | 238 | 10.3% |
| Total | 2,299 | 100.0% |
Transportation & Commute in Richland Parish
Vehicle Availability by Sex in Richland Parish
The most prevalent vehicle ownership categories in Richland Parish are males with 2 vehicles (1,130, accounting for 31.2%) and females with 2 vehicles (1,250, making up 30.0%).
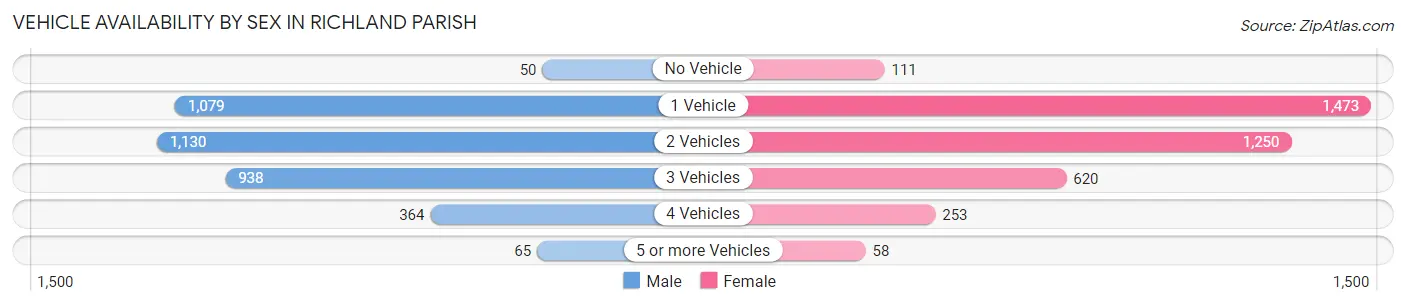
| Vehicles Available | Male | Female |
| No Vehicle | 50 (1.4%) | 111 (2.9%) |
| 1 Vehicle | 1,079 (29.8%) | 1,473 (39.1%) |
| 2 Vehicles | 1,130 (31.2%) | 1,250 (33.2%) |
| 3 Vehicles | 938 (25.9%) | 620 (16.5%) |
| 4 Vehicles | 364 (10.0%) | 253 (6.7%) |
| 5 or more Vehicles | 65 (1.8%) | 58 (1.5%) |
| Total | 3,626 (100.0%) | 3,765 (100.0%) |
Commute Time in Richland Parish
The most frequently occuring commute durations in Richland Parish are 15 to 19 minutes (1,441 commuters, 20.3%), 10 to 14 minutes (1,073 commuters, 15.1%), and 30 to 34 minutes (981 commuters, 13.8%).
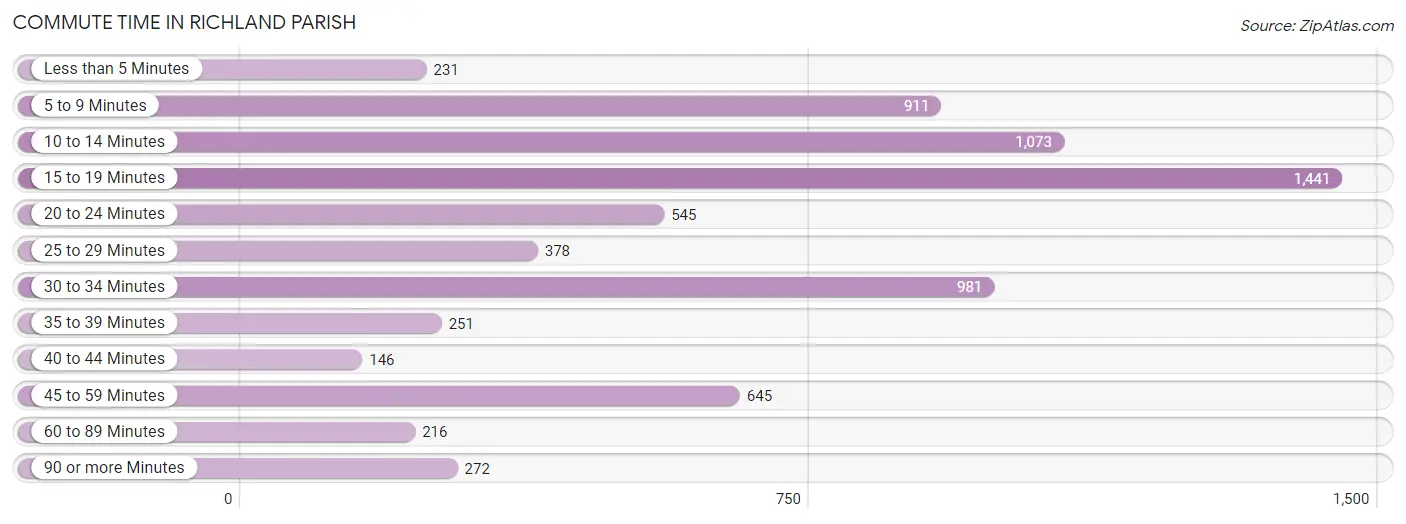
| Commute Time | # Commuters | % Commuters |
| Less than 5 Minutes | 231 | 3.3% |
| 5 to 9 Minutes | 911 | 12.9% |
| 10 to 14 Minutes | 1,073 | 15.1% |
| 15 to 19 Minutes | 1,441 | 20.3% |
| 20 to 24 Minutes | 545 | 7.7% |
| 25 to 29 Minutes | 378 | 5.3% |
| 30 to 34 Minutes | 981 | 13.8% |
| 35 to 39 Minutes | 251 | 3.5% |
| 40 to 44 Minutes | 146 | 2.1% |
| 45 to 59 Minutes | 645 | 9.1% |
| 60 to 89 Minutes | 216 | 3.0% |
| 90 or more Minutes | 272 | 3.8% |
Commute Time by Sex in Richland Parish
The most common commute times in Richland Parish are 15 to 19 minutes (749 commuters, 21.3%) for males and 15 to 19 minutes (692 commuters, 19.4%) for females.
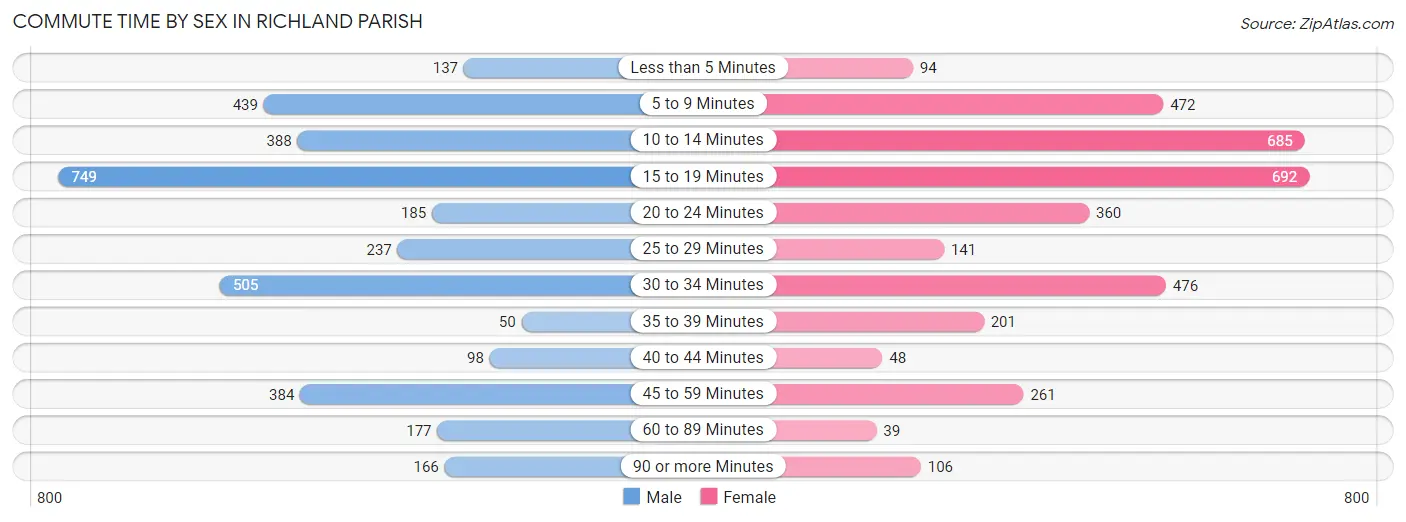
| Commute Time | Male | Female |
| Less than 5 Minutes | 137 (3.9%) | 94 (2.6%) |
| 5 to 9 Minutes | 439 (12.5%) | 472 (13.2%) |
| 10 to 14 Minutes | 388 (11.0%) | 685 (19.2%) |
| 15 to 19 Minutes | 749 (21.3%) | 692 (19.4%) |
| 20 to 24 Minutes | 185 (5.3%) | 360 (10.1%) |
| 25 to 29 Minutes | 237 (6.7%) | 141 (3.9%) |
| 30 to 34 Minutes | 505 (14.4%) | 476 (13.3%) |
| 35 to 39 Minutes | 50 (1.4%) | 201 (5.6%) |
| 40 to 44 Minutes | 98 (2.8%) | 48 (1.3%) |
| 45 to 59 Minutes | 384 (10.9%) | 261 (7.3%) |
| 60 to 89 Minutes | 177 (5.0%) | 39 (1.1%) |
| 90 or more Minutes | 166 (4.7%) | 106 (3.0%) |
Time of Departure to Work by Sex in Richland Parish
The most frequent times of departure to work in Richland Parish are 6:30 AM to 6:59 AM (553, 15.7%) for males and 7:00 AM to 7:29 AM (869, 24.3%) for females.
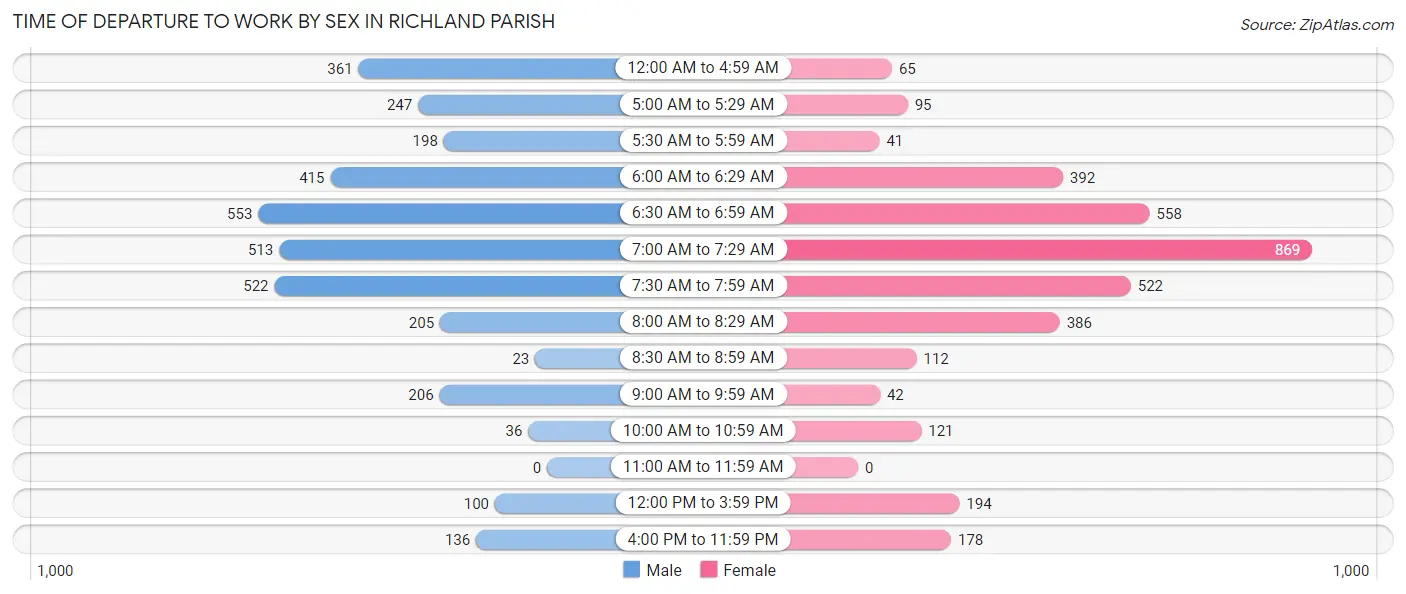
| Time of Departure | Male | Female |
| 12:00 AM to 4:59 AM | 361 (10.3%) | 65 (1.8%) |
| 5:00 AM to 5:29 AM | 247 (7.0%) | 95 (2.7%) |
| 5:30 AM to 5:59 AM | 198 (5.6%) | 41 (1.1%) |
| 6:00 AM to 6:29 AM | 415 (11.8%) | 392 (11.0%) |
| 6:30 AM to 6:59 AM | 553 (15.7%) | 558 (15.6%) |
| 7:00 AM to 7:29 AM | 513 (14.6%) | 869 (24.3%) |
| 7:30 AM to 7:59 AM | 522 (14.8%) | 522 (14.6%) |
| 8:00 AM to 8:29 AM | 205 (5.8%) | 386 (10.8%) |
| 8:30 AM to 8:59 AM | 23 (0.6%) | 112 (3.1%) |
| 9:00 AM to 9:59 AM | 206 (5.9%) | 42 (1.2%) |
| 10:00 AM to 10:59 AM | 36 (1.0%) | 121 (3.4%) |
| 11:00 AM to 11:59 AM | 0 (0.0%) | 0 (0.0%) |
| 12:00 PM to 3:59 PM | 100 (2.8%) | 194 (5.4%) |
| 4:00 PM to 11:59 PM | 136 (3.9%) | 178 (5.0%) |
| Total | 3,515 (100.0%) | 3,575 (100.0%) |
Housing Occupancy in Richland Parish
Occupancy by Ownership in Richland Parish
Of the total 7,295 dwellings in Richland Parish, owner-occupied units account for 4,654 (63.8%), while renter-occupied units make up 2,641 (36.2%).
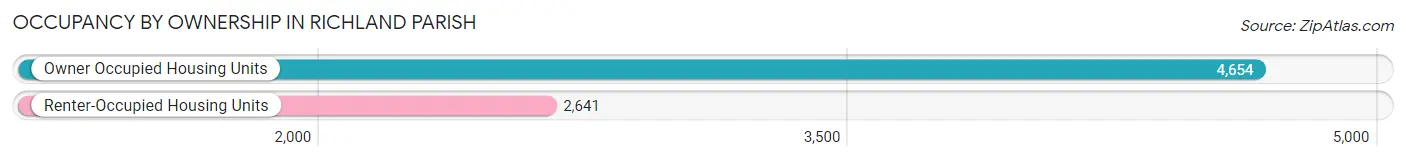
| Occupancy | # Housing Units | % Housing Units |
| Owner Occupied Housing Units | 4,654 | 63.8% |
| Renter-Occupied Housing Units | 2,641 | 36.2% |
| Total Occupied Housing Units | 7,295 | 100.0% |
Occupancy by Household Size in Richland Parish
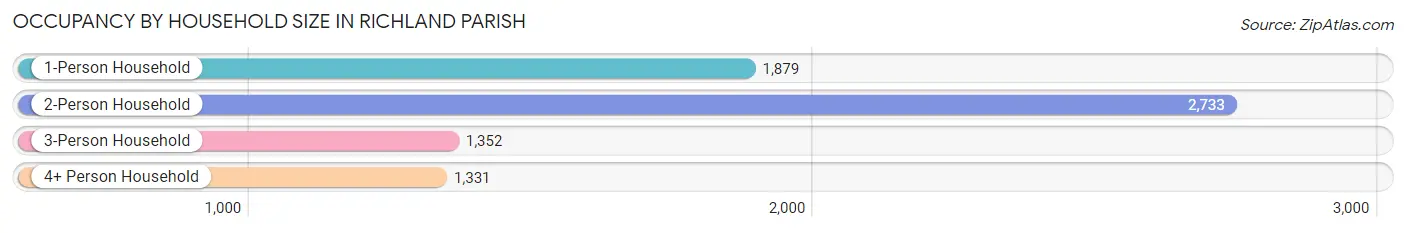
| Household Size | # Housing Units | % Housing Units |
| 1-Person Household | 1,879 | 25.8% |
| 2-Person Household | 2,733 | 37.5% |
| 3-Person Household | 1,352 | 18.5% |
| 4+ Person Household | 1,331 | 18.2% |
| Total Housing Units | 7,295 | 100.0% |
Occupancy by Ownership by Household Size in Richland Parish
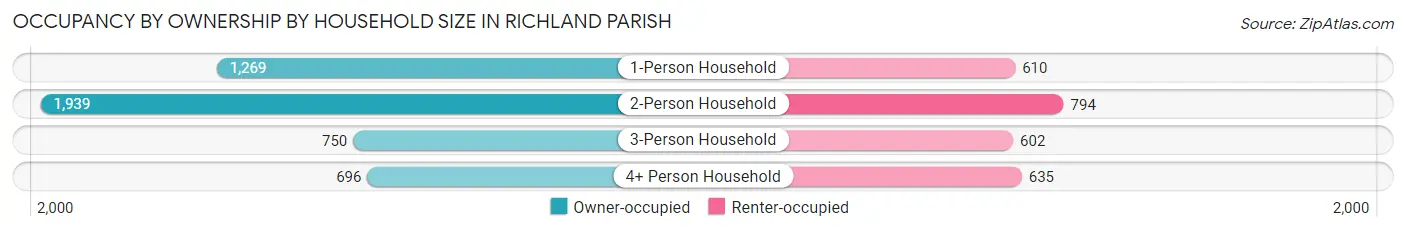
| Household Size | Owner-occupied | Renter-occupied |
| 1-Person Household | 1,269 (67.5%) | 610 (32.5%) |
| 2-Person Household | 1,939 (71.0%) | 794 (29.0%) |
| 3-Person Household | 750 (55.5%) | 602 (44.5%) |
| 4+ Person Household | 696 (52.3%) | 635 (47.7%) |
| Total Housing Units | 4,654 (63.8%) | 2,641 (36.2%) |
Occupancy by Educational Attainment in Richland Parish
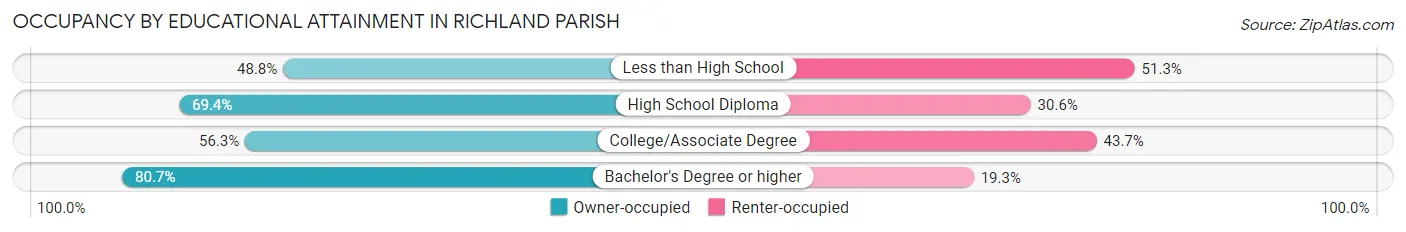
| Household Size | Owner-occupied | Renter-occupied |
| Less than High School | 663 (48.7%) | 697 (51.2%) |
| High School Diploma | 1,737 (69.4%) | 767 (30.6%) |
| College/Associate Degree | 1,186 (56.3%) | 921 (43.7%) |
| Bachelor's Degree or higher | 1,068 (80.7%) | 256 (19.3%) |
Occupancy by Age of Householder in Richland Parish
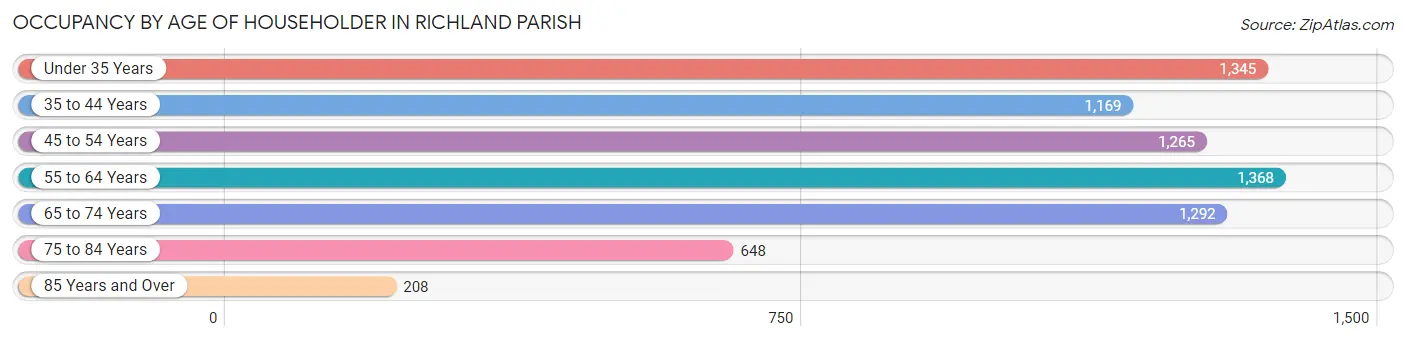
| Age Bracket | # Households | % Households |
| Under 35 Years | 1,345 | 18.4% |
| 35 to 44 Years | 1,169 | 16.0% |
| 45 to 54 Years | 1,265 | 17.3% |
| 55 to 64 Years | 1,368 | 18.8% |
| 65 to 74 Years | 1,292 | 17.7% |
| 75 to 84 Years | 648 | 8.9% |
| 85 Years and Over | 208 | 2.9% |
| Total | 7,295 | 100.0% |
Housing Finances in Richland Parish
Median Income by Occupancy in Richland Parish
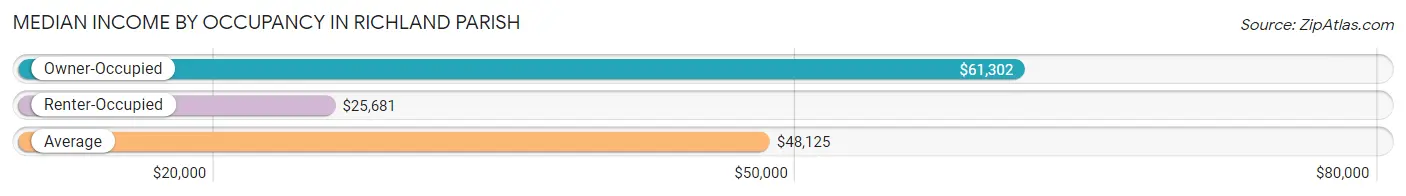
| Occupancy Type | # Households | Median Income |
| Owner-Occupied | 4,654 (63.8%) | $61,302 |
| Renter-Occupied | 2,641 (36.2%) | $25,681 |
| Average | 7,295 (100.0%) | $48,125 |
Occupancy by Householder Income Bracket in Richland Parish
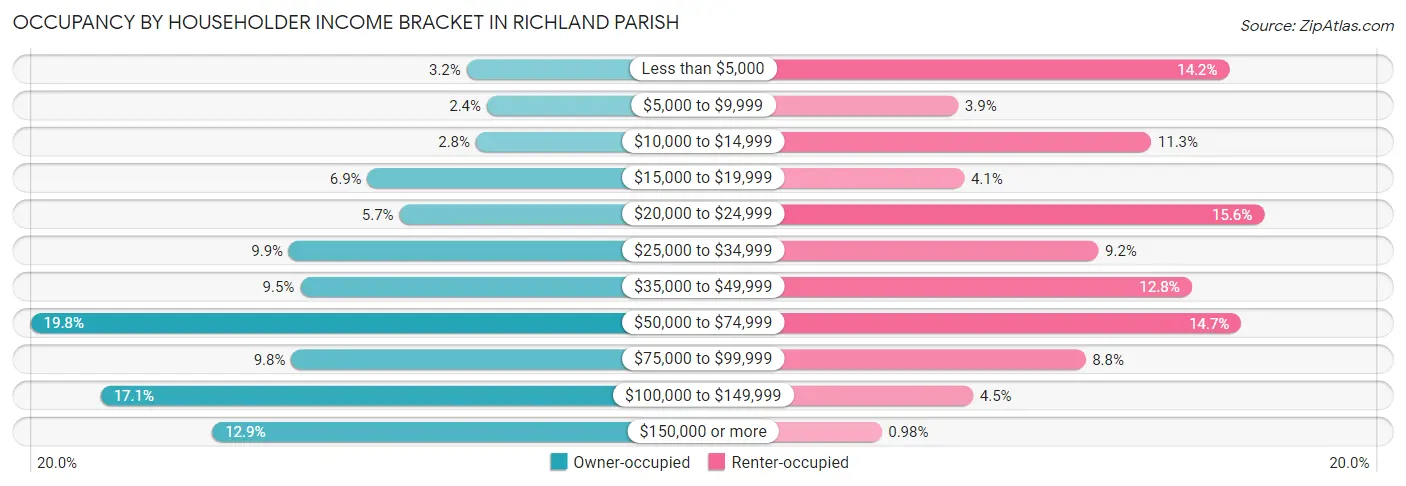
| Income Bracket | Owner-occupied | Renter-occupied |
| Less than $5,000 | 147 (3.2%) | 376 (14.2%) |
| $5,000 to $9,999 | 111 (2.4%) | 103 (3.9%) |
| $10,000 to $14,999 | 131 (2.8%) | 297 (11.3%) |
| $15,000 to $19,999 | 323 (6.9%) | 109 (4.1%) |
| $20,000 to $24,999 | 266 (5.7%) | 411 (15.6%) |
| $25,000 to $34,999 | 462 (9.9%) | 244 (9.2%) |
| $35,000 to $49,999 | 442 (9.5%) | 338 (12.8%) |
| $50,000 to $74,999 | 920 (19.8%) | 388 (14.7%) |
| $75,000 to $99,999 | 458 (9.8%) | 231 (8.7%) |
| $100,000 to $149,999 | 796 (17.1%) | 118 (4.5%) |
| $150,000 or more | 598 (12.9%) | 26 (1.0%) |
| Total | 4,654 (100.0%) | 2,641 (100.0%) |
Monthly Housing Cost Tiers in Richland Parish
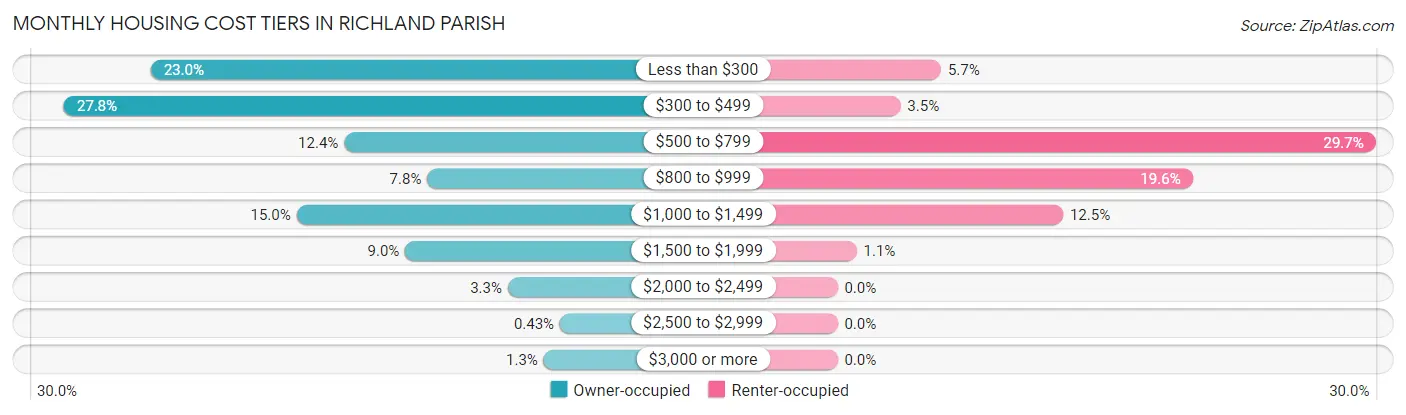
| Monthly Cost | Owner-occupied | Renter-occupied |
| Less than $300 | 1,072 (23.0%) | 151 (5.7%) |
| $300 to $499 | 1,295 (27.8%) | 92 (3.5%) |
| $500 to $799 | 575 (12.3%) | 785 (29.7%) |
| $800 to $999 | 361 (7.8%) | 518 (19.6%) |
| $1,000 to $1,499 | 697 (15.0%) | 329 (12.5%) |
| $1,500 to $1,999 | 418 (9.0%) | 28 (1.1%) |
| $2,000 to $2,499 | 154 (3.3%) | 0 (0.0%) |
| $2,500 to $2,999 | 20 (0.4%) | 0 (0.0%) |
| $3,000 or more | 62 (1.3%) | 0 (0.0%) |
| Total | 4,654 (100.0%) | 2,641 (100.0%) |
Physical Housing Characteristics in Richland Parish
Housing Structures in Richland Parish
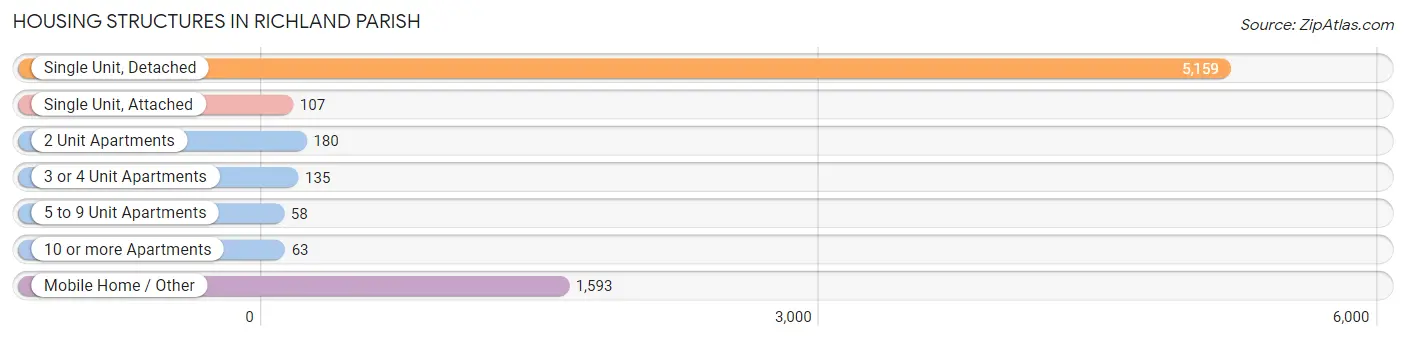
| Structure Type | # Housing Units | % Housing Units |
| Single Unit, Detached | 5,159 | 70.7% |
| Single Unit, Attached | 107 | 1.5% |
| 2 Unit Apartments | 180 | 2.5% |
| 3 or 4 Unit Apartments | 135 | 1.8% |
| 5 to 9 Unit Apartments | 58 | 0.8% |
| 10 or more Apartments | 63 | 0.9% |
| Mobile Home / Other | 1,593 | 21.8% |
| Total | 7,295 | 100.0% |
Housing Structures by Occupancy in Richland Parish
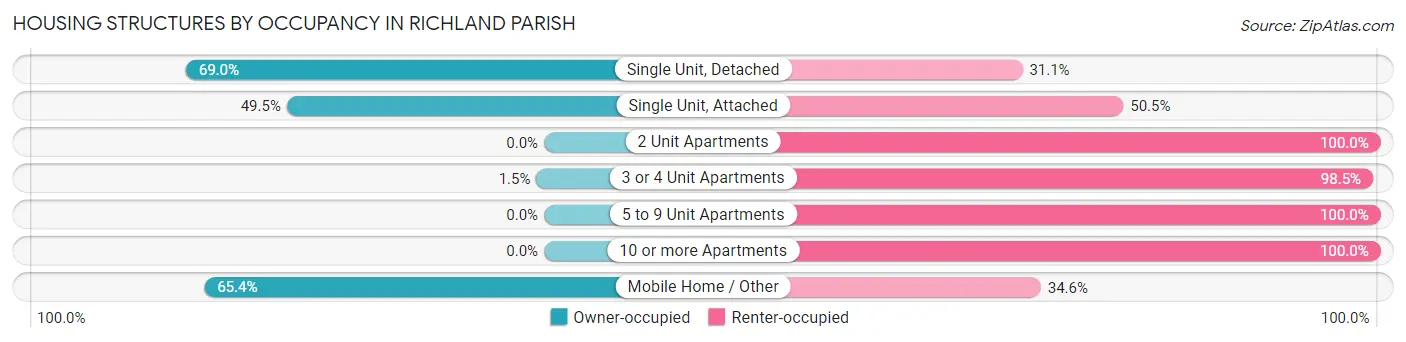
| Structure Type | Owner-occupied | Renter-occupied |
| Single Unit, Detached | 3,557 (69.0%) | 1,602 (31.0%) |
| Single Unit, Attached | 53 (49.5%) | 54 (50.5%) |
| 2 Unit Apartments | 0 (0.0%) | 180 (100.0%) |
| 3 or 4 Unit Apartments | 2 (1.5%) | 133 (98.5%) |
| 5 to 9 Unit Apartments | 0 (0.0%) | 58 (100.0%) |
| 10 or more Apartments | 0 (0.0%) | 63 (100.0%) |
| Mobile Home / Other | 1,042 (65.4%) | 551 (34.6%) |
| Total | 4,654 (63.8%) | 2,641 (36.2%) |
Housing Structures by Number of Rooms in Richland Parish
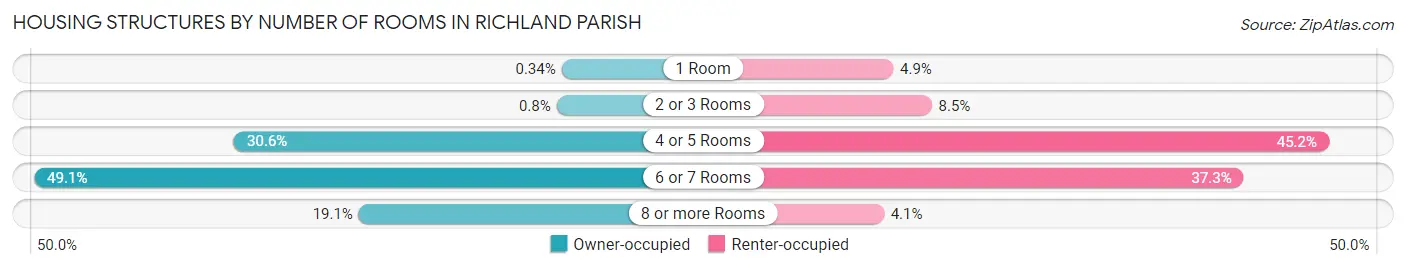
| Number of Rooms | Owner-occupied | Renter-occupied |
| 1 Room | 16 (0.3%) | 130 (4.9%) |
| 2 or 3 Rooms | 37 (0.8%) | 224 (8.5%) |
| 4 or 5 Rooms | 1,426 (30.6%) | 1,194 (45.2%) |
| 6 or 7 Rooms | 2,286 (49.1%) | 986 (37.3%) |
| 8 or more Rooms | 889 (19.1%) | 107 (4.1%) |
| Total | 4,654 (100.0%) | 2,641 (100.0%) |
Housing Structure by Heating Type in Richland Parish
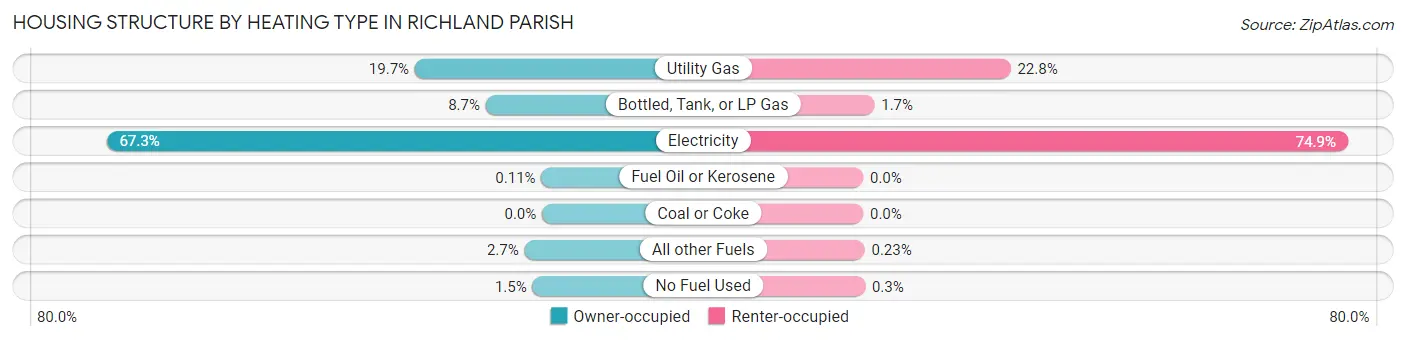
| Heating Type | Owner-occupied | Renter-occupied |
| Utility Gas | 915 (19.7%) | 602 (22.8%) |
| Bottled, Tank, or LP Gas | 405 (8.7%) | 46 (1.7%) |
| Electricity | 3,134 (67.3%) | 1,979 (74.9%) |
| Fuel Oil or Kerosene | 5 (0.1%) | 0 (0.0%) |
| Coal or Coke | 0 (0.0%) | 0 (0.0%) |
| All other Fuels | 126 (2.7%) | 6 (0.2%) |
| No Fuel Used | 69 (1.5%) | 8 (0.3%) |
| Total | 4,654 (100.0%) | 2,641 (100.0%) |
Household Vehicle Usage in Richland Parish
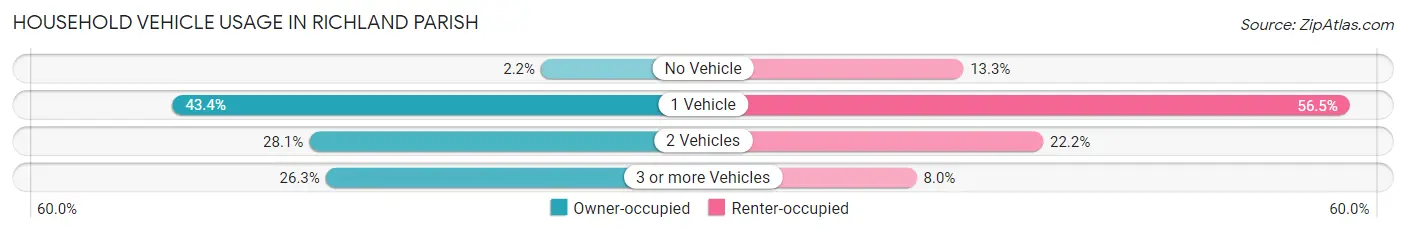
| Vehicles per Household | Owner-occupied | Renter-occupied |
| No Vehicle | 101 (2.2%) | 350 (13.3%) |
| 1 Vehicle | 2,021 (43.4%) | 1,493 (56.5%) |
| 2 Vehicles | 1,309 (28.1%) | 586 (22.2%) |
| 3 or more Vehicles | 1,223 (26.3%) | 212 (8.0%) |
| Total | 4,654 (100.0%) | 2,641 (100.0%) |
Real Estate & Mortgages in Richland Parish
Real Estate and Mortgage Overview in Richland Parish
| Characteristic | Without Mortgage | With Mortgage |
| Housing Units | 2,665 | 1,989 |
| Median Property Value | $98,400 | $150,800 |
| Median Household Income | $50,685 | $445 |
| Monthly Housing Costs | $334 | $62 |
| Real Estate Taxes | $285 | $660 |
Property Value by Mortgage Status in Richland Parish
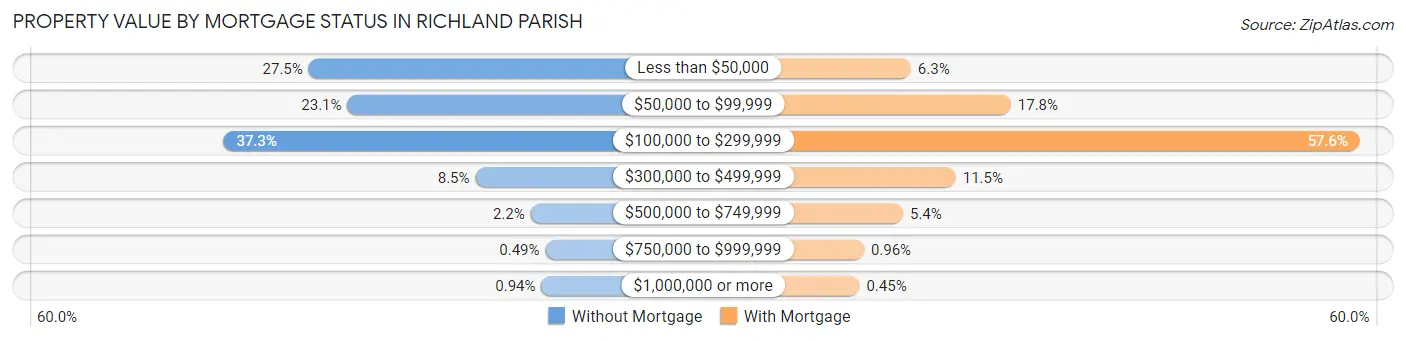
| Property Value | Without Mortgage | With Mortgage |
| Less than $50,000 | 734 (27.5%) | 126 (6.3%) |
| $50,000 to $99,999 | 616 (23.1%) | 353 (17.7%) |
| $100,000 to $299,999 | 993 (37.3%) | 1,146 (57.6%) |
| $300,000 to $499,999 | 226 (8.5%) | 228 (11.5%) |
| $500,000 to $749,999 | 58 (2.2%) | 108 (5.4%) |
| $750,000 to $999,999 | 13 (0.5%) | 19 (1.0%) |
| $1,000,000 or more | 25 (0.9%) | 9 (0.4%) |
| Total | 2,665 (100.0%) | 1,989 (100.0%) |
Household Income by Mortgage Status in Richland Parish
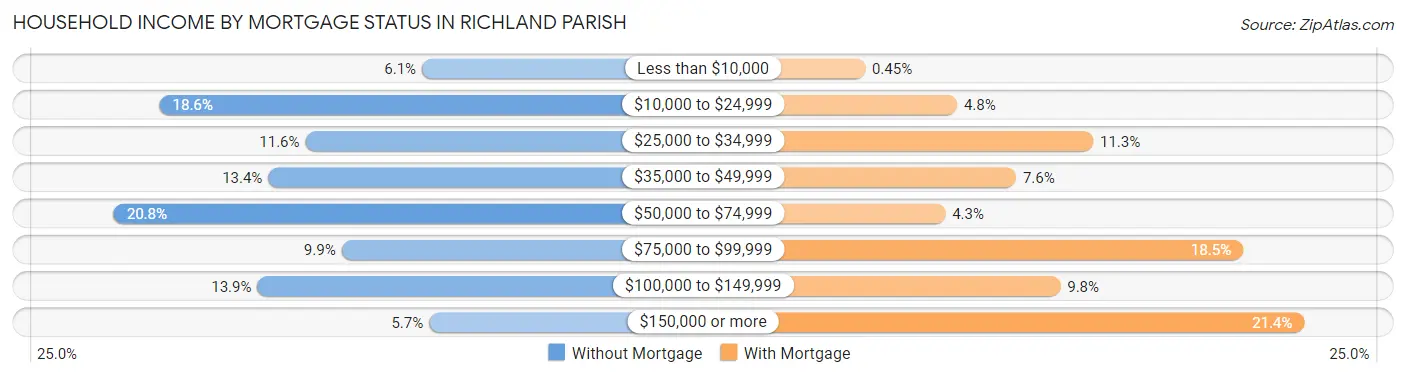
| Household Income | Without Mortgage | With Mortgage |
| Less than $10,000 | 162 (6.1%) | 9 (0.4%) |
| $10,000 to $24,999 | 495 (18.6%) | 96 (4.8%) |
| $25,000 to $34,999 | 310 (11.6%) | 225 (11.3%) |
| $35,000 to $49,999 | 357 (13.4%) | 152 (7.6%) |
| $50,000 to $74,999 | 553 (20.7%) | 85 (4.3%) |
| $75,000 to $99,999 | 264 (9.9%) | 367 (18.4%) |
| $100,000 to $149,999 | 371 (13.9%) | 194 (9.8%) |
| $150,000 or more | 153 (5.7%) | 425 (21.4%) |
| Total | 2,665 (100.0%) | 1,989 (100.0%) |
Property Value to Household Income Ratio in Richland Parish
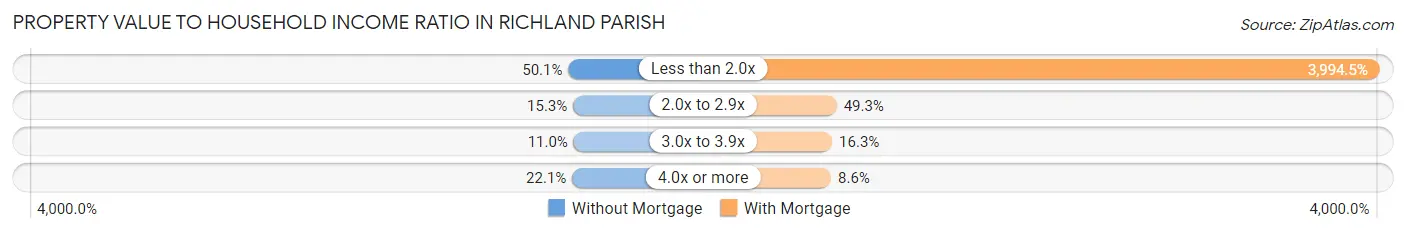
| Value-to-Income Ratio | Without Mortgage | With Mortgage |
| Less than 2.0x | 1,336 (50.1%) | 79,450 (3,994.5%) |
| 2.0x to 2.9x | 408 (15.3%) | 981 (49.3%) |
| 3.0x to 3.9x | 293 (11.0%) | 324 (16.3%) |
| 4.0x or more | 590 (22.1%) | 171 (8.6%) |
| Total | 2,665 (100.0%) | 1,989 (100.0%) |
Real Estate Taxes by Mortgage Status in Richland Parish
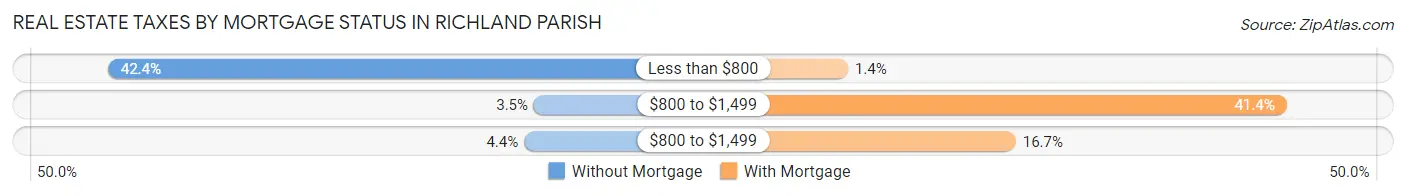
| Property Taxes | Without Mortgage | With Mortgage |
| Less than $800 | 1,130 (42.4%) | 27 (1.4%) |
| $800 to $1,499 | 93 (3.5%) | 824 (41.4%) |
| $800 to $1,499 | 117 (4.4%) | 332 (16.7%) |
| Total | 2,665 (100.0%) | 1,989 (100.0%) |
Health & Disability in Richland Parish
Health Insurance Coverage by Age in Richland Parish
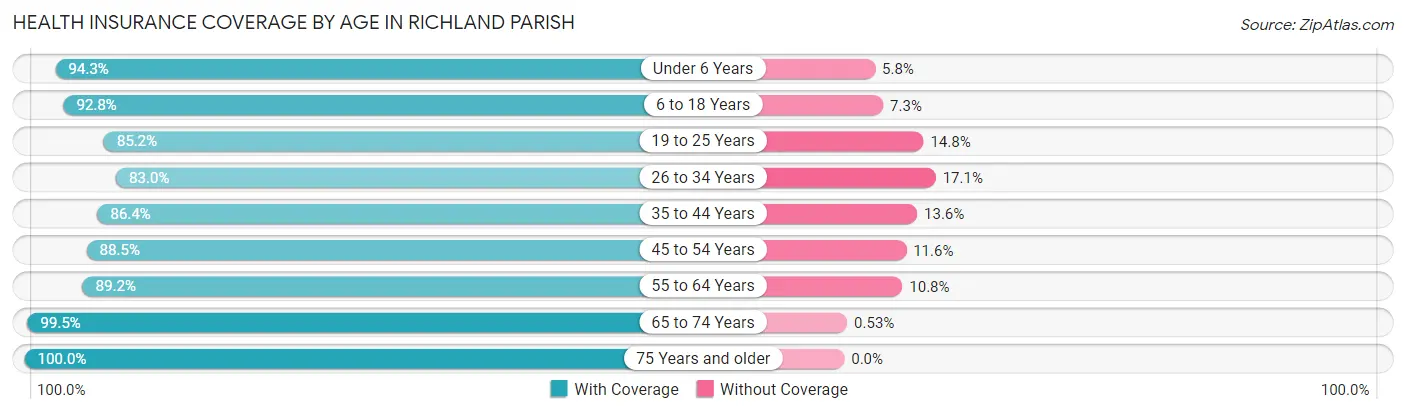
| Age Bracket | With Coverage | Without Coverage |
| Under 6 Years | 1,378 (94.3%) | 84 (5.8%) |
| 6 to 18 Years | 3,199 (92.7%) | 250 (7.2%) |
| 19 to 25 Years | 1,362 (85.2%) | 236 (14.8%) |
| 26 to 34 Years | 1,751 (83.0%) | 360 (17.1%) |
| 35 to 44 Years | 2,055 (86.4%) | 323 (13.6%) |
| 45 to 54 Years | 1,930 (88.4%) | 252 (11.6%) |
| 55 to 64 Years | 2,255 (89.2%) | 274 (10.8%) |
| 65 to 74 Years | 2,081 (99.5%) | 11 (0.5%) |
| 75 Years and older | 1,314 (100.0%) | 0 (0.0%) |
| Total | 17,325 (90.6%) | 1,790 (9.4%) |
Health Insurance Coverage by Citizenship Status in Richland Parish
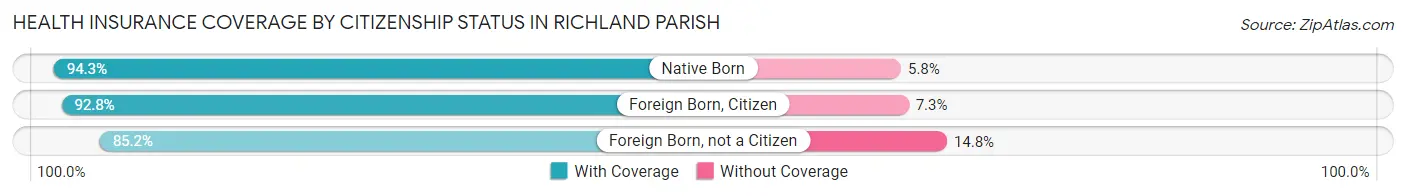
| Citizenship Status | With Coverage | Without Coverage |
| Native Born | 1,378 (94.3%) | 84 (5.8%) |
| Foreign Born, Citizen | 3,199 (92.7%) | 250 (7.2%) |
| Foreign Born, not a Citizen | 1,362 (85.2%) | 236 (14.8%) |
Health Insurance Coverage by Household Income in Richland Parish
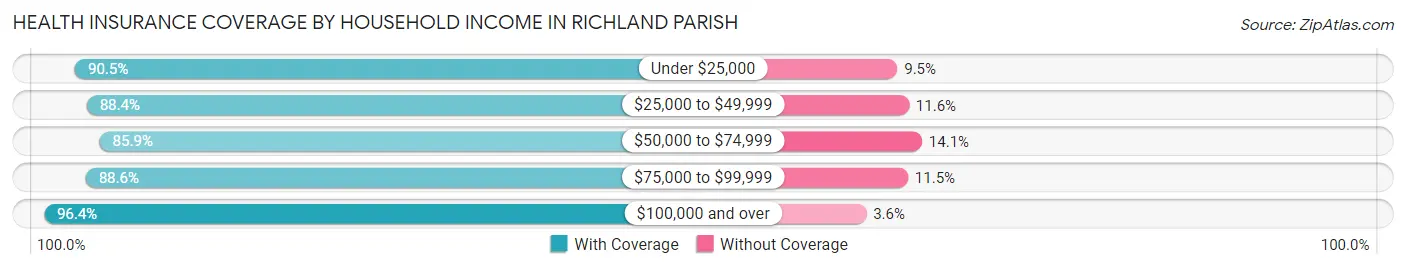
| Household Income | With Coverage | Without Coverage |
| Under $25,000 | 4,509 (90.5%) | 471 (9.5%) |
| $25,000 to $49,999 | 3,241 (88.4%) | 427 (11.6%) |
| $50,000 to $74,999 | 3,041 (85.9%) | 498 (14.1%) |
| $75,000 to $99,999 | 1,663 (88.5%) | 215 (11.5%) |
| $100,000 and over | 4,674 (96.4%) | 176 (3.6%) |
Public vs Private Health Insurance Coverage by Age in Richland Parish
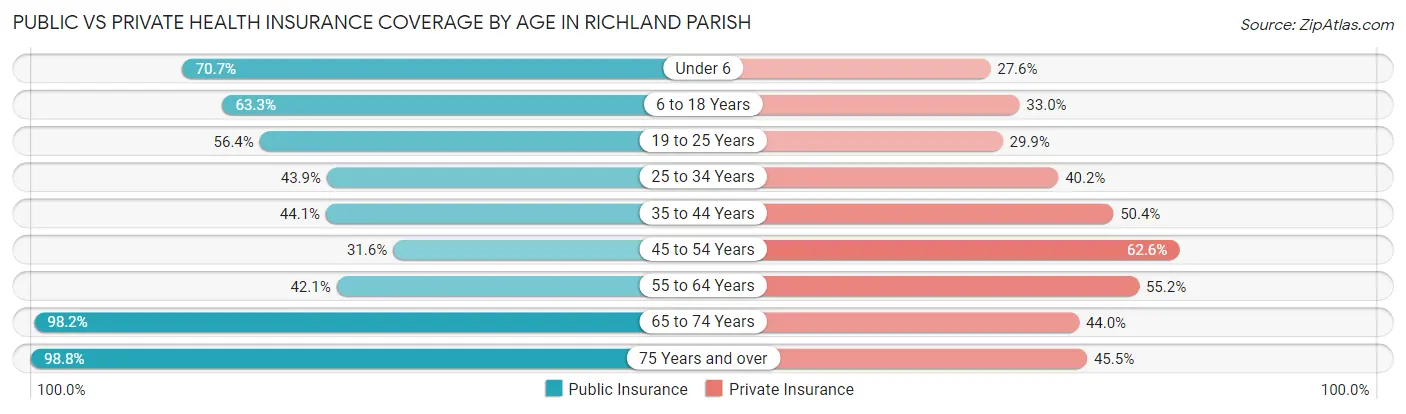
| Age Bracket | Public Insurance | Private Insurance |
| Under 6 | 1,033 (70.7%) | 403 (27.6%) |
| 6 to 18 Years | 2,182 (63.3%) | 1,137 (33.0%) |
| 19 to 25 Years | 901 (56.4%) | 477 (29.8%) |
| 25 to 34 Years | 927 (43.9%) | 848 (40.2%) |
| 35 to 44 Years | 1,048 (44.1%) | 1,198 (50.4%) |
| 45 to 54 Years | 690 (31.6%) | 1,366 (62.6%) |
| 55 to 64 Years | 1,065 (42.1%) | 1,395 (55.2%) |
| 65 to 74 Years | 2,054 (98.2%) | 921 (44.0%) |
| 75 Years and over | 1,298 (98.8%) | 598 (45.5%) |
| Total | 11,198 (58.6%) | 8,343 (43.6%) |
Disability Status by Sex by Age in Richland Parish
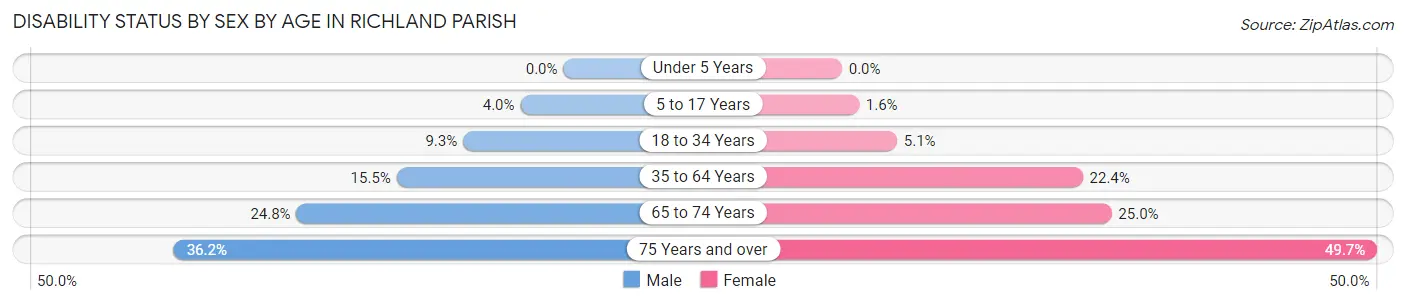
| Age Bracket | Male | Female |
| Under 5 Years | 0 (0.0%) | 0 (0.0%) |
| 5 to 17 Years | 76 (4.0%) | 25 (1.6%) |
| 18 to 34 Years | 174 (9.3%) | 102 (5.1%) |
| 35 to 64 Years | 491 (15.5%) | 875 (22.4%) |
| 65 to 74 Years | 246 (24.8%) | 275 (25.0%) |
| 75 Years and over | 192 (36.2%) | 389 (49.7%) |
Disability Class by Sex by Age in Richland Parish
Disability Class: Hearing Difficulty
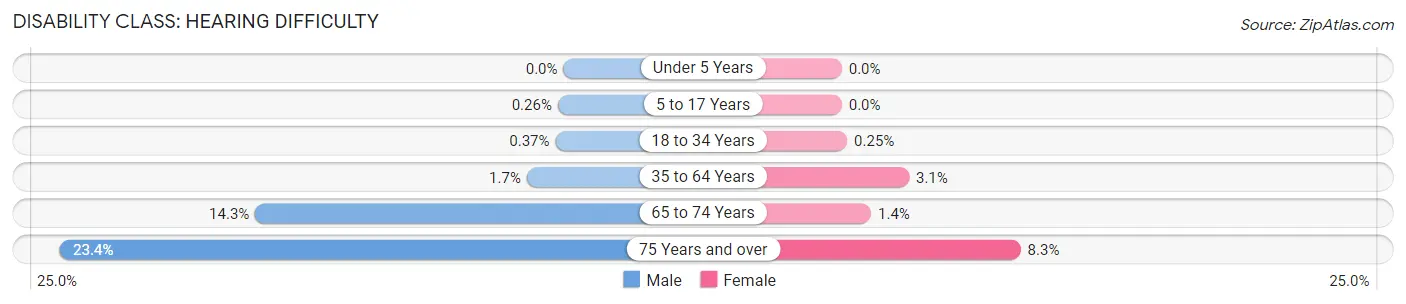
| Age Bracket | Male | Female |
| Under 5 Years | 0 (0.0%) | 0 (0.0%) |
| 5 to 17 Years | 5 (0.3%) | 0 (0.0%) |
| 18 to 34 Years | 7 (0.4%) | 5 (0.3%) |
| 35 to 64 Years | 54 (1.7%) | 122 (3.1%) |
| 65 to 74 Years | 142 (14.3%) | 15 (1.4%) |
| 75 Years and over | 124 (23.4%) | 65 (8.3%) |
Disability Class: Vision Difficulty
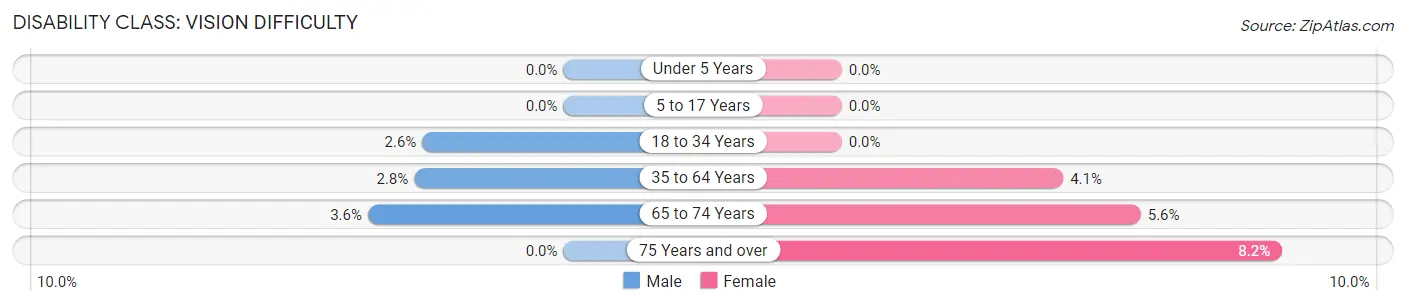
| Age Bracket | Male | Female |
| Under 5 Years | 0 (0.0%) | 0 (0.0%) |
| 5 to 17 Years | 0 (0.0%) | 0 (0.0%) |
| 18 to 34 Years | 49 (2.6%) | 0 (0.0%) |
| 35 to 64 Years | 88 (2.8%) | 161 (4.1%) |
| 65 to 74 Years | 36 (3.6%) | 61 (5.6%) |
| 75 Years and over | 0 (0.0%) | 64 (8.2%) |
Disability Class: Cognitive Difficulty
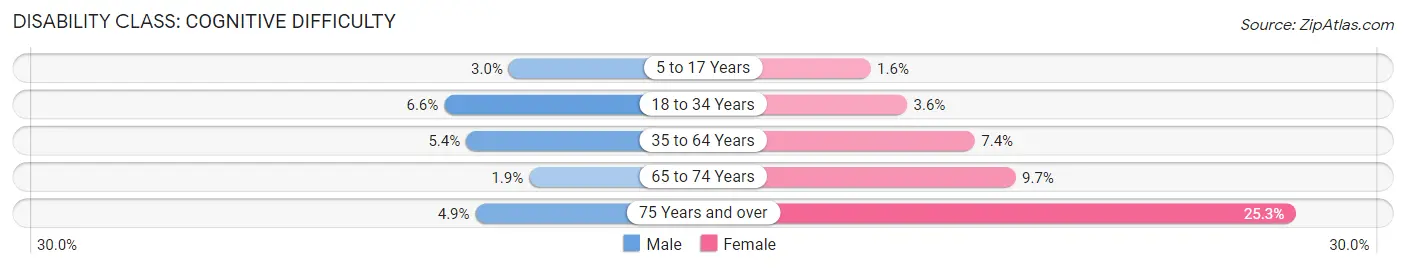
| Age Bracket | Male | Female |
| 5 to 17 Years | 58 (3.0%) | 25 (1.6%) |
| 18 to 34 Years | 124 (6.6%) | 72 (3.6%) |
| 35 to 64 Years | 172 (5.4%) | 289 (7.4%) |
| 65 to 74 Years | 19 (1.9%) | 106 (9.7%) |
| 75 Years and over | 26 (4.9%) | 198 (25.3%) |
Disability Class: Ambulatory Difficulty
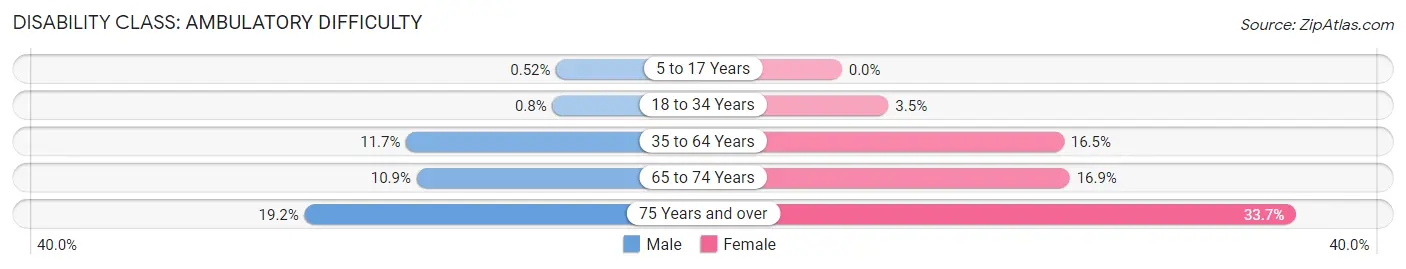
| Age Bracket | Male | Female |
| 5 to 17 Years | 10 (0.5%) | 0 (0.0%) |
| 18 to 34 Years | 15 (0.8%) | 69 (3.5%) |
| 35 to 64 Years | 370 (11.7%) | 645 (16.5%) |
| 65 to 74 Years | 108 (10.9%) | 186 (16.9%) |
| 75 Years and over | 102 (19.2%) | 264 (33.7%) |
Disability Class: Self-Care Difficulty
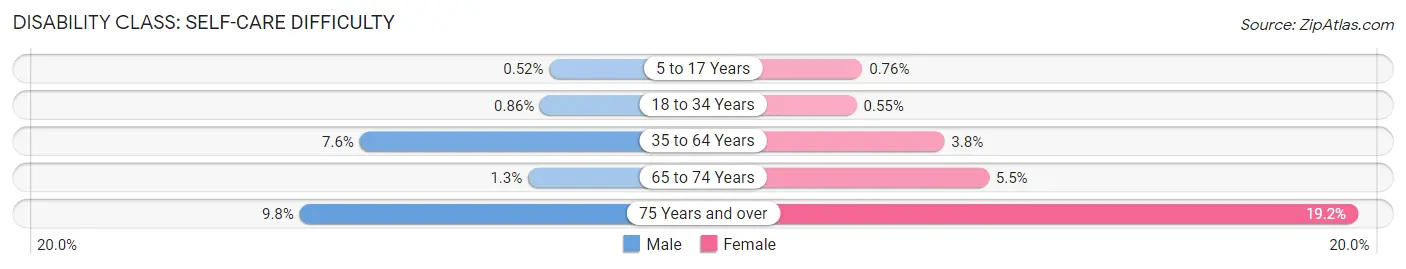
| Age Bracket | Male | Female |
| 5 to 17 Years | 10 (0.5%) | 12 (0.8%) |
| 18 to 34 Years | 16 (0.9%) | 11 (0.5%) |
| 35 to 64 Years | 240 (7.6%) | 149 (3.8%) |
| 65 to 74 Years | 13 (1.3%) | 60 (5.5%) |
| 75 Years and over | 52 (9.8%) | 150 (19.2%) |
Technology Access in Richland Parish
Computing Device Access in Richland Parish
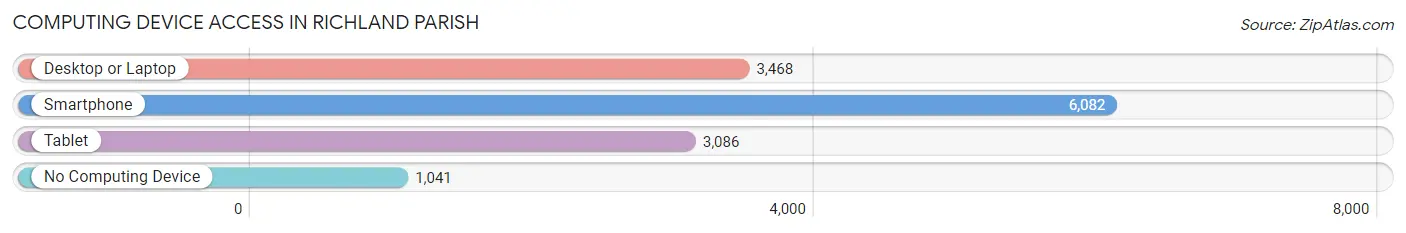
| Device Type | # Households | % Households |
| Desktop or Laptop | 3,468 | 47.5% |
| Smartphone | 6,082 | 83.4% |
| Tablet | 3,086 | 42.3% |
| No Computing Device | 1,041 | 14.3% |
| Total | 7,295 | 100.0% |
Internet Access in Richland Parish
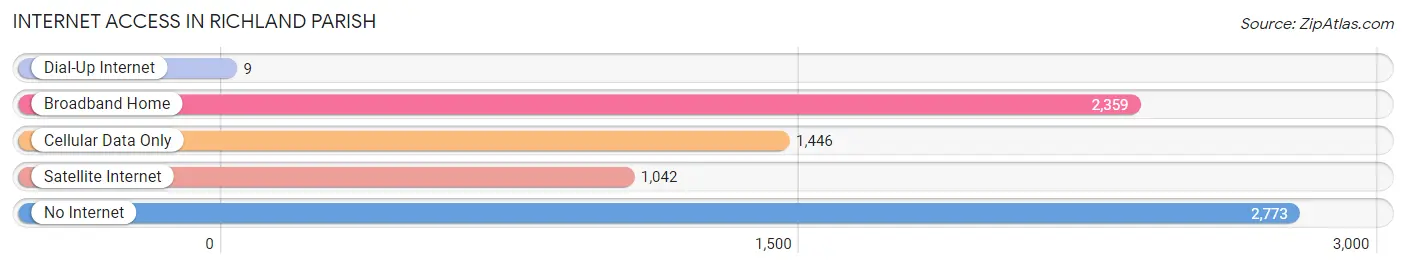
| Internet Type | # Households | % Households |
| Dial-Up Internet | 9 | 0.1% |
| Broadband Home | 2,359 | 32.3% |
| Cellular Data Only | 1,446 | 19.8% |
| Satellite Internet | 1,042 | 14.3% |
| No Internet | 2,773 | 38.0% |
| Total | 7,295 | 100.0% |
Richland Parish Summary
Richland Parish is located in the northeastern corner of Louisiana, and is bordered by the states of Arkansas and Mississippi. It is part of the Monroe Metropolitan Statistical Area, and is the second largest parish in the state. The parish seat is Rayville, and the largest city is Delhi. The parish was created in 1868 from parts of Franklin, Madison, and Morehouse parishes.
Geography
Richland Parish covers an area of 810 square miles, and is located in the northeastern corner of Louisiana. It is bordered by the states of Arkansas and Mississippi, and is part of the Monroe Metropolitan Statistical Area. The terrain is mostly flat, with some rolling hills in the northern part of the parish. The Ouachita River forms the western boundary of the parish, and the Tensas River forms the eastern boundary. The parish is drained by several creeks, including Bayou Macon, Bayou D'Arbonne, and Bayou Desiard.
The climate of Richland Parish is humid subtropical, with hot, humid summers and mild winters. The average annual temperature is 64°F, and the average annual precipitation is 48 inches.
Demographics
As of the 2010 census, there were 20,725 people, 7,845 households, and 5,619 families residing in Richland Parish. The population density was 26 people per square mile. The racial makeup of the parish was 68.3% White, 29.3% African American, 0.3% Native American, 0.3% Asian, 0.1% Pacific Islander, 0.7% from other races, and 1.3% from two or more races. Hispanic or Latino of any race were 2.2% of the population.
The median income for a household in Richland Parish was $30,945, and the median income for a family was $37,945. The per capita income for the parish was $15,945. About 22.3% of families and 27.2% of the population were below the poverty line, including 37.2% of those under age 18 and 22.2% of those age 65 or over.
Economy
The economy of Richland Parish is largely based on agriculture. The main crops grown in the parish are cotton, soybeans, corn, and wheat. Livestock production is also important, with cattle, hogs, and poultry being the main animals raised.
The parish is also home to several manufacturing companies, including a paper mill, a wood products plant, and a chemical plant. The parish is also home to several oil and gas production companies.
Richland Parish is served by two airports, the Rayville Municipal Airport and the Delhi Municipal Airport. The parish is also served by several highways, including Interstate 20, U.S. Highway 80, and Louisiana Highway 17.
Conclusion
Richland Parish is located in the northeastern corner of Louisiana, and is part of the Monroe Metropolitan Statistical Area. The parish covers an area of 810 square miles, and is bordered by the states of Arkansas and Mississippi. The population of the parish was 20,725 as of the 2010 census, and the median income for a household was $30,945. The economy of Richland Parish is largely based on agriculture, with cotton, soybeans, corn, and wheat being the main crops grown. The parish is also home to several manufacturing companies, and is served by two airports and several highways.
Common Questions
What is the Total Population of Richland Parish?
Total Population of Richland Parish is 20,028.
What is the Total Male Population of Richland Parish?
Total Male Population of Richland Parish is 9,951.
What is the Total Female Population of Richland Parish?
Total Female Population of Richland Parish is 10,077.
What is the Ratio of Males per 100 Females in Richland Parish?
There are 98.75 Males per 100 Females in Richland Parish.
What is the Ratio of Females per 100 Males in Richland Parish?
There are 101.27 Females per 100 Males in Richland Parish.
What is the Median Population Age in Richland Parish?
Median Population Age in Richland Parish is 39.5 Years.
What is the Average Family Size in Richland Parish
Average Family Size in Richland Parish is 3.1 People.
What is the Average Household Size in Richland Parish
Average Household Size in Richland Parish is 2.6 People.
What is Per Capita Income in Richland Parish?
Per Capita income in Richland Parish is $25,285.
What is the Median Family Income in Richland Parish?
Median Family Income in Richland Parish is $56,184.
What is the Median Household income in Richland Parish?
Median Household Income in Richland Parish is $48,125.
What is Income or Wage Gap in Richland Parish?
Income or Wage Gap in Richland Parish is 36.8%.
Women in Richland Parish earn 63.2 cents for every dollar earned by a man.
What is Family Income Deficit in Richland Parish?
Family Income Deficit in Richland Parish is $13,771.
Families that are below poverty line in Richland Parish earn $13,771 less on average than the poverty threshold level.
What is Inequality or Gini Index in Richland Parish?
Inequality or Gini Index in Richland Parish is 0.49.
How Large is the Labor Force in Richland Parish?
There are 8,122 People in the Labor Forcein in Richland Parish.
What is the Percentage of People in the Labor Force in Richland Parish?
51.3% of People are in the Labor Force in Richland Parish.
What is the Unemployment Rate in Richland Parish?
Unemployment Rate in Richland Parish is 6.8%.