Rapides Parish, LA
Rapides Parish Map
Rapides Parish Overview
129,536
TOTAL POPULATION
62,847
MALE POPULATION
66,689
FEMALE POPULATION
94.24
MALES / 100 FEMALES
106.11
FEMALES / 100 MALES
37.7
MEDIAN AGE
3.2
AVG FAMILY SIZE
2.6
AVG HOUSEHOLD SIZE
$31,010
PER CAPITA INCOME
$67,923
AVG FAMILY INCOME
$55,407
AVG HOUSEHOLD INCOME
30.7%
WAGE / INCOME GAP [ % ]
69.3¢/ $1
WAGE / INCOME GAP [ $ ]
$10,283
FAMILY INCOME DEFICIT
0.48
INEQUALITY / GINI INDEX
59,437
LABOR FORCE [ PEOPLE ]
58.6%
PERCENT IN LABOR FORCE
5.7%
UNEMPLOYMENT RATE
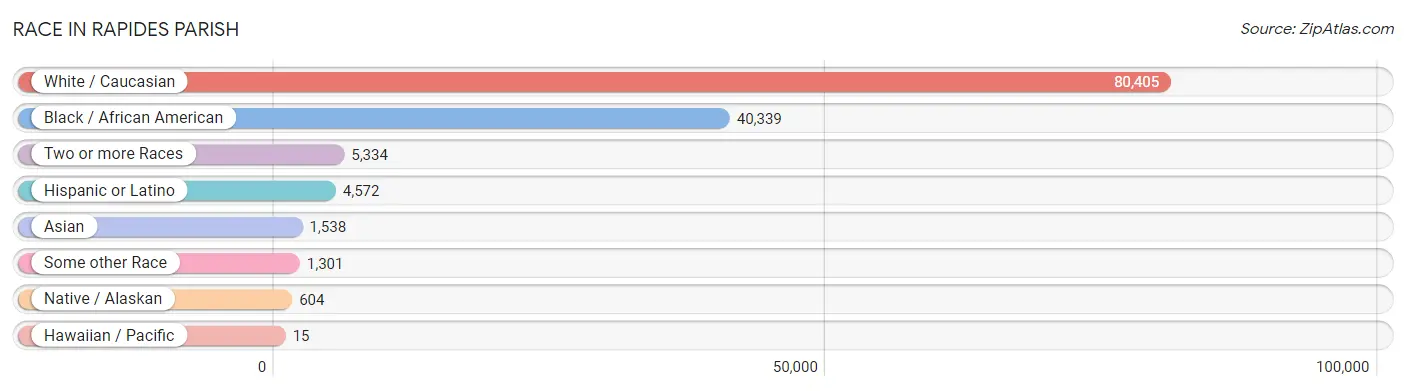
Race in Rapides Parish
The most populous races in Rapides Parish are White / Caucasian (80,405 | 62.1%), Black / African American (40,339 | 31.1%), and Two or more Races (5,334 | 4.1%).
| Race | # Population | % Population |
| Asian | 1,538 | 1.2% |
| Black / African American | 40,339 | 31.1% |
| Hawaiian / Pacific | 15 | 0.0% |
| Hispanic or Latino | 4,572 | 3.5% |
| Native / Alaskan | 604 | 0.5% |
| White / Caucasian | 80,405 | 62.1% |
| Two or more Races | 5,334 | 4.1% |
| Some other Race | 1,301 | 1.0% |
| Total | 129,536 | 100.0% |
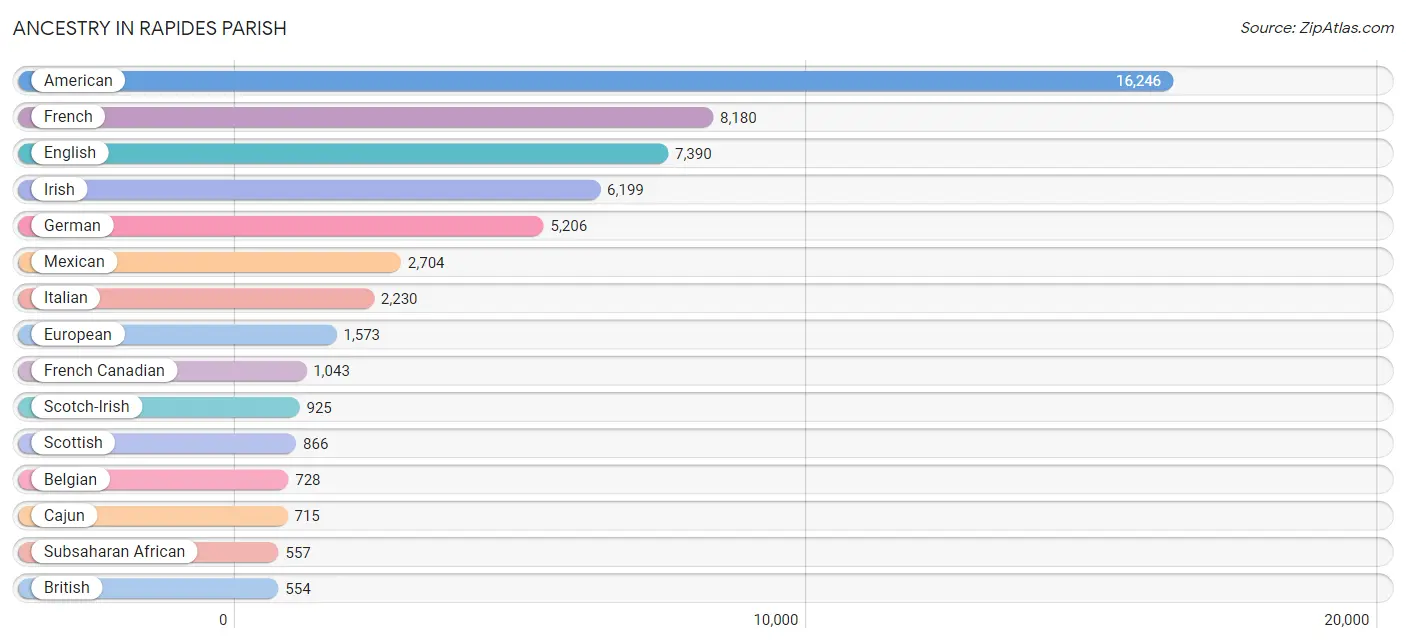
Ancestry in Rapides Parish
The most populous ancestries reported in Rapides Parish are American (16,246 | 12.5%), French (8,180 | 6.3%), English (7,390 | 5.7%), Irish (6,199 | 4.8%), and German (5,206 | 4.0%), together accounting for 33.4% of all Rapides Parish residents.
| Ancestry | # Population | % Population |
| African | 419 | 0.3% |
| Alsatian | 1 | 0.0% |
| American | 16,246 | 12.5% |
| Apache | 20 | 0.0% |
| Arab | 359 | 0.3% |
| Australian | 9 | 0.0% |
| Austrian | 74 | 0.1% |
| Basque | 11 | 0.0% |
| Belgian | 728 | 0.6% |
| Bhutanese | 220 | 0.2% |
| Blackfeet | 16 | 0.0% |
| Brazilian | 17 | 0.0% |
| British | 554 | 0.4% |
| Bulgarian | 94 | 0.1% |
| Burmese | 16 | 0.0% |
| Cajun | 715 | 0.5% |
| Canadian | 36 | 0.0% |
| Central American | 536 | 0.4% |
| Cherokee | 292 | 0.2% |
| Chickasaw | 42 | 0.0% |
| Choctaw | 434 | 0.3% |
| Colombian | 29 | 0.0% |
| Comanche | 1 | 0.0% |
| Costa Rican | 104 | 0.1% |
| Cree | 3 | 0.0% |
| Croatian | 62 | 0.1% |
| Cuban | 286 | 0.2% |
| Czech | 55 | 0.0% |
| Czechoslovakian | 92 | 0.1% |
| Danish | 24 | 0.0% |
| Dominican | 22 | 0.0% |
| Dutch | 219 | 0.2% |
| Eastern European | 135 | 0.1% |
| Ecuadorian | 39 | 0.0% |
| English | 7,390 | 5.7% |
| Ethiopian | 23 | 0.0% |
| European | 1,573 | 1.2% |
| Finnish | 9 | 0.0% |
| French | 8,180 | 6.3% |
| French American Indian | 9 | 0.0% |
| French Canadian | 1,043 | 0.8% |
| German | 5,206 | 4.0% |
| Greek | 40 | 0.0% |
| Guamanian / Chamorro | 14 | 0.0% |
| Guatemalan | 113 | 0.1% |
| Haitian | 126 | 0.1% |
| Honduran | 204 | 0.2% |
| Houma | 14 | 0.0% |
| Hungarian | 54 | 0.0% |
| Indian (Asian) | 374 | 0.3% |
| Irish | 6,199 | 4.8% |
| Italian | 2,230 | 1.7% |
| Jamaican | 27 | 0.0% |
| Japanese | 14 | 0.0% |
| Jordanian | 53 | 0.0% |
| Kenyan | 28 | 0.0% |
| Korean | 468 | 0.4% |
| Lebanese | 62 | 0.1% |
| Liberian | 38 | 0.0% |
| Lithuanian | 36 | 0.0% |
| Malaysian | 250 | 0.2% |
| Mexican | 2,704 | 2.1% |
| Mexican American Indian | 70 | 0.1% |
| Native Hawaiian | 28 | 0.0% |
| Nicaraguan | 106 | 0.1% |
| Northern European | 303 | 0.2% |
| Norwegian | 404 | 0.3% |
| Osage | 5 | 0.0% |
| Pakistani | 171 | 0.1% |
| Palestinian | 209 | 0.2% |
| Panamanian | 3 | 0.0% |
| Polish | 180 | 0.1% |
| Portuguese | 30 | 0.0% |
| Puerto Rican | 376 | 0.3% |
| Romanian | 14 | 0.0% |
| Russian | 73 | 0.1% |
| Salvadoran | 6 | 0.0% |
| Scandinavian | 235 | 0.2% |
| Scotch-Irish | 925 | 0.7% |
| Scottish | 866 | 0.7% |
| Seminole | 6 | 0.0% |
| Serbian | 9 | 0.0% |
| Sioux | 4 | 0.0% |
| Slavic | 12 | 0.0% |
| Slovak | 42 | 0.0% |
| South African | 44 | 0.0% |
| South American | 68 | 0.1% |
| South American Indian | 26 | 0.0% |
| Spaniard | 287 | 0.2% |
| Spanish | 183 | 0.1% |
| Sri Lankan | 183 | 0.1% |
| Subsaharan African | 557 | 0.4% |
| Swedish | 125 | 0.1% |
| Swiss | 105 | 0.1% |
| Syrian | 46 | 0.0% |
| Thai | 407 | 0.3% |
| Turkish | 13 | 0.0% |
| Ukrainian | 24 | 0.0% |
| Welsh | 254 | 0.2% |
| West Indian | 7 | 0.0% | View All 100 Rows |
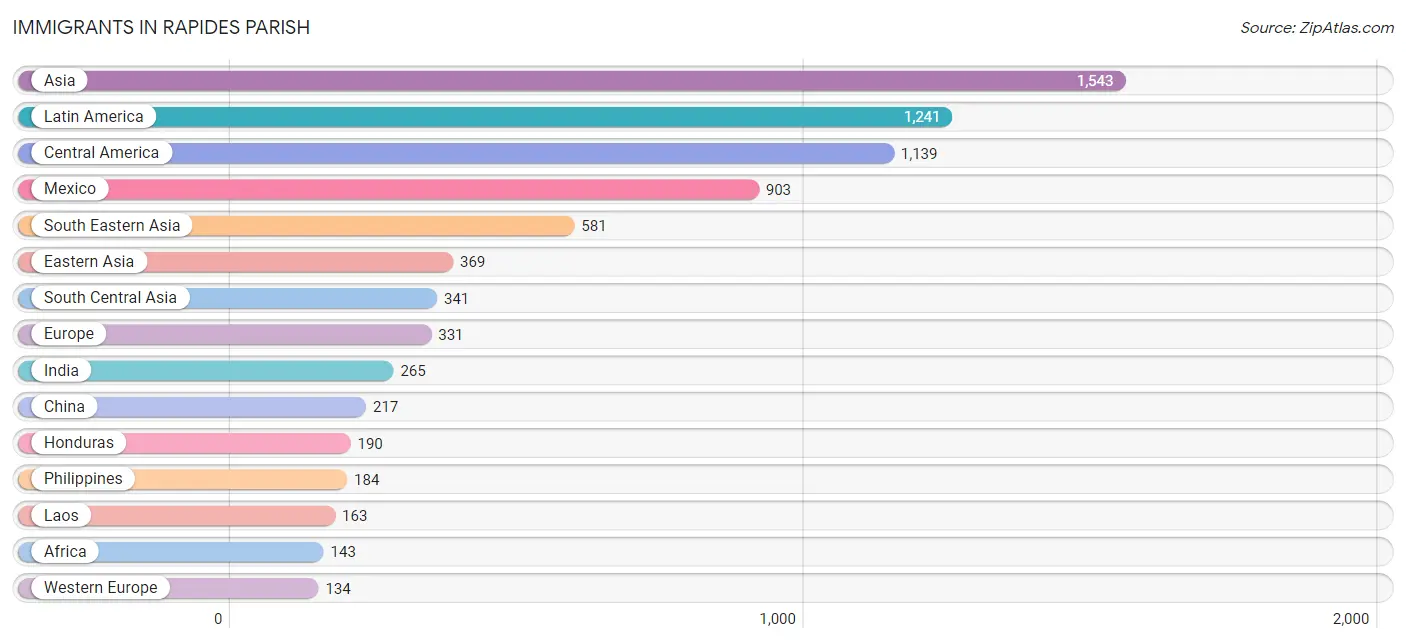
Immigrants in Rapides Parish
The most numerous immigrant groups reported in Rapides Parish came from Asia (1,543 | 1.2%), Latin America (1,241 | 1.0%), Central America (1,139 | 0.9%), Mexico (903 | 0.7%), and South Eastern Asia (581 | 0.4%), together accounting for 4.2% of all Rapides Parish residents.
| Immigration Origin | # Population | % Population |
| Africa | 143 | 0.1% |
| Asia | 1,543 | 1.2% |
| Australia | 3 | 0.0% |
| Austria | 38 | 0.0% |
| Bangladesh | 20 | 0.0% |
| Belize | 7 | 0.0% |
| Brazil | 17 | 0.0% |
| Bulgaria | 20 | 0.0% |
| Cambodia | 8 | 0.0% |
| Canada | 84 | 0.1% |
| Caribbean | 33 | 0.0% |
| Central America | 1,139 | 0.9% |
| China | 217 | 0.2% |
| Costa Rica | 39 | 0.0% |
| Cuba | 33 | 0.0% |
| Eastern Africa | 74 | 0.1% |
| Eastern Asia | 369 | 0.3% |
| Eastern Europe | 53 | 0.0% |
| Ecuador | 21 | 0.0% |
| England | 65 | 0.1% |
| Ethiopia | 23 | 0.0% |
| Europe | 331 | 0.3% |
| Germany | 96 | 0.1% |
| Ghana | 24 | 0.0% |
| Honduras | 190 | 0.2% |
| India | 265 | 0.2% |
| Israel | 66 | 0.1% |
| Italy | 66 | 0.1% |
| Japan | 126 | 0.1% |
| Jordan | 20 | 0.0% |
| Kenya | 7 | 0.0% |
| Korea | 26 | 0.0% |
| Laos | 163 | 0.1% |
| Latin America | 1,241 | 1.0% |
| Lithuania | 1 | 0.0% |
| Mexico | 903 | 0.7% |
| Nepal | 2 | 0.0% |
| Northern Europe | 78 | 0.1% |
| Oceania | 3 | 0.0% |
| Pakistan | 54 | 0.0% |
| Philippines | 184 | 0.1% |
| Russia | 32 | 0.0% |
| South Africa | 17 | 0.0% |
| South America | 69 | 0.1% |
| South Central Asia | 341 | 0.3% |
| South Eastern Asia | 581 | 0.4% |
| Southern Europe | 66 | 0.1% |
| Thailand | 94 | 0.1% |
| Turkey | 23 | 0.0% |
| Venezuela | 31 | 0.0% |
| Vietnam | 132 | 0.1% |
| Western Africa | 24 | 0.0% |
| Western Asia | 120 | 0.1% |
| Western Europe | 134 | 0.1% | View All 54 Rows |
Sex and Age in Rapides Parish
Sex and Age in Rapides Parish
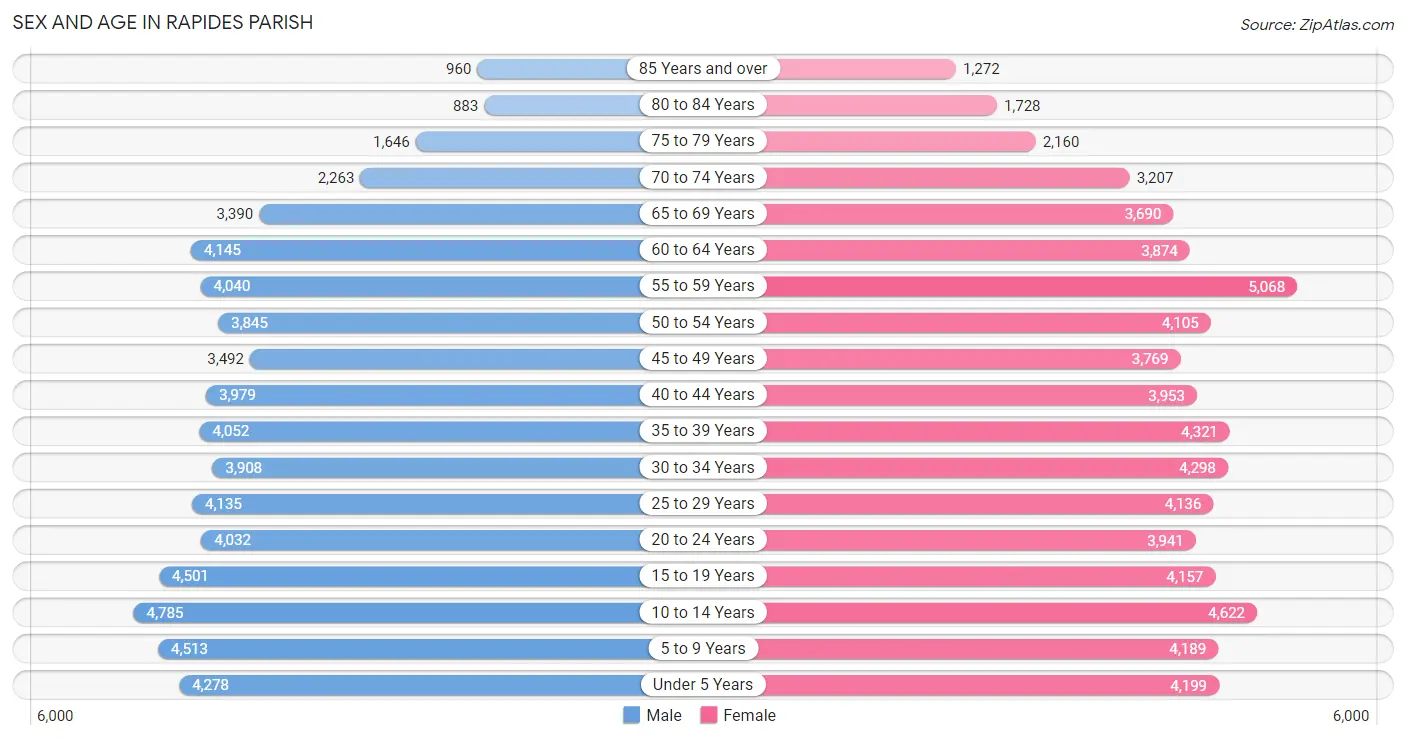
The most populous age groups in Rapides Parish are 10 to 14 Years (4,785 | 7.6%) for men and 55 to 59 Years (5,068 | 7.6%) for women.
| Age Bracket | Male | Female |
| Under 5 Years | 4,278 (6.8%) | 4,199 (6.3%) |
| 5 to 9 Years | 4,513 (7.2%) | 4,189 (6.3%) |
| 10 to 14 Years | 4,785 (7.6%) | 4,622 (6.9%) |
| 15 to 19 Years | 4,501 (7.2%) | 4,157 (6.2%) |
| 20 to 24 Years | 4,032 (6.4%) | 3,941 (5.9%) |
| 25 to 29 Years | 4,135 (6.6%) | 4,136 (6.2%) |
| 30 to 34 Years | 3,908 (6.2%) | 4,298 (6.4%) |
| 35 to 39 Years | 4,052 (6.5%) | 4,321 (6.5%) |
| 40 to 44 Years | 3,979 (6.3%) | 3,953 (5.9%) |
| 45 to 49 Years | 3,492 (5.6%) | 3,769 (5.7%) |
| 50 to 54 Years | 3,845 (6.1%) | 4,105 (6.2%) |
| 55 to 59 Years | 4,040 (6.4%) | 5,068 (7.6%) |
| 60 to 64 Years | 4,145 (6.6%) | 3,874 (5.8%) |
| 65 to 69 Years | 3,390 (5.4%) | 3,690 (5.5%) |
| 70 to 74 Years | 2,263 (3.6%) | 3,207 (4.8%) |
| 75 to 79 Years | 1,646 (2.6%) | 2,160 (3.2%) |
| 80 to 84 Years | 883 (1.4%) | 1,728 (2.6%) |
| 85 Years and over | 960 (1.5%) | 1,272 (1.9%) |
| Total | 62,847 (100.0%) | 66,689 (100.0%) |
Families and Households in Rapides Parish
Median Family Size in Rapides Parish
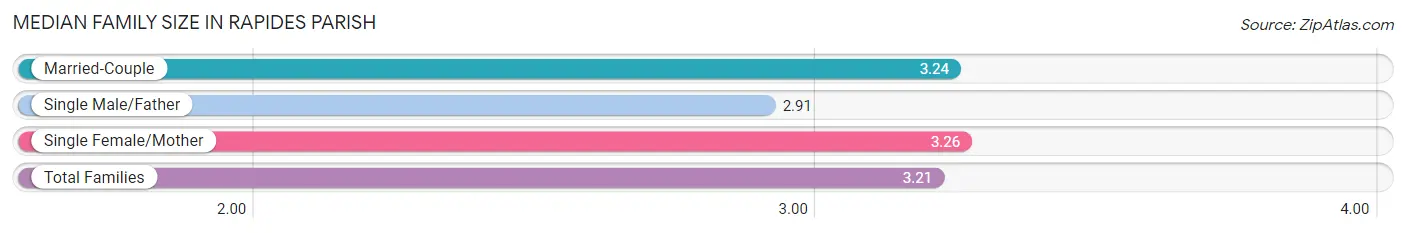
The median family size in Rapides Parish is 3.21 persons per family, with single female/mother families (8,143 | 25.7%) accounting for the largest median family size of 3.26 persons per family. On the other hand, single male/father families (2,932 | 9.2%) represent the smallest median family size with 2.91 persons per family.
| Family Type | # Families | Family Size |
| Married-Couple | 20,635 (65.1%) | 3.24 |
| Single Male/Father | 2,932 (9.2%) | 2.91 |
| Single Female/Mother | 8,143 (25.7%) | 3.26 |
| Total Families | 31,710 (100.0%) | 3.21 |
Median Household Size in Rapides Parish
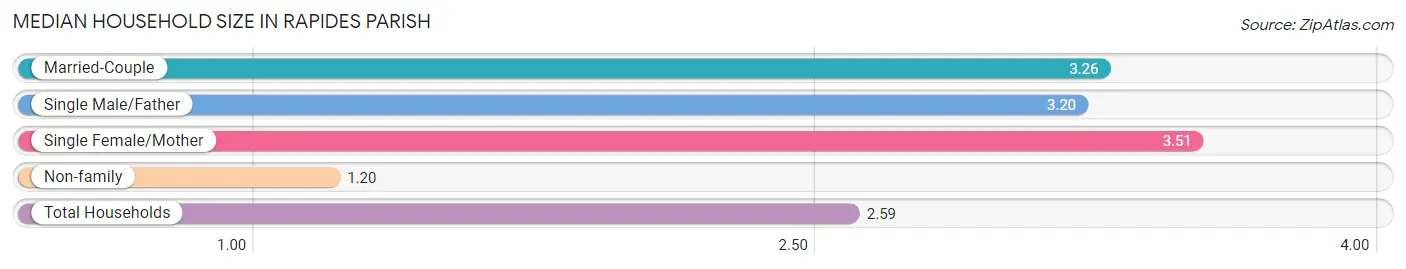
The median household size in Rapides Parish is 2.59 persons per household, with single female/mother households (8,143 | 16.8%) accounting for the largest median household size of 3.51 persons per household. non-family households (16,834 | 34.7%) represent the smallest median household size with 1.20 persons per household.
| Household Type | # Households | Household Size |
| Married-Couple | 20,635 (42.5%) | 3.26 |
| Single Male/Father | 2,932 (6.0%) | 3.20 |
| Single Female/Mother | 8,143 (16.8%) | 3.51 |
| Non-family | 16,834 (34.7%) | 1.20 |
| Total Households | 48,544 (100.0%) | 2.59 |
Household Size by Marriage Status in Rapides Parish
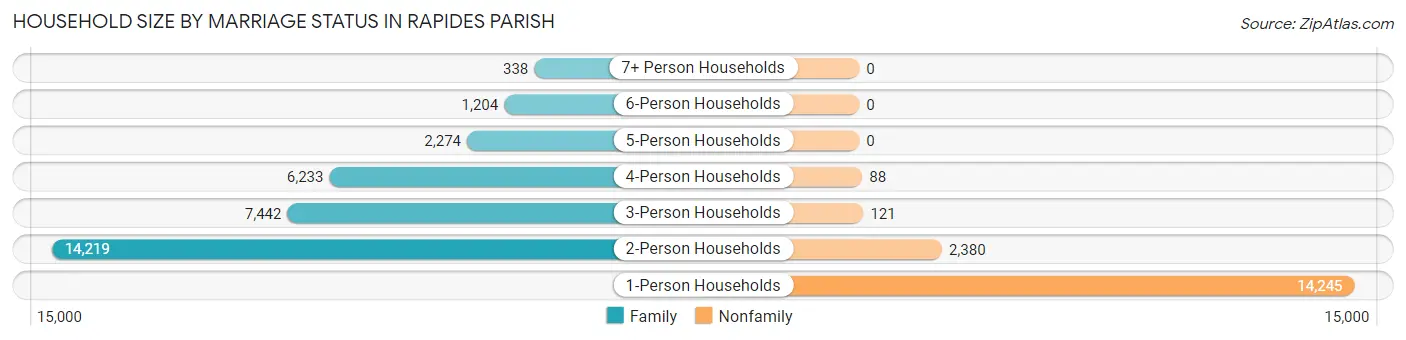
Out of a total of 48,544 households in Rapides Parish, 31,710 (65.3%) are family households, while 16,834 (34.7%) are nonfamily households. The most numerous type of family households are 2-person households, comprising 14,219, and the most common type of nonfamily households are 1-person households, comprising 14,245.
| Household Size | Family Households | Nonfamily Households |
| 1-Person Households | - | 14,245 (29.3%) |
| 2-Person Households | 14,219 (29.3%) | 2,380 (4.9%) |
| 3-Person Households | 7,442 (15.3%) | 121 (0.3%) |
| 4-Person Households | 6,233 (12.8%) | 88 (0.2%) |
| 5-Person Households | 2,274 (4.7%) | 0 (0.0%) |
| 6-Person Households | 1,204 (2.5%) | 0 (0.0%) |
| 7+ Person Households | 338 (0.7%) | 0 (0.0%) |
| Total | 31,710 (65.3%) | 16,834 (34.7%) |
Female Fertility in Rapides Parish
Fertility by Age in Rapides Parish
Average fertility rate in Rapides Parish is 63.0 births per 1,000 women. Women in the age bracket of 20 to 34 years have the highest fertility rate with 90.0 births per 1,000 women. Women in the age bracket of 20 to 34 years acount for 60.0% of all women with births.
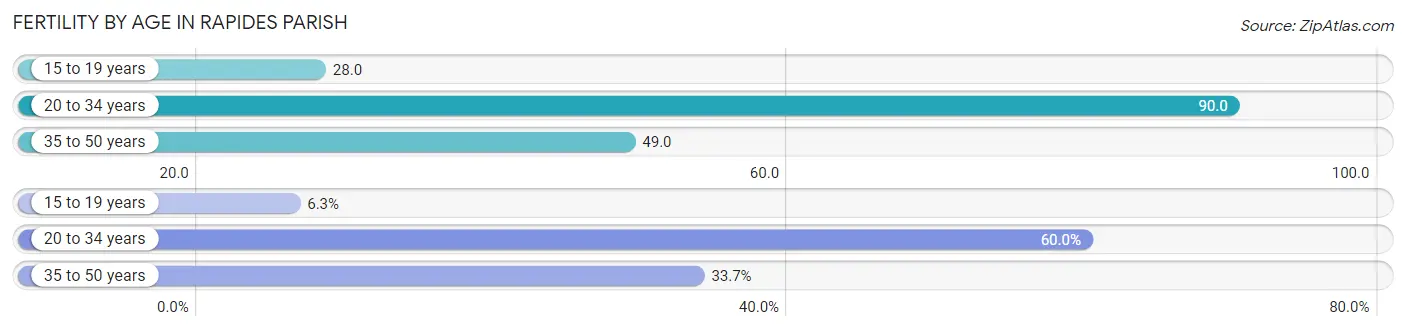
| Age Bracket | Women with Births | Births / 1,000 Women |
| 15 to 19 years | 116 (6.3%) | 28.0 |
| 20 to 34 years | 1,112 (60.0%) | 90.0 |
| 35 to 50 years | 624 (33.7%) | 49.0 |
| Total | 1,852 (100.0%) | 63.0 |
Fertility by Age by Marriage Status in Rapides Parish
57.3% of women with births (1,852) in Rapides Parish are married. The highest percentage of unmarried women with births falls into 15 to 19 years age bracket with 100.0% of them unmarried at the time of birth, while the lowest percentage of unmarried women with births belong to 35 to 50 years age bracket with 15.9% of them unmarried.
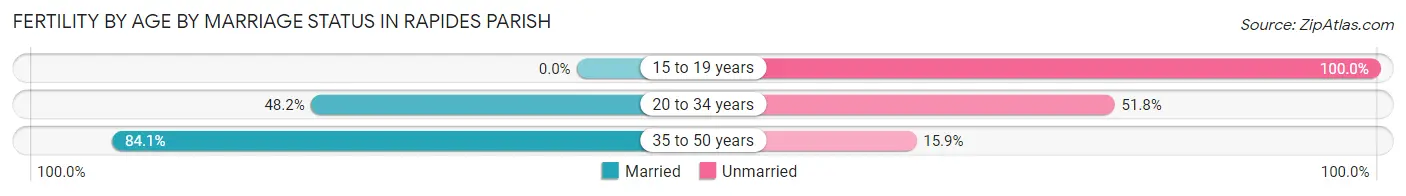
| Age Bracket | Married | Unmarried |
| 15 to 19 years | 0 (0.0%) | 116 (100.0%) |
| 20 to 34 years | 536 (48.2%) | 576 (51.8%) |
| 35 to 50 years | 525 (84.1%) | 99 (15.9%) |
| Total | 1,061 (57.3%) | 791 (42.7%) |
Fertility by Education in Rapides Parish
Average fertility rate in Rapides Parish is 63.0 births per 1,000 women. Women with the education attainment of bachelor's degree have the highest fertility rate of 98.0 births per 1,000 women, while women with the education attainment of graduate degree have the lowest fertility at 16.0 births per 1,000 women. Women with the education attainment of college or associate's degree represent 40.8% of all women with births.
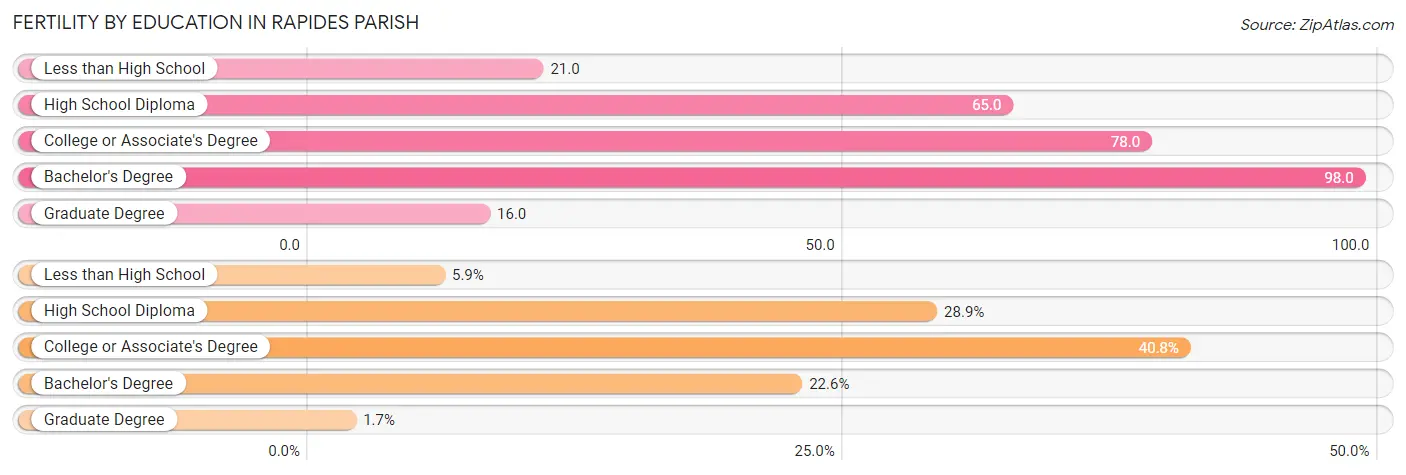
| Educational Attainment | Women with Births | Births / 1,000 Women |
| Less than High School | 109 (5.9%) | 21.0 |
| High School Diploma | 536 (28.9%) | 65.0 |
| College or Associate's Degree | 756 (40.8%) | 78.0 |
| Bachelor's Degree | 419 (22.6%) | 98.0 |
| Graduate Degree | 32 (1.7%) | 16.0 |
| Total | 1,852 (100.0%) | 63.0 |
Fertility by Education by Marriage Status in Rapides Parish
42.7% of women with births in Rapides Parish are unmarried. Women with the educational attainment of graduate degree are most likely to be married with 100.0% of them married at childbirth, while women with the educational attainment of less than high school are least likely to be married with 94.5% of them unmarried at childbirth.
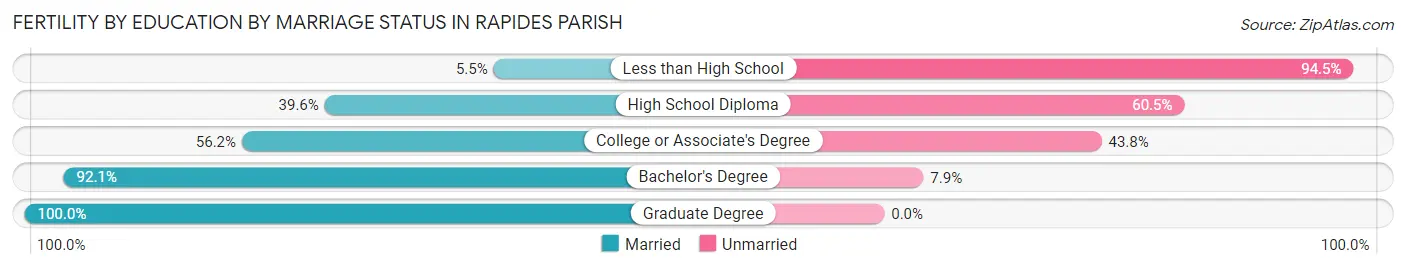
| Educational Attainment | Married | Unmarried |
| Less than High School | 6 (5.5%) | 103 (94.5%) |
| High School Diploma | 212 (39.6%) | 324 (60.5%) |
| College or Associate's Degree | 425 (56.2%) | 331 (43.8%) |
| Bachelor's Degree | 386 (92.1%) | 33 (7.9%) |
| Graduate Degree | 32 (100.0%) | 0 (0.0%) |
| Total | 1,061 (57.3%) | 791 (42.7%) |
Income in Rapides Parish
Income Overview in Rapides Parish
Per Capita Income in Rapides Parish is $31,010, while median incomes of families and households are $67,923 and $55,407 respectively.
| Characteristic | Number | Measure |
| Per Capita Income | 129,536 | $31,010 |
| Median Family Income | 31,710 | $67,923 |
| Mean Family Income | 31,710 | $90,373 |
| Median Household Income | 48,544 | $55,407 |
| Mean Household Income | 48,544 | $78,704 |
| Income Deficit | 31,710 | $10,283 |
| Wage / Income Gap (%) | 129,536 | 30.66% |
| Wage / Income Gap ($) | 129,536 | 69.34¢ per $1 |
| Gini / Inequality Index | 129,536 | 0.48 |
Earnings by Sex in Rapides Parish
Average Earnings in Rapides Parish are $35,174, $44,576 for men and $30,909 for women, a difference of 30.7%.
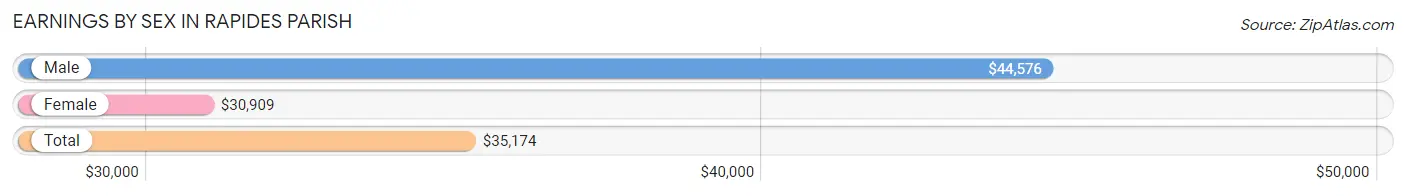
| Sex | Number | Average Earnings |
| Male | 31,013 (50.5%) | $44,576 |
| Female | 30,361 (49.5%) | $30,909 |
| Total | 61,374 (100.0%) | $35,174 |
Earnings by Sex by Income Bracket in Rapides Parish
The most common earnings brackets in Rapides Parish are $100,000+ for men (4,652 | 15.0%) and $30,000 to $34,999 for women (2,868 | 9.5%).
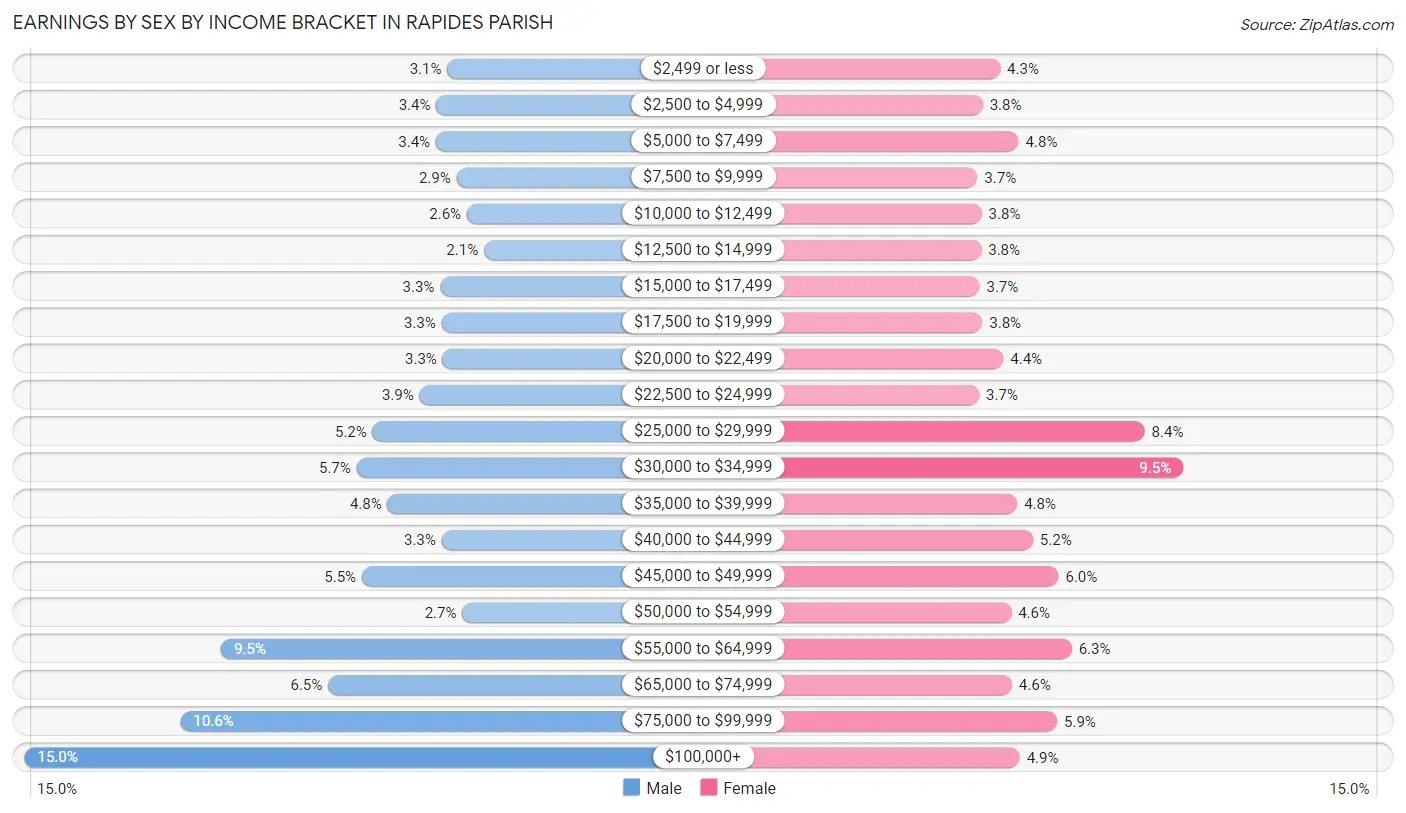
| Income | Male | Female |
| $2,499 or less | 968 (3.1%) | 1,310 (4.3%) |
| $2,500 to $4,999 | 1,063 (3.4%) | 1,161 (3.8%) |
| $5,000 to $7,499 | 1,067 (3.4%) | 1,465 (4.8%) |
| $7,500 to $9,999 | 888 (2.9%) | 1,114 (3.7%) |
| $10,000 to $12,499 | 798 (2.6%) | 1,150 (3.8%) |
| $12,500 to $14,999 | 648 (2.1%) | 1,148 (3.8%) |
| $15,000 to $17,499 | 1,029 (3.3%) | 1,132 (3.7%) |
| $17,500 to $19,999 | 1,016 (3.3%) | 1,157 (3.8%) |
| $20,000 to $22,499 | 1,008 (3.3%) | 1,335 (4.4%) |
| $22,500 to $24,999 | 1,208 (3.9%) | 1,130 (3.7%) |
| $25,000 to $29,999 | 1,618 (5.2%) | 2,541 (8.4%) |
| $30,000 to $34,999 | 1,757 (5.7%) | 2,868 (9.5%) |
| $35,000 to $39,999 | 1,489 (4.8%) | 1,455 (4.8%) |
| $40,000 to $44,999 | 1,016 (3.3%) | 1,587 (5.2%) |
| $45,000 to $49,999 | 1,711 (5.5%) | 1,806 (5.9%) |
| $50,000 to $54,999 | 836 (2.7%) | 1,404 (4.6%) |
| $55,000 to $64,999 | 2,940 (9.5%) | 1,919 (6.3%) |
| $65,000 to $74,999 | 2,006 (6.5%) | 1,409 (4.6%) |
| $75,000 to $99,999 | 3,295 (10.6%) | 1,794 (5.9%) |
| $100,000+ | 4,652 (15.0%) | 1,476 (4.9%) |
| Total | 31,013 (100.0%) | 30,361 (100.0%) |
Earnings by Sex by Educational Attainment in Rapides Parish
Average earnings in Rapides Parish are $49,629 for men and $33,454 for women, a difference of 32.6%. Men with an educational attainment of graduate degree enjoy the highest average annual earnings of $84,725, while those with less than high school education earn the least with $31,199. Women with an educational attainment of graduate degree earn the most with the average annual earnings of $59,083, while those with less than high school education have the smallest earnings of $20,248.
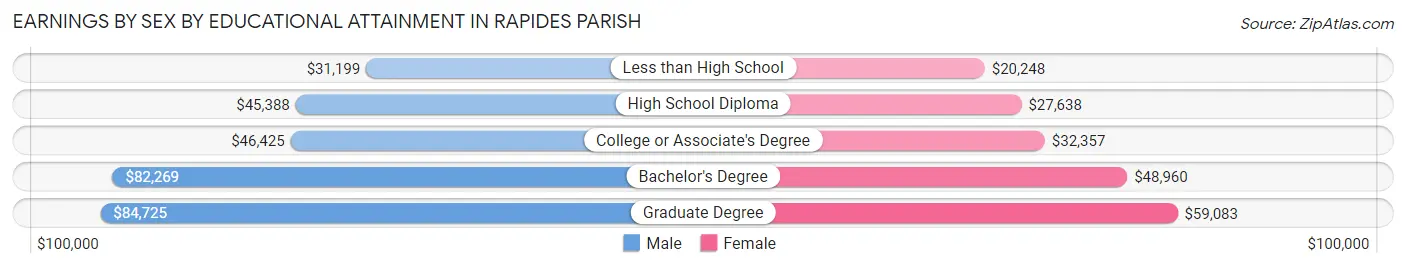
| Educational Attainment | Male Income | Female Income |
| Less than High School | $31,199 | $20,248 |
| High School Diploma | $45,388 | $27,638 |
| College or Associate's Degree | $46,425 | $32,357 |
| Bachelor's Degree | $82,269 | $48,960 |
| Graduate Degree | $84,725 | $59,083 |
| Total | $49,629 | $33,454 |
Family Income in Rapides Parish
Family Income Brackets in Rapides Parish
According to the Rapides Parish family income data, there are 5,898 families falling into the $50,000 to $74,999 income range, which is the most common income bracket and makes up 18.6% of all families. Conversely, the $10,000 to $14,999 income bracket is the least frequent group with only 824 families (2.6%) belonging to this category.
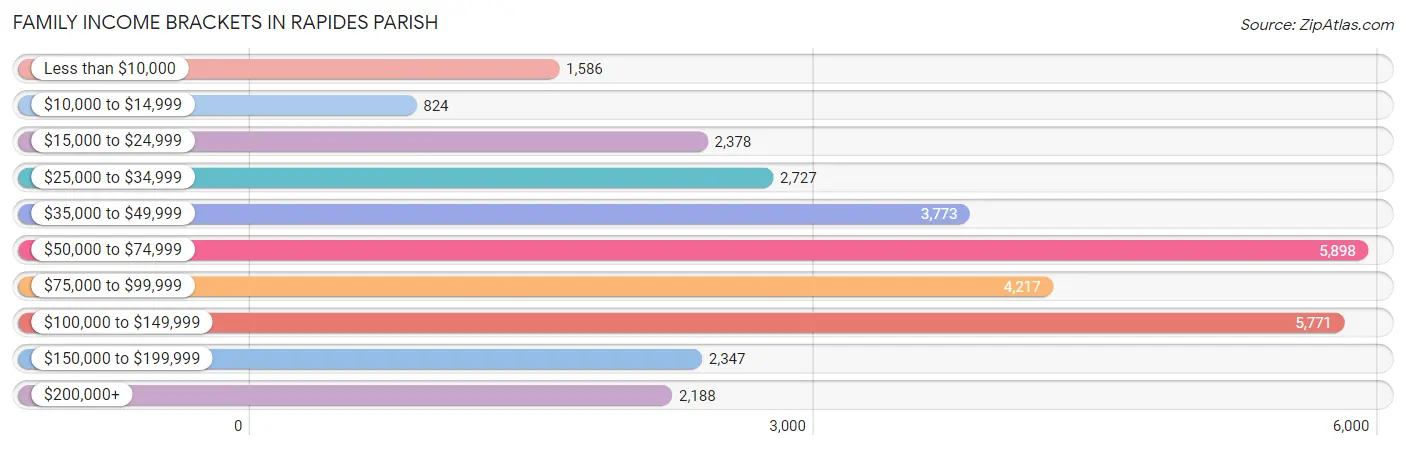
| Income Bracket | # Families | % Families |
| Less than $10,000 | 1,586 | 5.0% |
| $10,000 to $14,999 | 824 | 2.6% |
| $15,000 to $24,999 | 2,378 | 7.5% |
| $25,000 to $34,999 | 2,727 | 8.6% |
| $35,000 to $49,999 | 3,773 | 11.9% |
| $50,000 to $74,999 | 5,898 | 18.6% |
| $75,000 to $99,999 | 4,217 | 13.3% |
| $100,000 to $149,999 | 5,771 | 18.2% |
| $150,000 to $199,999 | 2,347 | 7.4% |
| $200,000+ | 2,188 | 6.9% |
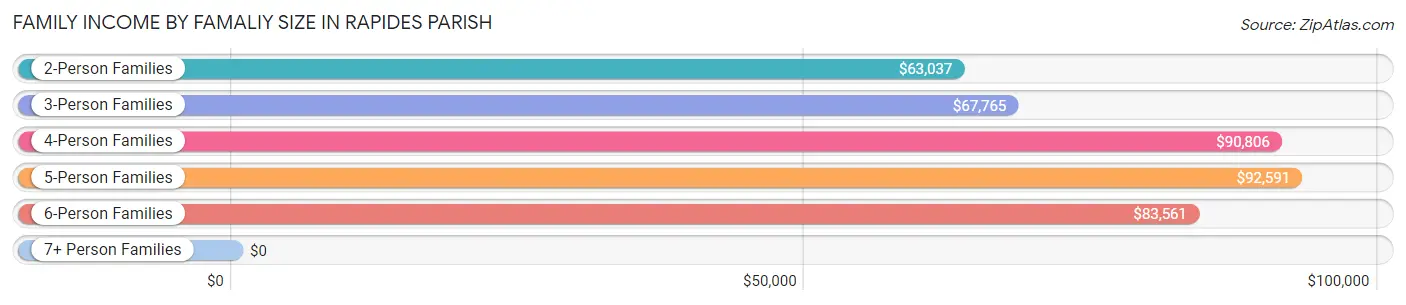
Family Income by Famaliy Size in Rapides Parish
5-person families (2,029 | 6.4%) account for the highest median family income in Rapides Parish with $92,591 per family, while 2-person families (15,218 | 48.0%) have the highest median income of $31,518 per family member.
| Income Bracket | # Families | Median Income |
| 2-Person Families | 15,218 (48.0%) | $63,037 |
| 3-Person Families | 7,642 (24.1%) | $67,765 |
| 4-Person Families | 5,468 (17.2%) | $90,806 |
| 5-Person Families | 2,029 (6.4%) | $92,591 |
| 6-Person Families | 1,036 (3.3%) | $83,561 |
| 7+ Person Families | 317 (1.0%) | $0 |
| Total | 31,710 (100.0%) | $67,923 |
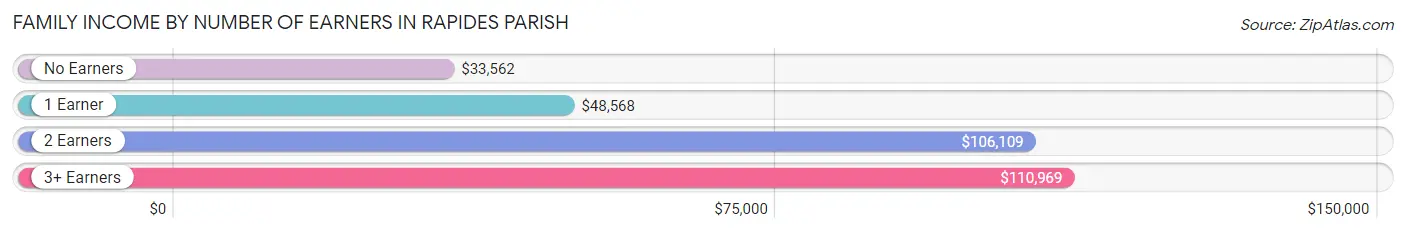
Family Income by Number of Earners in Rapides Parish
The median family income in Rapides Parish is $67,923, with families comprising 3+ earners (2,380) having the highest median family income of $110,969, while families with no earners (5,241) have the lowest median family income of $33,562, accounting for 7.5% and 16.5% of families, respectively.
| Number of Earners | # Families | Median Income |
| No Earners | 5,241 (16.5%) | $33,562 |
| 1 Earner | 12,571 (39.6%) | $48,568 |
| 2 Earners | 11,518 (36.3%) | $106,109 |
| 3+ Earners | 2,380 (7.5%) | $110,969 |
| Total | 31,710 (100.0%) | $67,923 |
Household Income in Rapides Parish
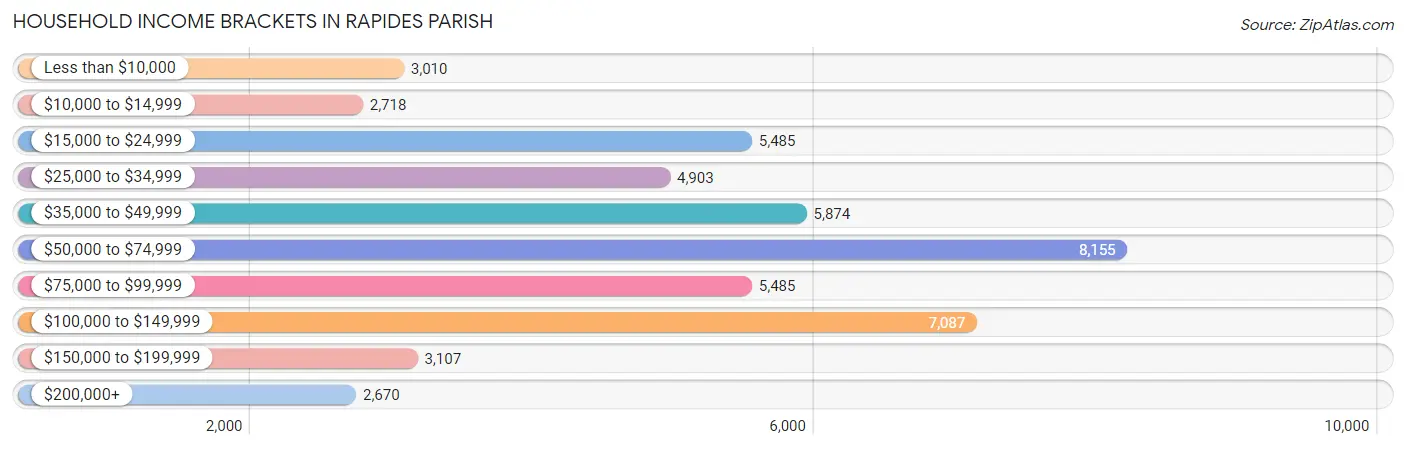
Household Income Brackets in Rapides Parish
With 8,155 households falling in the category, the $50,000 to $74,999 income range is the most frequent in Rapides Parish, accounting for 16.8% of all households. In contrast, only 2,670 households (5.5%) fall into the $200,000+ income bracket, making it the least populous group.
| Income Bracket | # Households | % Households |
| Less than $10,000 | 3,010 | 6.2% |
| $10,000 to $14,999 | 2,718 | 5.6% |
| $15,000 to $24,999 | 5,485 | 11.3% |
| $25,000 to $34,999 | 4,903 | 10.1% |
| $35,000 to $49,999 | 5,874 | 12.1% |
| $50,000 to $74,999 | 8,155 | 16.8% |
| $75,000 to $99,999 | 5,485 | 11.3% |
| $100,000 to $149,999 | 7,087 | 14.6% |
| $150,000 to $199,999 | 3,107 | 6.4% |
| $200,000+ | 2,670 | 5.5% |
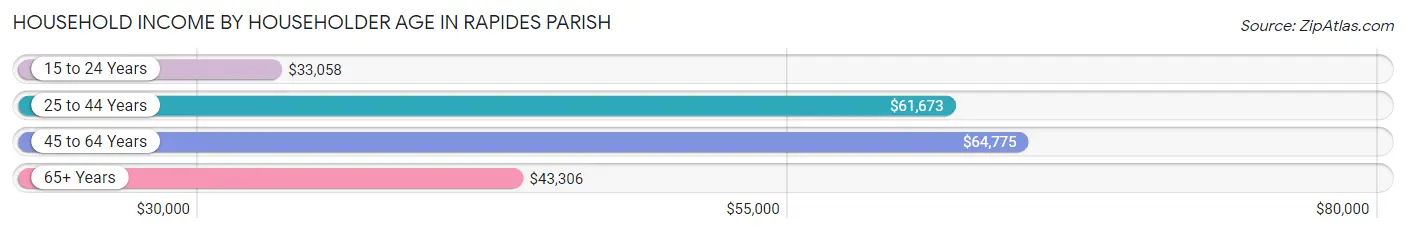
Household Income by Householder Age in Rapides Parish
The median household income in Rapides Parish is $55,407, with the highest median household income of $64,775 found in the 45 to 64 years age bracket for the primary householder. A total of 17,789 households (36.6%) fall into this category. Meanwhile, the 15 to 24 years age bracket for the primary householder has the lowest median household income of $33,058, with 1,692 households (3.5%) in this group.
| Income Bracket | # Households | Median Income |
| 15 to 24 Years | 1,692 (3.5%) | $33,058 |
| 25 to 44 Years | 15,155 (31.2%) | $61,673 |
| 45 to 64 Years | 17,789 (36.6%) | $64,775 |
| 65+ Years | 13,908 (28.6%) | $43,306 |
| Total | 48,544 (100.0%) | $55,407 |
Poverty in Rapides Parish
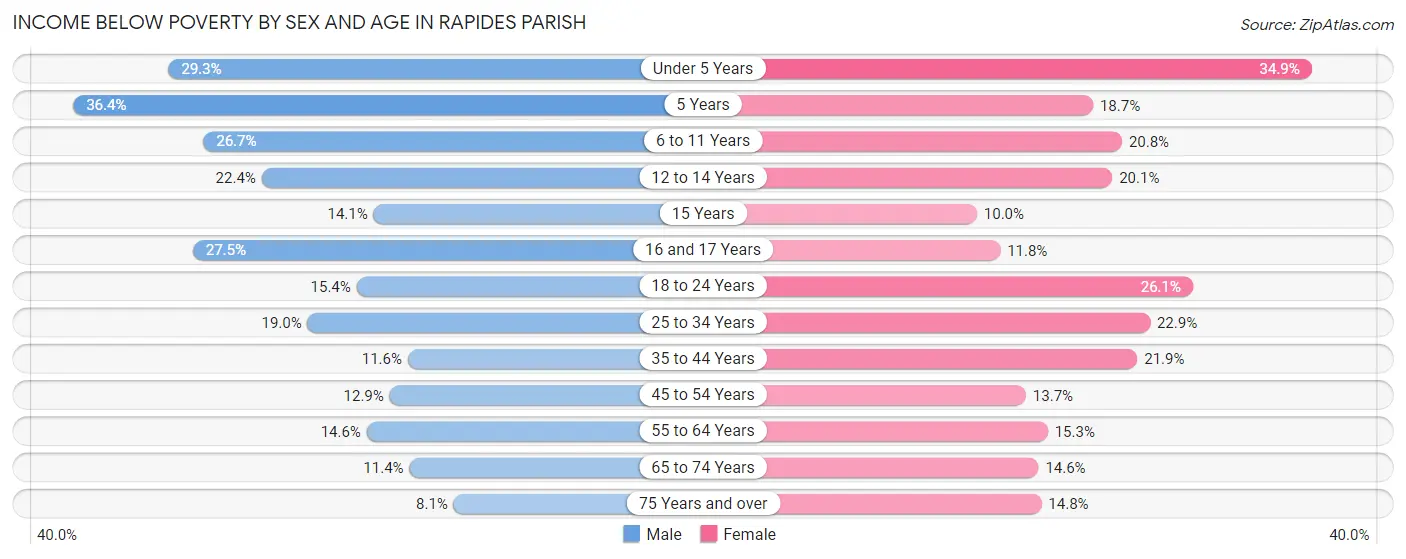
Income Below Poverty by Sex and Age in Rapides Parish
With 17.2% poverty level for males and 19.4% for females among the residents of Rapides Parish, 5 year old males and under 5 year old females are the most vulnerable to poverty, with 345 males (36.4%) and 1,449 females (34.9%) in their respective age groups living below the poverty level.
| Age Bracket | Male | Female |
| Under 5 Years | 1,231 (29.3%) | 1,449 (34.9%) |
| 5 Years | 345 (36.4%) | 138 (18.6%) |
| 6 to 11 Years | 1,397 (26.7%) | 1,038 (20.8%) |
| 12 to 14 Years | 673 (22.4%) | 580 (20.1%) |
| 15 Years | 123 (14.1%) | 64 (10.0%) |
| 16 and 17 Years | 523 (27.5%) | 236 (11.8%) |
| 18 to 24 Years | 759 (15.3%) | 1,306 (26.1%) |
| 25 to 34 Years | 1,478 (19.0%) | 1,923 (22.9%) |
| 35 to 44 Years | 894 (11.6%) | 1,806 (21.9%) |
| 45 to 54 Years | 925 (12.9%) | 1,076 (13.7%) |
| 55 to 64 Years | 1,180 (14.6%) | 1,353 (15.3%) |
| 65 to 74 Years | 623 (11.4%) | 995 (14.6%) |
| 75 Years and over | 270 (8.1%) | 717 (14.8%) |
| Total | 10,421 (17.2%) | 12,681 (19.4%) |
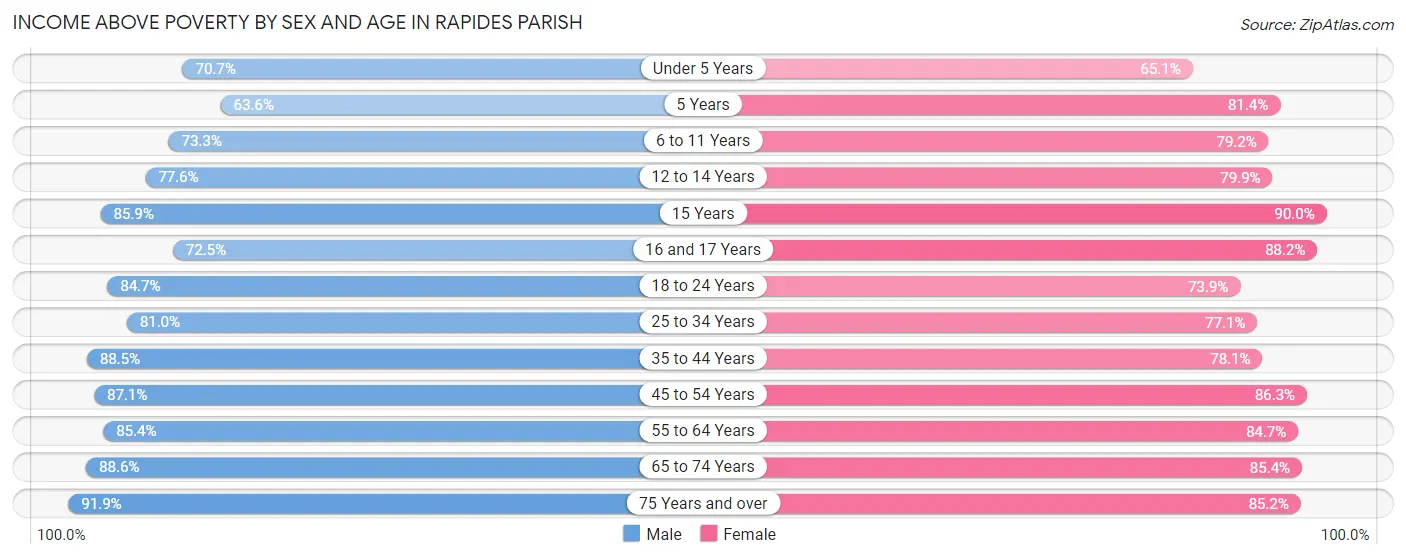
Income Above Poverty by Sex and Age in Rapides Parish
According to the poverty statistics in Rapides Parish, males aged 75 years and over and females aged 15 years are the age groups that are most secure financially, with 91.9% of males and 90.0% of females in these age groups living above the poverty line.
| Age Bracket | Male | Female |
| Under 5 Years | 2,966 (70.7%) | 2,705 (65.1%) |
| 5 Years | 603 (63.6%) | 602 (81.4%) |
| 6 to 11 Years | 3,830 (73.3%) | 3,952 (79.2%) |
| 12 to 14 Years | 2,332 (77.6%) | 2,309 (79.9%) |
| 15 Years | 750 (85.9%) | 574 (90.0%) |
| 16 and 17 Years | 1,378 (72.5%) | 1,770 (88.2%) |
| 18 to 24 Years | 4,186 (84.7%) | 3,706 (73.9%) |
| 25 to 34 Years | 6,307 (81.0%) | 6,481 (77.1%) |
| 35 to 44 Years | 6,843 (88.4%) | 6,427 (78.1%) |
| 45 to 54 Years | 6,245 (87.1%) | 6,798 (86.3%) |
| 55 to 64 Years | 6,904 (85.4%) | 7,496 (84.7%) |
| 65 to 74 Years | 4,828 (88.6%) | 5,819 (85.4%) |
| 75 Years and over | 3,047 (91.9%) | 4,121 (85.2%) |
| Total | 50,219 (82.8%) | 52,760 (80.6%) |
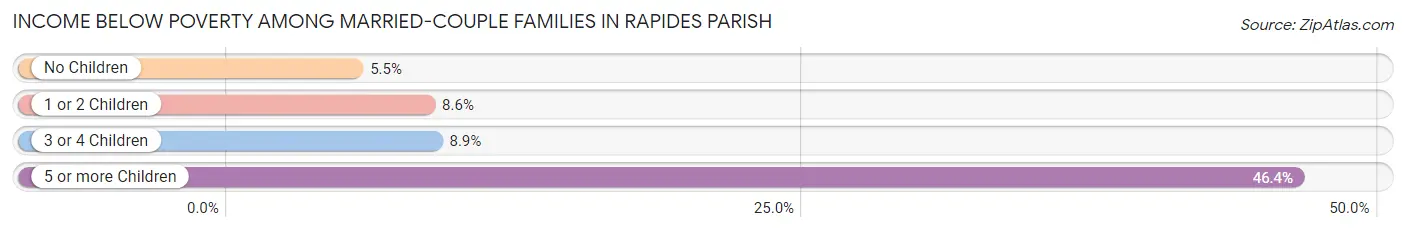
Income Below Poverty Among Married-Couple Families in Rapides Parish
The poverty statistics for married-couple families in Rapides Parish show that 7.1% or 1,468 of the total 20,635 families live below the poverty line. Families with 5 or more children have the highest poverty rate of 46.4%, comprising of 78 families. On the other hand, families with no children have the lowest poverty rate of 5.4%, which includes 647 families.
| Children | Above Poverty | Below Poverty |
| No Children | 11,231 (94.6%) | 647 (5.4%) |
| 1 or 2 Children | 6,167 (91.4%) | 579 (8.6%) |
| 3 or 4 Children | 1,679 (91.1%) | 164 (8.9%) |
| 5 or more Children | 90 (53.6%) | 78 (46.4%) |
| Total | 19,167 (92.9%) | 1,468 (7.1%) |
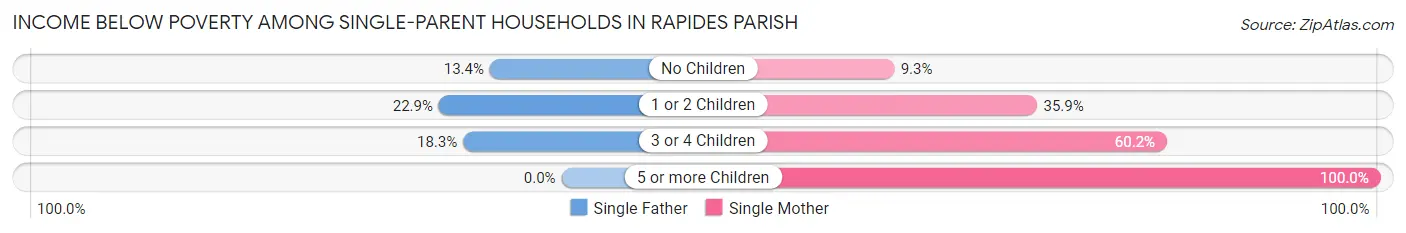
Income Below Poverty Among Single-Parent Households in Rapides Parish
According to the poverty data in Rapides Parish, 18.2% or 534 single-father households and 31.5% or 2,566 single-mother households are living below the poverty line. Among single-father households, those with 1 or 2 children have the highest poverty rate, with 330 households (22.9%) experiencing poverty. Likewise, among single-mother households, those with 5 or more children have the highest poverty rate, with 60 households (100.0%) falling below the poverty line.
| Children | Single Father | Single Mother |
| No Children | 182 (13.4%) | 216 (9.3%) |
| 1 or 2 Children | 330 (22.9%) | 1,747 (35.9%) |
| 3 or 4 Children | 22 (18.3%) | 543 (60.2%) |
| 5 or more Children | 0 (0.0%) | 60 (100.0%) |
| Total | 534 (18.2%) | 2,566 (31.5%) |
Income Below Poverty Among Married-Couple vs Single-Parent Households in Rapides Parish
The poverty data for Rapides Parish shows that 1,468 of the married-couple family households (7.1%) and 3,100 of the single-parent households (28.0%) are living below the poverty level. Within the married-couple family households, those with 5 or more children have the highest poverty rate, with 78 households (46.4%) falling below the poverty line. Among the single-parent households, those with 5 or more children have the highest poverty rate, with 60 household (92.3%) living below poverty.
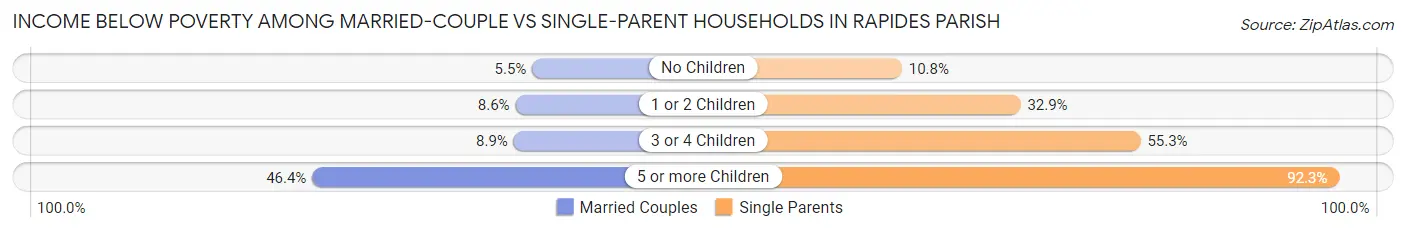
| Children | Married-Couple Families | Single-Parent Households |
| No Children | 647 (5.4%) | 398 (10.8%) |
| 1 or 2 Children | 579 (8.6%) | 2,077 (32.9%) |
| 3 or 4 Children | 164 (8.9%) | 565 (55.3%) |
| 5 or more Children | 78 (46.4%) | 60 (92.3%) |
| Total | 1,468 (7.1%) | 3,100 (28.0%) |
Employment Characteristics in Rapides Parish
Employment by Class of Employer in Rapides Parish
Among the 54,593 employed individuals in Rapides Parish, private company employees (33,446 | 61.3%), local government employees (4,819 | 8.8%), and state government employees (4,325 | 7.9%) make up the most common classes of employment.
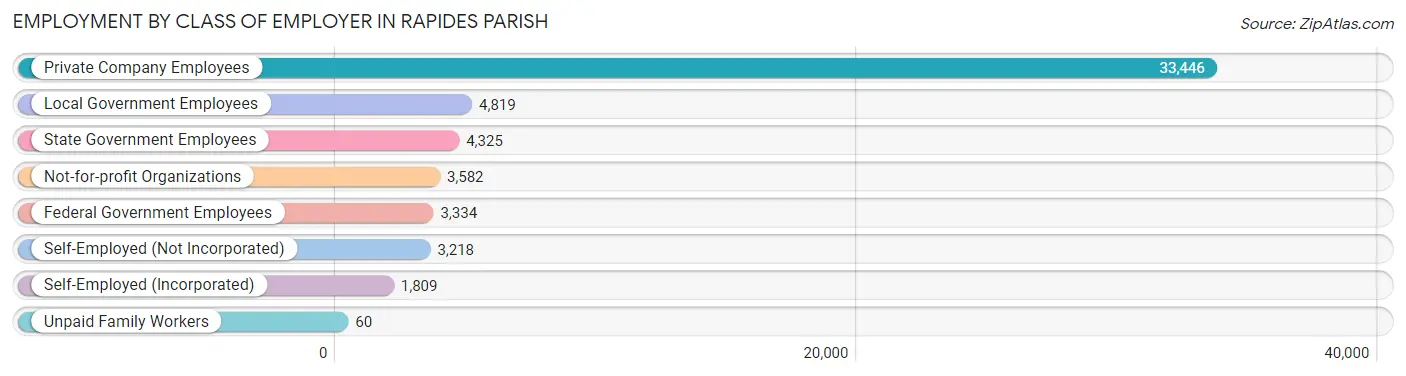
| Employer Class | # Employees | % Employees |
| Private Company Employees | 33,446 | 61.3% |
| Self-Employed (Incorporated) | 1,809 | 3.3% |
| Self-Employed (Not Incorporated) | 3,218 | 5.9% |
| Not-for-profit Organizations | 3,582 | 6.6% |
| Local Government Employees | 4,819 | 8.8% |
| State Government Employees | 4,325 | 7.9% |
| Federal Government Employees | 3,334 | 6.1% |
| Unpaid Family Workers | 60 | 0.1% |
| Total | 54,593 | 100.0% |
Employment Status by Age in Rapides Parish
According to the labor force statistics for Rapides Parish, out of the total population over 16 years of age (101,429), 58.6% or 59,437 individuals are in the labor force, with 5.7% or 3,388 of them unemployed. The age group with the highest labor force participation rate is 25 to 29 years, with 81.1% or 6,708 individuals in the labor force. Within the labor force, the 16 to 19 years age range has the highest percentage of unemployed individuals, with 21.0% or 348 of them being unemployed.
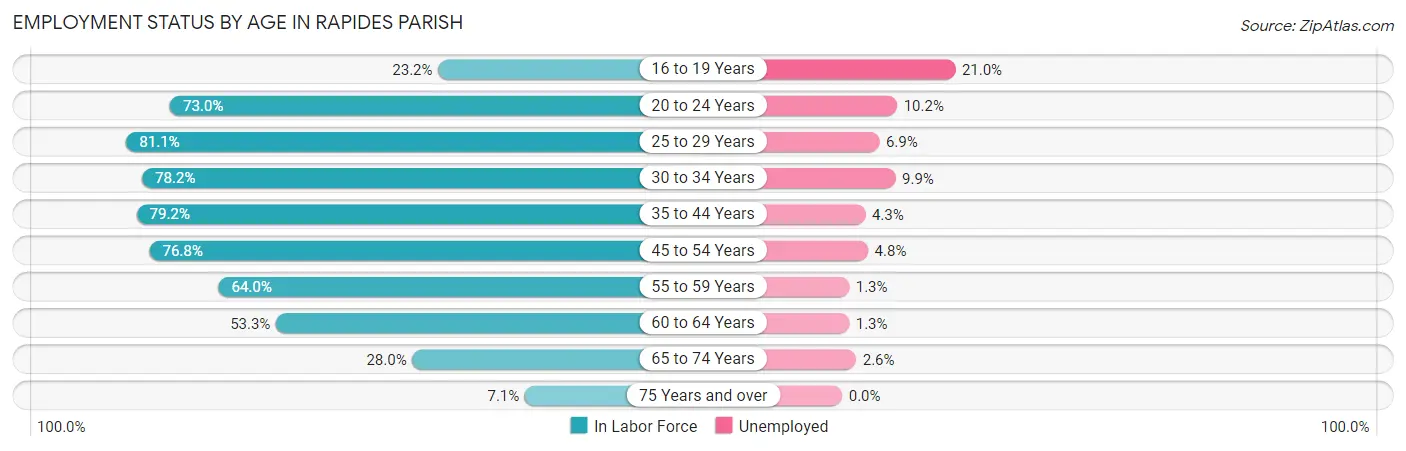
| Age Bracket | In Labor Force | Unemployed |
| 16 to 19 Years | 1,656 (23.2%) | 348 (21.0%) |
| 20 to 24 Years | 5,820 (73.0%) | 594 (10.2%) |
| 25 to 29 Years | 6,708 (81.1%) | 463 (6.9%) |
| 30 to 34 Years | 6,417 (78.2%) | 635 (9.9%) |
| 35 to 44 Years | 12,914 (79.2%) | 555 (4.3%) |
| 45 to 54 Years | 11,682 (76.8%) | 561 (4.8%) |
| 55 to 59 Years | 5,829 (64.0%) | 76 (1.3%) |
| 60 to 64 Years | 4,274 (53.3%) | 56 (1.3%) |
| 65 to 74 Years | 3,514 (28.0%) | 91 (2.6%) |
| 75 Years and over | 614 (7.1%) | 0 (0.0%) |
| Total | 59,437 (58.6%) | 3,388 (5.7%) |
Employment Status by Educational Attainment in Rapides Parish
According to labor force statistics for Rapides Parish, 73.5% of individuals (47,863) out of the total population between 25 and 64 years of age (65,120) are in the labor force, with 4.9% or 2,345 of them being unemployed. The group with the highest labor force participation rate are those with the educational attainment of bachelor's degree or higher, with 85.6% or 12,182 individuals in the labor force. Within the labor force, individuals with high school diploma education have the highest percentage of unemployment, with 7.5% or 1,326 of them being unemployed.
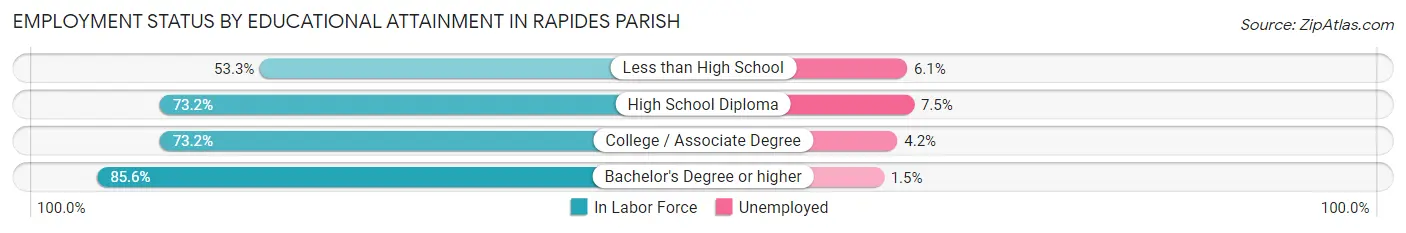
| Educational Attainment | In Labor Force | Unemployed |
| Less than High School | 4,243 (53.3%) | 486 (6.1%) |
| High School Diploma | 17,684 (73.2%) | 1,812 (7.5%) |
| College / Associate Degree | 13,740 (73.2%) | 788 (4.2%) |
| Bachelor's Degree or higher | 12,182 (85.6%) | 213 (1.5%) |
| Total | 47,863 (73.5%) | 3,191 (4.9%) |
Employment Occupations by Sex in Rapides Parish
Management, Business, Science and Arts Occupations
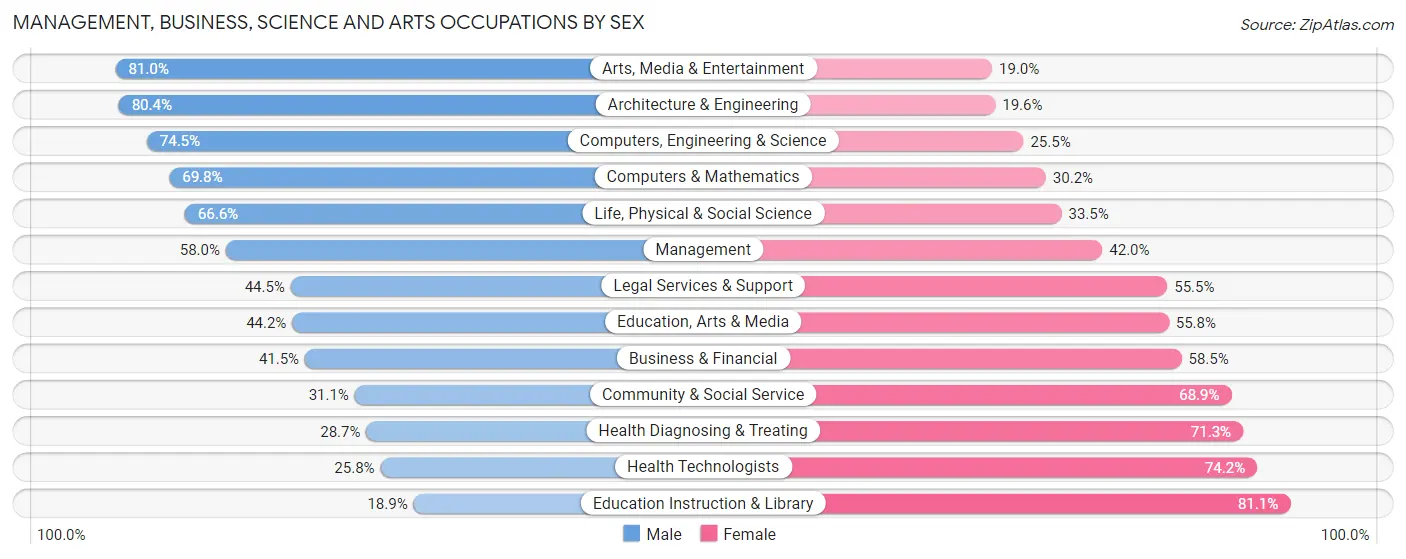
The most common Management, Business, Science and Arts occupations in Rapides Parish are Community & Social Service (6,420 | 11.6%), Health Diagnosing & Treating (4,819 | 8.7%), Management (4,760 | 8.6%), Education Instruction & Library (3,856 | 6.9%), and Health Technologists (2,839 | 5.1%).

Management, Business, Science and Arts Occupations by Sex
Within the Management, Business, Science and Arts occupations in Rapides Parish, the most male-oriented occupations are Arts, Media & Entertainment (81.0%), Architecture & Engineering (80.4%), and Computers, Engineering & Science (74.5%), while the most female-oriented occupations are Education Instruction & Library (81.1%), Health Technologists (74.2%), and Health Diagnosing & Treating (71.3%).
| Occupation | Male | Female |
| Management | 2,762 (58.0%) | 1,998 (42.0%) |
| Business & Financial | 739 (41.5%) | 1,041 (58.5%) |
| Computers, Engineering & Science | 978 (74.5%) | 335 (25.5%) |
| Computers & Mathematics | 259 (69.8%) | 112 (30.2%) |
| Architecture & Engineering | 536 (80.4%) | 131 (19.6%) |
| Life, Physical & Social Science | 183 (66.5%) | 92 (33.5%) |
| Community & Social Service | 1,999 (31.1%) | 4,421 (68.9%) |
| Education, Arts & Media | 653 (44.2%) | 825 (55.8%) |
| Legal Services & Support | 319 (44.5%) | 398 (55.5%) |
| Education Instruction & Library | 728 (18.9%) | 3,128 (81.1%) |
| Arts, Media & Entertainment | 299 (81.0%) | 70 (19.0%) |
| Health Diagnosing & Treating | 1,384 (28.7%) | 3,435 (71.3%) |
| Health Technologists | 732 (25.8%) | 2,107 (74.2%) |
| Total (Category) | 7,862 (41.2%) | 11,230 (58.8%) |
| Total (Overall) | 27,787 (50.0%) | 27,778 (50.0%) |
Services Occupations
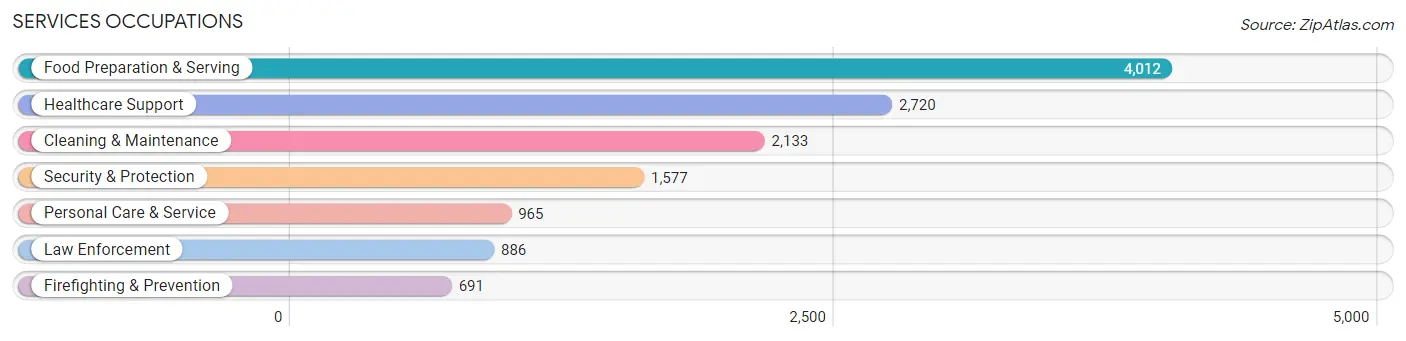
The most common Services occupations in Rapides Parish are Food Preparation & Serving (4,012 | 7.2%), Healthcare Support (2,720 | 4.9%), Cleaning & Maintenance (2,133 | 3.8%), Security & Protection (1,577 | 2.8%), and Personal Care & Service (965 | 1.7%).
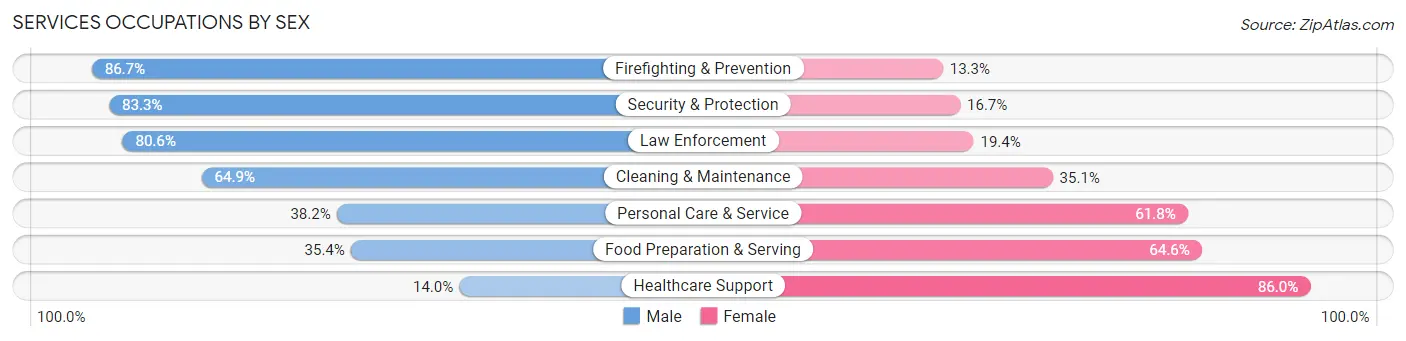
Services Occupations by Sex
Within the Services occupations in Rapides Parish, the most male-oriented occupations are Firefighting & Prevention (86.7%), Security & Protection (83.3%), and Law Enforcement (80.6%), while the most female-oriented occupations are Healthcare Support (86.0%), Food Preparation & Serving (64.6%), and Personal Care & Service (61.8%).
| Occupation | Male | Female |
| Healthcare Support | 380 (14.0%) | 2,340 (86.0%) |
| Security & Protection | 1,313 (83.3%) | 264 (16.7%) |
| Firefighting & Prevention | 599 (86.7%) | 92 (13.3%) |
| Law Enforcement | 714 (80.6%) | 172 (19.4%) |
| Food Preparation & Serving | 1,422 (35.4%) | 2,590 (64.6%) |
| Cleaning & Maintenance | 1,385 (64.9%) | 748 (35.1%) |
| Personal Care & Service | 369 (38.2%) | 596 (61.8%) |
| Total (Category) | 4,869 (42.7%) | 6,538 (57.3%) |
| Total (Overall) | 27,787 (50.0%) | 27,778 (50.0%) |
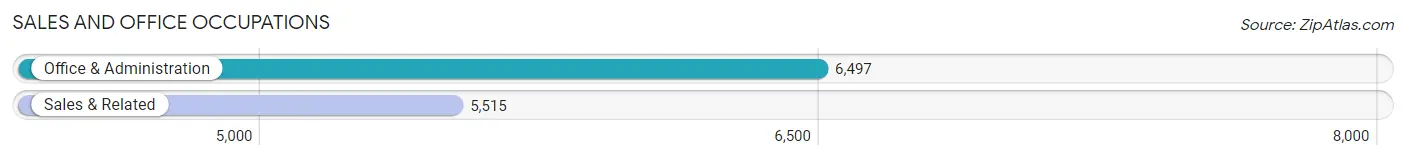
Sales and Office Occupations
The most common Sales and Office occupations in Rapides Parish are Office & Administration (6,497 | 11.7%), and Sales & Related (5,515 | 9.9%).
Sales and Office Occupations by Sex
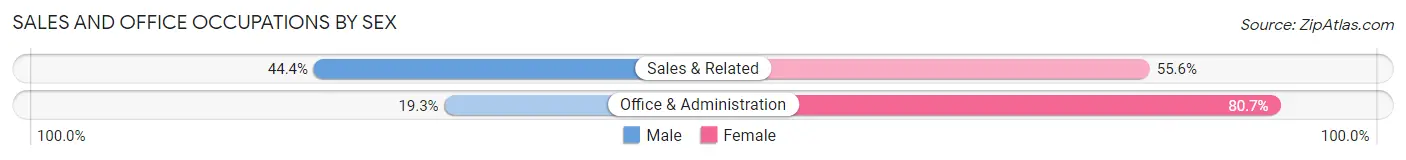
| Occupation | Male | Female |
| Sales & Related | 2,447 (44.4%) | 3,068 (55.6%) |
| Office & Administration | 1,251 (19.3%) | 5,246 (80.7%) |
| Total (Category) | 3,698 (30.8%) | 8,314 (69.2%) |
| Total (Overall) | 27,787 (50.0%) | 27,778 (50.0%) |
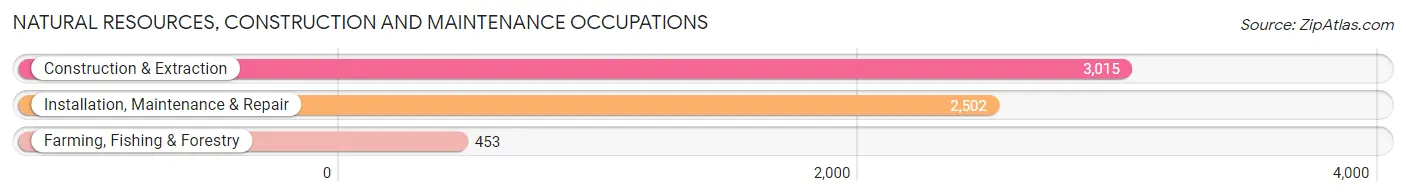
Natural Resources, Construction and Maintenance Occupations
The most common Natural Resources, Construction and Maintenance occupations in Rapides Parish are Construction & Extraction (3,015 | 5.4%), Installation, Maintenance & Repair (2,502 | 4.5%), and Farming, Fishing & Forestry (453 | 0.8%).
Natural Resources, Construction and Maintenance Occupations by Sex
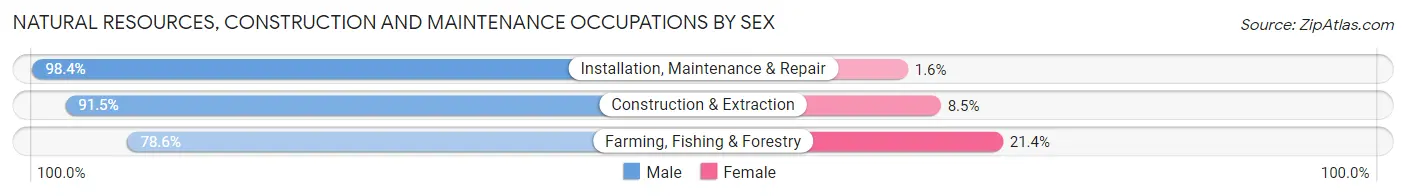
| Occupation | Male | Female |
| Farming, Fishing & Forestry | 356 (78.6%) | 97 (21.4%) |
| Construction & Extraction | 2,759 (91.5%) | 256 (8.5%) |
| Installation, Maintenance & Repair | 2,461 (98.4%) | 41 (1.6%) |
| Total (Category) | 5,576 (93.4%) | 394 (6.6%) |
| Total (Overall) | 27,787 (50.0%) | 27,778 (50.0%) |
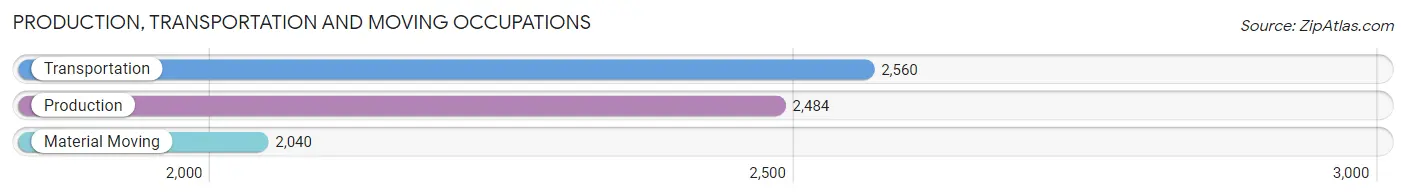
Production, Transportation and Moving Occupations
The most common Production, Transportation and Moving occupations in Rapides Parish are Transportation (2,560 | 4.6%), Production (2,484 | 4.5%), and Material Moving (2,040 | 3.7%).
Production, Transportation and Moving Occupations by Sex
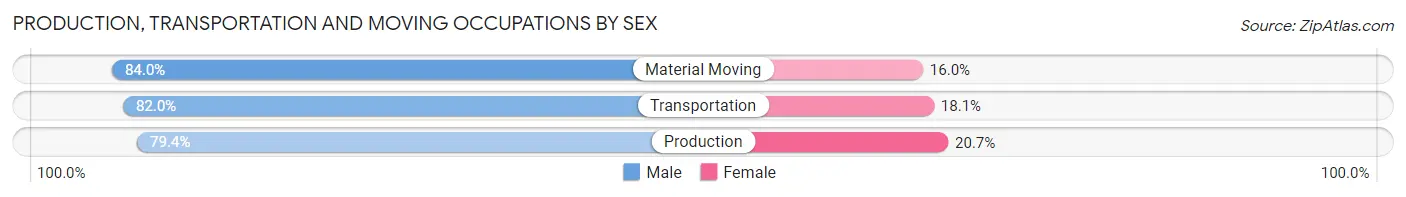
| Occupation | Male | Female |
| Production | 1,971 (79.3%) | 513 (20.6%) |
| Transportation | 2,098 (82.0%) | 462 (18.0%) |
| Material Moving | 1,713 (84.0%) | 327 (16.0%) |
| Total (Category) | 5,782 (81.6%) | 1,302 (18.4%) |
| Total (Overall) | 27,787 (50.0%) | 27,778 (50.0%) |
Employment Industries by Sex in Rapides Parish
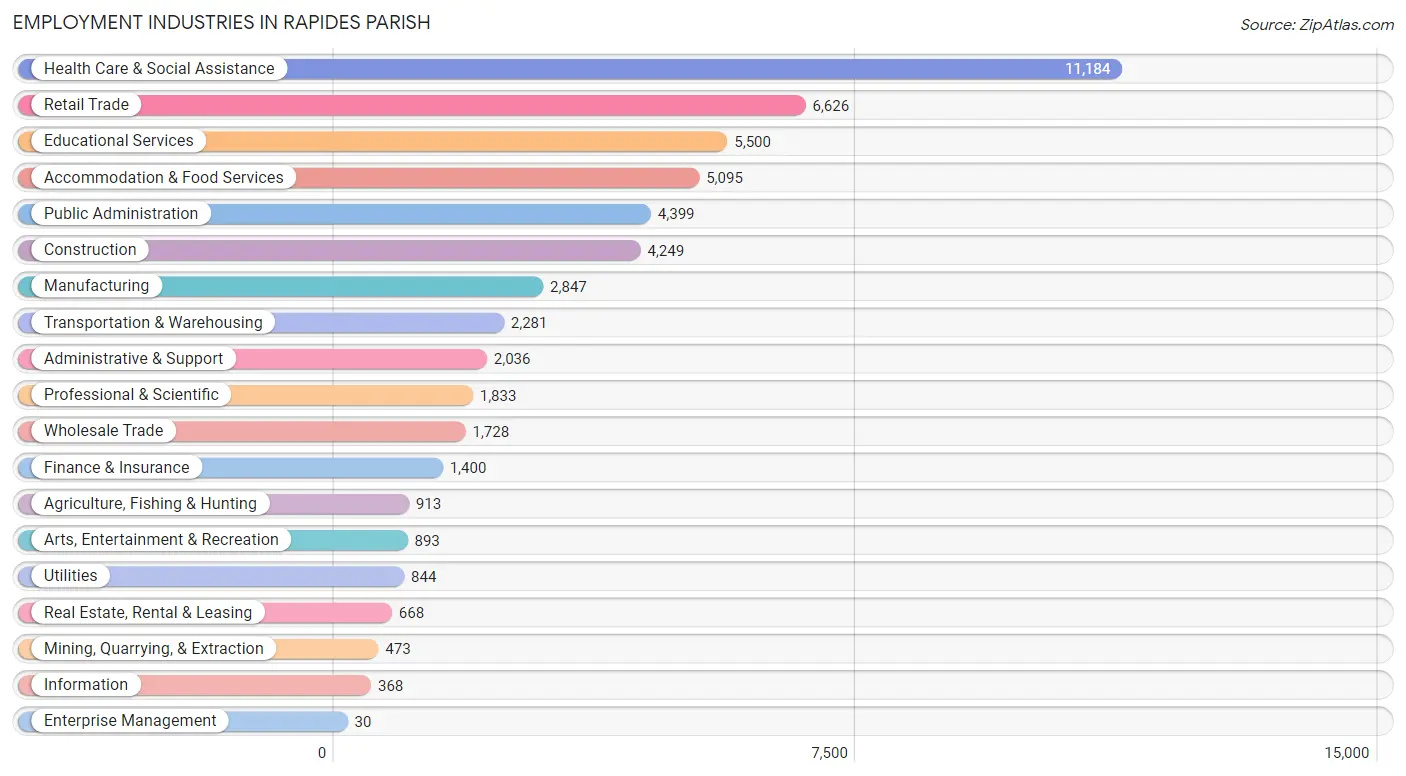
Employment Industries in Rapides Parish
The major employment industries in Rapides Parish include Health Care & Social Assistance (11,184 | 20.1%), Retail Trade (6,626 | 11.9%), Educational Services (5,500 | 9.9%), Accommodation & Food Services (5,095 | 9.2%), and Public Administration (4,399 | 7.9%).
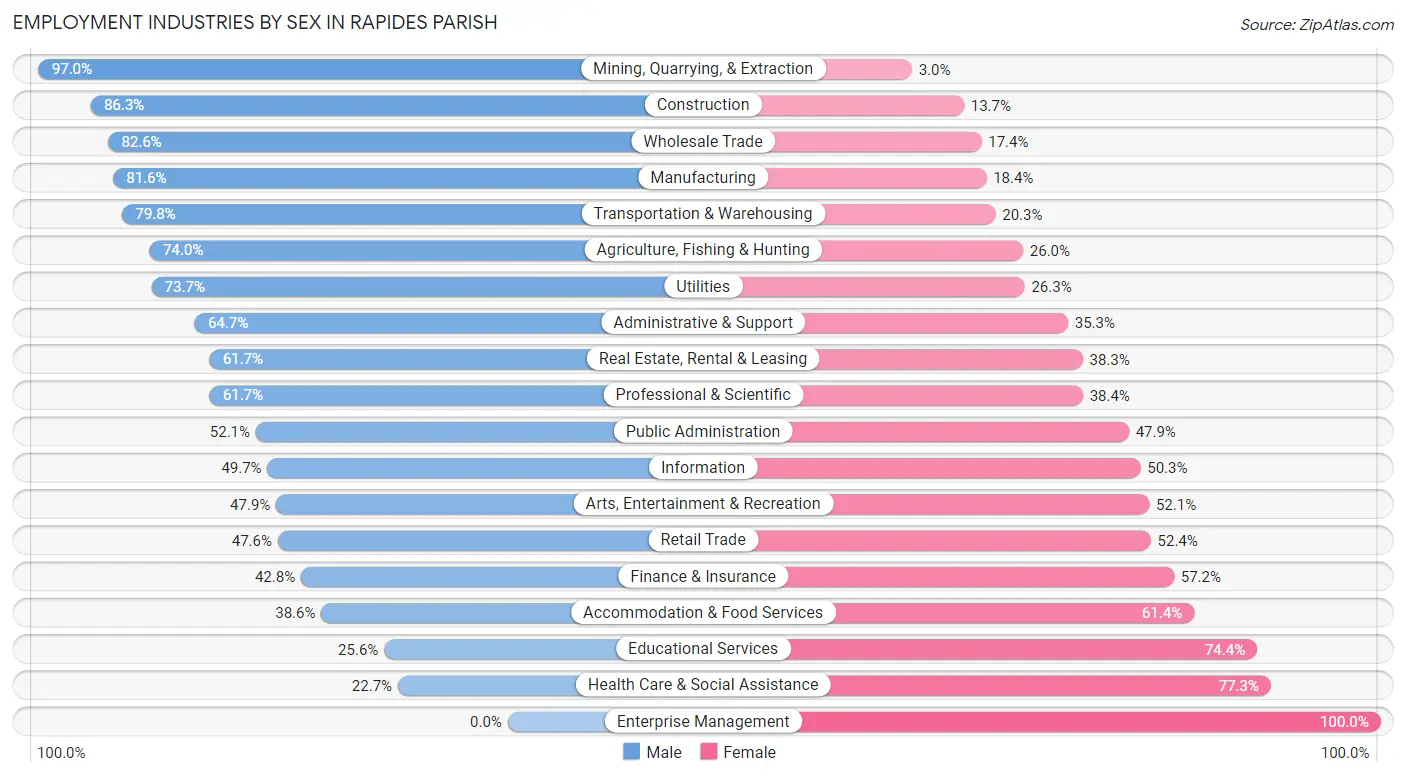
Employment Industries by Sex in Rapides Parish
The Rapides Parish industries that see more men than women are Mining, Quarrying, & Extraction (97.0%), Construction (86.3%), and Wholesale Trade (82.6%), whereas the industries that tend to have a higher number of women are Enterprise Management (100.0%), Health Care & Social Assistance (77.3%), and Educational Services (74.4%).
| Industry | Male | Female |
| Agriculture, Fishing & Hunting | 676 (74.0%) | 237 (26.0%) |
| Mining, Quarrying, & Extraction | 459 (97.0%) | 14 (3.0%) |
| Construction | 3,665 (86.3%) | 584 (13.7%) |
| Manufacturing | 2,324 (81.6%) | 523 (18.4%) |
| Wholesale Trade | 1,428 (82.6%) | 300 (17.4%) |
| Retail Trade | 3,153 (47.6%) | 3,473 (52.4%) |
| Transportation & Warehousing | 1,819 (79.7%) | 462 (20.3%) |
| Utilities | 622 (73.7%) | 222 (26.3%) |
| Information | 183 (49.7%) | 185 (50.3%) |
| Finance & Insurance | 599 (42.8%) | 801 (57.2%) |
| Real Estate, Rental & Leasing | 412 (61.7%) | 256 (38.3%) |
| Professional & Scientific | 1,130 (61.7%) | 703 (38.4%) |
| Enterprise Management | 0 (0.0%) | 30 (100.0%) |
| Administrative & Support | 1,318 (64.7%) | 718 (35.3%) |
| Educational Services | 1,407 (25.6%) | 4,093 (74.4%) |
| Health Care & Social Assistance | 2,542 (22.7%) | 8,642 (77.3%) |
| Arts, Entertainment & Recreation | 428 (47.9%) | 465 (52.1%) |
| Accommodation & Food Services | 1,966 (38.6%) | 3,129 (61.4%) |
| Public Administration | 2,293 (52.1%) | 2,106 (47.9%) |
| Total | 27,787 (50.0%) | 27,778 (50.0%) |
Education in Rapides Parish
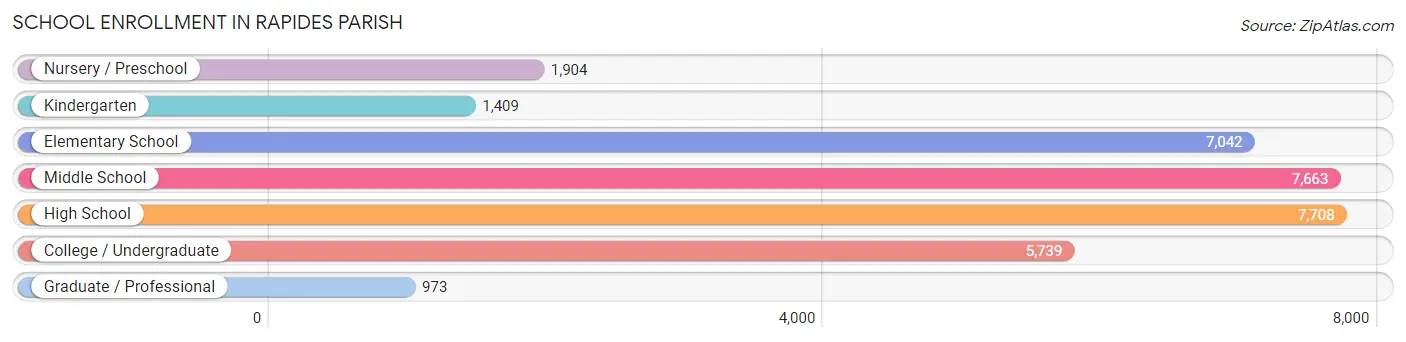
School Enrollment in Rapides Parish
The most common levels of schooling among the 32,438 students in Rapides Parish are high school (7,708 | 23.8%), middle school (7,663 | 23.6%), and elementary school (7,042 | 21.7%).
| School Level | # Students | % Students |
| Nursery / Preschool | 1,904 | 5.9% |
| Kindergarten | 1,409 | 4.3% |
| Elementary School | 7,042 | 21.7% |
| Middle School | 7,663 | 23.6% |
| High School | 7,708 | 23.8% |
| College / Undergraduate | 5,739 | 17.7% |
| Graduate / Professional | 973 | 3.0% |
| Total | 32,438 | 100.0% |
School Enrollment by Age by Funding Source in Rapides Parish
Out of a total of 32,438 students who are enrolled in schools in Rapides Parish, 4,476 (13.8%) attend a private institution, while the remaining 27,962 (86.2%) are enrolled in public schools. The age group of 20 to 24 year olds has the highest likelihood of being enrolled in private schools, with 729 (27.8% in the age bracket) enrolled. Conversely, the age group of 5 to 9 year old has the lowest likelihood of being enrolled in a private school, with 7,392 (90.8% in the age bracket) attending a public institution.
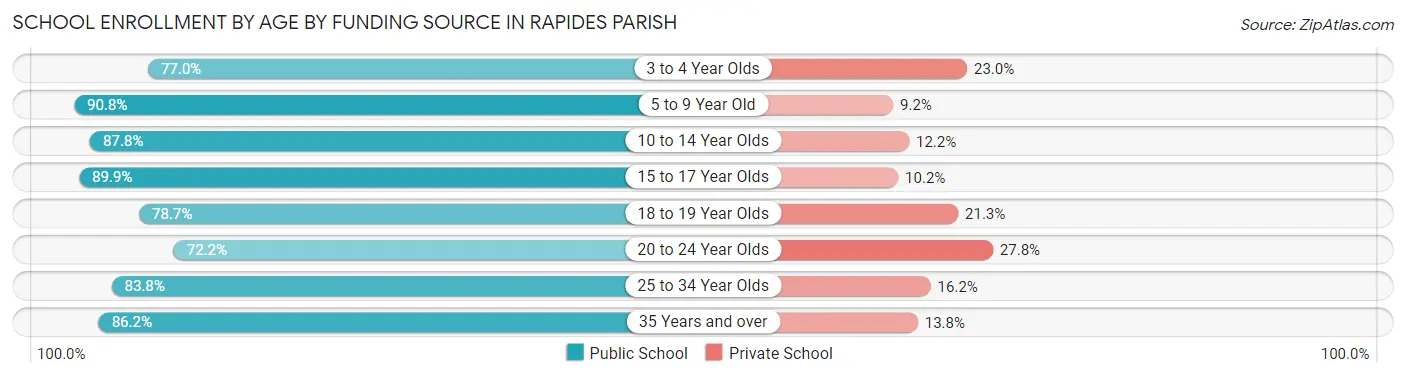
| Age Bracket | Public School | Private School |
| 3 to 4 Year Olds | 1,230 (77.0%) | 367 (23.0%) |
| 5 to 9 Year Old | 7,392 (90.8%) | 750 (9.2%) |
| 10 to 14 Year Olds | 8,086 (87.8%) | 1,121 (12.2%) |
| 15 to 17 Year Olds | 4,868 (89.8%) | 550 (10.2%) |
| 18 to 19 Year Olds | 1,642 (78.7%) | 445 (21.3%) |
| 20 to 24 Year Olds | 1,893 (72.2%) | 729 (27.8%) |
| 25 to 34 Year Olds | 1,485 (83.8%) | 287 (16.2%) |
| 35 Years and over | 1,373 (86.2%) | 220 (13.8%) |
| Total | 27,962 (86.2%) | 4,476 (13.8%) |
Educational Attainment by Field of Study in Rapides Parish
Education (3,917 | 19.4%), business (3,465 | 17.1%), science & technology (3,140 | 15.5%), arts & humanities (1,769 | 8.7%), and liberal arts & history (1,341 | 6.6%) are the most common fields of study among 20,223 individuals in Rapides Parish who have obtained a bachelor's degree or higher.
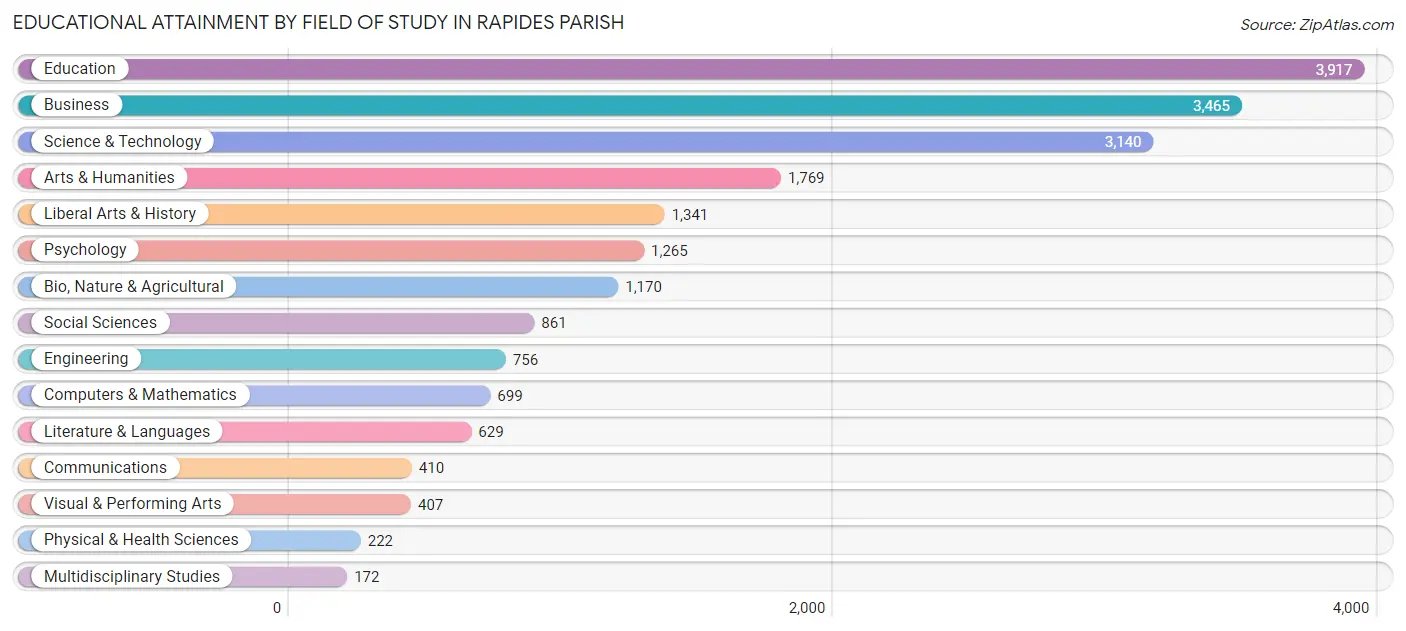
| Field of Study | # Graduates | % Graduates |
| Computers & Mathematics | 699 | 3.5% |
| Bio, Nature & Agricultural | 1,170 | 5.8% |
| Physical & Health Sciences | 222 | 1.1% |
| Psychology | 1,265 | 6.3% |
| Social Sciences | 861 | 4.3% |
| Engineering | 756 | 3.7% |
| Multidisciplinary Studies | 172 | 0.9% |
| Science & Technology | 3,140 | 15.5% |
| Business | 3,465 | 17.1% |
| Education | 3,917 | 19.4% |
| Literature & Languages | 629 | 3.1% |
| Liberal Arts & History | 1,341 | 6.6% |
| Visual & Performing Arts | 407 | 2.0% |
| Communications | 410 | 2.0% |
| Arts & Humanities | 1,769 | 8.7% |
| Total | 20,223 | 100.0% |
Transportation & Commute in Rapides Parish
Vehicle Availability by Sex in Rapides Parish
The most prevalent vehicle ownership categories in Rapides Parish are males with 2 vehicles (11,768, accounting for 43.4%) and females with 2 vehicles (10,427, making up 43.9%).
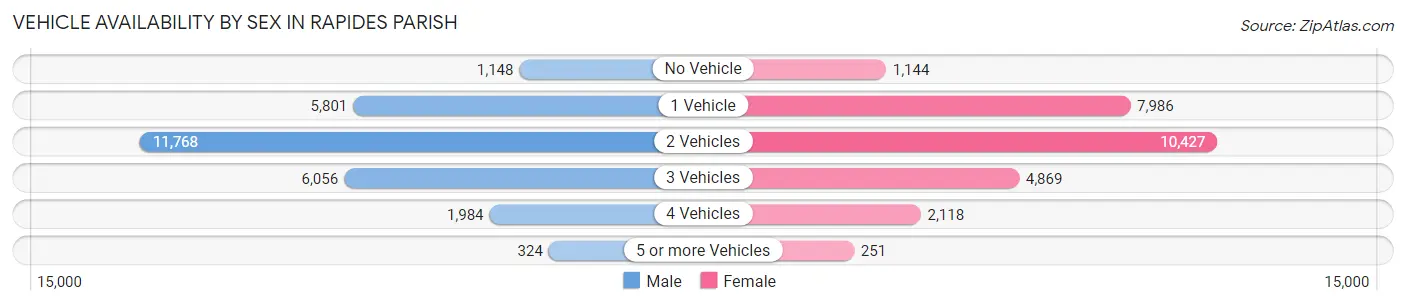
| Vehicles Available | Male | Female |
| No Vehicle | 1,148 (4.2%) | 1,144 (4.3%) |
| 1 Vehicle | 5,801 (21.4%) | 7,986 (29.8%) |
| 2 Vehicles | 11,768 (43.4%) | 10,427 (38.9%) |
| 3 Vehicles | 6,056 (22.4%) | 4,869 (18.2%) |
| 4 Vehicles | 1,984 (7.3%) | 2,118 (7.9%) |
| 5 or more Vehicles | 324 (1.2%) | 251 (0.9%) |
| Total | 27,081 (100.0%) | 26,795 (100.0%) |
Commute Time in Rapides Parish
The most frequently occuring commute durations in Rapides Parish are 10 to 14 minutes (10,670 commuters, 20.3%), 15 to 19 minutes (9,826 commuters, 18.7%), and 20 to 24 minutes (8,288 commuters, 15.8%).
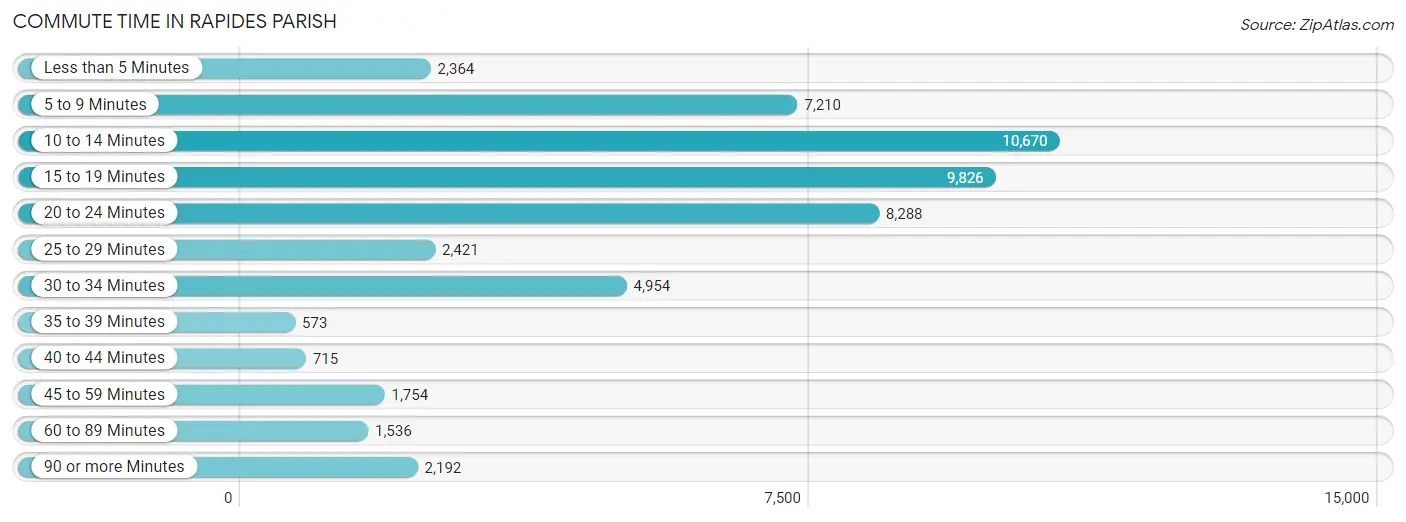
| Commute Time | # Commuters | % Commuters |
| Less than 5 Minutes | 2,364 | 4.5% |
| 5 to 9 Minutes | 7,210 | 13.7% |
| 10 to 14 Minutes | 10,670 | 20.3% |
| 15 to 19 Minutes | 9,826 | 18.7% |
| 20 to 24 Minutes | 8,288 | 15.8% |
| 25 to 29 Minutes | 2,421 | 4.6% |
| 30 to 34 Minutes | 4,954 | 9.4% |
| 35 to 39 Minutes | 573 | 1.1% |
| 40 to 44 Minutes | 715 | 1.4% |
| 45 to 59 Minutes | 1,754 | 3.3% |
| 60 to 89 Minutes | 1,536 | 2.9% |
| 90 or more Minutes | 2,192 | 4.2% |
Commute Time by Sex in Rapides Parish
The most common commute times in Rapides Parish are 20 to 24 minutes (4,601 commuters, 17.3%) for males and 10 to 14 minutes (6,229 commuters, 24.0%) for females.
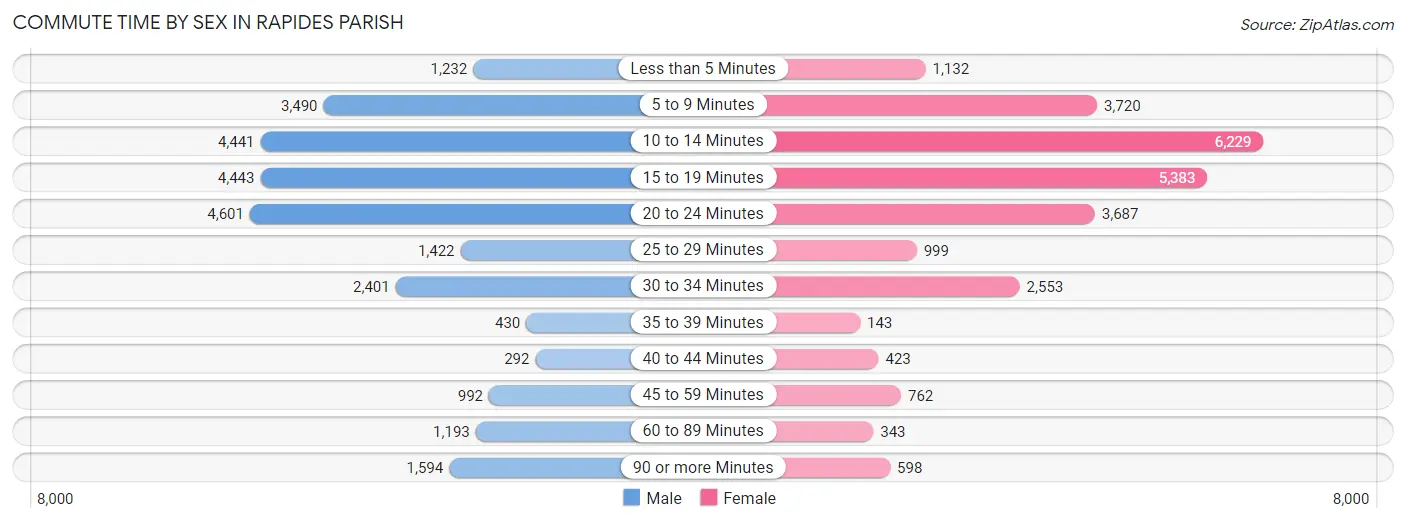
| Commute Time | Male | Female |
| Less than 5 Minutes | 1,232 (4.6%) | 1,132 (4.4%) |
| 5 to 9 Minutes | 3,490 (13.2%) | 3,720 (14.3%) |
| 10 to 14 Minutes | 4,441 (16.7%) | 6,229 (24.0%) |
| 15 to 19 Minutes | 4,443 (16.8%) | 5,383 (20.7%) |
| 20 to 24 Minutes | 4,601 (17.3%) | 3,687 (14.2%) |
| 25 to 29 Minutes | 1,422 (5.4%) | 999 (3.8%) |
| 30 to 34 Minutes | 2,401 (9.0%) | 2,553 (9.8%) |
| 35 to 39 Minutes | 430 (1.6%) | 143 (0.5%) |
| 40 to 44 Minutes | 292 (1.1%) | 423 (1.6%) |
| 45 to 59 Minutes | 992 (3.7%) | 762 (2.9%) |
| 60 to 89 Minutes | 1,193 (4.5%) | 343 (1.3%) |
| 90 or more Minutes | 1,594 (6.0%) | 598 (2.3%) |
Time of Departure to Work by Sex in Rapides Parish
The most frequent times of departure to work in Rapides Parish are 7:00 AM to 7:29 AM (4,188, 15.8%) for males and 7:30 AM to 7:59 AM (4,784, 18.4%) for females.
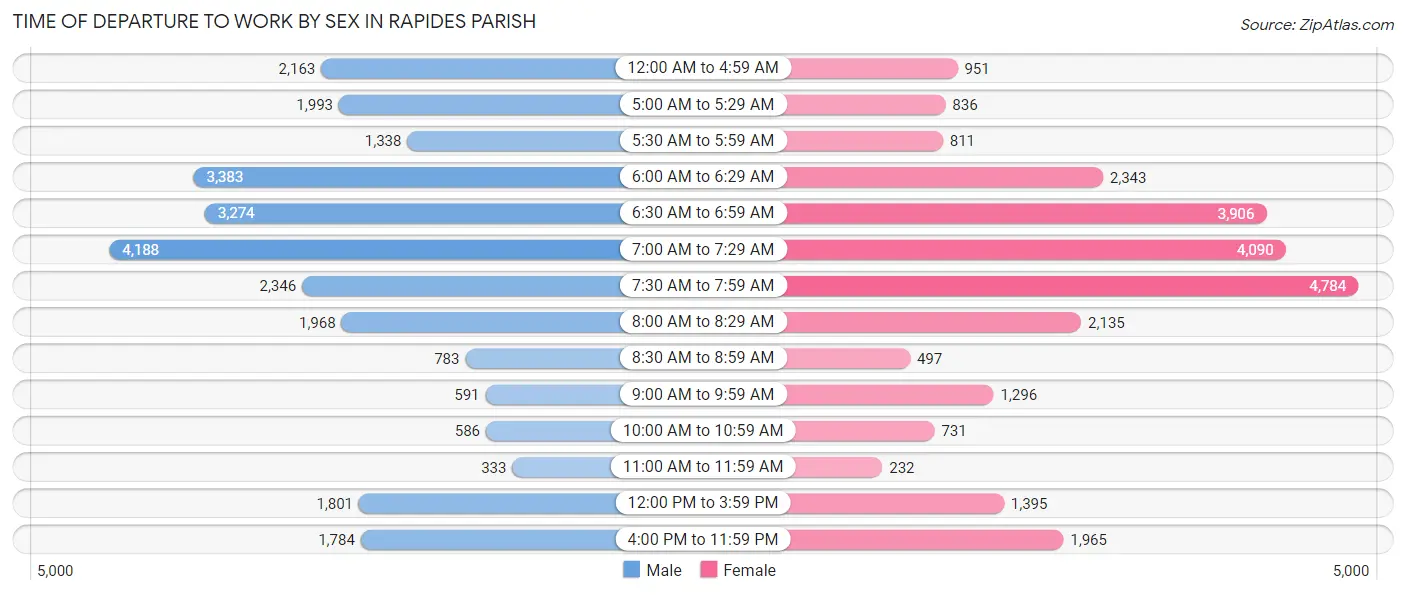
| Time of Departure | Male | Female |
| 12:00 AM to 4:59 AM | 2,163 (8.2%) | 951 (3.7%) |
| 5:00 AM to 5:29 AM | 1,993 (7.5%) | 836 (3.2%) |
| 5:30 AM to 5:59 AM | 1,338 (5.0%) | 811 (3.1%) |
| 6:00 AM to 6:29 AM | 3,383 (12.8%) | 2,343 (9.0%) |
| 6:30 AM to 6:59 AM | 3,274 (12.3%) | 3,906 (15.0%) |
| 7:00 AM to 7:29 AM | 4,188 (15.8%) | 4,090 (15.8%) |
| 7:30 AM to 7:59 AM | 2,346 (8.8%) | 4,784 (18.4%) |
| 8:00 AM to 8:29 AM | 1,968 (7.4%) | 2,135 (8.2%) |
| 8:30 AM to 8:59 AM | 783 (2.9%) | 497 (1.9%) |
| 9:00 AM to 9:59 AM | 591 (2.2%) | 1,296 (5.0%) |
| 10:00 AM to 10:59 AM | 586 (2.2%) | 731 (2.8%) |
| 11:00 AM to 11:59 AM | 333 (1.3%) | 232 (0.9%) |
| 12:00 PM to 3:59 PM | 1,801 (6.8%) | 1,395 (5.4%) |
| 4:00 PM to 11:59 PM | 1,784 (6.7%) | 1,965 (7.6%) |
| Total | 26,531 (100.0%) | 25,972 (100.0%) |
Housing Occupancy in Rapides Parish
Occupancy by Ownership in Rapides Parish
Of the total 48,544 dwellings in Rapides Parish, owner-occupied units account for 31,989 (65.9%), while renter-occupied units make up 16,555 (34.1%).
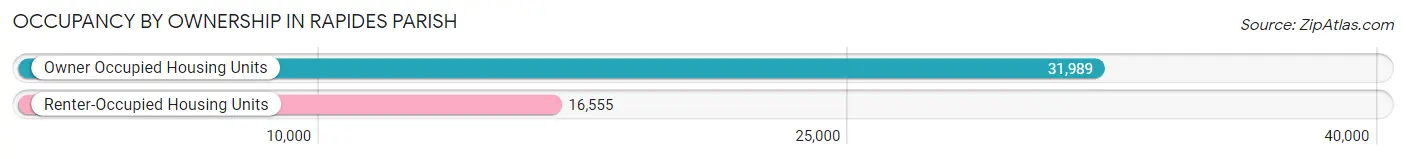
| Occupancy | # Housing Units | % Housing Units |
| Owner Occupied Housing Units | 31,989 | 65.9% |
| Renter-Occupied Housing Units | 16,555 | 34.1% |
| Total Occupied Housing Units | 48,544 | 100.0% |
Occupancy by Household Size in Rapides Parish
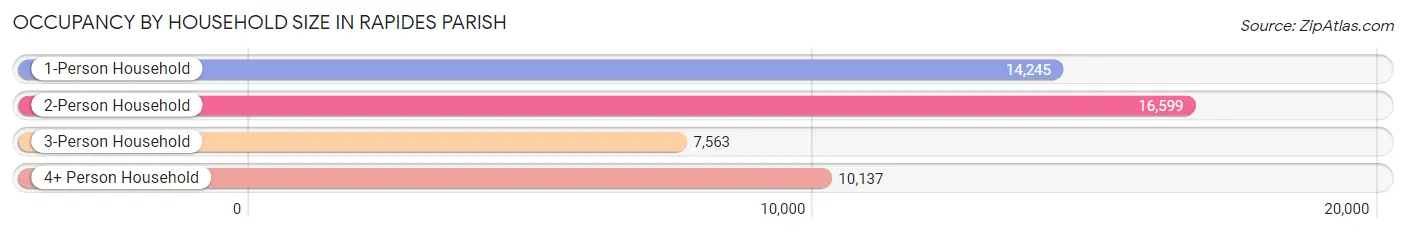
| Household Size | # Housing Units | % Housing Units |
| 1-Person Household | 14,245 | 29.3% |
| 2-Person Household | 16,599 | 34.2% |
| 3-Person Household | 7,563 | 15.6% |
| 4+ Person Household | 10,137 | 20.9% |
| Total Housing Units | 48,544 | 100.0% |
Occupancy by Ownership by Household Size in Rapides Parish
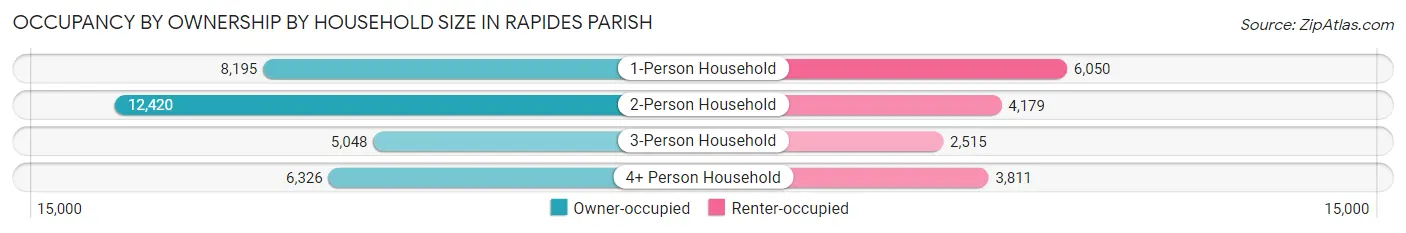
| Household Size | Owner-occupied | Renter-occupied |
| 1-Person Household | 8,195 (57.5%) | 6,050 (42.5%) |
| 2-Person Household | 12,420 (74.8%) | 4,179 (25.2%) |
| 3-Person Household | 5,048 (66.7%) | 2,515 (33.3%) |
| 4+ Person Household | 6,326 (62.4%) | 3,811 (37.6%) |
| Total Housing Units | 31,989 (65.9%) | 16,555 (34.1%) |
Occupancy by Educational Attainment in Rapides Parish
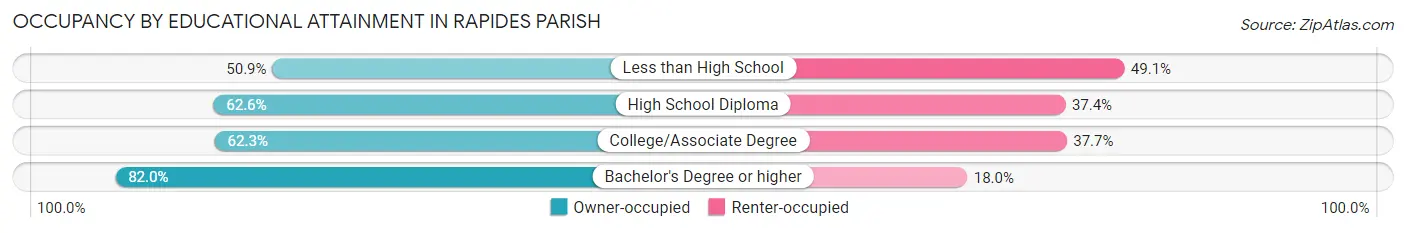
| Household Size | Owner-occupied | Renter-occupied |
| Less than High School | 2,565 (50.9%) | 2,476 (49.1%) |
| High School Diploma | 10,871 (62.6%) | 6,503 (37.4%) |
| College/Associate Degree | 9,106 (62.3%) | 5,507 (37.7%) |
| Bachelor's Degree or higher | 9,447 (82.0%) | 2,069 (18.0%) |
Occupancy by Age of Householder in Rapides Parish
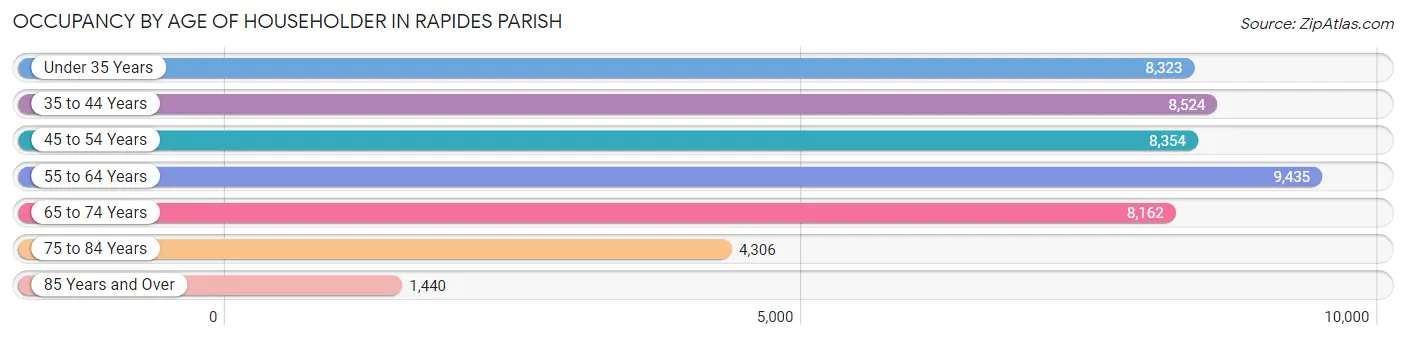
| Age Bracket | # Households | % Households |
| Under 35 Years | 8,323 | 17.2% |
| 35 to 44 Years | 8,524 | 17.6% |
| 45 to 54 Years | 8,354 | 17.2% |
| 55 to 64 Years | 9,435 | 19.4% |
| 65 to 74 Years | 8,162 | 16.8% |
| 75 to 84 Years | 4,306 | 8.9% |
| 85 Years and Over | 1,440 | 3.0% |
| Total | 48,544 | 100.0% |
Housing Finances in Rapides Parish
Median Income by Occupancy in Rapides Parish
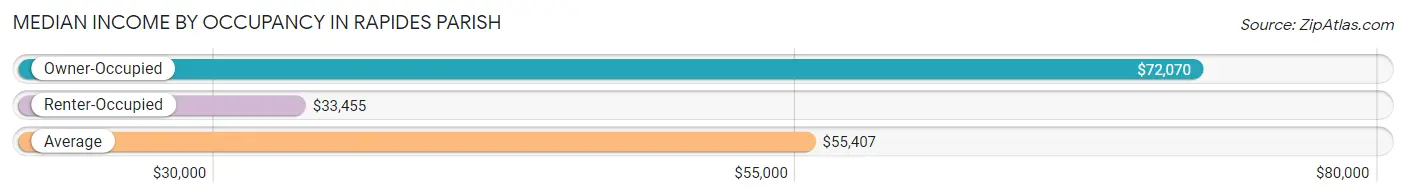
| Occupancy Type | # Households | Median Income |
| Owner-Occupied | 31,989 (65.9%) | $72,070 |
| Renter-Occupied | 16,555 (34.1%) | $33,455 |
| Average | 48,544 (100.0%) | $55,407 |
Occupancy by Householder Income Bracket in Rapides Parish
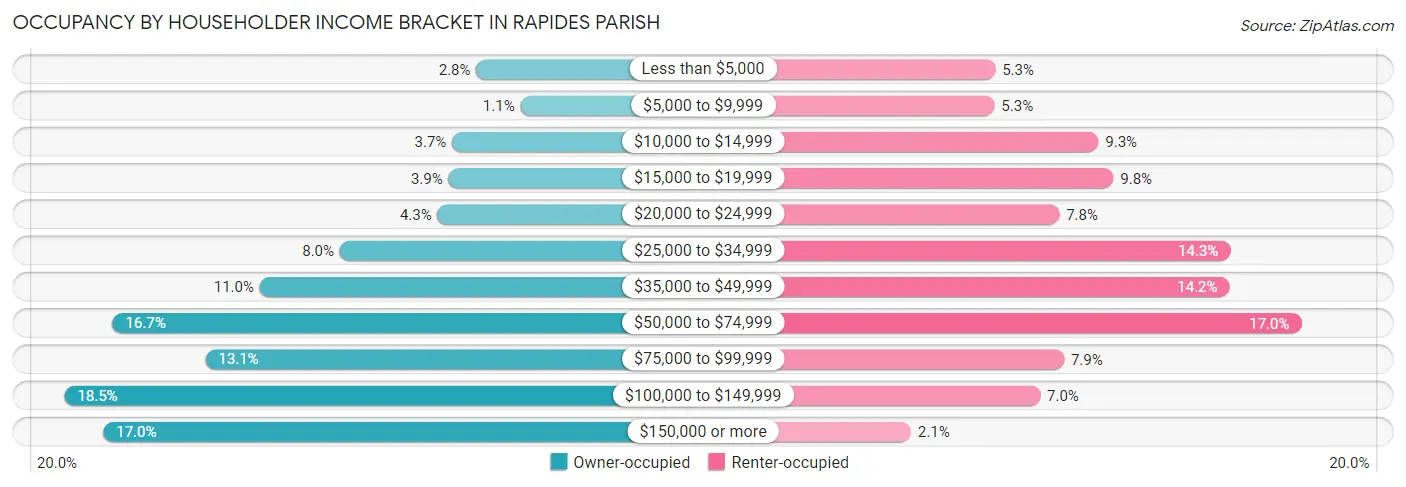
| Income Bracket | Owner-occupied | Renter-occupied |
| Less than $5,000 | 892 (2.8%) | 880 (5.3%) |
| $5,000 to $9,999 | 354 (1.1%) | 876 (5.3%) |
| $10,000 to $14,999 | 1,187 (3.7%) | 1,532 (9.2%) |
| $15,000 to $19,999 | 1,232 (3.8%) | 1,626 (9.8%) |
| $20,000 to $24,999 | 1,367 (4.3%) | 1,284 (7.8%) |
| $25,000 to $34,999 | 2,556 (8.0%) | 2,362 (14.3%) |
| $35,000 to $49,999 | 3,532 (11.0%) | 2,357 (14.2%) |
| $50,000 to $74,999 | 5,326 (16.7%) | 2,811 (17.0%) |
| $75,000 to $99,999 | 4,194 (13.1%) | 1,315 (7.9%) |
| $100,000 to $149,999 | 5,912 (18.5%) | 1,163 (7.0%) |
| $150,000 or more | 5,437 (17.0%) | 349 (2.1%) |
| Total | 31,989 (100.0%) | 16,555 (100.0%) |
Monthly Housing Cost Tiers in Rapides Parish
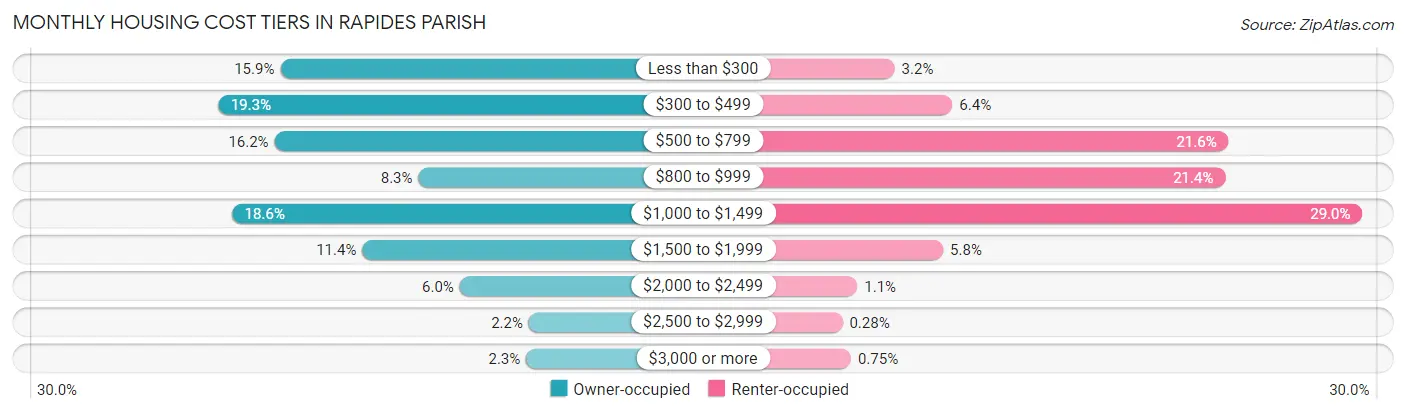
| Monthly Cost | Owner-occupied | Renter-occupied |
| Less than $300 | 5,080 (15.9%) | 523 (3.2%) |
| $300 to $499 | 6,182 (19.3%) | 1,052 (6.4%) |
| $500 to $799 | 5,181 (16.2%) | 3,576 (21.6%) |
| $800 to $999 | 2,638 (8.3%) | 3,546 (21.4%) |
| $1,000 to $1,499 | 5,941 (18.6%) | 4,799 (29.0%) |
| $1,500 to $1,999 | 3,632 (11.4%) | 966 (5.8%) |
| $2,000 to $2,499 | 1,911 (6.0%) | 182 (1.1%) |
| $2,500 to $2,999 | 689 (2.1%) | 47 (0.3%) |
| $3,000 or more | 735 (2.3%) | 124 (0.7%) |
| Total | 31,989 (100.0%) | 16,555 (100.0%) |
Physical Housing Characteristics in Rapides Parish
Housing Structures in Rapides Parish
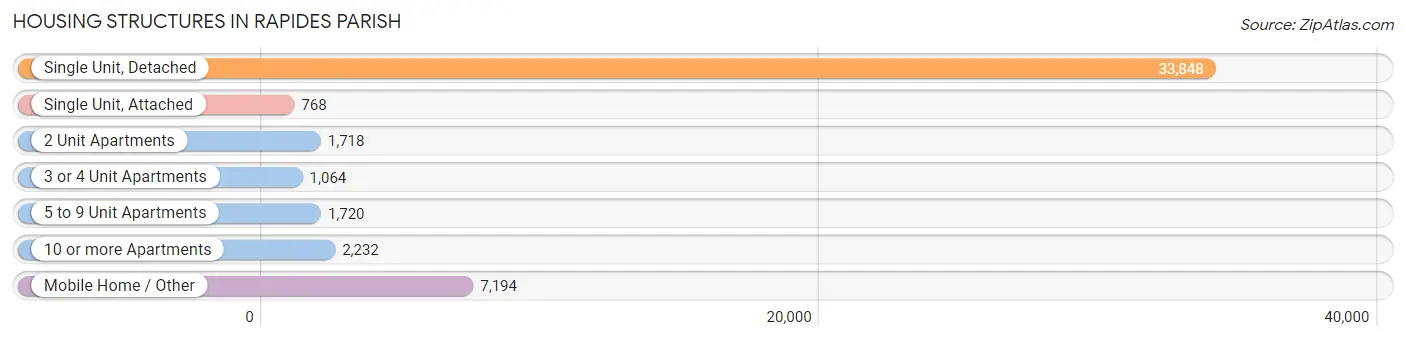
| Structure Type | # Housing Units | % Housing Units |
| Single Unit, Detached | 33,848 | 69.7% |
| Single Unit, Attached | 768 | 1.6% |
| 2 Unit Apartments | 1,718 | 3.5% |
| 3 or 4 Unit Apartments | 1,064 | 2.2% |
| 5 to 9 Unit Apartments | 1,720 | 3.5% |
| 10 or more Apartments | 2,232 | 4.6% |
| Mobile Home / Other | 7,194 | 14.8% |
| Total | 48,544 | 100.0% |
Housing Structures by Occupancy in Rapides Parish
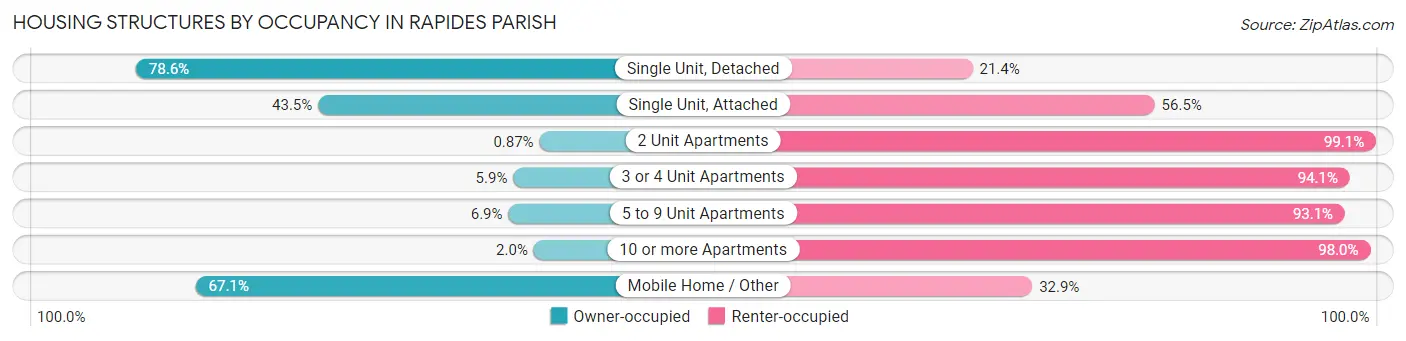
| Structure Type | Owner-occupied | Renter-occupied |
| Single Unit, Detached | 26,590 (78.6%) | 7,258 (21.4%) |
| Single Unit, Attached | 334 (43.5%) | 434 (56.5%) |
| 2 Unit Apartments | 15 (0.9%) | 1,703 (99.1%) |
| 3 or 4 Unit Apartments | 63 (5.9%) | 1,001 (94.1%) |
| 5 to 9 Unit Apartments | 118 (6.9%) | 1,602 (93.1%) |
| 10 or more Apartments | 44 (2.0%) | 2,188 (98.0%) |
| Mobile Home / Other | 4,825 (67.1%) | 2,369 (32.9%) |
| Total | 31,989 (65.9%) | 16,555 (34.1%) |
Housing Structures by Number of Rooms in Rapides Parish
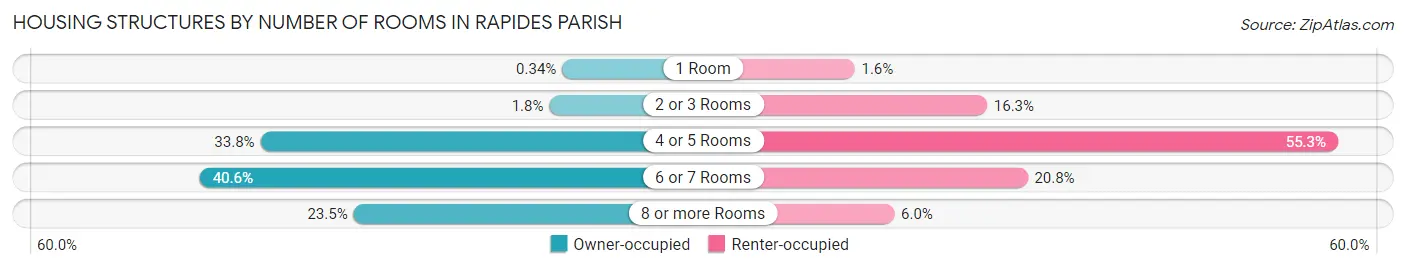
| Number of Rooms | Owner-occupied | Renter-occupied |
| 1 Room | 109 (0.3%) | 269 (1.6%) |
| 2 or 3 Rooms | 565 (1.8%) | 2,700 (16.3%) |
| 4 or 5 Rooms | 10,822 (33.8%) | 9,146 (55.2%) |
| 6 or 7 Rooms | 12,975 (40.6%) | 3,445 (20.8%) |
| 8 or more Rooms | 7,518 (23.5%) | 995 (6.0%) |
| Total | 31,989 (100.0%) | 16,555 (100.0%) |
Housing Structure by Heating Type in Rapides Parish
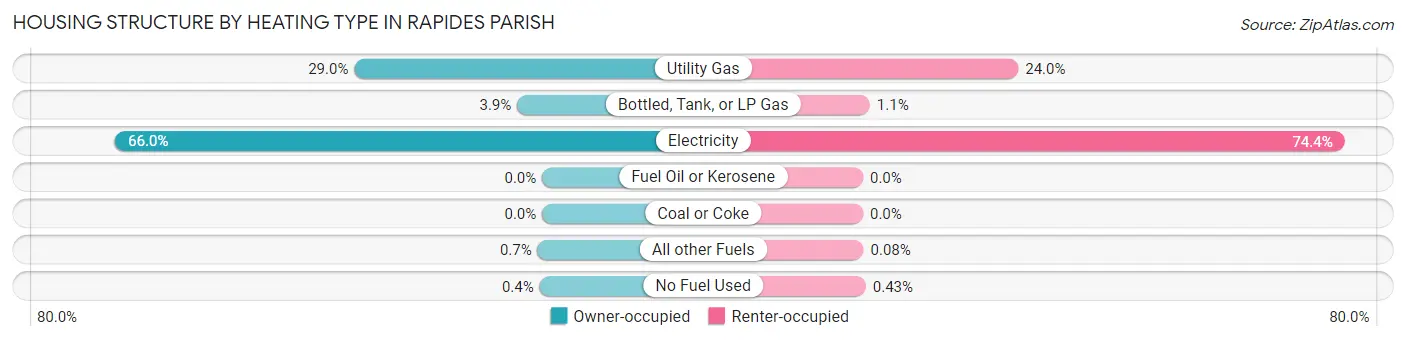
| Heating Type | Owner-occupied | Renter-occupied |
| Utility Gas | 9,290 (29.0%) | 3,973 (24.0%) |
| Bottled, Tank, or LP Gas | 1,234 (3.9%) | 175 (1.1%) |
| Electricity | 21,113 (66.0%) | 12,321 (74.4%) |
| Fuel Oil or Kerosene | 0 (0.0%) | 0 (0.0%) |
| Coal or Coke | 0 (0.0%) | 0 (0.0%) |
| All other Fuels | 224 (0.7%) | 14 (0.1%) |
| No Fuel Used | 128 (0.4%) | 72 (0.4%) |
| Total | 31,989 (100.0%) | 16,555 (100.0%) |
Household Vehicle Usage in Rapides Parish
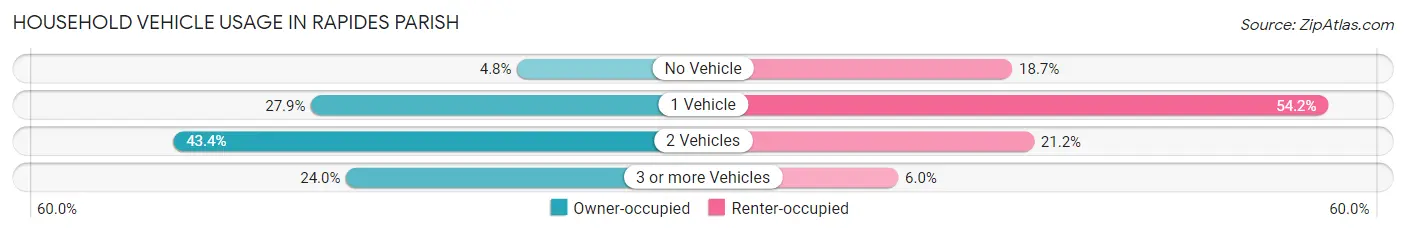
| Vehicles per Household | Owner-occupied | Renter-occupied |
| No Vehicle | 1,537 (4.8%) | 3,100 (18.7%) |
| 1 Vehicle | 8,920 (27.9%) | 8,964 (54.1%) |
| 2 Vehicles | 13,866 (43.3%) | 3,505 (21.2%) |
| 3 or more Vehicles | 7,666 (24.0%) | 986 (6.0%) |
| Total | 31,989 (100.0%) | 16,555 (100.0%) |
Real Estate & Mortgages in Rapides Parish
Real Estate and Mortgage Overview in Rapides Parish
| Characteristic | Without Mortgage | With Mortgage |
| Housing Units | 15,723 | 16,266 |
| Median Property Value | $145,300 | $193,800 |
| Median Household Income | $52,460 | $3,745 |
| Monthly Housing Costs | $379 | $735 |
| Real Estate Taxes | $548 | $4,401 |
Property Value by Mortgage Status in Rapides Parish
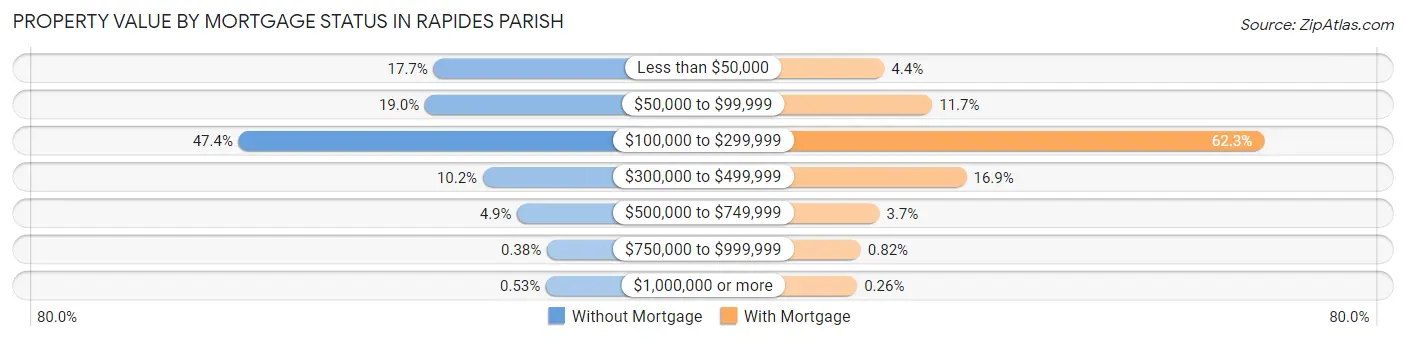
| Property Value | Without Mortgage | With Mortgage |
| Less than $50,000 | 2,778 (17.7%) | 715 (4.4%) |
| $50,000 to $99,999 | 2,986 (19.0%) | 1,903 (11.7%) |
| $100,000 to $299,999 | 7,448 (47.4%) | 10,127 (62.3%) |
| $300,000 to $499,999 | 1,597 (10.2%) | 2,750 (16.9%) |
| $500,000 to $749,999 | 772 (4.9%) | 596 (3.7%) |
| $750,000 to $999,999 | 59 (0.4%) | 133 (0.8%) |
| $1,000,000 or more | 83 (0.5%) | 42 (0.3%) |
| Total | 15,723 (100.0%) | 16,266 (100.0%) |
Household Income by Mortgage Status in Rapides Parish
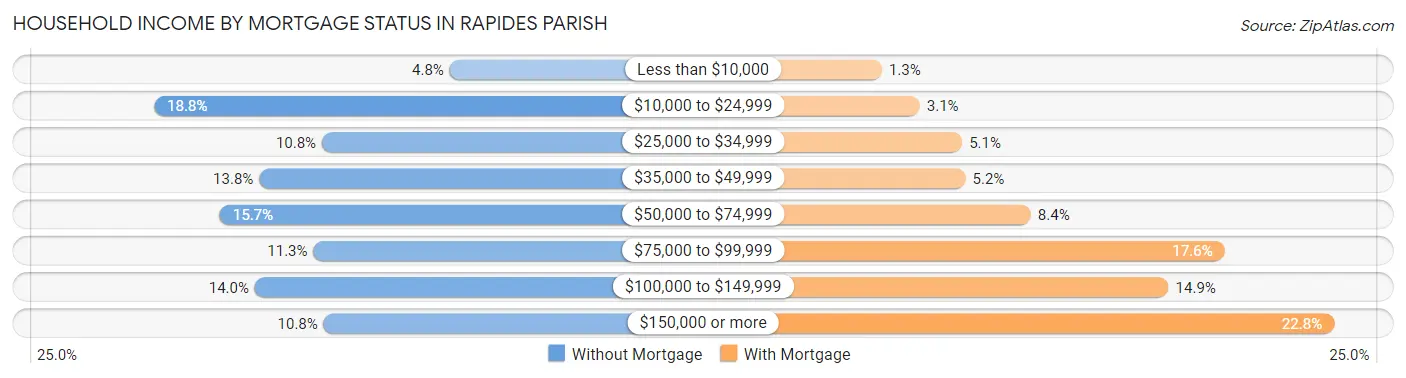
| Household Income | Without Mortgage | With Mortgage |
| Less than $10,000 | 749 (4.8%) | 205 (1.3%) |
| $10,000 to $24,999 | 2,960 (18.8%) | 497 (3.1%) |
| $25,000 to $34,999 | 1,704 (10.8%) | 826 (5.1%) |
| $35,000 to $49,999 | 2,174 (13.8%) | 852 (5.2%) |
| $50,000 to $74,999 | 2,468 (15.7%) | 1,358 (8.4%) |
| $75,000 to $99,999 | 1,769 (11.3%) | 2,858 (17.6%) |
| $100,000 to $149,999 | 2,207 (14.0%) | 2,425 (14.9%) |
| $150,000 or more | 1,692 (10.8%) | 3,705 (22.8%) |
| Total | 15,723 (100.0%) | 16,266 (100.0%) |
Property Value to Household Income Ratio in Rapides Parish
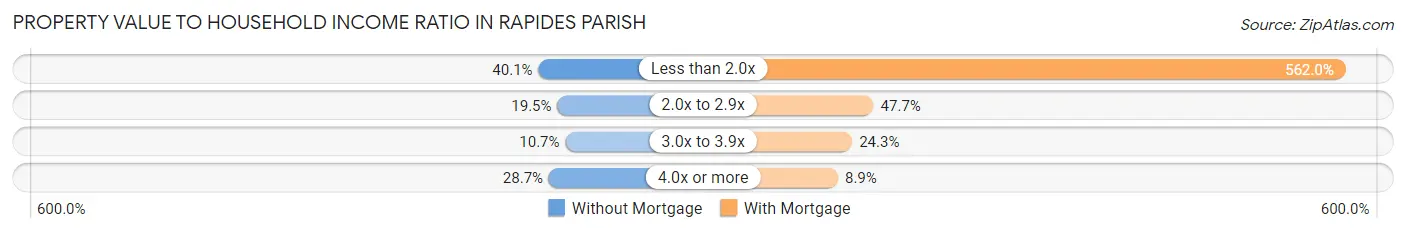
| Value-to-Income Ratio | Without Mortgage | With Mortgage |
| Less than 2.0x | 6,308 (40.1%) | 91,418 (562.0%) |
| 2.0x to 2.9x | 3,058 (19.5%) | 7,753 (47.7%) |
| 3.0x to 3.9x | 1,688 (10.7%) | 3,956 (24.3%) |
| 4.0x or more | 4,507 (28.7%) | 1,440 (8.8%) |
| Total | 15,723 (100.0%) | 16,266 (100.0%) |
Real Estate Taxes by Mortgage Status in Rapides Parish
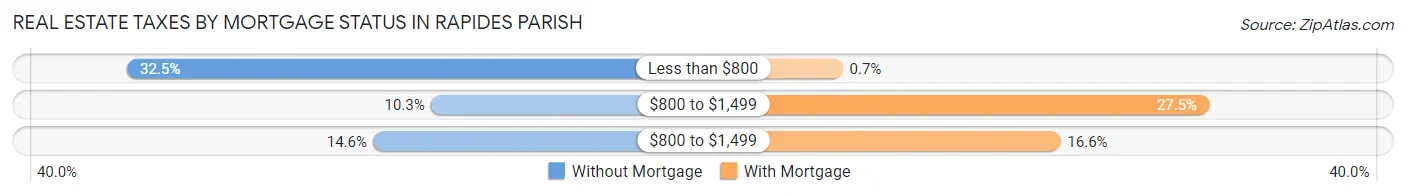
| Property Taxes | Without Mortgage | With Mortgage |
| Less than $800 | 5,112 (32.5%) | 114 (0.7%) |
| $800 to $1,499 | 1,626 (10.3%) | 4,467 (27.5%) |
| $800 to $1,499 | 2,289 (14.6%) | 2,702 (16.6%) |
| Total | 15,723 (100.0%) | 16,266 (100.0%) |
Health & Disability in Rapides Parish
Health Insurance Coverage by Age in Rapides Parish
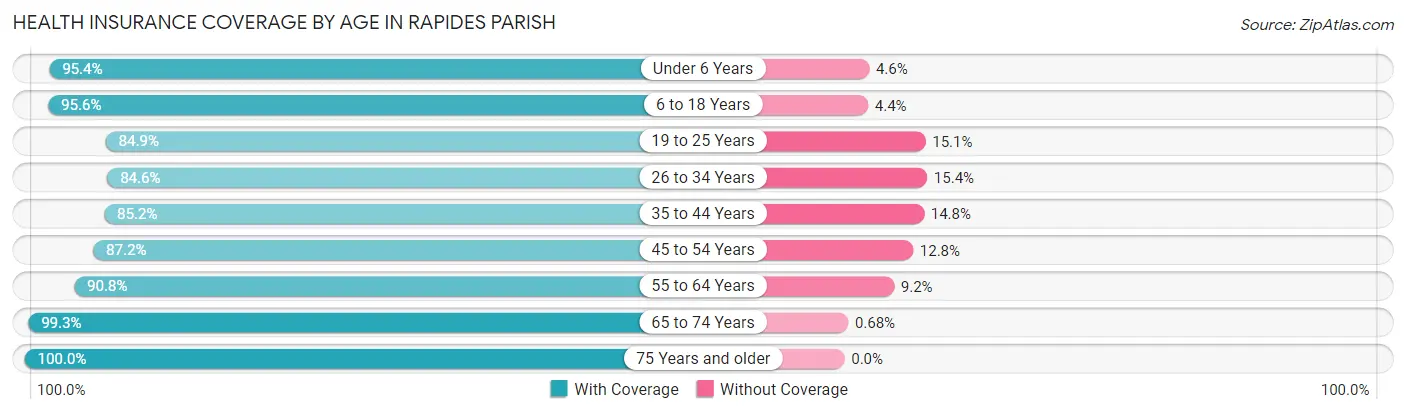
| Age Bracket | With Coverage | Without Coverage |
| Under 6 Years | 9,743 (95.4%) | 470 (4.6%) |
| 6 to 18 Years | 22,411 (95.6%) | 1,029 (4.4%) |
| 19 to 25 Years | 8,926 (84.9%) | 1,589 (15.1%) |
| 26 to 34 Years | 12,341 (84.6%) | 2,249 (15.4%) |
| 35 to 44 Years | 13,540 (85.2%) | 2,356 (14.8%) |
| 45 to 54 Years | 13,082 (87.2%) | 1,919 (12.8%) |
| 55 to 64 Years | 15,299 (90.8%) | 1,558 (9.2%) |
| 65 to 74 Years | 12,181 (99.3%) | 84 (0.7%) |
| 75 Years and older | 8,155 (100.0%) | 0 (0.0%) |
| Total | 115,678 (91.1%) | 11,254 (8.9%) |
Health Insurance Coverage by Citizenship Status in Rapides Parish
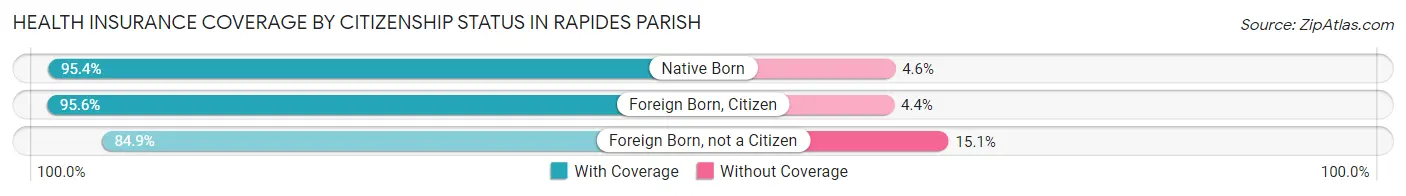
| Citizenship Status | With Coverage | Without Coverage |
| Native Born | 9,743 (95.4%) | 470 (4.6%) |
| Foreign Born, Citizen | 22,411 (95.6%) | 1,029 (4.4%) |
| Foreign Born, not a Citizen | 8,926 (84.9%) | 1,589 (15.1%) |
Health Insurance Coverage by Household Income in Rapides Parish
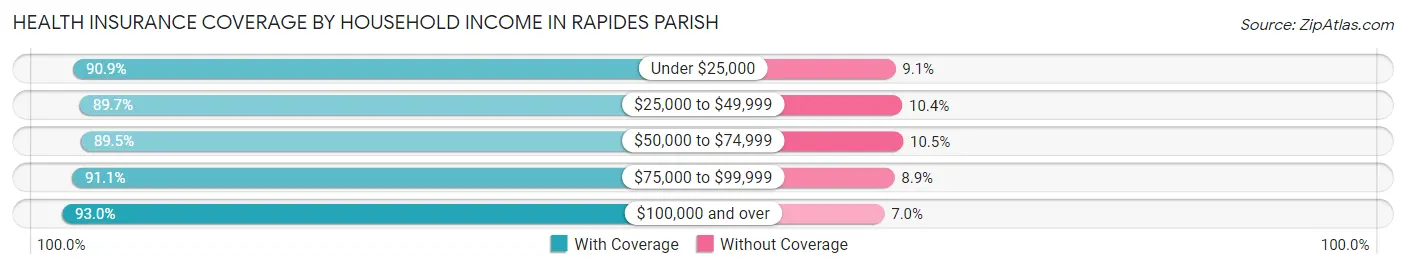
| Household Income | With Coverage | Without Coverage |
| Under $25,000 | 19,092 (90.9%) | 1,911 (9.1%) |
| $25,000 to $49,999 | 22,533 (89.6%) | 2,602 (10.3%) |
| $50,000 to $74,999 | 20,050 (89.5%) | 2,361 (10.5%) |
| $75,000 to $99,999 | 14,959 (91.1%) | 1,463 (8.9%) |
| $100,000 and over | 37,483 (93.0%) | 2,829 (7.0%) |
Public vs Private Health Insurance Coverage by Age in Rapides Parish
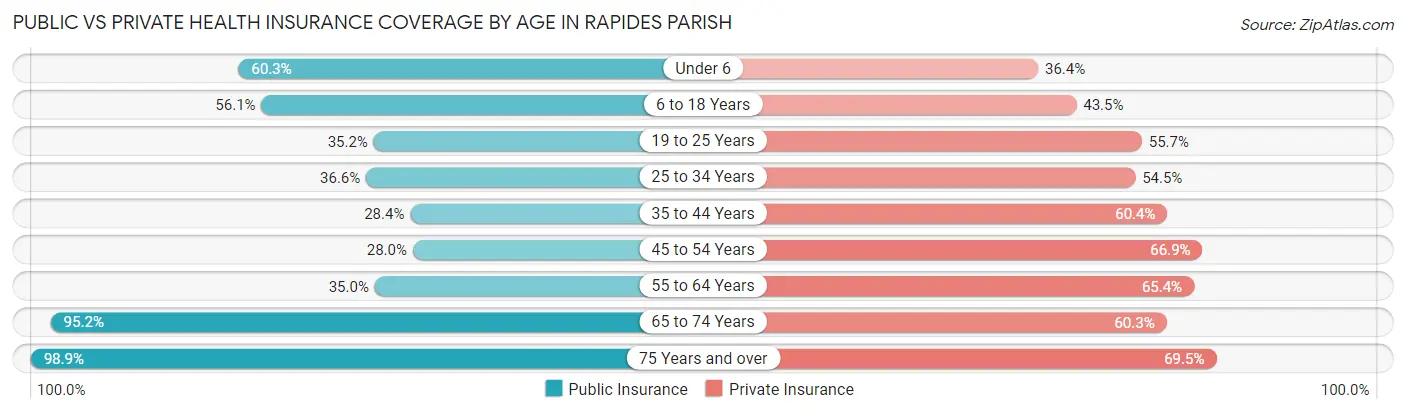
| Age Bracket | Public Insurance | Private Insurance |
| Under 6 | 6,160 (60.3%) | 3,720 (36.4%) |
| 6 to 18 Years | 13,137 (56.0%) | 10,201 (43.5%) |
| 19 to 25 Years | 3,701 (35.2%) | 5,856 (55.7%) |
| 25 to 34 Years | 5,342 (36.6%) | 7,946 (54.5%) |
| 35 to 44 Years | 4,517 (28.4%) | 9,603 (60.4%) |
| 45 to 54 Years | 4,193 (28.0%) | 10,040 (66.9%) |
| 55 to 64 Years | 5,902 (35.0%) | 11,018 (65.4%) |
| 65 to 74 Years | 11,671 (95.2%) | 7,391 (60.3%) |
| 75 Years and over | 8,062 (98.9%) | 5,668 (69.5%) |
| Total | 62,685 (49.4%) | 71,443 (56.3%) |
Disability Status by Sex by Age in Rapides Parish
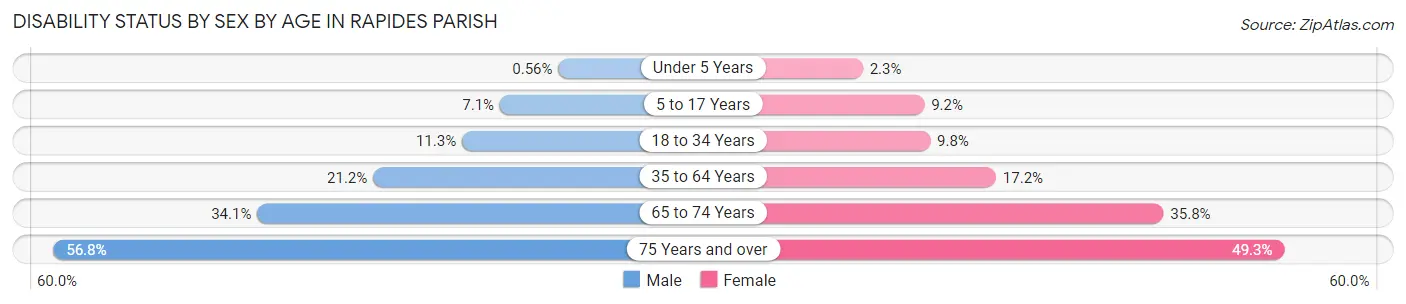
| Age Bracket | Male | Female |
| Under 5 Years | 24 (0.6%) | 98 (2.3%) |
| 5 to 17 Years | 852 (7.1%) | 1,052 (9.2%) |
| 18 to 34 Years | 1,477 (11.3%) | 1,345 (9.8%) |
| 35 to 64 Years | 4,843 (21.2%) | 4,273 (17.2%) |
| 65 to 74 Years | 1,858 (34.1%) | 2,441 (35.8%) |
| 75 Years and over | 1,884 (56.8%) | 2,384 (49.3%) |
Disability Class by Sex by Age in Rapides Parish
Disability Class: Hearing Difficulty
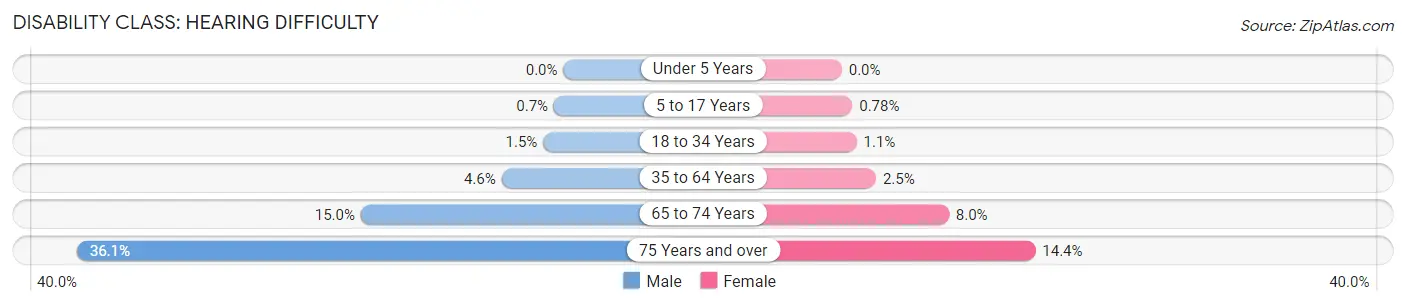
| Age Bracket | Male | Female |
| Under 5 Years | 0 (0.0%) | 0 (0.0%) |
| 5 to 17 Years | 85 (0.7%) | 89 (0.8%) |
| 18 to 34 Years | 196 (1.5%) | 150 (1.1%) |
| 35 to 64 Years | 1,050 (4.6%) | 632 (2.5%) |
| 65 to 74 Years | 820 (15.0%) | 542 (8.0%) |
| 75 Years and over | 1,198 (36.1%) | 695 (14.4%) |
Disability Class: Vision Difficulty
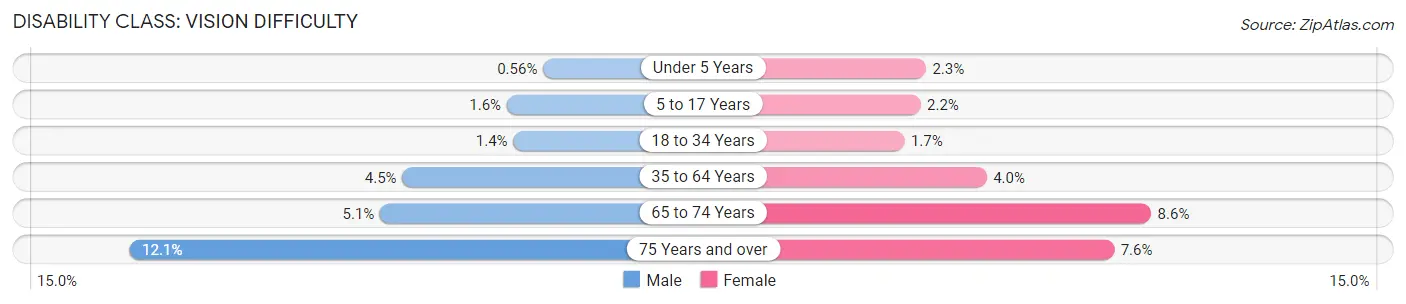
| Age Bracket | Male | Female |
| Under 5 Years | 24 (0.6%) | 98 (2.3%) |
| 5 to 17 Years | 189 (1.6%) | 250 (2.2%) |
| 18 to 34 Years | 182 (1.4%) | 237 (1.7%) |
| 35 to 64 Years | 1,024 (4.5%) | 1,001 (4.0%) |
| 65 to 74 Years | 278 (5.1%) | 586 (8.6%) |
| 75 Years and over | 401 (12.1%) | 366 (7.6%) |
Disability Class: Cognitive Difficulty
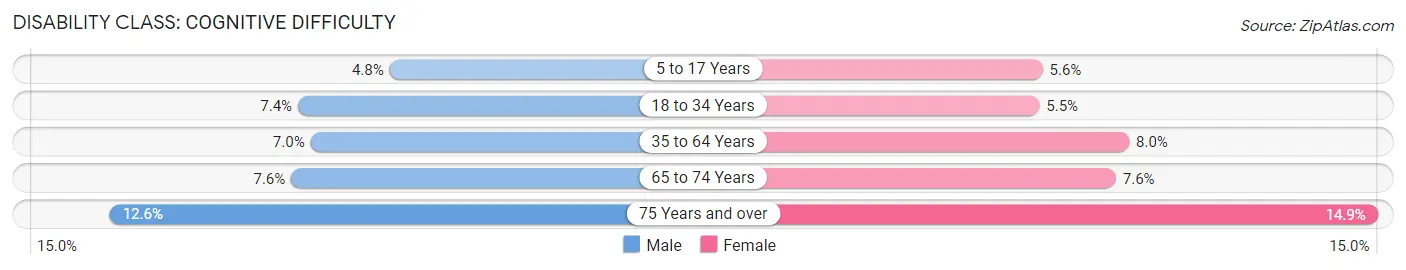
| Age Bracket | Male | Female |
| 5 to 17 Years | 584 (4.8%) | 641 (5.6%) |
| 18 to 34 Years | 967 (7.4%) | 753 (5.5%) |
| 35 to 64 Years | 1,609 (7.0%) | 1,992 (8.0%) |
| 65 to 74 Years | 413 (7.6%) | 520 (7.6%) |
| 75 Years and over | 419 (12.6%) | 722 (14.9%) |
Disability Class: Ambulatory Difficulty
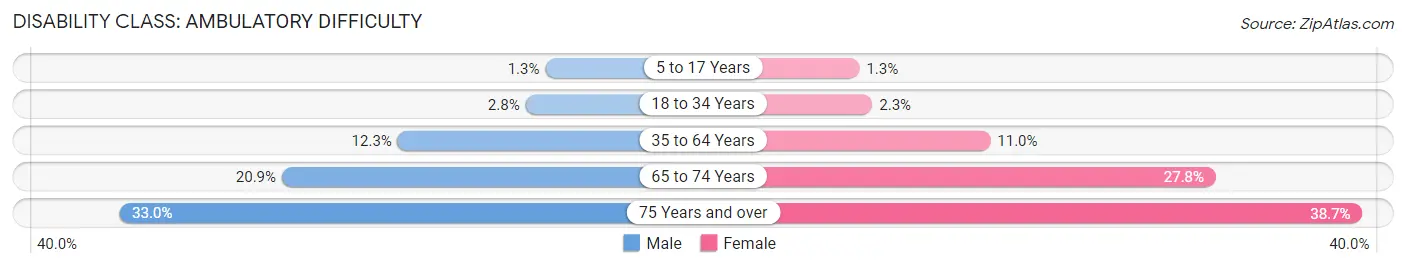
| Age Bracket | Male | Female |
| 5 to 17 Years | 162 (1.3%) | 150 (1.3%) |
| 18 to 34 Years | 367 (2.8%) | 310 (2.3%) |
| 35 to 64 Years | 2,811 (12.3%) | 2,747 (11.0%) |
| 65 to 74 Years | 1,139 (20.9%) | 1,892 (27.8%) |
| 75 Years and over | 1,094 (33.0%) | 1,870 (38.7%) |
Disability Class: Self-Care Difficulty
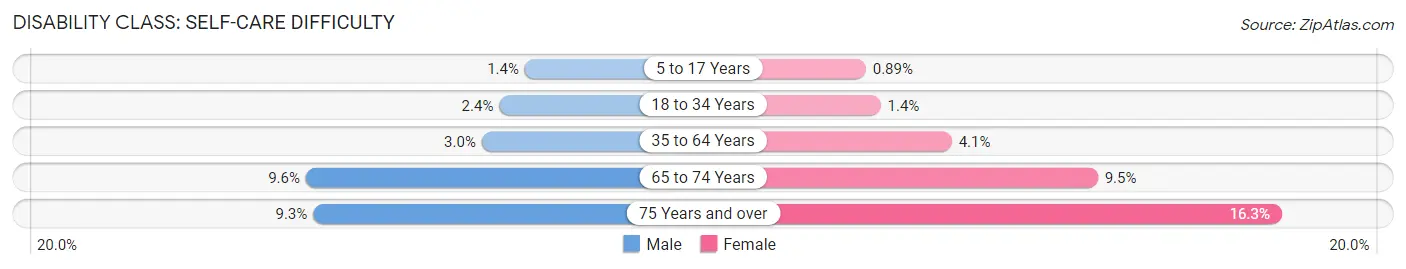
| Age Bracket | Male | Female |
| 5 to 17 Years | 172 (1.4%) | 102 (0.9%) |
| 18 to 34 Years | 311 (2.4%) | 197 (1.4%) |
| 35 to 64 Years | 692 (3.0%) | 1,016 (4.1%) |
| 65 to 74 Years | 521 (9.6%) | 647 (9.5%) |
| 75 Years and over | 308 (9.3%) | 790 (16.3%) |
Technology Access in Rapides Parish
Computing Device Access in Rapides Parish
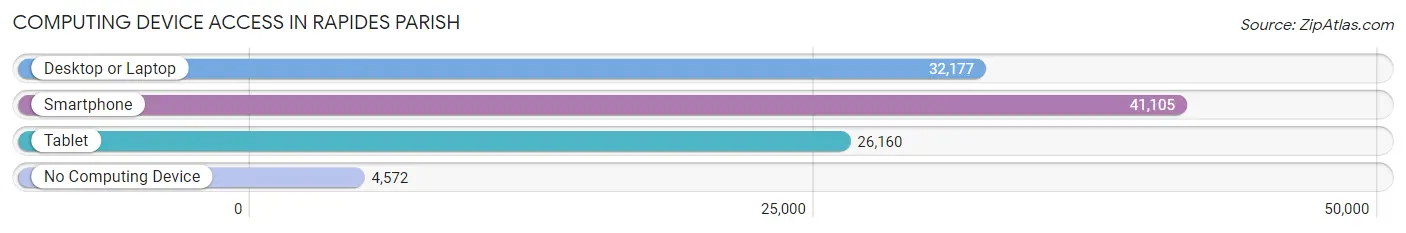
| Device Type | # Households | % Households |
| Desktop or Laptop | 32,177 | 66.3% |
| Smartphone | 41,105 | 84.7% |
| Tablet | 26,160 | 53.9% |
| No Computing Device | 4,572 | 9.4% |
| Total | 48,544 | 100.0% |
Internet Access in Rapides Parish
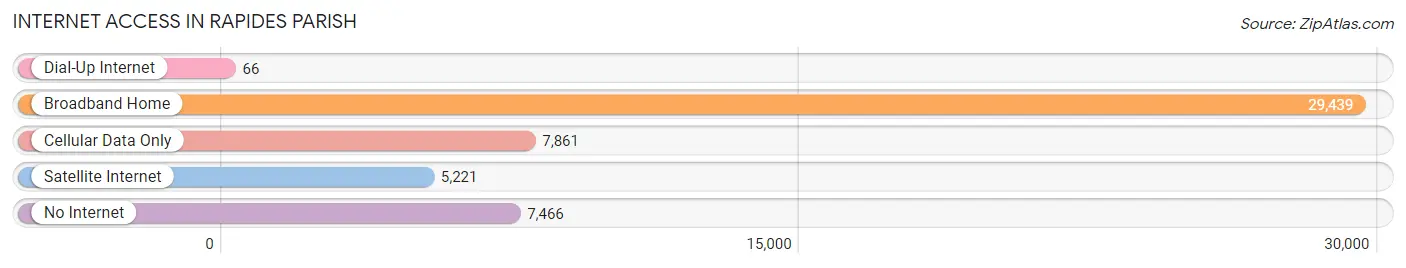
| Internet Type | # Households | % Households |
| Dial-Up Internet | 66 | 0.1% |
| Broadband Home | 29,439 | 60.6% |
| Cellular Data Only | 7,861 | 16.2% |
| Satellite Internet | 5,221 | 10.8% |
| No Internet | 7,466 | 15.4% |
| Total | 48,544 | 100.0% |
Rapides Parish Summary
Rapides Parish, located in the central region of Louisiana, is a vibrant and diverse area with a rich history, diverse geography, and a strong economy. The parish is home to the cities of Alexandria, Pineville, and Ball, as well as numerous unincorporated communities. Rapides Parish is bordered by Avoyelles Parish to the north, Grant Parish to the east, Natchitoches Parish to the west, and Vernon Parish to the south.
History
The area that is now Rapides Parish was originally inhabited by the Tunica, Choctaw, and Natchez Native American tribes. The first European settlers arrived in the area in the late 1700s, and the parish was officially established in 1807. The parish was named after the rapids of the Red River, which runs through the parish.
During the Civil War, Rapides Parish was the site of several battles, including the Battle of Mansfield and the Battle of Pleasant Hill. After the war, the parish experienced a period of economic growth, with the development of the lumber and railroad industries.
Geography
Rapides Parish covers an area of 1,362 square miles, making it the third-largest parish in Louisiana. The parish is located in the central region of the state, and is bordered by Avoyelles Parish to the north, Grant Parish to the east, Natchitoches Parish to the west, and Vernon Parish to the south.
The parish is divided into two distinct regions: the Red River Valley and the uplands. The Red River Valley is a flat, alluvial plain that is prone to flooding. The uplands are characterized by rolling hills and forests. The parish is home to several rivers, including the Red River, the Ouachita River, and the Calcasieu River.
Economy
Rapides Parish has a strong and diverse economy. The parish is home to several major industries, including manufacturing, healthcare, education, and tourism. The manufacturing sector is the largest employer in the parish, with major employers including International Paper, Georgia-Pacific, and Louisiana-Pacific.
The healthcare sector is also a major employer in the parish, with major employers including Rapides Regional Medical Center and Christus St. Frances Cabrini Hospital. The education sector is also a major employer in the parish, with major employers including Louisiana State University at Alexandria and Northwestern State University.
The tourism sector is also a major employer in the parish, with major attractions including the Alexandria Zoo, the Alexandria Museum of Art, and the Kent Plantation House.
Demographics
As of the 2010 census, Rapides Parish had a population of 131,613. The population is racially diverse, with the largest racial group being White (63.3%), followed by African American (30.2%), Hispanic (3.7%), and Asian (1.7%). The median household income in the parish is $45,945, and the median age is 37.7.
Conclusion
Rapides Parish is a vibrant and diverse area with a rich history, diverse geography, and a strong economy. The parish is home to several major industries, including manufacturing, healthcare, education, and tourism. The population is racially diverse, with the largest racial group being White. Rapides Parish is a great place to live, work, and visit.
Common Questions
What is the Total Population of Rapides Parish?
Total Population of Rapides Parish is 129,536.
What is the Total Male Population of Rapides Parish?
Total Male Population of Rapides Parish is 62,847.
What is the Total Female Population of Rapides Parish?
Total Female Population of Rapides Parish is 66,689.
What is the Ratio of Males per 100 Females in Rapides Parish?
There are 94.24 Males per 100 Females in Rapides Parish.
What is the Ratio of Females per 100 Males in Rapides Parish?
There are 106.11 Females per 100 Males in Rapides Parish.
What is the Median Population Age in Rapides Parish?
Median Population Age in Rapides Parish is 37.7 Years.
What is the Average Family Size in Rapides Parish
Average Family Size in Rapides Parish is 3.2 People.
What is the Average Household Size in Rapides Parish
Average Household Size in Rapides Parish is 2.6 People.
What is Per Capita Income in Rapides Parish?
Per Capita income in Rapides Parish is $31,010.
What is the Median Family Income in Rapides Parish?
Median Family Income in Rapides Parish is $67,923.
What is the Median Household income in Rapides Parish?
Median Household Income in Rapides Parish is $55,407.
What is Income or Wage Gap in Rapides Parish?
Income or Wage Gap in Rapides Parish is 30.7%.
Women in Rapides Parish earn 69.3 cents for every dollar earned by a man.
What is Family Income Deficit in Rapides Parish?
Family Income Deficit in Rapides Parish is $10,283.
Families that are below poverty line in Rapides Parish earn $10,283 less on average than the poverty threshold level.
What is Inequality or Gini Index in Rapides Parish?
Inequality or Gini Index in Rapides Parish is 0.48.
How Large is the Labor Force in Rapides Parish?
There are 59,437 People in the Labor Forcein in Rapides Parish.
What is the Percentage of People in the Labor Force in Rapides Parish?
58.6% of People are in the Labor Force in Rapides Parish.
What is the Unemployment Rate in Rapides Parish?
Unemployment Rate in Rapides Parish is 5.7%.