Pointe Coupee Parish, LA
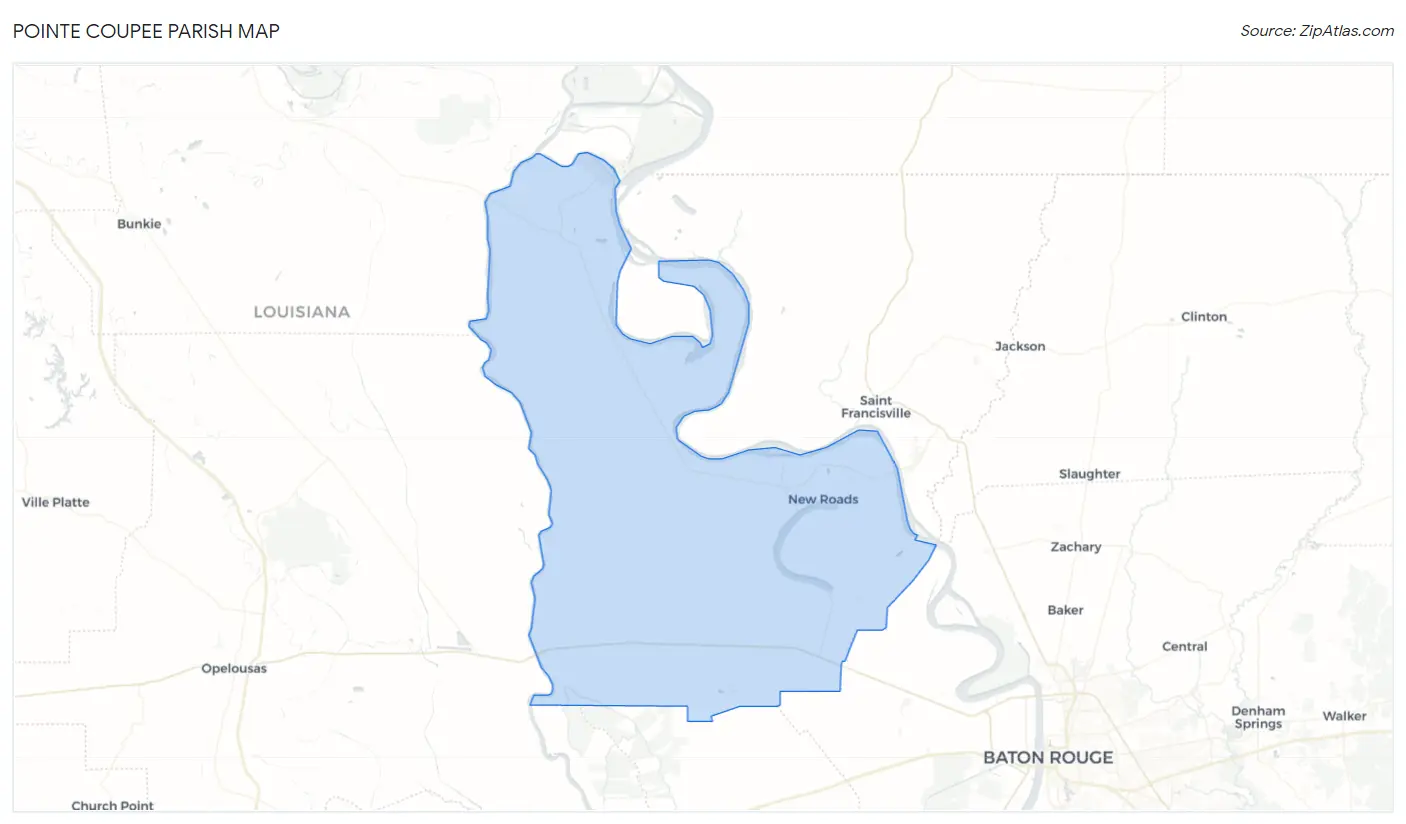
Pointe Coupee Parish Map
Pointe Coupee Parish Overview
20,652
TOTAL POPULATION
10,201
MALE POPULATION
10,451
FEMALE POPULATION
97.61
MALES / 100 FEMALES
102.45
FEMALES / 100 MALES
43.4
MEDIAN AGE
3.3
AVG FAMILY SIZE
2.5
AVG HOUSEHOLD SIZE
$31,595
PER CAPITA INCOME
$71,425
AVG FAMILY INCOME
$53,045
AVG HOUSEHOLD INCOME
47.4%
WAGE / INCOME GAP [ % ]
52.6¢/ $1
WAGE / INCOME GAP [ $ ]
$12,051
FAMILY INCOME DEFICIT
0.51
INEQUALITY / GINI INDEX
8,879
LABOR FORCE [ PEOPLE ]
53.0%
PERCENT IN LABOR FORCE
7.4%
UNEMPLOYMENT RATE
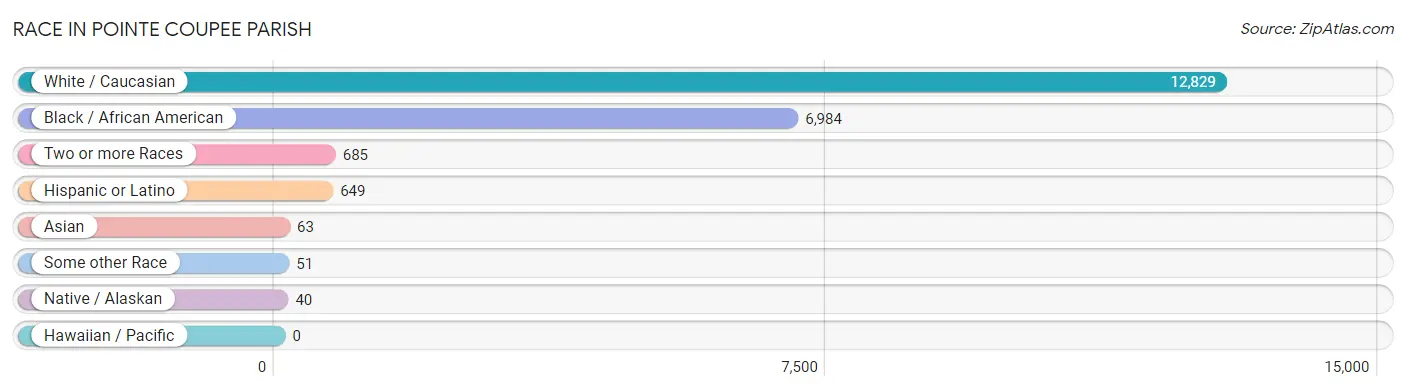
Race in Pointe Coupee Parish
The most populous races in Pointe Coupee Parish are White / Caucasian (12,829 | 62.1%), Black / African American (6,984 | 33.8%), and Two or more Races (685 | 3.3%).
| Race | # Population | % Population |
| Asian | 63 | 0.3% |
| Black / African American | 6,984 | 33.8% |
| Hawaiian / Pacific | 0 | 0.0% |
| Hispanic or Latino | 649 | 3.1% |
| Native / Alaskan | 40 | 0.2% |
| White / Caucasian | 12,829 | 62.1% |
| Two or more Races | 685 | 3.3% |
| Some other Race | 51 | 0.3% |
| Total | 20,652 | 100.0% |
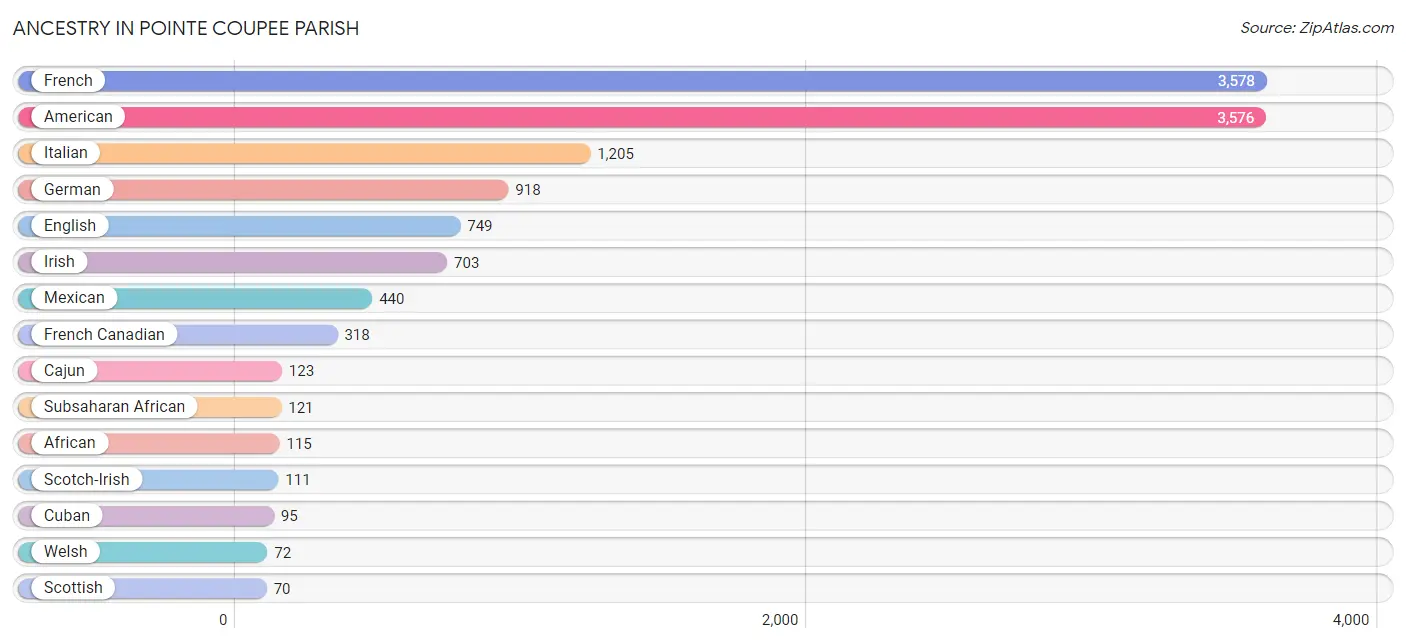
Ancestry in Pointe Coupee Parish
The most populous ancestries reported in Pointe Coupee Parish are French (3,578 | 17.3%), American (3,576 | 17.3%), Italian (1,205 | 5.8%), German (918 | 4.4%), and English (749 | 3.6%), together accounting for 48.6% of all Pointe Coupee Parish residents.
| Ancestry | # Population | % Population |
| African | 115 | 0.6% |
| American | 3,576 | 17.3% |
| Arab | 4 | 0.0% |
| British | 30 | 0.2% |
| Burmese | 28 | 0.1% |
| Cajun | 123 | 0.6% |
| Central American | 46 | 0.2% |
| Cherokee | 12 | 0.1% |
| Choctaw | 29 | 0.1% |
| Cuban | 95 | 0.5% |
| Dutch | 48 | 0.2% |
| Eastern European | 7 | 0.0% |
| English | 749 | 3.6% |
| European | 10 | 0.1% |
| French | 3,578 | 17.3% |
| French Canadian | 318 | 1.5% |
| German | 918 | 4.4% |
| Greek | 7 | 0.0% |
| Haitian | 37 | 0.2% |
| Houma | 24 | 0.1% |
| Hungarian | 9 | 0.0% |
| Indian (Asian) | 44 | 0.2% |
| Irish | 703 | 3.4% |
| Italian | 1,205 | 5.8% |
| Lebanese | 4 | 0.0% |
| Mexican | 440 | 2.1% |
| Nigerian | 6 | 0.0% |
| Northern European | 7 | 0.0% |
| Norwegian | 43 | 0.2% |
| Panamanian | 46 | 0.2% |
| Polish | 21 | 0.1% |
| Scandinavian | 7 | 0.0% |
| Scotch-Irish | 111 | 0.5% |
| Scottish | 70 | 0.3% |
| Spaniard | 23 | 0.1% |
| Spanish | 45 | 0.2% |
| Sri Lankan | 17 | 0.1% |
| Subsaharan African | 121 | 0.6% |
| Swiss | 4 | 0.0% |
| Welsh | 72 | 0.4% | View All 40 Rows |
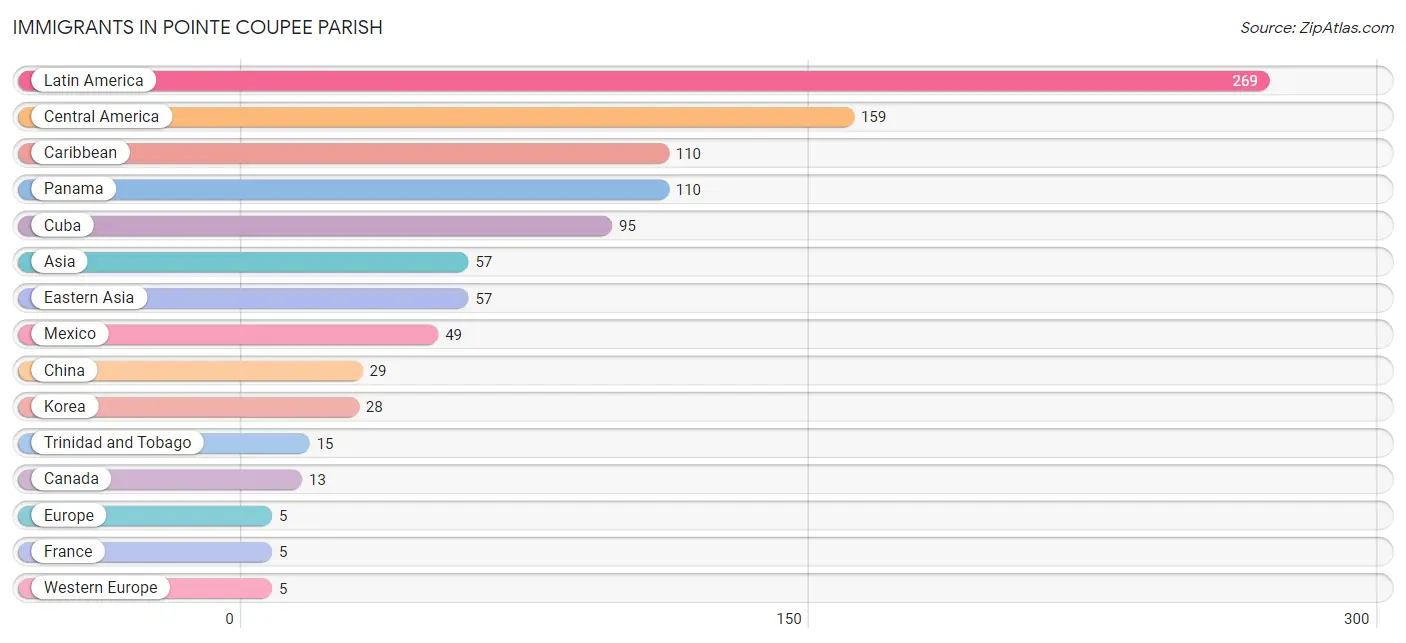
Immigrants in Pointe Coupee Parish
The most numerous immigrant groups reported in Pointe Coupee Parish came from Latin America (269 | 1.3%), Central America (159 | 0.8%), Caribbean (110 | 0.5%), Panama (110 | 0.5%), and Cuba (95 | 0.5%), together accounting for 3.6% of all Pointe Coupee Parish residents.
| Immigration Origin | # Population | % Population |
| Asia | 57 | 0.3% |
| Canada | 13 | 0.1% |
| Caribbean | 110 | 0.5% |
| Central America | 159 | 0.8% |
| China | 29 | 0.1% |
| Cuba | 95 | 0.5% |
| Eastern Asia | 57 | 0.3% |
| Europe | 5 | 0.0% |
| France | 5 | 0.0% |
| Korea | 28 | 0.1% |
| Latin America | 269 | 1.3% |
| Mexico | 49 | 0.2% |
| Panama | 110 | 0.5% |
| Trinidad and Tobago | 15 | 0.1% |
| Western Europe | 5 | 0.0% | View All 15 Rows |
Sex and Age in Pointe Coupee Parish
Sex and Age in Pointe Coupee Parish
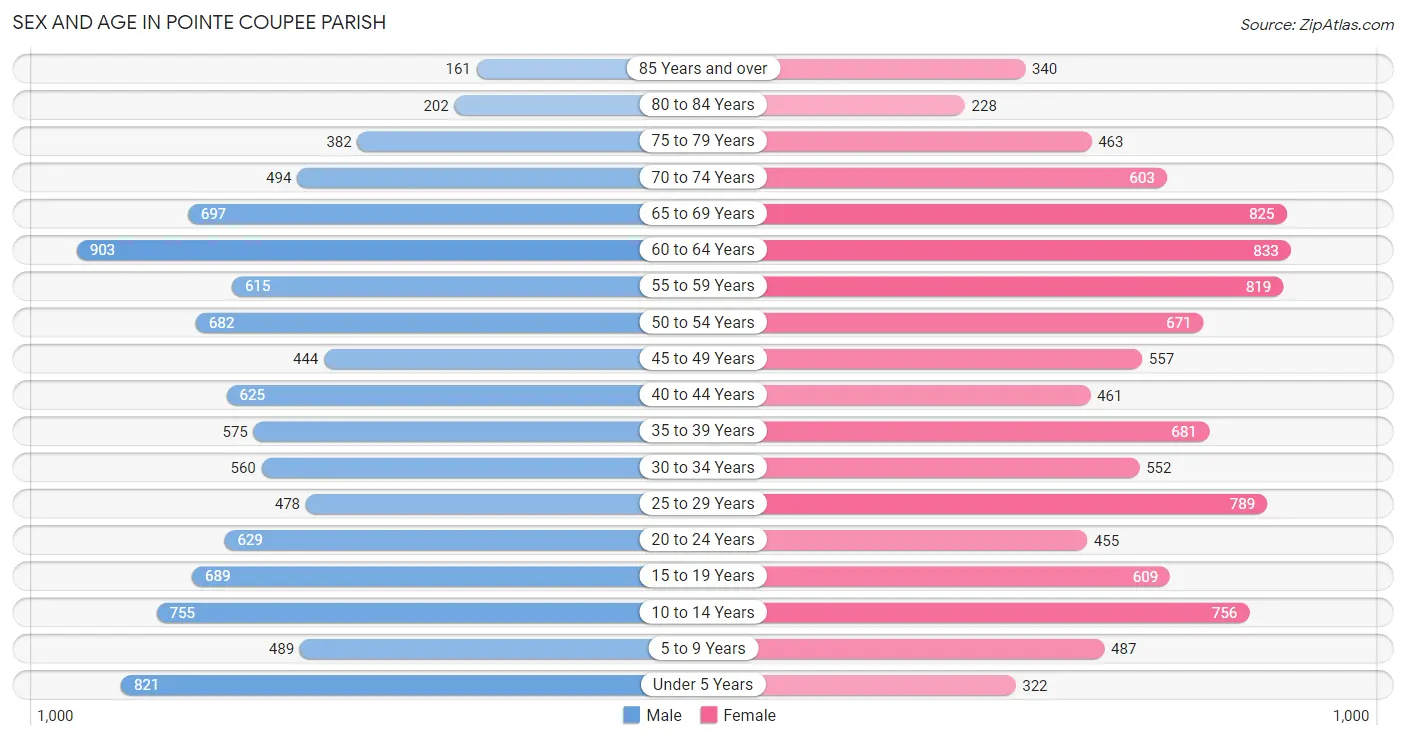
The most populous age groups in Pointe Coupee Parish are 60 to 64 Years (903 | 8.8%) for men and 60 to 64 Years (833 | 8.0%) for women.
| Age Bracket | Male | Female |
| Under 5 Years | 821 (8.1%) | 322 (3.1%) |
| 5 to 9 Years | 489 (4.8%) | 487 (4.7%) |
| 10 to 14 Years | 755 (7.4%) | 756 (7.2%) |
| 15 to 19 Years | 689 (6.8%) | 609 (5.8%) |
| 20 to 24 Years | 629 (6.2%) | 455 (4.3%) |
| 25 to 29 Years | 478 (4.7%) | 789 (7.5%) |
| 30 to 34 Years | 560 (5.5%) | 552 (5.3%) |
| 35 to 39 Years | 575 (5.6%) | 681 (6.5%) |
| 40 to 44 Years | 625 (6.1%) | 461 (4.4%) |
| 45 to 49 Years | 444 (4.3%) | 557 (5.3%) |
| 50 to 54 Years | 682 (6.7%) | 671 (6.4%) |
| 55 to 59 Years | 615 (6.0%) | 819 (7.8%) |
| 60 to 64 Years | 903 (8.8%) | 833 (8.0%) |
| 65 to 69 Years | 697 (6.8%) | 825 (7.9%) |
| 70 to 74 Years | 494 (4.8%) | 603 (5.8%) |
| 75 to 79 Years | 382 (3.7%) | 463 (4.4%) |
| 80 to 84 Years | 202 (2.0%) | 228 (2.2%) |
| 85 Years and over | 161 (1.6%) | 340 (3.3%) |
| Total | 10,201 (100.0%) | 10,451 (100.0%) |
Families and Households in Pointe Coupee Parish
Median Family Size in Pointe Coupee Parish
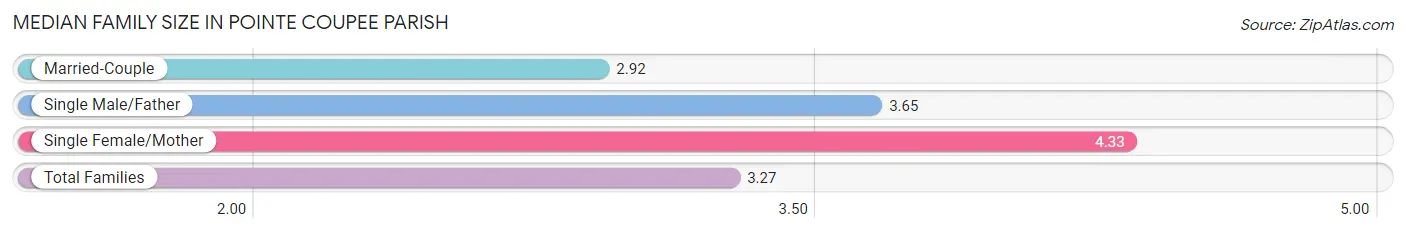
The median family size in Pointe Coupee Parish is 3.27 persons per family, with single female/mother families (1,068 | 21.4%) accounting for the largest median family size of 4.33 persons per family. On the other hand, married-couple families (3,607 | 72.3%) represent the smallest median family size with 2.92 persons per family.
| Family Type | # Families | Family Size |
| Married-Couple | 3,607 (72.3%) | 2.92 |
| Single Male/Father | 312 (6.3%) | 3.65 |
| Single Female/Mother | 1,068 (21.4%) | 4.33 |
| Total Families | 4,987 (100.0%) | 3.27 |
Median Household Size in Pointe Coupee Parish
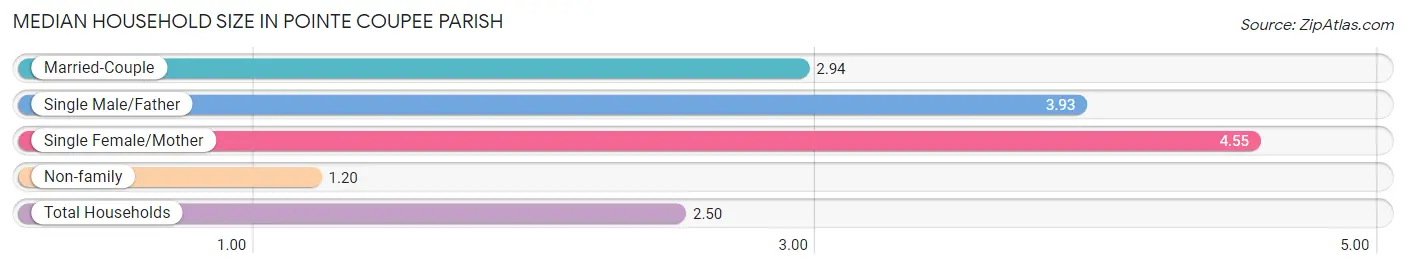
The median household size in Pointe Coupee Parish is 2.50 persons per household, with single female/mother households (1,068 | 13.0%) accounting for the largest median household size of 4.55 persons per household. non-family households (3,216 | 39.2%) represent the smallest median household size with 1.20 persons per household.
| Household Type | # Households | Household Size |
| Married-Couple | 3,607 (44.0%) | 2.94 |
| Single Male/Father | 312 (3.8%) | 3.93 |
| Single Female/Mother | 1,068 (13.0%) | 4.55 |
| Non-family | 3,216 (39.2%) | 1.20 |
| Total Households | 8,203 (100.0%) | 2.50 |
Household Size by Marriage Status in Pointe Coupee Parish
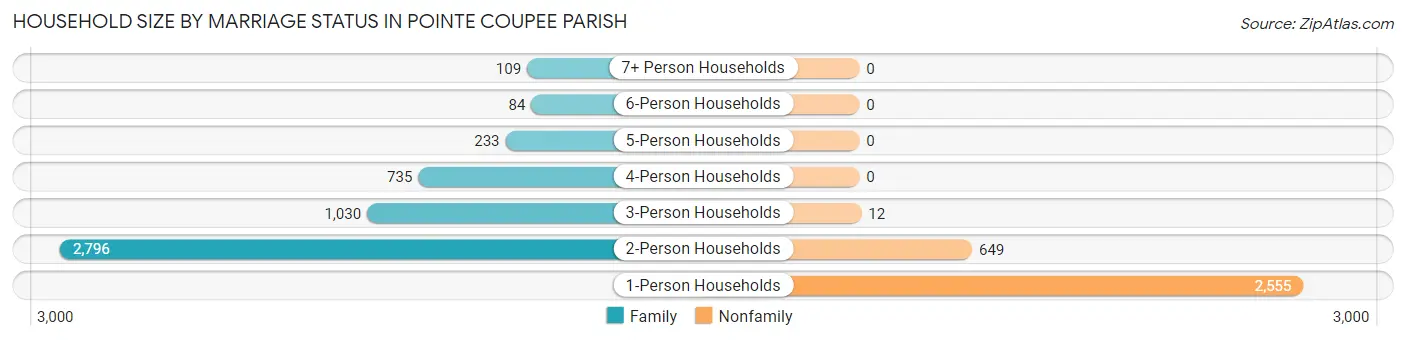
Out of a total of 8,203 households in Pointe Coupee Parish, 4,987 (60.8%) are family households, while 3,216 (39.2%) are nonfamily households. The most numerous type of family households are 2-person households, comprising 2,796, and the most common type of nonfamily households are 1-person households, comprising 2,555.
| Household Size | Family Households | Nonfamily Households |
| 1-Person Households | - | 2,555 (31.1%) |
| 2-Person Households | 2,796 (34.1%) | 649 (7.9%) |
| 3-Person Households | 1,030 (12.6%) | 12 (0.2%) |
| 4-Person Households | 735 (9.0%) | 0 (0.0%) |
| 5-Person Households | 233 (2.8%) | 0 (0.0%) |
| 6-Person Households | 84 (1.0%) | 0 (0.0%) |
| 7+ Person Households | 109 (1.3%) | 0 (0.0%) |
| Total | 4,987 (60.8%) | 3,216 (39.2%) |
Female Fertility in Pointe Coupee Parish
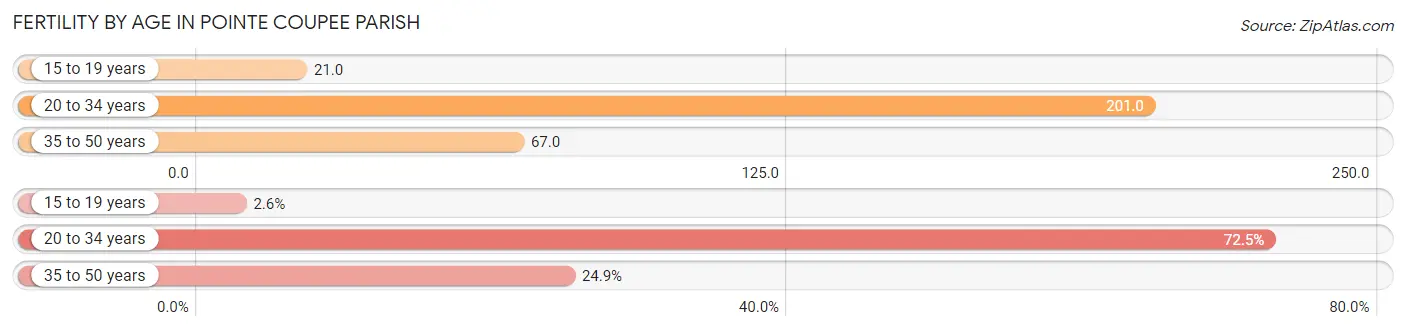
Fertility by Age in Pointe Coupee Parish
Average fertility rate in Pointe Coupee Parish is 117.0 births per 1,000 women. Women in the age bracket of 20 to 34 years have the highest fertility rate with 201.0 births per 1,000 women. Women in the age bracket of 20 to 34 years acount for 72.5% of all women with births.
| Age Bracket | Women with Births | Births / 1,000 Women |
| 15 to 19 years | 13 (2.6%) | 21.0 |
| 20 to 34 years | 361 (72.5%) | 201.0 |
| 35 to 50 years | 124 (24.9%) | 67.0 |
| Total | 498 (100.0%) | 117.0 |
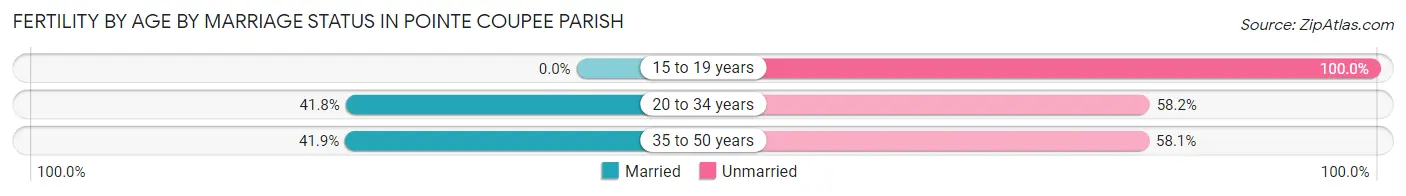
Fertility by Age by Marriage Status in Pointe Coupee Parish
40.8% of women with births (498) in Pointe Coupee Parish are married. The highest percentage of unmarried women with births falls into 15 to 19 years age bracket with 100.0% of them unmarried at the time of birth, while the lowest percentage of unmarried women with births belong to 35 to 50 years age bracket with 58.1% of them unmarried.
| Age Bracket | Married | Unmarried |
| 15 to 19 years | 0 (0.0%) | 13 (100.0%) |
| 20 to 34 years | 151 (41.8%) | 210 (58.2%) |
| 35 to 50 years | 52 (41.9%) | 72 (58.1%) |
| Total | 203 (40.8%) | 295 (59.2%) |
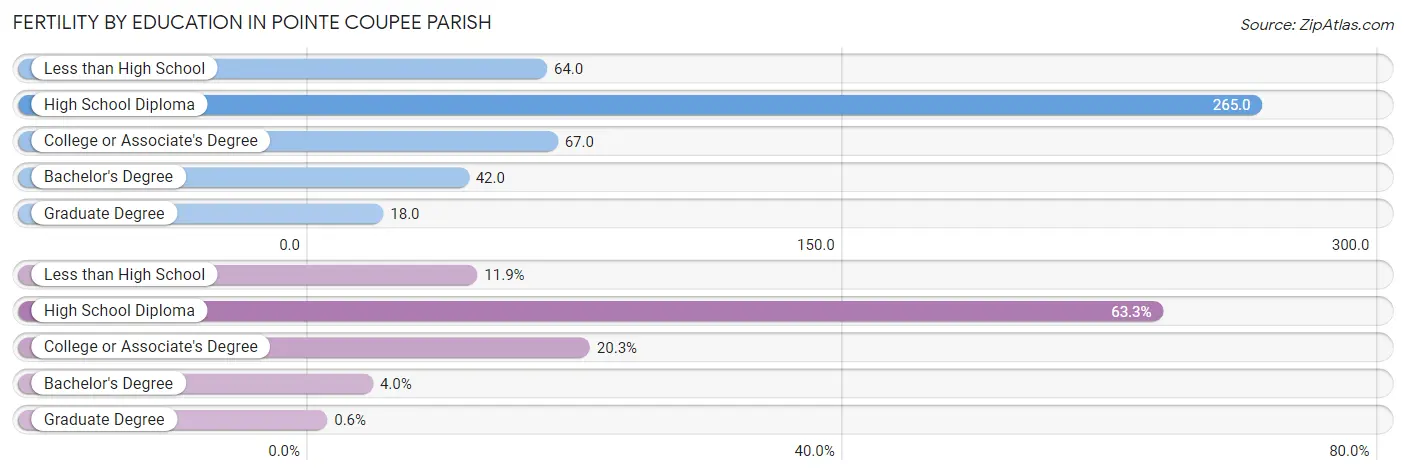
Fertility by Education in Pointe Coupee Parish
Average fertility rate in Pointe Coupee Parish is 117.0 births per 1,000 women. Women with the education attainment of high school diploma have the highest fertility rate of 265.0 births per 1,000 women, while women with the education attainment of graduate degree have the lowest fertility at 18.0 births per 1,000 women. Women with the education attainment of high school diploma represent 63.2% of all women with births.
| Educational Attainment | Women with Births | Births / 1,000 Women |
| Less than High School | 59 (11.8%) | 64.0 |
| High School Diploma | 315 (63.2%) | 265.0 |
| College or Associate's Degree | 101 (20.3%) | 67.0 |
| Bachelor's Degree | 20 (4.0%) | 42.0 |
| Graduate Degree | 3 (0.6%) | 18.0 |
| Total | 498 (100.0%) | 117.0 |
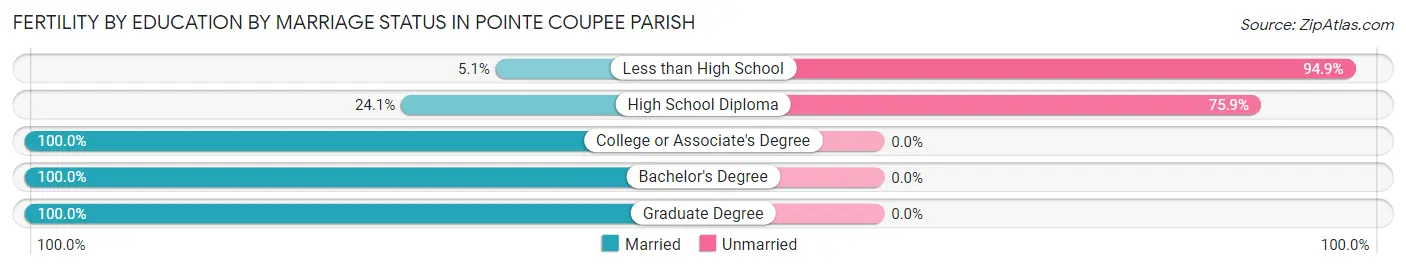
Fertility by Education by Marriage Status in Pointe Coupee Parish
59.2% of women with births in Pointe Coupee Parish are unmarried. Women with the educational attainment of college or associate's degree are most likely to be married with 100.0% of them married at childbirth, while women with the educational attainment of less than high school are least likely to be married with 94.9% of them unmarried at childbirth.
| Educational Attainment | Married | Unmarried |
| Less than High School | 3 (5.1%) | 56 (94.9%) |
| High School Diploma | 76 (24.1%) | 239 (75.9%) |
| College or Associate's Degree | 101 (100.0%) | 0 (0.0%) |
| Bachelor's Degree | 20 (100.0%) | 0 (0.0%) |
| Graduate Degree | 3 (100.0%) | 0 (0.0%) |
| Total | 203 (40.8%) | 295 (59.2%) |
Income in Pointe Coupee Parish
Income Overview in Pointe Coupee Parish
Per Capita Income in Pointe Coupee Parish is $31,595, while median incomes of families and households are $71,425 and $53,045 respectively.
| Characteristic | Number | Measure |
| Per Capita Income | 20,652 | $31,595 |
| Median Family Income | 4,987 | $71,425 |
| Mean Family Income | 4,987 | $90,301 |
| Median Household Income | 8,203 | $53,045 |
| Mean Household Income | 8,203 | $75,386 |
| Income Deficit | 4,987 | $12,051 |
| Wage / Income Gap (%) | 20,652 | 47.39% |
| Wage / Income Gap ($) | 20,652 | 52.61¢ per $1 |
| Gini / Inequality Index | 20,652 | 0.51 |
Earnings by Sex in Pointe Coupee Parish
Average Earnings in Pointe Coupee Parish are $39,262, $51,889 for men and $27,298 for women, a difference of 47.4%.
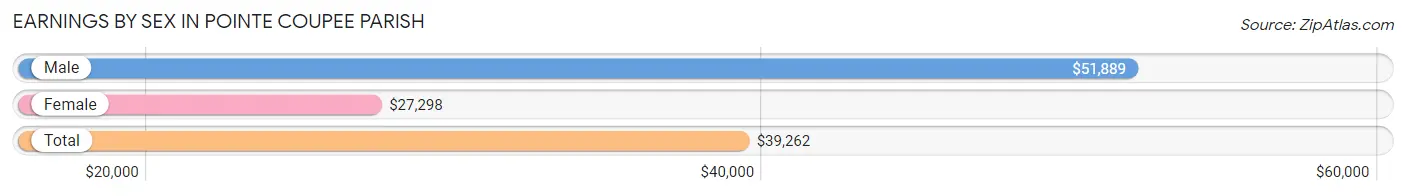
| Sex | Number | Average Earnings |
| Male | 4,580 (49.4%) | $51,889 |
| Female | 4,686 (50.6%) | $27,298 |
| Total | 9,266 (100.0%) | $39,262 |
Earnings by Sex by Income Bracket in Pointe Coupee Parish
The most common earnings brackets in Pointe Coupee Parish are $75,000 to $99,999 for men (768 | 16.8%) and $55,000 to $64,999 for women (444 | 9.5%).
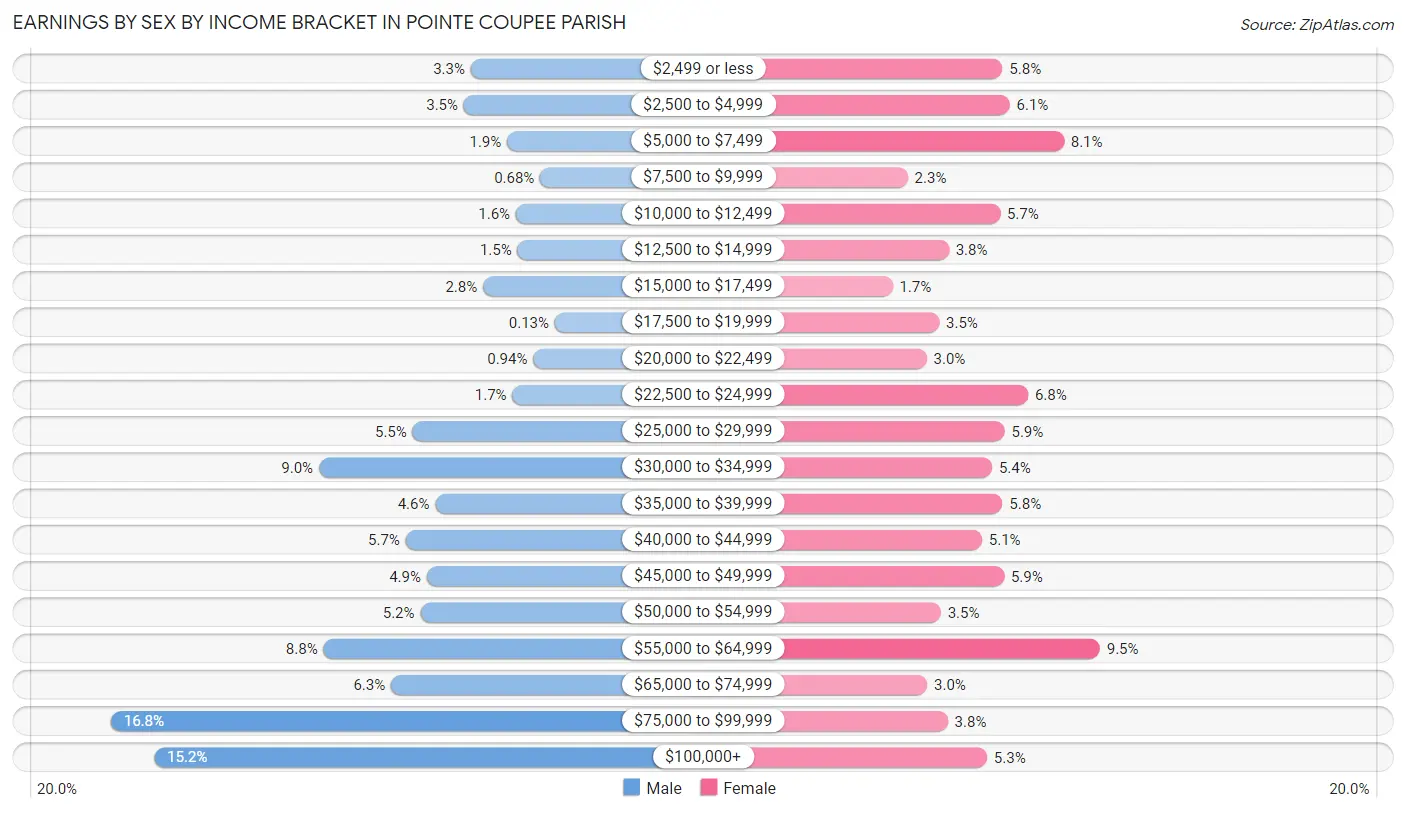
| Income | Male | Female |
| $2,499 or less | 150 (3.3%) | 273 (5.8%) |
| $2,500 to $4,999 | 162 (3.5%) | 286 (6.1%) |
| $5,000 to $7,499 | 88 (1.9%) | 381 (8.1%) |
| $7,500 to $9,999 | 31 (0.7%) | 107 (2.3%) |
| $10,000 to $12,499 | 73 (1.6%) | 269 (5.7%) |
| $12,500 to $14,999 | 70 (1.5%) | 179 (3.8%) |
| $15,000 to $17,499 | 129 (2.8%) | 80 (1.7%) |
| $17,500 to $19,999 | 6 (0.1%) | 162 (3.5%) |
| $20,000 to $22,499 | 43 (0.9%) | 140 (3.0%) |
| $22,500 to $24,999 | 79 (1.7%) | 318 (6.8%) |
| $25,000 to $29,999 | 250 (5.5%) | 277 (5.9%) |
| $30,000 to $34,999 | 411 (9.0%) | 255 (5.4%) |
| $35,000 to $39,999 | 211 (4.6%) | 273 (5.8%) |
| $40,000 to $44,999 | 262 (5.7%) | 237 (5.1%) |
| $45,000 to $49,999 | 226 (4.9%) | 276 (5.9%) |
| $50,000 to $54,999 | 237 (5.2%) | 165 (3.5%) |
| $55,000 to $64,999 | 403 (8.8%) | 444 (9.5%) |
| $65,000 to $74,999 | 287 (6.3%) | 141 (3.0%) |
| $75,000 to $99,999 | 768 (16.8%) | 177 (3.8%) |
| $100,000+ | 694 (15.1%) | 246 (5.2%) |
| Total | 4,580 (100.0%) | 4,686 (100.0%) |
Earnings by Sex by Educational Attainment in Pointe Coupee Parish
Average earnings in Pointe Coupee Parish are $52,854 for men and $31,807 for women, a difference of 39.8%. Men with an educational attainment of bachelor's degree enjoy the highest average annual earnings of $94,107, while those with college or associate's degree education earn the least with $44,716. Women with an educational attainment of graduate degree earn the most with the average annual earnings of $55,521, while those with less than high school education have the smallest earnings of $18,188.
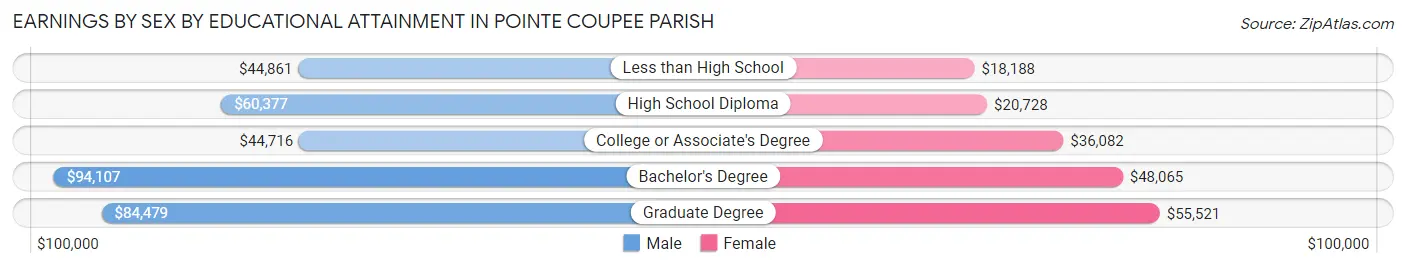
| Educational Attainment | Male Income | Female Income |
| Less than High School | $44,861 | $18,188 |
| High School Diploma | $60,377 | $20,728 |
| College or Associate's Degree | $44,716 | $36,082 |
| Bachelor's Degree | $94,107 | $48,065 |
| Graduate Degree | $84,479 | $55,521 |
| Total | $52,854 | $31,807 |
Family Income in Pointe Coupee Parish
Family Income Brackets in Pointe Coupee Parish
According to the Pointe Coupee Parish family income data, there are 1,087 families falling into the $100,000 to $149,999 income range, which is the most common income bracket and makes up 21.8% of all families. Conversely, the $15,000 to $24,999 income bracket is the least frequent group with only 175 families (3.5%) belonging to this category.
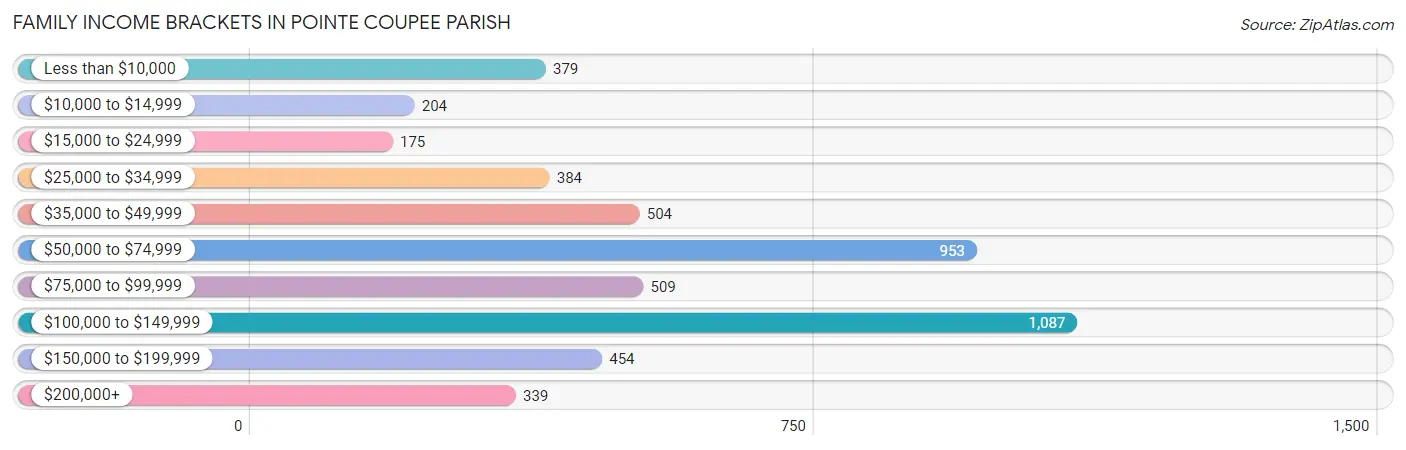
| Income Bracket | # Families | % Families |
| Less than $10,000 | 379 | 7.6% |
| $10,000 to $14,999 | 204 | 4.1% |
| $15,000 to $24,999 | 175 | 3.5% |
| $25,000 to $34,999 | 384 | 7.7% |
| $35,000 to $49,999 | 504 | 10.1% |
| $50,000 to $74,999 | 953 | 19.1% |
| $75,000 to $99,999 | 509 | 10.2% |
| $100,000 to $149,999 | 1,087 | 21.8% |
| $150,000 to $199,999 | 454 | 9.1% |
| $200,000+ | 339 | 6.8% |
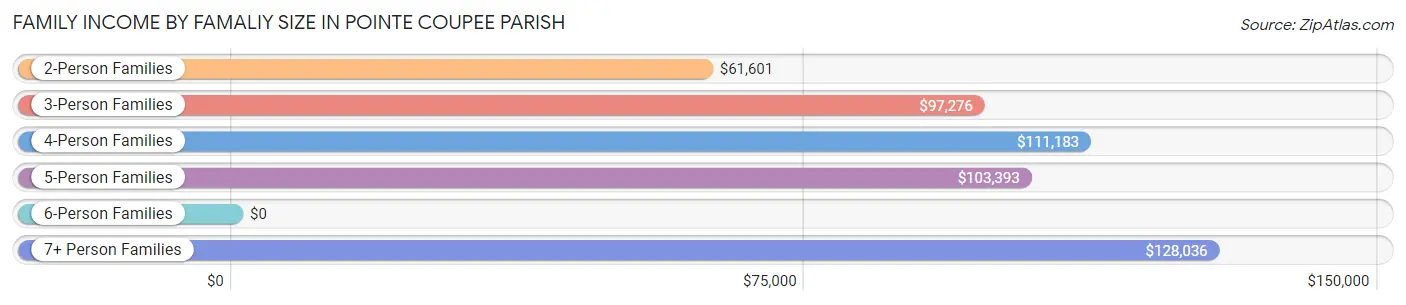
Family Income by Famaliy Size in Pointe Coupee Parish
7+ person families (92 | 1.8%) account for the highest median family income in Pointe Coupee Parish with $128,036 per family, while 3-person families (1,016 | 20.4%) have the highest median income of $32,425 per family member.
| Income Bracket | # Families | Median Income |
| 2-Person Families | 2,892 (58.0%) | $61,601 |
| 3-Person Families | 1,016 (20.4%) | $97,276 |
| 4-Person Families | 750 (15.0%) | $111,183 |
| 5-Person Families | 156 (3.1%) | $103,393 |
| 6-Person Families | 81 (1.6%) | $0 |
| 7+ Person Families | 92 (1.8%) | $128,036 |
| Total | 4,987 (100.0%) | $71,425 |
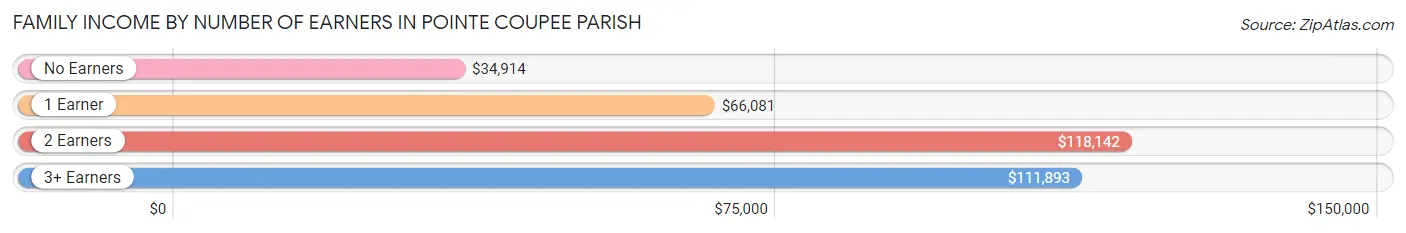
Family Income by Number of Earners in Pointe Coupee Parish
The median family income in Pointe Coupee Parish is $71,425, with families comprising 2 earners (1,899) having the highest median family income of $118,142, while families with no earners (1,256) have the lowest median family income of $34,914, accounting for 38.1% and 25.2% of families, respectively.
| Number of Earners | # Families | Median Income |
| No Earners | 1,256 (25.2%) | $34,914 |
| 1 Earner | 1,541 (30.9%) | $66,081 |
| 2 Earners | 1,899 (38.1%) | $118,142 |
| 3+ Earners | 291 (5.8%) | $111,893 |
| Total | 4,987 (100.0%) | $71,425 |
Household Income in Pointe Coupee Parish
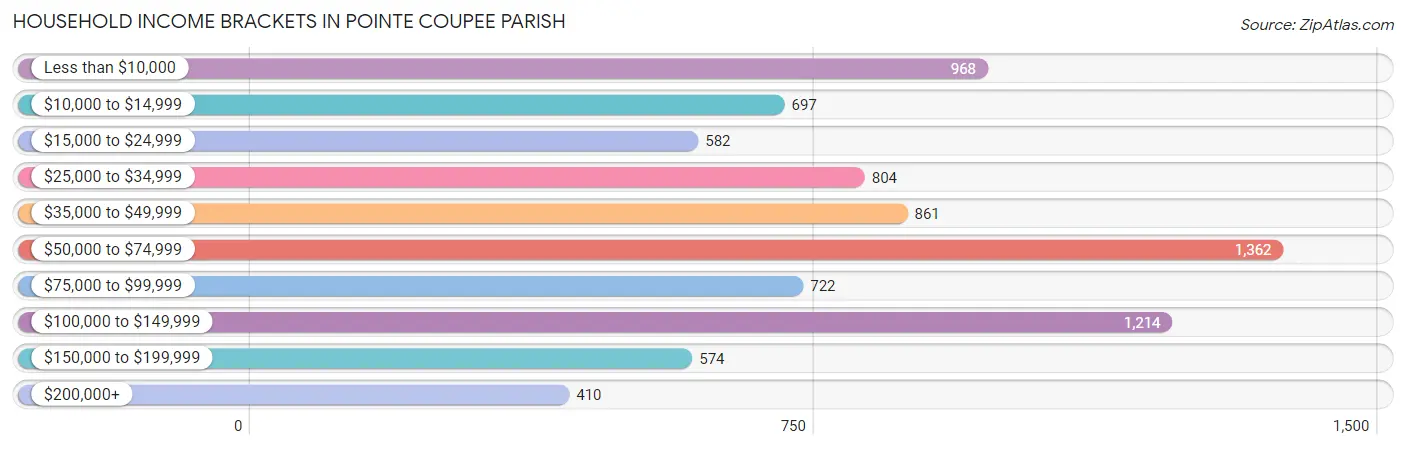
Household Income Brackets in Pointe Coupee Parish
With 1,362 households falling in the category, the $50,000 to $74,999 income range is the most frequent in Pointe Coupee Parish, accounting for 16.6% of all households. In contrast, only 410 households (5.0%) fall into the $200,000+ income bracket, making it the least populous group.
| Income Bracket | # Households | % Households |
| Less than $10,000 | 968 | 11.8% |
| $10,000 to $14,999 | 697 | 8.5% |
| $15,000 to $24,999 | 582 | 7.1% |
| $25,000 to $34,999 | 804 | 9.8% |
| $35,000 to $49,999 | 861 | 10.5% |
| $50,000 to $74,999 | 1,362 | 16.6% |
| $75,000 to $99,999 | 722 | 8.8% |
| $100,000 to $149,999 | 1,214 | 14.8% |
| $150,000 to $199,999 | 574 | 7.0% |
| $200,000+ | 410 | 5.0% |
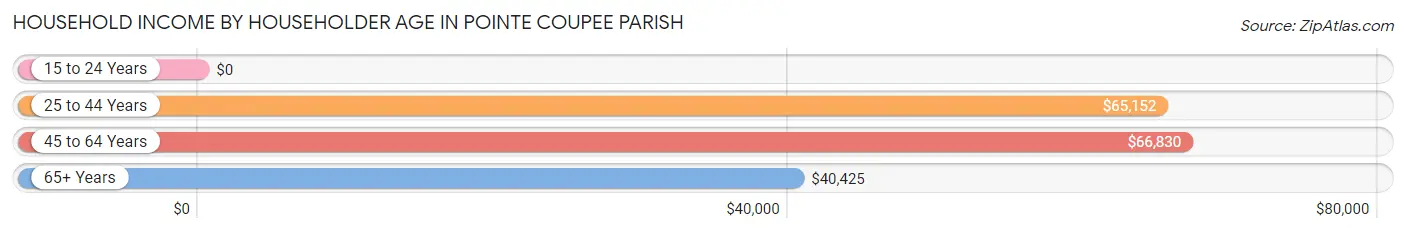
Household Income by Householder Age in Pointe Coupee Parish
The median household income in Pointe Coupee Parish is $53,045, with the highest median household income of $66,830 found in the 45 to 64 years age bracket for the primary householder. A total of 2,962 households (36.1%) fall into this category. Meanwhile, the 15 to 24 years age bracket for the primary householder has the lowest median household income of $0, with 306 households (3.7%) in this group.
| Income Bracket | # Households | Median Income |
| 15 to 24 Years | 306 (3.7%) | $0 |
| 25 to 44 Years | 2,004 (24.4%) | $65,152 |
| 45 to 64 Years | 2,962 (36.1%) | $66,830 |
| 65+ Years | 2,931 (35.7%) | $40,425 |
| Total | 8,203 (100.0%) | $53,045 |
Poverty in Pointe Coupee Parish
Income Below Poverty by Sex and Age in Pointe Coupee Parish
With 16.2% poverty level for males and 22.0% for females among the residents of Pointe Coupee Parish, 5 year old males and 6 to 11 year old females are the most vulnerable to poverty, with 24 males (41.4%) and 241 females (34.8%) in their respective age groups living below the poverty level.
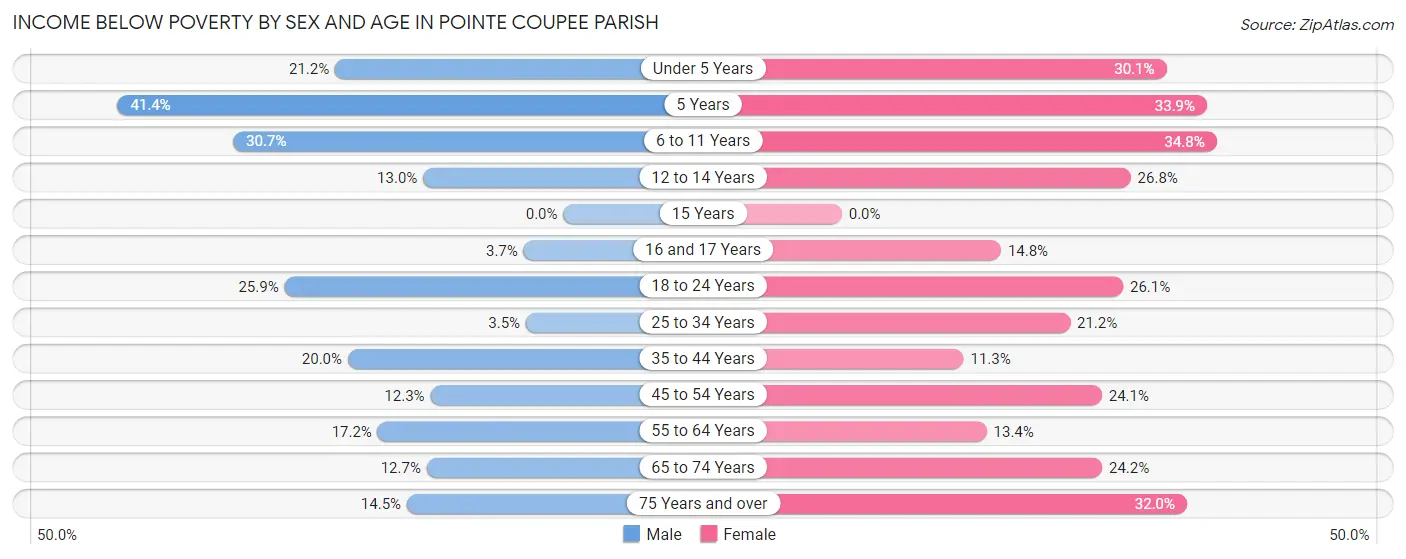
| Age Bracket | Male | Female |
| Under 5 Years | 174 (21.2%) | 97 (30.1%) |
| 5 Years | 24 (41.4%) | 41 (33.9%) |
| 6 to 11 Years | 179 (30.6%) | 241 (34.8%) |
| 12 to 14 Years | 74 (13.0%) | 115 (26.8%) |
| 15 Years | 0 (0.0%) | 0 (0.0%) |
| 16 and 17 Years | 8 (3.7%) | 44 (14.8%) |
| 18 to 24 Years | 249 (25.9%) | 166 (26.1%) |
| 25 to 34 Years | 36 (3.5%) | 284 (21.2%) |
| 35 to 44 Years | 240 (20.0%) | 129 (11.3%) |
| 45 to 54 Years | 139 (12.3%) | 291 (24.1%) |
| 55 to 64 Years | 260 (17.2%) | 222 (13.4%) |
| 65 to 74 Years | 151 (12.7%) | 343 (24.1%) |
| 75 Years and over | 106 (14.5%) | 309 (32.0%) |
| Total | 1,640 (16.2%) | 2,282 (22.0%) |
Income Above Poverty by Sex and Age in Pointe Coupee Parish
According to the poverty statistics in Pointe Coupee Parish, males aged 15 years and females aged 15 years are the age groups that are most secure financially, with 100.0% of males and 100.0% of females in these age groups living above the poverty line.
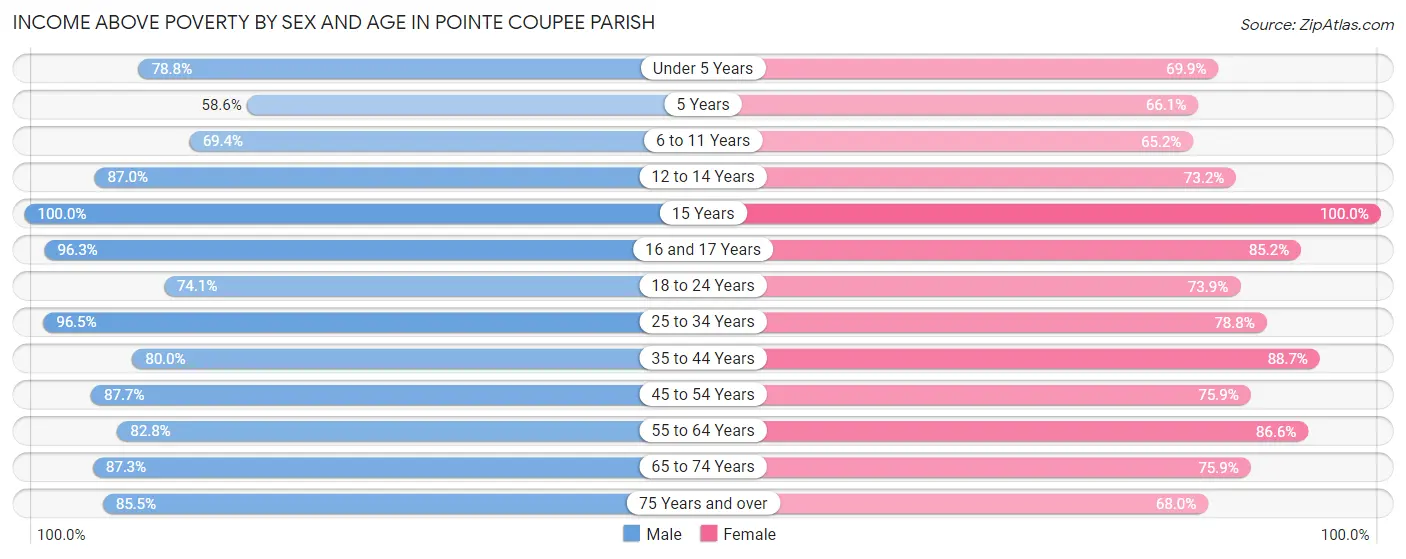
| Age Bracket | Male | Female |
| Under 5 Years | 647 (78.8%) | 225 (69.9%) |
| 5 Years | 34 (58.6%) | 80 (66.1%) |
| 6 to 11 Years | 405 (69.4%) | 452 (65.2%) |
| 12 to 14 Years | 495 (87.0%) | 314 (73.2%) |
| 15 Years | 139 (100.0%) | 130 (100.0%) |
| 16 and 17 Years | 209 (96.3%) | 254 (85.2%) |
| 18 to 24 Years | 713 (74.1%) | 470 (73.9%) |
| 25 to 34 Years | 1,002 (96.5%) | 1,057 (78.8%) |
| 35 to 44 Years | 960 (80.0%) | 1,013 (88.7%) |
| 45 to 54 Years | 987 (87.7%) | 915 (75.9%) |
| 55 to 64 Years | 1,249 (82.8%) | 1,430 (86.6%) |
| 65 to 74 Years | 1,040 (87.3%) | 1,077 (75.8%) |
| 75 Years and over | 624 (85.5%) | 656 (68.0%) |
| Total | 8,504 (83.8%) | 8,073 (78.0%) |
Income Below Poverty Among Married-Couple Families in Pointe Coupee Parish
The poverty statistics for married-couple families in Pointe Coupee Parish show that 8.8% or 319 of the total 3,607 families live below the poverty line. Families with 3 or 4 children have the highest poverty rate of 21.0%, comprising of 28 families. On the other hand, families with 5 or more children have the lowest poverty rate of 0.0%, which includes 0 families.
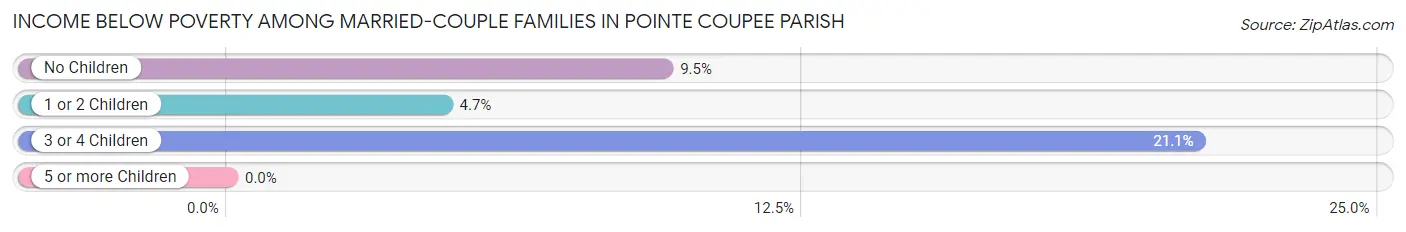
| Children | Above Poverty | Below Poverty |
| No Children | 2,466 (90.5%) | 258 (9.5%) |
| 1 or 2 Children | 674 (95.3%) | 33 (4.7%) |
| 3 or 4 Children | 105 (78.9%) | 28 (21.0%) |
| 5 or more Children | 43 (100.0%) | 0 (0.0%) |
| Total | 3,288 (91.2%) | 319 (8.8%) |
Income Below Poverty Among Single-Parent Households in Pointe Coupee Parish
According to the poverty data in Pointe Coupee Parish, 46.8% or 146 single-father households and 20.3% or 217 single-mother households are living below the poverty line. Among single-father households, those with no children have the highest poverty rate, with 126 households (66.7%) experiencing poverty. Likewise, among single-mother households, those with 5 or more children have the highest poverty rate, with 17 households (100.0%) falling below the poverty line.
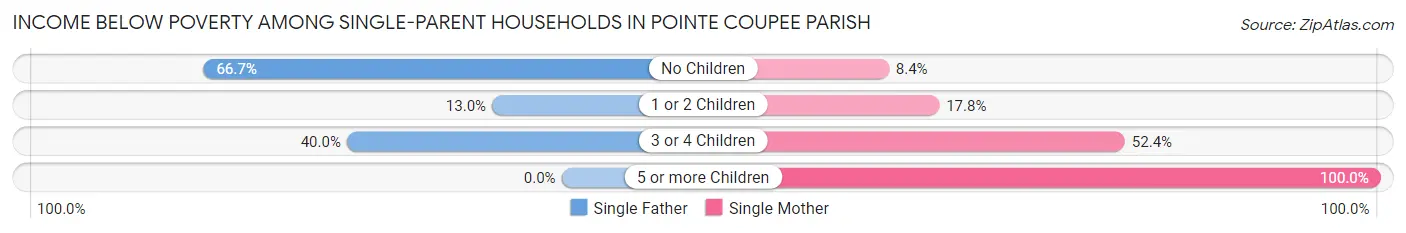
| Children | Single Father | Single Mother |
| No Children | 126 (66.7%) | 34 (8.4%) |
| 1 or 2 Children | 14 (13.0%) | 89 (17.8%) |
| 3 or 4 Children | 6 (40.0%) | 77 (52.4%) |
| 5 or more Children | 0 (0.0%) | 17 (100.0%) |
| Total | 146 (46.8%) | 217 (20.3%) |
Income Below Poverty Among Married-Couple vs Single-Parent Households in Pointe Coupee Parish
The poverty data for Pointe Coupee Parish shows that 319 of the married-couple family households (8.8%) and 363 of the single-parent households (26.3%) are living below the poverty level. Within the married-couple family households, those with 3 or 4 children have the highest poverty rate, with 28 households (21.0%) falling below the poverty line. Among the single-parent households, those with 5 or more children have the highest poverty rate, with 17 household (100.0%) living below poverty.
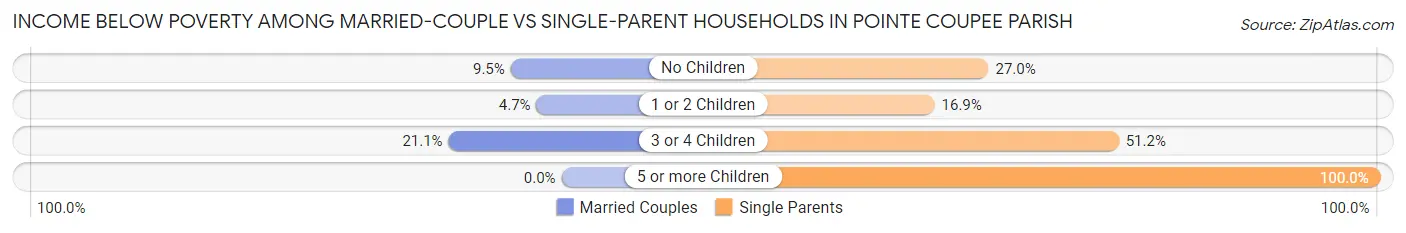
| Children | Married-Couple Families | Single-Parent Households |
| No Children | 258 (9.5%) | 160 (27.0%) |
| 1 or 2 Children | 33 (4.7%) | 103 (16.9%) |
| 3 or 4 Children | 28 (21.0%) | 83 (51.2%) |
| 5 or more Children | 0 (0.0%) | 17 (100.0%) |
| Total | 319 (8.8%) | 363 (26.3%) |
Employment Characteristics in Pointe Coupee Parish
Employment by Class of Employer in Pointe Coupee Parish
Among the 7,836 employed individuals in Pointe Coupee Parish, private company employees (4,967 | 63.4%), state government employees (1,015 | 13.0%), and local government employees (751 | 9.6%) make up the most common classes of employment.
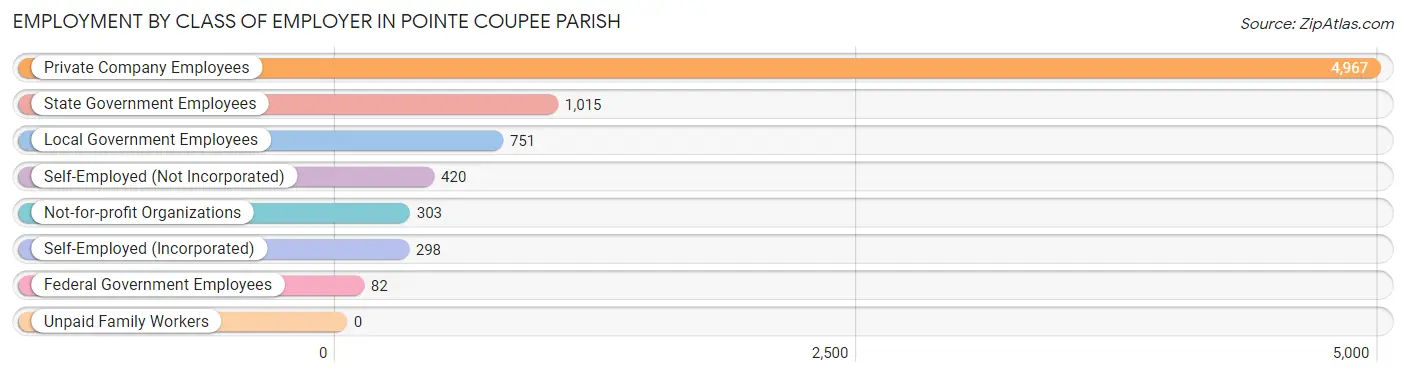
| Employer Class | # Employees | % Employees |
| Private Company Employees | 4,967 | 63.4% |
| Self-Employed (Incorporated) | 298 | 3.8% |
| Self-Employed (Not Incorporated) | 420 | 5.4% |
| Not-for-profit Organizations | 303 | 3.9% |
| Local Government Employees | 751 | 9.6% |
| State Government Employees | 1,015 | 13.0% |
| Federal Government Employees | 82 | 1.1% |
| Unpaid Family Workers | 0 | 0.0% |
| Total | 7,836 | 100.0% |
Employment Status by Age in Pointe Coupee Parish
According to the labor force statistics for Pointe Coupee Parish, out of the total population over 16 years of age (16,753), 53.0% or 8,879 individuals are in the labor force, with 7.4% or 657 of them unemployed. The age group with the highest labor force participation rate is 30 to 34 years, with 78.3% or 871 individuals in the labor force. Within the labor force, the 20 to 24 years age range has the highest percentage of unemployed individuals, with 35.0% or 295 of them being unemployed.
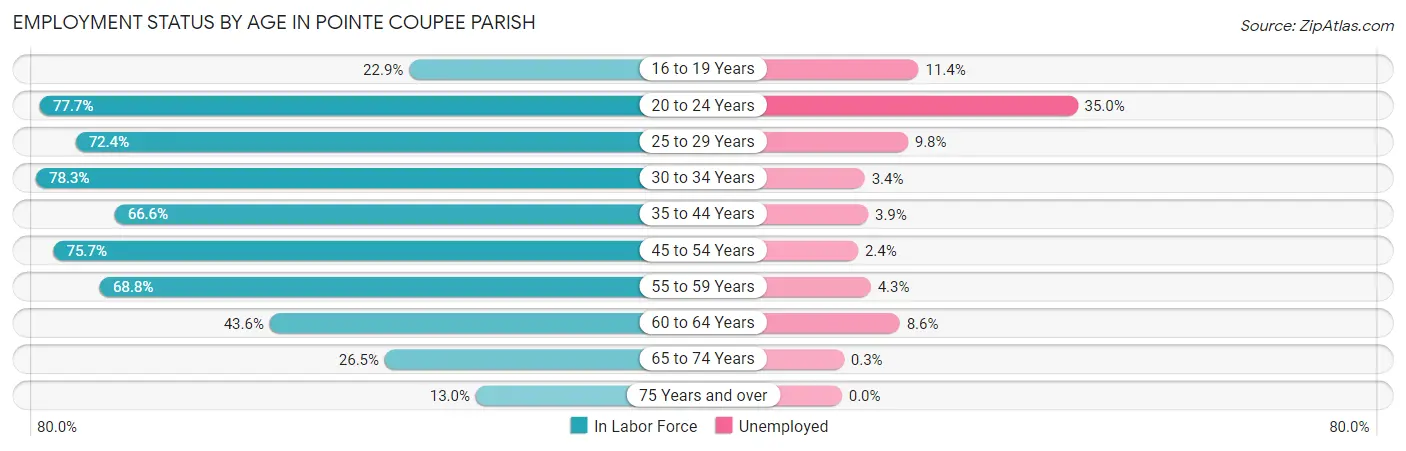
| Age Bracket | In Labor Force | Unemployed |
| 16 to 19 Years | 236 (22.9%) | 27 (11.4%) |
| 20 to 24 Years | 842 (77.7%) | 295 (35.0%) |
| 25 to 29 Years | 917 (72.4%) | 90 (9.8%) |
| 30 to 34 Years | 871 (78.3%) | 30 (3.4%) |
| 35 to 44 Years | 1,560 (66.6%) | 61 (3.9%) |
| 45 to 54 Years | 1,782 (75.7%) | 43 (2.4%) |
| 55 to 59 Years | 987 (68.8%) | 42 (4.3%) |
| 60 to 64 Years | 757 (43.6%) | 65 (8.6%) |
| 65 to 74 Years | 694 (26.5%) | 2 (0.3%) |
| 75 Years and over | 231 (13.0%) | 0 (0.0%) |
| Total | 8,879 (53.0%) | 657 (7.4%) |
Employment Status by Educational Attainment in Pointe Coupee Parish
According to labor force statistics for Pointe Coupee Parish, 67.1% of individuals (6,874) out of the total population between 25 and 64 years of age (10,245) are in the labor force, with 4.8% or 330 of them being unemployed. The group with the highest labor force participation rate are those with the educational attainment of bachelor's degree or higher, with 87.0% or 1,435 individuals in the labor force. Within the labor force, individuals with less than high school education have the highest percentage of unemployment, with 9.4% or 67 of them being unemployed.
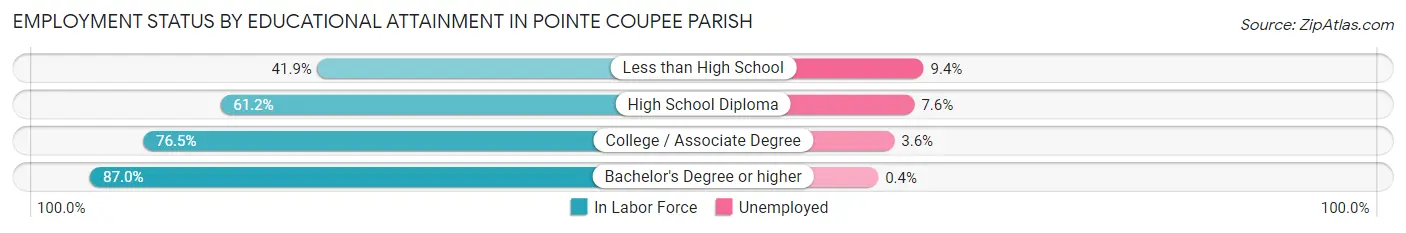
| Educational Attainment | In Labor Force | Unemployed |
| Less than High School | 712 (41.9%) | 160 (9.4%) |
| High School Diploma | 2,196 (61.2%) | 273 (7.6%) |
| College / Associate Degree | 2,531 (76.5%) | 119 (3.6%) |
| Bachelor's Degree or higher | 1,435 (87.0%) | 7 (0.4%) |
| Total | 6,874 (67.1%) | 492 (4.8%) |
Employment Occupations by Sex in Pointe Coupee Parish
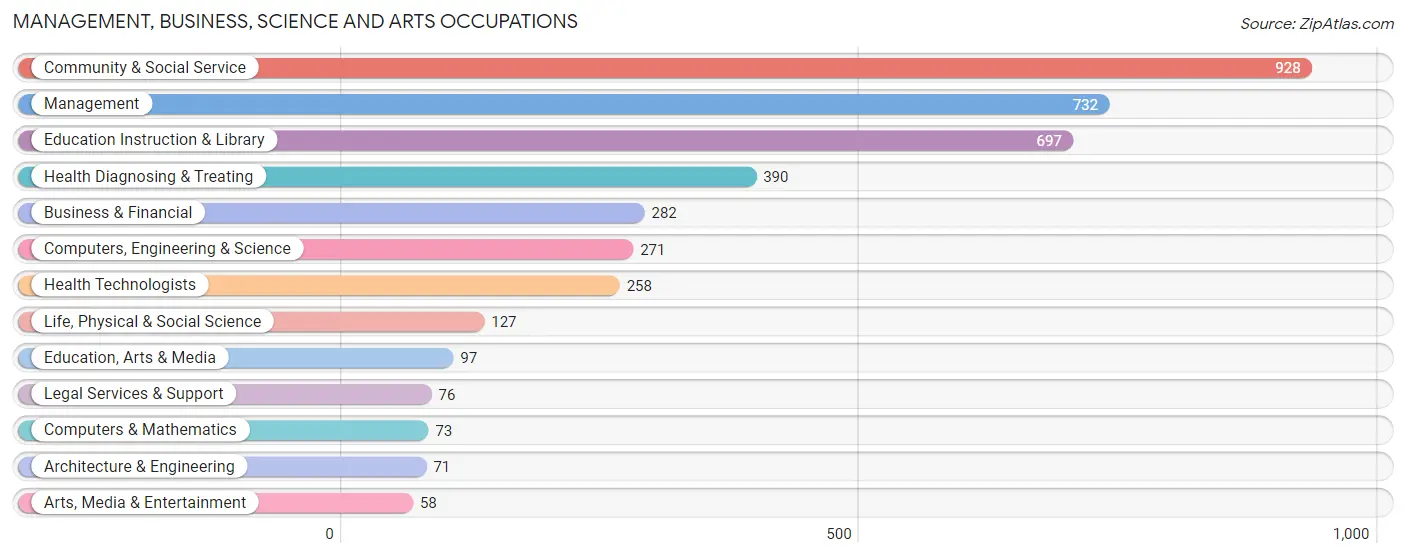
Management, Business, Science and Arts Occupations
The most common Management, Business, Science and Arts occupations in Pointe Coupee Parish are Community & Social Service (928 | 11.3%), Management (732 | 8.9%), Education Instruction & Library (697 | 8.5%), Health Diagnosing & Treating (390 | 4.8%), and Business & Financial (282 | 3.4%).
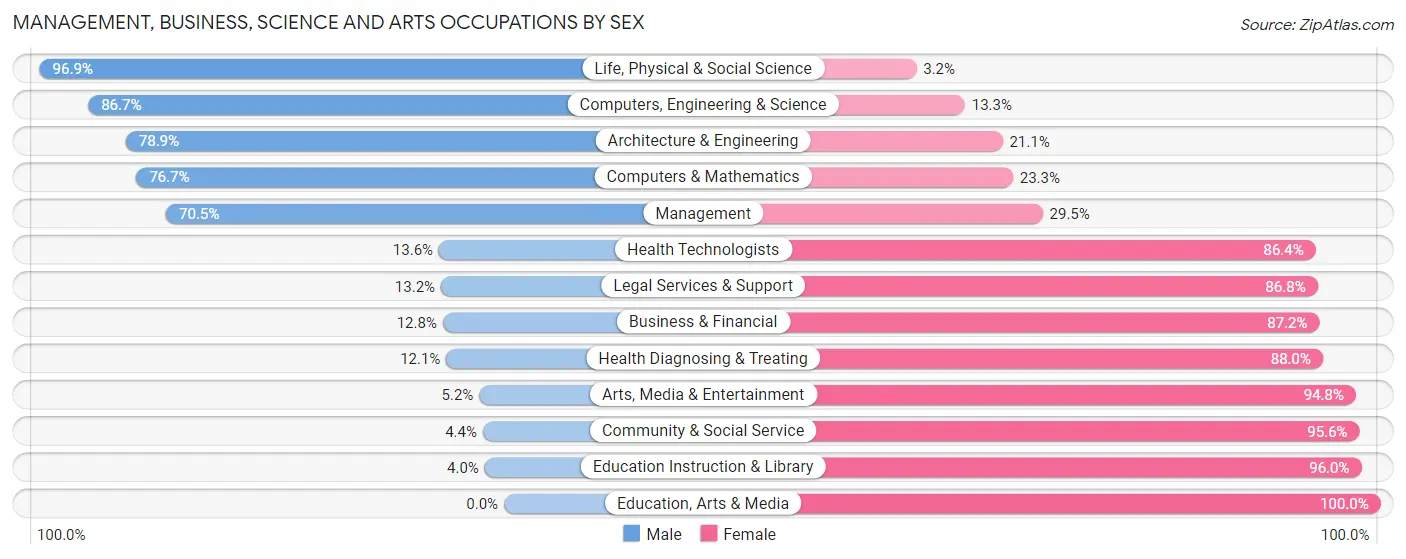
Management, Business, Science and Arts Occupations by Sex
Within the Management, Business, Science and Arts occupations in Pointe Coupee Parish, the most male-oriented occupations are Life, Physical & Social Science (96.9%), Computers, Engineering & Science (86.7%), and Architecture & Engineering (78.9%), while the most female-oriented occupations are Education, Arts & Media (100.0%), Education Instruction & Library (96.0%), and Community & Social Service (95.6%).
| Occupation | Male | Female |
| Management | 516 (70.5%) | 216 (29.5%) |
| Business & Financial | 36 (12.8%) | 246 (87.2%) |
| Computers, Engineering & Science | 235 (86.7%) | 36 (13.3%) |
| Computers & Mathematics | 56 (76.7%) | 17 (23.3%) |
| Architecture & Engineering | 56 (78.9%) | 15 (21.1%) |
| Life, Physical & Social Science | 123 (96.9%) | 4 (3.2%) |
| Community & Social Service | 41 (4.4%) | 887 (95.6%) |
| Education, Arts & Media | 0 (0.0%) | 97 (100.0%) |
| Legal Services & Support | 10 (13.2%) | 66 (86.8%) |
| Education Instruction & Library | 28 (4.0%) | 669 (96.0%) |
| Arts, Media & Entertainment | 3 (5.2%) | 55 (94.8%) |
| Health Diagnosing & Treating | 47 (12.0%) | 343 (87.9%) |
| Health Technologists | 35 (13.6%) | 223 (86.4%) |
| Total (Category) | 875 (33.6%) | 1,728 (66.4%) |
| Total (Overall) | 4,038 (49.2%) | 4,173 (50.8%) |
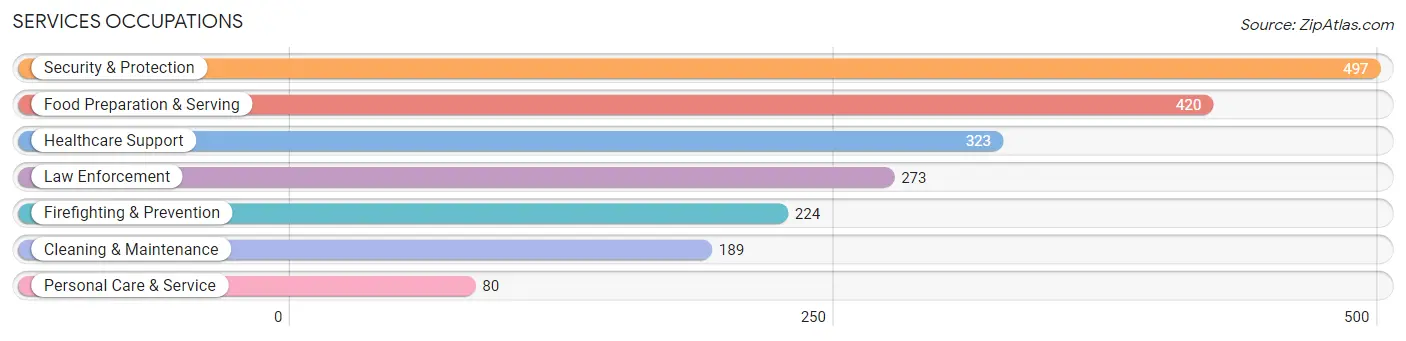
Services Occupations
The most common Services occupations in Pointe Coupee Parish are Security & Protection (497 | 6.0%), Food Preparation & Serving (420 | 5.1%), Healthcare Support (323 | 3.9%), Law Enforcement (273 | 3.3%), and Firefighting & Prevention (224 | 2.7%).
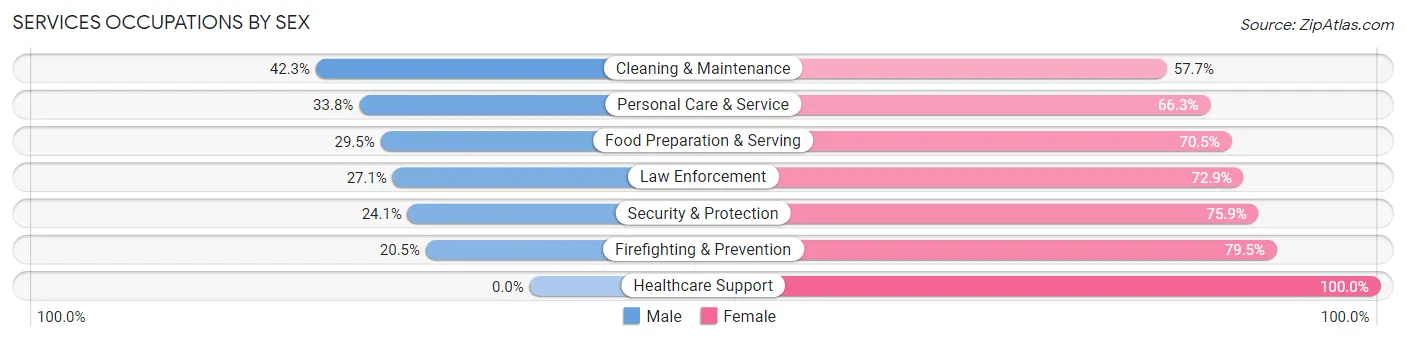
Services Occupations by Sex
Within the Services occupations in Pointe Coupee Parish, the most male-oriented occupations are Cleaning & Maintenance (42.3%), Personal Care & Service (33.8%), and Food Preparation & Serving (29.5%), while the most female-oriented occupations are Healthcare Support (100.0%), Firefighting & Prevention (79.5%), and Security & Protection (75.9%).
| Occupation | Male | Female |
| Healthcare Support | 0 (0.0%) | 323 (100.0%) |
| Security & Protection | 120 (24.1%) | 377 (75.9%) |
| Firefighting & Prevention | 46 (20.5%) | 178 (79.5%) |
| Law Enforcement | 74 (27.1%) | 199 (72.9%) |
| Food Preparation & Serving | 124 (29.5%) | 296 (70.5%) |
| Cleaning & Maintenance | 80 (42.3%) | 109 (57.7%) |
| Personal Care & Service | 27 (33.8%) | 53 (66.2%) |
| Total (Category) | 351 (23.3%) | 1,158 (76.7%) |
| Total (Overall) | 4,038 (49.2%) | 4,173 (50.8%) |
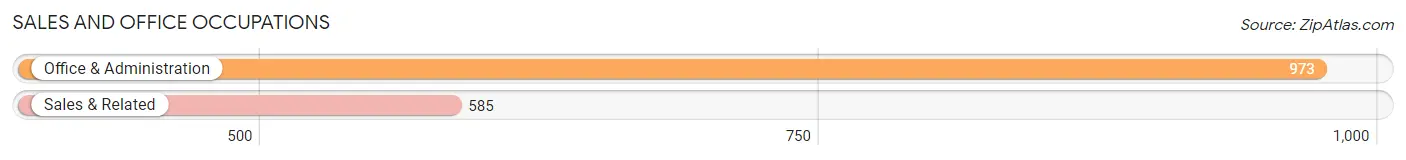
Sales and Office Occupations
The most common Sales and Office occupations in Pointe Coupee Parish are Office & Administration (973 | 11.8%), and Sales & Related (585 | 7.1%).
Sales and Office Occupations by Sex

| Occupation | Male | Female |
| Sales & Related | 164 (28.0%) | 421 (72.0%) |
| Office & Administration | 172 (17.7%) | 801 (82.3%) |
| Total (Category) | 336 (21.6%) | 1,222 (78.4%) |
| Total (Overall) | 4,038 (49.2%) | 4,173 (50.8%) |
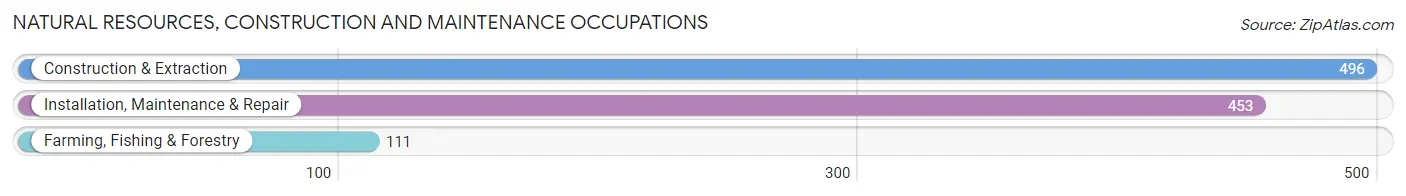
Natural Resources, Construction and Maintenance Occupations
The most common Natural Resources, Construction and Maintenance occupations in Pointe Coupee Parish are Construction & Extraction (496 | 6.0%), Installation, Maintenance & Repair (453 | 5.5%), and Farming, Fishing & Forestry (111 | 1.3%).
Natural Resources, Construction and Maintenance Occupations by Sex
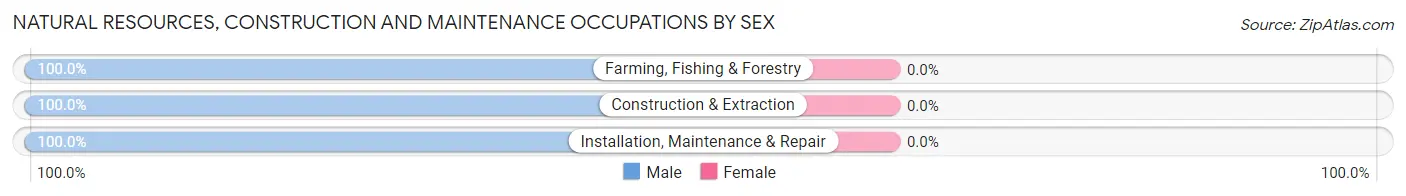
| Occupation | Male | Female |
| Farming, Fishing & Forestry | 111 (100.0%) | 0 (0.0%) |
| Construction & Extraction | 496 (100.0%) | 0 (0.0%) |
| Installation, Maintenance & Repair | 453 (100.0%) | 0 (0.0%) |
| Total (Category) | 1,060 (100.0%) | 0 (0.0%) |
| Total (Overall) | 4,038 (49.2%) | 4,173 (50.8%) |
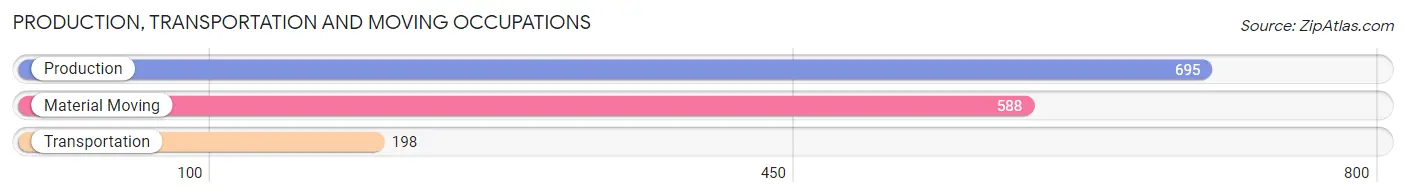
Production, Transportation and Moving Occupations
The most common Production, Transportation and Moving occupations in Pointe Coupee Parish are Production (695 | 8.5%), Material Moving (588 | 7.2%), and Transportation (198 | 2.4%).
Production, Transportation and Moving Occupations by Sex
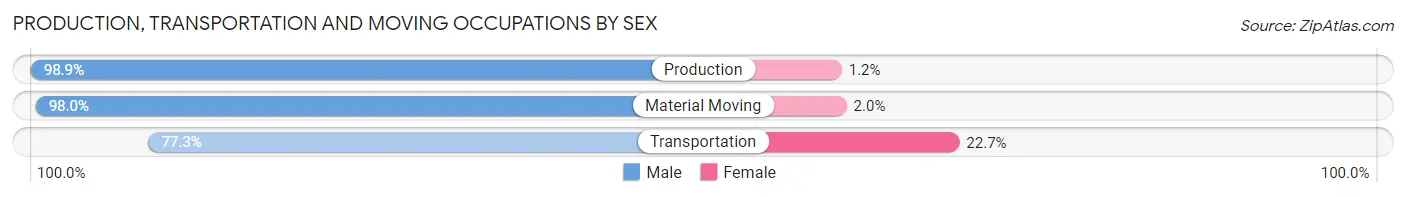
| Occupation | Male | Female |
| Production | 687 (98.9%) | 8 (1.1%) |
| Transportation | 153 (77.3%) | 45 (22.7%) |
| Material Moving | 576 (98.0%) | 12 (2.0%) |
| Total (Category) | 1,416 (95.6%) | 65 (4.4%) |
| Total (Overall) | 4,038 (49.2%) | 4,173 (50.8%) |
Employment Industries by Sex in Pointe Coupee Parish
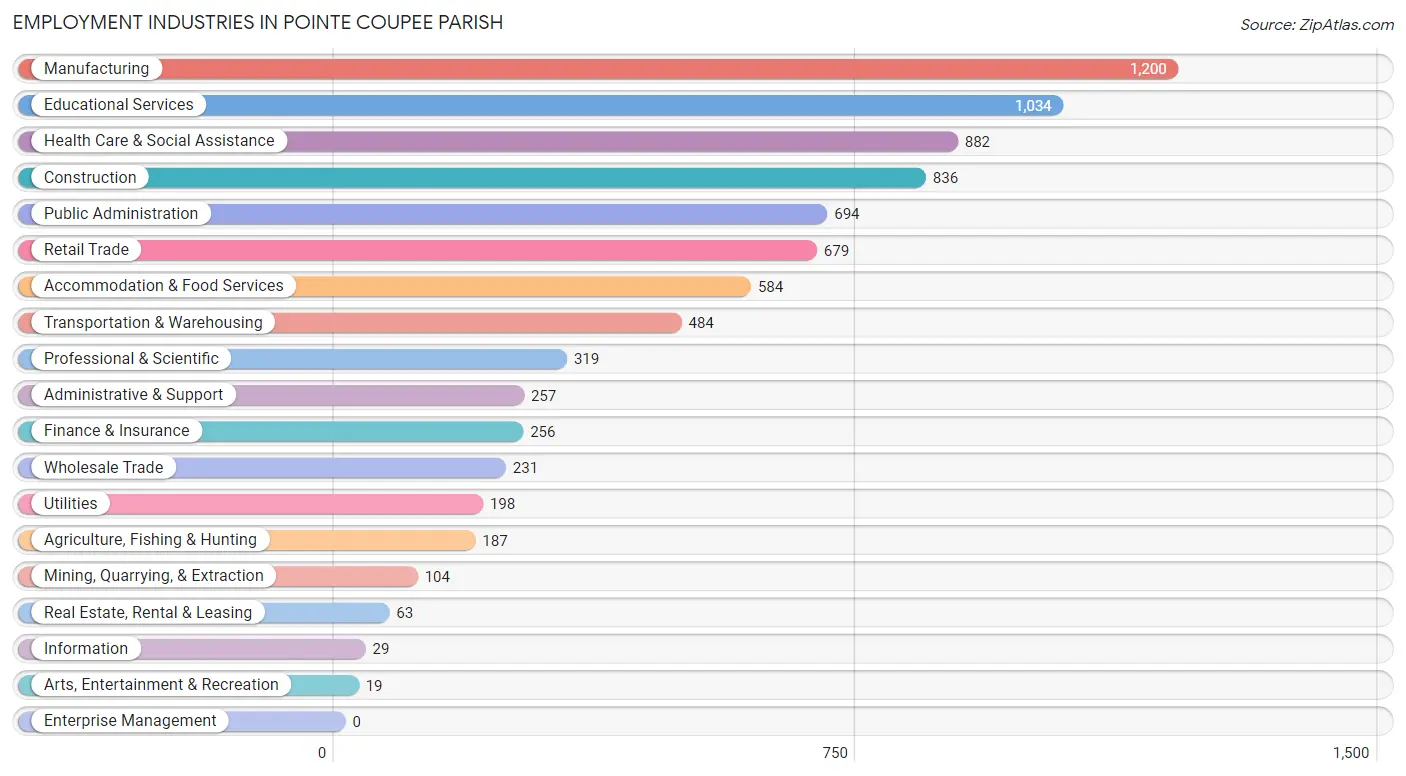
Employment Industries in Pointe Coupee Parish
The major employment industries in Pointe Coupee Parish include Manufacturing (1,200 | 14.6%), Educational Services (1,034 | 12.6%), Health Care & Social Assistance (882 | 10.7%), Construction (836 | 10.2%), and Public Administration (694 | 8.5%).
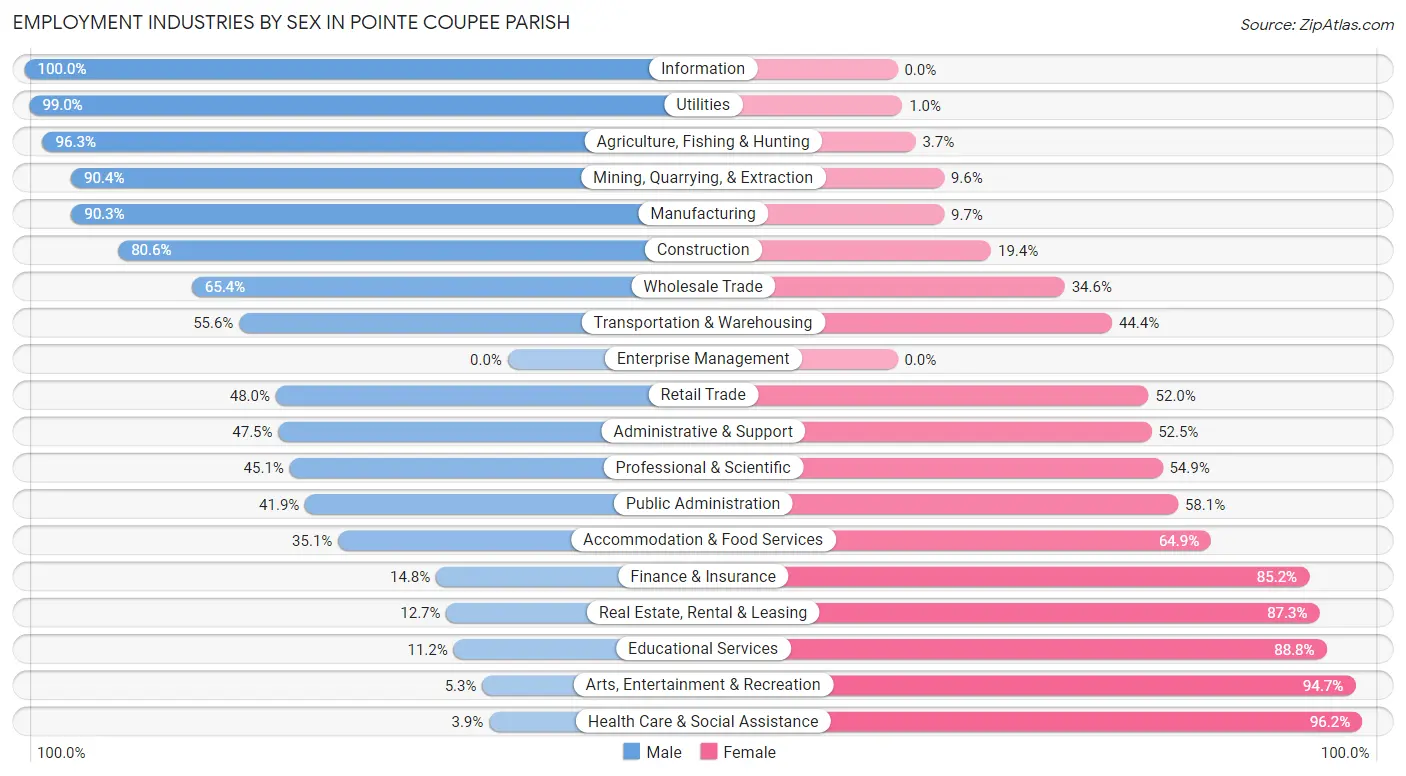
Employment Industries by Sex in Pointe Coupee Parish
The Pointe Coupee Parish industries that see more men than women are Information (100.0%), Utilities (99.0%), and Agriculture, Fishing & Hunting (96.3%), whereas the industries that tend to have a higher number of women are Health Care & Social Assistance (96.2%), Arts, Entertainment & Recreation (94.7%), and Educational Services (88.8%).
| Industry | Male | Female |
| Agriculture, Fishing & Hunting | 180 (96.3%) | 7 (3.7%) |
| Mining, Quarrying, & Extraction | 94 (90.4%) | 10 (9.6%) |
| Construction | 674 (80.6%) | 162 (19.4%) |
| Manufacturing | 1,084 (90.3%) | 116 (9.7%) |
| Wholesale Trade | 151 (65.4%) | 80 (34.6%) |
| Retail Trade | 326 (48.0%) | 353 (52.0%) |
| Transportation & Warehousing | 269 (55.6%) | 215 (44.4%) |
| Utilities | 196 (99.0%) | 2 (1.0%) |
| Information | 29 (100.0%) | 0 (0.0%) |
| Finance & Insurance | 38 (14.8%) | 218 (85.2%) |
| Real Estate, Rental & Leasing | 8 (12.7%) | 55 (87.3%) |
| Professional & Scientific | 144 (45.1%) | 175 (54.9%) |
| Enterprise Management | 0 (0.0%) | 0 (0.0%) |
| Administrative & Support | 122 (47.5%) | 135 (52.5%) |
| Educational Services | 116 (11.2%) | 918 (88.8%) |
| Health Care & Social Assistance | 34 (3.8%) | 848 (96.2%) |
| Arts, Entertainment & Recreation | 1 (5.3%) | 18 (94.7%) |
| Accommodation & Food Services | 205 (35.1%) | 379 (64.9%) |
| Public Administration | 291 (41.9%) | 403 (58.1%) |
| Total | 4,038 (49.2%) | 4,173 (50.8%) |
Education in Pointe Coupee Parish
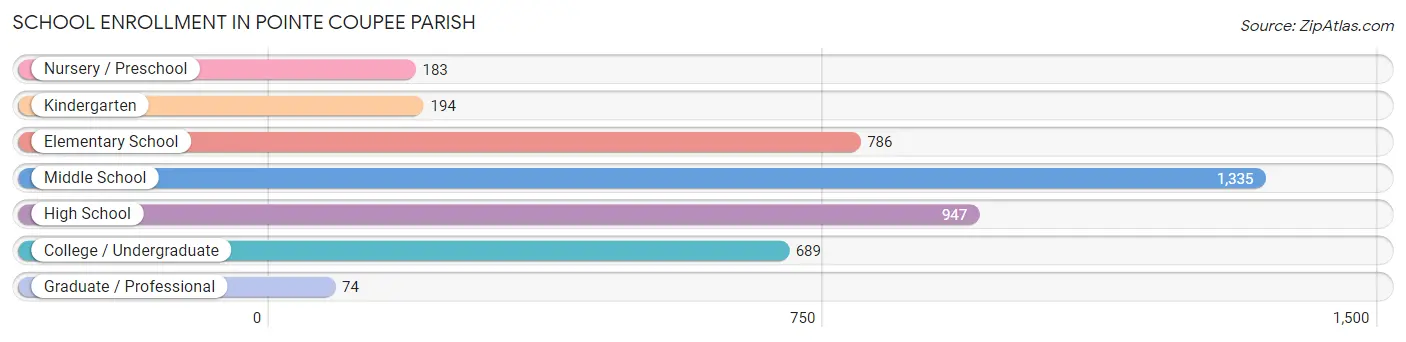
School Enrollment in Pointe Coupee Parish
The most common levels of schooling among the 4,208 students in Pointe Coupee Parish are middle school (1,335 | 31.7%), high school (947 | 22.5%), and elementary school (786 | 18.7%).
| School Level | # Students | % Students |
| Nursery / Preschool | 183 | 4.3% |
| Kindergarten | 194 | 4.6% |
| Elementary School | 786 | 18.7% |
| Middle School | 1,335 | 31.7% |
| High School | 947 | 22.5% |
| College / Undergraduate | 689 | 16.4% |
| Graduate / Professional | 74 | 1.8% |
| Total | 4,208 | 100.0% |
School Enrollment by Age by Funding Source in Pointe Coupee Parish
Out of a total of 4,208 students who are enrolled in schools in Pointe Coupee Parish, 1,342 (31.9%) attend a private institution, while the remaining 2,866 (68.1%) are enrolled in public schools. The age group of 20 to 24 year olds has the highest likelihood of being enrolled in private schools, with 123 (65.1% in the age bracket) enrolled. Conversely, the age group of 5 to 9 year old has the lowest likelihood of being enrolled in a private school, with 668 (76.7% in the age bracket) attending a public institution.
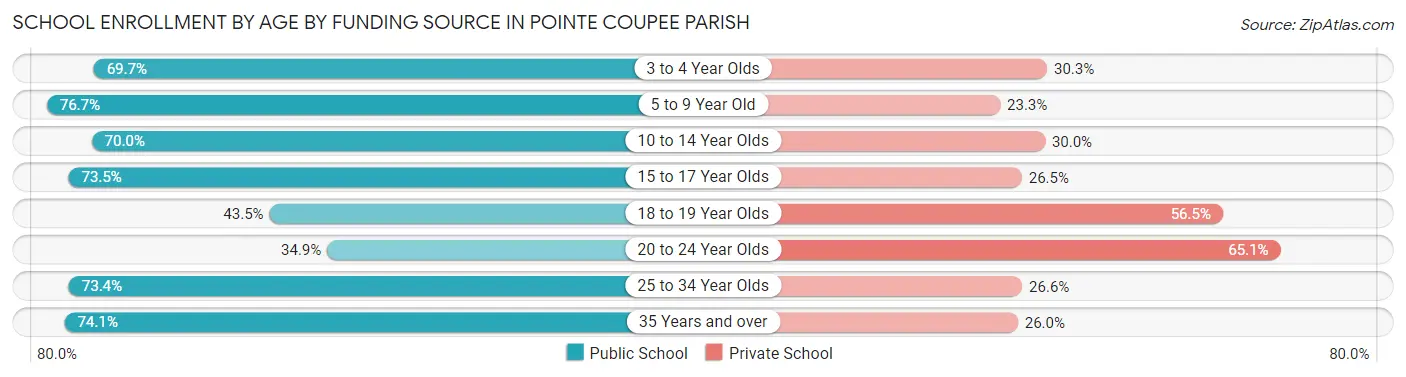
| Age Bracket | Public School | Private School |
| 3 to 4 Year Olds | 115 (69.7%) | 50 (30.3%) |
| 5 to 9 Year Old | 668 (76.7%) | 203 (23.3%) |
| 10 to 14 Year Olds | 1,046 (70.0%) | 448 (30.0%) |
| 15 to 17 Year Olds | 559 (73.5%) | 202 (26.5%) |
| 18 to 19 Year Olds | 178 (43.5%) | 231 (56.5%) |
| 20 to 24 Year Olds | 66 (34.9%) | 123 (65.1%) |
| 25 to 34 Year Olds | 138 (73.4%) | 50 (26.6%) |
| 35 Years and over | 97 (74.1%) | 34 (26.0%) |
| Total | 2,866 (68.1%) | 1,342 (31.9%) |
Educational Attainment by Field of Study in Pointe Coupee Parish
Education (456 | 20.2%), business (369 | 16.4%), science & technology (241 | 10.7%), computers & mathematics (214 | 9.5%), and liberal arts & history (203 | 9.0%) are the most common fields of study among 2,256 individuals in Pointe Coupee Parish who have obtained a bachelor's degree or higher.
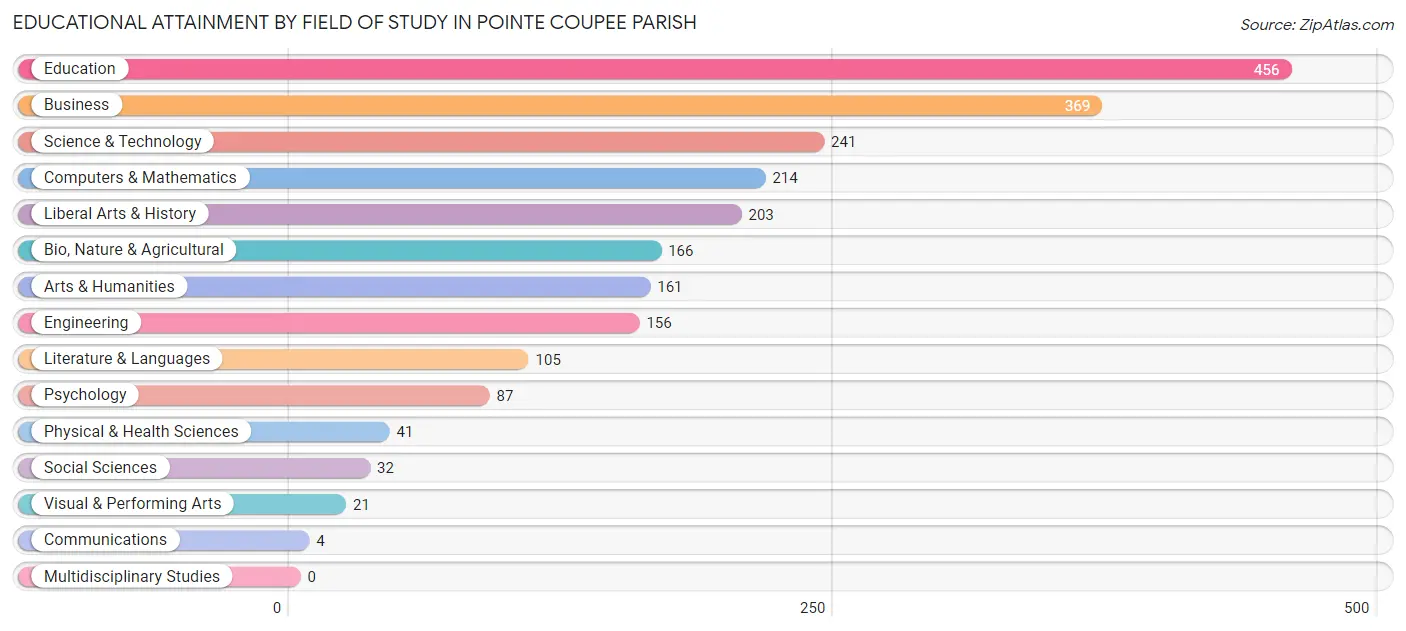
| Field of Study | # Graduates | % Graduates |
| Computers & Mathematics | 214 | 9.5% |
| Bio, Nature & Agricultural | 166 | 7.4% |
| Physical & Health Sciences | 41 | 1.8% |
| Psychology | 87 | 3.9% |
| Social Sciences | 32 | 1.4% |
| Engineering | 156 | 6.9% |
| Multidisciplinary Studies | 0 | 0.0% |
| Science & Technology | 241 | 10.7% |
| Business | 369 | 16.4% |
| Education | 456 | 20.2% |
| Literature & Languages | 105 | 4.6% |
| Liberal Arts & History | 203 | 9.0% |
| Visual & Performing Arts | 21 | 0.9% |
| Communications | 4 | 0.2% |
| Arts & Humanities | 161 | 7.1% |
| Total | 2,256 | 100.0% |
Transportation & Commute in Pointe Coupee Parish
Vehicle Availability by Sex in Pointe Coupee Parish
The most prevalent vehicle ownership categories in Pointe Coupee Parish are males with 2 vehicles (2,178, accounting for 55.3%) and females with 2 vehicles (1,889, making up 55.9%).
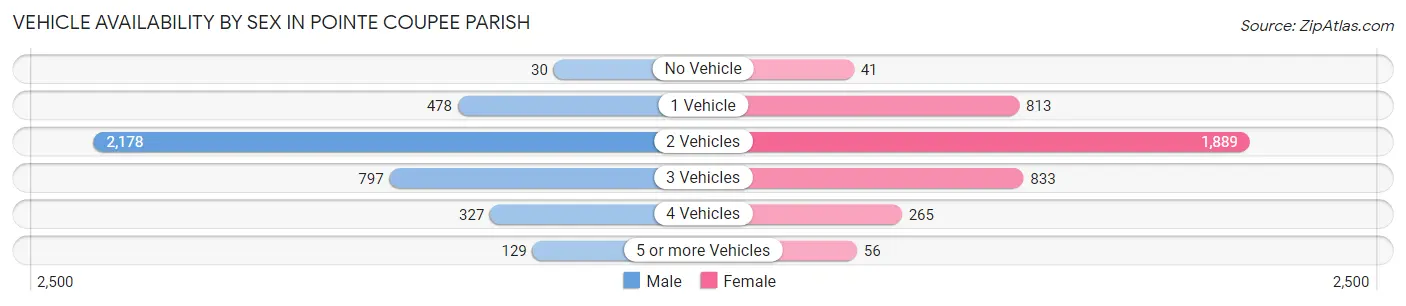
| Vehicles Available | Male | Female |
| No Vehicle | 30 (0.8%) | 41 (1.1%) |
| 1 Vehicle | 478 (12.1%) | 813 (20.9%) |
| 2 Vehicles | 2,178 (55.3%) | 1,889 (48.5%) |
| 3 Vehicles | 797 (20.2%) | 833 (21.4%) |
| 4 Vehicles | 327 (8.3%) | 265 (6.8%) |
| 5 or more Vehicles | 129 (3.3%) | 56 (1.4%) |
| Total | 3,939 (100.0%) | 3,897 (100.0%) |
Commute Time in Pointe Coupee Parish
The most frequently occuring commute durations in Pointe Coupee Parish are 45 to 59 minutes (1,341 commuters, 17.3%), 15 to 19 minutes (1,006 commuters, 13.0%), and 5 to 9 minutes (890 commuters, 11.5%).
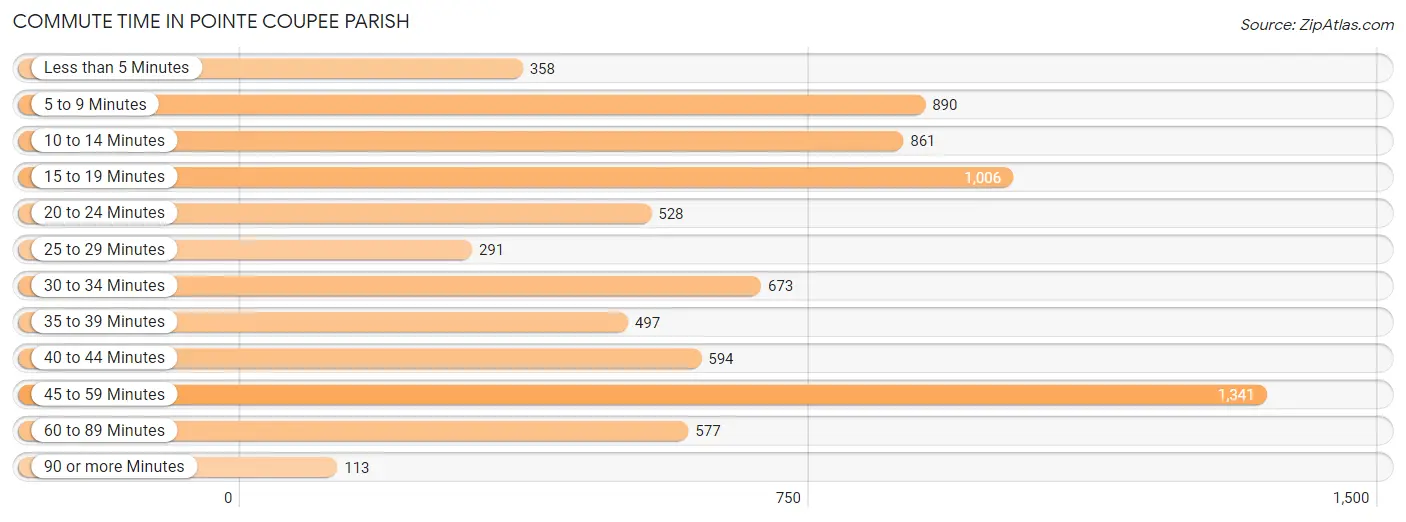
| Commute Time | # Commuters | % Commuters |
| Less than 5 Minutes | 358 | 4.6% |
| 5 to 9 Minutes | 890 | 11.5% |
| 10 to 14 Minutes | 861 | 11.1% |
| 15 to 19 Minutes | 1,006 | 13.0% |
| 20 to 24 Minutes | 528 | 6.8% |
| 25 to 29 Minutes | 291 | 3.8% |
| 30 to 34 Minutes | 673 | 8.7% |
| 35 to 39 Minutes | 497 | 6.4% |
| 40 to 44 Minutes | 594 | 7.7% |
| 45 to 59 Minutes | 1,341 | 17.3% |
| 60 to 89 Minutes | 577 | 7.5% |
| 90 or more Minutes | 113 | 1.5% |
Commute Time by Sex in Pointe Coupee Parish
The most common commute times in Pointe Coupee Parish are 30 to 34 minutes (479 commuters, 12.3%) for males and 45 to 59 minutes (921 commuters, 24.0%) for females.
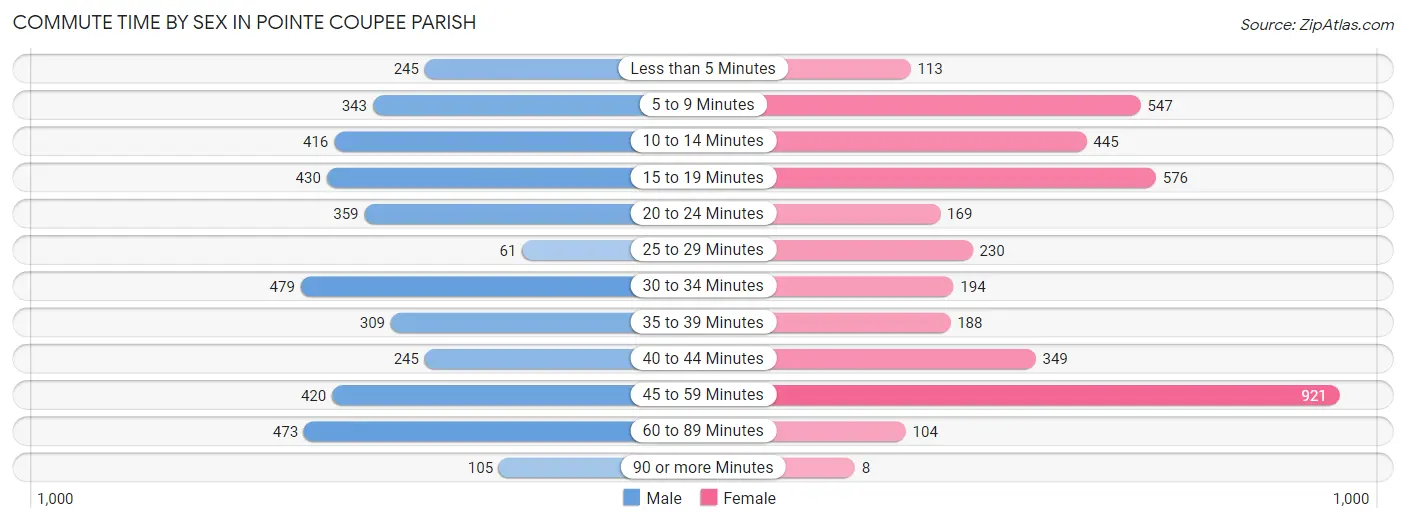
| Commute Time | Male | Female |
| Less than 5 Minutes | 245 (6.3%) | 113 (2.9%) |
| 5 to 9 Minutes | 343 (8.8%) | 547 (14.2%) |
| 10 to 14 Minutes | 416 (10.7%) | 445 (11.6%) |
| 15 to 19 Minutes | 430 (11.1%) | 576 (15.0%) |
| 20 to 24 Minutes | 359 (9.2%) | 169 (4.4%) |
| 25 to 29 Minutes | 61 (1.6%) | 230 (6.0%) |
| 30 to 34 Minutes | 479 (12.3%) | 194 (5.1%) |
| 35 to 39 Minutes | 309 (8.0%) | 188 (4.9%) |
| 40 to 44 Minutes | 245 (6.3%) | 349 (9.1%) |
| 45 to 59 Minutes | 420 (10.8%) | 921 (24.0%) |
| 60 to 89 Minutes | 473 (12.2%) | 104 (2.7%) |
| 90 or more Minutes | 105 (2.7%) | 8 (0.2%) |
Time of Departure to Work by Sex in Pointe Coupee Parish
The most frequent times of departure to work in Pointe Coupee Parish are 6:00 AM to 6:29 AM (652, 16.8%) for males and 6:00 AM to 6:29 AM (667, 17.3%) for females.

| Time of Departure | Male | Female |
| 12:00 AM to 4:59 AM | 628 (16.2%) | 274 (7.1%) |
| 5:00 AM to 5:29 AM | 493 (12.7%) | 73 (1.9%) |
| 5:30 AM to 5:59 AM | 365 (9.4%) | 246 (6.4%) |
| 6:00 AM to 6:29 AM | 652 (16.8%) | 667 (17.3%) |
| 6:30 AM to 6:59 AM | 549 (14.1%) | 475 (12.4%) |
| 7:00 AM to 7:29 AM | 384 (9.9%) | 647 (16.8%) |
| 7:30 AM to 7:59 AM | 171 (4.4%) | 387 (10.1%) |
| 8:00 AM to 8:29 AM | 226 (5.8%) | 252 (6.6%) |
| 8:30 AM to 8:59 AM | 80 (2.1%) | 128 (3.3%) |
| 9:00 AM to 9:59 AM | 148 (3.8%) | 95 (2.5%) |
| 10:00 AM to 10:59 AM | 11 (0.3%) | 31 (0.8%) |
| 11:00 AM to 11:59 AM | 0 (0.0%) | 73 (1.9%) |
| 12:00 PM to 3:59 PM | 62 (1.6%) | 196 (5.1%) |
| 4:00 PM to 11:59 PM | 116 (3.0%) | 300 (7.8%) |
| Total | 3,885 (100.0%) | 3,844 (100.0%) |
Housing Occupancy in Pointe Coupee Parish
Occupancy by Ownership in Pointe Coupee Parish
Of the total 8,203 dwellings in Pointe Coupee Parish, owner-occupied units account for 6,346 (77.4%), while renter-occupied units make up 1,857 (22.6%).
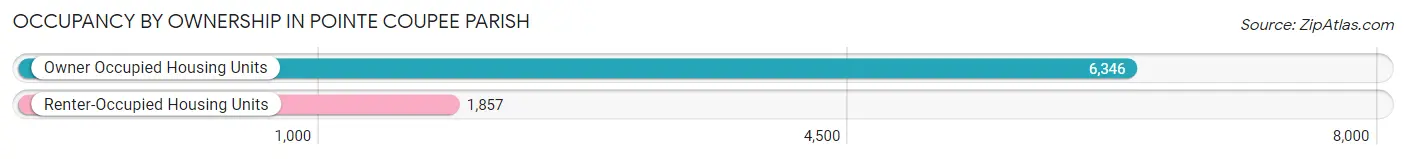
| Occupancy | # Housing Units | % Housing Units |
| Owner Occupied Housing Units | 6,346 | 77.4% |
| Renter-Occupied Housing Units | 1,857 | 22.6% |
| Total Occupied Housing Units | 8,203 | 100.0% |
Occupancy by Household Size in Pointe Coupee Parish
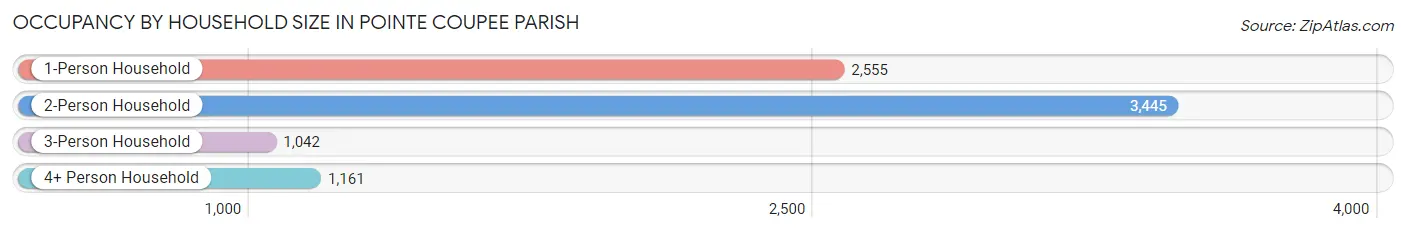
| Household Size | # Housing Units | % Housing Units |
| 1-Person Household | 2,555 | 31.1% |
| 2-Person Household | 3,445 | 42.0% |
| 3-Person Household | 1,042 | 12.7% |
| 4+ Person Household | 1,161 | 14.1% |
| Total Housing Units | 8,203 | 100.0% |
Occupancy by Ownership by Household Size in Pointe Coupee Parish
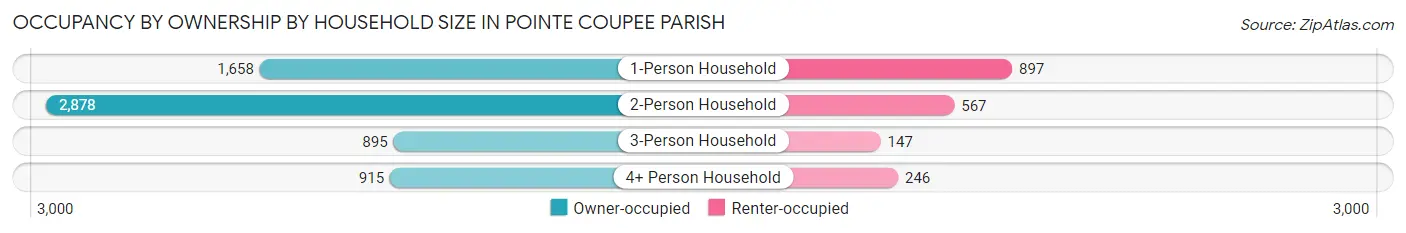
| Household Size | Owner-occupied | Renter-occupied |
| 1-Person Household | 1,658 (64.9%) | 897 (35.1%) |
| 2-Person Household | 2,878 (83.5%) | 567 (16.5%) |
| 3-Person Household | 895 (85.9%) | 147 (14.1%) |
| 4+ Person Household | 915 (78.8%) | 246 (21.2%) |
| Total Housing Units | 6,346 (77.4%) | 1,857 (22.6%) |
Occupancy by Educational Attainment in Pointe Coupee Parish
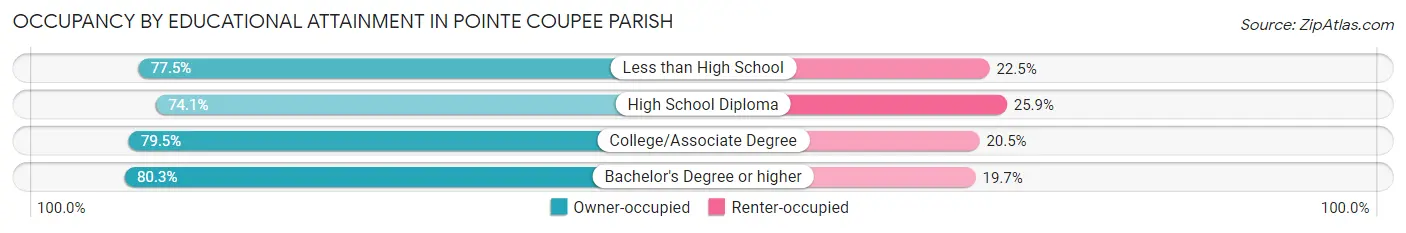
| Household Size | Owner-occupied | Renter-occupied |
| Less than High School | 966 (77.5%) | 280 (22.5%) |
| High School Diploma | 2,217 (74.1%) | 775 (25.9%) |
| College/Associate Degree | 2,112 (79.5%) | 544 (20.5%) |
| Bachelor's Degree or higher | 1,051 (80.3%) | 258 (19.7%) |
Occupancy by Age of Householder in Pointe Coupee Parish
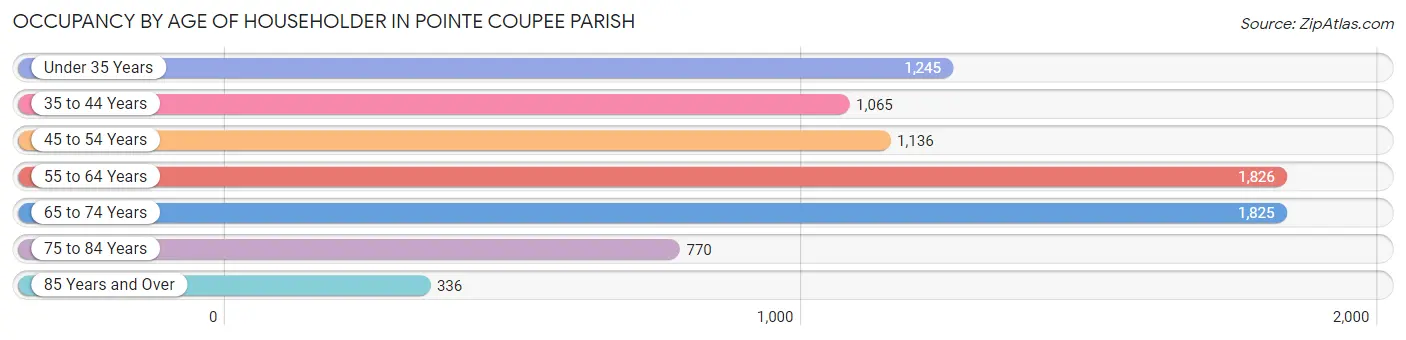
| Age Bracket | # Households | % Households |
| Under 35 Years | 1,245 | 15.2% |
| 35 to 44 Years | 1,065 | 13.0% |
| 45 to 54 Years | 1,136 | 13.9% |
| 55 to 64 Years | 1,826 | 22.3% |
| 65 to 74 Years | 1,825 | 22.3% |
| 75 to 84 Years | 770 | 9.4% |
| 85 Years and Over | 336 | 4.1% |
| Total | 8,203 | 100.0% |
Housing Finances in Pointe Coupee Parish
Median Income by Occupancy in Pointe Coupee Parish
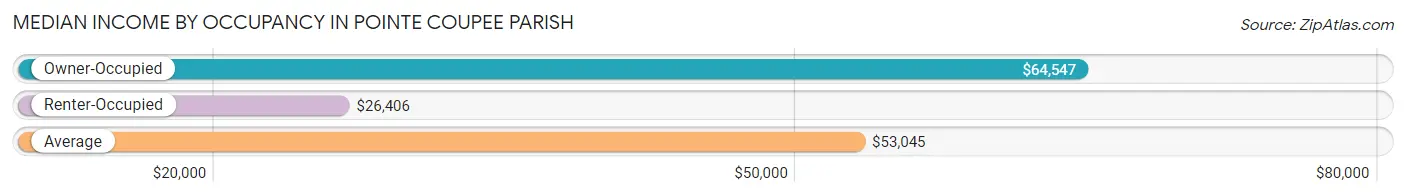
| Occupancy Type | # Households | Median Income |
| Owner-Occupied | 6,346 (77.4%) | $64,547 |
| Renter-Occupied | 1,857 (22.6%) | $26,406 |
| Average | 8,203 (100.0%) | $53,045 |
Occupancy by Householder Income Bracket in Pointe Coupee Parish
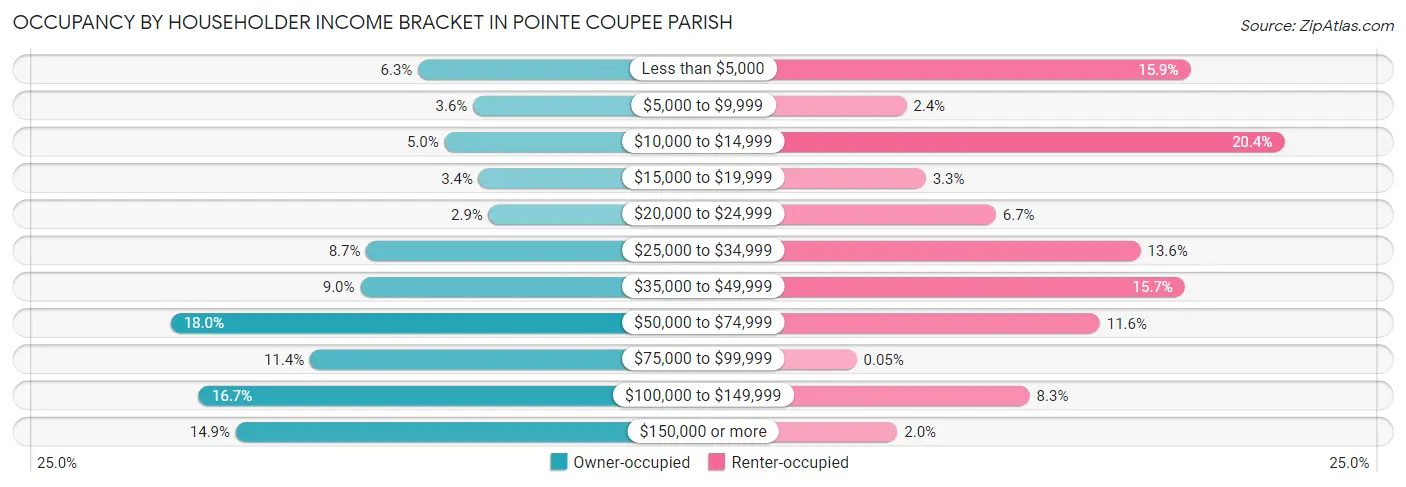
| Income Bracket | Owner-occupied | Renter-occupied |
| Less than $5,000 | 397 (6.3%) | 296 (15.9%) |
| $5,000 to $9,999 | 231 (3.6%) | 45 (2.4%) |
| $10,000 to $14,999 | 317 (5.0%) | 379 (20.4%) |
| $15,000 to $19,999 | 214 (3.4%) | 62 (3.3%) |
| $20,000 to $24,999 | 184 (2.9%) | 124 (6.7%) |
| $25,000 to $34,999 | 554 (8.7%) | 252 (13.6%) |
| $35,000 to $49,999 | 572 (9.0%) | 291 (15.7%) |
| $50,000 to $74,999 | 1,145 (18.0%) | 216 (11.6%) |
| $75,000 to $99,999 | 724 (11.4%) | 1 (0.1%) |
| $100,000 to $149,999 | 1,060 (16.7%) | 154 (8.3%) |
| $150,000 or more | 948 (14.9%) | 37 (2.0%) |
| Total | 6,346 (100.0%) | 1,857 (100.0%) |
Monthly Housing Cost Tiers in Pointe Coupee Parish
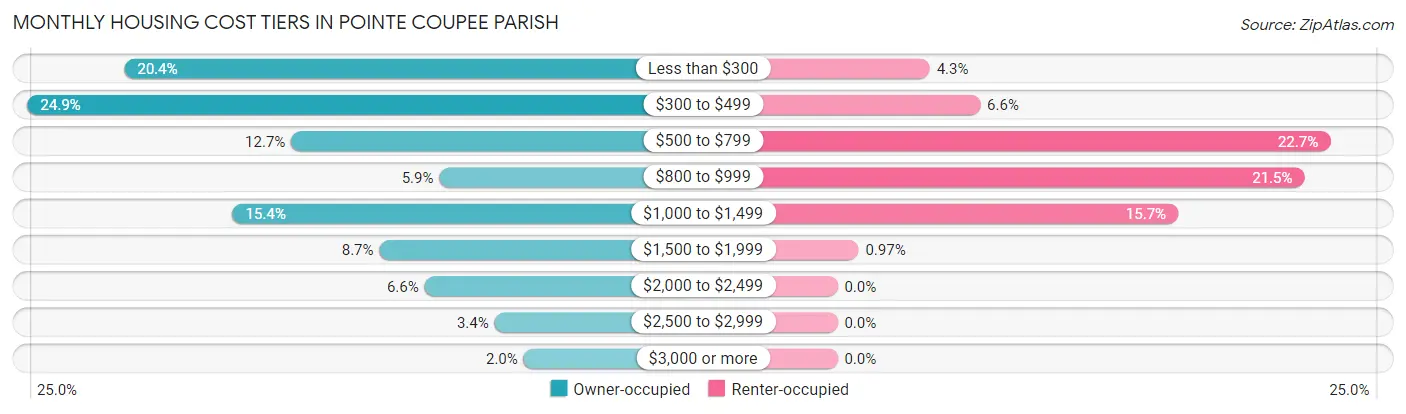
| Monthly Cost | Owner-occupied | Renter-occupied |
| Less than $300 | 1,295 (20.4%) | 79 (4.3%) |
| $300 to $499 | 1,578 (24.9%) | 122 (6.6%) |
| $500 to $799 | 808 (12.7%) | 421 (22.7%) |
| $800 to $999 | 375 (5.9%) | 399 (21.5%) |
| $1,000 to $1,499 | 979 (15.4%) | 291 (15.7%) |
| $1,500 to $1,999 | 550 (8.7%) | 18 (1.0%) |
| $2,000 to $2,499 | 418 (6.6%) | 0 (0.0%) |
| $2,500 to $2,999 | 214 (3.4%) | 0 (0.0%) |
| $3,000 or more | 129 (2.0%) | 0 (0.0%) |
| Total | 6,346 (100.0%) | 1,857 (100.0%) |
Physical Housing Characteristics in Pointe Coupee Parish
Housing Structures in Pointe Coupee Parish
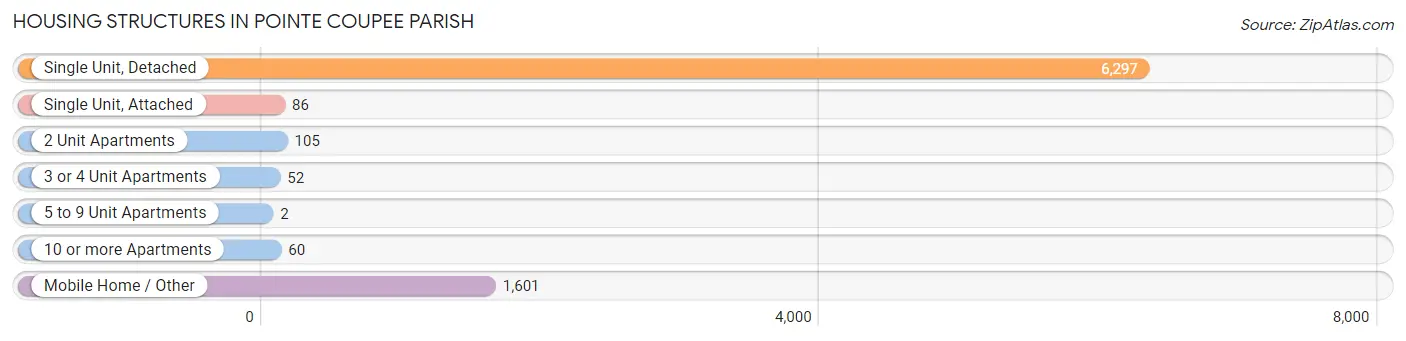
| Structure Type | # Housing Units | % Housing Units |
| Single Unit, Detached | 6,297 | 76.8% |
| Single Unit, Attached | 86 | 1.1% |
| 2 Unit Apartments | 105 | 1.3% |
| 3 or 4 Unit Apartments | 52 | 0.6% |
| 5 to 9 Unit Apartments | 2 | 0.0% |
| 10 or more Apartments | 60 | 0.7% |
| Mobile Home / Other | 1,601 | 19.5% |
| Total | 8,203 | 100.0% |
Housing Structures by Occupancy in Pointe Coupee Parish
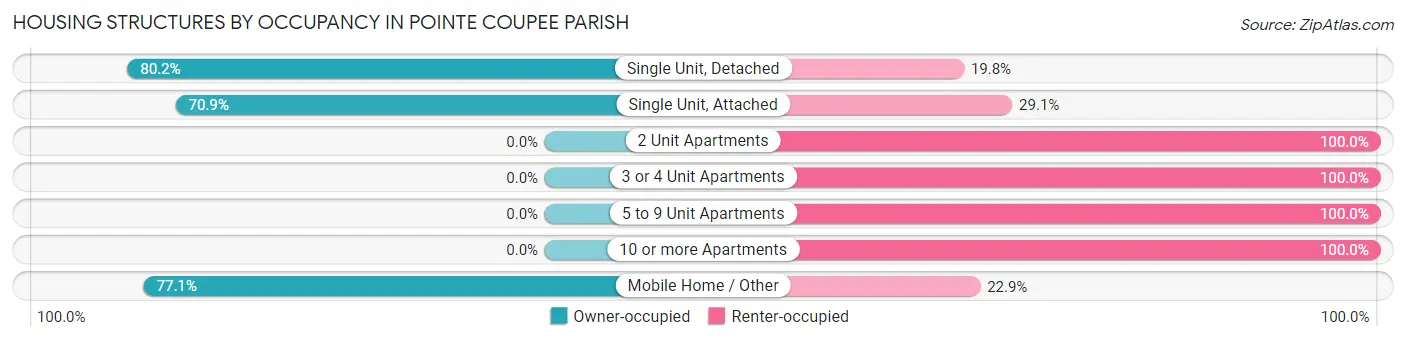
| Structure Type | Owner-occupied | Renter-occupied |
| Single Unit, Detached | 5,051 (80.2%) | 1,246 (19.8%) |
| Single Unit, Attached | 61 (70.9%) | 25 (29.1%) |
| 2 Unit Apartments | 0 (0.0%) | 105 (100.0%) |
| 3 or 4 Unit Apartments | 0 (0.0%) | 52 (100.0%) |
| 5 to 9 Unit Apartments | 0 (0.0%) | 2 (100.0%) |
| 10 or more Apartments | 0 (0.0%) | 60 (100.0%) |
| Mobile Home / Other | 1,234 (77.1%) | 367 (22.9%) |
| Total | 6,346 (77.4%) | 1,857 (22.6%) |
Housing Structures by Number of Rooms in Pointe Coupee Parish
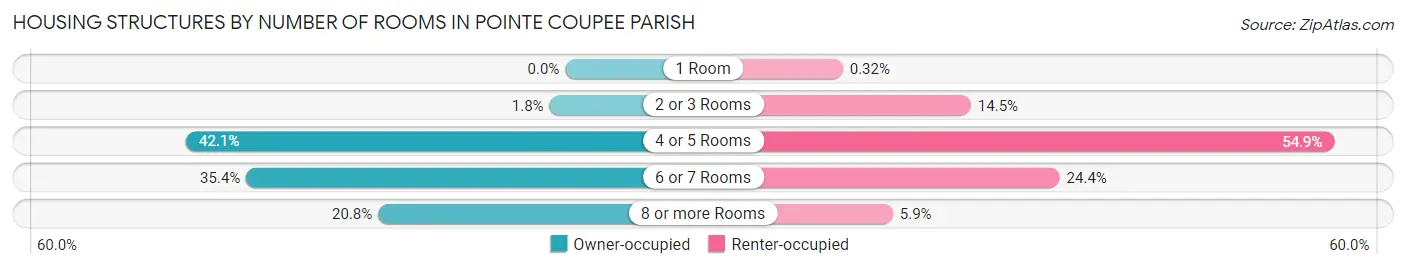
| Number of Rooms | Owner-occupied | Renter-occupied |
| 1 Room | 0 (0.0%) | 6 (0.3%) |
| 2 or 3 Rooms | 111 (1.8%) | 270 (14.5%) |
| 4 or 5 Rooms | 2,670 (42.1%) | 1,019 (54.9%) |
| 6 or 7 Rooms | 2,247 (35.4%) | 453 (24.4%) |
| 8 or more Rooms | 1,318 (20.8%) | 109 (5.9%) |
| Total | 6,346 (100.0%) | 1,857 (100.0%) |
Housing Structure by Heating Type in Pointe Coupee Parish
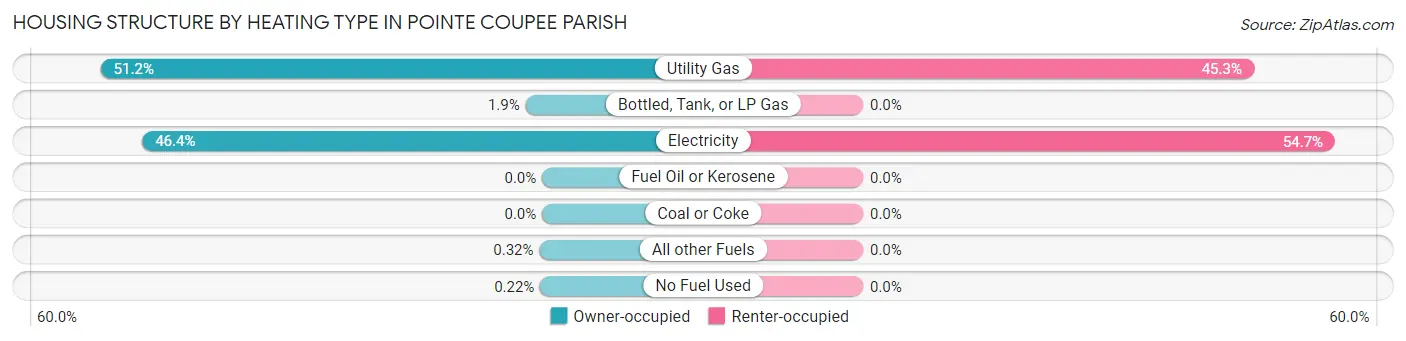
| Heating Type | Owner-occupied | Renter-occupied |
| Utility Gas | 3,248 (51.2%) | 841 (45.3%) |
| Bottled, Tank, or LP Gas | 122 (1.9%) | 0 (0.0%) |
| Electricity | 2,942 (46.4%) | 1,016 (54.7%) |
| Fuel Oil or Kerosene | 0 (0.0%) | 0 (0.0%) |
| Coal or Coke | 0 (0.0%) | 0 (0.0%) |
| All other Fuels | 20 (0.3%) | 0 (0.0%) |
| No Fuel Used | 14 (0.2%) | 0 (0.0%) |
| Total | 6,346 (100.0%) | 1,857 (100.0%) |
Household Vehicle Usage in Pointe Coupee Parish
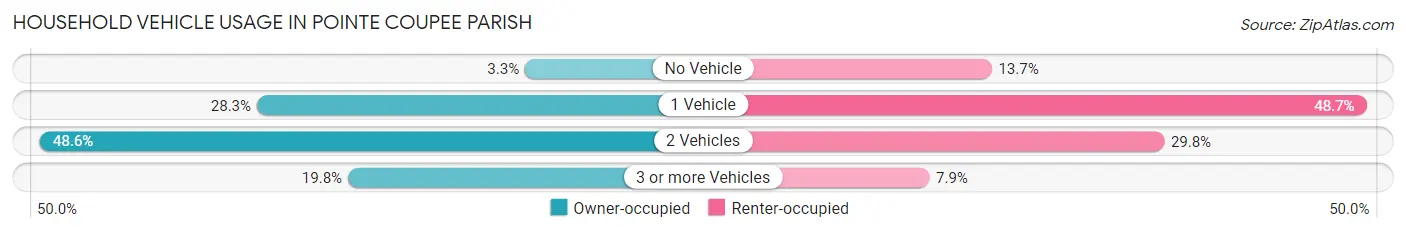
| Vehicles per Household | Owner-occupied | Renter-occupied |
| No Vehicle | 209 (3.3%) | 254 (13.7%) |
| 1 Vehicle | 1,797 (28.3%) | 904 (48.7%) |
| 2 Vehicles | 3,082 (48.6%) | 553 (29.8%) |
| 3 or more Vehicles | 1,258 (19.8%) | 146 (7.9%) |
| Total | 6,346 (100.0%) | 1,857 (100.0%) |
Real Estate & Mortgages in Pointe Coupee Parish
Real Estate and Mortgage Overview in Pointe Coupee Parish
| Characteristic | Without Mortgage | With Mortgage |
| Housing Units | 3,636 | 2,710 |
| Median Property Value | $120,100 | $228,600 |
| Median Household Income | $47,948 | $653 |
| Monthly Housing Costs | $366 | $119 |
| Real Estate Taxes | $375 | $252 |
Property Value by Mortgage Status in Pointe Coupee Parish
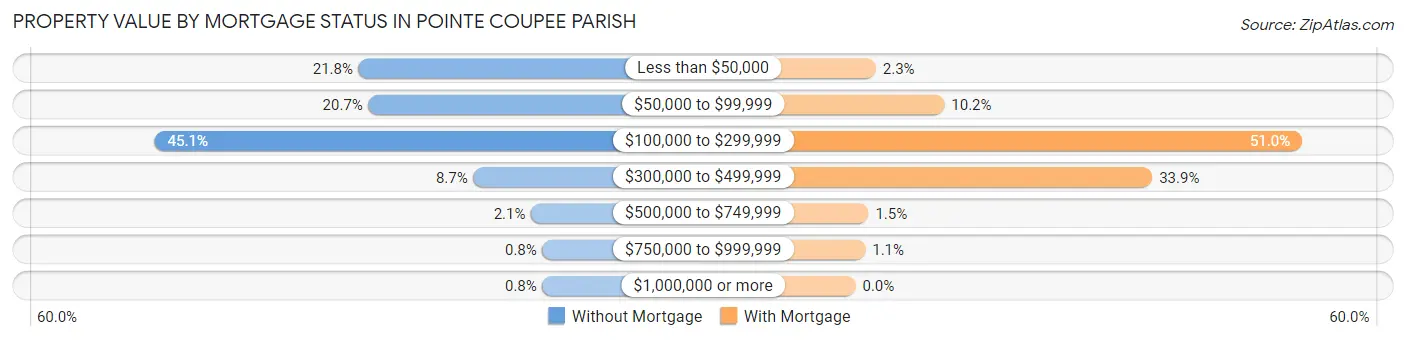
| Property Value | Without Mortgage | With Mortgage |
| Less than $50,000 | 793 (21.8%) | 63 (2.3%) |
| $50,000 to $99,999 | 752 (20.7%) | 275 (10.2%) |
| $100,000 to $299,999 | 1,641 (45.1%) | 1,383 (51.0%) |
| $300,000 to $499,999 | 316 (8.7%) | 919 (33.9%) |
| $500,000 to $749,999 | 76 (2.1%) | 40 (1.5%) |
| $750,000 to $999,999 | 29 (0.8%) | 30 (1.1%) |
| $1,000,000 or more | 29 (0.8%) | 0 (0.0%) |
| Total | 3,636 (100.0%) | 2,710 (100.0%) |
Household Income by Mortgage Status in Pointe Coupee Parish
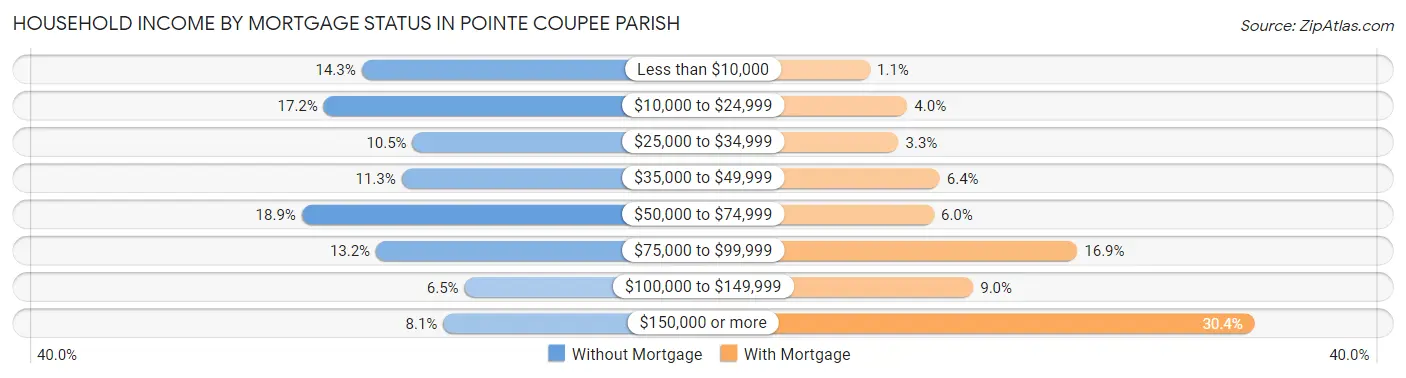
| Household Income | Without Mortgage | With Mortgage |
| Less than $10,000 | 521 (14.3%) | 30 (1.1%) |
| $10,000 to $24,999 | 626 (17.2%) | 107 (4.0%) |
| $25,000 to $34,999 | 380 (10.4%) | 89 (3.3%) |
| $35,000 to $49,999 | 410 (11.3%) | 174 (6.4%) |
| $50,000 to $74,999 | 687 (18.9%) | 162 (6.0%) |
| $75,000 to $99,999 | 481 (13.2%) | 458 (16.9%) |
| $100,000 to $149,999 | 236 (6.5%) | 243 (9.0%) |
| $150,000 or more | 295 (8.1%) | 824 (30.4%) |
| Total | 3,636 (100.0%) | 2,710 (100.0%) |
Property Value to Household Income Ratio in Pointe Coupee Parish
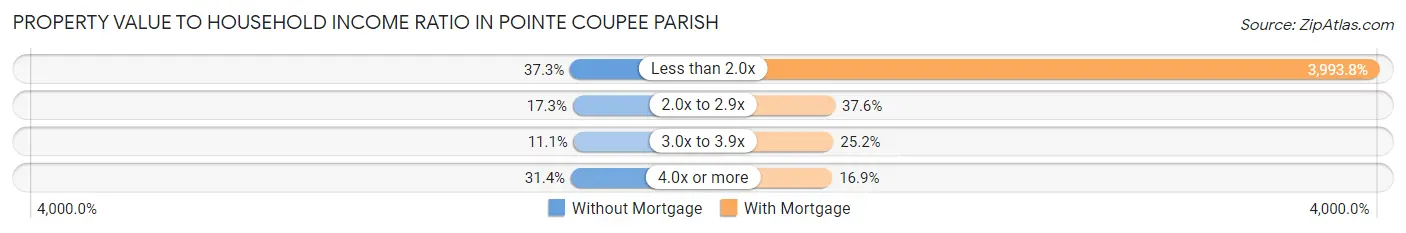
| Value-to-Income Ratio | Without Mortgage | With Mortgage |
| Less than 2.0x | 1,356 (37.3%) | 108,232 (3,993.8%) |
| 2.0x to 2.9x | 630 (17.3%) | 1,020 (37.6%) |
| 3.0x to 3.9x | 403 (11.1%) | 684 (25.2%) |
| 4.0x or more | 1,141 (31.4%) | 459 (16.9%) |
| Total | 3,636 (100.0%) | 2,710 (100.0%) |
Real Estate Taxes by Mortgage Status in Pointe Coupee Parish
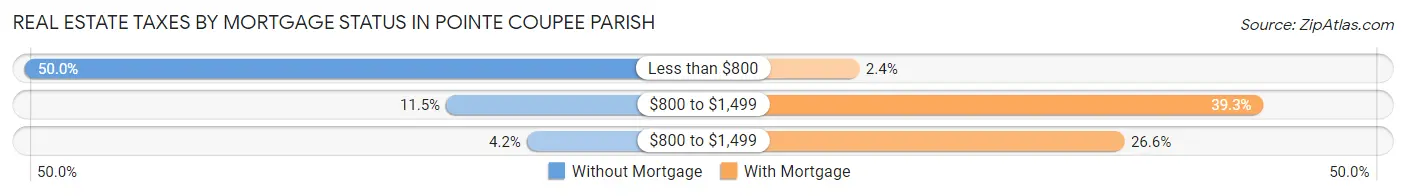
| Property Taxes | Without Mortgage | With Mortgage |
| Less than $800 | 1,817 (50.0%) | 64 (2.4%) |
| $800 to $1,499 | 419 (11.5%) | 1,065 (39.3%) |
| $800 to $1,499 | 151 (4.2%) | 720 (26.6%) |
| Total | 3,636 (100.0%) | 2,710 (100.0%) |
Health & Disability in Pointe Coupee Parish
Health Insurance Coverage by Age in Pointe Coupee Parish
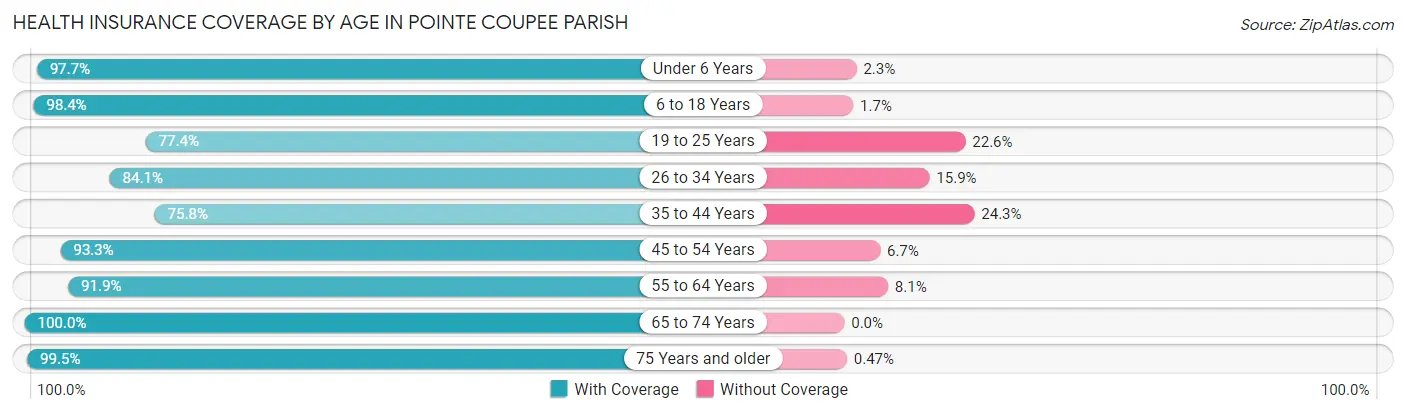
| Age Bracket | With Coverage | Without Coverage |
| Under 6 Years | 1,292 (97.7%) | 30 (2.3%) |
| 6 to 18 Years | 3,228 (98.4%) | 54 (1.7%) |
| 19 to 25 Years | 1,337 (77.4%) | 390 (22.6%) |
| 26 to 34 Years | 1,733 (84.1%) | 327 (15.9%) |
| 35 to 44 Years | 1,771 (75.7%) | 567 (24.2%) |
| 45 to 54 Years | 2,171 (93.3%) | 155 (6.7%) |
| 55 to 64 Years | 2,904 (91.9%) | 257 (8.1%) |
| 65 to 74 Years | 2,611 (100.0%) | 0 (0.0%) |
| 75 Years and older | 1,687 (99.5%) | 8 (0.5%) |
| Total | 18,734 (91.3%) | 1,788 (8.7%) |
Health Insurance Coverage by Citizenship Status in Pointe Coupee Parish
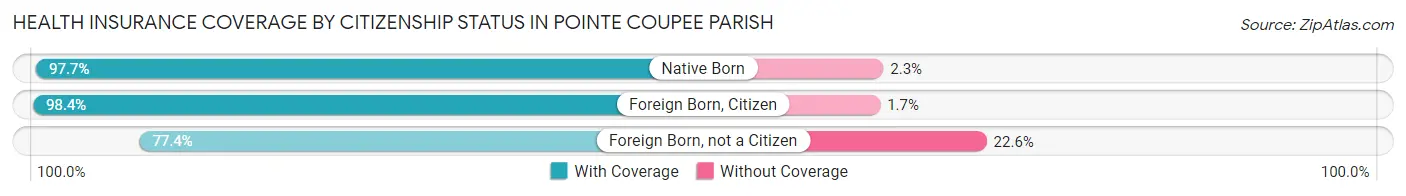
| Citizenship Status | With Coverage | Without Coverage |
| Native Born | 1,292 (97.7%) | 30 (2.3%) |
| Foreign Born, Citizen | 3,228 (98.4%) | 54 (1.7%) |
| Foreign Born, not a Citizen | 1,337 (77.4%) | 390 (22.6%) |
Health Insurance Coverage by Household Income in Pointe Coupee Parish
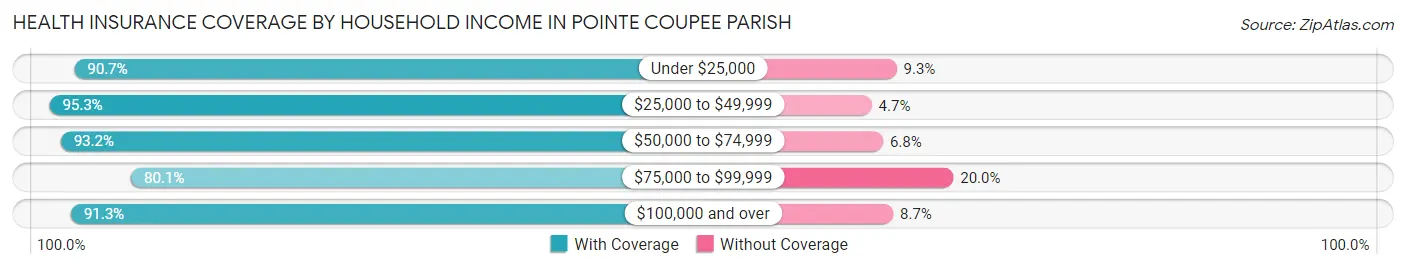
| Household Income | With Coverage | Without Coverage |
| Under $25,000 | 3,199 (90.7%) | 329 (9.3%) |
| $25,000 to $49,999 | 3,703 (95.3%) | 181 (4.7%) |
| $50,000 to $74,999 | 3,348 (93.2%) | 243 (6.8%) |
| $75,000 to $99,999 | 1,485 (80.0%) | 370 (20.0%) |
| $100,000 and over | 6,999 (91.3%) | 665 (8.7%) |
Public vs Private Health Insurance Coverage by Age in Pointe Coupee Parish
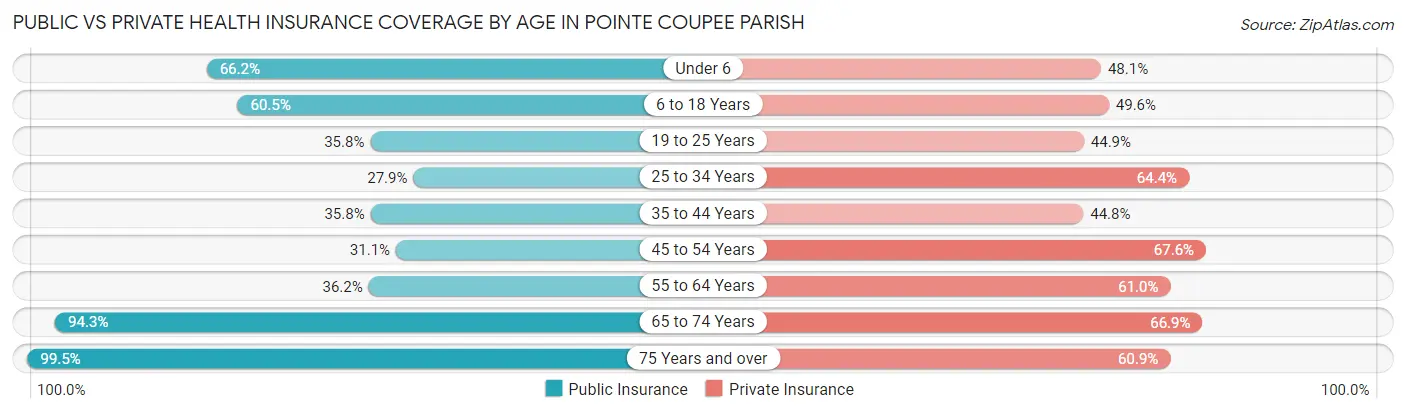
| Age Bracket | Public Insurance | Private Insurance |
| Under 6 | 875 (66.2%) | 636 (48.1%) |
| 6 to 18 Years | 1,985 (60.5%) | 1,627 (49.6%) |
| 19 to 25 Years | 619 (35.8%) | 776 (44.9%) |
| 25 to 34 Years | 574 (27.9%) | 1,327 (64.4%) |
| 35 to 44 Years | 837 (35.8%) | 1,048 (44.8%) |
| 45 to 54 Years | 723 (31.1%) | 1,572 (67.6%) |
| 55 to 64 Years | 1,143 (36.2%) | 1,927 (61.0%) |
| 65 to 74 Years | 2,463 (94.3%) | 1,747 (66.9%) |
| 75 Years and over | 1,686 (99.5%) | 1,033 (60.9%) |
| Total | 10,905 (53.1%) | 11,693 (57.0%) |
Disability Status by Sex by Age in Pointe Coupee Parish
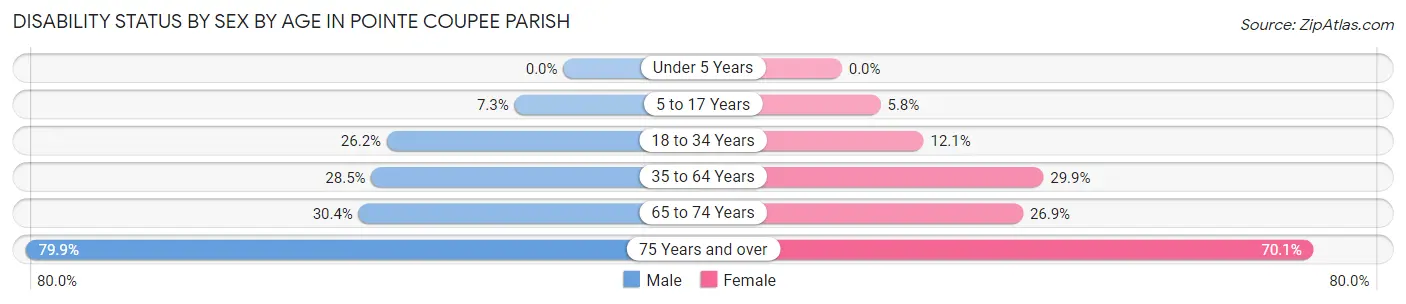
| Age Bracket | Male | Female |
| Under 5 Years | 0 (0.0%) | 0 (0.0%) |
| 5 to 17 Years | 116 (7.2%) | 96 (5.8%) |
| 18 to 34 Years | 524 (26.2%) | 240 (12.1%) |
| 35 to 64 Years | 1,090 (28.5%) | 1,197 (29.9%) |
| 65 to 74 Years | 362 (30.4%) | 382 (26.9%) |
| 75 Years and over | 583 (79.9%) | 676 (70.1%) |
Disability Class by Sex by Age in Pointe Coupee Parish
Disability Class: Hearing Difficulty
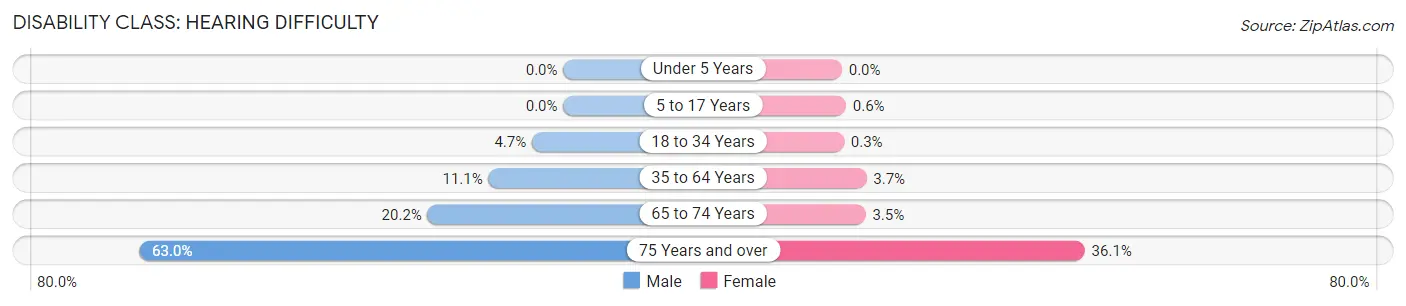
| Age Bracket | Male | Female |
| Under 5 Years | 0 (0.0%) | 0 (0.0%) |
| 5 to 17 Years | 0 (0.0%) | 10 (0.6%) |
| 18 to 34 Years | 93 (4.6%) | 6 (0.3%) |
| 35 to 64 Years | 425 (11.1%) | 146 (3.6%) |
| 65 to 74 Years | 240 (20.2%) | 50 (3.5%) |
| 75 Years and over | 460 (63.0%) | 348 (36.1%) |
Disability Class: Vision Difficulty
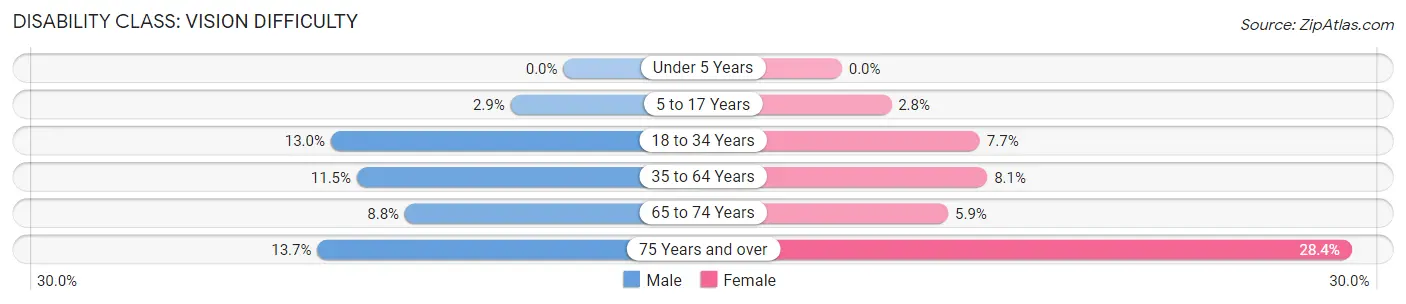
| Age Bracket | Male | Female |
| Under 5 Years | 0 (0.0%) | 0 (0.0%) |
| 5 to 17 Years | 47 (2.9%) | 46 (2.8%) |
| 18 to 34 Years | 259 (13.0%) | 152 (7.7%) |
| 35 to 64 Years | 440 (11.5%) | 324 (8.1%) |
| 65 to 74 Years | 105 (8.8%) | 84 (5.9%) |
| 75 Years and over | 100 (13.7%) | 274 (28.4%) |
Disability Class: Cognitive Difficulty
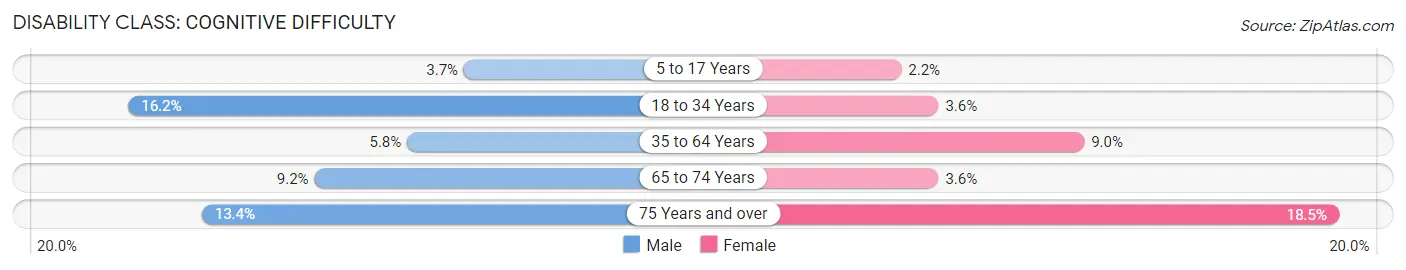
| Age Bracket | Male | Female |
| 5 to 17 Years | 59 (3.7%) | 37 (2.2%) |
| 18 to 34 Years | 323 (16.2%) | 71 (3.6%) |
| 35 to 64 Years | 222 (5.8%) | 360 (9.0%) |
| 65 to 74 Years | 110 (9.2%) | 51 (3.6%) |
| 75 Years and over | 98 (13.4%) | 178 (18.4%) |
Disability Class: Ambulatory Difficulty
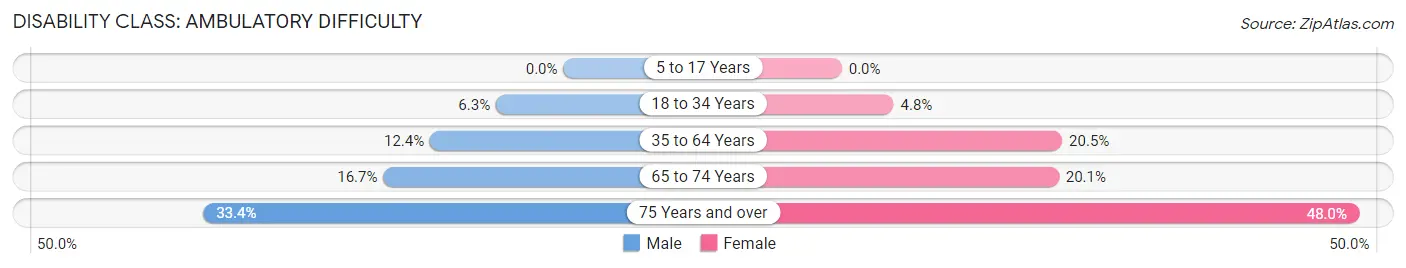
| Age Bracket | Male | Female |
| 5 to 17 Years | 0 (0.0%) | 0 (0.0%) |
| 18 to 34 Years | 125 (6.2%) | 95 (4.8%) |
| 35 to 64 Years | 473 (12.4%) | 818 (20.4%) |
| 65 to 74 Years | 199 (16.7%) | 286 (20.1%) |
| 75 Years and over | 244 (33.4%) | 463 (48.0%) |
Disability Class: Self-Care Difficulty
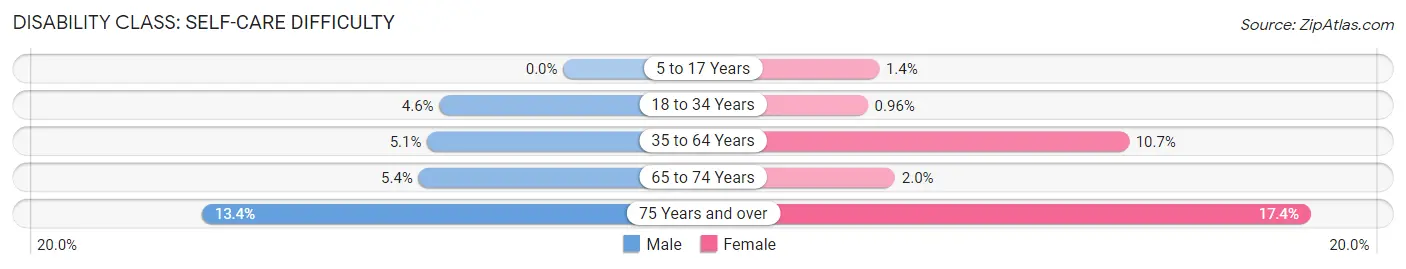
| Age Bracket | Male | Female |
| 5 to 17 Years | 0 (0.0%) | 23 (1.4%) |
| 18 to 34 Years | 92 (4.6%) | 19 (1.0%) |
| 35 to 64 Years | 193 (5.1%) | 426 (10.6%) |
| 65 to 74 Years | 64 (5.4%) | 28 (2.0%) |
| 75 Years and over | 98 (13.4%) | 168 (17.4%) |
Technology Access in Pointe Coupee Parish
Computing Device Access in Pointe Coupee Parish
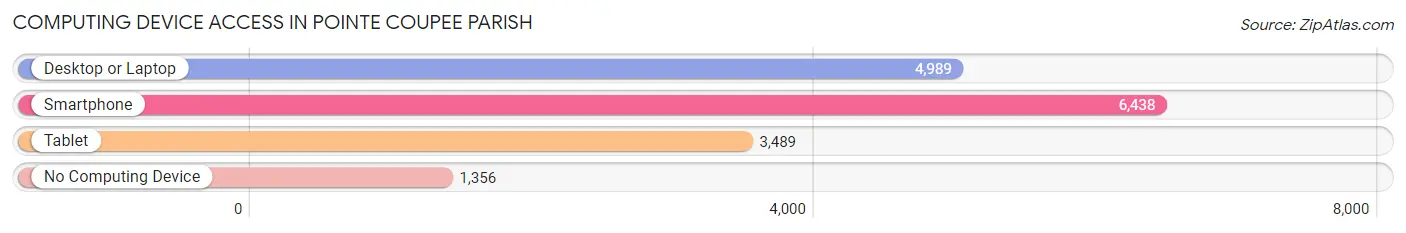
| Device Type | # Households | % Households |
| Desktop or Laptop | 4,989 | 60.8% |
| Smartphone | 6,438 | 78.5% |
| Tablet | 3,489 | 42.5% |
| No Computing Device | 1,356 | 16.5% |
| Total | 8,203 | 100.0% |
Internet Access in Pointe Coupee Parish
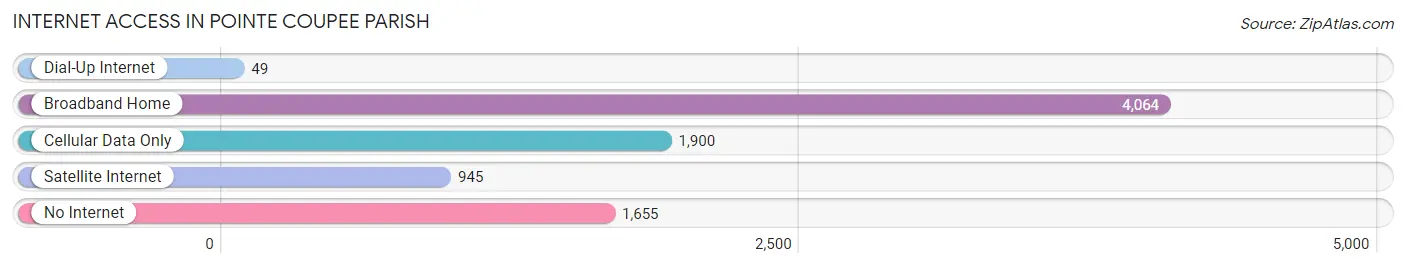
| Internet Type | # Households | % Households |
| Dial-Up Internet | 49 | 0.6% |
| Broadband Home | 4,064 | 49.5% |
| Cellular Data Only | 1,900 | 23.2% |
| Satellite Internet | 945 | 11.5% |
| No Internet | 1,655 | 20.2% |
| Total | 8,203 | 100.0% |
Pointe Coupee Parish Summary
Pointe Coupee Parish is located in the state of Louisiana, in the United States of America. It is bordered by West Feliciana Parish to the north, Avoyelles Parish to the east, Iberville Parish to the south, and the Mississippi River to the west. The parish seat is New Roads. As of the 2010 census, the population of Pointe Coupee Parish was 22,802.
Geography
Pointe Coupee Parish is located in the southeastern part of Louisiana, in the Mississippi River Delta region. It is bordered by West Feliciana Parish to the north, Avoyelles Parish to the east, Iberville Parish to the south, and the Mississippi River to the west. The parish has a total area of 545 square miles, of which 541 square miles is land and 4.2 square miles is water. The parish is divided into two distinct regions: the northern part is mostly flat, while the southern part is hilly and rolling.
The parish is home to several bodies of water, including the Mississippi River, False River, and the Atchafalaya River. The parish is also home to several state parks, including Tunica Hills State Park, False River State Park, and the Atchafalaya National Wildlife Refuge.
History
Pointe Coupee Parish was established in 1807, and is named after the French phrase “pointe coupee”, which means “cut point”. The parish was originally part of the French colony of Louisiana, and was later part of the Spanish colony of Louisiana. The parish was part of the Territory of Orleans before it became part of the state of Louisiana in 1812.
The parish was home to several Native American tribes, including the Chitimacha, Tunica, and Houma. The first European settlers in the area were French colonists, who arrived in the early 1700s. The parish was an important center of the cotton and sugar cane industries in the 19th century.
Economy
The economy of Pointe Coupee Parish is largely based on agriculture. The main crops grown in the parish are cotton, soybeans, corn, and sugar cane. The parish is also home to several large industrial plants, including a paper mill, a chemical plant, and a steel mill.
The parish is home to several tourist attractions, including the False River State Park, Tunica Hills State Park, and the Atchafalaya National Wildlife Refuge. The parish is also home to several historic sites, including the Pointe Coupee Parish Courthouse, the Old Pointe Coupee Parish Jail, and the Old Pointe Coupee Parish Courthouse.
Demographics
As of the 2010 census, the population of Pointe Coupee Parish was 22,802. The racial makeup of the parish was 68.3% White, 28.7% African American, 0.3% Native American, 0.3% Asian, 0.1% Pacific Islander, 0.7% from other races, and 1.9% from two or more races. Hispanic or Latino of any race were 2.2% of the population.
The median income for a household in the parish was $37,945, and the median income for a family was $45,945. The per capita income for the parish was $18,945. About 17.3% of families and 21.2% of the population were below the poverty line, including 28.2% of those under age 18 and 16.2% of those age 65 or over.
Common Questions
What is the Total Population of Pointe Coupee Parish?
Total Population of Pointe Coupee Parish is 20,652.
What is the Total Male Population of Pointe Coupee Parish?
Total Male Population of Pointe Coupee Parish is 10,201.
What is the Total Female Population of Pointe Coupee Parish?
Total Female Population of Pointe Coupee Parish is 10,451.
What is the Ratio of Males per 100 Females in Pointe Coupee Parish?
There are 97.61 Males per 100 Females in Pointe Coupee Parish.
What is the Ratio of Females per 100 Males in Pointe Coupee Parish?
There are 102.45 Females per 100 Males in Pointe Coupee Parish.
What is the Median Population Age in Pointe Coupee Parish?
Median Population Age in Pointe Coupee Parish is 43.4 Years.
What is the Average Family Size in Pointe Coupee Parish
Average Family Size in Pointe Coupee Parish is 3.3 People.
What is the Average Household Size in Pointe Coupee Parish
Average Household Size in Pointe Coupee Parish is 2.5 People.
What is Per Capita Income in Pointe Coupee Parish?
Per Capita income in Pointe Coupee Parish is $31,595.
What is the Median Family Income in Pointe Coupee Parish?
Median Family Income in Pointe Coupee Parish is $71,425.
What is the Median Household income in Pointe Coupee Parish?
Median Household Income in Pointe Coupee Parish is $53,045.
What is Income or Wage Gap in Pointe Coupee Parish?
Income or Wage Gap in Pointe Coupee Parish is 47.4%.
Women in Pointe Coupee Parish earn 52.6 cents for every dollar earned by a man.
What is Family Income Deficit in Pointe Coupee Parish?
Family Income Deficit in Pointe Coupee Parish is $12,051.
Families that are below poverty line in Pointe Coupee Parish earn $12,051 less on average than the poverty threshold level.
What is Inequality or Gini Index in Pointe Coupee Parish?
Inequality or Gini Index in Pointe Coupee Parish is 0.51.
How Large is the Labor Force in Pointe Coupee Parish?
There are 8,879 People in the Labor Forcein in Pointe Coupee Parish.
What is the Percentage of People in the Labor Force in Pointe Coupee Parish?
53.0% of People are in the Labor Force in Pointe Coupee Parish.
What is the Unemployment Rate in Pointe Coupee Parish?
Unemployment Rate in Pointe Coupee Parish is 7.4%.