Plaquemines Parish, LA
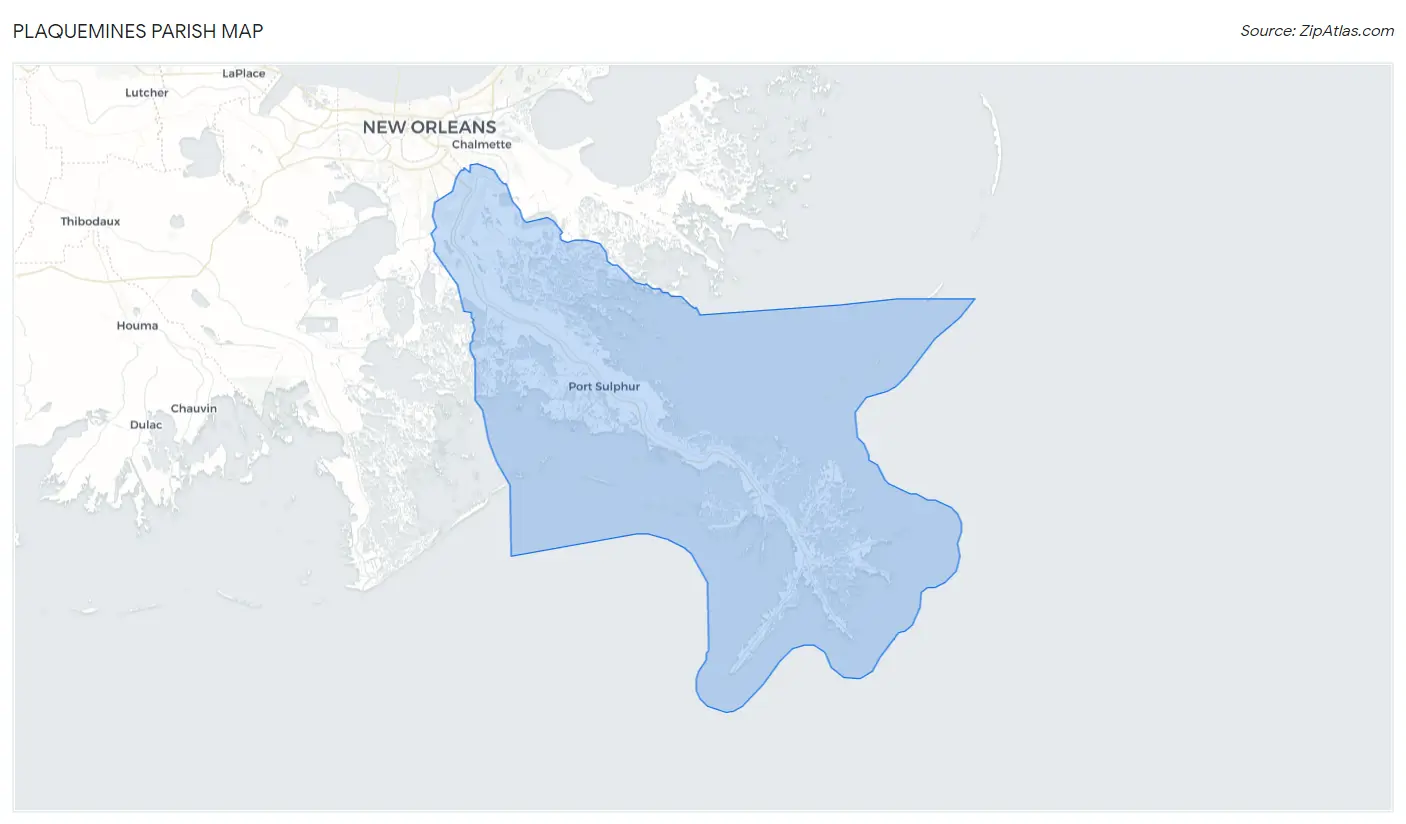
Plaquemines Parish Map
Plaquemines Parish Overview
23,305
TOTAL POPULATION
12,112
MALE POPULATION
11,193
FEMALE POPULATION
108.21
MALES / 100 FEMALES
92.41
FEMALES / 100 MALES
36.4
MEDIAN AGE
3.3
AVG FAMILY SIZE
2.8
AVG HOUSEHOLD SIZE
$35,413
PER CAPITA INCOME
$84,478
AVG FAMILY INCOME
$77,996
AVG HOUSEHOLD INCOME
48.3%
WAGE / INCOME GAP [ % ]
51.7¢/ $1
WAGE / INCOME GAP [ $ ]
$12,379
FAMILY INCOME DEFICIT
0.47
INEQUALITY / GINI INDEX
11,851
LABOR FORCE [ PEOPLE ]
65.0%
PERCENT IN LABOR FORCE
4.4%
UNEMPLOYMENT RATE
Plaquemines Parish Area Codes
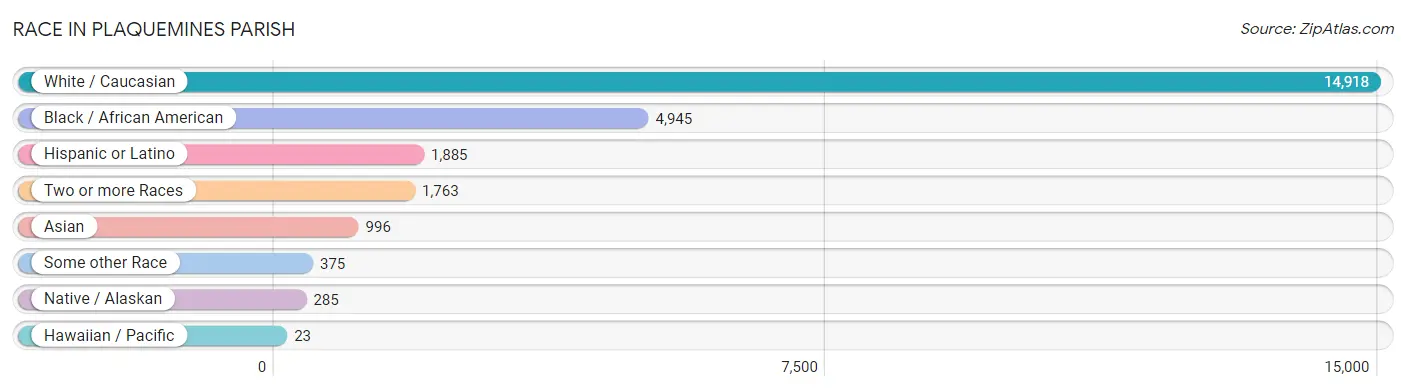
Race in Plaquemines Parish
The most populous races in Plaquemines Parish are White / Caucasian (14,918 | 64.0%), Black / African American (4,945 | 21.2%), and Hispanic or Latino (1,885 | 8.1%).
| Race | # Population | % Population |
| Asian | 996 | 4.3% |
| Black / African American | 4,945 | 21.2% |
| Hawaiian / Pacific | 23 | 0.1% |
| Hispanic or Latino | 1,885 | 8.1% |
| Native / Alaskan | 285 | 1.2% |
| White / Caucasian | 14,918 | 64.0% |
| Two or more Races | 1,763 | 7.6% |
| Some other Race | 375 | 1.6% |
| Total | 23,305 | 100.0% |
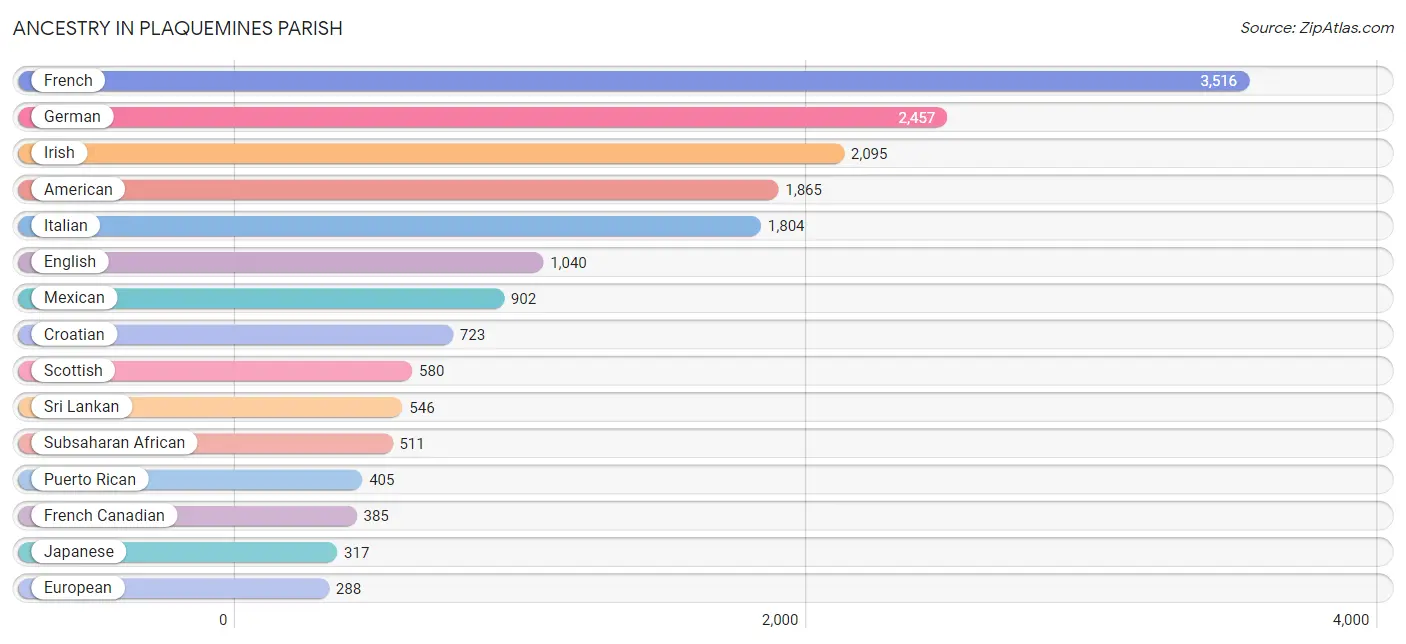
Ancestry in Plaquemines Parish
The most populous ancestries reported in Plaquemines Parish are French (3,516 | 15.1%), German (2,457 | 10.5%), Irish (2,095 | 9.0%), American (1,865 | 8.0%), and Italian (1,804 | 7.7%), together accounting for 50.4% of all Plaquemines Parish residents.
| Ancestry | # Population | % Population |
| African | 271 | 1.2% |
| American | 1,865 | 8.0% |
| Austrian | 7 | 0.0% |
| Belizean | 6 | 0.0% |
| Bhutanese | 27 | 0.1% |
| Blackfeet | 60 | 0.3% |
| British | 41 | 0.2% |
| Burmese | 54 | 0.2% |
| Cajun | 63 | 0.3% |
| Central American | 227 | 1.0% |
| Central American Indian | 53 | 0.2% |
| Cherokee | 112 | 0.5% |
| Choctaw | 72 | 0.3% |
| Creek | 49 | 0.2% |
| Croatian | 723 | 3.1% |
| Cuban | 105 | 0.4% |
| Czech | 34 | 0.2% |
| Dominican | 88 | 0.4% |
| Dutch | 103 | 0.4% |
| Eastern European | 118 | 0.5% |
| English | 1,040 | 4.5% |
| European | 288 | 1.2% |
| Filipino | 62 | 0.3% |
| Finnish | 11 | 0.1% |
| French | 3,516 | 15.1% |
| French American Indian | 144 | 0.6% |
| French Canadian | 385 | 1.7% |
| German | 2,457 | 10.5% |
| Greek | 10 | 0.0% |
| Haitian | 6 | 0.0% |
| Honduran | 32 | 0.1% |
| Houma | 38 | 0.2% |
| Hungarian | 48 | 0.2% |
| Indian (Asian) | 6 | 0.0% |
| Irish | 2,095 | 9.0% |
| Italian | 1,804 | 7.7% |
| Jamaican | 8 | 0.0% |
| Japanese | 317 | 1.4% |
| Korean | 41 | 0.2% |
| Lithuanian | 37 | 0.2% |
| Mexican | 902 | 3.9% |
| Nicaraguan | 39 | 0.2% |
| Nigerian | 32 | 0.1% |
| Norwegian | 38 | 0.2% |
| Pakistani | 51 | 0.2% |
| Panamanian | 67 | 0.3% |
| Polish | 103 | 0.4% |
| Portuguese | 27 | 0.1% |
| Puerto Rican | 405 | 1.7% |
| Salvadoran | 89 | 0.4% |
| Scandinavian | 122 | 0.5% |
| Scotch-Irish | 221 | 0.9% |
| Scottish | 580 | 2.5% |
| Sioux | 12 | 0.1% |
| Slavic | 9 | 0.0% |
| South American | 9 | 0.0% |
| Spaniard | 1 | 0.0% |
| Spanish | 97 | 0.4% |
| Sri Lankan | 546 | 2.3% |
| Subsaharan African | 511 | 2.2% |
| Swedish | 78 | 0.3% |
| Swiss | 10 | 0.0% |
| Ugandan | 208 | 0.9% |
| Uruguayan | 9 | 0.0% |
| Welsh | 45 | 0.2% |
| Yugoslavian | 74 | 0.3% | View All 66 Rows |
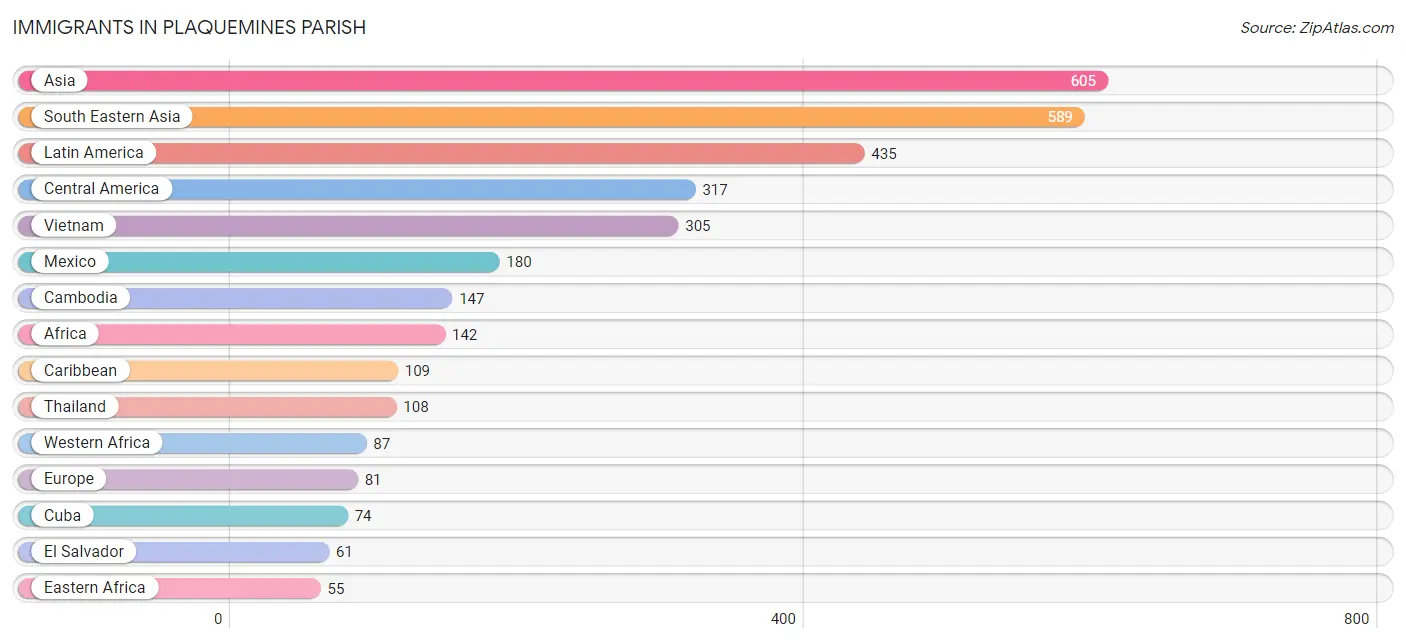
Immigrants in Plaquemines Parish
The most numerous immigrant groups reported in Plaquemines Parish came from Asia (605 | 2.6%), South Eastern Asia (589 | 2.5%), Latin America (435 | 1.9%), Central America (317 | 1.4%), and Vietnam (305 | 1.3%), together accounting for 9.7% of all Plaquemines Parish residents.
| Immigration Origin | # Population | % Population |
| Africa | 142 | 0.6% |
| Asia | 605 | 2.6% |
| Cambodia | 147 | 0.6% |
| Caribbean | 109 | 0.5% |
| Central America | 317 | 1.4% |
| Croatia | 34 | 0.2% |
| Cuba | 74 | 0.3% |
| Czechoslovakia | 8 | 0.0% |
| Dominican Republic | 35 | 0.2% |
| Eastern Africa | 55 | 0.2% |
| Eastern Asia | 16 | 0.1% |
| Eastern Europe | 42 | 0.2% |
| El Salvador | 61 | 0.3% |
| Europe | 81 | 0.4% |
| Germany | 33 | 0.1% |
| Ghana | 37 | 0.2% |
| Honduras | 37 | 0.2% |
| Japan | 1 | 0.0% |
| Korea | 15 | 0.1% |
| Latin America | 435 | 1.9% |
| Mexico | 180 | 0.8% |
| Nicaragua | 39 | 0.2% |
| Northern Europe | 6 | 0.0% |
| Philippines | 29 | 0.1% |
| South America | 9 | 0.0% |
| South Eastern Asia | 589 | 2.5% |
| Thailand | 108 | 0.5% |
| Uganda | 55 | 0.2% |
| Uruguay | 9 | 0.0% |
| Vietnam | 305 | 1.3% |
| Western Africa | 87 | 0.4% |
| Western Europe | 33 | 0.1% | View All 32 Rows |
Sex and Age in Plaquemines Parish
Sex and Age in Plaquemines Parish
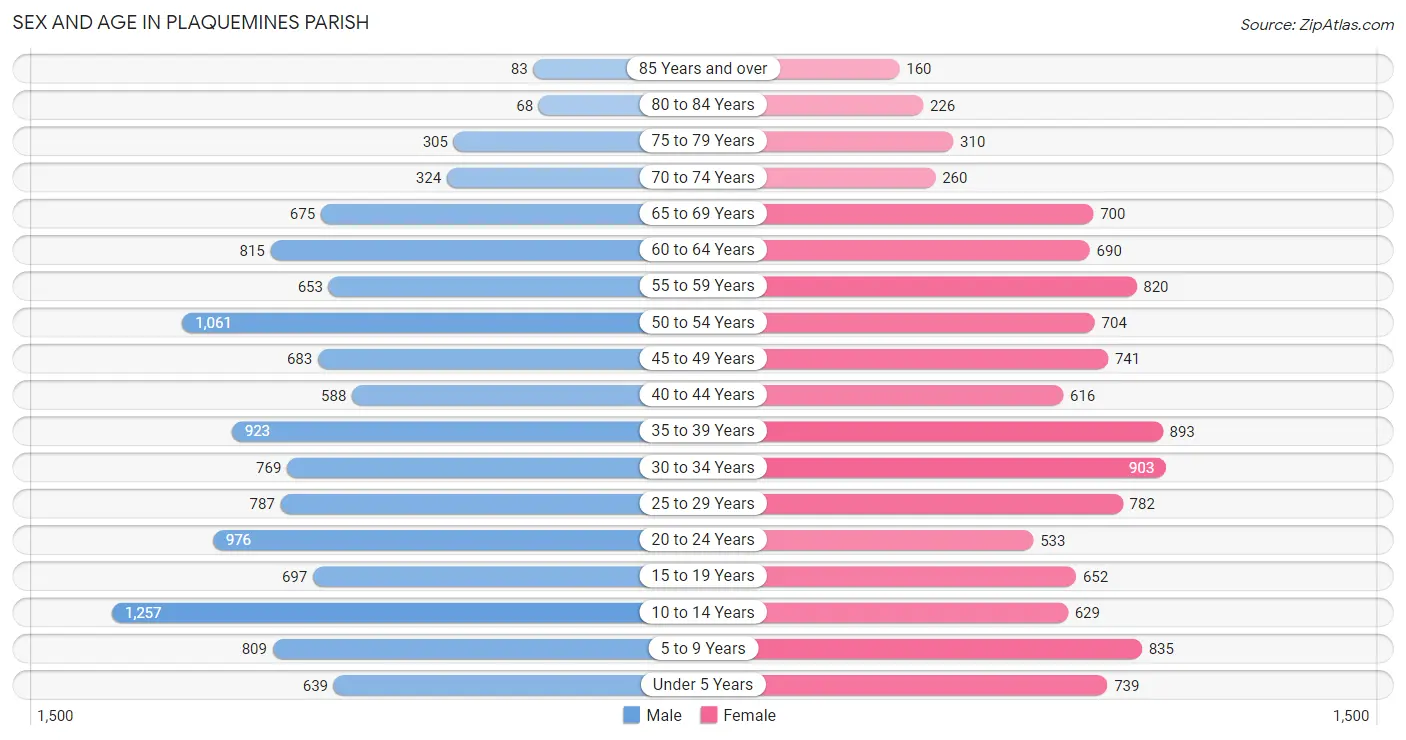
The most populous age groups in Plaquemines Parish are 10 to 14 Years (1,257 | 10.4%) for men and 30 to 34 Years (903 | 8.1%) for women.
| Age Bracket | Male | Female |
| Under 5 Years | 639 (5.3%) | 739 (6.6%) |
| 5 to 9 Years | 809 (6.7%) | 835 (7.5%) |
| 10 to 14 Years | 1,257 (10.4%) | 629 (5.6%) |
| 15 to 19 Years | 697 (5.8%) | 652 (5.8%) |
| 20 to 24 Years | 976 (8.1%) | 533 (4.8%) |
| 25 to 29 Years | 787 (6.5%) | 782 (7.0%) |
| 30 to 34 Years | 769 (6.4%) | 903 (8.1%) |
| 35 to 39 Years | 923 (7.6%) | 893 (8.0%) |
| 40 to 44 Years | 588 (4.9%) | 616 (5.5%) |
| 45 to 49 Years | 683 (5.6%) | 741 (6.6%) |
| 50 to 54 Years | 1,061 (8.8%) | 704 (6.3%) |
| 55 to 59 Years | 653 (5.4%) | 820 (7.3%) |
| 60 to 64 Years | 815 (6.7%) | 690 (6.2%) |
| 65 to 69 Years | 675 (5.6%) | 700 (6.2%) |
| 70 to 74 Years | 324 (2.7%) | 260 (2.3%) |
| 75 to 79 Years | 305 (2.5%) | 310 (2.8%) |
| 80 to 84 Years | 68 (0.6%) | 226 (2.0%) |
| 85 Years and over | 83 (0.7%) | 160 (1.4%) |
| Total | 12,112 (100.0%) | 11,193 (100.0%) |
Families and Households in Plaquemines Parish
Median Family Size in Plaquemines Parish
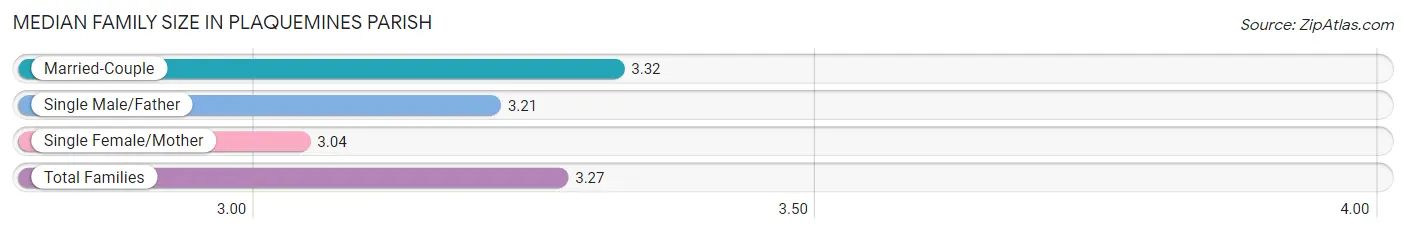
The median family size in Plaquemines Parish is 3.27 persons per family, with married-couple families (4,850 | 77.9%) accounting for the largest median family size of 3.32 persons per family. On the other hand, single female/mother families (1,044 | 16.8%) represent the smallest median family size with 3.04 persons per family.
| Family Type | # Families | Family Size |
| Married-Couple | 4,850 (77.9%) | 3.32 |
| Single Male/Father | 330 (5.3%) | 3.21 |
| Single Female/Mother | 1,044 (16.8%) | 3.04 |
| Total Families | 6,224 (100.0%) | 3.27 |
Median Household Size in Plaquemines Parish
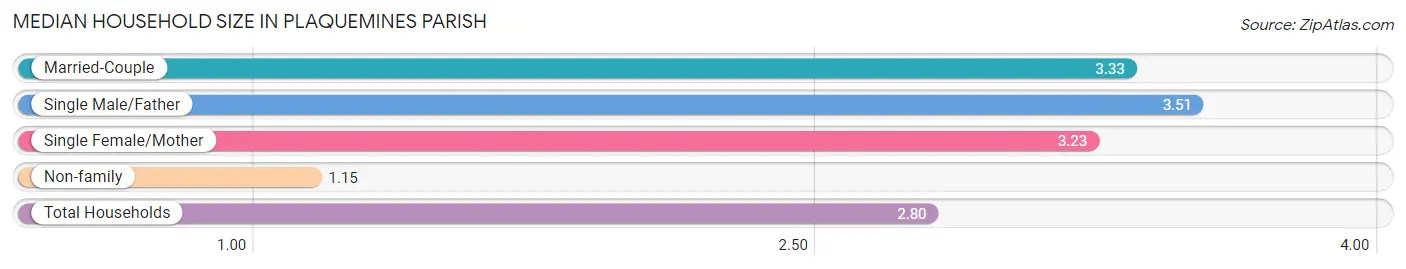
The median household size in Plaquemines Parish is 2.80 persons per household, with single male/father households (330 | 4.0%) accounting for the largest median household size of 3.51 persons per household. non-family households (1,948 | 23.8%) represent the smallest median household size with 1.15 persons per household.
| Household Type | # Households | Household Size |
| Married-Couple | 4,850 (59.4%) | 3.33 |
| Single Male/Father | 330 (4.0%) | 3.51 |
| Single Female/Mother | 1,044 (12.8%) | 3.23 |
| Non-family | 1,948 (23.8%) | 1.15 |
| Total Households | 8,172 (100.0%) | 2.80 |
Household Size by Marriage Status in Plaquemines Parish
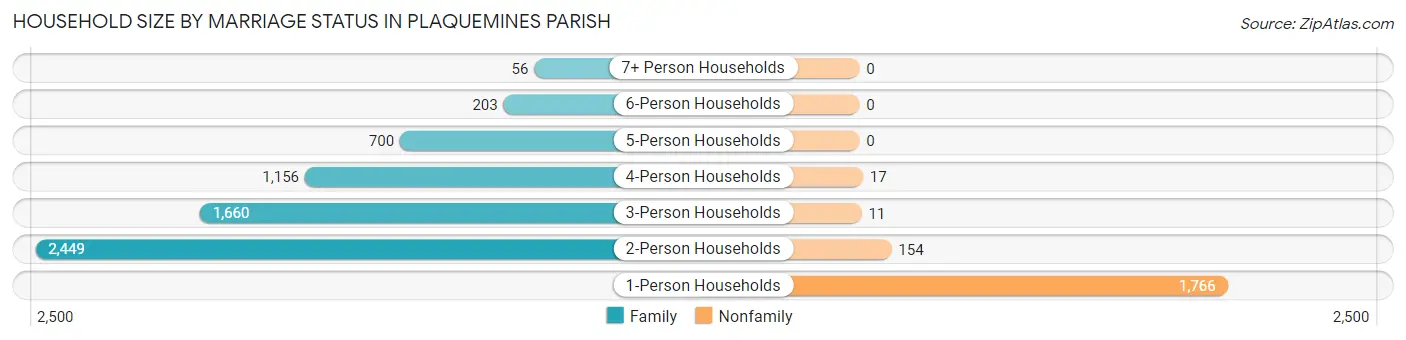
Out of a total of 8,172 households in Plaquemines Parish, 6,224 (76.2%) are family households, while 1,948 (23.8%) are nonfamily households. The most numerous type of family households are 2-person households, comprising 2,449, and the most common type of nonfamily households are 1-person households, comprising 1,766.
| Household Size | Family Households | Nonfamily Households |
| 1-Person Households | - | 1,766 (21.6%) |
| 2-Person Households | 2,449 (30.0%) | 154 (1.9%) |
| 3-Person Households | 1,660 (20.3%) | 11 (0.1%) |
| 4-Person Households | 1,156 (14.1%) | 17 (0.2%) |
| 5-Person Households | 700 (8.6%) | 0 (0.0%) |
| 6-Person Households | 203 (2.5%) | 0 (0.0%) |
| 7+ Person Households | 56 (0.7%) | 0 (0.0%) |
| Total | 6,224 (76.2%) | 1,948 (23.8%) |
Female Fertility in Plaquemines Parish
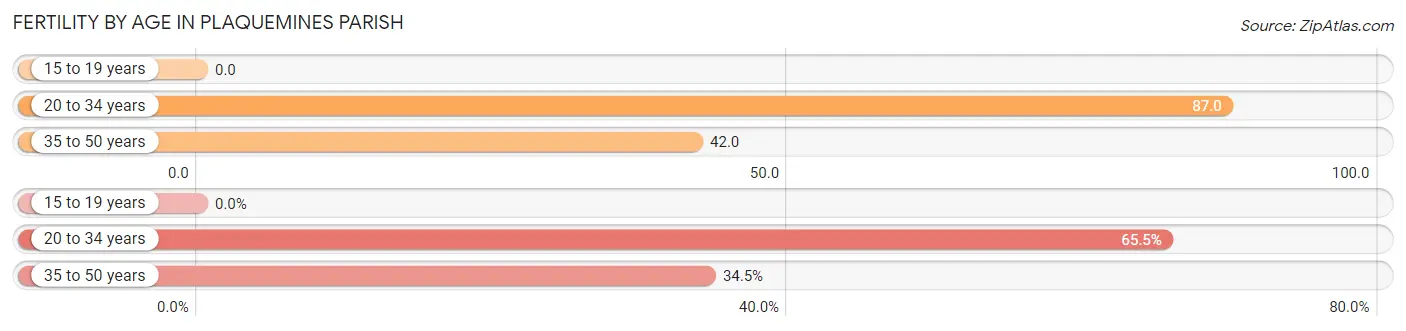
Fertility by Age in Plaquemines Parish
Average fertility rate in Plaquemines Parish is 55.0 births per 1,000 women. Women in the age bracket of 20 to 34 years have the highest fertility rate with 87.0 births per 1,000 women. Women in the age bracket of 20 to 34 years acount for 65.5% of all women with births.
| Age Bracket | Women with Births | Births / 1,000 Women |
| 15 to 19 years | 0 (0.0%) | 0.0 |
| 20 to 34 years | 192 (65.5%) | 87.0 |
| 35 to 50 years | 101 (34.5%) | 42.0 |
| Total | 293 (100.0%) | 55.0 |
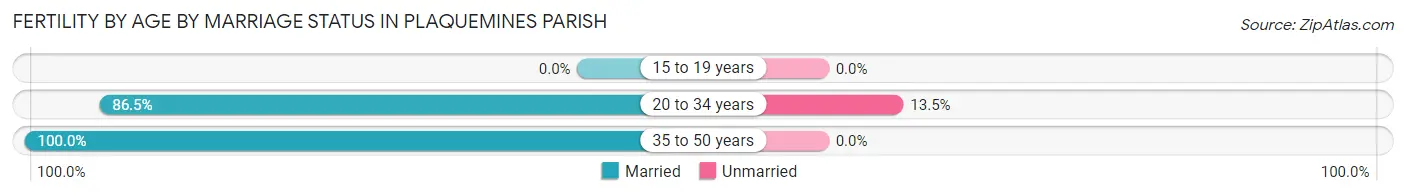
Fertility by Age by Marriage Status in Plaquemines Parish
91.1% of women with births (293) in Plaquemines Parish are married. The highest percentage of unmarried women with births falls into 20 to 34 years age bracket with 13.5% of them unmarried at the time of birth, while the lowest percentage of unmarried women with births belong to 35 to 50 years age bracket with 0.0% of them unmarried.
| Age Bracket | Married | Unmarried |
| 15 to 19 years | 0 (0.0%) | 0 (0.0%) |
| 20 to 34 years | 166 (86.5%) | 26 (13.5%) |
| 35 to 50 years | 101 (100.0%) | 0 (0.0%) |
| Total | 267 (91.1%) | 26 (8.9%) |
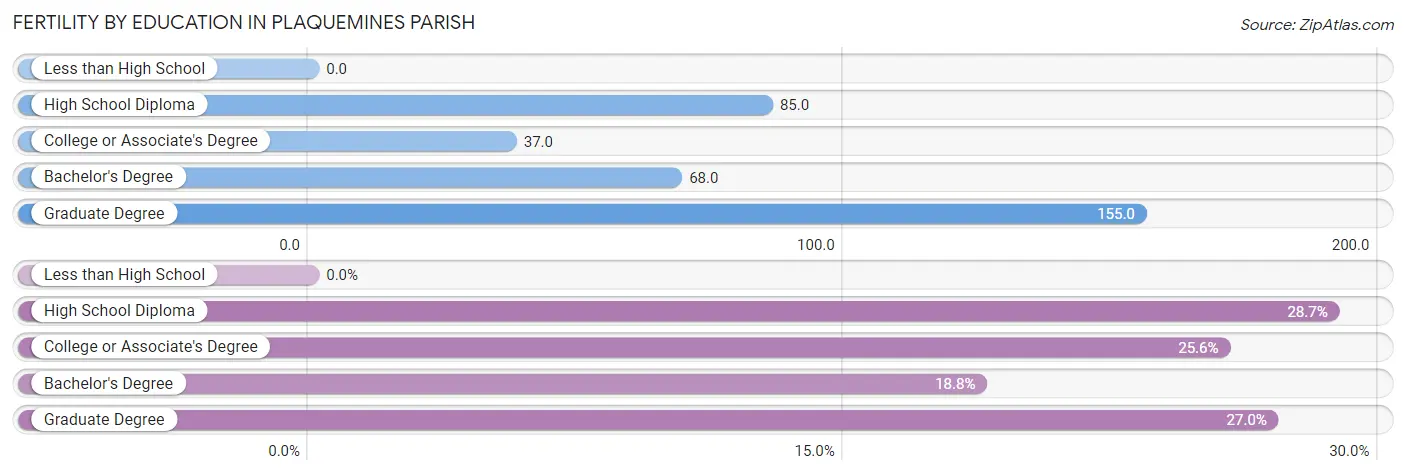
Fertility by Education in Plaquemines Parish
| Educational Attainment | Women with Births | Births / 1,000 Women |
| Less than High School | 0 (0.0%) | 0.0 |
| High School Diploma | 84 (28.7%) | 85.0 |
| College or Associate's Degree | 75 (25.6%) | 37.0 |
| Bachelor's Degree | 55 (18.8%) | 68.0 |
| Graduate Degree | 79 (27.0%) | 155.0 |
| Total | 293 (100.0%) | 55.0 |
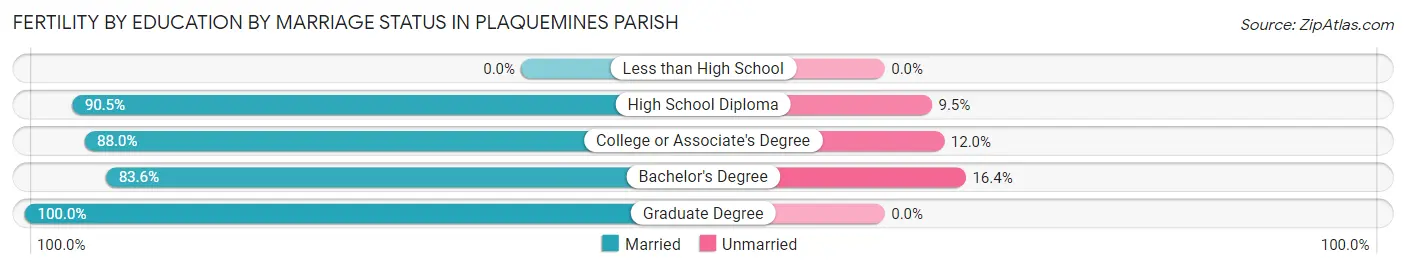
Fertility by Education by Marriage Status in Plaquemines Parish
8.9% of women with births in Plaquemines Parish are unmarried. Women with the educational attainment of graduate degree are most likely to be married with 100.0% of them married at childbirth, while women with the educational attainment of bachelor's degree are least likely to be married with 16.4% of them unmarried at childbirth.
| Educational Attainment | Married | Unmarried |
| Less than High School | 0 (0.0%) | 0 (0.0%) |
| High School Diploma | 76 (90.5%) | 8 (9.5%) |
| College or Associate's Degree | 66 (88.0%) | 9 (12.0%) |
| Bachelor's Degree | 46 (83.6%) | 9 (16.4%) |
| Graduate Degree | 79 (100.0%) | 0 (0.0%) |
| Total | 267 (91.1%) | 26 (8.9%) |
Income in Plaquemines Parish
Income Overview in Plaquemines Parish
Per Capita Income in Plaquemines Parish is $35,413, while median incomes of families and households are $84,478 and $77,996 respectively.
| Characteristic | Number | Measure |
| Per Capita Income | 23,305 | $35,413 |
| Median Family Income | 6,224 | $84,478 |
| Mean Family Income | 6,224 | $112,238 |
| Median Household Income | 8,172 | $77,996 |
| Mean Household Income | 8,172 | $98,008 |
| Income Deficit | 6,224 | $12,379 |
| Wage / Income Gap (%) | 23,305 | 48.30% |
| Wage / Income Gap ($) | 23,305 | 51.70¢ per $1 |
| Gini / Inequality Index | 23,305 | 0.47 |
Earnings by Sex in Plaquemines Parish
Average Earnings in Plaquemines Parish are $41,120, $53,774 for men and $27,802 for women, a difference of 48.3%.
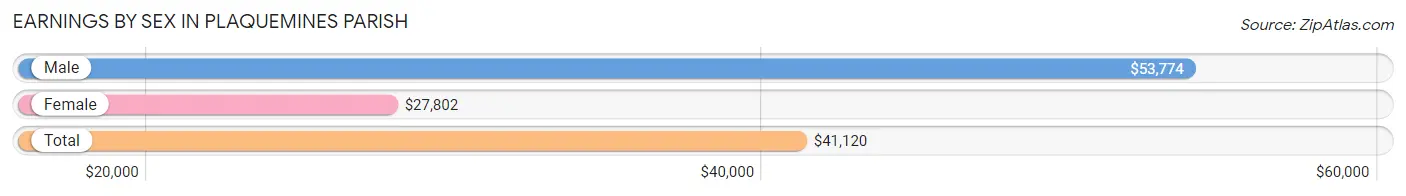
| Sex | Number | Average Earnings |
| Male | 6,834 (56.8%) | $53,774 |
| Female | 5,199 (43.2%) | $27,802 |
| Total | 12,033 (100.0%) | $41,120 |
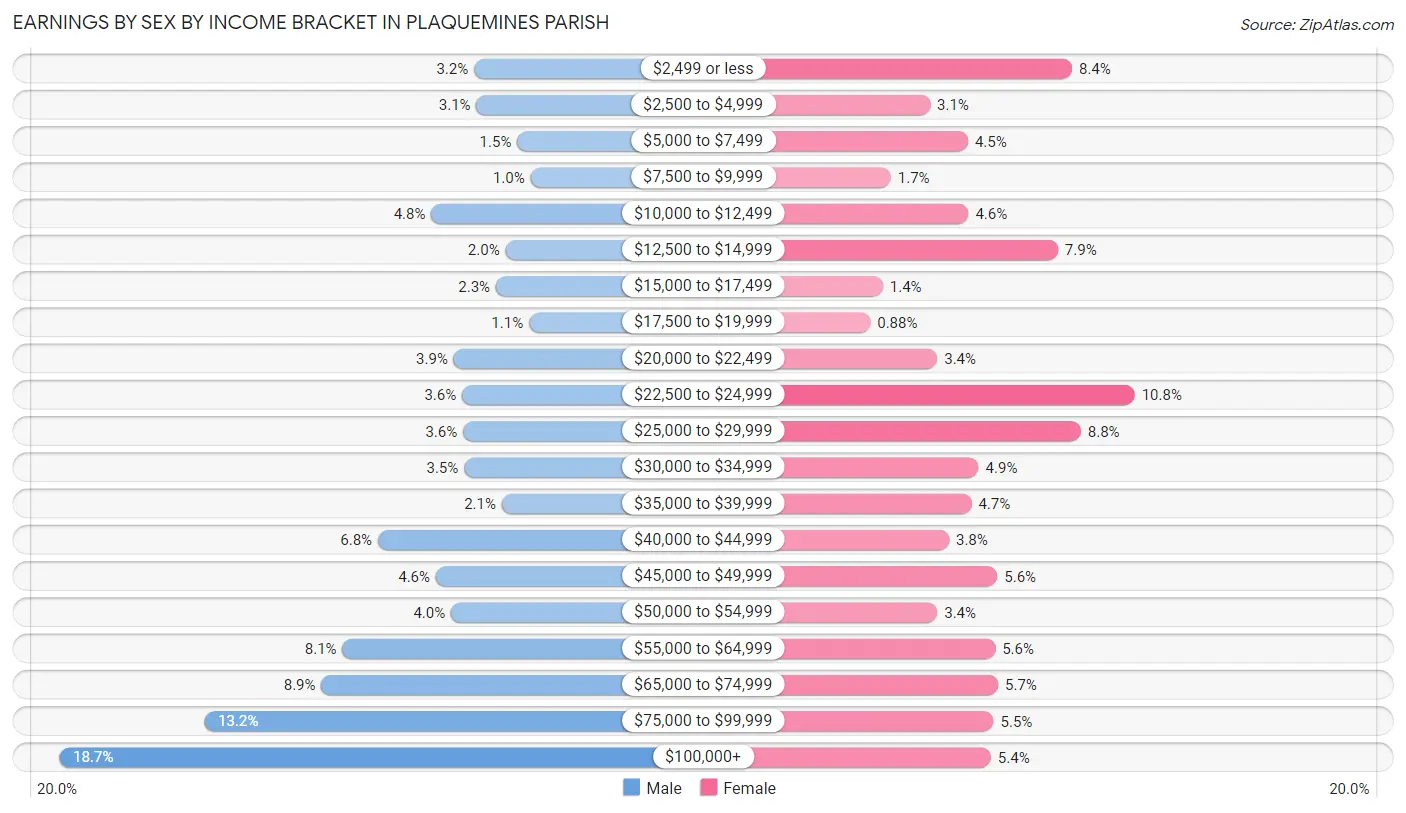
Earnings by Sex by Income Bracket in Plaquemines Parish
The most common earnings brackets in Plaquemines Parish are $100,000+ for men (1,276 | 18.7%) and $22,500 to $24,999 for women (561 | 10.8%).
| Income | Male | Female |
| $2,499 or less | 216 (3.2%) | 439 (8.4%) |
| $2,500 to $4,999 | 210 (3.1%) | 162 (3.1%) |
| $5,000 to $7,499 | 105 (1.5%) | 236 (4.5%) |
| $7,500 to $9,999 | 71 (1.0%) | 86 (1.7%) |
| $10,000 to $12,499 | 325 (4.8%) | 237 (4.6%) |
| $12,500 to $14,999 | 135 (2.0%) | 411 (7.9%) |
| $15,000 to $17,499 | 160 (2.3%) | 70 (1.3%) |
| $17,500 to $19,999 | 75 (1.1%) | 46 (0.9%) |
| $20,000 to $22,499 | 268 (3.9%) | 176 (3.4%) |
| $22,500 to $24,999 | 247 (3.6%) | 561 (10.8%) |
| $25,000 to $29,999 | 244 (3.6%) | 456 (8.8%) |
| $30,000 to $34,999 | 241 (3.5%) | 257 (4.9%) |
| $35,000 to $39,999 | 145 (2.1%) | 243 (4.7%) |
| $40,000 to $44,999 | 462 (6.8%) | 199 (3.8%) |
| $45,000 to $49,999 | 314 (4.6%) | 293 (5.6%) |
| $50,000 to $54,999 | 275 (4.0%) | 176 (3.4%) |
| $55,000 to $64,999 | 553 (8.1%) | 289 (5.6%) |
| $65,000 to $74,999 | 607 (8.9%) | 295 (5.7%) |
| $75,000 to $99,999 | 905 (13.2%) | 286 (5.5%) |
| $100,000+ | 1,276 (18.7%) | 281 (5.4%) |
| Total | 6,834 (100.0%) | 5,199 (100.0%) |
Earnings by Sex by Educational Attainment in Plaquemines Parish
Average earnings in Plaquemines Parish are $62,384 for men and $29,175 for women, a difference of 53.2%. Men with an educational attainment of graduate degree enjoy the highest average annual earnings of $102,059, while those with college or associate's degree education earn the least with $54,396. Women with an educational attainment of graduate degree earn the most with the average annual earnings of $57,045, while those with high school diploma education have the smallest earnings of $25,952.
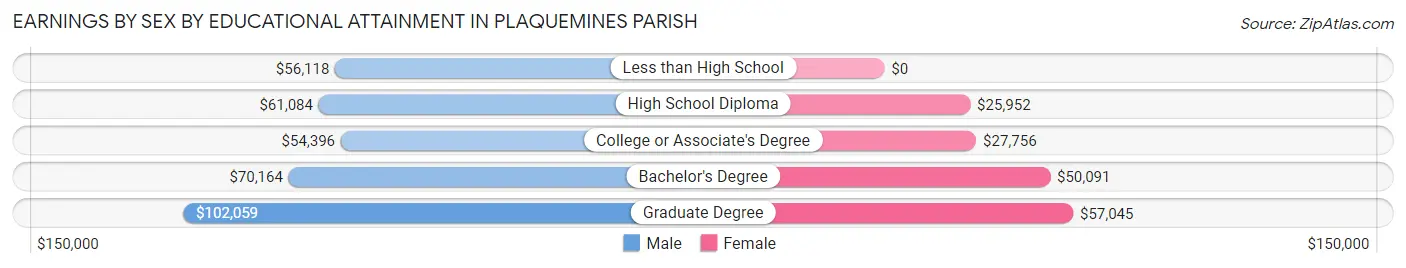
| Educational Attainment | Male Income | Female Income |
| Less than High School | $56,118 | $0 |
| High School Diploma | $61,084 | $25,952 |
| College or Associate's Degree | $54,396 | $27,756 |
| Bachelor's Degree | $70,164 | $50,091 |
| Graduate Degree | $102,059 | $57,045 |
| Total | $62,384 | $29,175 |
Family Income in Plaquemines Parish
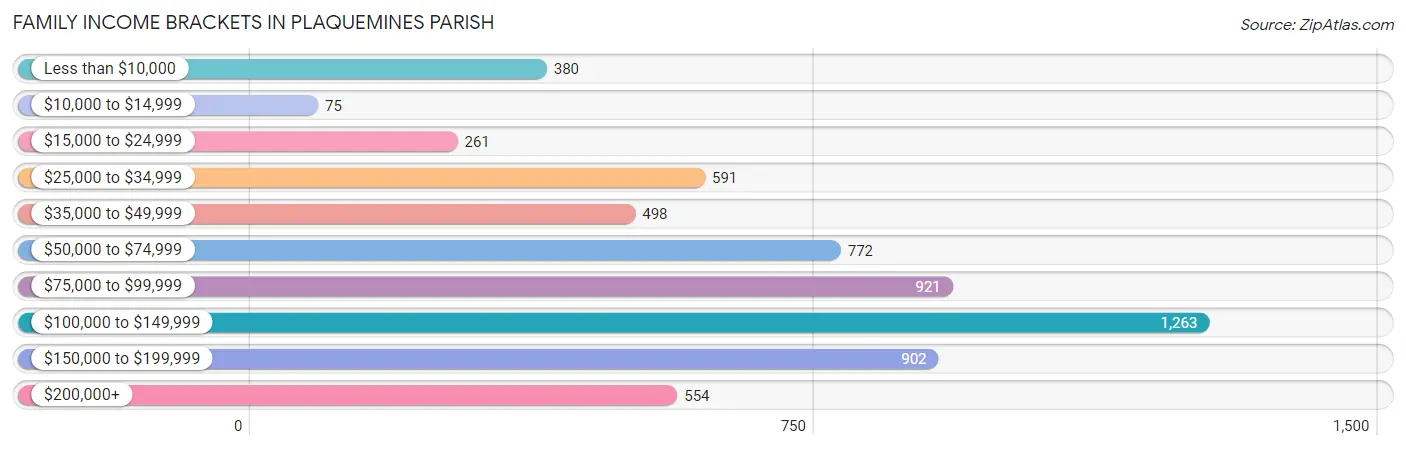
Family Income Brackets in Plaquemines Parish
According to the Plaquemines Parish family income data, there are 1,263 families falling into the $100,000 to $149,999 income range, which is the most common income bracket and makes up 20.3% of all families. Conversely, the $10,000 to $14,999 income bracket is the least frequent group with only 75 families (1.2%) belonging to this category.
| Income Bracket | # Families | % Families |
| Less than $10,000 | 380 | 6.1% |
| $10,000 to $14,999 | 75 | 1.2% |
| $15,000 to $24,999 | 261 | 4.2% |
| $25,000 to $34,999 | 591 | 9.5% |
| $35,000 to $49,999 | 498 | 8.0% |
| $50,000 to $74,999 | 772 | 12.4% |
| $75,000 to $99,999 | 921 | 14.8% |
| $100,000 to $149,999 | 1,263 | 20.3% |
| $150,000 to $199,999 | 902 | 14.5% |
| $200,000+ | 554 | 8.9% |
Family Income by Famaliy Size in Plaquemines Parish
4-person families (1,071 | 17.2%) account for the highest median family income in Plaquemines Parish with $109,675 per family, while 2-person families (2,634 | 42.3%) have the highest median income of $35,567 per family member.
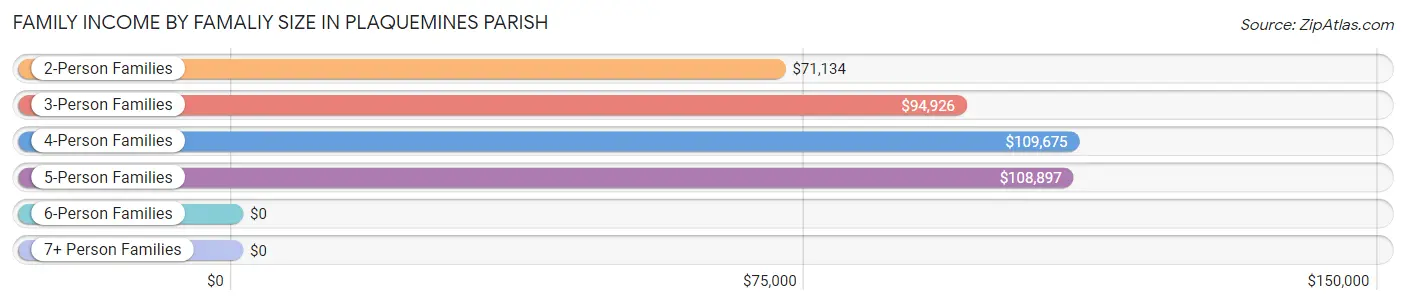
| Income Bracket | # Families | Median Income |
| 2-Person Families | 2,634 (42.3%) | $71,134 |
| 3-Person Families | 1,603 (25.8%) | $94,926 |
| 4-Person Families | 1,071 (17.2%) | $109,675 |
| 5-Person Families | 657 (10.6%) | $108,897 |
| 6-Person Families | 203 (3.3%) | $0 |
| 7+ Person Families | 56 (0.9%) | $0 |
| Total | 6,224 (100.0%) | $84,478 |
Family Income by Number of Earners in Plaquemines Parish
The median family income in Plaquemines Parish is $84,478, with families comprising 3+ earners (625) having the highest median family income of $177,259, while families with no earners (908) have the lowest median family income of $36,604, accounting for 10.0% and 14.6% of families, respectively.
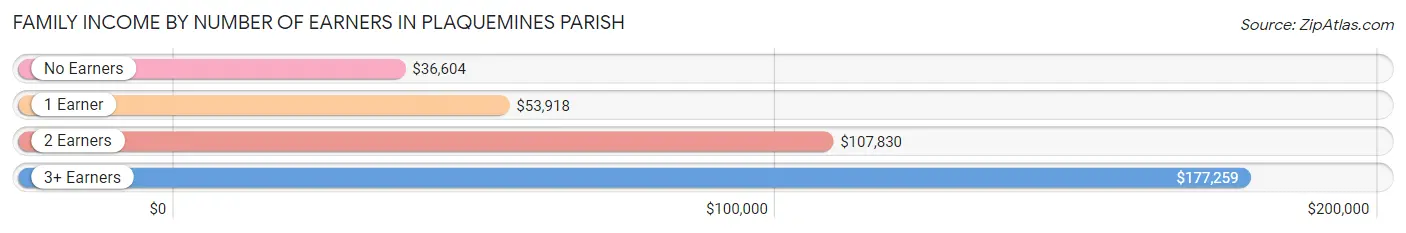
| Number of Earners | # Families | Median Income |
| No Earners | 908 (14.6%) | $36,604 |
| 1 Earner | 2,205 (35.4%) | $53,918 |
| 2 Earners | 2,486 (39.9%) | $107,830 |
| 3+ Earners | 625 (10.0%) | $177,259 |
| Total | 6,224 (100.0%) | $84,478 |
Household Income in Plaquemines Parish
Household Income Brackets in Plaquemines Parish
With 1,430 households falling in the category, the $100,000 to $149,999 income range is the most frequent in Plaquemines Parish, accounting for 17.5% of all households. In contrast, only 360 households (4.4%) fall into the $10,000 to $14,999 income bracket, making it the least populous group.
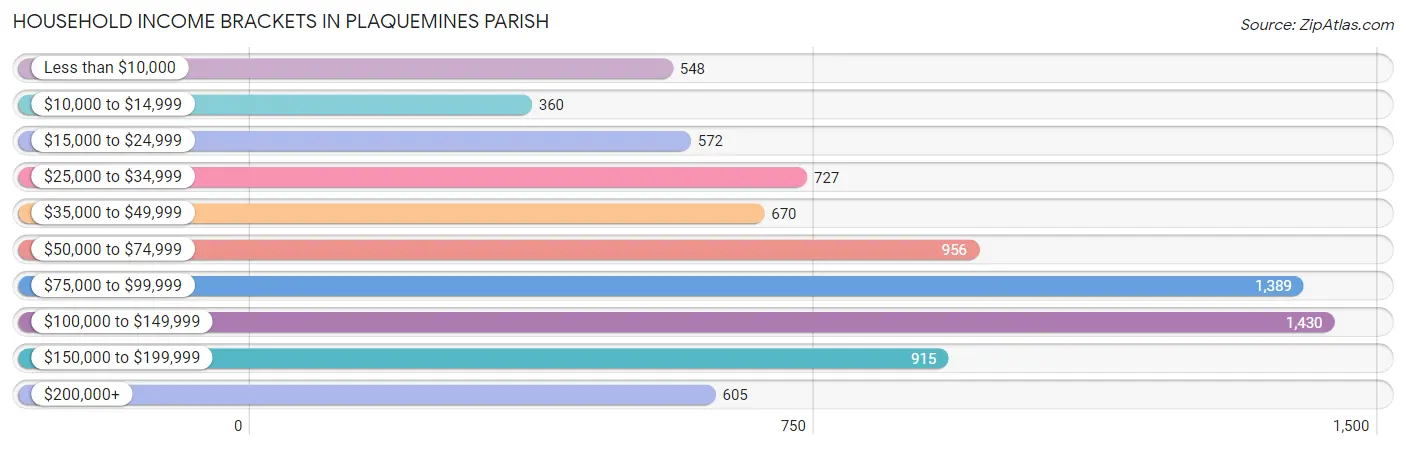
| Income Bracket | # Households | % Households |
| Less than $10,000 | 548 | 6.7% |
| $10,000 to $14,999 | 360 | 4.4% |
| $15,000 to $24,999 | 572 | 7.0% |
| $25,000 to $34,999 | 727 | 8.9% |
| $35,000 to $49,999 | 670 | 8.2% |
| $50,000 to $74,999 | 956 | 11.7% |
| $75,000 to $99,999 | 1,389 | 17.0% |
| $100,000 to $149,999 | 1,430 | 17.5% |
| $150,000 to $199,999 | 915 | 11.2% |
| $200,000+ | 605 | 7.4% |
Household Income by Householder Age in Plaquemines Parish
The median household income in Plaquemines Parish is $77,996, with the highest median household income of $92,188 found in the 45 to 64 years age bracket for the primary householder. A total of 3,116 households (38.1%) fall into this category. Meanwhile, the 15 to 24 years age bracket for the primary householder has the lowest median household income of $0, with 178 households (2.2%) in this group.
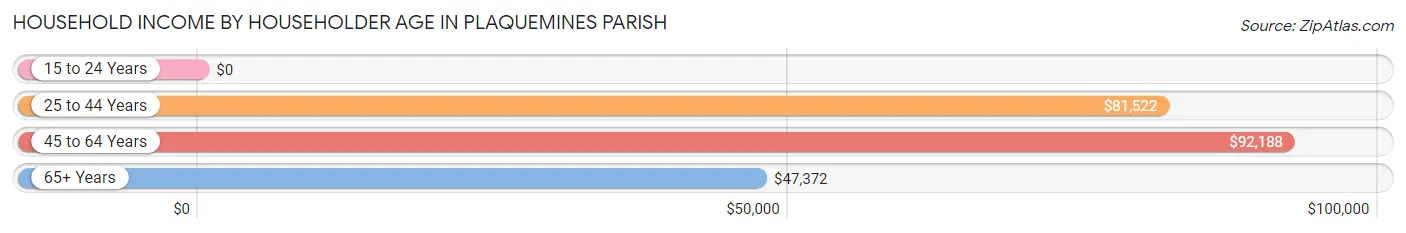
| Income Bracket | # Households | Median Income |
| 15 to 24 Years | 178 (2.2%) | $0 |
| 25 to 44 Years | 2,894 (35.4%) | $81,522 |
| 45 to 64 Years | 3,116 (38.1%) | $92,188 |
| 65+ Years | 1,984 (24.3%) | $47,372 |
| Total | 8,172 (100.0%) | $77,996 |
Poverty in Plaquemines Parish
Income Below Poverty by Sex and Age in Plaquemines Parish
With 11.9% poverty level for males and 17.7% for females among the residents of Plaquemines Parish, under 5 year old males and 6 to 11 year old females are the most vulnerable to poverty, with 245 males (38.3%) and 312 females (39.8%) in their respective age groups living below the poverty level.
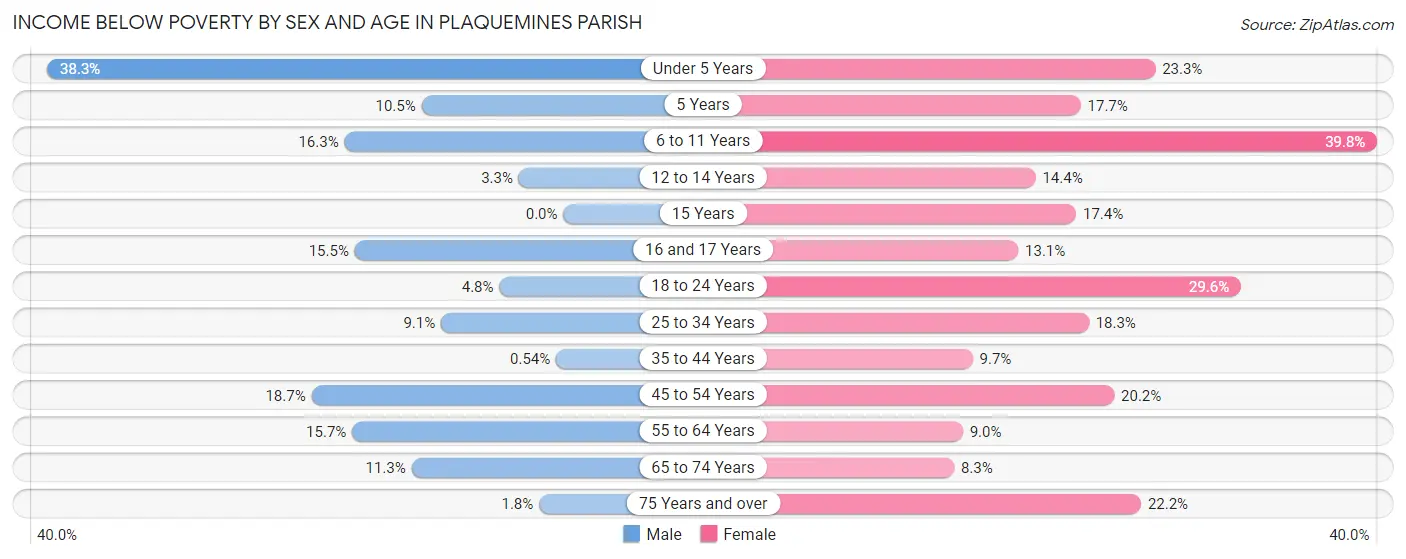
| Age Bracket | Male | Female |
| Under 5 Years | 245 (38.3%) | 172 (23.3%) |
| 5 Years | 14 (10.5%) | 39 (17.7%) |
| 6 to 11 Years | 216 (16.3%) | 312 (39.8%) |
| 12 to 14 Years | 20 (3.3%) | 66 (14.4%) |
| 15 Years | 0 (0.0%) | 8 (17.4%) |
| 16 and 17 Years | 55 (15.5%) | 53 (13.1%) |
| 18 to 24 Years | 54 (4.8%) | 206 (29.6%) |
| 25 to 34 Years | 139 (9.1%) | 305 (18.3%) |
| 35 to 44 Years | 8 (0.5%) | 146 (9.7%) |
| 45 to 54 Years | 326 (18.7%) | 291 (20.2%) |
| 55 to 64 Years | 226 (15.7%) | 135 (9.0%) |
| 65 to 74 Years | 110 (11.3%) | 78 (8.3%) |
| 75 Years and over | 8 (1.8%) | 147 (22.2%) |
| Total | 1,421 (11.9%) | 1,958 (17.7%) |
Income Above Poverty by Sex and Age in Plaquemines Parish
According to the poverty statistics in Plaquemines Parish, males aged 15 years and females aged 65 to 74 years are the age groups that are most secure financially, with 100.0% of males and 91.7% of females in these age groups living above the poverty line.
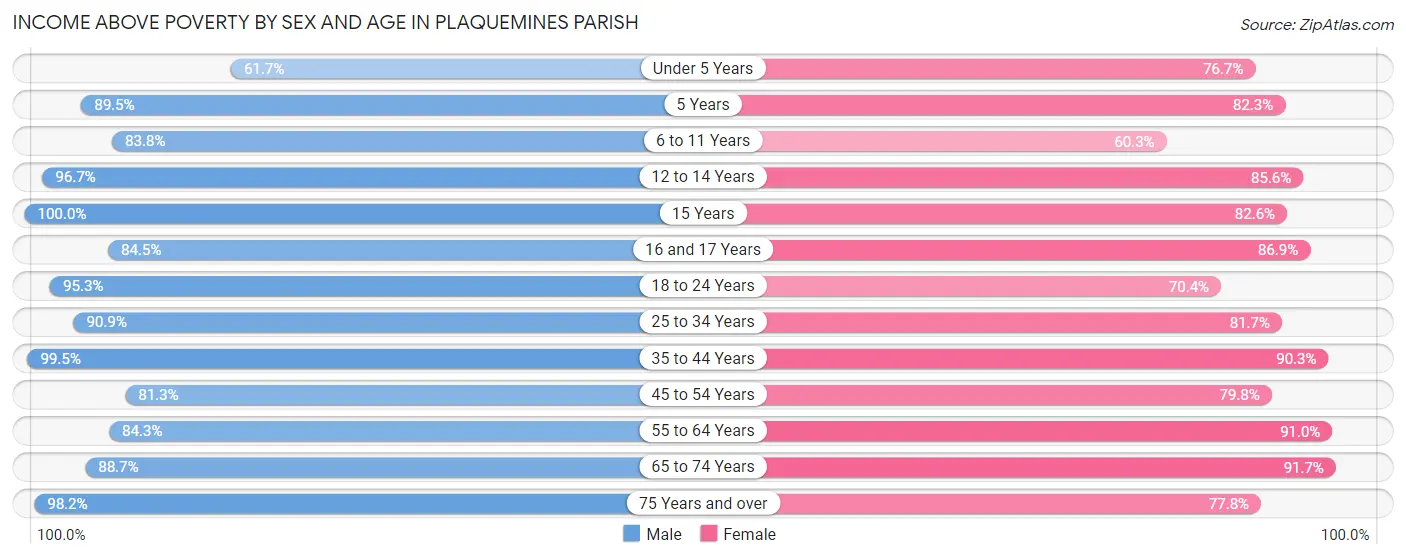
| Age Bracket | Male | Female |
| Under 5 Years | 394 (61.7%) | 567 (76.7%) |
| 5 Years | 119 (89.5%) | 181 (82.3%) |
| 6 to 11 Years | 1,113 (83.8%) | 473 (60.3%) |
| 12 to 14 Years | 584 (96.7%) | 393 (85.6%) |
| 15 Years | 117 (100.0%) | 38 (82.6%) |
| 16 and 17 Years | 300 (84.5%) | 352 (86.9%) |
| 18 to 24 Years | 1,083 (95.3%) | 489 (70.4%) |
| 25 to 34 Years | 1,392 (90.9%) | 1,359 (81.7%) |
| 35 to 44 Years | 1,473 (99.5%) | 1,358 (90.3%) |
| 45 to 54 Years | 1,417 (81.3%) | 1,148 (79.8%) |
| 55 to 64 Years | 1,215 (84.3%) | 1,369 (91.0%) |
| 65 to 74 Years | 866 (88.7%) | 858 (91.7%) |
| 75 Years and over | 437 (98.2%) | 515 (77.8%) |
| Total | 10,510 (88.1%) | 9,100 (82.3%) |
Income Below Poverty Among Married-Couple Families in Plaquemines Parish
The poverty statistics for married-couple families in Plaquemines Parish show that 6.2% or 302 of the total 4,850 families live below the poverty line. Families with 3 or 4 children have the highest poverty rate of 25.8%, comprising of 161 families. On the other hand, families with 5 or more children have the lowest poverty rate of 0.0%, which includes 0 families.
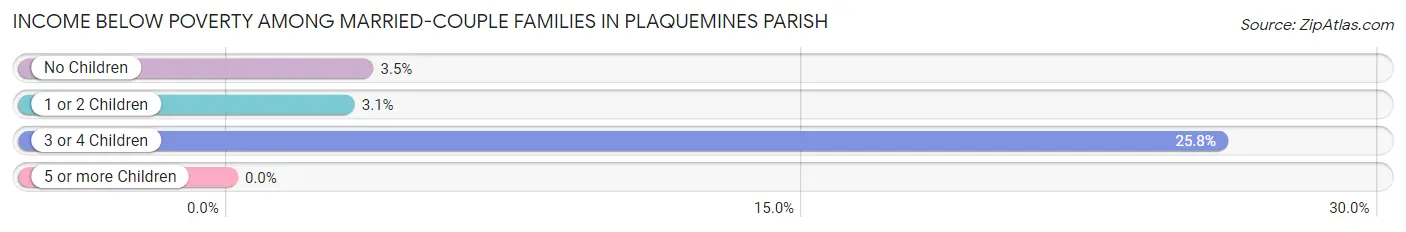
| Children | Above Poverty | Below Poverty |
| No Children | 2,482 (96.5%) | 91 (3.5%) |
| 1 or 2 Children | 1,592 (97.0%) | 50 (3.0%) |
| 3 or 4 Children | 462 (74.2%) | 161 (25.8%) |
| 5 or more Children | 12 (100.0%) | 0 (0.0%) |
| Total | 4,548 (93.8%) | 302 (6.2%) |
Income Below Poverty Among Single-Parent Households in Plaquemines Parish
According to the poverty data in Plaquemines Parish, 7.6% or 25 single-father households and 36.8% or 384 single-mother households are living below the poverty line. Among single-father households, those with 1 or 2 children have the highest poverty rate, with 17 households (11.9%) experiencing poverty. Likewise, among single-mother households, those with 5 or more children have the highest poverty rate, with 10 households (100.0%) falling below the poverty line.
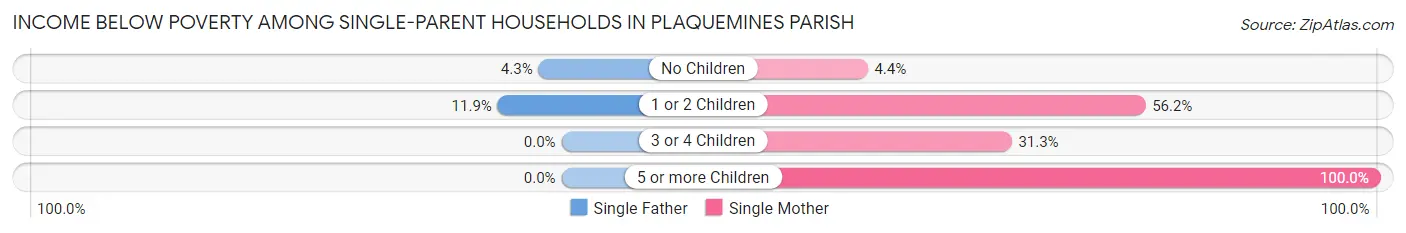
| Children | Single Father | Single Mother |
| No Children | 8 (4.3%) | 16 (4.4%) |
| 1 or 2 Children | 17 (11.9%) | 333 (56.2%) |
| 3 or 4 Children | 0 (0.0%) | 25 (31.2%) |
| 5 or more Children | 0 (0.0%) | 10 (100.0%) |
| Total | 25 (7.6%) | 384 (36.8%) |
Income Below Poverty Among Married-Couple vs Single-Parent Households in Plaquemines Parish
The poverty data for Plaquemines Parish shows that 302 of the married-couple family households (6.2%) and 409 of the single-parent households (29.8%) are living below the poverty level. Within the married-couple family households, those with 3 or 4 children have the highest poverty rate, with 161 households (25.8%) falling below the poverty line. Among the single-parent households, those with 5 or more children have the highest poverty rate, with 10 household (100.0%) living below poverty.
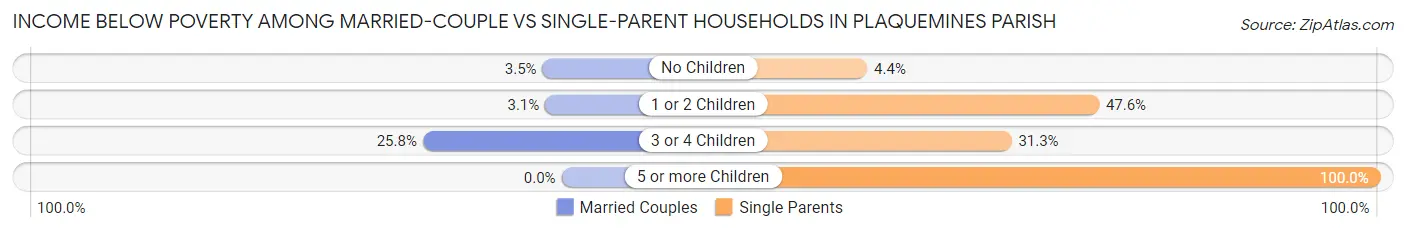
| Children | Married-Couple Families | Single-Parent Households |
| No Children | 91 (3.5%) | 24 (4.4%) |
| 1 or 2 Children | 50 (3.0%) | 350 (47.5%) |
| 3 or 4 Children | 161 (25.8%) | 25 (31.2%) |
| 5 or more Children | 0 (0.0%) | 10 (100.0%) |
| Total | 302 (6.2%) | 409 (29.8%) |
Employment Characteristics in Plaquemines Parish
Employment by Class of Employer in Plaquemines Parish
Among the 10,962 employed individuals in Plaquemines Parish, private company employees (6,351 | 57.9%), federal government employees (1,409 | 12.9%), and local government employees (986 | 9.0%) make up the most common classes of employment.
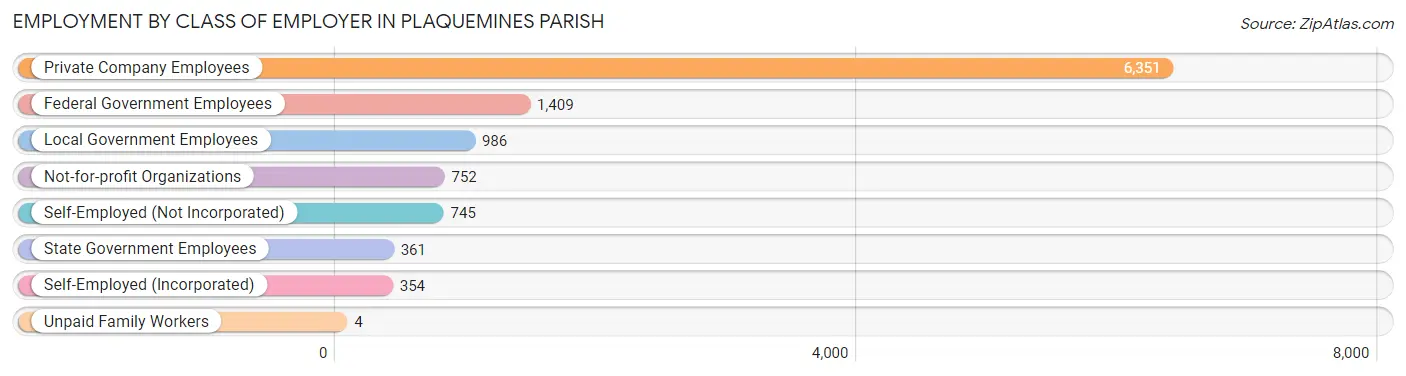
| Employer Class | # Employees | % Employees |
| Private Company Employees | 6,351 | 57.9% |
| Self-Employed (Incorporated) | 354 | 3.2% |
| Self-Employed (Not Incorporated) | 745 | 6.8% |
| Not-for-profit Organizations | 752 | 6.9% |
| Local Government Employees | 986 | 9.0% |
| State Government Employees | 361 | 3.3% |
| Federal Government Employees | 1,409 | 12.9% |
| Unpaid Family Workers | 4 | 0.0% |
| Total | 10,962 | 100.0% |
Employment Status by Age in Plaquemines Parish
According to the labor force statistics for Plaquemines Parish, out of the total population over 16 years of age (18,233), 65.0% or 11,851 individuals are in the labor force, with 4.4% or 521 of them unemployed. The age group with the highest labor force participation rate is 25 to 29 years, with 88.2% or 1,384 individuals in the labor force. Within the labor force, the 20 to 24 years age range has the highest percentage of unemployed individuals, with 19.4% or 212 of them being unemployed.
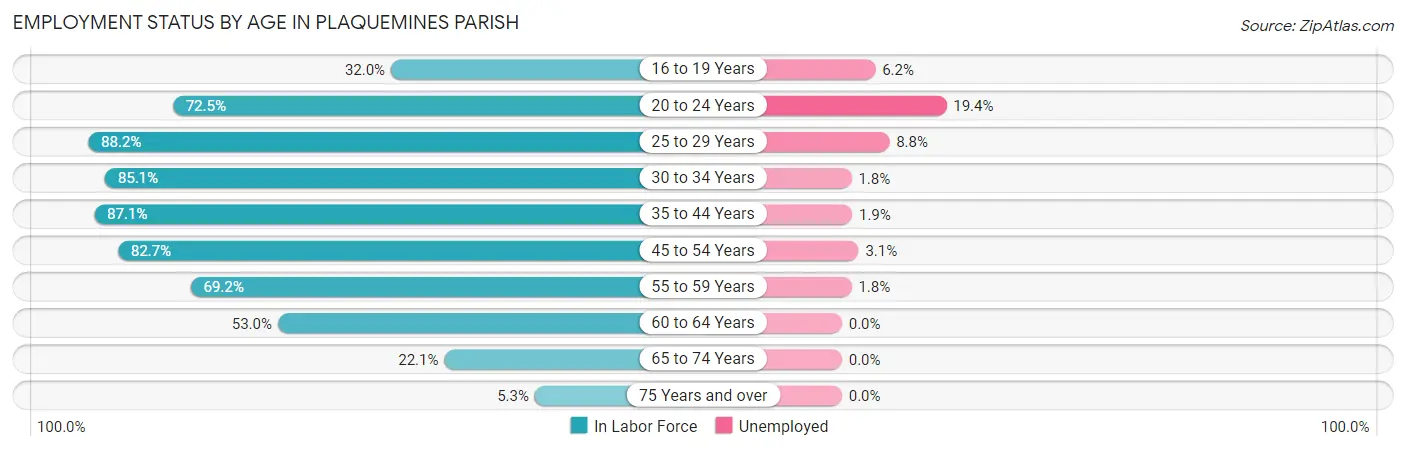
| Age Bracket | In Labor Force | Unemployed |
| 16 to 19 Years | 379 (32.0%) | 23 (6.2%) |
| 20 to 24 Years | 1,094 (72.5%) | 212 (19.4%) |
| 25 to 29 Years | 1,384 (88.2%) | 122 (8.8%) |
| 30 to 34 Years | 1,423 (85.1%) | 26 (1.8%) |
| 35 to 44 Years | 2,630 (87.1%) | 50 (1.9%) |
| 45 to 54 Years | 2,637 (82.7%) | 82 (3.1%) |
| 55 to 59 Years | 1,019 (69.2%) | 18 (1.8%) |
| 60 to 64 Years | 798 (53.0%) | 0 (0.0%) |
| 65 to 74 Years | 433 (22.1%) | 0 (0.0%) |
| 75 Years and over | 61 (5.3%) | 0 (0.0%) |
| Total | 11,851 (65.0%) | 521 (4.4%) |
Employment Status by Educational Attainment in Plaquemines Parish
According to labor force statistics for Plaquemines Parish, 79.6% of individuals (9,893) out of the total population between 25 and 64 years of age (12,428) are in the labor force, with 3.0% or 297 of them being unemployed. The group with the highest labor force participation rate are those with the educational attainment of bachelor's degree or higher, with 94.1% or 2,384 individuals in the labor force. Within the labor force, individuals with less than high school education have the highest percentage of unemployment, with 7.7% or 59 of them being unemployed.
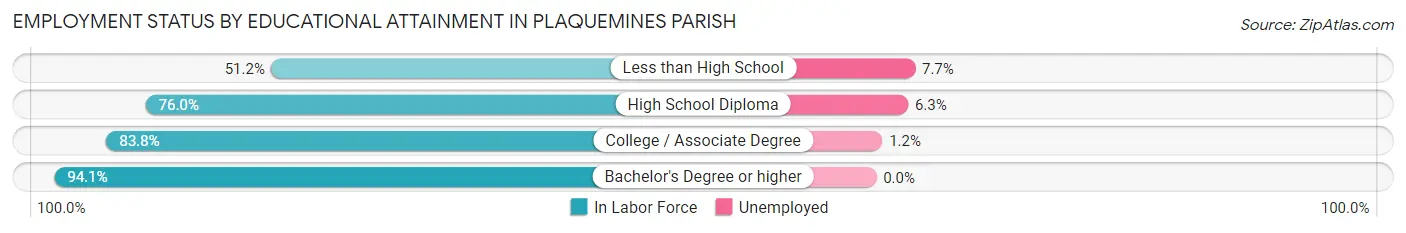
| Educational Attainment | In Labor Force | Unemployed |
| Less than High School | 767 (51.2%) | 115 (7.7%) |
| High School Diploma | 2,845 (76.0%) | 236 (6.3%) |
| College / Associate Degree | 3,898 (83.8%) | 56 (1.2%) |
| Bachelor's Degree or higher | 2,384 (94.1%) | 0 (0.0%) |
| Total | 9,893 (79.6%) | 373 (3.0%) |
Employment Occupations by Sex in Plaquemines Parish
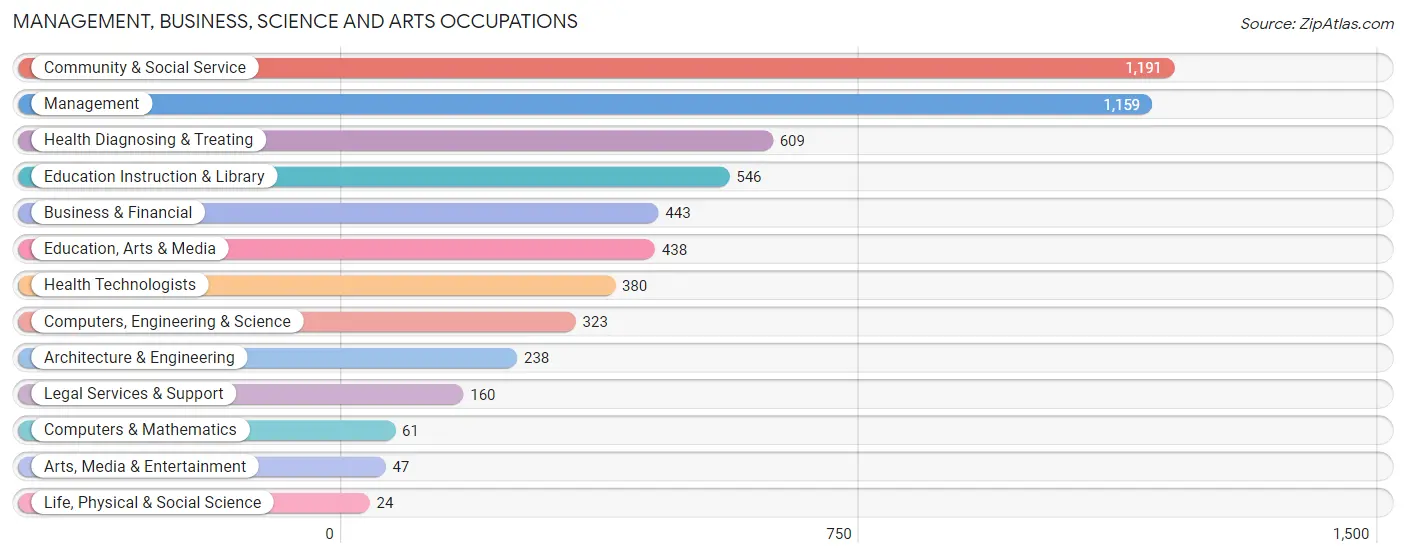
Management, Business, Science and Arts Occupations
The most common Management, Business, Science and Arts occupations in Plaquemines Parish are Community & Social Service (1,191 | 11.3%), Management (1,159 | 11.0%), Health Diagnosing & Treating (609 | 5.8%), Education Instruction & Library (546 | 5.2%), and Business & Financial (443 | 4.2%).
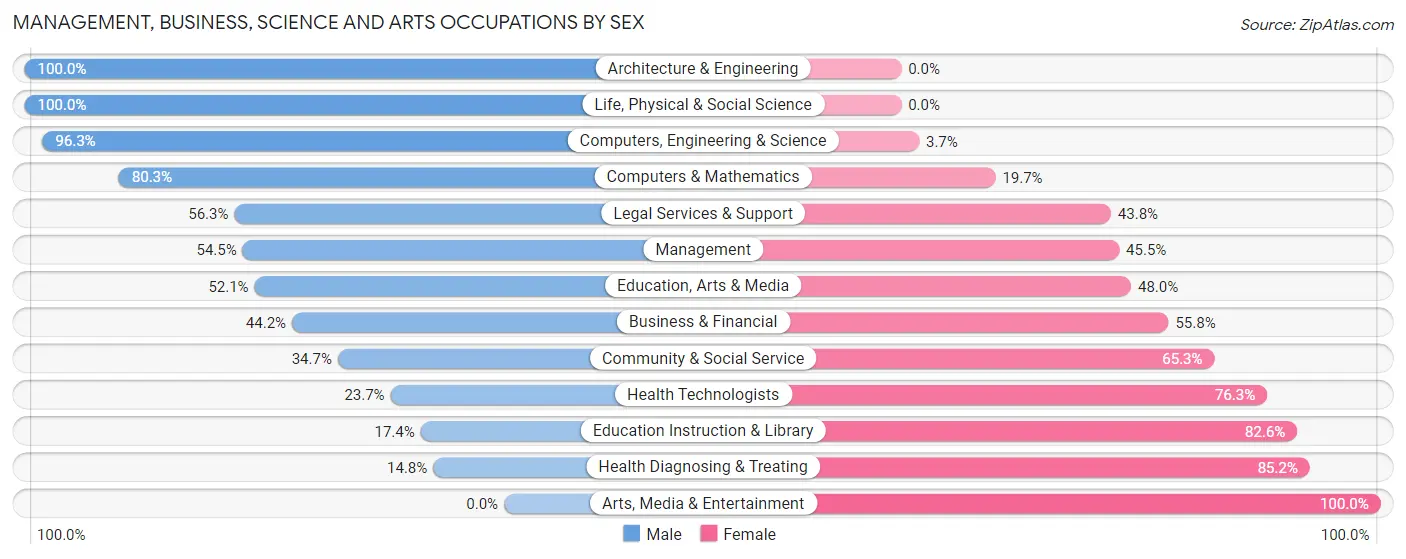
Management, Business, Science and Arts Occupations by Sex
Within the Management, Business, Science and Arts occupations in Plaquemines Parish, the most male-oriented occupations are Architecture & Engineering (100.0%), Life, Physical & Social Science (100.0%), and Computers, Engineering & Science (96.3%), while the most female-oriented occupations are Arts, Media & Entertainment (100.0%), Health Diagnosing & Treating (85.2%), and Education Instruction & Library (82.6%).
| Occupation | Male | Female |
| Management | 632 (54.5%) | 527 (45.5%) |
| Business & Financial | 196 (44.2%) | 247 (55.8%) |
| Computers, Engineering & Science | 311 (96.3%) | 12 (3.7%) |
| Computers & Mathematics | 49 (80.3%) | 12 (19.7%) |
| Architecture & Engineering | 238 (100.0%) | 0 (0.0%) |
| Life, Physical & Social Science | 24 (100.0%) | 0 (0.0%) |
| Community & Social Service | 413 (34.7%) | 778 (65.3%) |
| Education, Arts & Media | 228 (52.0%) | 210 (47.9%) |
| Legal Services & Support | 90 (56.2%) | 70 (43.8%) |
| Education Instruction & Library | 95 (17.4%) | 451 (82.6%) |
| Arts, Media & Entertainment | 0 (0.0%) | 47 (100.0%) |
| Health Diagnosing & Treating | 90 (14.8%) | 519 (85.2%) |
| Health Technologists | 90 (23.7%) | 290 (76.3%) |
| Total (Category) | 1,642 (44.1%) | 2,083 (55.9%) |
| Total (Overall) | 5,904 (55.9%) | 4,666 (44.1%) |
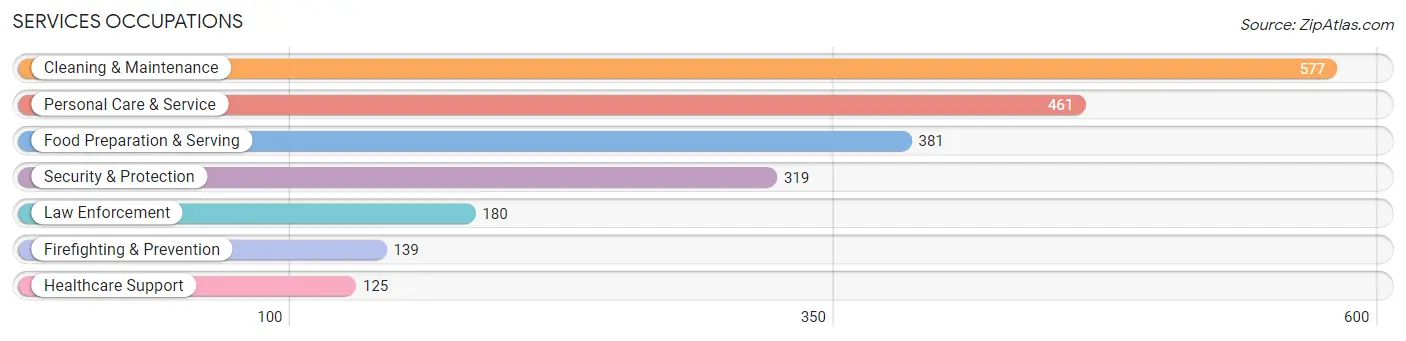
Services Occupations
The most common Services occupations in Plaquemines Parish are Cleaning & Maintenance (577 | 5.5%), Personal Care & Service (461 | 4.4%), Food Preparation & Serving (381 | 3.6%), Security & Protection (319 | 3.0%), and Law Enforcement (180 | 1.7%).
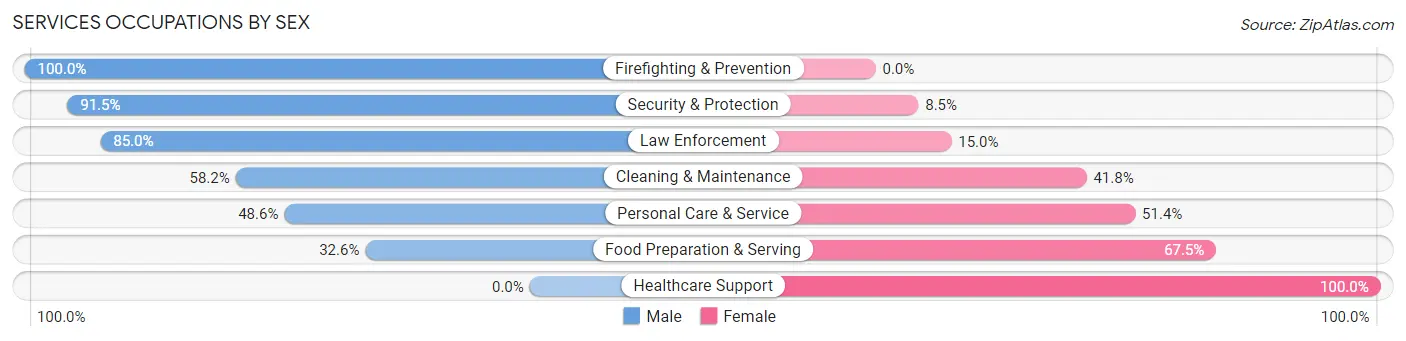
Services Occupations by Sex
Within the Services occupations in Plaquemines Parish, the most male-oriented occupations are Firefighting & Prevention (100.0%), Security & Protection (91.5%), and Law Enforcement (85.0%), while the most female-oriented occupations are Healthcare Support (100.0%), Food Preparation & Serving (67.4%), and Personal Care & Service (51.4%).
| Occupation | Male | Female |
| Healthcare Support | 0 (0.0%) | 125 (100.0%) |
| Security & Protection | 292 (91.5%) | 27 (8.5%) |
| Firefighting & Prevention | 139 (100.0%) | 0 (0.0%) |
| Law Enforcement | 153 (85.0%) | 27 (15.0%) |
| Food Preparation & Serving | 124 (32.6%) | 257 (67.4%) |
| Cleaning & Maintenance | 336 (58.2%) | 241 (41.8%) |
| Personal Care & Service | 224 (48.6%) | 237 (51.4%) |
| Total (Category) | 976 (52.4%) | 887 (47.6%) |
| Total (Overall) | 5,904 (55.9%) | 4,666 (44.1%) |
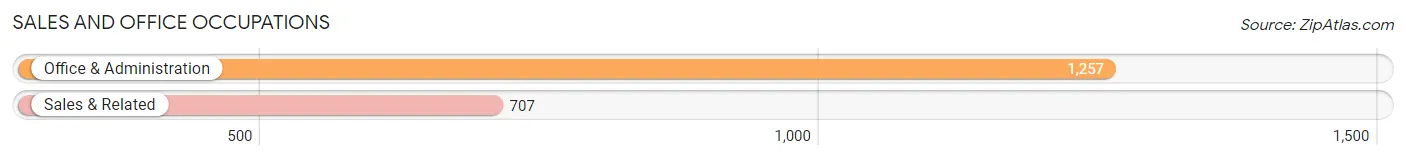
Sales and Office Occupations
The most common Sales and Office occupations in Plaquemines Parish are Office & Administration (1,257 | 11.9%), and Sales & Related (707 | 6.7%).
Sales and Office Occupations by Sex
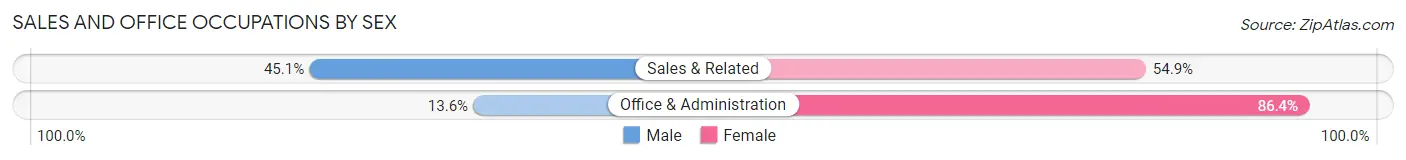
| Occupation | Male | Female |
| Sales & Related | 319 (45.1%) | 388 (54.9%) |
| Office & Administration | 171 (13.6%) | 1,086 (86.4%) |
| Total (Category) | 490 (24.9%) | 1,474 (75.0%) |
| Total (Overall) | 5,904 (55.9%) | 4,666 (44.1%) |
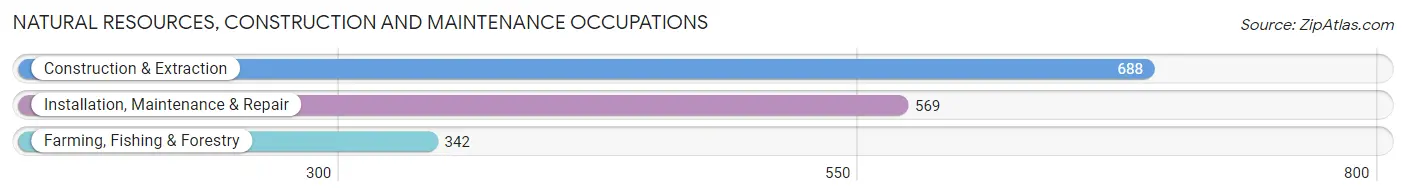
Natural Resources, Construction and Maintenance Occupations
The most common Natural Resources, Construction and Maintenance occupations in Plaquemines Parish are Construction & Extraction (688 | 6.5%), Installation, Maintenance & Repair (569 | 5.4%), and Farming, Fishing & Forestry (342 | 3.2%).
Natural Resources, Construction and Maintenance Occupations by Sex
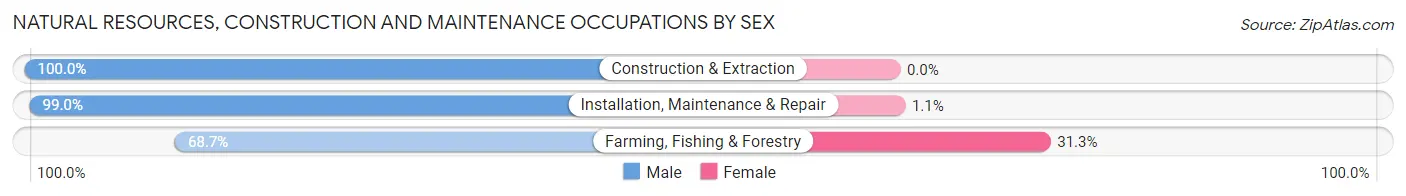
| Occupation | Male | Female |
| Farming, Fishing & Forestry | 235 (68.7%) | 107 (31.3%) |
| Construction & Extraction | 688 (100.0%) | 0 (0.0%) |
| Installation, Maintenance & Repair | 563 (99.0%) | 6 (1.1%) |
| Total (Category) | 1,486 (92.9%) | 113 (7.1%) |
| Total (Overall) | 5,904 (55.9%) | 4,666 (44.1%) |
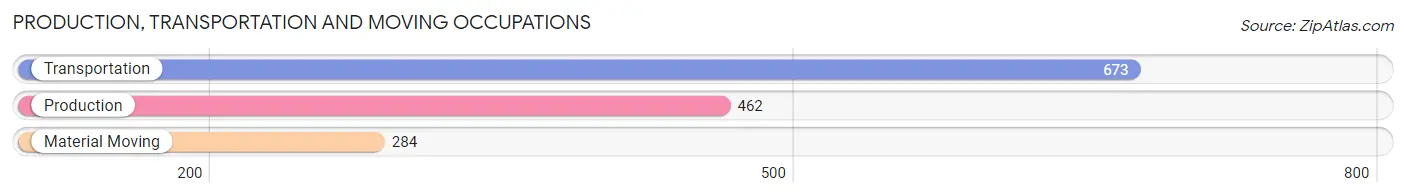
Production, Transportation and Moving Occupations
The most common Production, Transportation and Moving occupations in Plaquemines Parish are Transportation (673 | 6.4%), Production (462 | 4.4%), and Material Moving (284 | 2.7%).
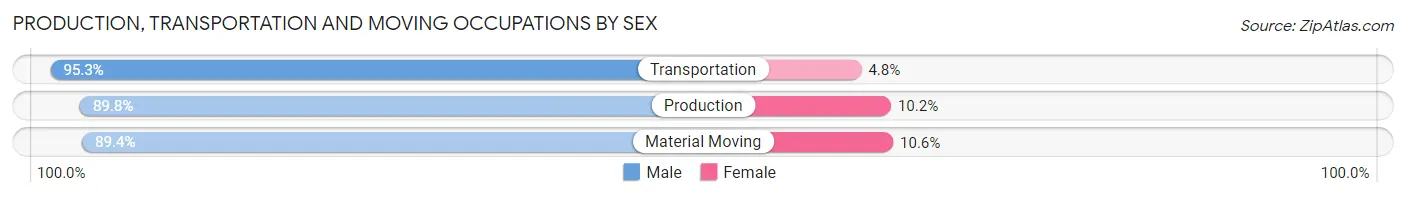
Production, Transportation and Moving Occupations by Sex
| Occupation | Male | Female |
| Production | 415 (89.8%) | 47 (10.2%) |
| Transportation | 641 (95.3%) | 32 (4.8%) |
| Material Moving | 254 (89.4%) | 30 (10.6%) |
| Total (Category) | 1,310 (92.3%) | 109 (7.7%) |
| Total (Overall) | 5,904 (55.9%) | 4,666 (44.1%) |
Employment Industries by Sex in Plaquemines Parish
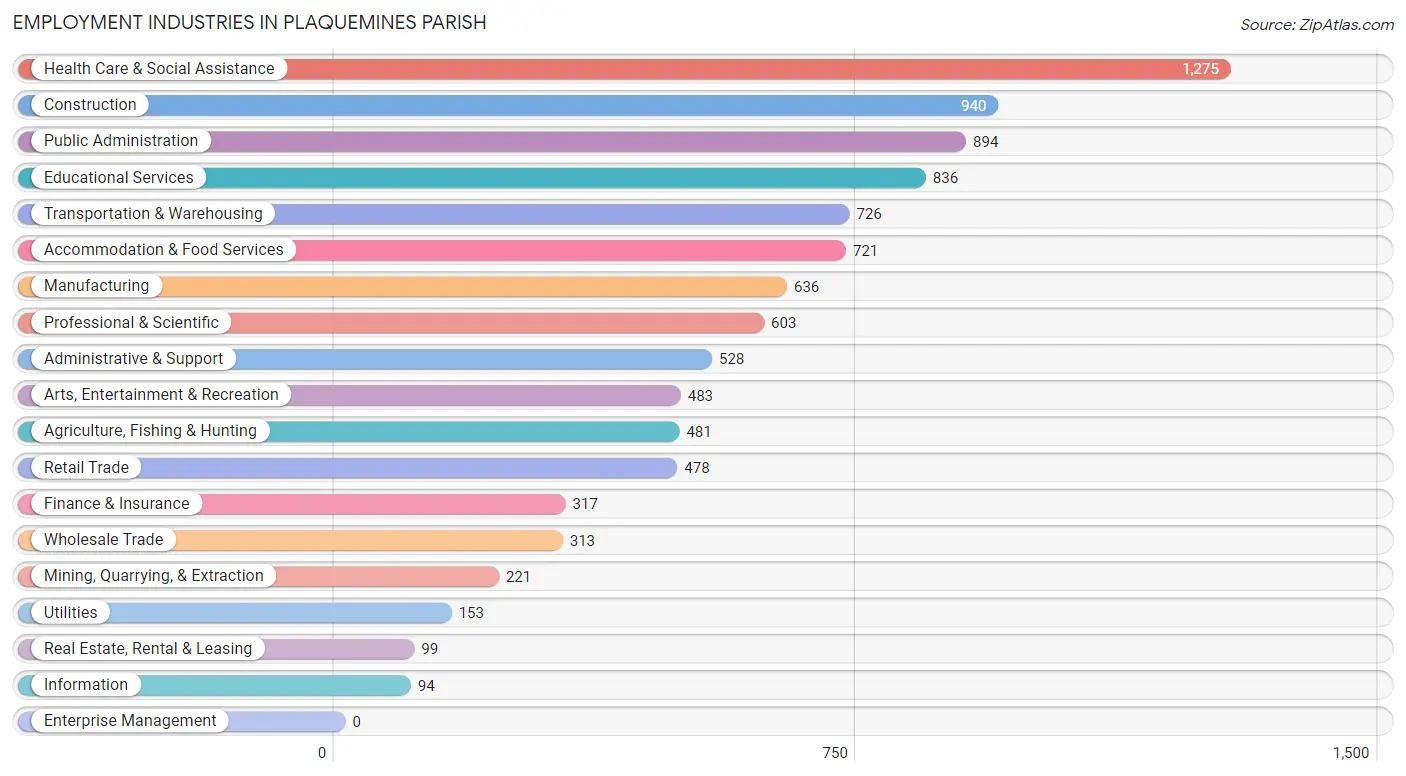
Employment Industries in Plaquemines Parish
The major employment industries in Plaquemines Parish include Health Care & Social Assistance (1,275 | 12.1%), Construction (940 | 8.9%), Public Administration (894 | 8.5%), Educational Services (836 | 7.9%), and Transportation & Warehousing (726 | 6.9%).
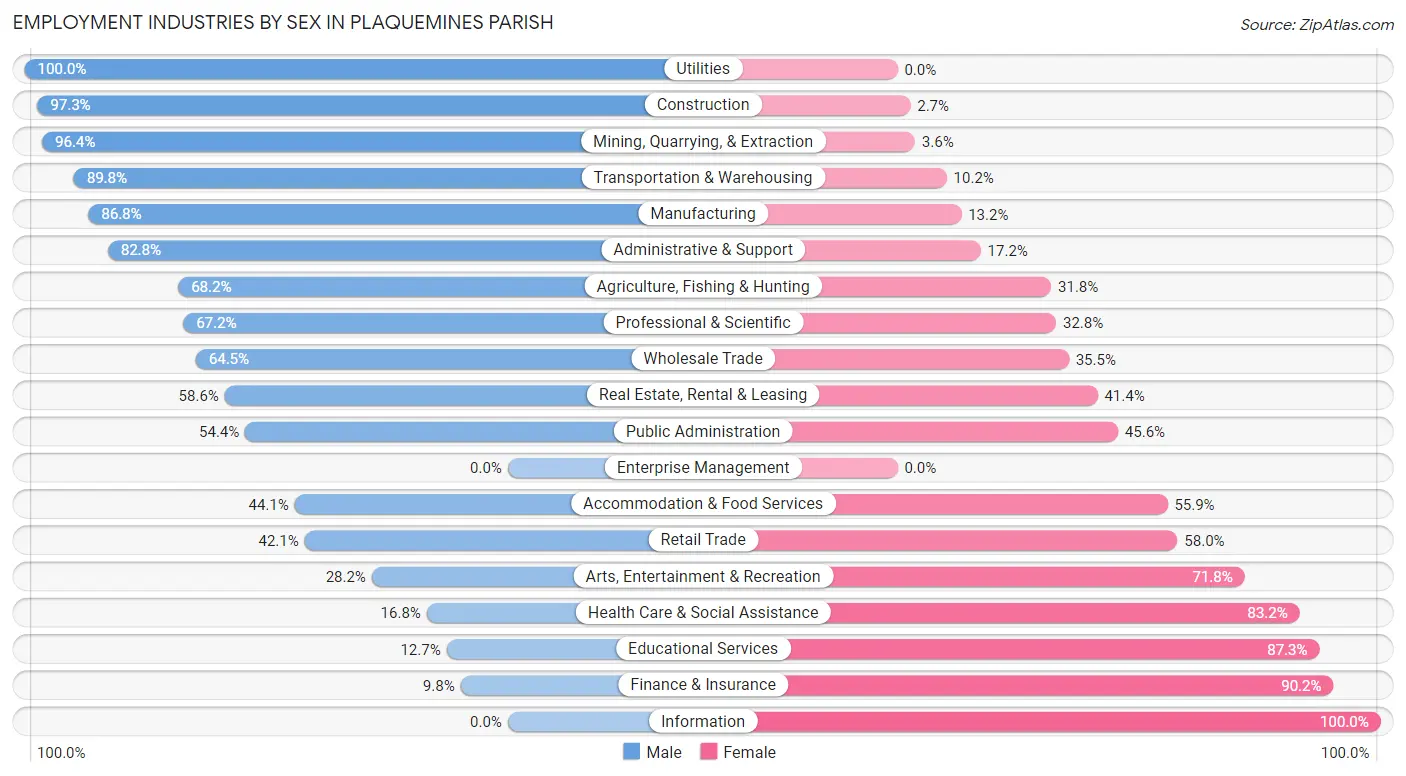
Employment Industries by Sex in Plaquemines Parish
The Plaquemines Parish industries that see more men than women are Utilities (100.0%), Construction (97.3%), and Mining, Quarrying, & Extraction (96.4%), whereas the industries that tend to have a higher number of women are Information (100.0%), Finance & Insurance (90.2%), and Educational Services (87.3%).
| Industry | Male | Female |
| Agriculture, Fishing & Hunting | 328 (68.2%) | 153 (31.8%) |
| Mining, Quarrying, & Extraction | 213 (96.4%) | 8 (3.6%) |
| Construction | 915 (97.3%) | 25 (2.7%) |
| Manufacturing | 552 (86.8%) | 84 (13.2%) |
| Wholesale Trade | 202 (64.5%) | 111 (35.5%) |
| Retail Trade | 201 (42.0%) | 277 (58.0%) |
| Transportation & Warehousing | 652 (89.8%) | 74 (10.2%) |
| Utilities | 153 (100.0%) | 0 (0.0%) |
| Information | 0 (0.0%) | 94 (100.0%) |
| Finance & Insurance | 31 (9.8%) | 286 (90.2%) |
| Real Estate, Rental & Leasing | 58 (58.6%) | 41 (41.4%) |
| Professional & Scientific | 405 (67.2%) | 198 (32.8%) |
| Enterprise Management | 0 (0.0%) | 0 (0.0%) |
| Administrative & Support | 437 (82.8%) | 91 (17.2%) |
| Educational Services | 106 (12.7%) | 730 (87.3%) |
| Health Care & Social Assistance | 214 (16.8%) | 1,061 (83.2%) |
| Arts, Entertainment & Recreation | 136 (28.2%) | 347 (71.8%) |
| Accommodation & Food Services | 318 (44.1%) | 403 (55.9%) |
| Public Administration | 486 (54.4%) | 408 (45.6%) |
| Total | 5,904 (55.9%) | 4,666 (44.1%) |
Education in Plaquemines Parish
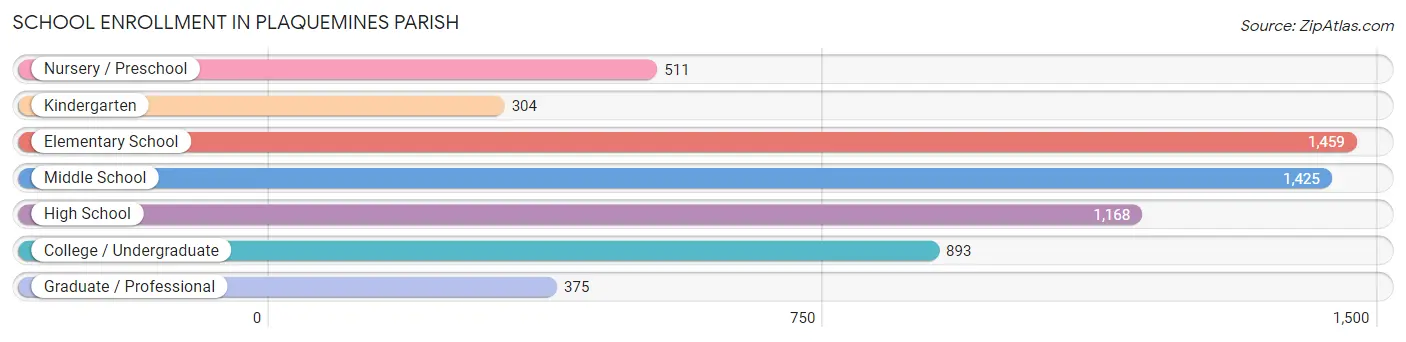
School Enrollment in Plaquemines Parish
The most common levels of schooling among the 6,135 students in Plaquemines Parish are elementary school (1,459 | 23.8%), middle school (1,425 | 23.2%), and high school (1,168 | 19.0%).
| School Level | # Students | % Students |
| Nursery / Preschool | 511 | 8.3% |
| Kindergarten | 304 | 5.0% |
| Elementary School | 1,459 | 23.8% |
| Middle School | 1,425 | 23.2% |
| High School | 1,168 | 19.0% |
| College / Undergraduate | 893 | 14.6% |
| Graduate / Professional | 375 | 6.1% |
| Total | 6,135 | 100.0% |
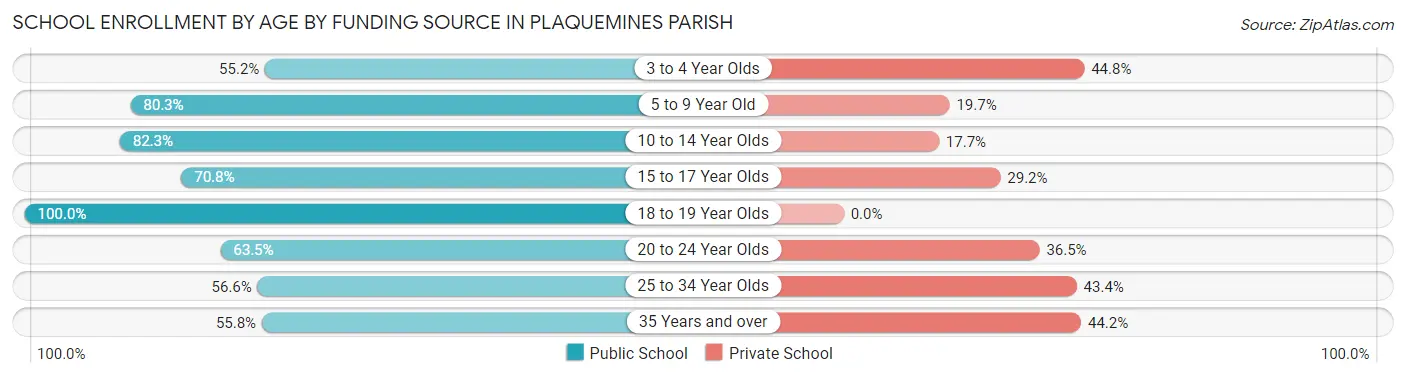
School Enrollment by Age by Funding Source in Plaquemines Parish
Out of a total of 6,135 students who are enrolled in schools in Plaquemines Parish, 1,521 (24.8%) attend a private institution, while the remaining 4,614 (75.2%) are enrolled in public schools. The age group of 3 to 4 year olds has the highest likelihood of being enrolled in private schools, with 164 (44.8% in the age bracket) enrolled. Conversely, the age group of 18 to 19 year olds has the lowest likelihood of being enrolled in a private school, with 361 (100.0% in the age bracket) attending a public institution.
| Age Bracket | Public School | Private School |
| 3 to 4 Year Olds | 202 (55.2%) | 164 (44.8%) |
| 5 to 9 Year Old | 1,291 (80.3%) | 317 (19.7%) |
| 10 to 14 Year Olds | 1,442 (82.3%) | 311 (17.7%) |
| 15 to 17 Year Olds | 655 (70.8%) | 270 (29.2%) |
| 18 to 19 Year Olds | 361 (100.0%) | 0 (0.0%) |
| 20 to 24 Year Olds | 263 (63.5%) | 151 (36.5%) |
| 25 to 34 Year Olds | 210 (56.6%) | 161 (43.4%) |
| 35 Years and over | 188 (55.8%) | 149 (44.2%) |
| Total | 4,614 (75.2%) | 1,521 (24.8%) |
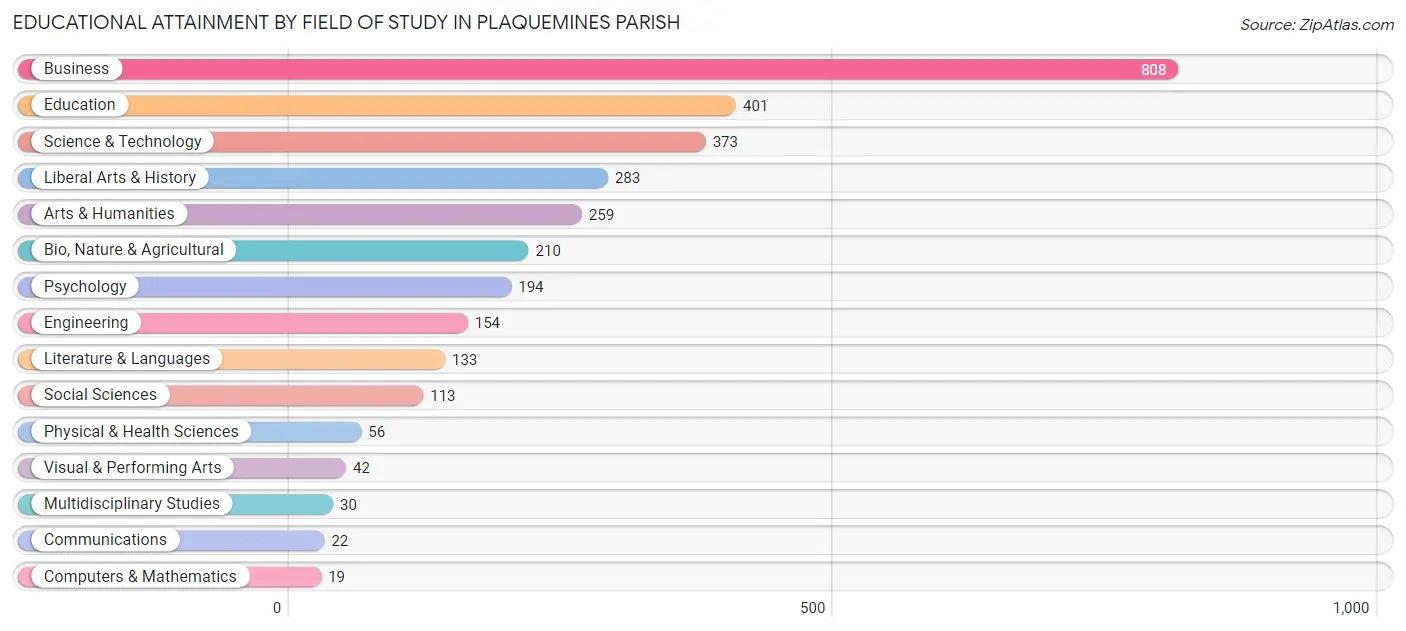
Educational Attainment by Field of Study in Plaquemines Parish
Business (808 | 26.1%), education (401 | 13.0%), science & technology (373 | 12.0%), liberal arts & history (283 | 9.1%), and arts & humanities (259 | 8.4%) are the most common fields of study among 3,097 individuals in Plaquemines Parish who have obtained a bachelor's degree or higher.
| Field of Study | # Graduates | % Graduates |
| Computers & Mathematics | 19 | 0.6% |
| Bio, Nature & Agricultural | 210 | 6.8% |
| Physical & Health Sciences | 56 | 1.8% |
| Psychology | 194 | 6.3% |
| Social Sciences | 113 | 3.6% |
| Engineering | 154 | 5.0% |
| Multidisciplinary Studies | 30 | 1.0% |
| Science & Technology | 373 | 12.0% |
| Business | 808 | 26.1% |
| Education | 401 | 13.0% |
| Literature & Languages | 133 | 4.3% |
| Liberal Arts & History | 283 | 9.1% |
| Visual & Performing Arts | 42 | 1.4% |
| Communications | 22 | 0.7% |
| Arts & Humanities | 259 | 8.4% |
| Total | 3,097 | 100.0% |
Transportation & Commute in Plaquemines Parish
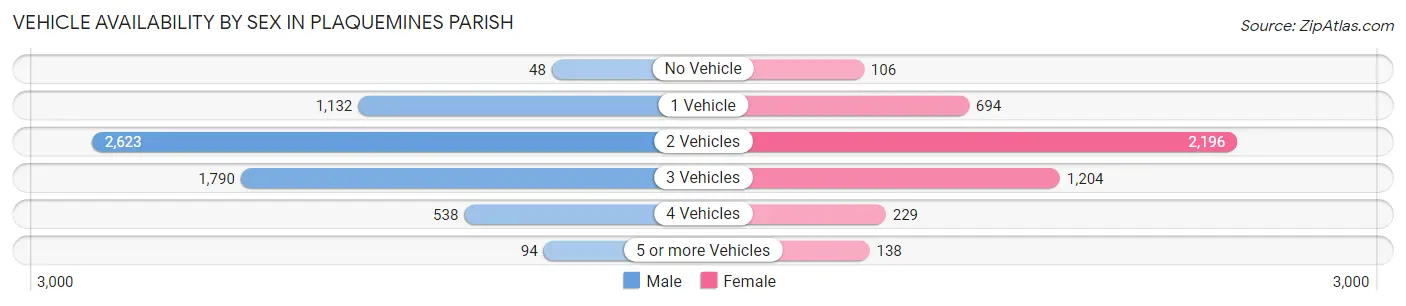
Vehicle Availability by Sex in Plaquemines Parish
The most prevalent vehicle ownership categories in Plaquemines Parish are males with 2 vehicles (2,623, accounting for 42.1%) and females with 2 vehicles (2,196, making up 57.4%).
| Vehicles Available | Male | Female |
| No Vehicle | 48 (0.8%) | 106 (2.3%) |
| 1 Vehicle | 1,132 (18.2%) | 694 (15.2%) |
| 2 Vehicles | 2,623 (42.1%) | 2,196 (48.1%) |
| 3 Vehicles | 1,790 (28.8%) | 1,204 (26.4%) |
| 4 Vehicles | 538 (8.6%) | 229 (5.0%) |
| 5 or more Vehicles | 94 (1.5%) | 138 (3.0%) |
| Total | 6,225 (100.0%) | 4,567 (100.0%) |
Commute Time in Plaquemines Parish
The most frequently occuring commute durations in Plaquemines Parish are 30 to 34 minutes (1,905 commuters, 17.8%), 5 to 9 minutes (1,536 commuters, 14.4%), and 10 to 14 minutes (1,337 commuters, 12.5%).
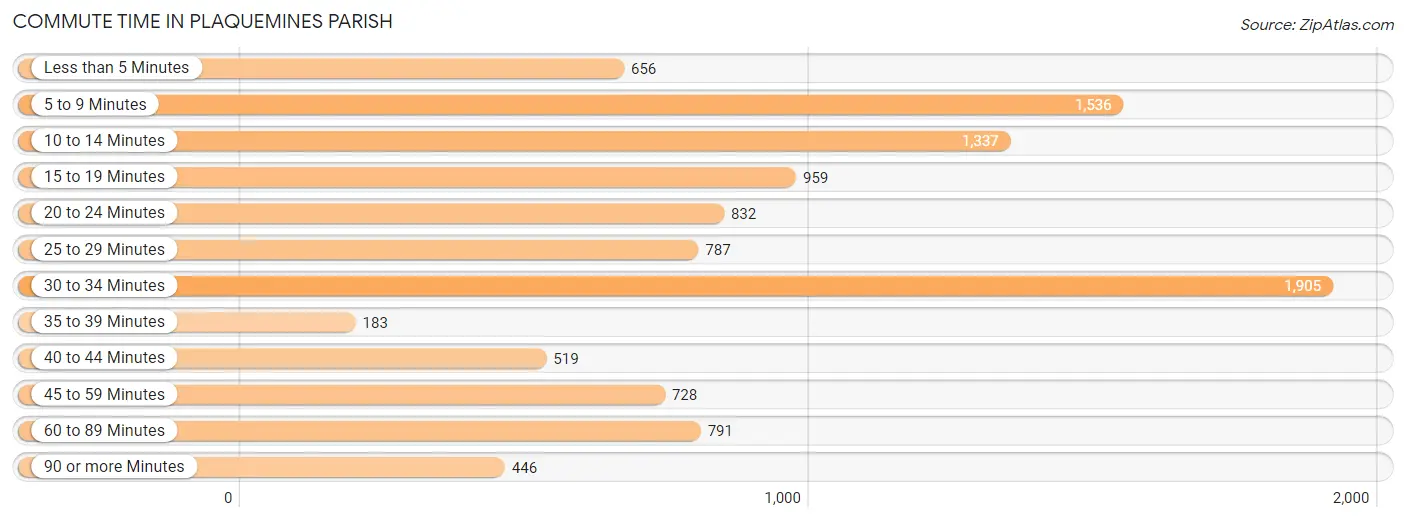
| Commute Time | # Commuters | % Commuters |
| Less than 5 Minutes | 656 | 6.1% |
| 5 to 9 Minutes | 1,536 | 14.4% |
| 10 to 14 Minutes | 1,337 | 12.5% |
| 15 to 19 Minutes | 959 | 9.0% |
| 20 to 24 Minutes | 832 | 7.8% |
| 25 to 29 Minutes | 787 | 7.4% |
| 30 to 34 Minutes | 1,905 | 17.8% |
| 35 to 39 Minutes | 183 | 1.7% |
| 40 to 44 Minutes | 519 | 4.9% |
| 45 to 59 Minutes | 728 | 6.8% |
| 60 to 89 Minutes | 791 | 7.4% |
| 90 or more Minutes | 446 | 4.2% |
Commute Time by Sex in Plaquemines Parish
The most common commute times in Plaquemines Parish are 30 to 34 minutes (1,199 commuters, 19.4%) for males and 30 to 34 minutes (706 commuters, 15.7%) for females.
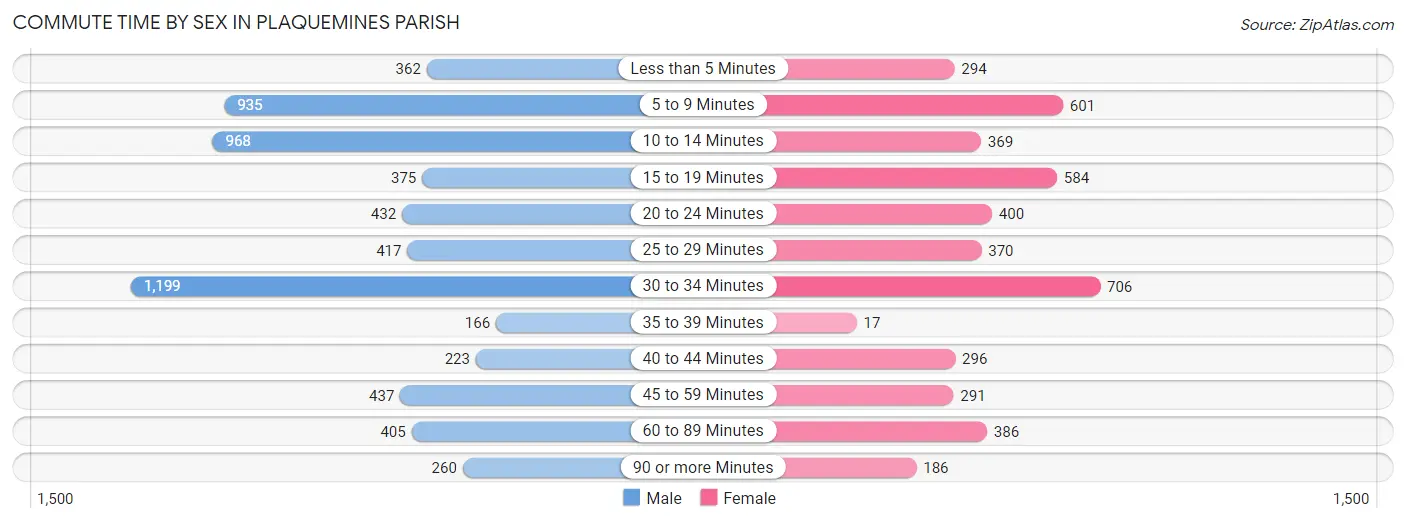
| Commute Time | Male | Female |
| Less than 5 Minutes | 362 (5.9%) | 294 (6.5%) |
| 5 to 9 Minutes | 935 (15.1%) | 601 (13.4%) |
| 10 to 14 Minutes | 968 (15.7%) | 369 (8.2%) |
| 15 to 19 Minutes | 375 (6.1%) | 584 (13.0%) |
| 20 to 24 Minutes | 432 (7.0%) | 400 (8.9%) |
| 25 to 29 Minutes | 417 (6.8%) | 370 (8.2%) |
| 30 to 34 Minutes | 1,199 (19.4%) | 706 (15.7%) |
| 35 to 39 Minutes | 166 (2.7%) | 17 (0.4%) |
| 40 to 44 Minutes | 223 (3.6%) | 296 (6.6%) |
| 45 to 59 Minutes | 437 (7.1%) | 291 (6.5%) |
| 60 to 89 Minutes | 405 (6.6%) | 386 (8.6%) |
| 90 or more Minutes | 260 (4.2%) | 186 (4.1%) |
Time of Departure to Work by Sex in Plaquemines Parish
The most frequent times of departure to work in Plaquemines Parish are 6:30 AM to 6:59 AM (978, 15.8%) for males and 7:30 AM to 7:59 AM (808, 18.0%) for females.
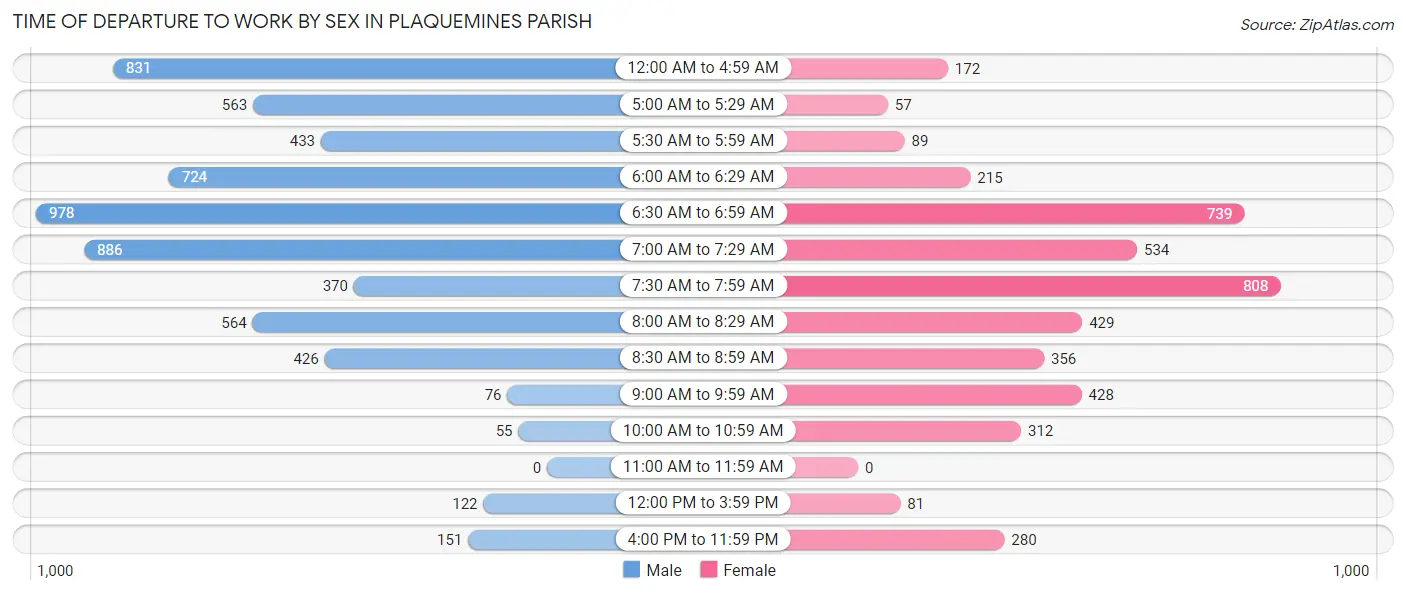
| Time of Departure | Male | Female |
| 12:00 AM to 4:59 AM | 831 (13.5%) | 172 (3.8%) |
| 5:00 AM to 5:29 AM | 563 (9.1%) | 57 (1.3%) |
| 5:30 AM to 5:59 AM | 433 (7.0%) | 89 (2.0%) |
| 6:00 AM to 6:29 AM | 724 (11.7%) | 215 (4.8%) |
| 6:30 AM to 6:59 AM | 978 (15.8%) | 739 (16.4%) |
| 7:00 AM to 7:29 AM | 886 (14.3%) | 534 (11.9%) |
| 7:30 AM to 7:59 AM | 370 (6.0%) | 808 (18.0%) |
| 8:00 AM to 8:29 AM | 564 (9.1%) | 429 (9.5%) |
| 8:30 AM to 8:59 AM | 426 (6.9%) | 356 (7.9%) |
| 9:00 AM to 9:59 AM | 76 (1.2%) | 428 (9.5%) |
| 10:00 AM to 10:59 AM | 55 (0.9%) | 312 (6.9%) |
| 11:00 AM to 11:59 AM | 0 (0.0%) | 0 (0.0%) |
| 12:00 PM to 3:59 PM | 122 (2.0%) | 81 (1.8%) |
| 4:00 PM to 11:59 PM | 151 (2.4%) | 280 (6.2%) |
| Total | 6,179 (100.0%) | 4,500 (100.0%) |
Housing Occupancy in Plaquemines Parish
Occupancy by Ownership in Plaquemines Parish
Of the total 8,172 dwellings in Plaquemines Parish, owner-occupied units account for 5,866 (71.8%), while renter-occupied units make up 2,306 (28.2%).
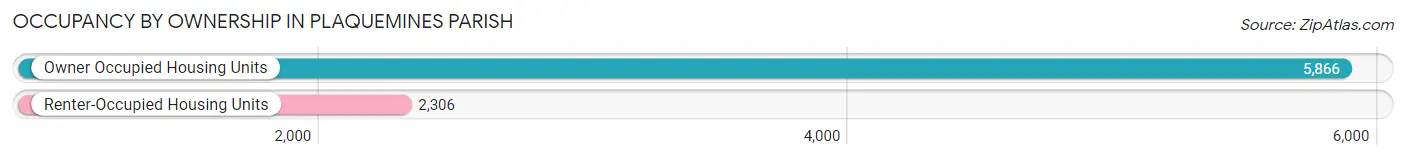
| Occupancy | # Housing Units | % Housing Units |
| Owner Occupied Housing Units | 5,866 | 71.8% |
| Renter-Occupied Housing Units | 2,306 | 28.2% |
| Total Occupied Housing Units | 8,172 | 100.0% |
Occupancy by Household Size in Plaquemines Parish
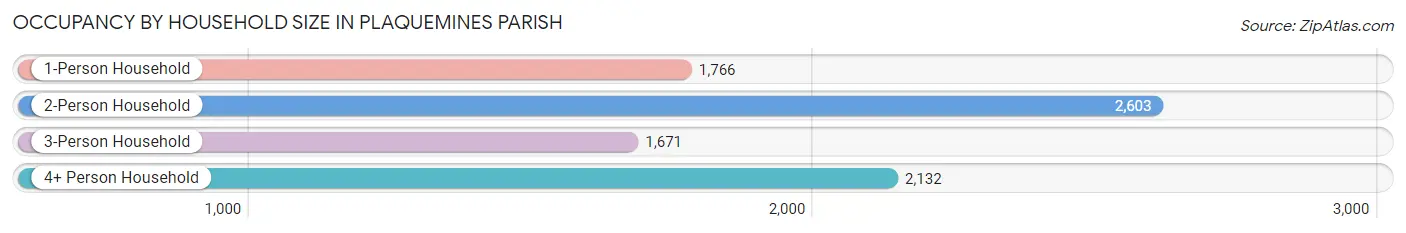
| Household Size | # Housing Units | % Housing Units |
| 1-Person Household | 1,766 | 21.6% |
| 2-Person Household | 2,603 | 31.9% |
| 3-Person Household | 1,671 | 20.4% |
| 4+ Person Household | 2,132 | 26.1% |
| Total Housing Units | 8,172 | 100.0% |
Occupancy by Ownership by Household Size in Plaquemines Parish
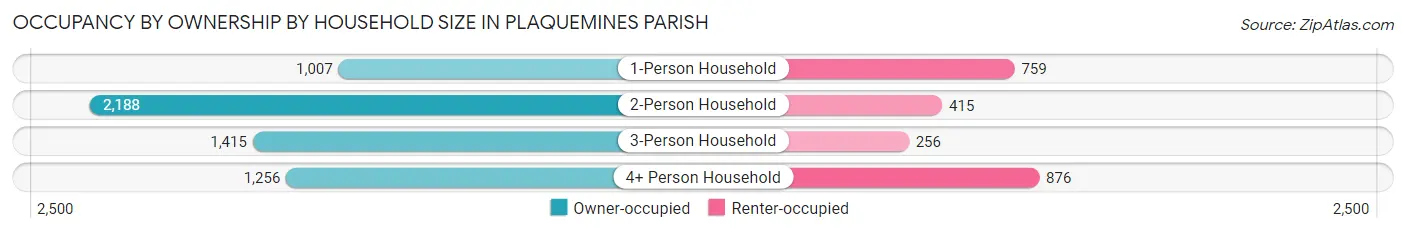
| Household Size | Owner-occupied | Renter-occupied |
| 1-Person Household | 1,007 (57.0%) | 759 (43.0%) |
| 2-Person Household | 2,188 (84.1%) | 415 (15.9%) |
| 3-Person Household | 1,415 (84.7%) | 256 (15.3%) |
| 4+ Person Household | 1,256 (58.9%) | 876 (41.1%) |
| Total Housing Units | 5,866 (71.8%) | 2,306 (28.2%) |
Occupancy by Educational Attainment in Plaquemines Parish
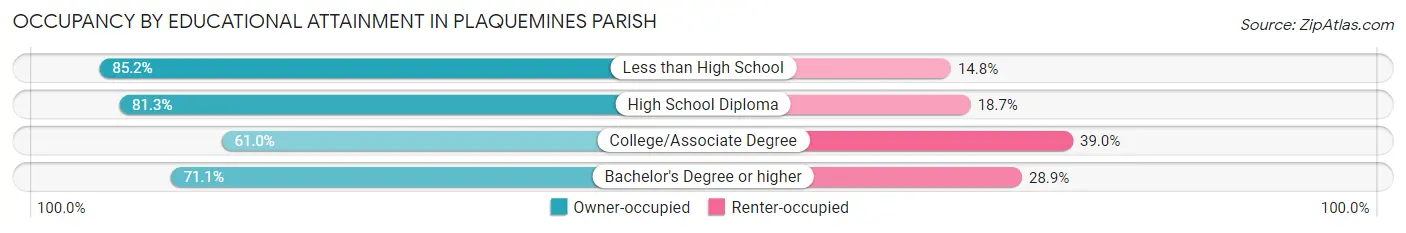
| Household Size | Owner-occupied | Renter-occupied |
| Less than High School | 798 (85.2%) | 139 (14.8%) |
| High School Diploma | 1,964 (81.3%) | 453 (18.7%) |
| College/Associate Degree | 1,932 (61.0%) | 1,237 (39.0%) |
| Bachelor's Degree or higher | 1,172 (71.1%) | 477 (28.9%) |
Occupancy by Age of Householder in Plaquemines Parish
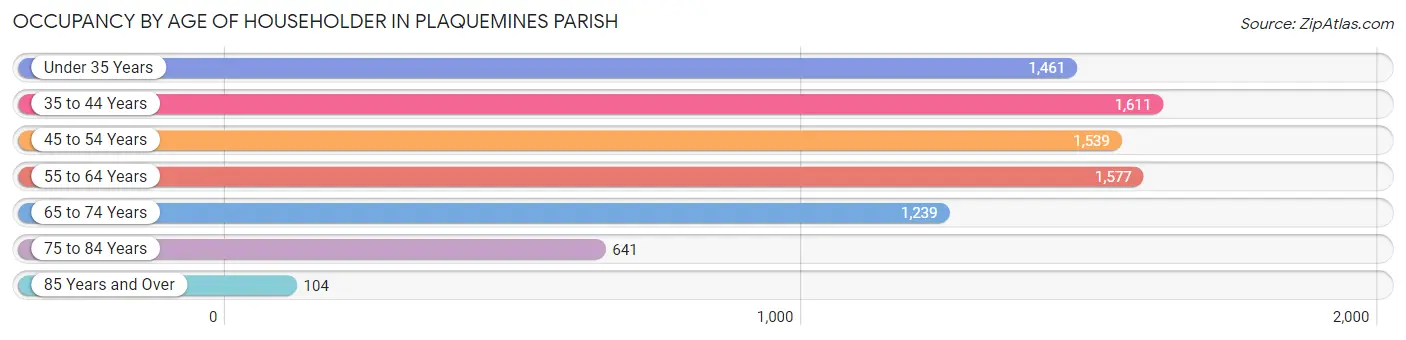
| Age Bracket | # Households | % Households |
| Under 35 Years | 1,461 | 17.9% |
| 35 to 44 Years | 1,611 | 19.7% |
| 45 to 54 Years | 1,539 | 18.8% |
| 55 to 64 Years | 1,577 | 19.3% |
| 65 to 74 Years | 1,239 | 15.2% |
| 75 to 84 Years | 641 | 7.8% |
| 85 Years and Over | 104 | 1.3% |
| Total | 8,172 | 100.0% |
Housing Finances in Plaquemines Parish
Median Income by Occupancy in Plaquemines Parish
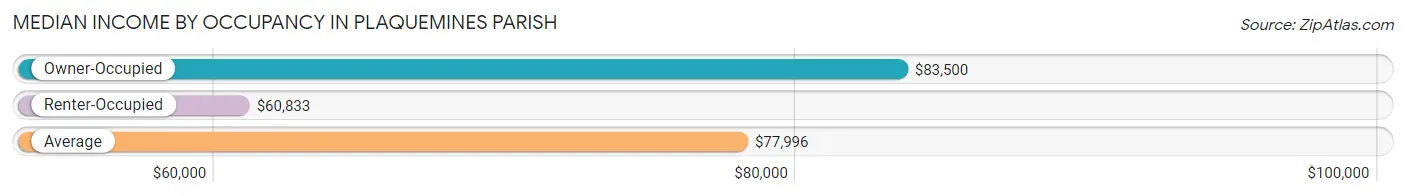
| Occupancy Type | # Households | Median Income |
| Owner-Occupied | 5,866 (71.8%) | $83,500 |
| Renter-Occupied | 2,306 (28.2%) | $60,833 |
| Average | 8,172 (100.0%) | $77,996 |
Occupancy by Householder Income Bracket in Plaquemines Parish
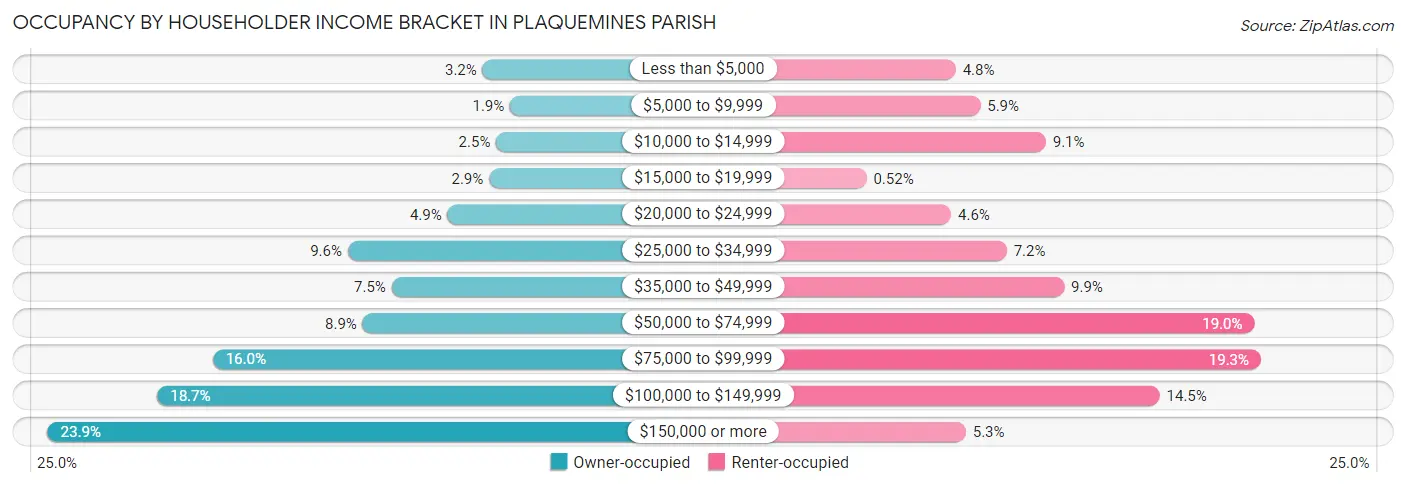
| Income Bracket | Owner-occupied | Renter-occupied |
| Less than $5,000 | 187 (3.2%) | 110 (4.8%) |
| $5,000 to $9,999 | 110 (1.9%) | 137 (5.9%) |
| $10,000 to $14,999 | 149 (2.5%) | 209 (9.1%) |
| $15,000 to $19,999 | 169 (2.9%) | 12 (0.5%) |
| $20,000 to $24,999 | 285 (4.9%) | 105 (4.5%) |
| $25,000 to $34,999 | 564 (9.6%) | 166 (7.2%) |
| $35,000 to $49,999 | 441 (7.5%) | 229 (9.9%) |
| $50,000 to $74,999 | 522 (8.9%) | 438 (19.0%) |
| $75,000 to $99,999 | 941 (16.0%) | 445 (19.3%) |
| $100,000 to $149,999 | 1,096 (18.7%) | 334 (14.5%) |
| $150,000 or more | 1,402 (23.9%) | 121 (5.2%) |
| Total | 5,866 (100.0%) | 2,306 (100.0%) |
Monthly Housing Cost Tiers in Plaquemines Parish
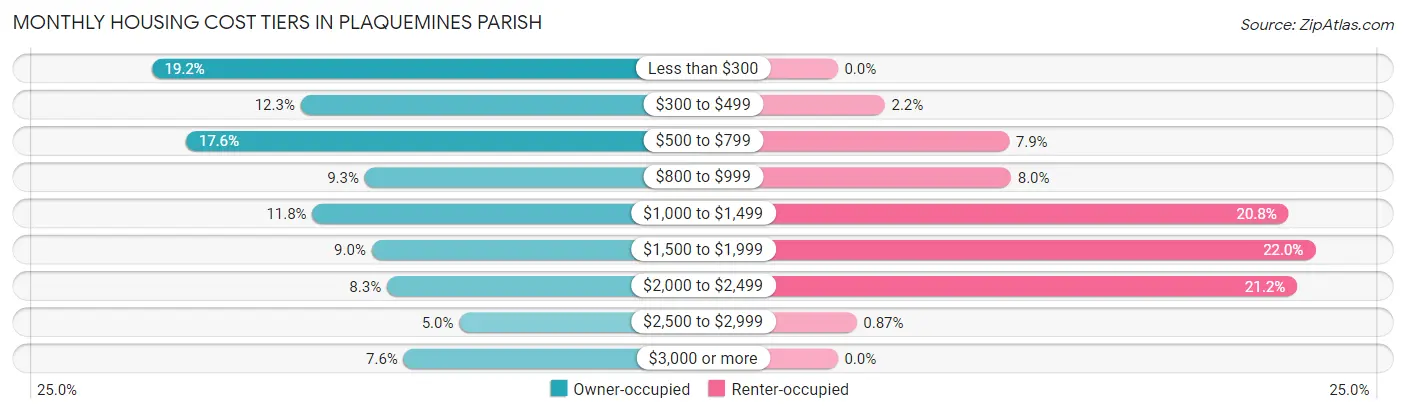
| Monthly Cost | Owner-occupied | Renter-occupied |
| Less than $300 | 1,124 (19.2%) | 0 (0.0%) |
| $300 to $499 | 721 (12.3%) | 50 (2.2%) |
| $500 to $799 | 1,031 (17.6%) | 182 (7.9%) |
| $800 to $999 | 548 (9.3%) | 184 (8.0%) |
| $1,000 to $1,499 | 689 (11.7%) | 479 (20.8%) |
| $1,500 to $1,999 | 529 (9.0%) | 507 (22.0%) |
| $2,000 to $2,499 | 488 (8.3%) | 488 (21.2%) |
| $2,500 to $2,999 | 293 (5.0%) | 20 (0.9%) |
| $3,000 or more | 443 (7.5%) | 0 (0.0%) |
| Total | 5,866 (100.0%) | 2,306 (100.0%) |
Physical Housing Characteristics in Plaquemines Parish
Housing Structures in Plaquemines Parish
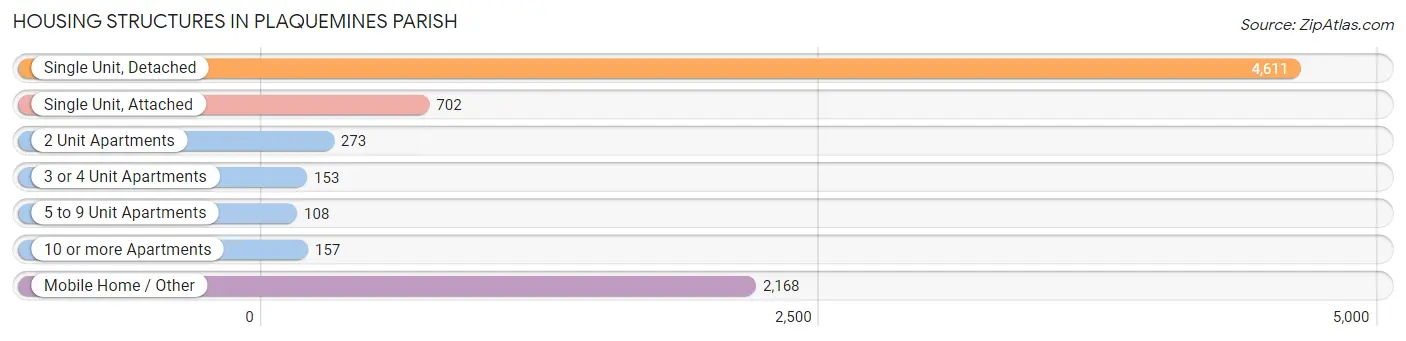
| Structure Type | # Housing Units | % Housing Units |
| Single Unit, Detached | 4,611 | 56.4% |
| Single Unit, Attached | 702 | 8.6% |
| 2 Unit Apartments | 273 | 3.3% |
| 3 or 4 Unit Apartments | 153 | 1.9% |
| 5 to 9 Unit Apartments | 108 | 1.3% |
| 10 or more Apartments | 157 | 1.9% |
| Mobile Home / Other | 2,168 | 26.5% |
| Total | 8,172 | 100.0% |
Housing Structures by Occupancy in Plaquemines Parish
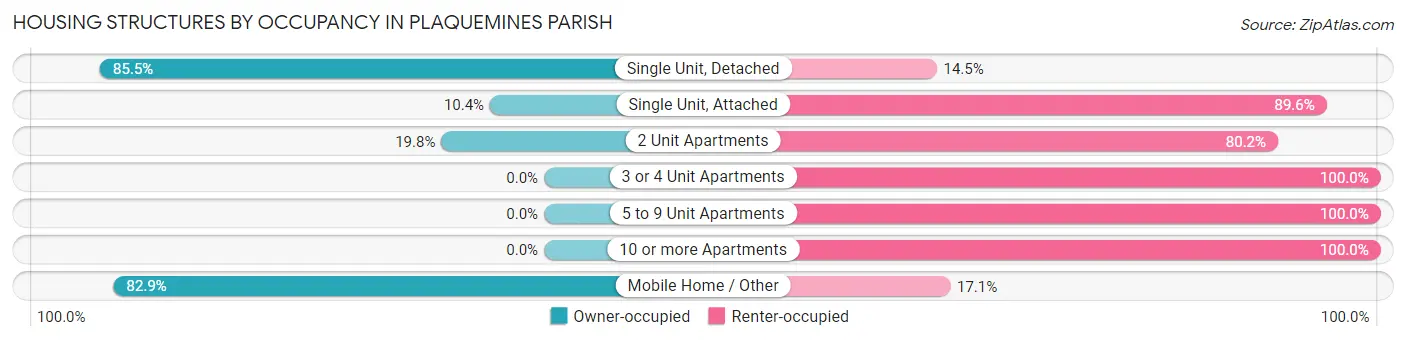
| Structure Type | Owner-occupied | Renter-occupied |
| Single Unit, Detached | 3,942 (85.5%) | 669 (14.5%) |
| Single Unit, Attached | 73 (10.4%) | 629 (89.6%) |
| 2 Unit Apartments | 54 (19.8%) | 219 (80.2%) |
| 3 or 4 Unit Apartments | 0 (0.0%) | 153 (100.0%) |
| 5 to 9 Unit Apartments | 0 (0.0%) | 108 (100.0%) |
| 10 or more Apartments | 0 (0.0%) | 157 (100.0%) |
| Mobile Home / Other | 1,797 (82.9%) | 371 (17.1%) |
| Total | 5,866 (71.8%) | 2,306 (28.2%) |
Housing Structures by Number of Rooms in Plaquemines Parish
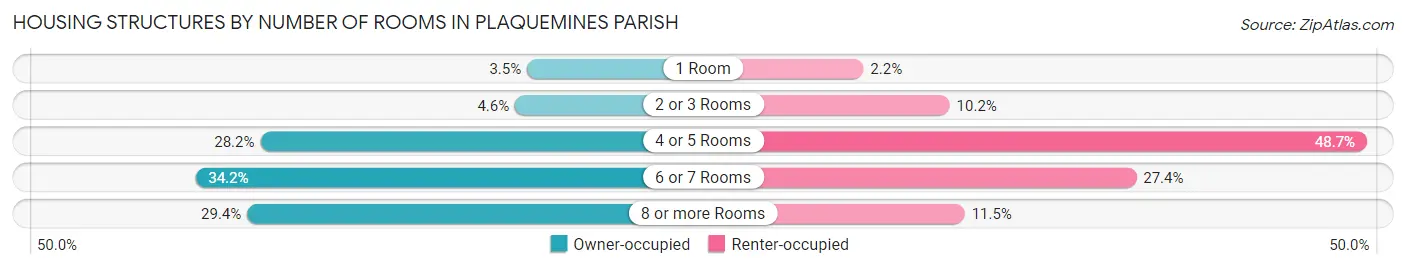
| Number of Rooms | Owner-occupied | Renter-occupied |
| 1 Room | 207 (3.5%) | 50 (2.2%) |
| 2 or 3 Rooms | 272 (4.6%) | 234 (10.2%) |
| 4 or 5 Rooms | 1,654 (28.2%) | 1,124 (48.7%) |
| 6 or 7 Rooms | 2,007 (34.2%) | 632 (27.4%) |
| 8 or more Rooms | 1,726 (29.4%) | 266 (11.5%) |
| Total | 5,866 (100.0%) | 2,306 (100.0%) |
Housing Structure by Heating Type in Plaquemines Parish
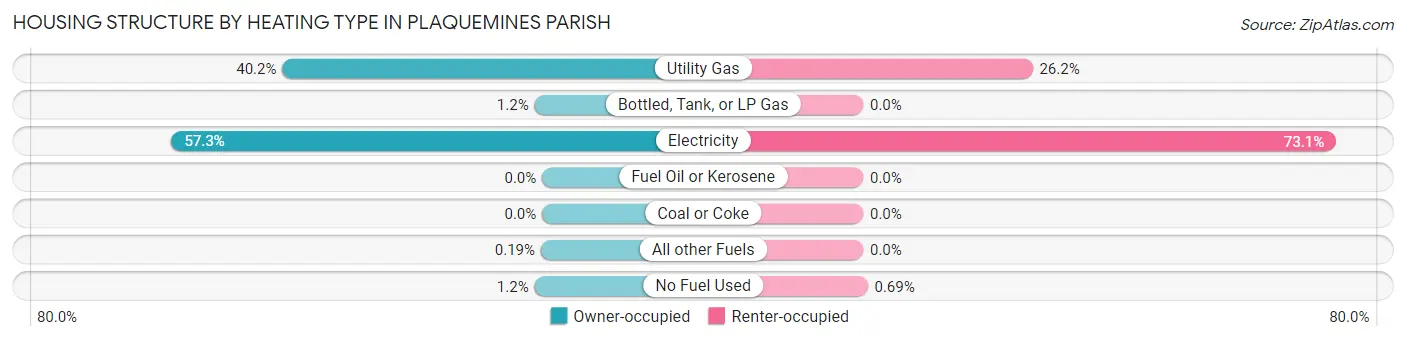
| Heating Type | Owner-occupied | Renter-occupied |
| Utility Gas | 2,356 (40.2%) | 604 (26.2%) |
| Bottled, Tank, or LP Gas | 69 (1.2%) | 0 (0.0%) |
| Electricity | 3,361 (57.3%) | 1,686 (73.1%) |
| Fuel Oil or Kerosene | 0 (0.0%) | 0 (0.0%) |
| Coal or Coke | 0 (0.0%) | 0 (0.0%) |
| All other Fuels | 11 (0.2%) | 0 (0.0%) |
| No Fuel Used | 69 (1.2%) | 16 (0.7%) |
| Total | 5,866 (100.0%) | 2,306 (100.0%) |
Household Vehicle Usage in Plaquemines Parish
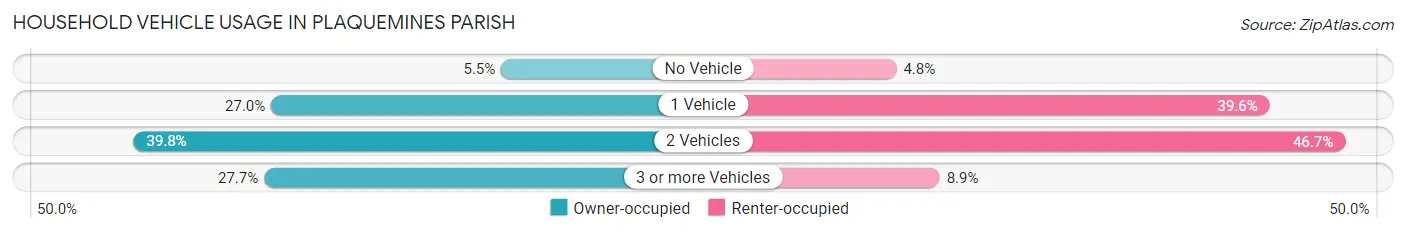
| Vehicles per Household | Owner-occupied | Renter-occupied |
| No Vehicle | 324 (5.5%) | 111 (4.8%) |
| 1 Vehicle | 1,583 (27.0%) | 914 (39.6%) |
| 2 Vehicles | 2,337 (39.8%) | 1,077 (46.7%) |
| 3 or more Vehicles | 1,622 (27.7%) | 204 (8.8%) |
| Total | 5,866 (100.0%) | 2,306 (100.0%) |
Real Estate & Mortgages in Plaquemines Parish
Real Estate and Mortgage Overview in Plaquemines Parish
| Characteristic | Without Mortgage | With Mortgage |
| Housing Units | 3,120 | 2,746 |
| Median Property Value | $192,400 | $308,000 |
| Median Household Income | $69,250 | $829 |
| Monthly Housing Costs | $425 | $443 |
| Real Estate Taxes | $1,130 | $416 |
Property Value by Mortgage Status in Plaquemines Parish
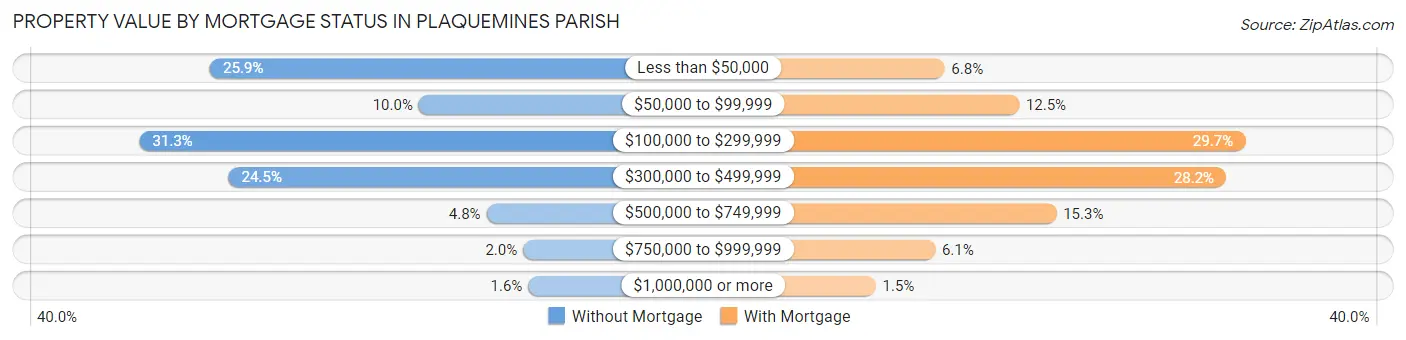
| Property Value | Without Mortgage | With Mortgage |
| Less than $50,000 | 807 (25.9%) | 186 (6.8%) |
| $50,000 to $99,999 | 311 (10.0%) | 342 (12.4%) |
| $100,000 to $299,999 | 975 (31.2%) | 815 (29.7%) |
| $300,000 to $499,999 | 763 (24.5%) | 775 (28.2%) |
| $500,000 to $749,999 | 150 (4.8%) | 420 (15.3%) |
| $750,000 to $999,999 | 63 (2.0%) | 166 (6.0%) |
| $1,000,000 or more | 51 (1.6%) | 42 (1.5%) |
| Total | 3,120 (100.0%) | 2,746 (100.0%) |
Household Income by Mortgage Status in Plaquemines Parish
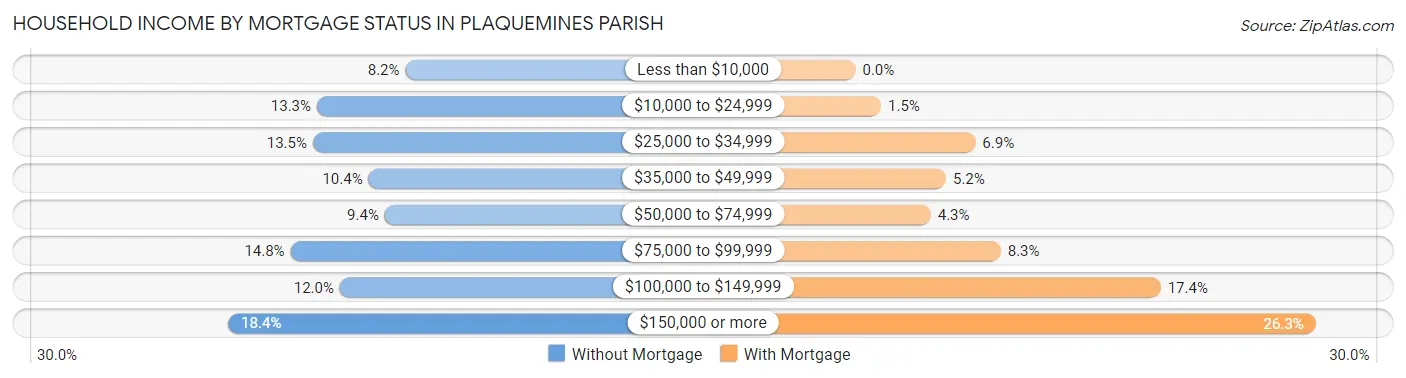
| Household Income | Without Mortgage | With Mortgage |
| Less than $10,000 | 257 (8.2%) | 0 (0.0%) |
| $10,000 to $24,999 | 415 (13.3%) | 40 (1.5%) |
| $25,000 to $34,999 | 422 (13.5%) | 188 (6.9%) |
| $35,000 to $49,999 | 323 (10.3%) | 142 (5.2%) |
| $50,000 to $74,999 | 294 (9.4%) | 118 (4.3%) |
| $75,000 to $99,999 | 462 (14.8%) | 228 (8.3%) |
| $100,000 to $149,999 | 374 (12.0%) | 479 (17.4%) |
| $150,000 or more | 573 (18.4%) | 722 (26.3%) |
| Total | 3,120 (100.0%) | 2,746 (100.0%) |
Property Value to Household Income Ratio in Plaquemines Parish
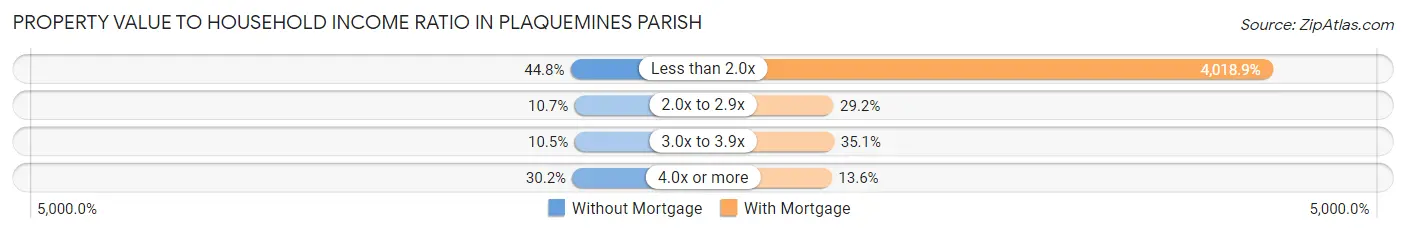
| Value-to-Income Ratio | Without Mortgage | With Mortgage |
| Less than 2.0x | 1,399 (44.8%) | 110,360 (4,018.9%) |
| 2.0x to 2.9x | 333 (10.7%) | 802 (29.2%) |
| 3.0x to 3.9x | 328 (10.5%) | 965 (35.1%) |
| 4.0x or more | 942 (30.2%) | 372 (13.6%) |
| Total | 3,120 (100.0%) | 2,746 (100.0%) |
Real Estate Taxes by Mortgage Status in Plaquemines Parish
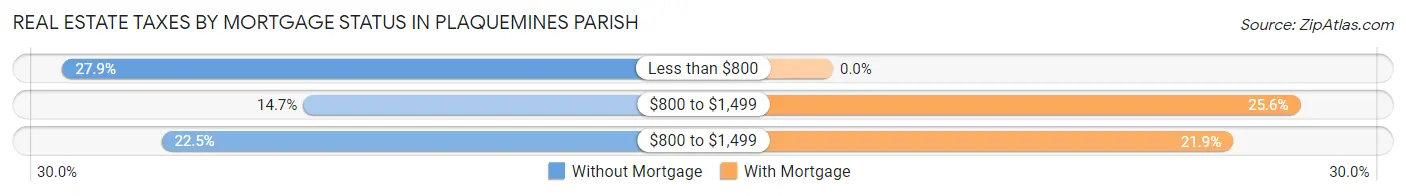
| Property Taxes | Without Mortgage | With Mortgage |
| Less than $800 | 871 (27.9%) | 0 (0.0%) |
| $800 to $1,499 | 460 (14.7%) | 703 (25.6%) |
| $800 to $1,499 | 702 (22.5%) | 602 (21.9%) |
| Total | 3,120 (100.0%) | 2,746 (100.0%) |
Health & Disability in Plaquemines Parish
Health Insurance Coverage by Age in Plaquemines Parish
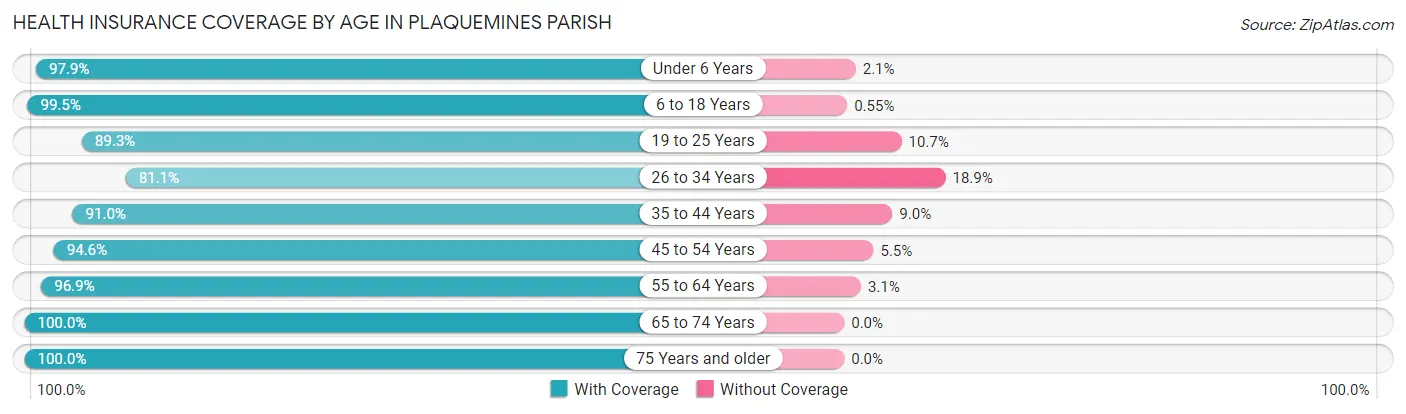
| Age Bracket | With Coverage | Without Coverage |
| Under 6 Years | 1,694 (97.9%) | 37 (2.1%) |
| 6 to 18 Years | 4,310 (99.5%) | 24 (0.5%) |
| 19 to 25 Years | 1,604 (89.3%) | 192 (10.7%) |
| 26 to 34 Years | 2,157 (81.1%) | 502 (18.9%) |
| 35 to 44 Years | 2,414 (91.0%) | 238 (9.0%) |
| 45 to 54 Years | 2,964 (94.6%) | 171 (5.4%) |
| 55 to 64 Years | 2,853 (96.9%) | 92 (3.1%) |
| 65 to 74 Years | 1,912 (100.0%) | 0 (0.0%) |
| 75 Years and older | 1,107 (100.0%) | 0 (0.0%) |
| Total | 21,015 (94.4%) | 1,256 (5.6%) |
Health Insurance Coverage by Citizenship Status in Plaquemines Parish
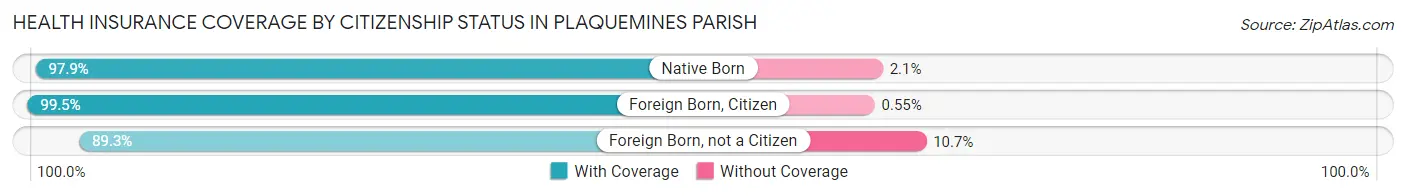
| Citizenship Status | With Coverage | Without Coverage |
| Native Born | 1,694 (97.9%) | 37 (2.1%) |
| Foreign Born, Citizen | 4,310 (99.5%) | 24 (0.5%) |
| Foreign Born, not a Citizen | 1,604 (89.3%) | 192 (10.7%) |
Health Insurance Coverage by Household Income in Plaquemines Parish
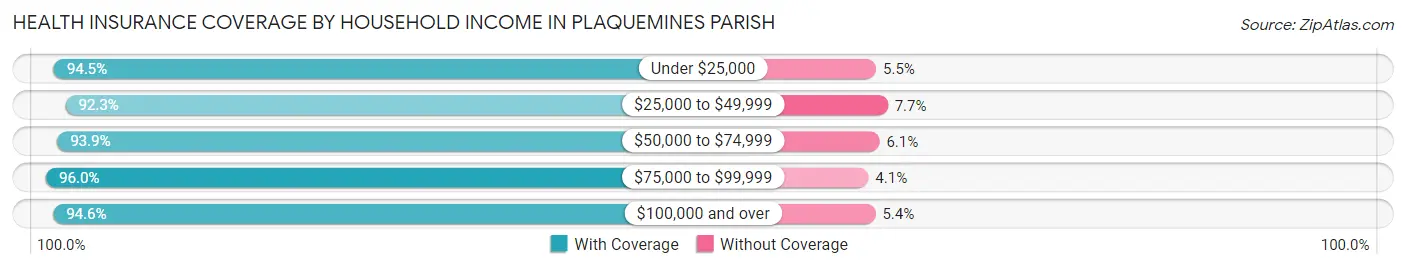
| Household Income | With Coverage | Without Coverage |
| Under $25,000 | 2,567 (94.5%) | 149 (5.5%) |
| $25,000 to $49,999 | 2,783 (92.3%) | 231 (7.7%) |
| $50,000 to $74,999 | 2,638 (93.9%) | 172 (6.1%) |
| $75,000 to $99,999 | 3,841 (96.0%) | 162 (4.1%) |
| $100,000 and over | 9,110 (94.6%) | 517 (5.4%) |
Public vs Private Health Insurance Coverage by Age in Plaquemines Parish

| Age Bracket | Public Insurance | Private Insurance |
| Under 6 | 597 (34.5%) | 1,187 (68.6%) |
| 6 to 18 Years | 2,251 (51.9%) | 2,616 (60.4%) |
| 19 to 25 Years | 660 (36.7%) | 1,012 (56.4%) |
| 25 to 34 Years | 706 (26.6%) | 1,568 (59.0%) |
| 35 to 44 Years | 608 (22.9%) | 2,097 (79.1%) |
| 45 to 54 Years | 607 (19.4%) | 2,583 (82.4%) |
| 55 to 64 Years | 700 (23.8%) | 2,303 (78.2%) |
| 65 to 74 Years | 1,799 (94.1%) | 1,013 (53.0%) |
| 75 Years and over | 1,107 (100.0%) | 493 (44.5%) |
| Total | 9,035 (40.6%) | 14,872 (66.8%) |
Disability Status by Sex by Age in Plaquemines Parish
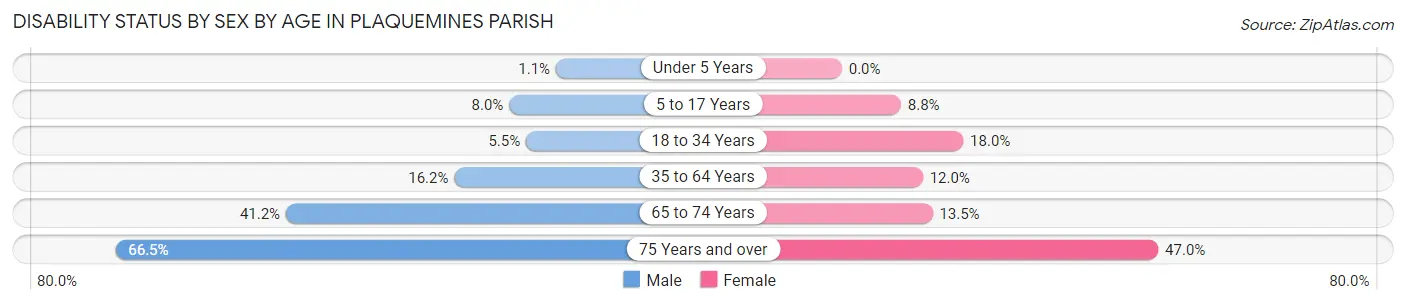
| Age Bracket | Male | Female |
| Under 5 Years | 7 (1.1%) | 0 (0.0%) |
| 5 to 17 Years | 204 (8.0%) | 168 (8.8%) |
| 18 to 34 Years | 129 (5.5%) | 425 (18.0%) |
| 35 to 64 Years | 714 (16.2%) | 519 (12.0%) |
| 65 to 74 Years | 402 (41.2%) | 126 (13.5%) |
| 75 Years and over | 296 (66.5%) | 311 (47.0%) |
Disability Class by Sex by Age in Plaquemines Parish
Disability Class: Hearing Difficulty
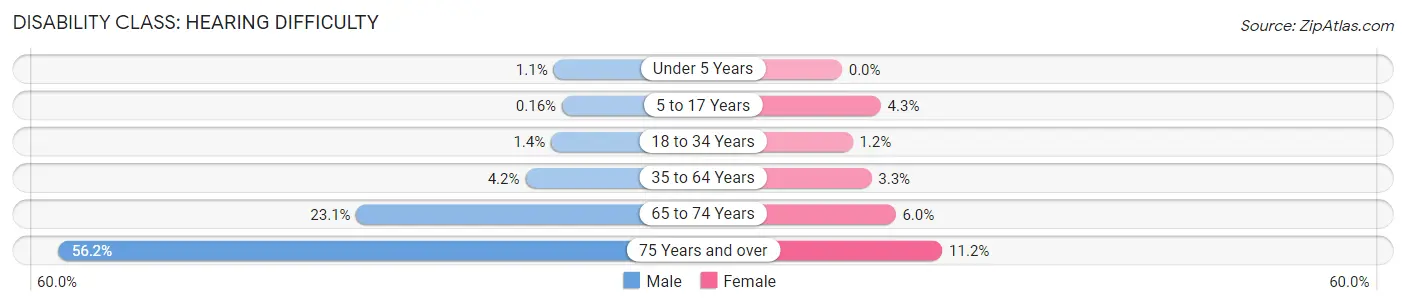
| Age Bracket | Male | Female |
| Under 5 Years | 7 (1.1%) | 0 (0.0%) |
| 5 to 17 Years | 4 (0.2%) | 83 (4.3%) |
| 18 to 34 Years | 32 (1.4%) | 28 (1.2%) |
| 35 to 64 Years | 187 (4.2%) | 142 (3.3%) |
| 65 to 74 Years | 225 (23.1%) | 56 (6.0%) |
| 75 Years and over | 250 (56.2%) | 74 (11.2%) |
Disability Class: Vision Difficulty
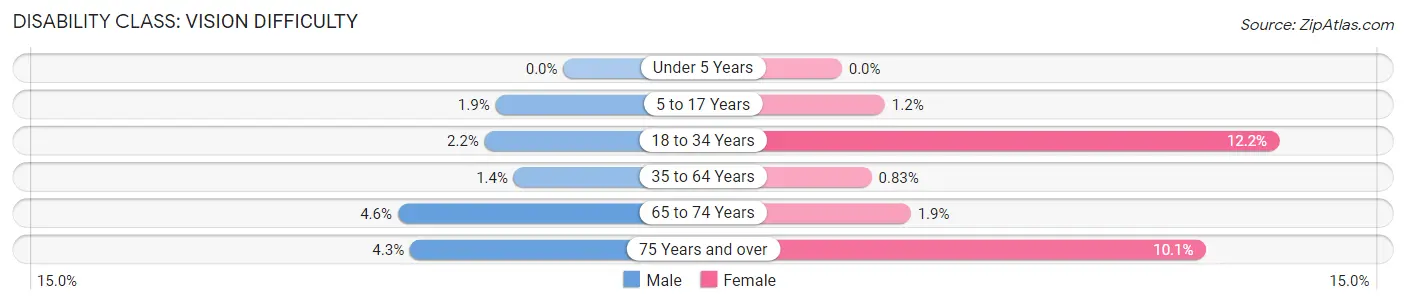
| Age Bracket | Male | Female |
| Under 5 Years | 0 (0.0%) | 0 (0.0%) |
| 5 to 17 Years | 48 (1.9%) | 23 (1.2%) |
| 18 to 34 Years | 51 (2.2%) | 287 (12.2%) |
| 35 to 64 Years | 61 (1.4%) | 36 (0.8%) |
| 65 to 74 Years | 45 (4.6%) | 18 (1.9%) |
| 75 Years and over | 19 (4.3%) | 67 (10.1%) |
Disability Class: Cognitive Difficulty
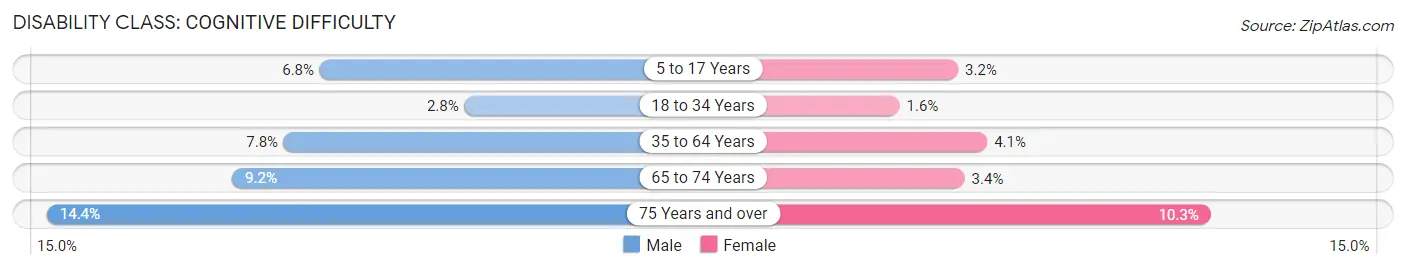
| Age Bracket | Male | Female |
| 5 to 17 Years | 172 (6.8%) | 62 (3.2%) |
| 18 to 34 Years | 64 (2.8%) | 38 (1.6%) |
| 35 to 64 Years | 343 (7.8%) | 175 (4.1%) |
| 65 to 74 Years | 90 (9.2%) | 32 (3.4%) |
| 75 Years and over | 64 (14.4%) | 68 (10.3%) |
Disability Class: Ambulatory Difficulty
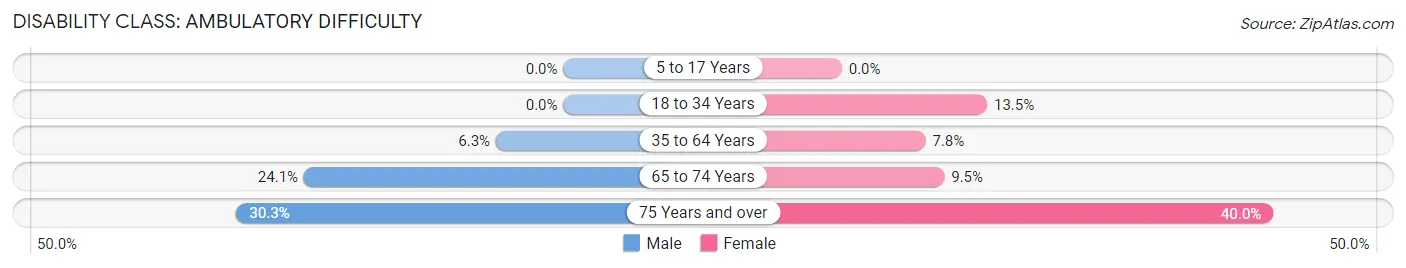
| Age Bracket | Male | Female |
| 5 to 17 Years | 0 (0.0%) | 0 (0.0%) |
| 18 to 34 Years | 0 (0.0%) | 318 (13.5%) |
| 35 to 64 Years | 276 (6.3%) | 336 (7.8%) |
| 65 to 74 Years | 235 (24.1%) | 89 (9.5%) |
| 75 Years and over | 135 (30.3%) | 265 (40.0%) |
Disability Class: Self-Care Difficulty

| Age Bracket | Male | Female |
| 5 to 17 Years | 0 (0.0%) | 0 (0.0%) |
| 18 to 34 Years | 0 (0.0%) | 0 (0.0%) |
| 35 to 64 Years | 91 (2.1%) | 92 (2.1%) |
| 65 to 74 Years | 90 (9.2%) | 13 (1.4%) |
| 75 Years and over | 78 (17.5%) | 92 (13.9%) |
Technology Access in Plaquemines Parish
Computing Device Access in Plaquemines Parish
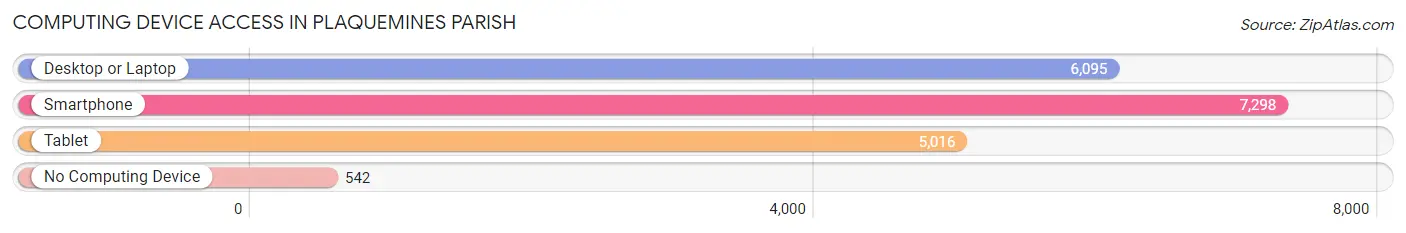
| Device Type | # Households | % Households |
| Desktop or Laptop | 6,095 | 74.6% |
| Smartphone | 7,298 | 89.3% |
| Tablet | 5,016 | 61.4% |
| No Computing Device | 542 | 6.6% |
| Total | 8,172 | 100.0% |
Internet Access in Plaquemines Parish
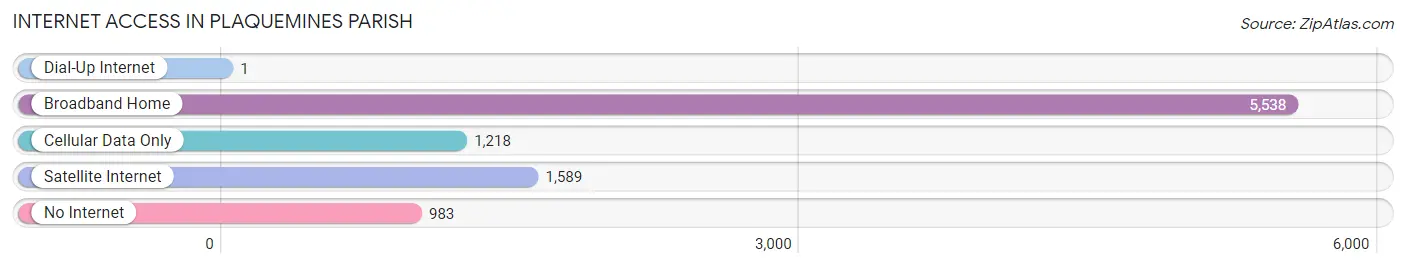
| Internet Type | # Households | % Households |
| Dial-Up Internet | 1 | 0.0% |
| Broadband Home | 5,538 | 67.8% |
| Cellular Data Only | 1,218 | 14.9% |
| Satellite Internet | 1,589 | 19.4% |
| No Internet | 983 | 12.0% |
| Total | 8,172 | 100.0% |
Plaquemines Parish Summary
Plaquemines Parish, Louisiana is a unique and diverse area located in the southeastern corner of the state. It is bordered by the Mississippi River to the north, the Gulf of Mexico to the south, and the parishes of St. Bernard and Jefferson to the east and west, respectively. The parish is home to a variety of cultures, including Native American, French, Spanish, African American, and Cajun. It is also home to a variety of industries, including fishing, oil and gas, and tourism.
Geography
Plaquemines Parish is located in the southeastern corner of Louisiana and is bordered by the Mississippi River to the north, the Gulf of Mexico to the south, and the parishes of St. Bernard and Jefferson to the east and west, respectively. The parish is approximately 300 square miles in size and is divided into two distinct regions: the east bank and the west bank. The east bank is located on the Mississippi River and is home to the majority of the parish’s population. The west bank is located on the Gulf of Mexico and is home to the majority of the parish’s industry.
The parish is home to a variety of landscapes, including wetlands, marshes, swamps, and bayous. The wetlands are home to a variety of wildlife, including alligators, turtles, and birds. The marshes are home to a variety of fish, including redfish, speckled trout, and flounder. The swamps are home to a variety of plants, including cypress trees, Spanish moss, and palmetto. The bayous are home to a variety of wildlife, including nutria, muskrats, and beavers.
History
Plaquemines Parish was first settled by Native Americans in the 16th century. The area was later colonized by the French in the 18th century and was part of the Louisiana Purchase in 1803. The parish was officially established in 1807 and was named after the Plaquemine Native American tribe.
The parish was home to a variety of cultures, including Native American, French, Spanish, African American, and Cajun. The parish was also home to a variety of industries, including fishing, oil and gas, and tourism.
In the early 20th century, the parish was hit hard by the Great Depression and World War II. The parish was also hit hard by Hurricane Katrina in 2005, which caused extensive damage to the area.
Economy
Plaquemines Parish is home to a variety of industries, including fishing, oil and gas, and tourism. The fishing industry is the largest employer in the parish, with the majority of the jobs being in the shrimping and oyster industries. The oil and gas industry is also a major employer in the parish, with the majority of the jobs being in the offshore drilling and refining industries. The tourism industry is also a major employer in the parish, with the majority of the jobs being in the hospitality and retail industries.
The parish is also home to a variety of businesses, including restaurants, hotels, and retail stores. The parish is also home to a variety of attractions, including the Plaquemines Parish Museum, the Plaquemines Parish Historical Society, and the Plaquemines Parish Fair.
Demographics
As of the 2010 census, Plaquemines Parish had a population of 23,042. The population is approximately 60% white, 30% African American, and 10% Hispanic or Latino. The median household income is $45,845 and the median home value is $150,000.
The parish is home to a variety of religions, including Catholic, Protestant, and Jewish. The parish is also home to a variety of languages, including English, French, Spanish, and Cajun.
Conclusion
Plaquemines Parish, Louisiana is a unique and diverse area located in the southeastern corner of the state. It is bordered by the Mississippi River to the north, the Gulf of Mexico to the south, and the parishes of St. Bernard and Jefferson to the east and west, respectively. The parish is home to a variety of cultures, including Native American, French, Spanish, African American, and Cajun. It is also home to a variety of industries, including fishing, oil and gas, and tourism. The parish has a population of 23,042 and a median household income of $45,845. The parish is home to a variety of religions, languages, businesses, and attractions.
Common Questions
What is the Total Population of Plaquemines Parish?
Total Population of Plaquemines Parish is 23,305.
What is the Total Male Population of Plaquemines Parish?
Total Male Population of Plaquemines Parish is 12,112.
What is the Total Female Population of Plaquemines Parish?
Total Female Population of Plaquemines Parish is 11,193.
What is the Ratio of Males per 100 Females in Plaquemines Parish?
There are 108.21 Males per 100 Females in Plaquemines Parish.
What is the Ratio of Females per 100 Males in Plaquemines Parish?
There are 92.41 Females per 100 Males in Plaquemines Parish.
What is the Median Population Age in Plaquemines Parish?
Median Population Age in Plaquemines Parish is 36.4 Years.
What is the Average Family Size in Plaquemines Parish
Average Family Size in Plaquemines Parish is 3.3 People.
What is the Average Household Size in Plaquemines Parish
Average Household Size in Plaquemines Parish is 2.8 People.
What is Per Capita Income in Plaquemines Parish?
Per Capita income in Plaquemines Parish is $35,413.
What is the Median Family Income in Plaquemines Parish?
Median Family Income in Plaquemines Parish is $84,478.
What is the Median Household income in Plaquemines Parish?
Median Household Income in Plaquemines Parish is $77,996.
What is Income or Wage Gap in Plaquemines Parish?
Income or Wage Gap in Plaquemines Parish is 48.3%.
Women in Plaquemines Parish earn 51.7 cents for every dollar earned by a man.
What is Family Income Deficit in Plaquemines Parish?
Family Income Deficit in Plaquemines Parish is $12,379.
Families that are below poverty line in Plaquemines Parish earn $12,379 less on average than the poverty threshold level.
What is Inequality or Gini Index in Plaquemines Parish?
Inequality or Gini Index in Plaquemines Parish is 0.47.
How Large is the Labor Force in Plaquemines Parish?
There are 11,851 People in the Labor Forcein in Plaquemines Parish.
What is the Percentage of People in the Labor Force in Plaquemines Parish?
65.0% of People are in the Labor Force in Plaquemines Parish.
What is the Unemployment Rate in Plaquemines Parish?
Unemployment Rate in Plaquemines Parish is 4.4%.