Ouachita Parish, LA
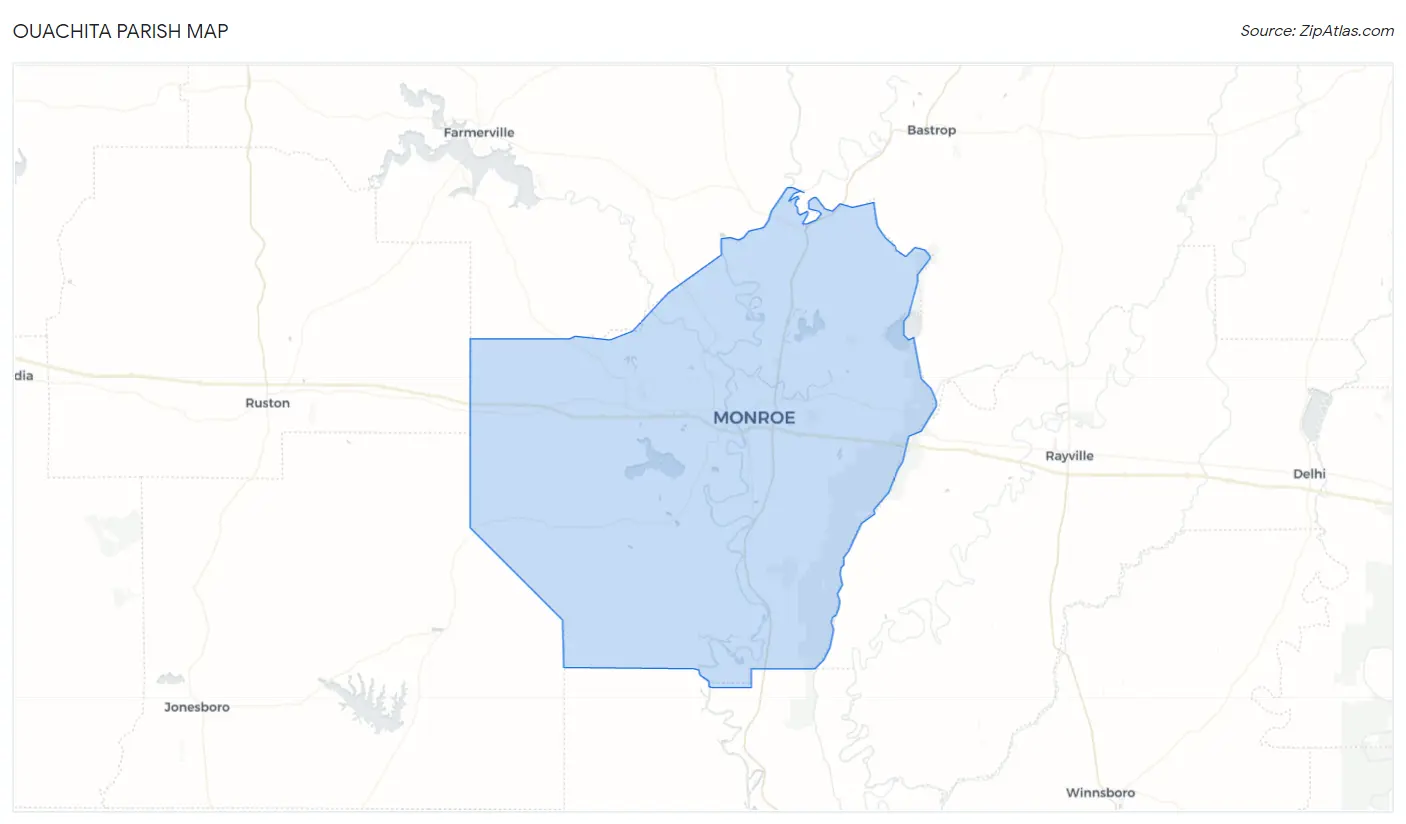
Ouachita Parish Map
Ouachita Parish Overview
159,585
TOTAL POPULATION
77,016
MALE POPULATION
82,569
FEMALE POPULATION
93.27
MALES / 100 FEMALES
107.21
FEMALES / 100 MALES
36.5
MEDIAN AGE
3.3
AVG FAMILY SIZE
2.6
AVG HOUSEHOLD SIZE
$29,670
PER CAPITA INCOME
$67,253
AVG FAMILY INCOME
$49,261
AVG HOUSEHOLD INCOME
32.0%
WAGE / INCOME GAP [ % ]
68.0¢/ $1
WAGE / INCOME GAP [ $ ]
$11,934
FAMILY INCOME DEFICIT
0.52
INEQUALITY / GINI INDEX
73,364
LABOR FORCE [ PEOPLE ]
58.8%
PERCENT IN LABOR FORCE
6.5%
UNEMPLOYMENT RATE
Ouachita Parish Area Codes
Race in Ouachita Parish
The most populous races in Ouachita Parish are White / Caucasian (91,697 | 57.5%), Black / African American (59,511 | 37.3%), and Two or more Races (4,070 | 2.5%).
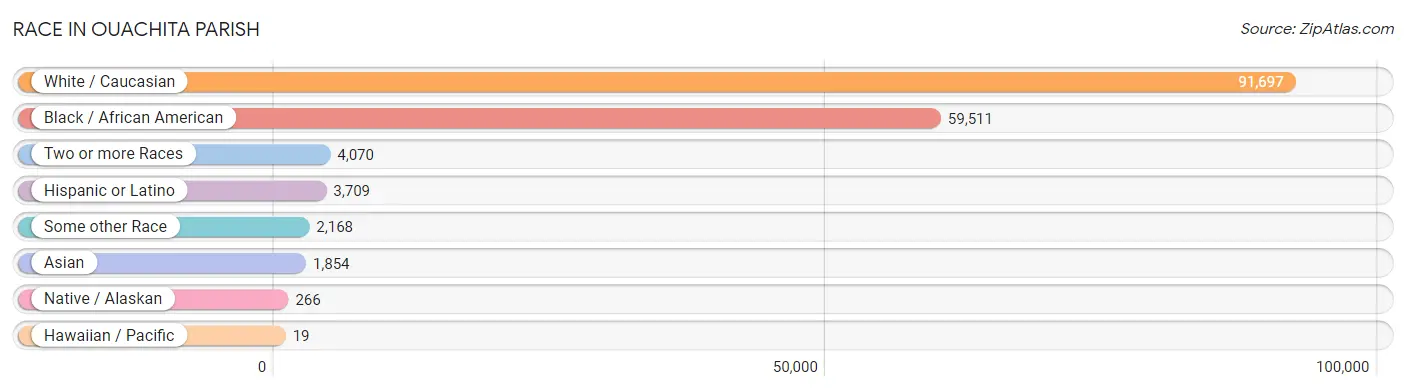
| Race | # Population | % Population |
| Asian | 1,854 | 1.2% |
| Black / African American | 59,511 | 37.3% |
| Hawaiian / Pacific | 19 | 0.0% |
| Hispanic or Latino | 3,709 | 2.3% |
| Native / Alaskan | 266 | 0.2% |
| White / Caucasian | 91,697 | 57.5% |
| Two or more Races | 4,070 | 2.5% |
| Some other Race | 2,168 | 1.4% |
| Total | 159,585 | 100.0% |
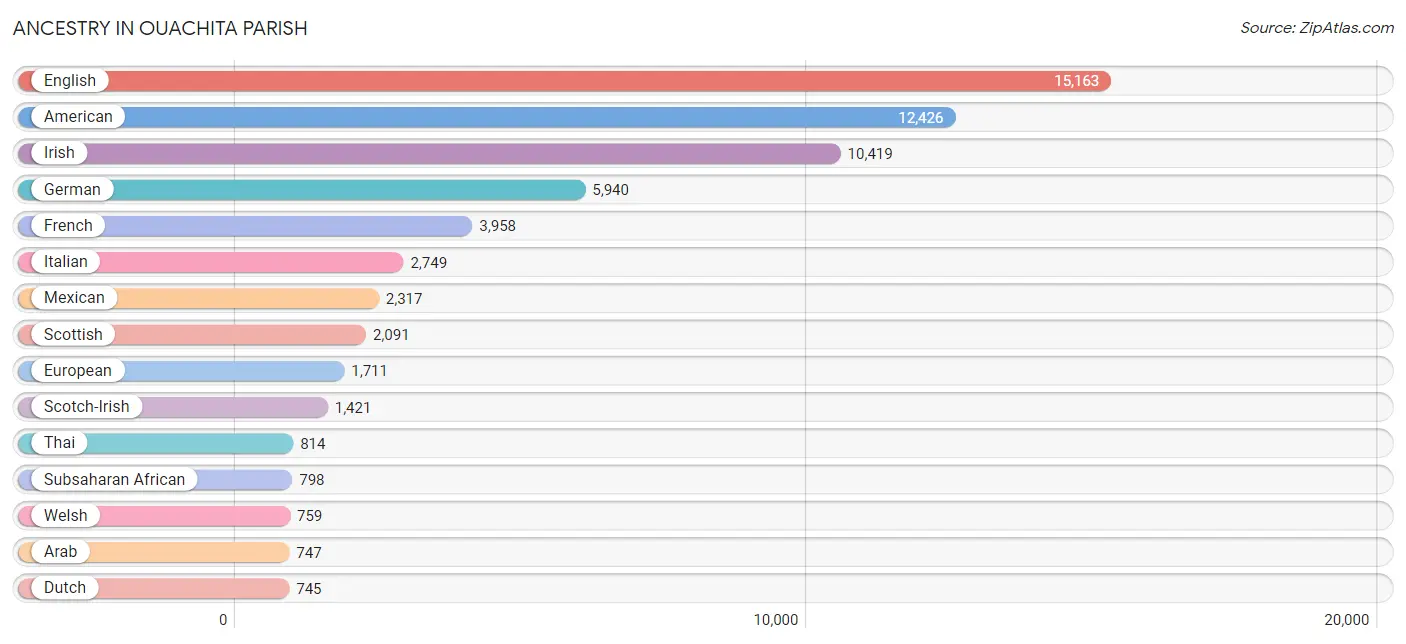
Ancestry in Ouachita Parish
The most populous ancestries reported in Ouachita Parish are English (15,163 | 9.5%), American (12,426 | 7.8%), Irish (10,419 | 6.5%), German (5,940 | 3.7%), and French (3,958 | 2.5%), together accounting for 30.0% of all Ouachita Parish residents.
| Ancestry | # Population | % Population |
| African | 547 | 0.3% |
| Albanian | 6 | 0.0% |
| American | 12,426 | 7.8% |
| Apache | 45 | 0.0% |
| Arab | 747 | 0.5% |
| Australian | 127 | 0.1% |
| Austrian | 116 | 0.1% |
| Barbadian | 21 | 0.0% |
| Belgian | 35 | 0.0% |
| Belizean | 39 | 0.0% |
| Bhutanese | 40 | 0.0% |
| Blackfeet | 43 | 0.0% |
| Brazilian | 6 | 0.0% |
| British | 396 | 0.3% |
| Burmese | 109 | 0.1% |
| Cajun | 228 | 0.1% |
| Canadian | 41 | 0.0% |
| Central American | 553 | 0.4% |
| Central American Indian | 157 | 0.1% |
| Cherokee | 245 | 0.2% |
| Chickasaw | 46 | 0.0% |
| Chippewa | 20 | 0.0% |
| Choctaw | 134 | 0.1% |
| Colombian | 5 | 0.0% |
| Comanche | 27 | 0.0% |
| Cuban | 15 | 0.0% |
| Czech | 94 | 0.1% |
| Czechoslovakian | 113 | 0.1% |
| Danish | 166 | 0.1% |
| Dutch | 745 | 0.5% |
| Dutch West Indian | 13 | 0.0% |
| Eastern European | 78 | 0.1% |
| Ecuadorian | 42 | 0.0% |
| Egyptian | 20 | 0.0% |
| English | 15,163 | 9.5% |
| Estonian | 16 | 0.0% |
| European | 1,711 | 1.1% |
| Filipino | 4 | 0.0% |
| Finnish | 44 | 0.0% |
| French | 3,958 | 2.5% |
| French American Indian | 25 | 0.0% |
| French Canadian | 484 | 0.3% |
| German | 5,940 | 3.7% |
| Greek | 190 | 0.1% |
| Honduran | 410 | 0.3% |
| Houma | 3 | 0.0% |
| Hungarian | 59 | 0.0% |
| Indian (Asian) | 273 | 0.2% |
| Inupiat | 31 | 0.0% |
| Iranian | 22 | 0.0% |
| Iraqi | 44 | 0.0% |
| Irish | 10,419 | 6.5% |
| Israeli | 57 | 0.0% |
| Italian | 2,749 | 1.7% |
| Jamaican | 55 | 0.0% |
| Korean | 168 | 0.1% |
| Latvian | 35 | 0.0% |
| Lebanese | 66 | 0.0% |
| Lithuanian | 33 | 0.0% |
| Lumbee | 11 | 0.0% |
| Malaysian | 26 | 0.0% |
| Mexican | 2,317 | 1.5% |
| Mexican American Indian | 99 | 0.1% |
| Moroccan | 47 | 0.0% |
| Native Hawaiian | 12 | 0.0% |
| Nepalese | 83 | 0.1% |
| Nicaraguan | 35 | 0.0% |
| Nigerian | 173 | 0.1% |
| Northern European | 35 | 0.0% |
| Norwegian | 530 | 0.3% |
| Pakistani | 83 | 0.1% |
| Palestinian | 138 | 0.1% |
| Panamanian | 46 | 0.0% |
| Peruvian | 11 | 0.0% |
| Polish | 654 | 0.4% |
| Portuguese | 54 | 0.0% |
| Puerto Rican | 192 | 0.1% |
| Russian | 168 | 0.1% |
| Salvadoran | 62 | 0.0% |
| Samoan | 7 | 0.0% |
| Scandinavian | 183 | 0.1% |
| Scotch-Irish | 1,421 | 0.9% |
| Scottish | 2,091 | 1.3% |
| Sioux | 31 | 0.0% |
| Slavic | 78 | 0.1% |
| Slovak | 21 | 0.0% |
| South American | 163 | 0.1% |
| Spaniard | 8 | 0.0% |
| Spanish | 215 | 0.1% |
| Sri Lankan | 613 | 0.4% |
| Subsaharan African | 798 | 0.5% |
| Swedish | 440 | 0.3% |
| Swiss | 86 | 0.1% |
| Syrian | 108 | 0.1% |
| Thai | 814 | 0.5% |
| Ukrainian | 58 | 0.0% |
| Venezuelan | 105 | 0.1% |
| Welsh | 759 | 0.5% |
| West Indian | 20 | 0.0% |
| Yugoslavian | 8 | 0.0% | View All 100 Rows |
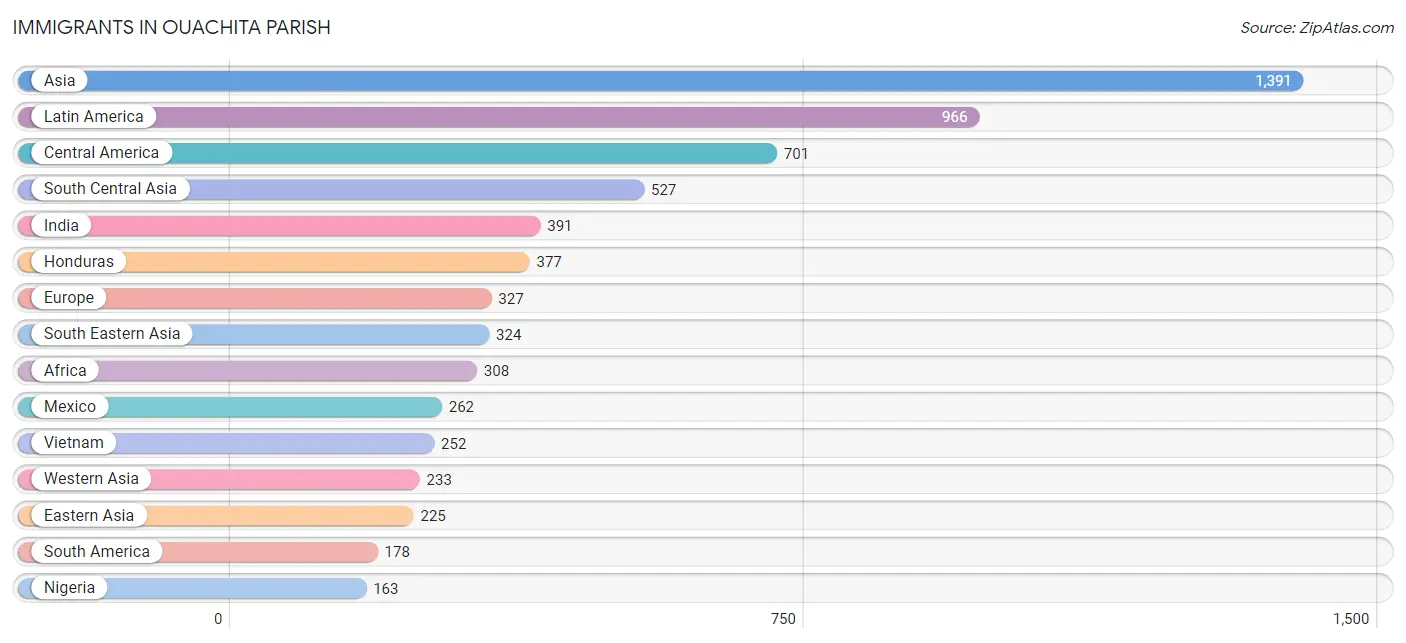
Immigrants in Ouachita Parish
The most numerous immigrant groups reported in Ouachita Parish came from Asia (1,391 | 0.9%), Latin America (966 | 0.6%), Central America (701 | 0.4%), South Central Asia (527 | 0.3%), and India (391 | 0.3%), together accounting for 2.5% of all Ouachita Parish residents.
| Immigration Origin | # Population | % Population |
| Africa | 308 | 0.2% |
| Asia | 1,391 | 0.9% |
| Barbados | 21 | 0.0% |
| Belgium | 7 | 0.0% |
| Belize | 27 | 0.0% |
| Bosnia and Herzegovina | 18 | 0.0% |
| Brazil | 40 | 0.0% |
| Cameroon | 82 | 0.1% |
| Canada | 34 | 0.0% |
| Caribbean | 87 | 0.1% |
| Central America | 701 | 0.4% |
| China | 91 | 0.1% |
| Cuba | 6 | 0.0% |
| Eastern Asia | 225 | 0.1% |
| Eastern Europe | 88 | 0.1% |
| Egypt | 20 | 0.0% |
| England | 16 | 0.0% |
| Europe | 327 | 0.2% |
| Germany | 70 | 0.0% |
| Greece | 25 | 0.0% |
| Haiti | 40 | 0.0% |
| Honduras | 377 | 0.2% |
| Hong Kong | 1 | 0.0% |
| India | 391 | 0.3% |
| Iraq | 22 | 0.0% |
| Ireland | 8 | 0.0% |
| Israel | 39 | 0.0% |
| Italy | 7 | 0.0% |
| Japan | 54 | 0.0% |
| Korea | 80 | 0.1% |
| Latin America | 966 | 0.6% |
| Latvia | 35 | 0.0% |
| Mexico | 262 | 0.2% |
| Middle Africa | 82 | 0.1% |
| Morocco | 43 | 0.0% |
| Nepal | 130 | 0.1% |
| Netherlands | 9 | 0.0% |
| Nicaragua | 35 | 0.0% |
| Nigeria | 163 | 0.1% |
| Northern Africa | 63 | 0.0% |
| Northern Europe | 121 | 0.1% |
| Oceania | 9 | 0.0% |
| Pakistan | 6 | 0.0% |
| Philippines | 57 | 0.0% |
| Russia | 35 | 0.0% |
| Saudi Arabia | 51 | 0.0% |
| South America | 178 | 0.1% |
| South Central Asia | 527 | 0.3% |
| South Eastern Asia | 324 | 0.2% |
| Southern Europe | 32 | 0.0% |
| Syria | 73 | 0.1% |
| Taiwan | 4 | 0.0% |
| Thailand | 15 | 0.0% |
| Venezuela | 138 | 0.1% |
| Vietnam | 252 | 0.2% |
| Western Africa | 163 | 0.1% |
| Western Asia | 233 | 0.2% |
| Western Europe | 86 | 0.1% |
| Yemen | 48 | 0.0% | View All 59 Rows |
Sex and Age in Ouachita Parish
Sex and Age in Ouachita Parish
The most populous age groups in Ouachita Parish are 10 to 14 Years (6,032 | 7.8%) for men and 30 to 34 Years (5,708 | 6.9%) for women.
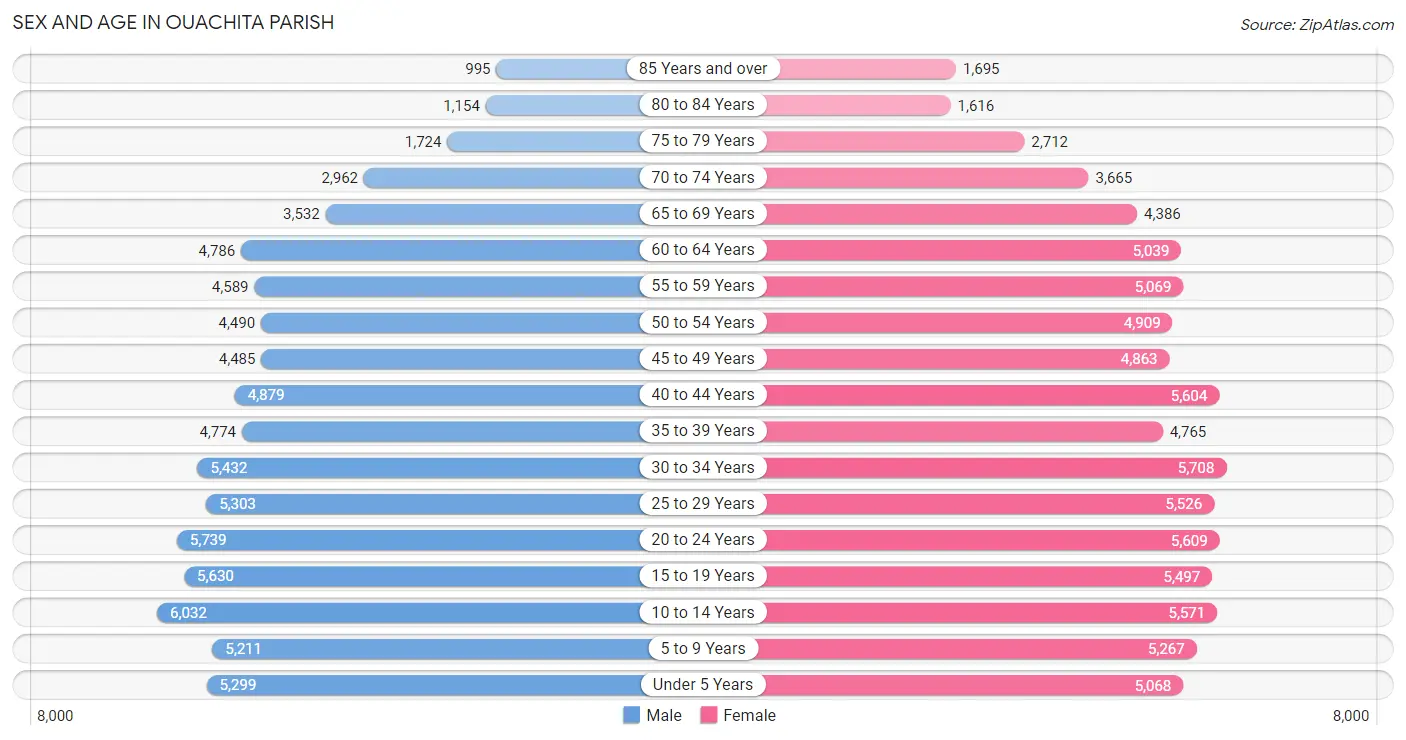
| Age Bracket | Male | Female |
| Under 5 Years | 5,299 (6.9%) | 5,068 (6.1%) |
| 5 to 9 Years | 5,211 (6.8%) | 5,267 (6.4%) |
| 10 to 14 Years | 6,032 (7.8%) | 5,571 (6.8%) |
| 15 to 19 Years | 5,630 (7.3%) | 5,497 (6.7%) |
| 20 to 24 Years | 5,739 (7.4%) | 5,609 (6.8%) |
| 25 to 29 Years | 5,303 (6.9%) | 5,526 (6.7%) |
| 30 to 34 Years | 5,432 (7.0%) | 5,708 (6.9%) |
| 35 to 39 Years | 4,774 (6.2%) | 4,765 (5.8%) |
| 40 to 44 Years | 4,879 (6.3%) | 5,604 (6.8%) |
| 45 to 49 Years | 4,485 (5.8%) | 4,863 (5.9%) |
| 50 to 54 Years | 4,490 (5.8%) | 4,909 (5.9%) |
| 55 to 59 Years | 4,589 (6.0%) | 5,069 (6.1%) |
| 60 to 64 Years | 4,786 (6.2%) | 5,039 (6.1%) |
| 65 to 69 Years | 3,532 (4.6%) | 4,386 (5.3%) |
| 70 to 74 Years | 2,962 (3.8%) | 3,665 (4.4%) |
| 75 to 79 Years | 1,724 (2.2%) | 2,712 (3.3%) |
| 80 to 84 Years | 1,154 (1.5%) | 1,616 (2.0%) |
| 85 Years and over | 995 (1.3%) | 1,695 (2.1%) |
| Total | 77,016 (100.0%) | 82,569 (100.0%) |
Families and Households in Ouachita Parish
Median Family Size in Ouachita Parish
The median family size in Ouachita Parish is 3.29 persons per family, with single female/mother families (10,119 | 26.8%) accounting for the largest median family size of 3.5 persons per family. On the other hand, single male/father families (3,114 | 8.3%) represent the smallest median family size with 3.18 persons per family.
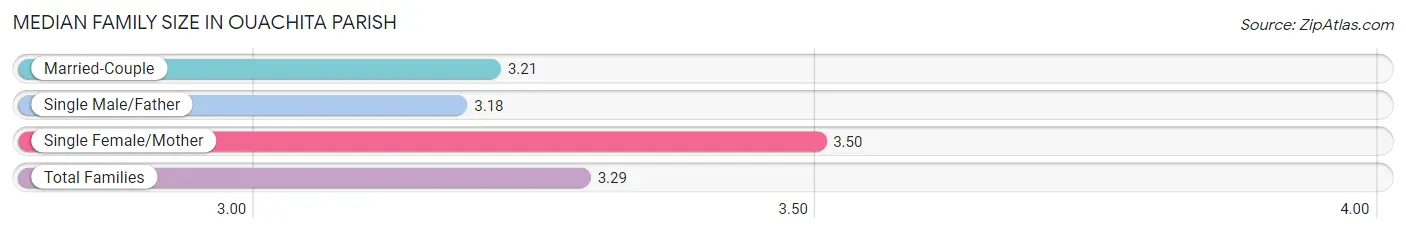
| Family Type | # Families | Family Size |
| Married-Couple | 24,509 (64.9%) | 3.21 |
| Single Male/Father | 3,114 (8.3%) | 3.18 |
| Single Female/Mother | 10,119 (26.8%) | 3.50 |
| Total Families | 37,742 (100.0%) | 3.29 |
Median Household Size in Ouachita Parish
The median household size in Ouachita Parish is 2.58 persons per household, with single female/mother households (10,119 | 17.0%) accounting for the largest median household size of 3.68 persons per household. non-family households (21,853 | 36.7%) represent the smallest median household size with 1.19 persons per household.
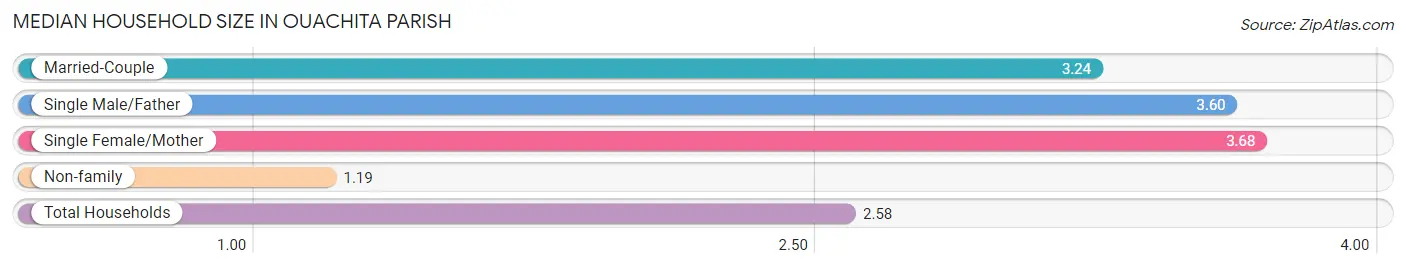
| Household Type | # Households | Household Size |
| Married-Couple | 24,509 (41.1%) | 3.24 |
| Single Male/Father | 3,114 (5.2%) | 3.60 |
| Single Female/Mother | 10,119 (17.0%) | 3.68 |
| Non-family | 21,853 (36.7%) | 1.19 |
| Total Households | 59,595 (100.0%) | 2.58 |
Household Size by Marriage Status in Ouachita Parish
Out of a total of 59,595 households in Ouachita Parish, 37,742 (63.3%) are family households, while 21,853 (36.7%) are nonfamily households. The most numerous type of family households are 2-person households, comprising 16,857, and the most common type of nonfamily households are 1-person households, comprising 18,895.
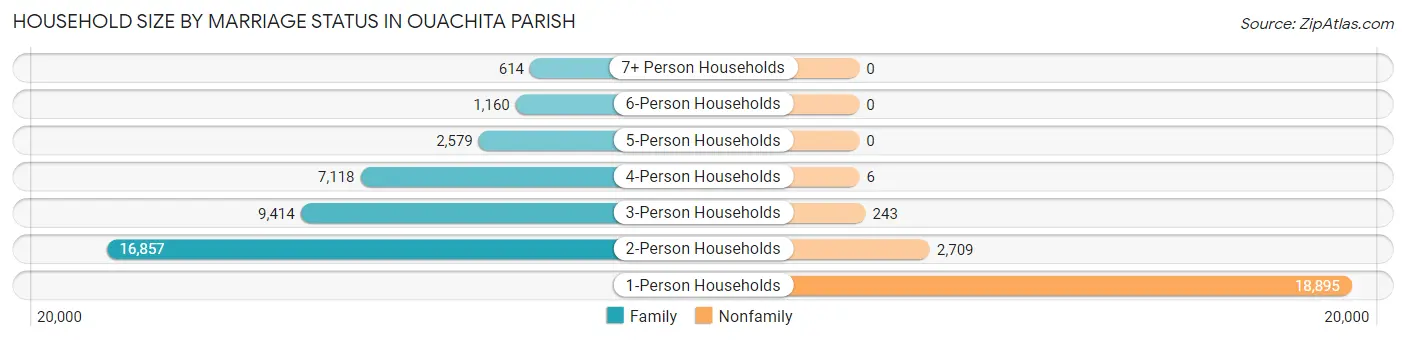
| Household Size | Family Households | Nonfamily Households |
| 1-Person Households | - | 18,895 (31.7%) |
| 2-Person Households | 16,857 (28.3%) | 2,709 (4.5%) |
| 3-Person Households | 9,414 (15.8%) | 243 (0.4%) |
| 4-Person Households | 7,118 (11.9%) | 6 (0.0%) |
| 5-Person Households | 2,579 (4.3%) | 0 (0.0%) |
| 6-Person Households | 1,160 (1.9%) | 0 (0.0%) |
| 7+ Person Households | 614 (1.0%) | 0 (0.0%) |
| Total | 37,742 (63.3%) | 21,853 (36.7%) |
Female Fertility in Ouachita Parish
Fertility by Age in Ouachita Parish
Average fertility rate in Ouachita Parish is 47.0 births per 1,000 women. Women in the age bracket of 20 to 34 years have the highest fertility rate with 82.0 births per 1,000 women. Women in the age bracket of 20 to 34 years acount for 75.7% of all women with births.
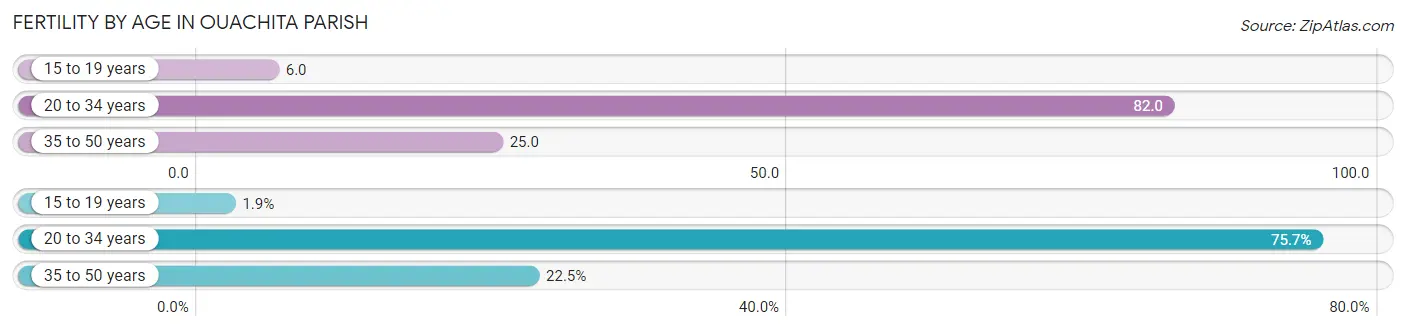
| Age Bracket | Women with Births | Births / 1,000 Women |
| 15 to 19 years | 34 (1.9%) | 6.0 |
| 20 to 34 years | 1,381 (75.7%) | 82.0 |
| 35 to 50 years | 410 (22.5%) | 25.0 |
| Total | 1,825 (100.0%) | 47.0 |
Fertility by Age by Marriage Status in Ouachita Parish
39.9% of women with births (1,825) in Ouachita Parish are married. The highest percentage of unmarried women with births falls into 15 to 19 years age bracket with 100.0% of them unmarried at the time of birth, while the lowest percentage of unmarried women with births belong to 35 to 50 years age bracket with 44.2% of them unmarried.
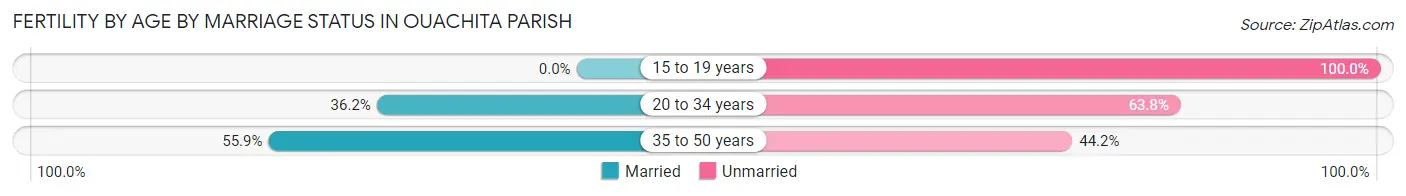
| Age Bracket | Married | Unmarried |
| 15 to 19 years | 0 (0.0%) | 34 (100.0%) |
| 20 to 34 years | 500 (36.2%) | 881 (63.8%) |
| 35 to 50 years | 229 (55.8%) | 181 (44.2%) |
| Total | 728 (39.9%) | 1,097 (60.1%) |
Fertility by Education in Ouachita Parish
Average fertility rate in Ouachita Parish is 47.0 births per 1,000 women. Women with the education attainment of high school diploma have the highest fertility rate of 64.0 births per 1,000 women, while women with the education attainment of less than high school have the lowest fertility at 33.0 births per 1,000 women. Women with the education attainment of high school diploma represent 29.9% of all women with births.
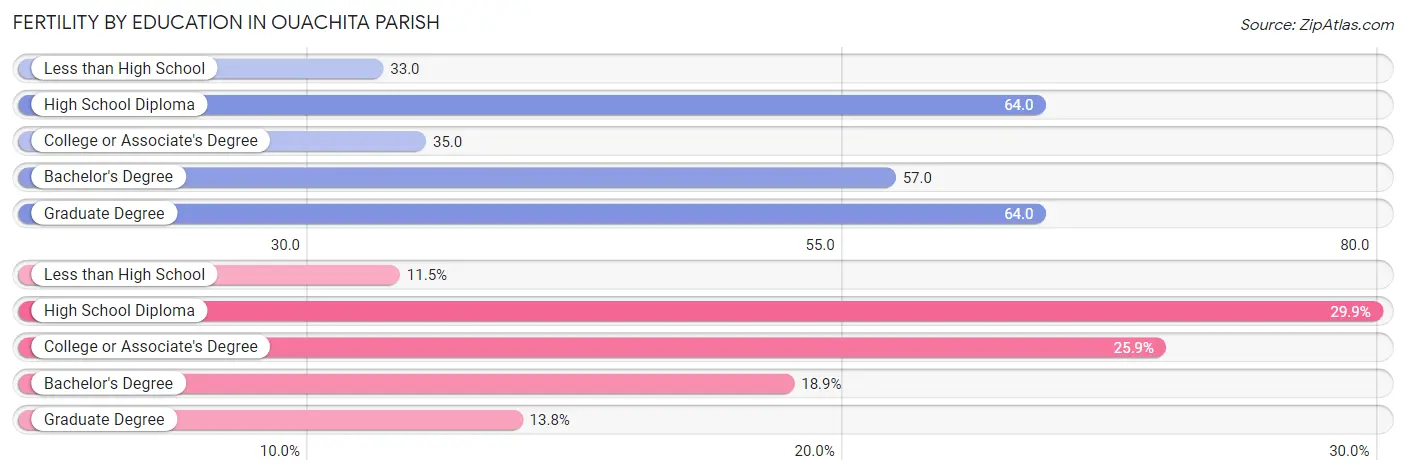
| Educational Attainment | Women with Births | Births / 1,000 Women |
| Less than High School | 210 (11.5%) | 33.0 |
| High School Diploma | 546 (29.9%) | 64.0 |
| College or Associate's Degree | 472 (25.9%) | 35.0 |
| Bachelor's Degree | 345 (18.9%) | 57.0 |
| Graduate Degree | 252 (13.8%) | 64.0 |
| Total | 1,825 (100.0%) | 47.0 |
Fertility by Education by Marriage Status in Ouachita Parish
60.1% of women with births in Ouachita Parish are unmarried. Women with the educational attainment of graduate degree are most likely to be married with 100.0% of them married at childbirth, while women with the educational attainment of high school diploma are least likely to be married with 79.5% of them unmarried at childbirth.
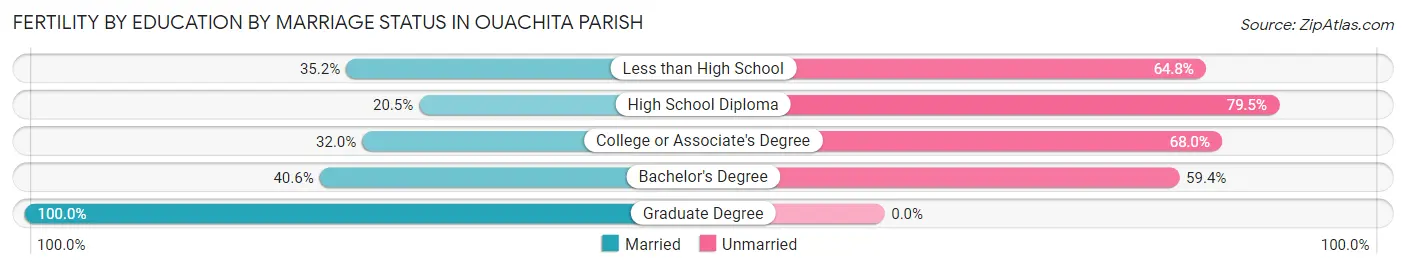
| Educational Attainment | Married | Unmarried |
| Less than High School | 74 (35.2%) | 136 (64.8%) |
| High School Diploma | 112 (20.5%) | 434 (79.5%) |
| College or Associate's Degree | 151 (32.0%) | 321 (68.0%) |
| Bachelor's Degree | 140 (40.6%) | 205 (59.4%) |
| Graduate Degree | 252 (100.0%) | 0 (0.0%) |
| Total | 728 (39.9%) | 1,097 (60.1%) |
Income in Ouachita Parish
Income Overview in Ouachita Parish
Per Capita Income in Ouachita Parish is $29,670, while median incomes of families and households are $67,253 and $49,261 respectively.
| Characteristic | Number | Measure |
| Per Capita Income | 159,585 | $29,670 |
| Median Family Income | 37,742 | $67,253 |
| Mean Family Income | 37,742 | $92,202 |
| Median Household Income | 59,595 | $49,261 |
| Mean Household Income | 59,595 | $74,687 |
| Income Deficit | 37,742 | $11,934 |
| Wage / Income Gap (%) | 159,585 | 31.99% |
| Wage / Income Gap ($) | 159,585 | 68.01¢ per $1 |
| Gini / Inequality Index | 159,585 | 0.52 |
Earnings by Sex in Ouachita Parish
Average Earnings in Ouachita Parish are $36,557, $45,511 for men and $30,952 for women, a difference of 32.0%.
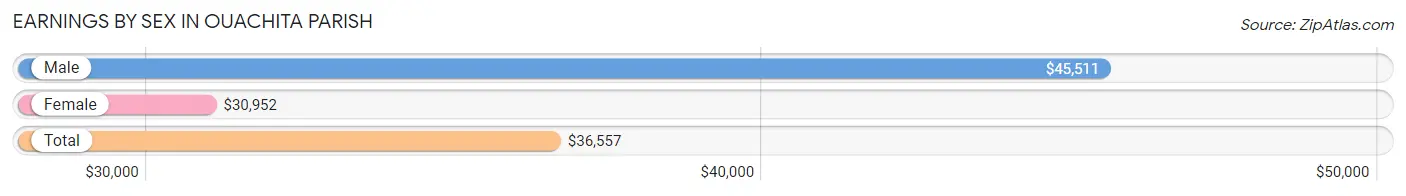
| Sex | Number | Average Earnings |
| Male | 36,257 (49.0%) | $45,511 |
| Female | 37,670 (51.0%) | $30,952 |
| Total | 73,927 (100.0%) | $36,557 |
Earnings by Sex by Income Bracket in Ouachita Parish
The most common earnings brackets in Ouachita Parish are $100,000+ for men (5,906 | 16.3%) and $25,000 to $29,999 for women (3,064 | 8.1%).
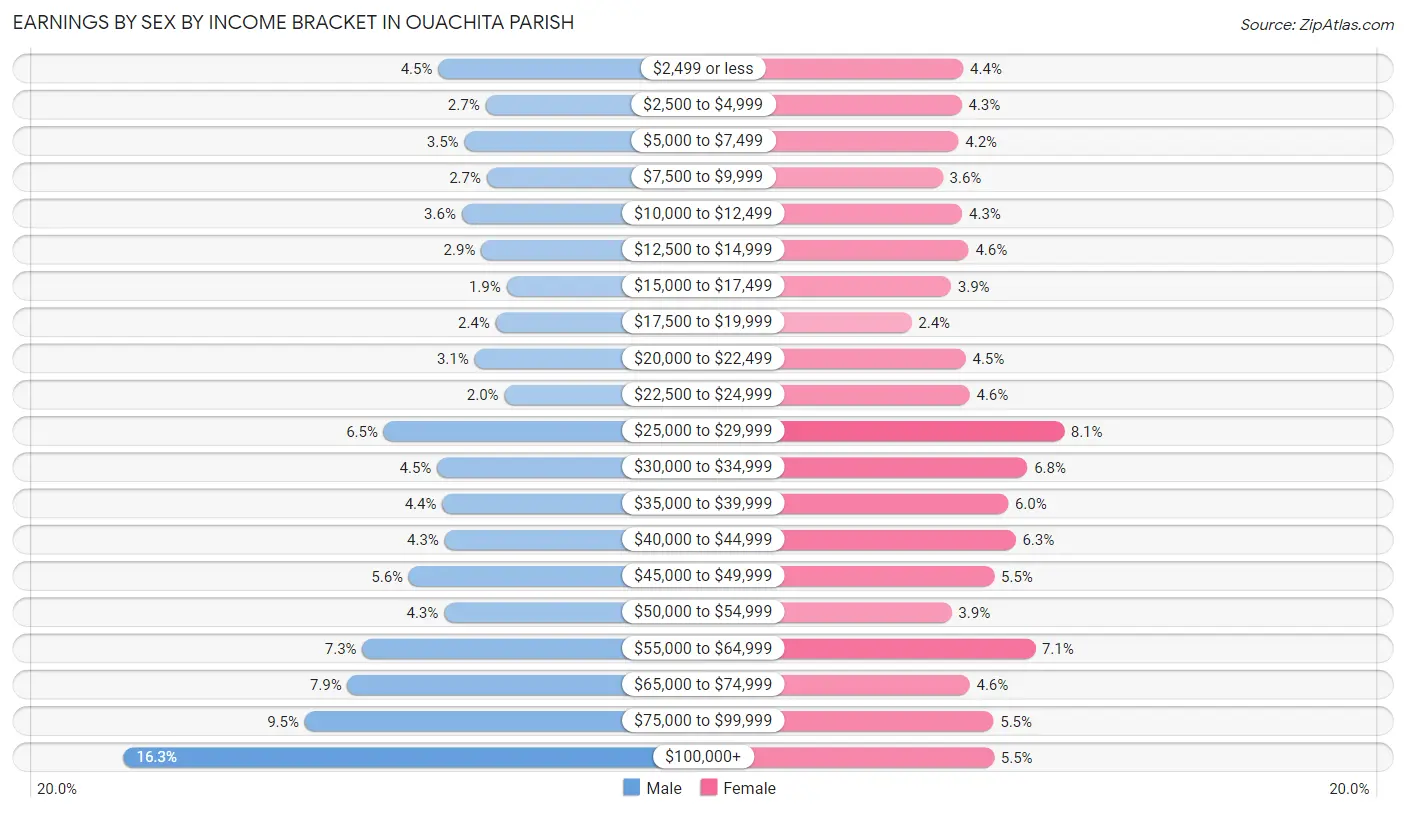
| Income | Male | Female |
| $2,499 or less | 1,632 (4.5%) | 1,642 (4.4%) |
| $2,500 to $4,999 | 990 (2.7%) | 1,619 (4.3%) |
| $5,000 to $7,499 | 1,277 (3.5%) | 1,573 (4.2%) |
| $7,500 to $9,999 | 970 (2.7%) | 1,353 (3.6%) |
| $10,000 to $12,499 | 1,314 (3.6%) | 1,628 (4.3%) |
| $12,500 to $14,999 | 1,048 (2.9%) | 1,716 (4.6%) |
| $15,000 to $17,499 | 702 (1.9%) | 1,470 (3.9%) |
| $17,500 to $19,999 | 852 (2.4%) | 910 (2.4%) |
| $20,000 to $22,499 | 1,140 (3.1%) | 1,678 (4.4%) |
| $22,500 to $24,999 | 732 (2.0%) | 1,733 (4.6%) |
| $25,000 to $29,999 | 2,370 (6.5%) | 3,064 (8.1%) |
| $30,000 to $34,999 | 1,645 (4.5%) | 2,545 (6.8%) |
| $35,000 to $39,999 | 1,578 (4.3%) | 2,276 (6.0%) |
| $40,000 to $44,999 | 1,545 (4.3%) | 2,379 (6.3%) |
| $45,000 to $49,999 | 2,032 (5.6%) | 2,078 (5.5%) |
| $50,000 to $54,999 | 1,553 (4.3%) | 1,475 (3.9%) |
| $55,000 to $64,999 | 2,663 (7.3%) | 2,654 (7.0%) |
| $65,000 to $74,999 | 2,864 (7.9%) | 1,733 (4.6%) |
| $75,000 to $99,999 | 3,444 (9.5%) | 2,069 (5.5%) |
| $100,000+ | 5,906 (16.3%) | 2,075 (5.5%) |
| Total | 36,257 (100.0%) | 37,670 (100.0%) |
Earnings by Sex by Educational Attainment in Ouachita Parish
Average earnings in Ouachita Parish are $52,091 for men and $35,162 for women, a difference of 32.5%. Men with an educational attainment of graduate degree enjoy the highest average annual earnings of $79,405, while those with less than high school education earn the least with $31,173. Women with an educational attainment of graduate degree earn the most with the average annual earnings of $55,596, while those with less than high school education have the smallest earnings of $20,143.
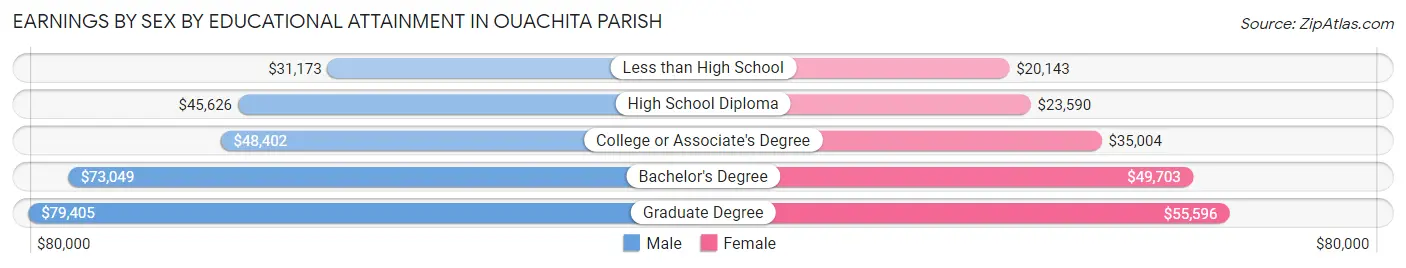
| Educational Attainment | Male Income | Female Income |
| Less than High School | $31,173 | $20,143 |
| High School Diploma | $45,626 | $23,590 |
| College or Associate's Degree | $48,402 | $35,004 |
| Bachelor's Degree | $73,049 | $49,703 |
| Graduate Degree | $79,405 | $55,596 |
| Total | $52,091 | $35,162 |
Family Income in Ouachita Parish
Family Income Brackets in Ouachita Parish
According to the Ouachita Parish family income data, there are 6,190 families falling into the $100,000 to $149,999 income range, which is the most common income bracket and makes up 16.4% of all families. Conversely, the $10,000 to $14,999 income bracket is the least frequent group with only 1,661 families (4.4%) belonging to this category.
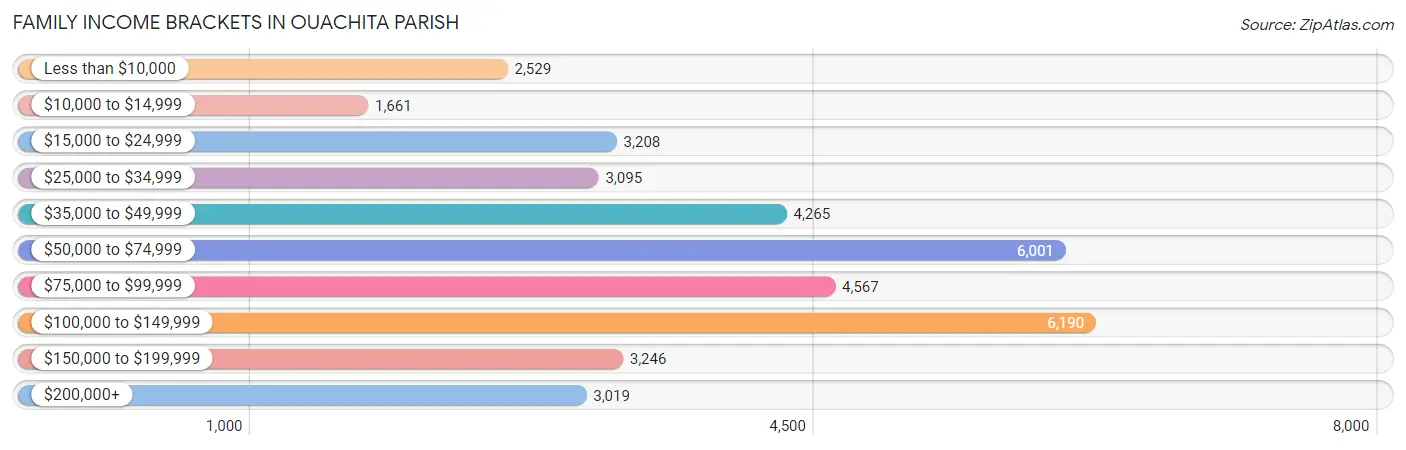
| Income Bracket | # Families | % Families |
| Less than $10,000 | 2,529 | 6.7% |
| $10,000 to $14,999 | 1,661 | 4.4% |
| $15,000 to $24,999 | 3,208 | 8.5% |
| $25,000 to $34,999 | 3,095 | 8.2% |
| $35,000 to $49,999 | 4,265 | 11.3% |
| $50,000 to $74,999 | 6,001 | 15.9% |
| $75,000 to $99,999 | 4,567 | 12.1% |
| $100,000 to $149,999 | 6,190 | 16.4% |
| $150,000 to $199,999 | 3,246 | 8.6% |
| $200,000+ | 3,019 | 8.0% |
Family Income by Famaliy Size in Ouachita Parish
4-person families (6,421 | 17.0%) account for the highest median family income in Ouachita Parish with $94,558 per family, while 2-person families (18,049 | 47.8%) have the highest median income of $30,566 per family member.
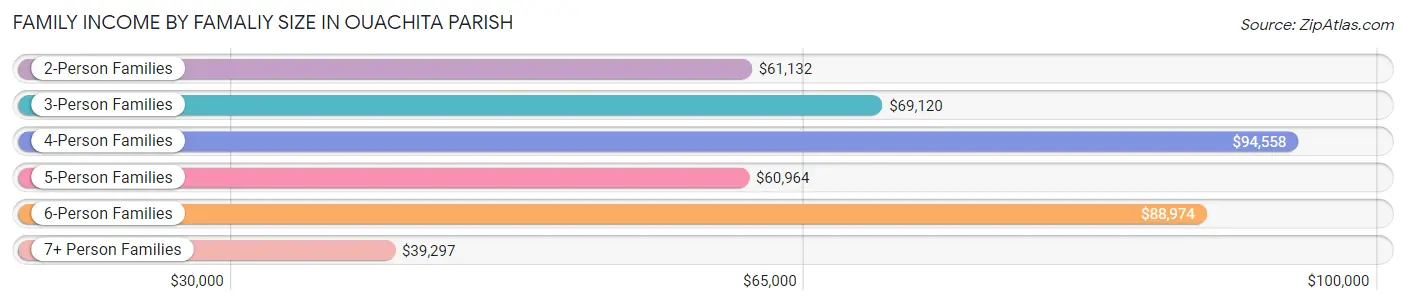
| Income Bracket | # Families | Median Income |
| 2-Person Families | 18,049 (47.8%) | $61,132 |
| 3-Person Families | 9,249 (24.5%) | $69,120 |
| 4-Person Families | 6,421 (17.0%) | $94,558 |
| 5-Person Families | 2,565 (6.8%) | $60,964 |
| 6-Person Families | 940 (2.5%) | $88,974 |
| 7+ Person Families | 518 (1.4%) | $39,297 |
| Total | 37,742 (100.0%) | $67,253 |
Family Income by Number of Earners in Ouachita Parish
The median family income in Ouachita Parish is $67,253, with families comprising 3+ earners (2,832) having the highest median family income of $136,618, while families with no earners (7,166) have the lowest median family income of $27,073, accounting for 7.5% and 19.0% of families, respectively.
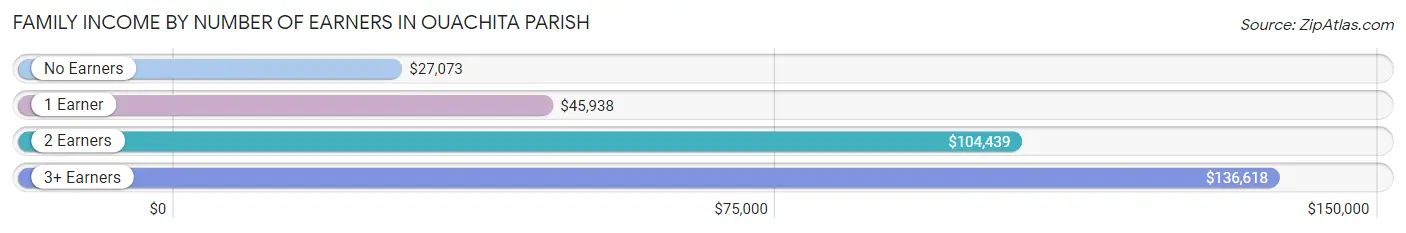
| Number of Earners | # Families | Median Income |
| No Earners | 7,166 (19.0%) | $27,073 |
| 1 Earner | 14,001 (37.1%) | $45,938 |
| 2 Earners | 13,743 (36.4%) | $104,439 |
| 3+ Earners | 2,832 (7.5%) | $136,618 |
| Total | 37,742 (100.0%) | $67,253 |
Household Income in Ouachita Parish
Household Income Brackets in Ouachita Parish
With 8,999 households falling in the category, the $50,000 to $74,999 income range is the most frequent in Ouachita Parish, accounting for 15.1% of all households. In contrast, only 3,397 households (5.7%) fall into the $200,000+ income bracket, making it the least populous group.
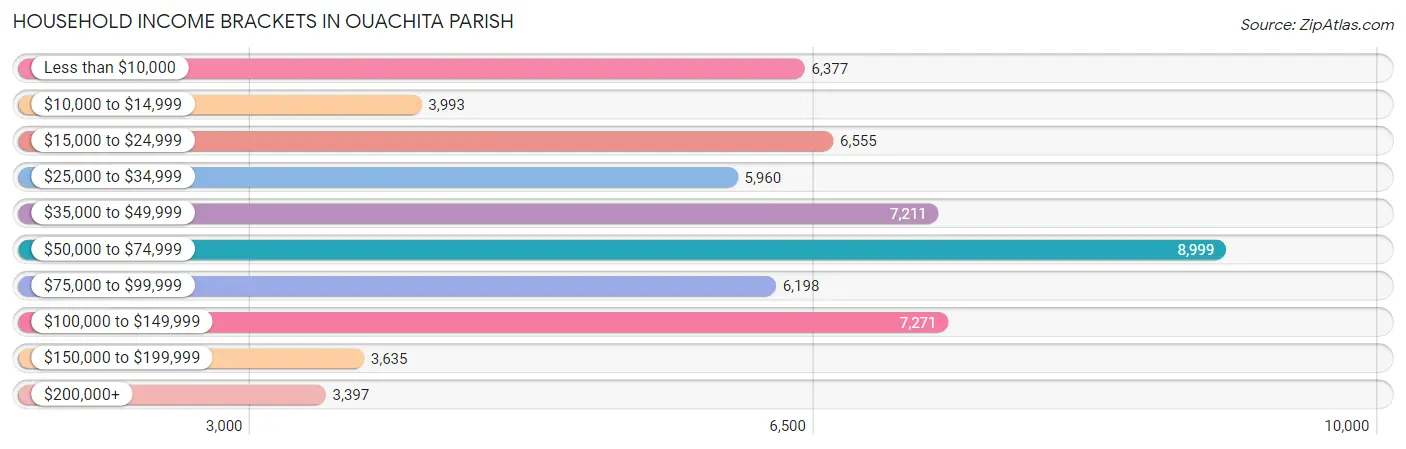
| Income Bracket | # Households | % Households |
| Less than $10,000 | 6,377 | 10.7% |
| $10,000 to $14,999 | 3,993 | 6.7% |
| $15,000 to $24,999 | 6,555 | 11.0% |
| $25,000 to $34,999 | 5,960 | 10.0% |
| $35,000 to $49,999 | 7,211 | 12.1% |
| $50,000 to $74,999 | 8,999 | 15.1% |
| $75,000 to $99,999 | 6,198 | 10.4% |
| $100,000 to $149,999 | 7,271 | 12.2% |
| $150,000 to $199,999 | 3,635 | 6.1% |
| $200,000+ | 3,397 | 5.7% |
Household Income by Householder Age in Ouachita Parish
The median household income in Ouachita Parish is $49,261, with the highest median household income of $59,962 found in the 45 to 64 years age bracket for the primary householder. A total of 21,847 households (36.7%) fall into this category. Meanwhile, the 15 to 24 years age bracket for the primary householder has the lowest median household income of $29,653, with 2,478 households (4.2%) in this group.

| Income Bracket | # Households | Median Income |
| 15 to 24 Years | 2,478 (4.2%) | $29,653 |
| 25 to 44 Years | 19,801 (33.2%) | $51,727 |
| 45 to 64 Years | 21,847 (36.7%) | $59,962 |
| 65+ Years | 15,469 (26.0%) | $39,730 |
| Total | 59,595 (100.0%) | $49,261 |
Poverty in Ouachita Parish
Income Below Poverty by Sex and Age in Ouachita Parish
With 21.5% poverty level for males and 25.2% for females among the residents of Ouachita Parish, 5 year old males and 5 year old females are the most vulnerable to poverty, with 525 males (47.1%) and 389 females (40.0%) in their respective age groups living below the poverty level.
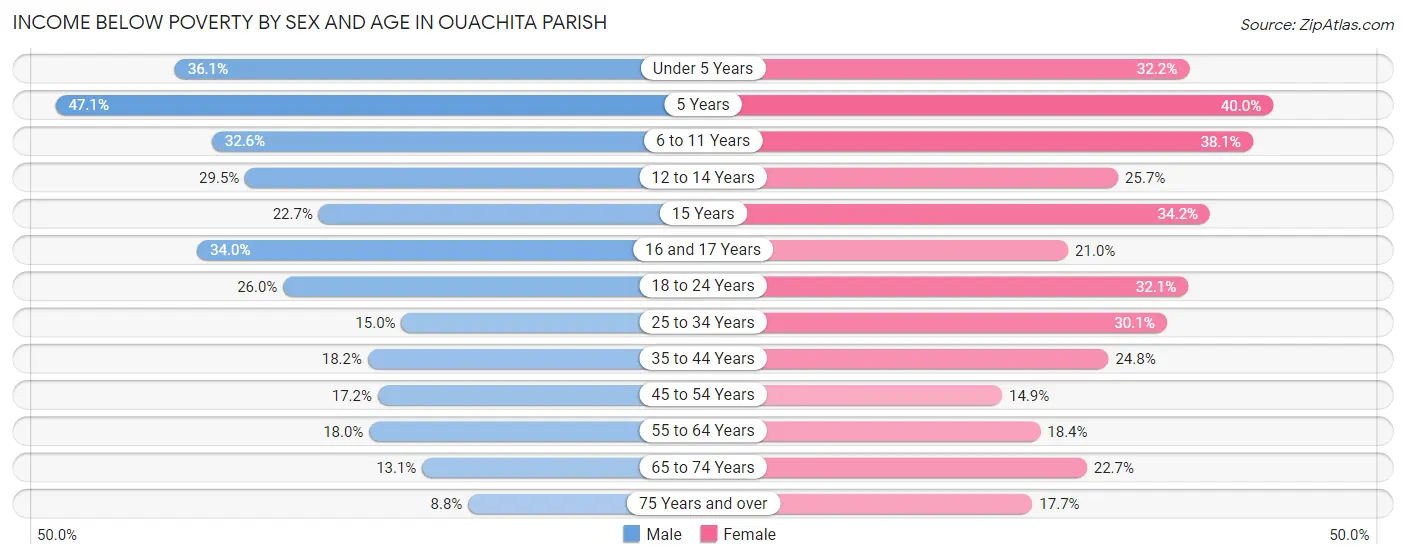
| Age Bracket | Male | Female |
| Under 5 Years | 1,832 (36.1%) | 1,630 (32.2%) |
| 5 Years | 525 (47.1%) | 389 (40.0%) |
| 6 to 11 Years | 2,113 (32.6%) | 2,488 (38.1%) |
| 12 to 14 Years | 1,033 (29.5%) | 841 (25.7%) |
| 15 Years | 289 (22.7%) | 372 (34.2%) |
| 16 and 17 Years | 707 (34.0%) | 445 (21.0%) |
| 18 to 24 Years | 1,717 (26.0%) | 2,182 (32.1%) |
| 25 to 34 Years | 1,511 (15.0%) | 3,380 (30.1%) |
| 35 to 44 Years | 1,591 (18.1%) | 2,561 (24.7%) |
| 45 to 54 Years | 1,486 (17.2%) | 1,452 (14.9%) |
| 55 to 64 Years | 1,650 (18.0%) | 1,854 (18.4%) |
| 65 to 74 Years | 834 (13.1%) | 1,814 (22.7%) |
| 75 Years and over | 323 (8.8%) | 1,031 (17.7%) |
| Total | 15,611 (21.5%) | 20,439 (25.2%) |
Income Above Poverty by Sex and Age in Ouachita Parish
According to the poverty statistics in Ouachita Parish, males aged 75 years and over and females aged 45 to 54 years are the age groups that are most secure financially, with 91.2% of males and 85.1% of females in these age groups living above the poverty line.
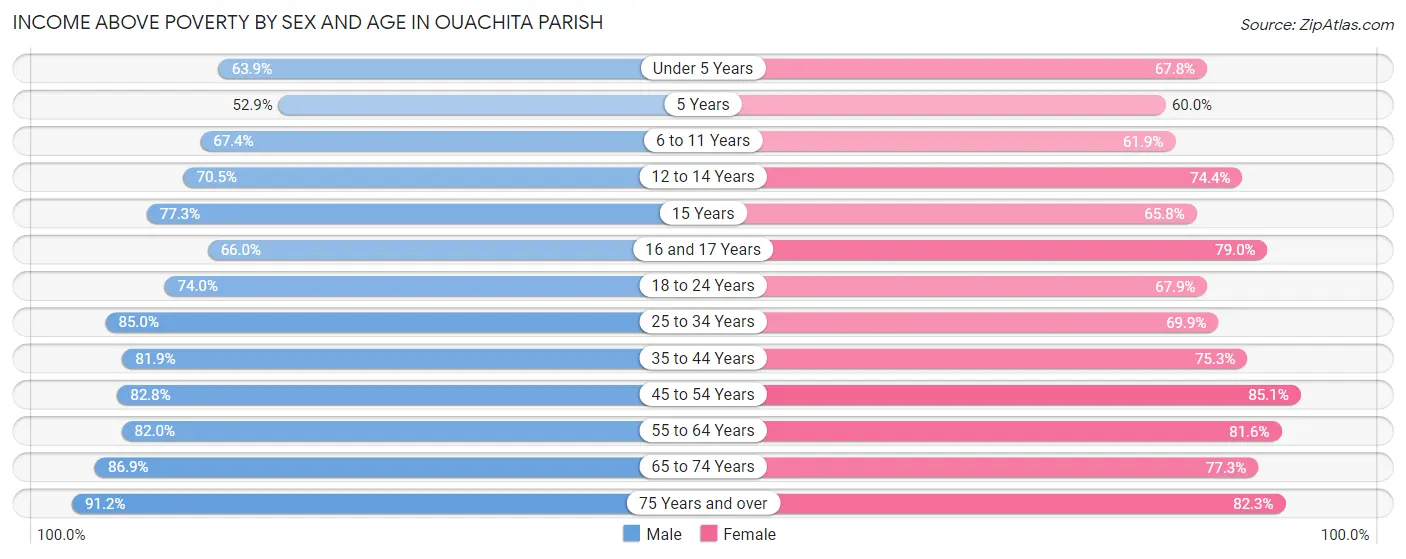
| Age Bracket | Male | Female |
| Under 5 Years | 3,249 (63.9%) | 3,428 (67.8%) |
| 5 Years | 589 (52.9%) | 583 (60.0%) |
| 6 to 11 Years | 4,364 (67.4%) | 4,037 (61.9%) |
| 12 to 14 Years | 2,465 (70.5%) | 2,438 (74.4%) |
| 15 Years | 984 (77.3%) | 717 (65.8%) |
| 16 and 17 Years | 1,373 (66.0%) | 1,673 (79.0%) |
| 18 to 24 Years | 4,886 (74.0%) | 4,608 (67.9%) |
| 25 to 34 Years | 8,544 (85.0%) | 7,837 (69.9%) |
| 35 to 44 Years | 7,175 (81.9%) | 7,788 (75.2%) |
| 45 to 54 Years | 7,141 (82.8%) | 8,312 (85.1%) |
| 55 to 64 Years | 7,508 (82.0%) | 8,204 (81.6%) |
| 65 to 74 Years | 5,533 (86.9%) | 6,163 (77.3%) |
| 75 Years and over | 3,336 (91.2%) | 4,797 (82.3%) |
| Total | 57,147 (78.5%) | 60,585 (74.8%) |
Income Below Poverty Among Married-Couple Families in Ouachita Parish
The poverty statistics for married-couple families in Ouachita Parish show that 6.3% or 1,535 of the total 24,509 families live below the poverty line. Families with 5 or more children have the highest poverty rate of 46.3%, comprising of 75 families. On the other hand, families with no children have the lowest poverty rate of 5.2%, which includes 739 families.
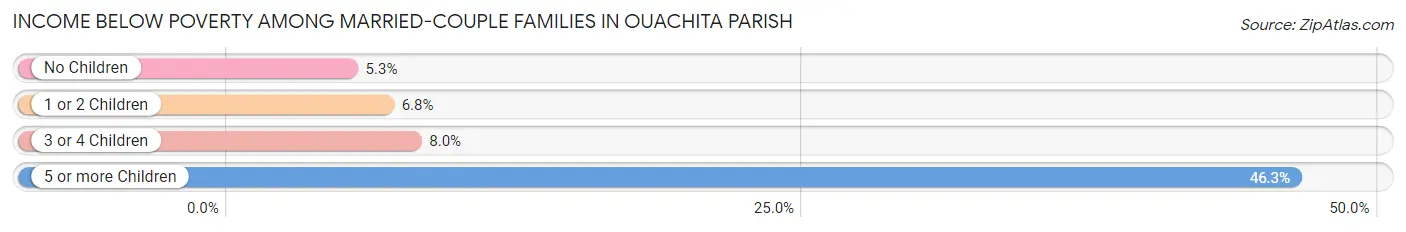
| Children | Above Poverty | Below Poverty |
| No Children | 13,349 (94.8%) | 739 (5.2%) |
| 1 or 2 Children | 7,909 (93.2%) | 579 (6.8%) |
| 3 or 4 Children | 1,629 (92.0%) | 142 (8.0%) |
| 5 or more Children | 87 (53.7%) | 75 (46.3%) |
| Total | 22,974 (93.7%) | 1,535 (6.3%) |
Income Below Poverty Among Single-Parent Households in Ouachita Parish
According to the poverty data in Ouachita Parish, 24.6% or 765 single-father households and 45.0% or 4,552 single-mother households are living below the poverty line. Among single-father households, those with 5 or more children have the highest poverty rate, with 12 households (100.0%) experiencing poverty. Likewise, among single-mother households, those with 5 or more children have the highest poverty rate, with 185 households (100.0%) falling below the poverty line.
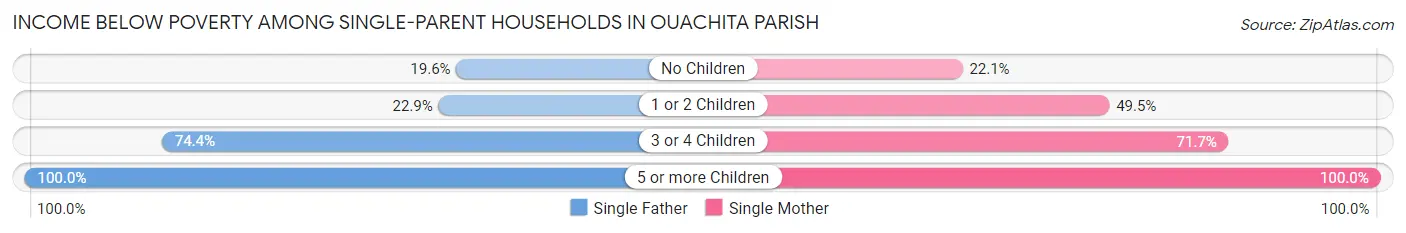
| Children | Single Father | Single Mother |
| No Children | 294 (19.6%) | 754 (22.1%) |
| 1 or 2 Children | 325 (22.9%) | 2,369 (49.5%) |
| 3 or 4 Children | 134 (74.4%) | 1,244 (71.7%) |
| 5 or more Children | 12 (100.0%) | 185 (100.0%) |
| Total | 765 (24.6%) | 4,552 (45.0%) |
Income Below Poverty Among Married-Couple vs Single-Parent Households in Ouachita Parish
The poverty data for Ouachita Parish shows that 1,535 of the married-couple family households (6.3%) and 5,317 of the single-parent households (40.2%) are living below the poverty level. Within the married-couple family households, those with 5 or more children have the highest poverty rate, with 75 households (46.3%) falling below the poverty line. Among the single-parent households, those with 5 or more children have the highest poverty rate, with 197 household (100.0%) living below poverty.
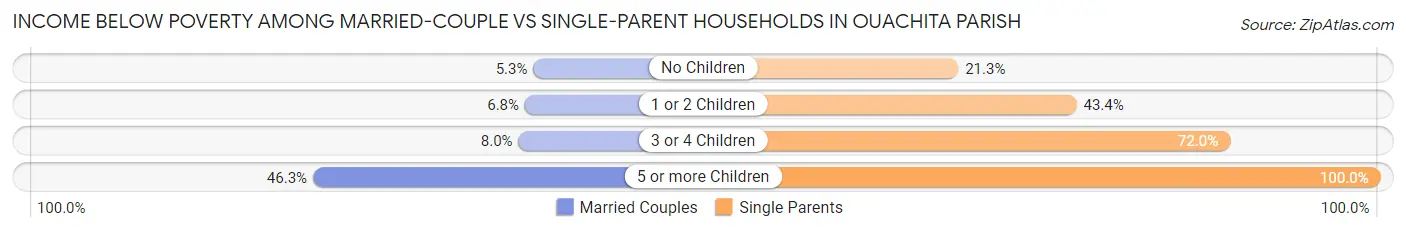
| Children | Married-Couple Families | Single-Parent Households |
| No Children | 739 (5.2%) | 1,048 (21.3%) |
| 1 or 2 Children | 579 (6.8%) | 2,694 (43.4%) |
| 3 or 4 Children | 142 (8.0%) | 1,378 (72.0%) |
| 5 or more Children | 75 (46.3%) | 197 (100.0%) |
| Total | 1,535 (6.3%) | 5,317 (40.2%) |
Employment Characteristics in Ouachita Parish
Employment by Class of Employer in Ouachita Parish
Among the 67,312 employed individuals in Ouachita Parish, private company employees (45,970 | 68.3%), not-for-profit organizations (5,295 | 7.9%), and local government employees (4,829 | 7.2%) make up the most common classes of employment.
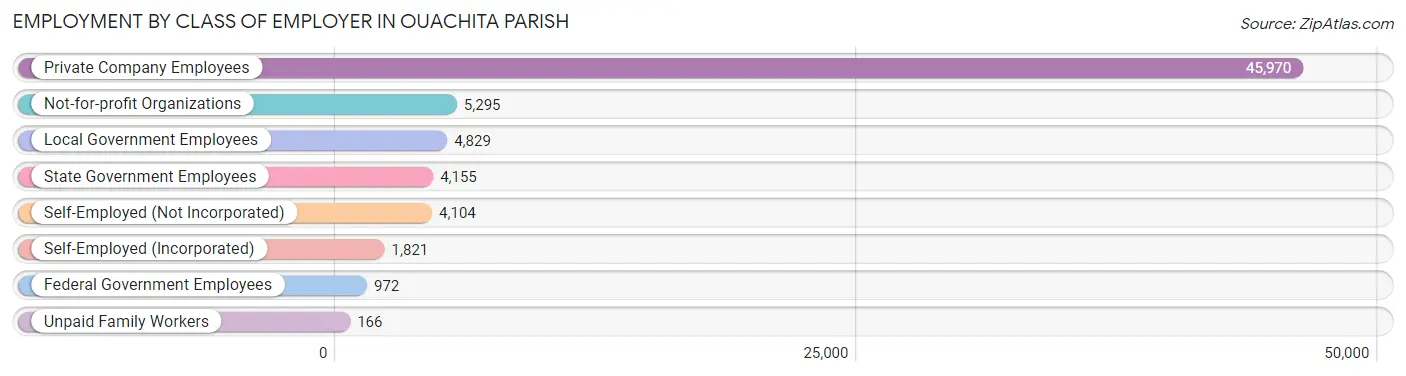
| Employer Class | # Employees | % Employees |
| Private Company Employees | 45,970 | 68.3% |
| Self-Employed (Incorporated) | 1,821 | 2.7% |
| Self-Employed (Not Incorporated) | 4,104 | 6.1% |
| Not-for-profit Organizations | 5,295 | 7.9% |
| Local Government Employees | 4,829 | 7.2% |
| State Government Employees | 4,155 | 6.2% |
| Federal Government Employees | 972 | 1.4% |
| Unpaid Family Workers | 166 | 0.3% |
| Total | 67,312 | 100.0% |
Employment Status by Age in Ouachita Parish
According to the labor force statistics for Ouachita Parish, out of the total population over 16 years of age (124,769), 58.8% or 73,364 individuals are in the labor force, with 6.5% or 4,769 of them unemployed. The age group with the highest labor force participation rate is 35 to 44 years, with 77.6% or 15,537 individuals in the labor force. Within the labor force, the 16 to 19 years age range has the highest percentage of unemployed individuals, with 20.4% or 540 of them being unemployed.
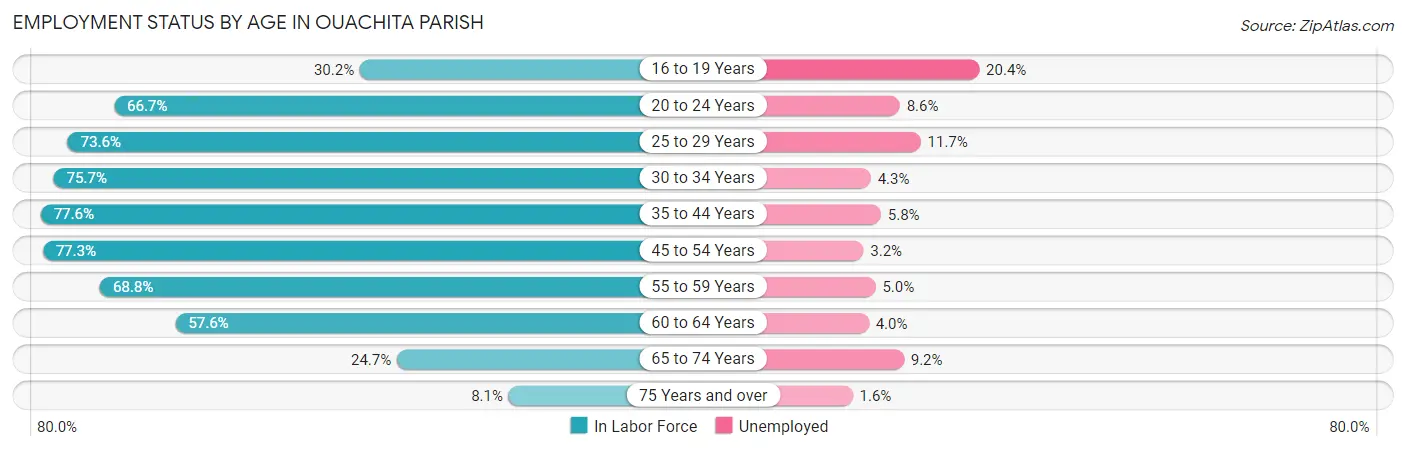
| Age Bracket | In Labor Force | Unemployed |
| 16 to 19 Years | 2,645 (30.2%) | 540 (20.4%) |
| 20 to 24 Years | 7,569 (66.7%) | 651 (8.6%) |
| 25 to 29 Years | 7,970 (73.6%) | 932 (11.7%) |
| 30 to 34 Years | 8,433 (75.7%) | 363 (4.3%) |
| 35 to 44 Years | 15,537 (77.6%) | 901 (5.8%) |
| 45 to 54 Years | 14,491 (77.3%) | 464 (3.2%) |
| 55 to 59 Years | 6,645 (68.8%) | 332 (5.0%) |
| 60 to 64 Years | 5,659 (57.6%) | 226 (4.0%) |
| 65 to 74 Years | 3,593 (24.7%) | 331 (9.2%) |
| 75 Years and over | 802 (8.1%) | 13 (1.6%) |
| Total | 73,364 (58.8%) | 4,769 (6.5%) |
Employment Status by Educational Attainment in Ouachita Parish
According to labor force statistics for Ouachita Parish, 73.2% of individuals (58,722) out of the total population between 25 and 64 years of age (80,221) are in the labor force, with 5.5% or 3,230 of them being unemployed. The group with the highest labor force participation rate are those with the educational attainment of bachelor's degree or higher, with 89.8% or 18,924 individuals in the labor force. Within the labor force, individuals with less than high school education have the highest percentage of unemployment, with 12.7% or 615 of them being unemployed.
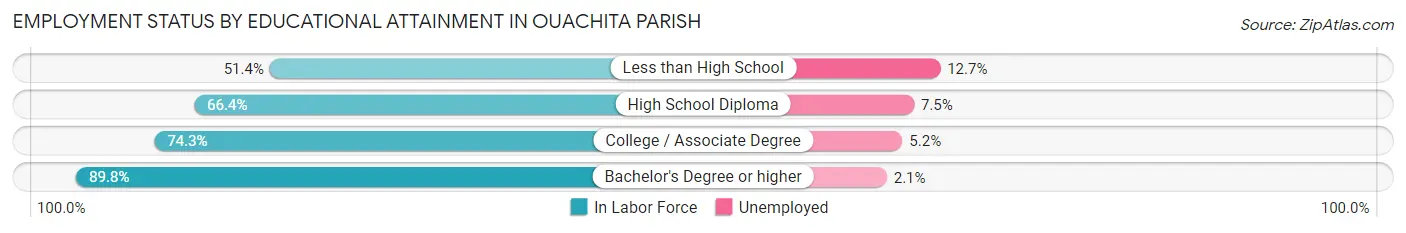
| Educational Attainment | In Labor Force | Unemployed |
| Less than High School | 4,845 (51.4%) | 1,197 (12.7%) |
| High School Diploma | 16,514 (66.4%) | 1,865 (7.5%) |
| College / Associate Degree | 18,465 (74.3%) | 1,292 (5.2%) |
| Bachelor's Degree or higher | 18,924 (89.8%) | 443 (2.1%) |
| Total | 58,722 (73.2%) | 4,412 (5.5%) |
Employment Occupations by Sex in Ouachita Parish
Management, Business, Science and Arts Occupations
The most common Management, Business, Science and Arts occupations in Ouachita Parish are Community & Social Service (8,643 | 12.6%), Management (5,952 | 8.7%), Health Diagnosing & Treating (5,651 | 8.3%), Education Instruction & Library (4,786 | 7.0%), and Health Technologists (3,690 | 5.4%).
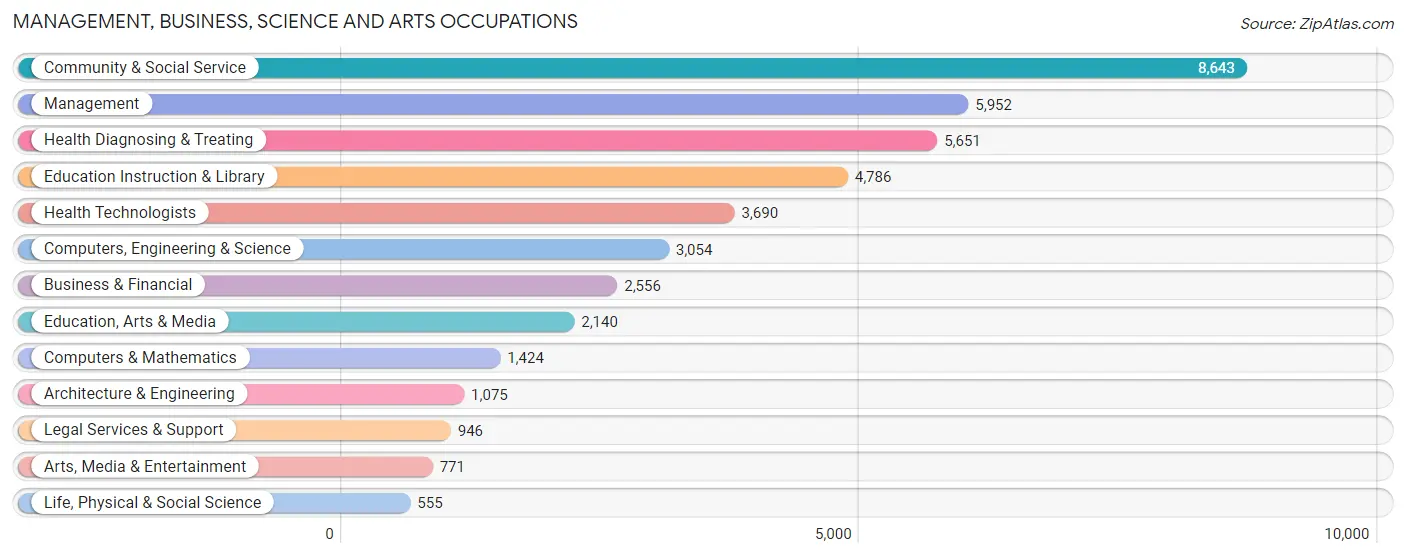
Management, Business, Science and Arts Occupations by Sex
Within the Management, Business, Science and Arts occupations in Ouachita Parish, the most male-oriented occupations are Architecture & Engineering (78.8%), Computers, Engineering & Science (64.7%), and Computers & Mathematics (59.8%), while the most female-oriented occupations are Education Instruction & Library (80.1%), Health Technologists (74.9%), and Health Diagnosing & Treating (74.8%).
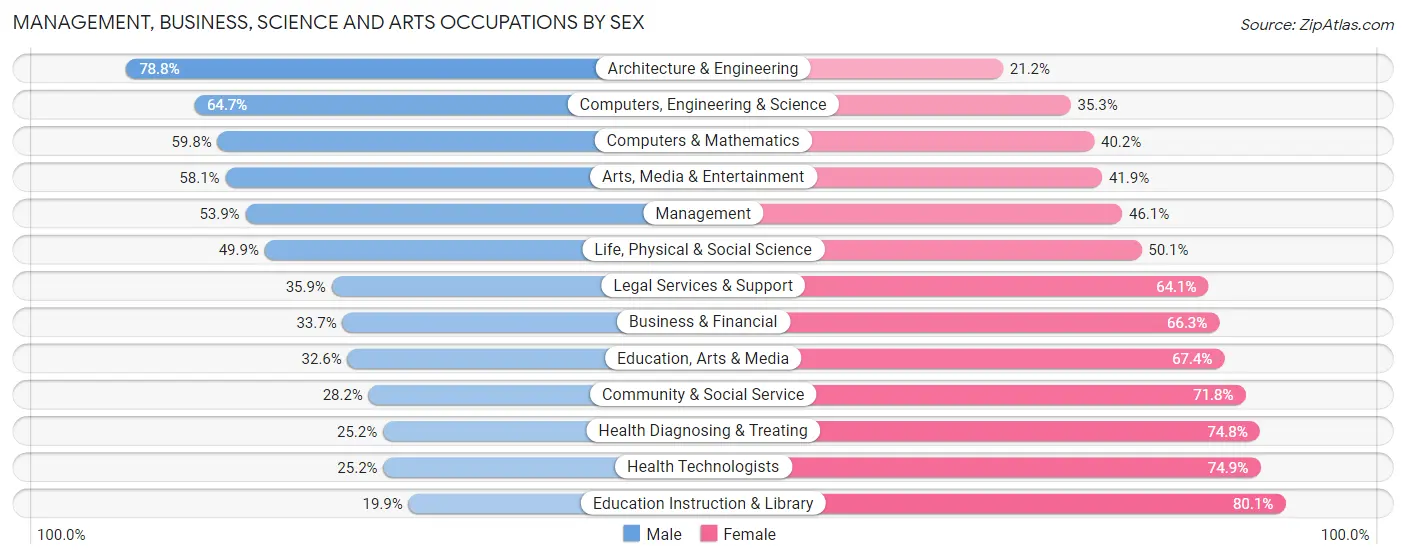
| Occupation | Male | Female |
| Management | 3,210 (53.9%) | 2,742 (46.1%) |
| Business & Financial | 861 (33.7%) | 1,695 (66.3%) |
| Computers, Engineering & Science | 1,975 (64.7%) | 1,079 (35.3%) |
| Computers & Mathematics | 851 (59.8%) | 573 (40.2%) |
| Architecture & Engineering | 847 (78.8%) | 228 (21.2%) |
| Life, Physical & Social Science | 277 (49.9%) | 278 (50.1%) |
| Community & Social Service | 2,439 (28.2%) | 6,204 (71.8%) |
| Education, Arts & Media | 698 (32.6%) | 1,442 (67.4%) |
| Legal Services & Support | 340 (35.9%) | 606 (64.1%) |
| Education Instruction & Library | 953 (19.9%) | 3,833 (80.1%) |
| Arts, Media & Entertainment | 448 (58.1%) | 323 (41.9%) |
| Health Diagnosing & Treating | 1,426 (25.2%) | 4,225 (74.8%) |
| Health Technologists | 928 (25.2%) | 2,762 (74.9%) |
| Total (Category) | 9,911 (38.3%) | 15,945 (61.7%) |
| Total (Overall) | 33,150 (48.4%) | 35,279 (51.6%) |
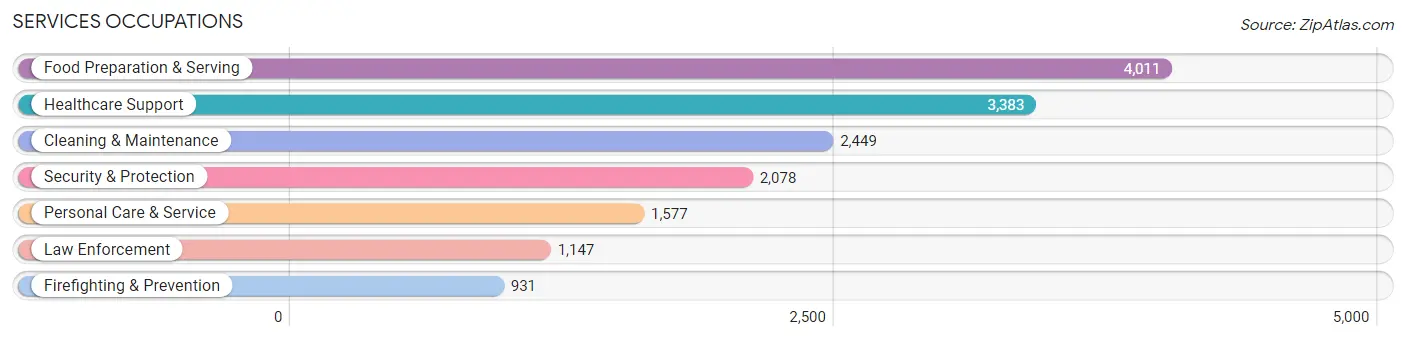
Services Occupations
The most common Services occupations in Ouachita Parish are Food Preparation & Serving (4,011 | 5.9%), Healthcare Support (3,383 | 4.9%), Cleaning & Maintenance (2,449 | 3.6%), Security & Protection (2,078 | 3.0%), and Personal Care & Service (1,577 | 2.3%).
Services Occupations by Sex
Within the Services occupations in Ouachita Parish, the most male-oriented occupations are Firefighting & Prevention (83.0%), Security & Protection (73.8%), and Law Enforcement (66.3%), while the most female-oriented occupations are Healthcare Support (85.4%), Personal Care & Service (82.6%), and Food Preparation & Serving (51.2%).
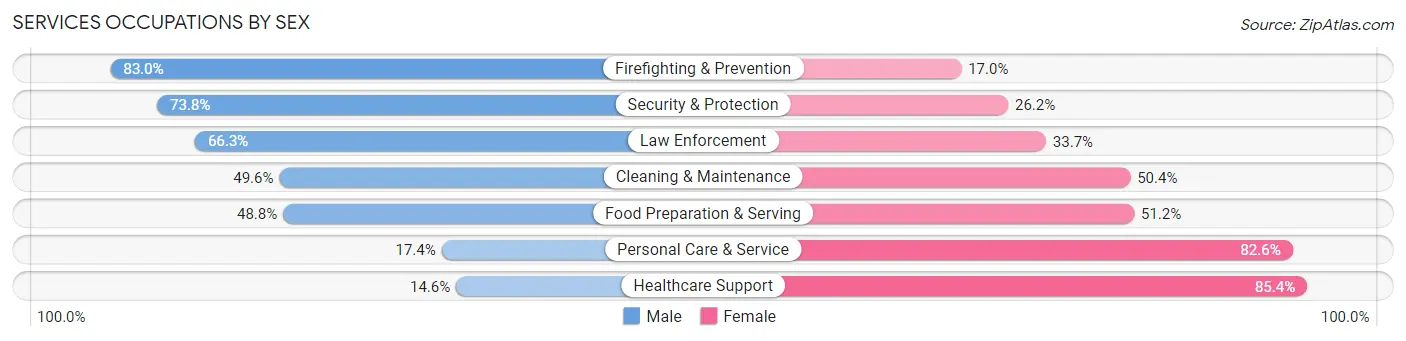
| Occupation | Male | Female |
| Healthcare Support | 493 (14.6%) | 2,890 (85.4%) |
| Security & Protection | 1,533 (73.8%) | 545 (26.2%) |
| Firefighting & Prevention | 773 (83.0%) | 158 (17.0%) |
| Law Enforcement | 760 (66.3%) | 387 (33.7%) |
| Food Preparation & Serving | 1,958 (48.8%) | 2,053 (51.2%) |
| Cleaning & Maintenance | 1,214 (49.6%) | 1,235 (50.4%) |
| Personal Care & Service | 275 (17.4%) | 1,302 (82.6%) |
| Total (Category) | 5,473 (40.6%) | 8,025 (59.5%) |
| Total (Overall) | 33,150 (48.4%) | 35,279 (51.6%) |
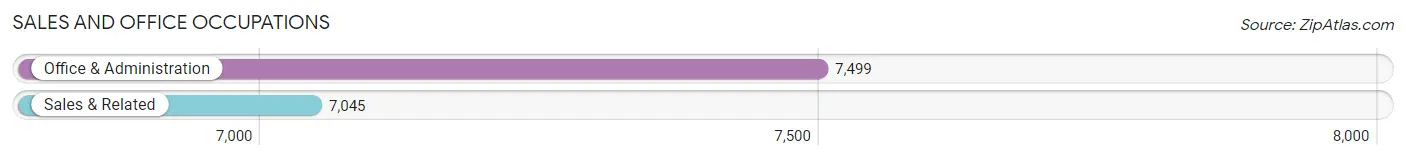
Sales and Office Occupations
The most common Sales and Office occupations in Ouachita Parish are Office & Administration (7,499 | 11.0%), and Sales & Related (7,045 | 10.3%).
Sales and Office Occupations by Sex

| Occupation | Male | Female |
| Sales & Related | 3,478 (49.4%) | 3,567 (50.6%) |
| Office & Administration | 1,406 (18.8%) | 6,093 (81.2%) |
| Total (Category) | 4,884 (33.6%) | 9,660 (66.4%) |
| Total (Overall) | 33,150 (48.4%) | 35,279 (51.6%) |
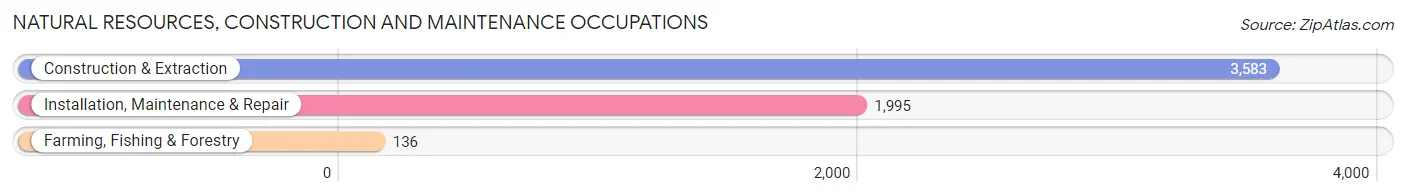
Natural Resources, Construction and Maintenance Occupations
The most common Natural Resources, Construction and Maintenance occupations in Ouachita Parish are Construction & Extraction (3,583 | 5.2%), Installation, Maintenance & Repair (1,995 | 2.9%), and Farming, Fishing & Forestry (136 | 0.2%).
Natural Resources, Construction and Maintenance Occupations by Sex
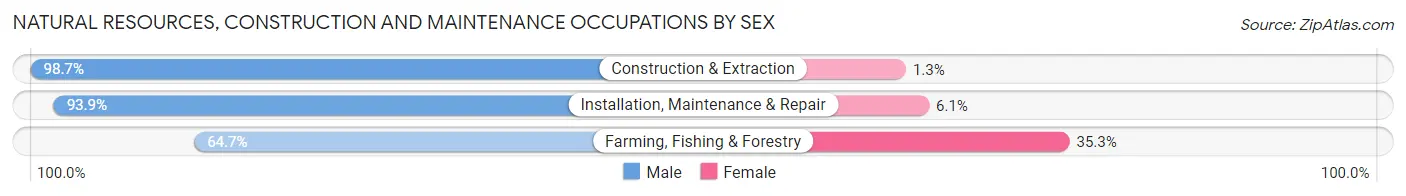
| Occupation | Male | Female |
| Farming, Fishing & Forestry | 88 (64.7%) | 48 (35.3%) |
| Construction & Extraction | 3,538 (98.7%) | 45 (1.3%) |
| Installation, Maintenance & Repair | 1,874 (93.9%) | 121 (6.1%) |
| Total (Category) | 5,500 (96.3%) | 214 (3.7%) |
| Total (Overall) | 33,150 (48.4%) | 35,279 (51.6%) |
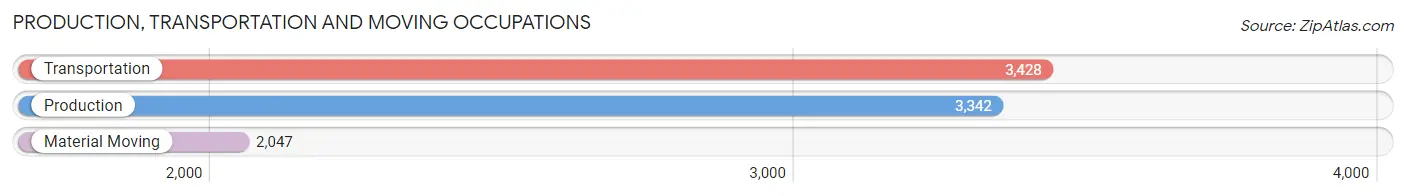
Production, Transportation and Moving Occupations
The most common Production, Transportation and Moving occupations in Ouachita Parish are Transportation (3,428 | 5.0%), Production (3,342 | 4.9%), and Material Moving (2,047 | 3.0%).
Production, Transportation and Moving Occupations by Sex
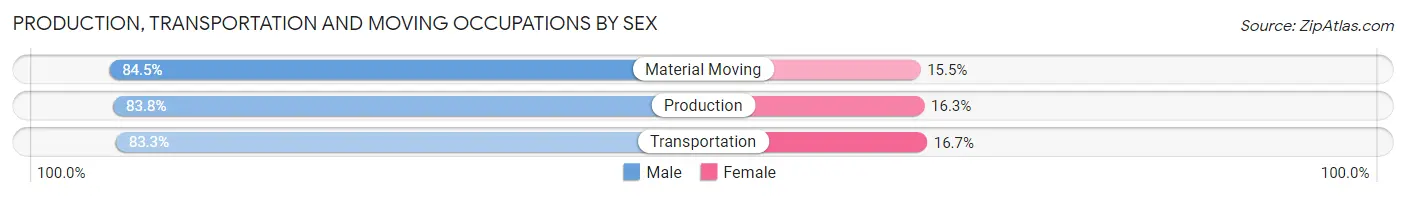
| Occupation | Male | Female |
| Production | 2,799 (83.8%) | 543 (16.3%) |
| Transportation | 2,854 (83.3%) | 574 (16.7%) |
| Material Moving | 1,729 (84.5%) | 318 (15.5%) |
| Total (Category) | 7,382 (83.7%) | 1,435 (16.3%) |
| Total (Overall) | 33,150 (48.4%) | 35,279 (51.6%) |
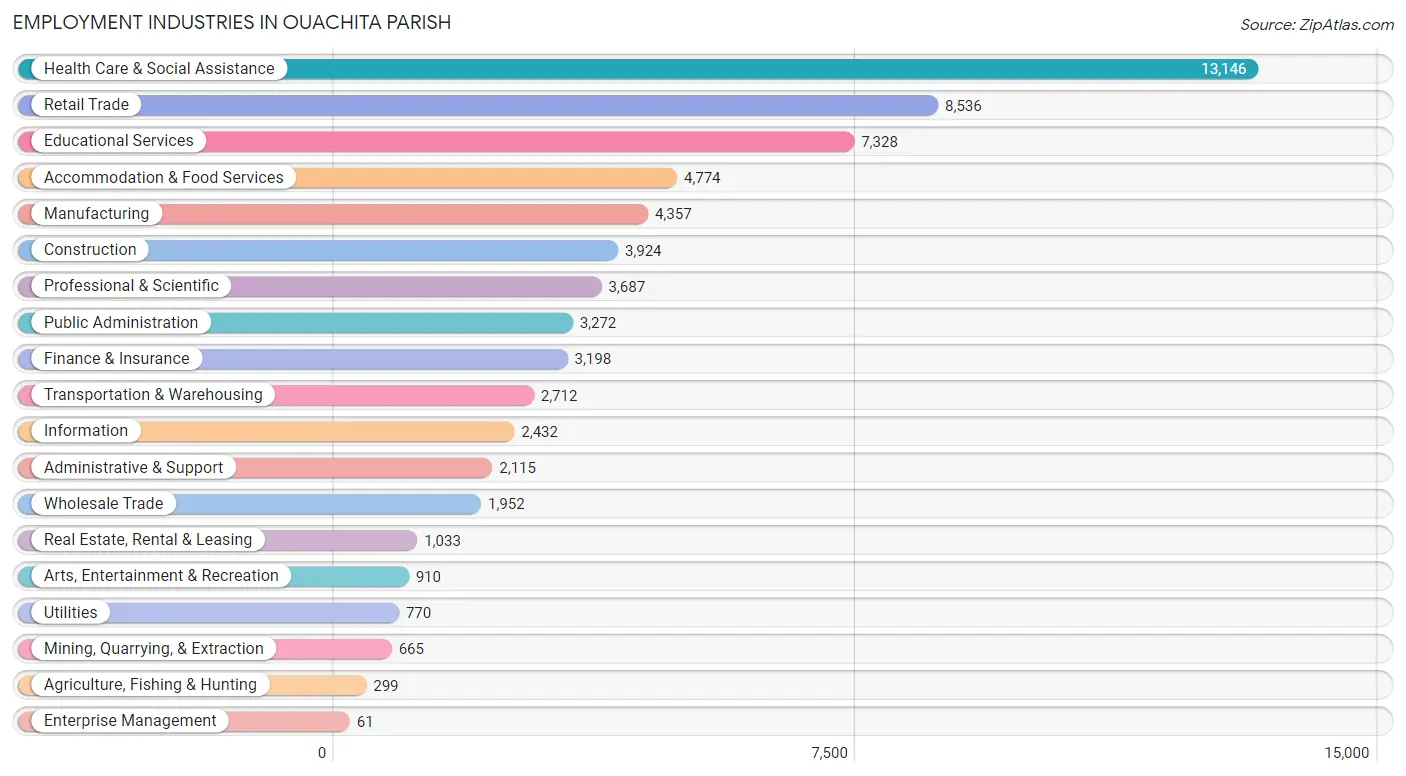
Employment Industries by Sex in Ouachita Parish
Employment Industries in Ouachita Parish
The major employment industries in Ouachita Parish include Health Care & Social Assistance (13,146 | 19.2%), Retail Trade (8,536 | 12.5%), Educational Services (7,328 | 10.7%), Accommodation & Food Services (4,774 | 7.0%), and Manufacturing (4,357 | 6.4%).
Employment Industries by Sex in Ouachita Parish
The Ouachita Parish industries that see more men than women are Construction (94.0%), Enterprise Management (93.4%), and Mining, Quarrying, & Extraction (88.1%), whereas the industries that tend to have a higher number of women are Health Care & Social Assistance (80.5%), Educational Services (70.1%), and Finance & Insurance (65.9%).
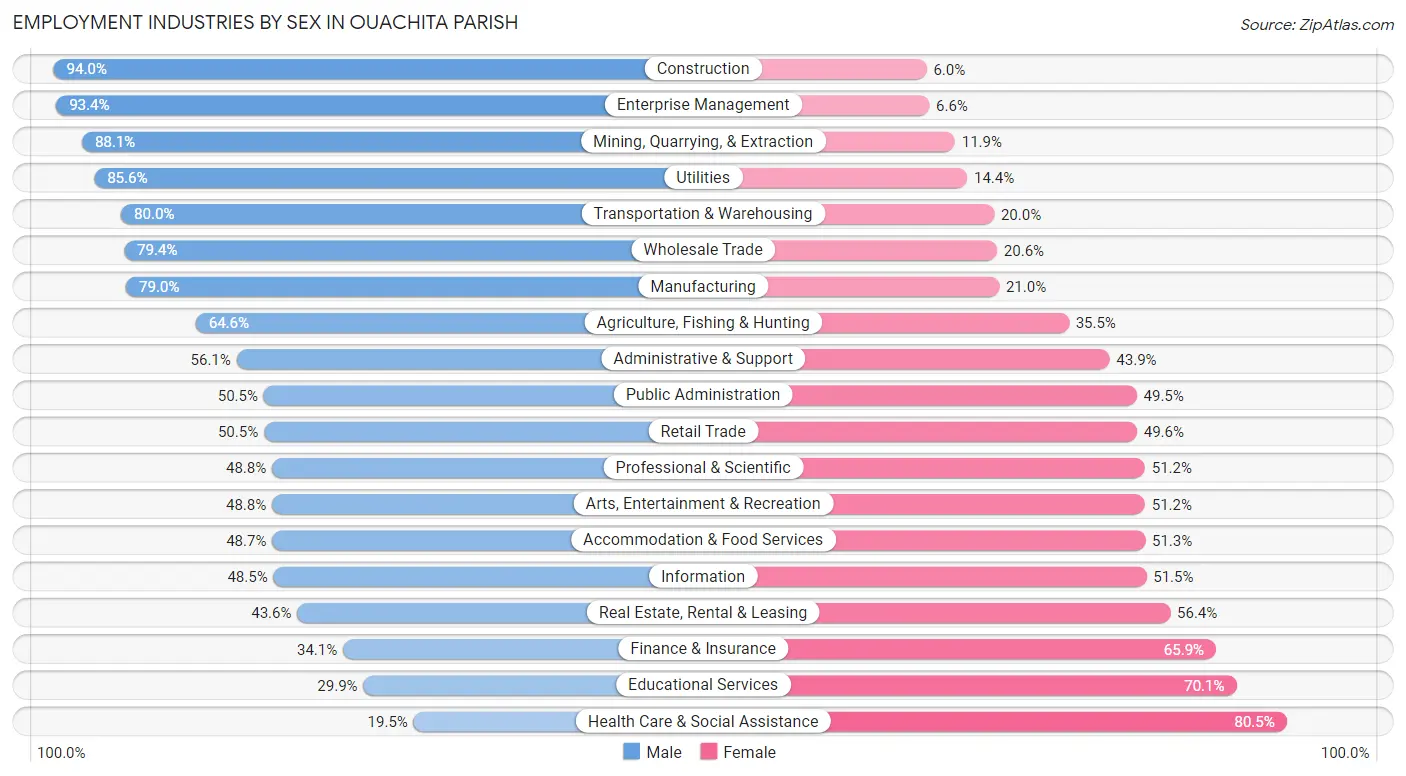
| Industry | Male | Female |
| Agriculture, Fishing & Hunting | 193 (64.5%) | 106 (35.4%) |
| Mining, Quarrying, & Extraction | 586 (88.1%) | 79 (11.9%) |
| Construction | 3,688 (94.0%) | 236 (6.0%) |
| Manufacturing | 3,441 (79.0%) | 916 (21.0%) |
| Wholesale Trade | 1,550 (79.4%) | 402 (20.6%) |
| Retail Trade | 4,306 (50.4%) | 4,230 (49.5%) |
| Transportation & Warehousing | 2,170 (80.0%) | 542 (20.0%) |
| Utilities | 659 (85.6%) | 111 (14.4%) |
| Information | 1,179 (48.5%) | 1,253 (51.5%) |
| Finance & Insurance | 1,090 (34.1%) | 2,108 (65.9%) |
| Real Estate, Rental & Leasing | 450 (43.6%) | 583 (56.4%) |
| Professional & Scientific | 1,799 (48.8%) | 1,888 (51.2%) |
| Enterprise Management | 57 (93.4%) | 4 (6.6%) |
| Administrative & Support | 1,187 (56.1%) | 928 (43.9%) |
| Educational Services | 2,189 (29.9%) | 5,139 (70.1%) |
| Health Care & Social Assistance | 2,559 (19.5%) | 10,587 (80.5%) |
| Arts, Entertainment & Recreation | 444 (48.8%) | 466 (51.2%) |
| Accommodation & Food Services | 2,327 (48.7%) | 2,447 (51.3%) |
| Public Administration | 1,652 (50.5%) | 1,620 (49.5%) |
| Total | 33,150 (48.4%) | 35,279 (51.6%) |
Education in Ouachita Parish
School Enrollment in Ouachita Parish
The most common levels of schooling among the 41,170 students in Ouachita Parish are college / undergraduate (9,355 | 22.7%), middle school (8,800 | 21.4%), and high school (8,720 | 21.2%).
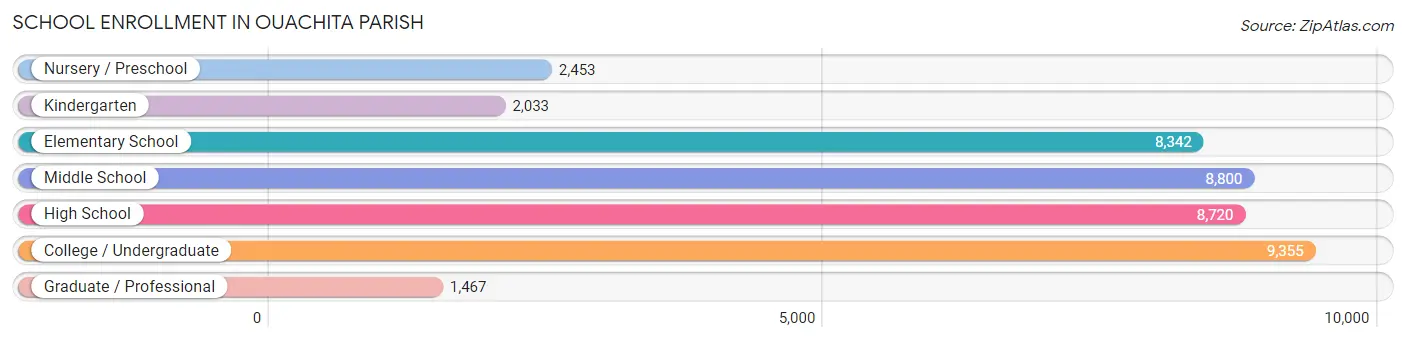
| School Level | # Students | % Students |
| Nursery / Preschool | 2,453 | 6.0% |
| Kindergarten | 2,033 | 4.9% |
| Elementary School | 8,342 | 20.3% |
| Middle School | 8,800 | 21.4% |
| High School | 8,720 | 21.2% |
| College / Undergraduate | 9,355 | 22.7% |
| Graduate / Professional | 1,467 | 3.6% |
| Total | 41,170 | 100.0% |
School Enrollment by Age by Funding Source in Ouachita Parish
Out of a total of 41,170 students who are enrolled in schools in Ouachita Parish, 6,670 (16.2%) attend a private institution, while the remaining 34,500 (83.8%) are enrolled in public schools. The age group of 3 to 4 year olds has the highest likelihood of being enrolled in private schools, with 710 (37.4% in the age bracket) enrolled. Conversely, the age group of 20 to 24 year olds has the lowest likelihood of being enrolled in a private school, with 4,550 (89.6% in the age bracket) attending a public institution.
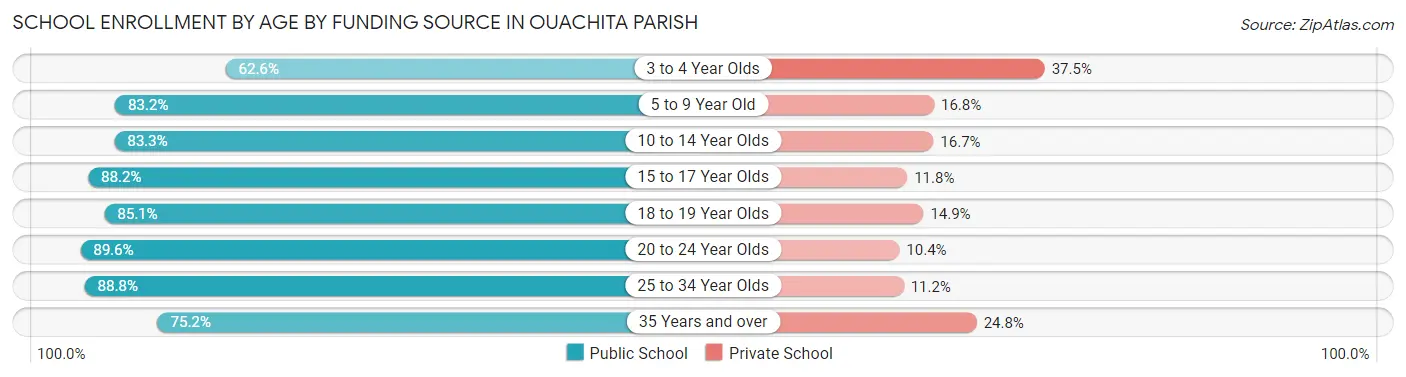
| Age Bracket | Public School | Private School |
| 3 to 4 Year Olds | 1,186 (62.5%) | 710 (37.4%) |
| 5 to 9 Year Old | 8,099 (83.2%) | 1,640 (16.8%) |
| 10 to 14 Year Olds | 9,155 (83.3%) | 1,838 (16.7%) |
| 15 to 17 Year Olds | 5,381 (88.2%) | 723 (11.8%) |
| 18 to 19 Year Olds | 2,881 (85.1%) | 503 (14.9%) |
| 20 to 24 Year Olds | 4,550 (89.6%) | 527 (10.4%) |
| 25 to 34 Year Olds | 1,787 (88.8%) | 225 (11.2%) |
| 35 Years and over | 1,478 (75.2%) | 487 (24.8%) |
| Total | 34,500 (83.8%) | 6,670 (16.2%) |
Educational Attainment by Field of Study in Ouachita Parish
Business (5,098 | 17.8%), education (4,850 | 16.9%), science & technology (4,364 | 15.2%), arts & humanities (2,590 | 9.0%), and liberal arts & history (2,464 | 8.6%) are the most common fields of study among 28,648 individuals in Ouachita Parish who have obtained a bachelor's degree or higher.
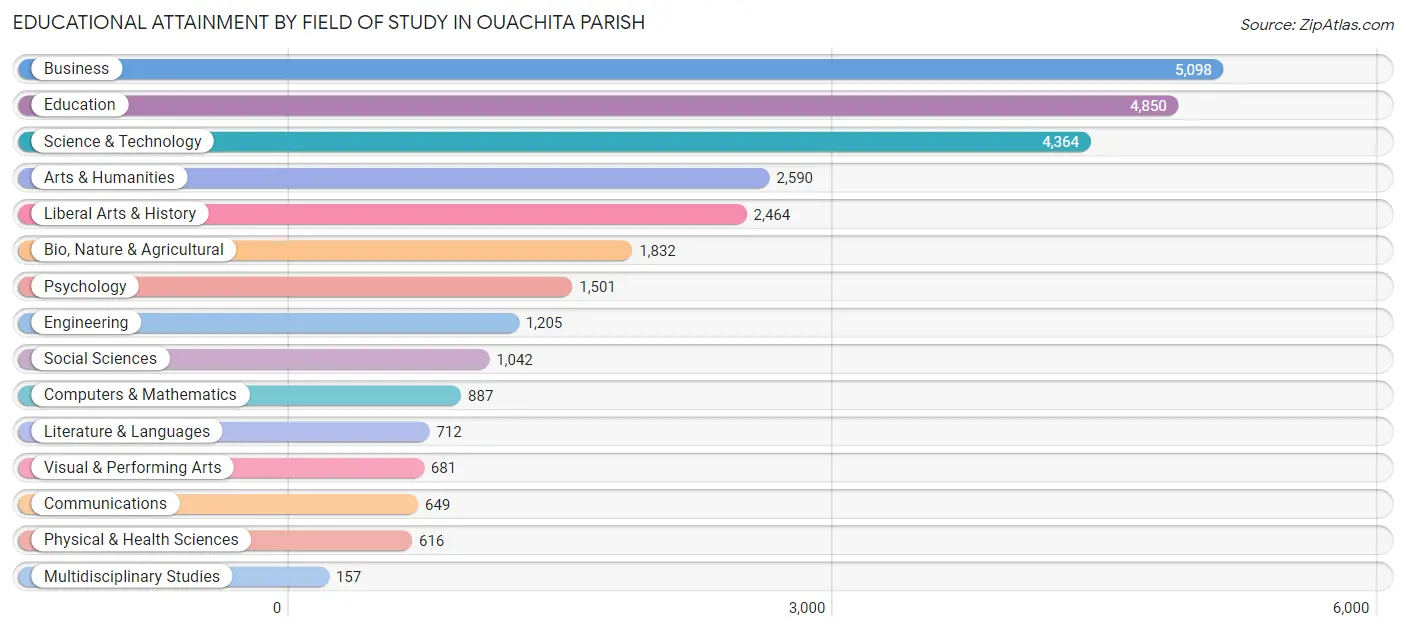
| Field of Study | # Graduates | % Graduates |
| Computers & Mathematics | 887 | 3.1% |
| Bio, Nature & Agricultural | 1,832 | 6.4% |
| Physical & Health Sciences | 616 | 2.1% |
| Psychology | 1,501 | 5.2% |
| Social Sciences | 1,042 | 3.6% |
| Engineering | 1,205 | 4.2% |
| Multidisciplinary Studies | 157 | 0.5% |
| Science & Technology | 4,364 | 15.2% |
| Business | 5,098 | 17.8% |
| Education | 4,850 | 16.9% |
| Literature & Languages | 712 | 2.5% |
| Liberal Arts & History | 2,464 | 8.6% |
| Visual & Performing Arts | 681 | 2.4% |
| Communications | 649 | 2.3% |
| Arts & Humanities | 2,590 | 9.0% |
| Total | 28,648 | 100.0% |
Transportation & Commute in Ouachita Parish
Vehicle Availability by Sex in Ouachita Parish
The most prevalent vehicle ownership categories in Ouachita Parish are males with 2 vehicles (13,826, accounting for 42.5%) and females with 2 vehicles (13,306, making up 40.4%).
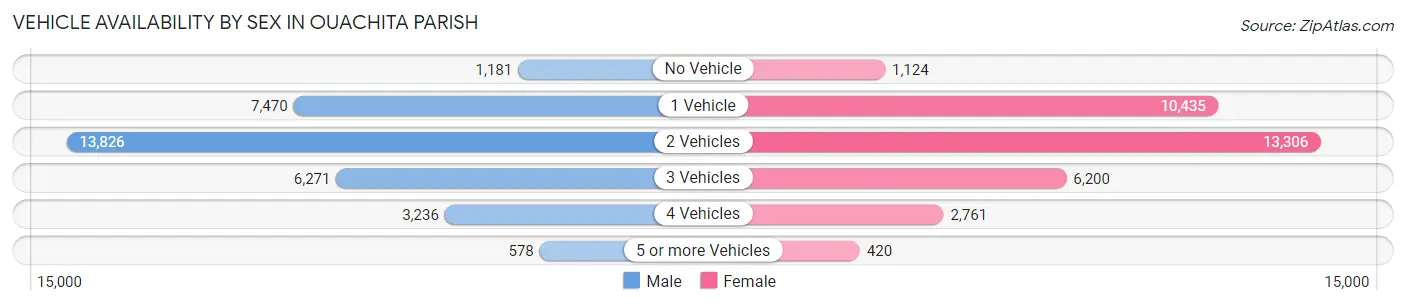
| Vehicles Available | Male | Female |
| No Vehicle | 1,181 (3.6%) | 1,124 (3.3%) |
| 1 Vehicle | 7,470 (22.9%) | 10,435 (30.5%) |
| 2 Vehicles | 13,826 (42.5%) | 13,306 (38.9%) |
| 3 Vehicles | 6,271 (19.3%) | 6,200 (18.1%) |
| 4 Vehicles | 3,236 (9.9%) | 2,761 (8.1%) |
| 5 or more Vehicles | 578 (1.8%) | 420 (1.2%) |
| Total | 32,562 (100.0%) | 34,246 (100.0%) |
Commute Time in Ouachita Parish
The most frequently occuring commute durations in Ouachita Parish are 15 to 19 minutes (14,352 commuters, 22.7%), 10 to 14 minutes (12,282 commuters, 19.4%), and 20 to 24 minutes (11,256 commuters, 17.8%).
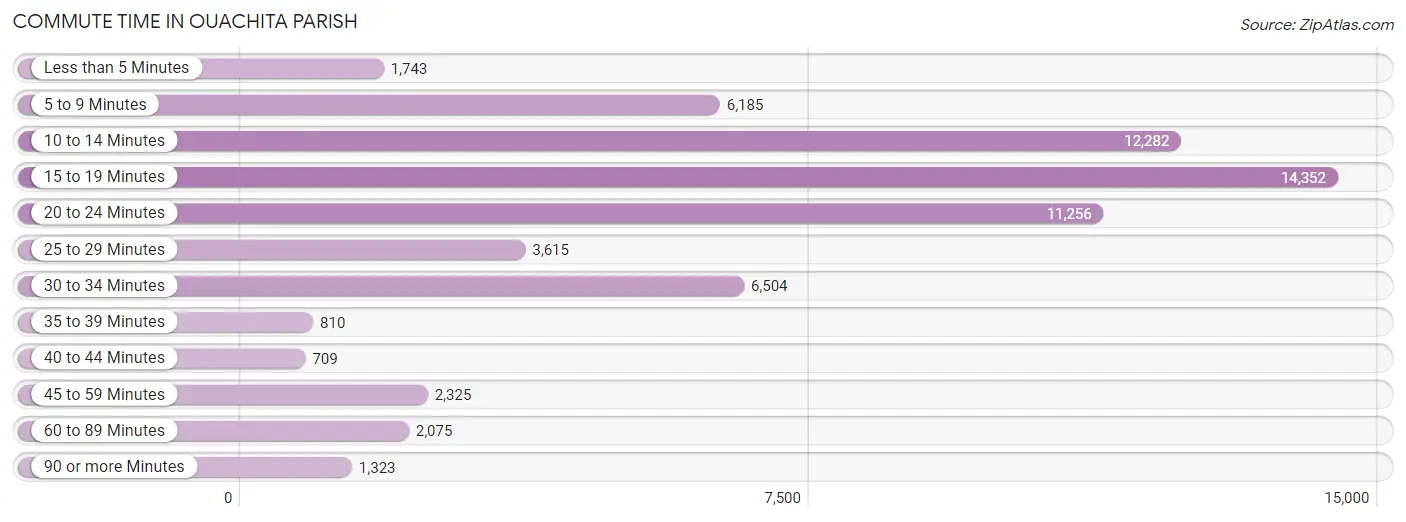
| Commute Time | # Commuters | % Commuters |
| Less than 5 Minutes | 1,743 | 2.8% |
| 5 to 9 Minutes | 6,185 | 9.8% |
| 10 to 14 Minutes | 12,282 | 19.4% |
| 15 to 19 Minutes | 14,352 | 22.7% |
| 20 to 24 Minutes | 11,256 | 17.8% |
| 25 to 29 Minutes | 3,615 | 5.7% |
| 30 to 34 Minutes | 6,504 | 10.3% |
| 35 to 39 Minutes | 810 | 1.3% |
| 40 to 44 Minutes | 709 | 1.1% |
| 45 to 59 Minutes | 2,325 | 3.7% |
| 60 to 89 Minutes | 2,075 | 3.3% |
| 90 or more Minutes | 1,323 | 2.1% |
Commute Time by Sex in Ouachita Parish
The most common commute times in Ouachita Parish are 15 to 19 minutes (7,333 commuters, 23.7%) for males and 10 to 14 minutes (7,036 commuters, 21.8%) for females.
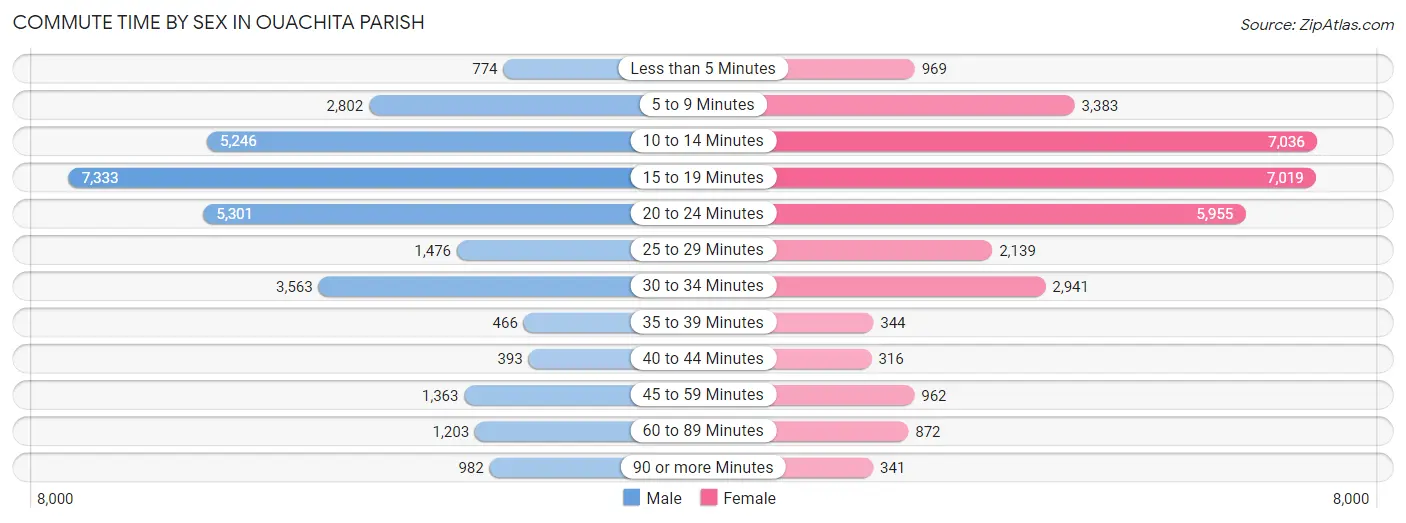
| Commute Time | Male | Female |
| Less than 5 Minutes | 774 (2.5%) | 969 (3.0%) |
| 5 to 9 Minutes | 2,802 (9.1%) | 3,383 (10.5%) |
| 10 to 14 Minutes | 5,246 (17.0%) | 7,036 (21.8%) |
| 15 to 19 Minutes | 7,333 (23.7%) | 7,019 (21.7%) |
| 20 to 24 Minutes | 5,301 (17.2%) | 5,955 (18.4%) |
| 25 to 29 Minutes | 1,476 (4.8%) | 2,139 (6.6%) |
| 30 to 34 Minutes | 3,563 (11.5%) | 2,941 (9.1%) |
| 35 to 39 Minutes | 466 (1.5%) | 344 (1.1%) |
| 40 to 44 Minutes | 393 (1.3%) | 316 (1.0%) |
| 45 to 59 Minutes | 1,363 (4.4%) | 962 (3.0%) |
| 60 to 89 Minutes | 1,203 (3.9%) | 872 (2.7%) |
| 90 or more Minutes | 982 (3.2%) | 341 (1.1%) |
Time of Departure to Work by Sex in Ouachita Parish
The most frequent times of departure to work in Ouachita Parish are 7:00 AM to 7:29 AM (5,474, 17.7%) for males and 7:00 AM to 7:29 AM (7,449, 23.1%) for females.
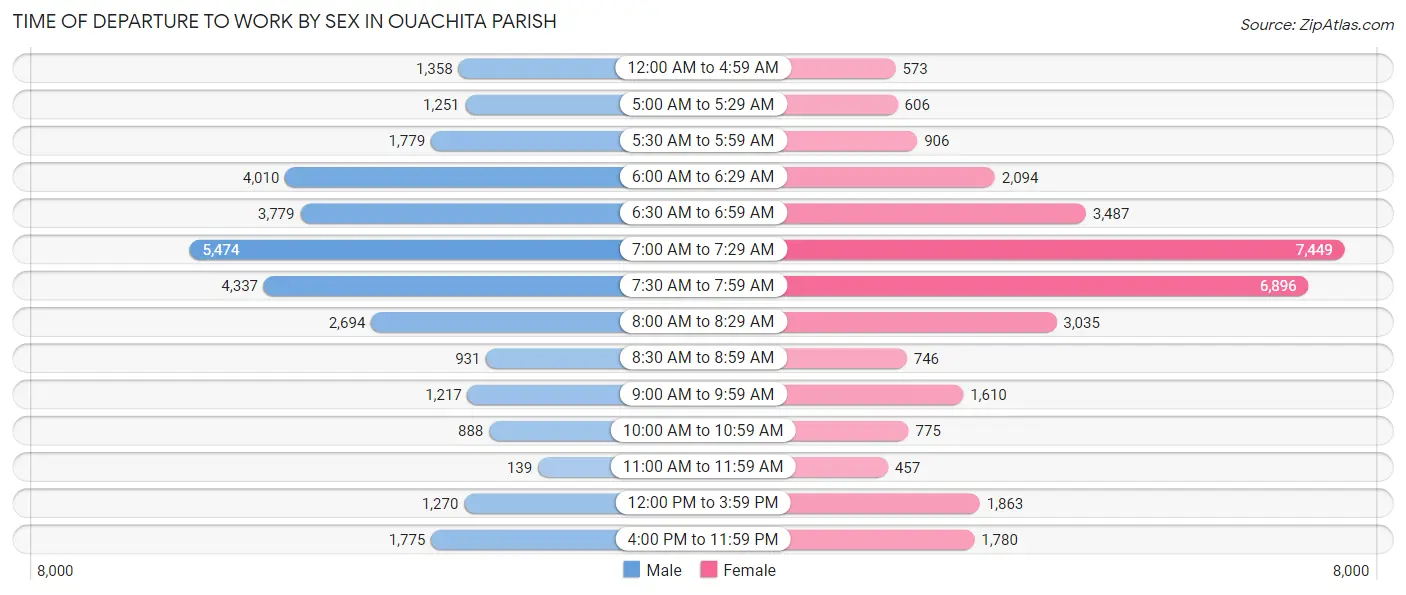
| Time of Departure | Male | Female |
| 12:00 AM to 4:59 AM | 1,358 (4.4%) | 573 (1.8%) |
| 5:00 AM to 5:29 AM | 1,251 (4.1%) | 606 (1.9%) |
| 5:30 AM to 5:59 AM | 1,779 (5.8%) | 906 (2.8%) |
| 6:00 AM to 6:29 AM | 4,010 (13.0%) | 2,094 (6.5%) |
| 6:30 AM to 6:59 AM | 3,779 (12.2%) | 3,487 (10.8%) |
| 7:00 AM to 7:29 AM | 5,474 (17.7%) | 7,449 (23.1%) |
| 7:30 AM to 7:59 AM | 4,337 (14.0%) | 6,896 (21.4%) |
| 8:00 AM to 8:29 AM | 2,694 (8.7%) | 3,035 (9.4%) |
| 8:30 AM to 8:59 AM | 931 (3.0%) | 746 (2.3%) |
| 9:00 AM to 9:59 AM | 1,217 (3.9%) | 1,610 (5.0%) |
| 10:00 AM to 10:59 AM | 888 (2.9%) | 775 (2.4%) |
| 11:00 AM to 11:59 AM | 139 (0.4%) | 457 (1.4%) |
| 12:00 PM to 3:59 PM | 1,270 (4.1%) | 1,863 (5.8%) |
| 4:00 PM to 11:59 PM | 1,775 (5.7%) | 1,780 (5.5%) |
| Total | 30,902 (100.0%) | 32,277 (100.0%) |
Housing Occupancy in Ouachita Parish
Occupancy by Ownership in Ouachita Parish
Of the total 59,595 dwellings in Ouachita Parish, owner-occupied units account for 35,465 (59.5%), while renter-occupied units make up 24,130 (40.5%).
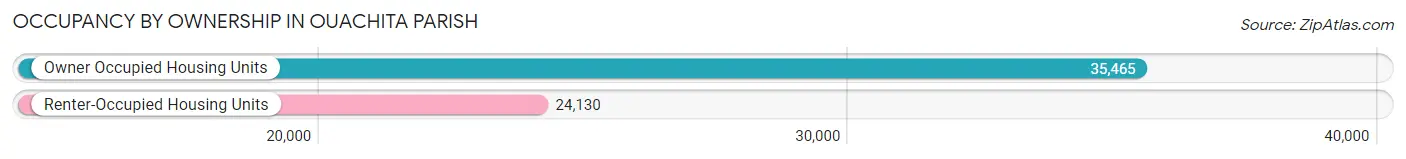
| Occupancy | # Housing Units | % Housing Units |
| Owner Occupied Housing Units | 35,465 | 59.5% |
| Renter-Occupied Housing Units | 24,130 | 40.5% |
| Total Occupied Housing Units | 59,595 | 100.0% |
Occupancy by Household Size in Ouachita Parish
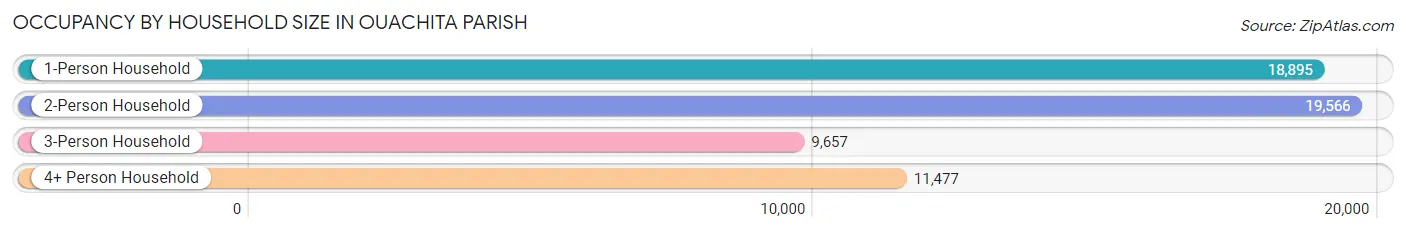
| Household Size | # Housing Units | % Housing Units |
| 1-Person Household | 18,895 | 31.7% |
| 2-Person Household | 19,566 | 32.8% |
| 3-Person Household | 9,657 | 16.2% |
| 4+ Person Household | 11,477 | 19.3% |
| Total Housing Units | 59,595 | 100.0% |
Occupancy by Ownership by Household Size in Ouachita Parish
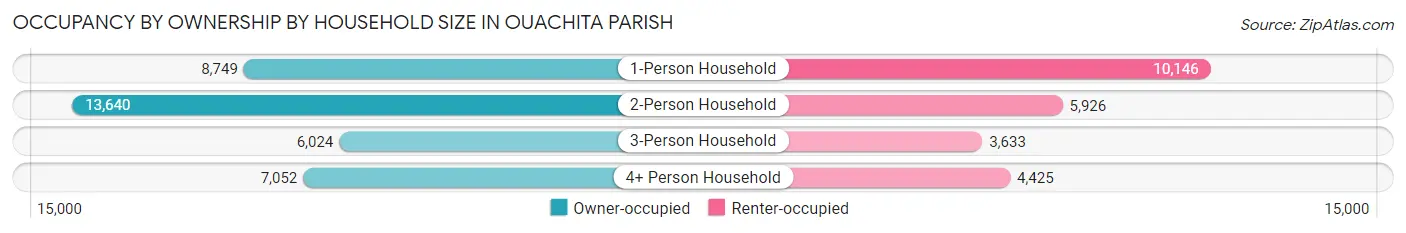
| Household Size | Owner-occupied | Renter-occupied |
| 1-Person Household | 8,749 (46.3%) | 10,146 (53.7%) |
| 2-Person Household | 13,640 (69.7%) | 5,926 (30.3%) |
| 3-Person Household | 6,024 (62.4%) | 3,633 (37.6%) |
| 4+ Person Household | 7,052 (61.4%) | 4,425 (38.6%) |
| Total Housing Units | 35,465 (59.5%) | 24,130 (40.5%) |
Occupancy by Educational Attainment in Ouachita Parish
| Household Size | Owner-occupied | Renter-occupied |
| Less than High School | 2,755 (41.9%) | 3,814 (58.1%) |
| High School Diploma | 9,901 (53.6%) | 8,560 (46.4%) |
| College/Associate Degree | 10,516 (56.4%) | 8,121 (43.6%) |
| Bachelor's Degree or higher | 12,293 (77.2%) | 3,635 (22.8%) |
Occupancy by Age of Householder in Ouachita Parish
| Age Bracket | # Households | % Households |
| Under 35 Years | 12,063 | 20.2% |
| 35 to 44 Years | 10,216 | 17.1% |
| 45 to 54 Years | 10,198 | 17.1% |
| 55 to 64 Years | 11,649 | 19.6% |
| 65 to 74 Years | 9,044 | 15.2% |
| 75 to 84 Years | 4,443 | 7.5% |
| 85 Years and Over | 1,982 | 3.3% |
| Total | 59,595 | 100.0% |
Housing Finances in Ouachita Parish
Median Income by Occupancy in Ouachita Parish
| Occupancy Type | # Households | Median Income |
| Owner-Occupied | 35,465 (59.5%) | $73,976 |
| Renter-Occupied | 24,130 (40.5%) | $28,994 |
| Average | 59,595 (100.0%) | $49,261 |
Occupancy by Householder Income Bracket in Ouachita Parish
| Income Bracket | Owner-occupied | Renter-occupied |
| Less than $5,000 | 1,332 (3.8%) | 2,840 (11.8%) |
| $5,000 to $9,999 | 669 (1.9%) | 1,530 (6.3%) |
| $10,000 to $14,999 | 1,208 (3.4%) | 2,794 (11.6%) |
| $15,000 to $19,999 | 1,372 (3.9%) | 1,787 (7.4%) |
| $20,000 to $24,999 | 1,547 (4.4%) | 1,874 (7.8%) |
| $25,000 to $34,999 | 2,641 (7.4%) | 3,308 (13.7%) |
| $35,000 to $49,999 | 3,643 (10.3%) | 3,556 (14.7%) |
| $50,000 to $74,999 | 5,558 (15.7%) | 3,468 (14.4%) |
| $75,000 to $99,999 | 5,041 (14.2%) | 1,161 (4.8%) |
| $100,000 to $149,999 | 5,949 (16.8%) | 1,296 (5.4%) |
| $150,000 or more | 6,505 (18.3%) | 516 (2.1%) |
| Total | 35,465 (100.0%) | 24,130 (100.0%) |
Monthly Housing Cost Tiers in Ouachita Parish
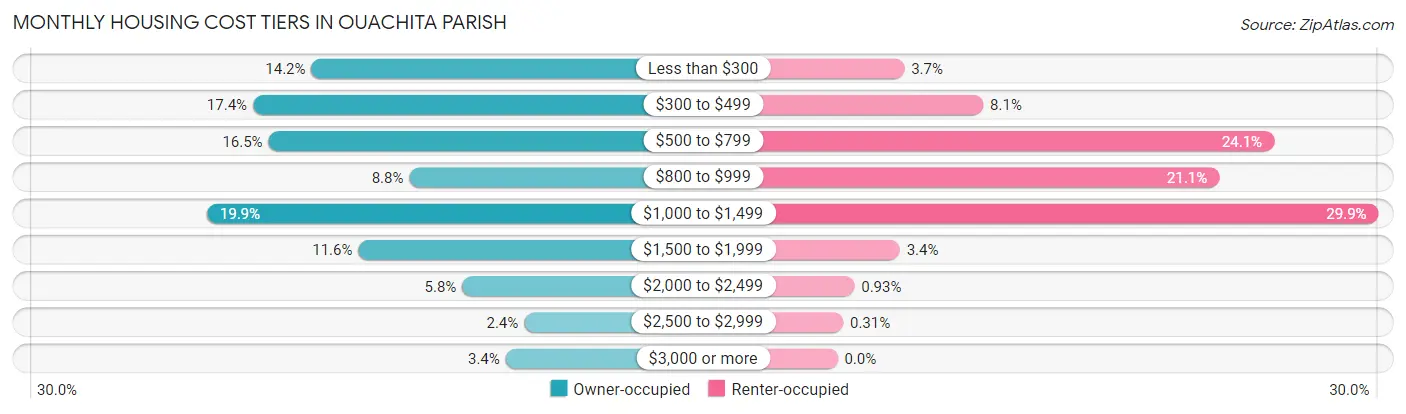
| Monthly Cost | Owner-occupied | Renter-occupied |
| Less than $300 | 5,022 (14.2%) | 891 (3.7%) |
| $300 to $499 | 6,166 (17.4%) | 1,943 (8.1%) |
| $500 to $799 | 5,864 (16.5%) | 5,818 (24.1%) |
| $800 to $999 | 3,104 (8.7%) | 5,087 (21.1%) |
| $1,000 to $1,499 | 7,069 (19.9%) | 7,209 (29.9%) |
| $1,500 to $1,999 | 4,103 (11.6%) | 831 (3.4%) |
| $2,000 to $2,499 | 2,067 (5.8%) | 224 (0.9%) |
| $2,500 to $2,999 | 853 (2.4%) | 76 (0.3%) |
| $3,000 or more | 1,217 (3.4%) | 0 (0.0%) |
| Total | 35,465 (100.0%) | 24,130 (100.0%) |
Physical Housing Characteristics in Ouachita Parish
Housing Structures in Ouachita Parish
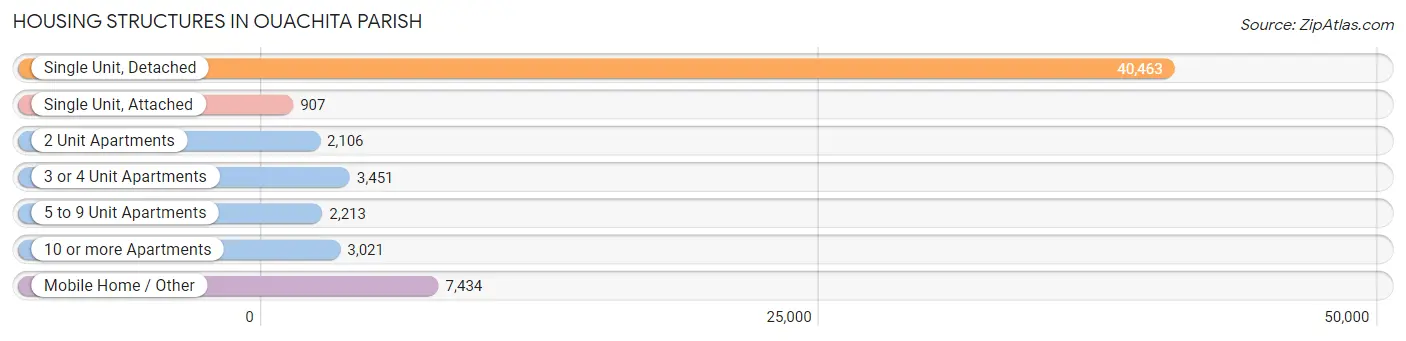
| Structure Type | # Housing Units | % Housing Units |
| Single Unit, Detached | 40,463 | 67.9% |
| Single Unit, Attached | 907 | 1.5% |
| 2 Unit Apartments | 2,106 | 3.5% |
| 3 or 4 Unit Apartments | 3,451 | 5.8% |
| 5 to 9 Unit Apartments | 2,213 | 3.7% |
| 10 or more Apartments | 3,021 | 5.1% |
| Mobile Home / Other | 7,434 | 12.5% |
| Total | 59,595 | 100.0% |
Housing Structures by Occupancy in Ouachita Parish
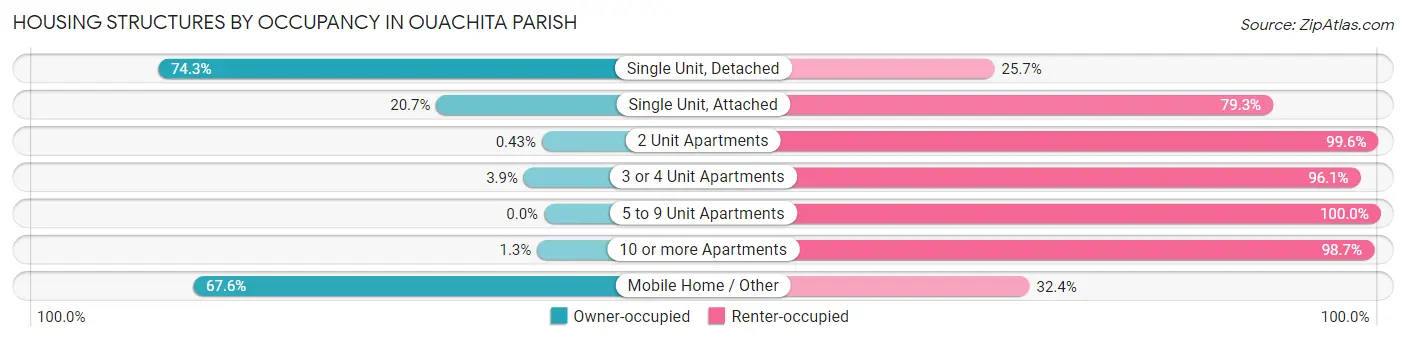
| Structure Type | Owner-occupied | Renter-occupied |
| Single Unit, Detached | 30,070 (74.3%) | 10,393 (25.7%) |
| Single Unit, Attached | 188 (20.7%) | 719 (79.3%) |
| 2 Unit Apartments | 9 (0.4%) | 2,097 (99.6%) |
| 3 or 4 Unit Apartments | 134 (3.9%) | 3,317 (96.1%) |
| 5 to 9 Unit Apartments | 0 (0.0%) | 2,213 (100.0%) |
| 10 or more Apartments | 40 (1.3%) | 2,981 (98.7%) |
| Mobile Home / Other | 5,024 (67.6%) | 2,410 (32.4%) |
| Total | 35,465 (59.5%) | 24,130 (40.5%) |
Housing Structures by Number of Rooms in Ouachita Parish
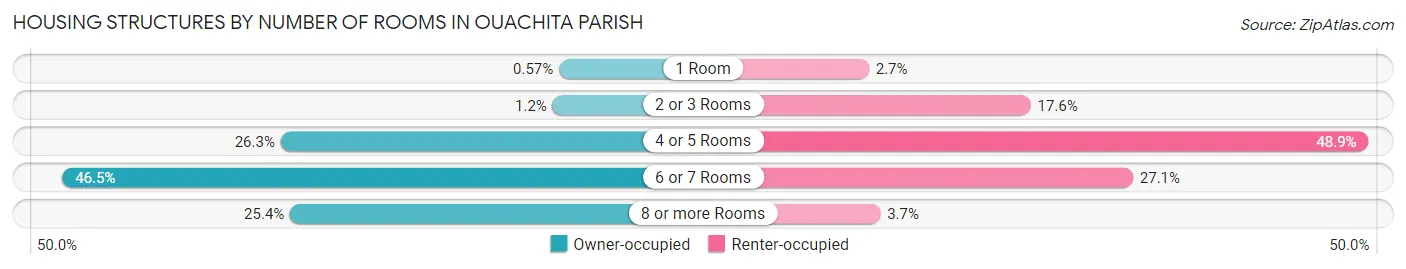
| Number of Rooms | Owner-occupied | Renter-occupied |
| 1 Room | 203 (0.6%) | 645 (2.7%) |
| 2 or 3 Rooms | 410 (1.2%) | 4,255 (17.6%) |
| 4 or 5 Rooms | 9,331 (26.3%) | 11,794 (48.9%) |
| 6 or 7 Rooms | 16,498 (46.5%) | 6,536 (27.1%) |
| 8 or more Rooms | 9,023 (25.4%) | 900 (3.7%) |
| Total | 35,465 (100.0%) | 24,130 (100.0%) |
Housing Structure by Heating Type in Ouachita Parish
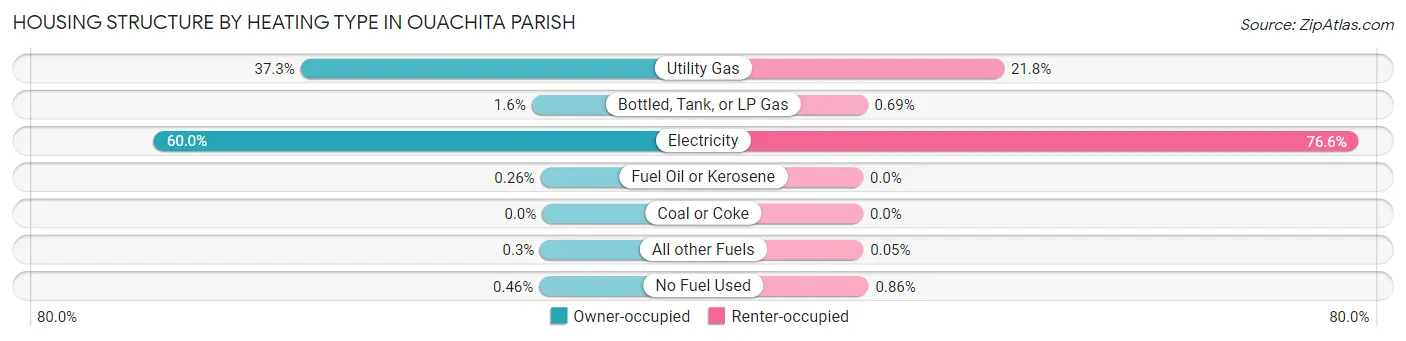
| Heating Type | Owner-occupied | Renter-occupied |
| Utility Gas | 13,238 (37.3%) | 5,261 (21.8%) |
| Bottled, Tank, or LP Gas | 581 (1.6%) | 167 (0.7%) |
| Electricity | 21,284 (60.0%) | 18,483 (76.6%) |
| Fuel Oil or Kerosene | 92 (0.3%) | 0 (0.0%) |
| Coal or Coke | 0 (0.0%) | 0 (0.0%) |
| All other Fuels | 107 (0.3%) | 12 (0.1%) |
| No Fuel Used | 163 (0.5%) | 207 (0.9%) |
| Total | 35,465 (100.0%) | 24,130 (100.0%) |
Household Vehicle Usage in Ouachita Parish
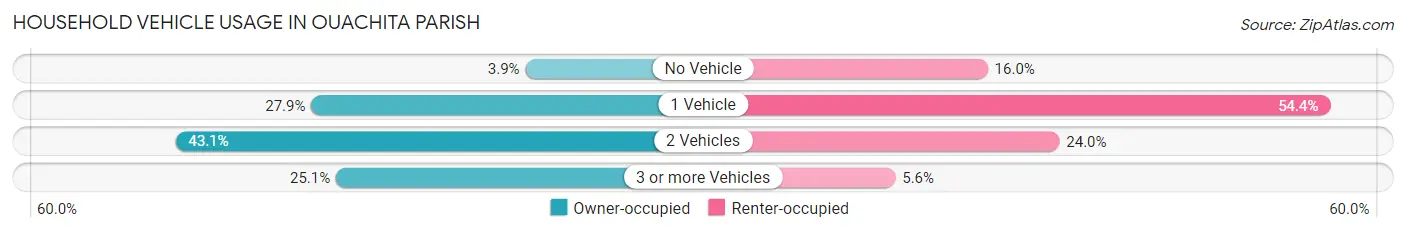
| Vehicles per Household | Owner-occupied | Renter-occupied |
| No Vehicle | 1,384 (3.9%) | 3,858 (16.0%) |
| 1 Vehicle | 9,886 (27.9%) | 13,117 (54.4%) |
| 2 Vehicles | 15,290 (43.1%) | 5,795 (24.0%) |
| 3 or more Vehicles | 8,905 (25.1%) | 1,360 (5.6%) |
| Total | 35,465 (100.0%) | 24,130 (100.0%) |
Real Estate & Mortgages in Ouachita Parish
Real Estate and Mortgage Overview in Ouachita Parish
| Characteristic | Without Mortgage | With Mortgage |
| Housing Units | 17,240 | 18,225 |
| Median Property Value | $139,400 | $201,900 |
| Median Household Income | $57,463 | $4,451 |
| Monthly Housing Costs | $412 | $1,087 |
| Real Estate Taxes | $566 | $2,947 |
Property Value by Mortgage Status in Ouachita Parish
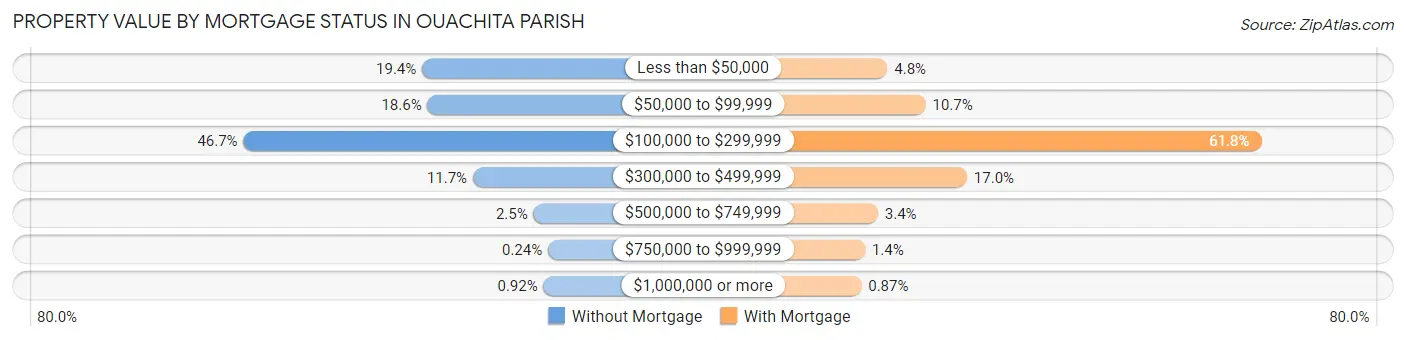
| Property Value | Without Mortgage | With Mortgage |
| Less than $50,000 | 3,350 (19.4%) | 882 (4.8%) |
| $50,000 to $99,999 | 3,209 (18.6%) | 1,944 (10.7%) |
| $100,000 to $299,999 | 8,043 (46.7%) | 11,267 (61.8%) |
| $300,000 to $499,999 | 2,014 (11.7%) | 3,092 (17.0%) |
| $500,000 to $749,999 | 423 (2.5%) | 619 (3.4%) |
| $750,000 to $999,999 | 42 (0.2%) | 263 (1.4%) |
| $1,000,000 or more | 159 (0.9%) | 158 (0.9%) |
| Total | 17,240 (100.0%) | 18,225 (100.0%) |
Household Income by Mortgage Status in Ouachita Parish
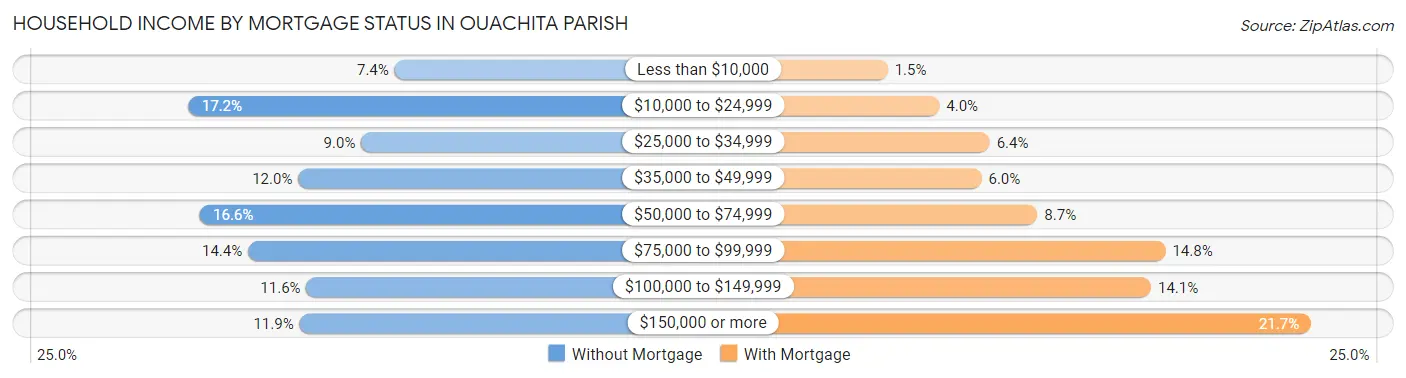
| Household Income | Without Mortgage | With Mortgage |
| Less than $10,000 | 1,273 (7.4%) | 278 (1.5%) |
| $10,000 to $24,999 | 2,962 (17.2%) | 728 (4.0%) |
| $25,000 to $34,999 | 1,547 (9.0%) | 1,165 (6.4%) |
| $35,000 to $49,999 | 2,064 (12.0%) | 1,094 (6.0%) |
| $50,000 to $74,999 | 2,868 (16.6%) | 1,579 (8.7%) |
| $75,000 to $99,999 | 2,476 (14.4%) | 2,690 (14.8%) |
| $100,000 to $149,999 | 1,996 (11.6%) | 2,565 (14.1%) |
| $150,000 or more | 2,054 (11.9%) | 3,953 (21.7%) |
| Total | 17,240 (100.0%) | 18,225 (100.0%) |
Property Value to Household Income Ratio in Ouachita Parish
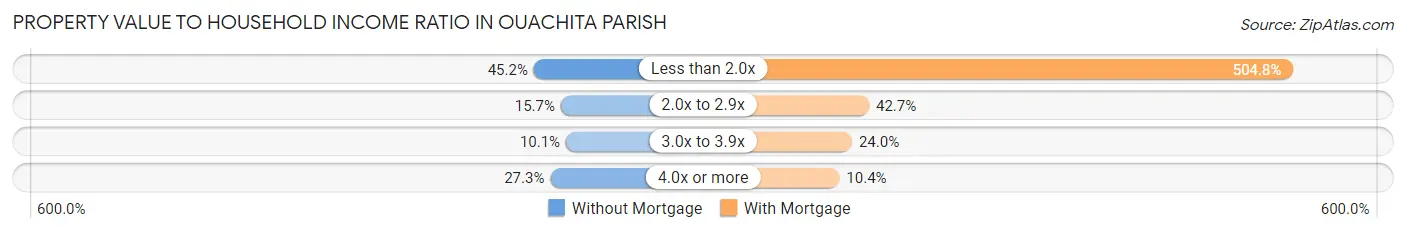
| Value-to-Income Ratio | Without Mortgage | With Mortgage |
| Less than 2.0x | 7,793 (45.2%) | 92,007 (504.8%) |
| 2.0x to 2.9x | 2,710 (15.7%) | 7,775 (42.7%) |
| 3.0x to 3.9x | 1,739 (10.1%) | 4,381 (24.0%) |
| 4.0x or more | 4,698 (27.3%) | 1,886 (10.3%) |
| Total | 17,240 (100.0%) | 18,225 (100.0%) |
Real Estate Taxes by Mortgage Status in Ouachita Parish
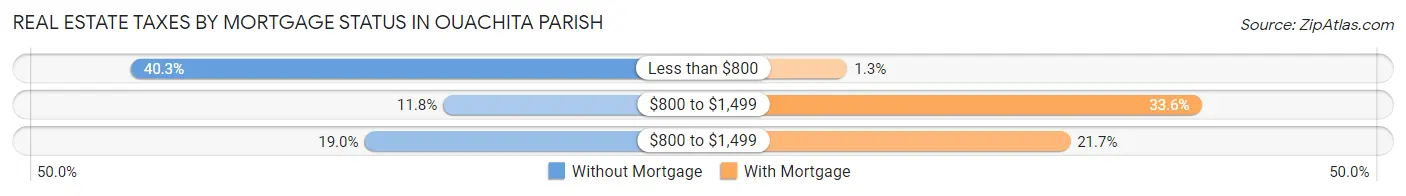
| Property Taxes | Without Mortgage | With Mortgage |
| Less than $800 | 6,947 (40.3%) | 239 (1.3%) |
| $800 to $1,499 | 2,032 (11.8%) | 6,130 (33.6%) |
| $800 to $1,499 | 3,273 (19.0%) | 3,947 (21.7%) |
| Total | 17,240 (100.0%) | 18,225 (100.0%) |
Health & Disability in Ouachita Parish
Health Insurance Coverage by Age in Ouachita Parish
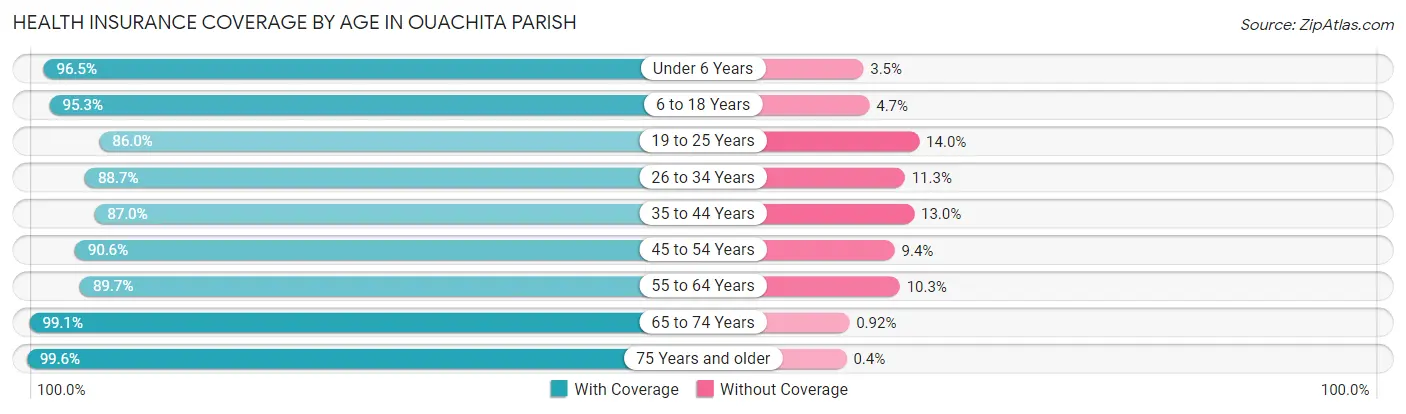
| Age Bracket | With Coverage | Without Coverage |
| Under 6 Years | 12,031 (96.5%) | 442 (3.5%) |
| 6 to 18 Years | 27,426 (95.3%) | 1,341 (4.7%) |
| 19 to 25 Years | 12,956 (86.0%) | 2,102 (14.0%) |
| 26 to 34 Years | 17,053 (88.7%) | 2,165 (11.3%) |
| 35 to 44 Years | 16,628 (87.0%) | 2,487 (13.0%) |
| 45 to 54 Years | 16,626 (90.6%) | 1,721 (9.4%) |
| 55 to 64 Years | 17,229 (89.7%) | 1,984 (10.3%) |
| 65 to 74 Years | 14,212 (99.1%) | 132 (0.9%) |
| 75 Years and older | 9,449 (99.6%) | 38 (0.4%) |
| Total | 143,610 (92.0%) | 12,412 (8.0%) |
Health Insurance Coverage by Citizenship Status in Ouachita Parish
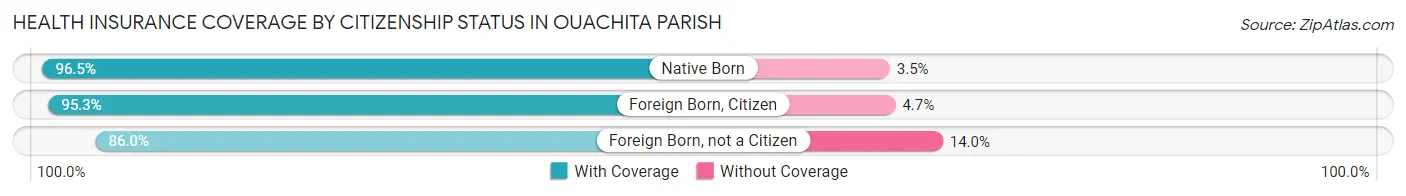
| Citizenship Status | With Coverage | Without Coverage |
| Native Born | 12,031 (96.5%) | 442 (3.5%) |
| Foreign Born, Citizen | 27,426 (95.3%) | 1,341 (4.7%) |
| Foreign Born, not a Citizen | 12,956 (86.0%) | 2,102 (14.0%) |
Health Insurance Coverage by Household Income in Ouachita Parish
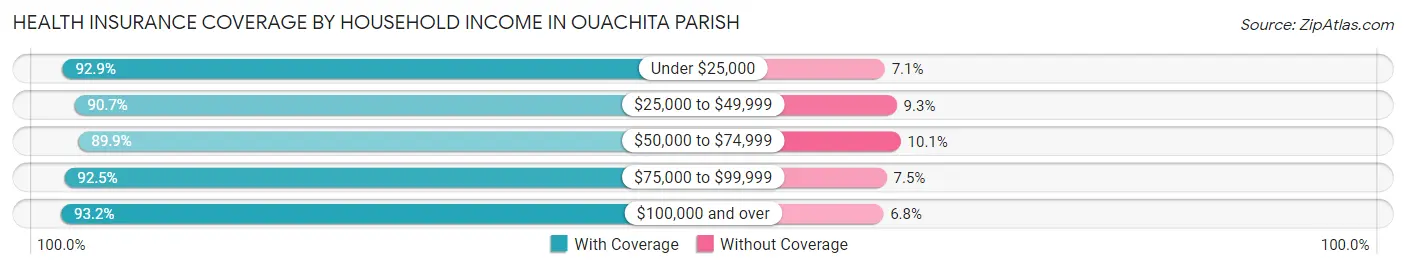
| Household Income | With Coverage | Without Coverage |
| Under $25,000 | 31,609 (92.9%) | 2,415 (7.1%) |
| $25,000 to $49,999 | 28,520 (90.7%) | 2,938 (9.3%) |
| $50,000 to $74,999 | 20,661 (89.9%) | 2,316 (10.1%) |
| $75,000 to $99,999 | 15,408 (92.5%) | 1,242 (7.5%) |
| $100,000 and over | 45,097 (93.2%) | 3,308 (6.8%) |
Public vs Private Health Insurance Coverage by Age in Ouachita Parish
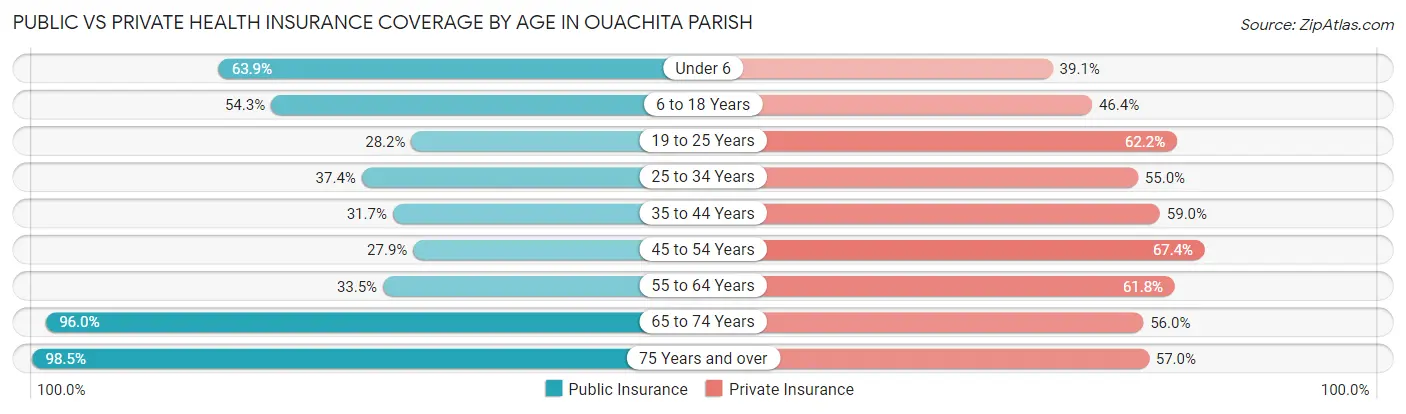
| Age Bracket | Public Insurance | Private Insurance |
| Under 6 | 7,975 (63.9%) | 4,882 (39.1%) |
| 6 to 18 Years | 15,613 (54.3%) | 13,358 (46.4%) |
| 19 to 25 Years | 4,249 (28.2%) | 9,369 (62.2%) |
| 25 to 34 Years | 7,196 (37.4%) | 10,563 (55.0%) |
| 35 to 44 Years | 6,054 (31.7%) | 11,285 (59.0%) |
| 45 to 54 Years | 5,115 (27.9%) | 12,366 (67.4%) |
| 55 to 64 Years | 6,435 (33.5%) | 11,880 (61.8%) |
| 65 to 74 Years | 13,768 (96.0%) | 8,025 (55.9%) |
| 75 Years and over | 9,348 (98.5%) | 5,406 (57.0%) |
| Total | 75,753 (48.5%) | 87,134 (55.8%) |
Disability Status by Sex by Age in Ouachita Parish
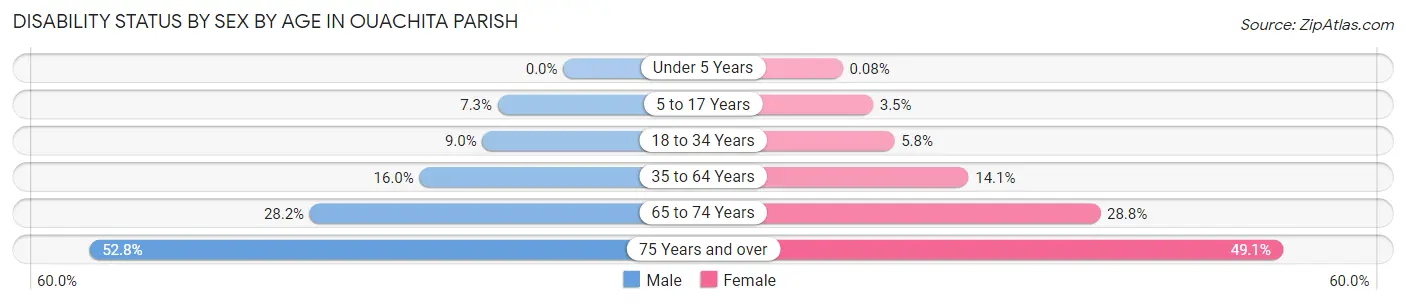
| Age Bracket | Male | Female |
| Under 5 Years | 0 (0.0%) | 4 (0.1%) |
| 5 to 17 Years | 1,063 (7.3%) | 484 (3.5%) |
| 18 to 34 Years | 1,569 (9.0%) | 1,116 (5.8%) |
| 35 to 64 Years | 4,244 (16.0%) | 4,252 (14.1%) |
| 65 to 74 Years | 1,797 (28.2%) | 2,294 (28.8%) |
| 75 Years and over | 1,932 (52.8%) | 2,862 (49.1%) |
Disability Class by Sex by Age in Ouachita Parish
Disability Class: Hearing Difficulty
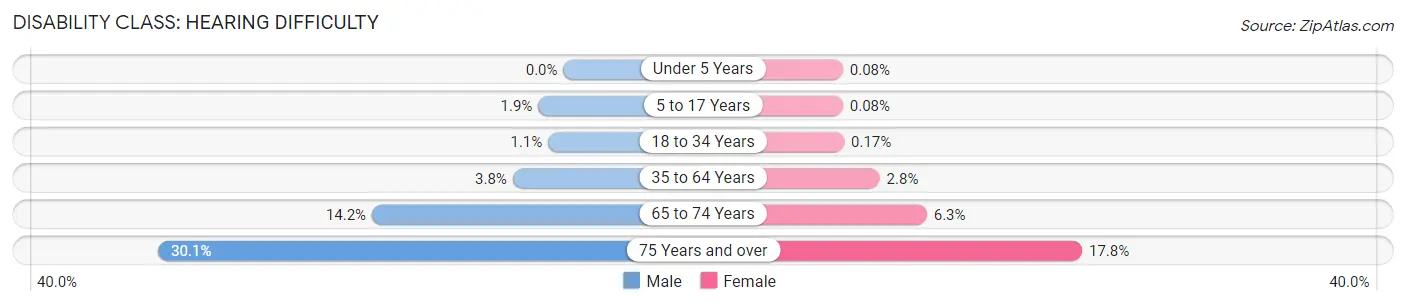
| Age Bracket | Male | Female |
| Under 5 Years | 0 (0.0%) | 4 (0.1%) |
| 5 to 17 Years | 273 (1.9%) | 11 (0.1%) |
| 18 to 34 Years | 197 (1.1%) | 33 (0.2%) |
| 35 to 64 Years | 996 (3.8%) | 848 (2.8%) |
| 65 to 74 Years | 905 (14.2%) | 503 (6.3%) |
| 75 Years and over | 1,101 (30.1%) | 1,040 (17.8%) |
Disability Class: Vision Difficulty
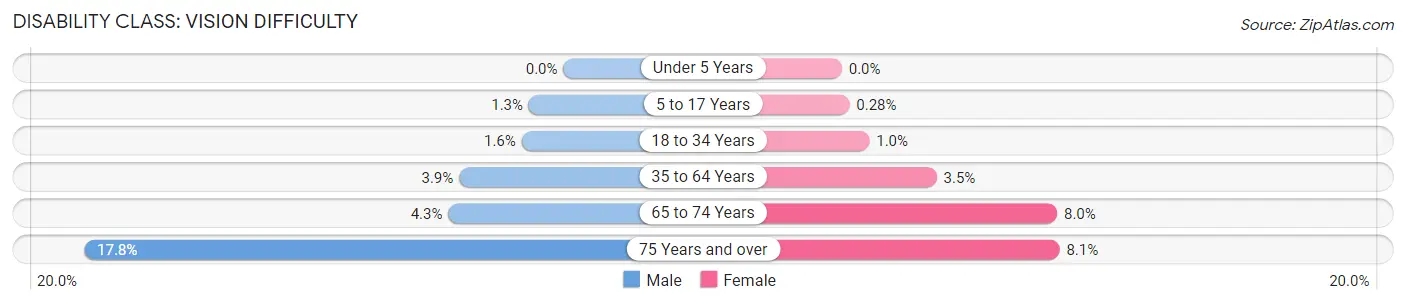
| Age Bracket | Male | Female |
| Under 5 Years | 0 (0.0%) | 0 (0.0%) |
| 5 to 17 Years | 187 (1.3%) | 39 (0.3%) |
| 18 to 34 Years | 270 (1.5%) | 194 (1.0%) |
| 35 to 64 Years | 1,026 (3.9%) | 1,063 (3.5%) |
| 65 to 74 Years | 272 (4.3%) | 637 (8.0%) |
| 75 Years and over | 651 (17.8%) | 471 (8.1%) |
Disability Class: Cognitive Difficulty
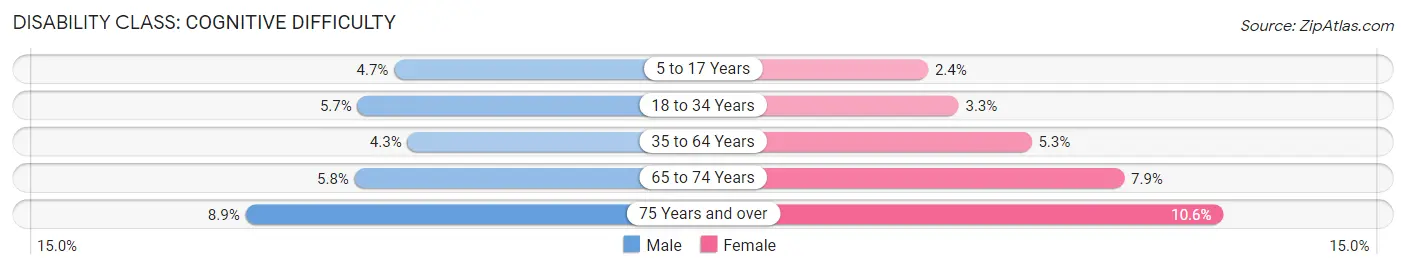
| Age Bracket | Male | Female |
| 5 to 17 Years | 687 (4.7%) | 337 (2.4%) |
| 18 to 34 Years | 999 (5.7%) | 620 (3.3%) |
| 35 to 64 Years | 1,149 (4.3%) | 1,592 (5.3%) |
| 65 to 74 Years | 370 (5.8%) | 627 (7.9%) |
| 75 Years and over | 324 (8.8%) | 619 (10.6%) |
Disability Class: Ambulatory Difficulty
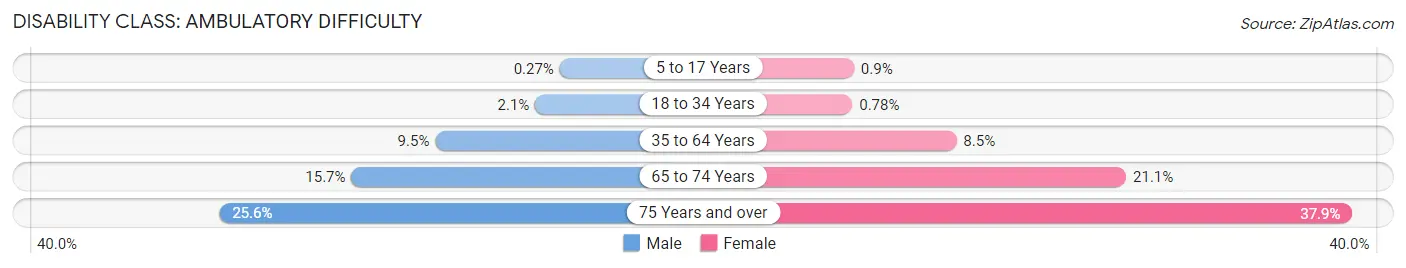
| Age Bracket | Male | Female |
| 5 to 17 Years | 40 (0.3%) | 127 (0.9%) |
| 18 to 34 Years | 364 (2.1%) | 149 (0.8%) |
| 35 to 64 Years | 2,521 (9.5%) | 2,568 (8.5%) |
| 65 to 74 Years | 1,002 (15.7%) | 1,684 (21.1%) |
| 75 Years and over | 935 (25.6%) | 2,209 (37.9%) |
Disability Class: Self-Care Difficulty
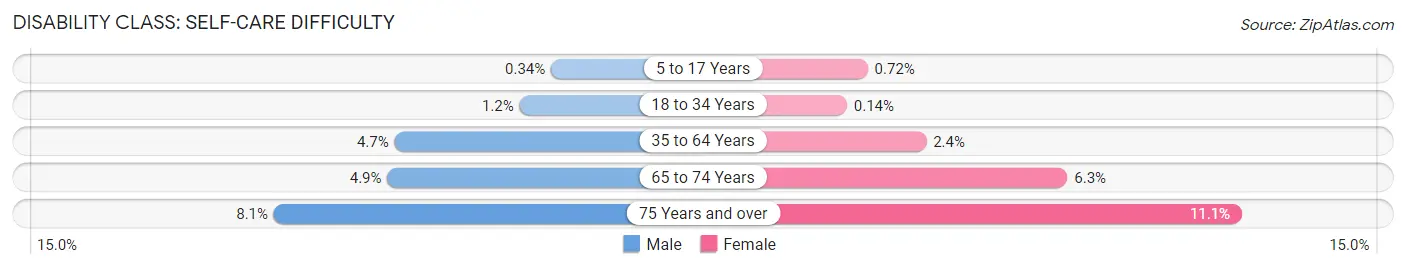
| Age Bracket | Male | Female |
| 5 to 17 Years | 49 (0.3%) | 101 (0.7%) |
| 18 to 34 Years | 213 (1.2%) | 26 (0.1%) |
| 35 to 64 Years | 1,246 (4.7%) | 708 (2.4%) |
| 65 to 74 Years | 312 (4.9%) | 501 (6.3%) |
| 75 Years and over | 295 (8.1%) | 649 (11.1%) |
Technology Access in Ouachita Parish
Computing Device Access in Ouachita Parish
| Device Type | # Households | % Households |
| Desktop or Laptop | 39,202 | 65.8% |
| Smartphone | 50,376 | 84.5% |
| Tablet | 32,431 | 54.4% |
| No Computing Device | 6,596 | 11.1% |
| Total | 59,595 | 100.0% |
Internet Access in Ouachita Parish
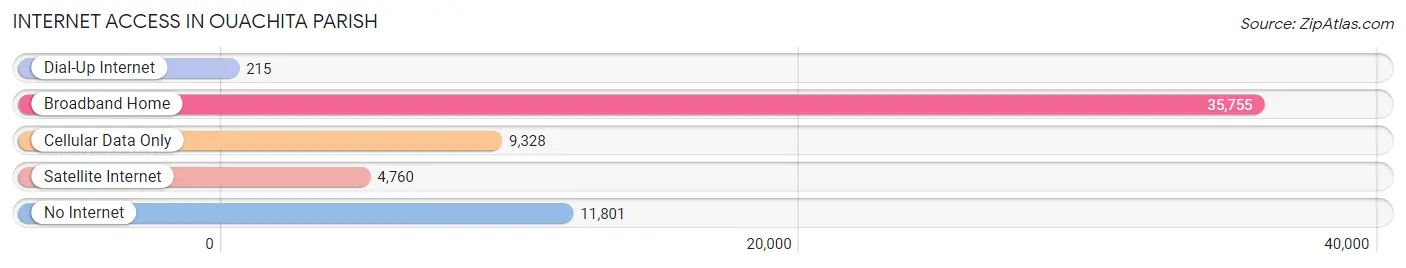
| Internet Type | # Households | % Households |
| Dial-Up Internet | 215 | 0.4% |
| Broadband Home | 35,755 | 60.0% |
| Cellular Data Only | 9,328 | 15.7% |
| Satellite Internet | 4,760 | 8.0% |
| No Internet | 11,801 | 19.8% |
| Total | 59,595 | 100.0% |
Ouachita Parish Summary
Ouachita Parish is located in the northern part of Louisiana, and is bordered by the states of Arkansas and Mississippi. It is the home of the city of Monroe, the parish seat, and is part of the Monroe Metropolitan Statistical Area. The parish was established in 1807 and is named after the Ouachita River, which flows through the area. As of the 2010 census, the population of Ouachita Parish was 153,720, making it the fourth most populous parish in Louisiana.
Geography
Ouachita Parish is located in the northern part of Louisiana, and is bordered by the states of Arkansas and Mississippi. It is the home of the city of Monroe, the parish seat, and is part of the Monroe Metropolitan Statistical Area. The parish is located in the Ouachita River Valley, and is drained by the Ouachita River and its tributaries. The parish has a total area of 845 square miles, of which 835 square miles is land and 10 square miles is water.
The parish is mostly flat, with some rolling hills in the northern and western parts. The highest point in the parish is an unnamed hill in the northern part of the parish, which has an elevation of 250 feet. The parish is located in the humid subtropical climate zone, and has hot, humid summers and mild winters. The average annual temperature is 64°F, and the average annual precipitation is 49.5 inches.
Economy
The economy of Ouachita Parish is largely based on agriculture, manufacturing, and services. The major agricultural products of the parish include cotton, soybeans, corn, and rice. The major manufacturing industries in the parish include food processing, paper products, and chemicals. The major service industries in the parish include healthcare, education, and retail.
The largest employers in the parish are the Monroe City School District, the University of Louisiana at Monroe, and the Ouachita Parish School Board. Other major employers in the parish include St. Francis Medical Center, Walmart, and the Monroe Regional Airport.
Demographics
As of the 2010 census, there were 153,720 people, 58,945 households, and 39,945 families living in the parish. The population density was 184.3 people per square mile. The racial makeup of the parish was 63.2% White, 32.3% African American, 0.5% Native American, 0.7% Asian, 0.1% Pacific Islander, 1.7% from other races, and 1.5% from two or more races. Hispanic or Latino of any race were 3.7% of the population.
The median income for a household in the parish was $37,945, and the median income for a family was $45,945. The per capita income for the parish was $19,945. About 17.2% of families and 21.3% of the population were below the poverty line, including 28.3% of those under age 18 and 16.2% of those age 65 or over.
Conclusion
Ouachita Parish is located in the northern part of Louisiana, and is bordered by the states of Arkansas and Mississippi. It is the home of the city of Monroe, the parish seat, and is part of the Monroe Metropolitan Statistical Area. The parish was established in 1807 and is named after the Ouachita River, which flows through the area. As of the 2010 census, the population of Ouachita Parish was 153,720, making it the fourth most populous parish in Louisiana. The economy of the parish is largely based on agriculture, manufacturing, and services. The major employers in the parish are the Monroe City School District, the University of Louisiana at Monroe, and the Ouachita Parish School Board. The racial makeup of the parish was 63.2% White, 32.3% African American, 0.5% Native American, 0.7% Asian, 0.1% Pacific Islander, 1.7% from other races, and 1.5% from two or more races. The median income for a household in the parish was $37,945, and the median income for a family was $45,945.
Common Questions
What is the Total Population of Ouachita Parish?
Total Population of Ouachita Parish is 159,585.
What is the Total Male Population of Ouachita Parish?
Total Male Population of Ouachita Parish is 77,016.
What is the Total Female Population of Ouachita Parish?
Total Female Population of Ouachita Parish is 82,569.
What is the Ratio of Males per 100 Females in Ouachita Parish?
There are 93.27 Males per 100 Females in Ouachita Parish.
What is the Ratio of Females per 100 Males in Ouachita Parish?
There are 107.21 Females per 100 Males in Ouachita Parish.
What is the Median Population Age in Ouachita Parish?
Median Population Age in Ouachita Parish is 36.5 Years.
What is the Average Family Size in Ouachita Parish
Average Family Size in Ouachita Parish is 3.3 People.
What is the Average Household Size in Ouachita Parish
Average Household Size in Ouachita Parish is 2.6 People.
What is Per Capita Income in Ouachita Parish?
Per Capita income in Ouachita Parish is $29,670.
What is the Median Family Income in Ouachita Parish?
Median Family Income in Ouachita Parish is $67,253.
What is the Median Household income in Ouachita Parish?
Median Household Income in Ouachita Parish is $49,261.
What is Income or Wage Gap in Ouachita Parish?
Income or Wage Gap in Ouachita Parish is 32.0%.
Women in Ouachita Parish earn 68.0 cents for every dollar earned by a man.
What is Family Income Deficit in Ouachita Parish?
Family Income Deficit in Ouachita Parish is $11,934.
Families that are below poverty line in Ouachita Parish earn $11,934 less on average than the poverty threshold level.
What is Inequality or Gini Index in Ouachita Parish?
Inequality or Gini Index in Ouachita Parish is 0.52.
How Large is the Labor Force in Ouachita Parish?
There are 73,364 People in the Labor Forcein in Ouachita Parish.
What is the Percentage of People in the Labor Force in Ouachita Parish?
58.8% of People are in the Labor Force in Ouachita Parish.
What is the Unemployment Rate in Ouachita Parish?
Unemployment Rate in Ouachita Parish is 6.5%.