Madison Parish, LA
Madison Parish Map
Madison Parish Overview
10,028
TOTAL POPULATION
4,770
MALE POPULATION
5,258
FEMALE POPULATION
90.72
MALES / 100 FEMALES
110.23
FEMALES / 100 MALES
36.2
MEDIAN AGE
3.4
AVG FAMILY SIZE
2.7
AVG HOUSEHOLD SIZE
$18,314
PER CAPITA INCOME
$45,203
AVG FAMILY INCOME
$34,508
AVG HOUSEHOLD INCOME
25.3%
WAGE / INCOME GAP [ % ]
74.7¢/ $1
WAGE / INCOME GAP [ $ ]
$12,462
FAMILY INCOME DEFICIT
0.54
INEQUALITY / GINI INDEX
3,143
LABOR FORCE [ PEOPLE ]
40.9%
PERCENT IN LABOR FORCE
5.8%
UNEMPLOYMENT RATE
Madison Parish Area Codes
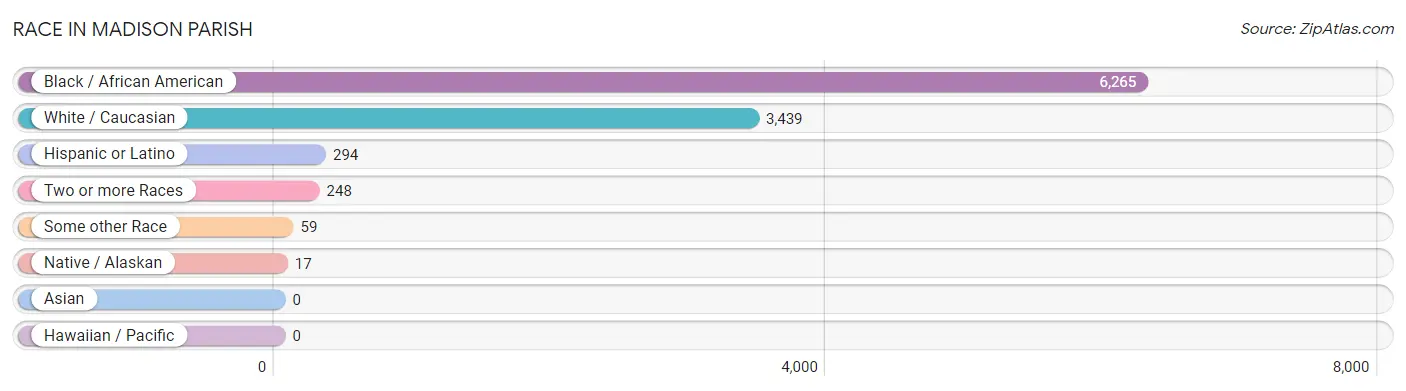
Race in Madison Parish
The most populous races in Madison Parish are Black / African American (6,265 | 62.5%), White / Caucasian (3,439 | 34.3%), and Hispanic or Latino (294 | 2.9%).
| Race | # Population | % Population |
| Asian | 0 | 0.0% |
| Black / African American | 6,265 | 62.5% |
| Hawaiian / Pacific | 0 | 0.0% |
| Hispanic or Latino | 294 | 2.9% |
| Native / Alaskan | 17 | 0.2% |
| White / Caucasian | 3,439 | 34.3% |
| Two or more Races | 248 | 2.5% |
| Some other Race | 59 | 0.6% |
| Total | 10,028 | 100.0% |
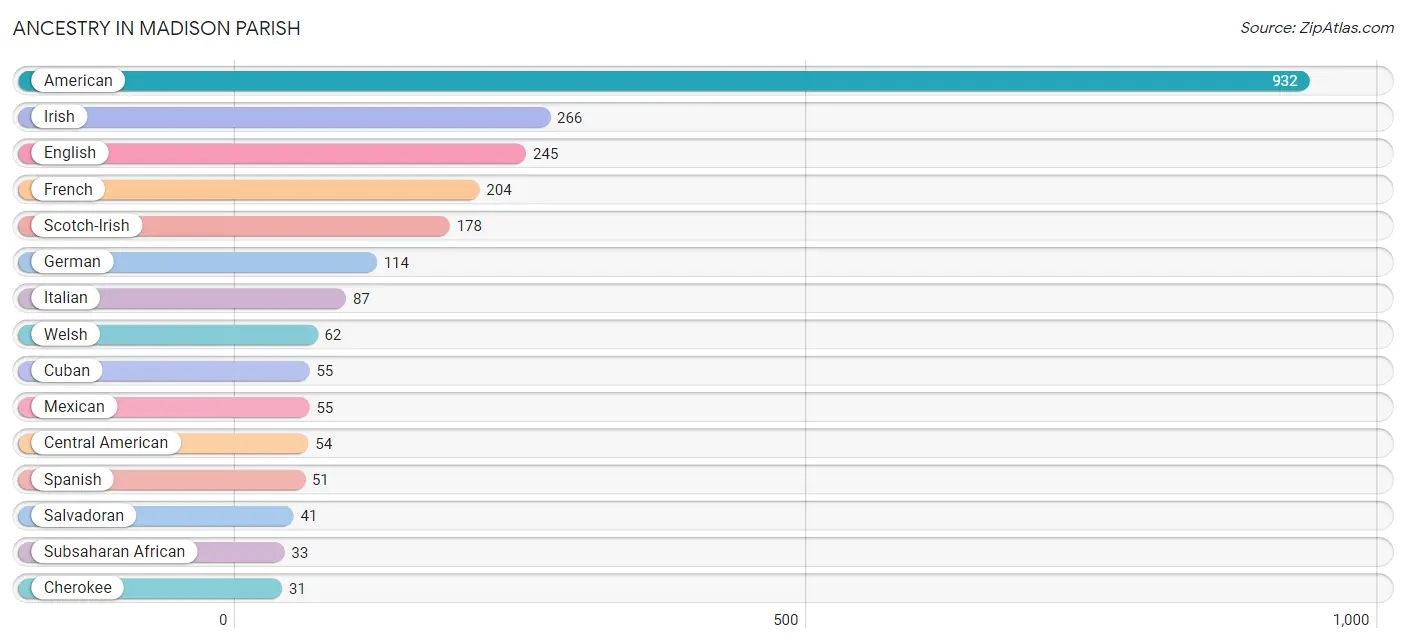
Ancestry in Madison Parish
The most populous ancestries reported in Madison Parish are American (932 | 9.3%), Irish (266 | 2.6%), English (245 | 2.4%), French (204 | 2.0%), and Scotch-Irish (178 | 1.8%), together accounting for 18.2% of all Madison Parish residents.
| Ancestry | # Population | % Population |
| African | 26 | 0.3% |
| American | 932 | 9.3% |
| British | 6 | 0.1% |
| Cajun | 4 | 0.0% |
| Central American | 54 | 0.5% |
| Cherokee | 31 | 0.3% |
| Choctaw | 6 | 0.1% |
| Cuban | 55 | 0.5% |
| Dominican | 9 | 0.1% |
| Dutch | 18 | 0.2% |
| Eastern European | 3 | 0.0% |
| English | 245 | 2.4% |
| European | 19 | 0.2% |
| French | 204 | 2.0% |
| French Canadian | 16 | 0.2% |
| German | 114 | 1.1% |
| Haitian | 5 | 0.1% |
| Honduran | 7 | 0.1% |
| Irish | 266 | 2.6% |
| Israeli | 5 | 0.1% |
| Italian | 87 | 0.9% |
| Lithuanian | 19 | 0.2% |
| Mexican | 55 | 0.5% |
| Norwegian | 1 | 0.0% |
| Panamanian | 6 | 0.1% |
| Polish | 14 | 0.1% |
| Puerto Rican | 4 | 0.0% |
| Salvadoran | 41 | 0.4% |
| Scandinavian | 31 | 0.3% |
| Scotch-Irish | 178 | 1.8% |
| Scottish | 29 | 0.3% |
| Sioux | 10 | 0.1% |
| Spaniard | 2 | 0.0% |
| Spanish | 51 | 0.5% |
| Subsaharan African | 33 | 0.3% |
| Swedish | 19 | 0.2% |
| Swiss | 1 | 0.0% |
| Welsh | 62 | 0.6% |
| West Indian | 6 | 0.1% | View All 39 Rows |
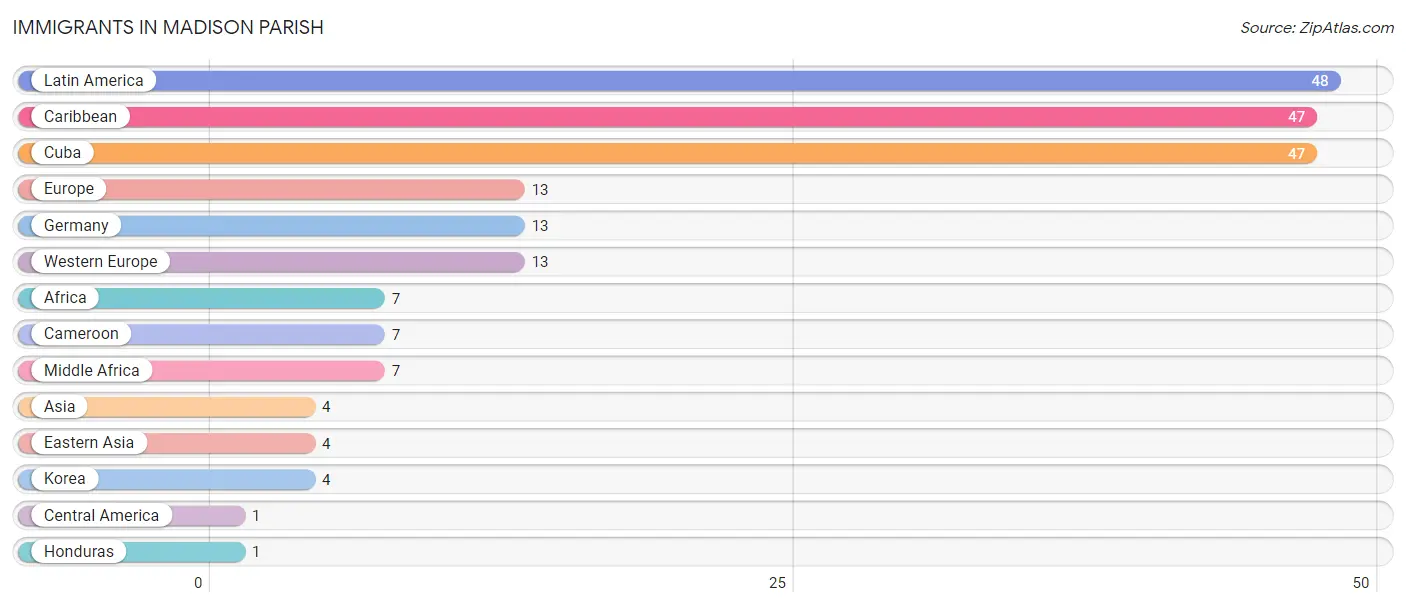
Immigrants in Madison Parish
The most numerous immigrant groups reported in Madison Parish came from Latin America (48 | 0.5%), Caribbean (47 | 0.5%), Cuba (47 | 0.5%), Europe (13 | 0.1%), and Germany (13 | 0.1%), together accounting for 1.7% of all Madison Parish residents.
| Immigration Origin | # Population | % Population |
| Africa | 7 | 0.1% |
| Asia | 4 | 0.0% |
| Cameroon | 7 | 0.1% |
| Caribbean | 47 | 0.5% |
| Central America | 1 | 0.0% |
| Cuba | 47 | 0.5% |
| Eastern Asia | 4 | 0.0% |
| Europe | 13 | 0.1% |
| Germany | 13 | 0.1% |
| Honduras | 1 | 0.0% |
| Korea | 4 | 0.0% |
| Latin America | 48 | 0.5% |
| Middle Africa | 7 | 0.1% |
| Western Europe | 13 | 0.1% | View All 14 Rows |
Sex and Age in Madison Parish
Sex and Age in Madison Parish
The most populous age groups in Madison Parish are 10 to 14 Years (458 | 9.6%) for men and 5 to 9 Years (468 | 8.9%) for women.
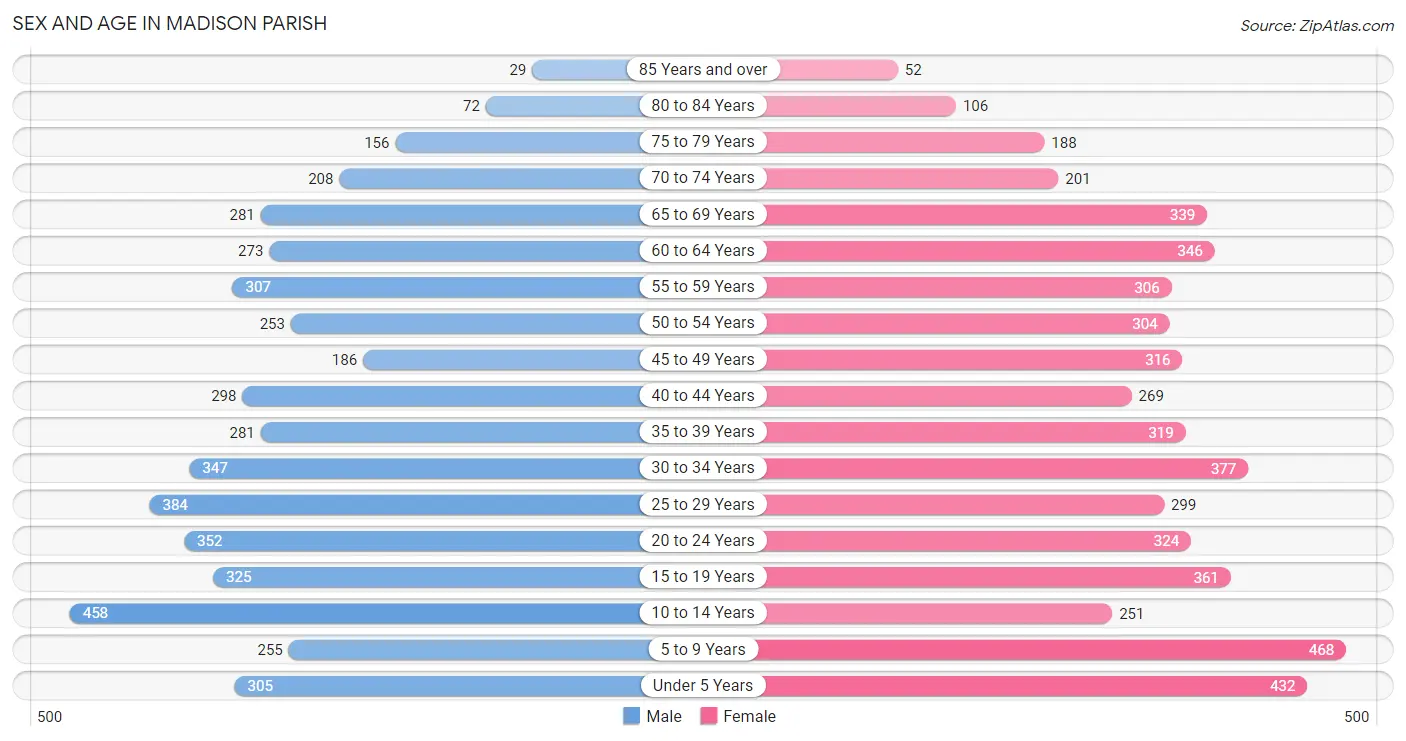
| Age Bracket | Male | Female |
| Under 5 Years | 305 (6.4%) | 432 (8.2%) |
| 5 to 9 Years | 255 (5.3%) | 468 (8.9%) |
| 10 to 14 Years | 458 (9.6%) | 251 (4.8%) |
| 15 to 19 Years | 325 (6.8%) | 361 (6.9%) |
| 20 to 24 Years | 352 (7.4%) | 324 (6.2%) |
| 25 to 29 Years | 384 (8.1%) | 299 (5.7%) |
| 30 to 34 Years | 347 (7.3%) | 377 (7.2%) |
| 35 to 39 Years | 281 (5.9%) | 319 (6.1%) |
| 40 to 44 Years | 298 (6.2%) | 269 (5.1%) |
| 45 to 49 Years | 186 (3.9%) | 316 (6.0%) |
| 50 to 54 Years | 253 (5.3%) | 304 (5.8%) |
| 55 to 59 Years | 307 (6.4%) | 306 (5.8%) |
| 60 to 64 Years | 273 (5.7%) | 346 (6.6%) |
| 65 to 69 Years | 281 (5.9%) | 339 (6.5%) |
| 70 to 74 Years | 208 (4.4%) | 201 (3.8%) |
| 75 to 79 Years | 156 (3.3%) | 188 (3.6%) |
| 80 to 84 Years | 72 (1.5%) | 106 (2.0%) |
| 85 Years and over | 29 (0.6%) | 52 (1.0%) |
| Total | 4,770 (100.0%) | 5,258 (100.0%) |
Families and Households in Madison Parish
Median Family Size in Madison Parish
The median family size in Madison Parish is 3.38 persons per family, with single female/mother families (900 | 44.3%) accounting for the largest median family size of 3.67 persons per family. On the other hand, married-couple families (987 | 48.5%) represent the smallest median family size with 3.08 persons per family.
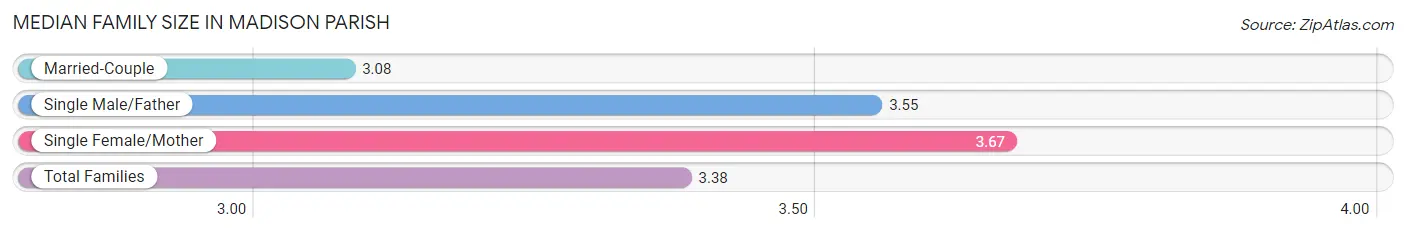
| Family Type | # Families | Family Size |
| Married-Couple | 987 (48.5%) | 3.08 |
| Single Male/Father | 147 (7.2%) | 3.55 |
| Single Female/Mother | 900 (44.3%) | 3.67 |
| Total Families | 2,034 (100.0%) | 3.38 |
Median Household Size in Madison Parish
The median household size in Madison Parish is 2.72 persons per household, with single female/mother households (900 | 29.1%) accounting for the largest median household size of 3.92 persons per household. non-family households (1,058 | 34.2%) represent the smallest median household size with 1.19 persons per household.
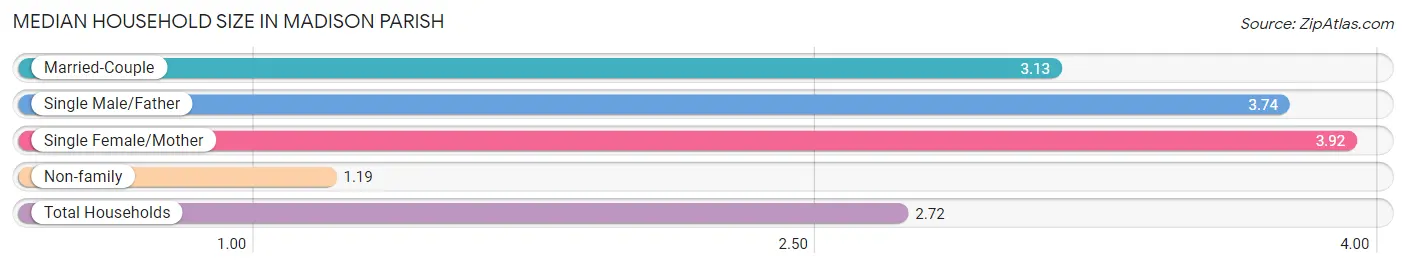
| Household Type | # Households | Household Size |
| Married-Couple | 987 (31.9%) | 3.13 |
| Single Male/Father | 147 (4.8%) | 3.74 |
| Single Female/Mother | 900 (29.1%) | 3.92 |
| Non-family | 1,058 (34.2%) | 1.19 |
| Total Households | 3,092 (100.0%) | 2.72 |
Household Size by Marriage Status in Madison Parish
Out of a total of 3,092 households in Madison Parish, 2,034 (65.8%) are family households, while 1,058 (34.2%) are nonfamily households. The most numerous type of family households are 2-person households, comprising 838, and the most common type of nonfamily households are 1-person households, comprising 960.
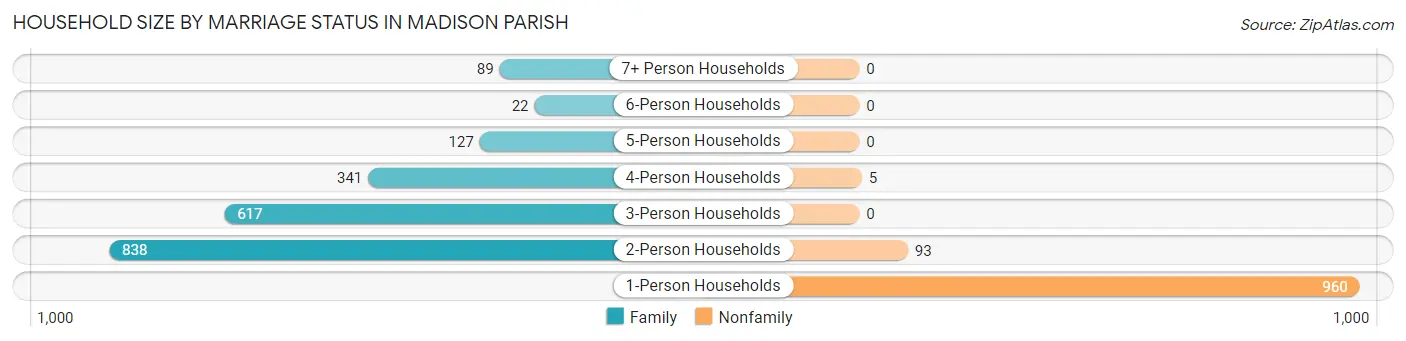
| Household Size | Family Households | Nonfamily Households |
| 1-Person Households | - | 960 (31.0%) |
| 2-Person Households | 838 (27.1%) | 93 (3.0%) |
| 3-Person Households | 617 (20.0%) | 0 (0.0%) |
| 4-Person Households | 341 (11.0%) | 5 (0.2%) |
| 5-Person Households | 127 (4.1%) | 0 (0.0%) |
| 6-Person Households | 22 (0.7%) | 0 (0.0%) |
| 7+ Person Households | 89 (2.9%) | 0 (0.0%) |
| Total | 2,034 (65.8%) | 1,058 (34.2%) |
Female Fertility in Madison Parish
Fertility by Age in Madison Parish
Average fertility rate in Madison Parish is 53.0 births per 1,000 women. Women in the age bracket of 20 to 34 years have the highest fertility rate with 113.0 births per 1,000 women. Women in the age bracket of 20 to 34 years acount for 91.1% of all women with births.
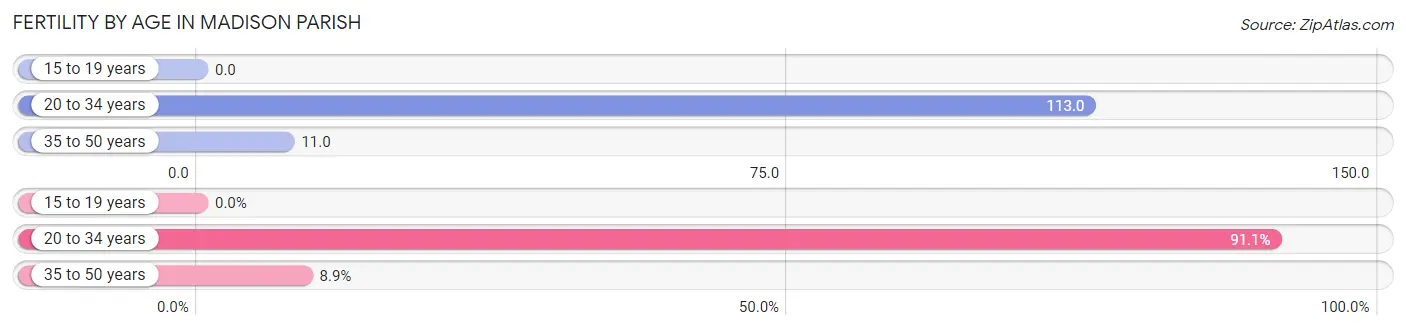
| Age Bracket | Women with Births | Births / 1,000 Women |
| 15 to 19 years | 0 (0.0%) | 0.0 |
| 20 to 34 years | 113 (91.1%) | 113.0 |
| 35 to 50 years | 11 (8.9%) | 11.0 |
| Total | 124 (100.0%) | 53.0 |
Fertility by Age by Marriage Status in Madison Parish
17.7% of women with births (124) in Madison Parish are married. The highest percentage of unmarried women with births falls into 20 to 34 years age bracket with 85.8% of them unmarried at the time of birth, while the lowest percentage of unmarried women with births belong to 35 to 50 years age bracket with 45.5% of them unmarried.
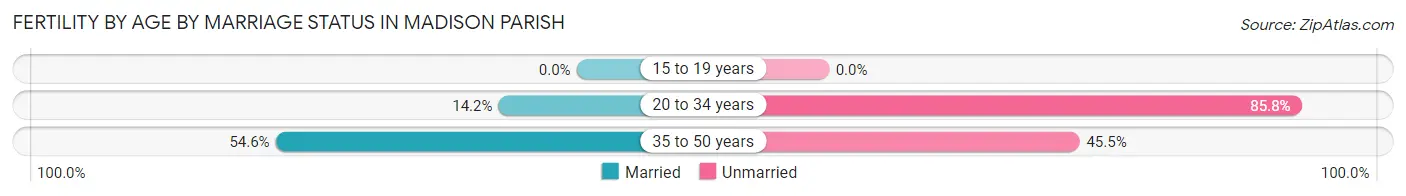
| Age Bracket | Married | Unmarried |
| 15 to 19 years | 0 (0.0%) | 0 (0.0%) |
| 20 to 34 years | 16 (14.2%) | 97 (85.8%) |
| 35 to 50 years | 6 (54.5%) | 5 (45.5%) |
| Total | 22 (17.7%) | 102 (82.3%) |
Fertility by Education in Madison Parish
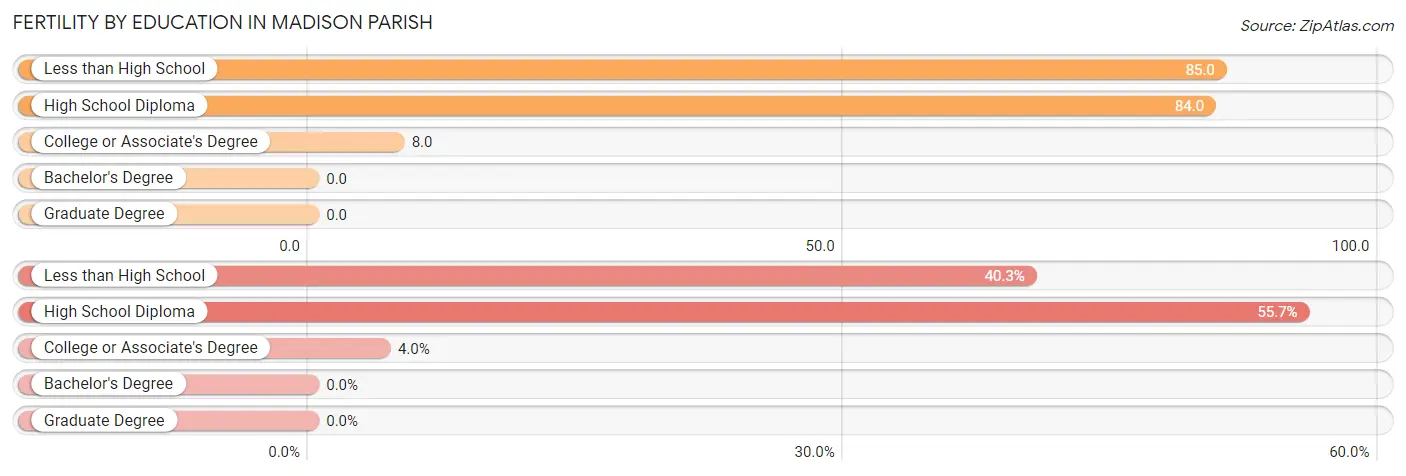
| Educational Attainment | Women with Births | Births / 1,000 Women |
| Less than High School | 50 (40.3%) | 85.0 |
| High School Diploma | 69 (55.6%) | 84.0 |
| College or Associate's Degree | 5 (4.0%) | 8.0 |
| Bachelor's Degree | 0 (0.0%) | 0.0 |
| Graduate Degree | 0 (0.0%) | 0.0 |
| Total | 124 (100.0%) | 53.0 |
Fertility by Education by Marriage Status in Madison Parish
82.3% of women with births in Madison Parish are unmarried. Women with the educational attainment of less than high school are most likely to be married with 38.0% of them married at childbirth, while women with the educational attainment of college or associate's degree are least likely to be married with 100.0% of them unmarried at childbirth.
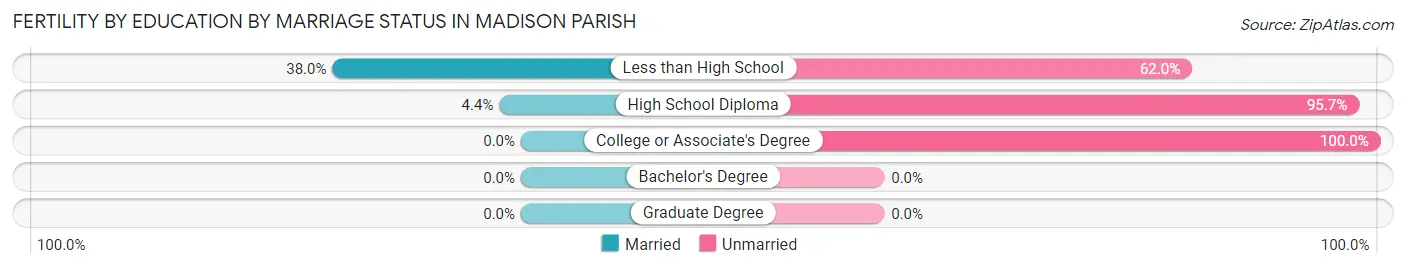
| Educational Attainment | Married | Unmarried |
| Less than High School | 19 (38.0%) | 31 (62.0%) |
| High School Diploma | 3 (4.3%) | 66 (95.7%) |
| College or Associate's Degree | 0 (0.0%) | 5 (100.0%) |
| Bachelor's Degree | 0 (0.0%) | 0 (0.0%) |
| Graduate Degree | 0 (0.0%) | 0 (0.0%) |
| Total | 22 (17.7%) | 102 (82.3%) |
Income in Madison Parish
Income Overview in Madison Parish
Per Capita Income in Madison Parish is $18,314, while median incomes of families and households are $45,203 and $34,508 respectively.
| Characteristic | Number | Measure |
| Per Capita Income | 10,028 | $18,314 |
| Median Family Income | 2,034 | $45,203 |
| Mean Family Income | 2,034 | $70,050 |
| Median Household Income | 3,092 | $34,508 |
| Mean Household Income | 3,092 | $56,215 |
| Income Deficit | 2,034 | $12,462 |
| Wage / Income Gap (%) | 10,028 | 25.31% |
| Wage / Income Gap ($) | 10,028 | 74.69¢ per $1 |
| Gini / Inequality Index | 10,028 | 0.54 |
Earnings by Sex in Madison Parish
Average Earnings in Madison Parish are $26,590, $30,604 for men and $22,857 for women, a difference of 25.3%.
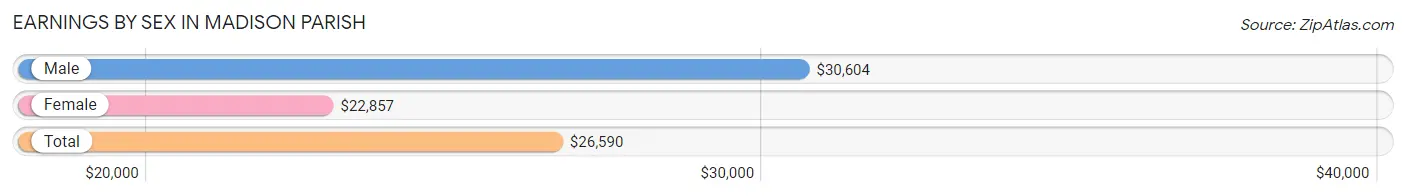
| Sex | Number | Average Earnings |
| Male | 1,553 (45.0%) | $30,604 |
| Female | 1,902 (55.0%) | $22,857 |
| Total | 3,455 (100.0%) | $26,590 |
Earnings by Sex by Income Bracket in Madison Parish
The most common earnings brackets in Madison Parish are $65,000 to $74,999 for men (159 | 10.2%) and $2,499 or less for women (238 | 12.5%).
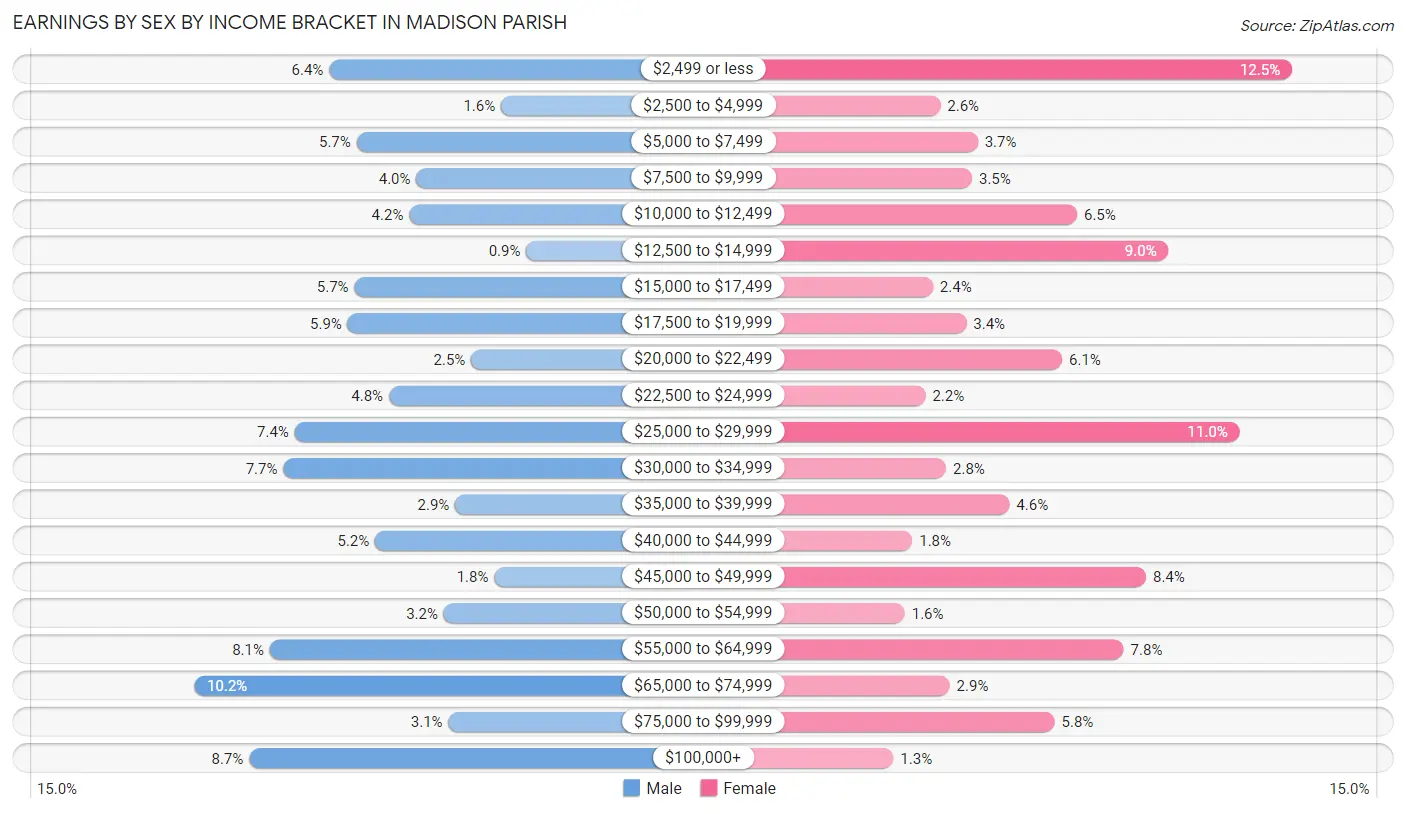
| Income | Male | Female |
| $2,499 or less | 100 (6.4%) | 238 (12.5%) |
| $2,500 to $4,999 | 25 (1.6%) | 50 (2.6%) |
| $5,000 to $7,499 | 88 (5.7%) | 70 (3.7%) |
| $7,500 to $9,999 | 62 (4.0%) | 67 (3.5%) |
| $10,000 to $12,499 | 65 (4.2%) | 123 (6.5%) |
| $12,500 to $14,999 | 14 (0.9%) | 172 (9.0%) |
| $15,000 to $17,499 | 89 (5.7%) | 46 (2.4%) |
| $17,500 to $19,999 | 92 (5.9%) | 64 (3.4%) |
| $20,000 to $22,499 | 38 (2.5%) | 115 (6.0%) |
| $22,500 to $24,999 | 74 (4.8%) | 42 (2.2%) |
| $25,000 to $29,999 | 115 (7.4%) | 210 (11.0%) |
| $30,000 to $34,999 | 120 (7.7%) | 53 (2.8%) |
| $35,000 to $39,999 | 45 (2.9%) | 87 (4.6%) |
| $40,000 to $44,999 | 80 (5.1%) | 35 (1.8%) |
| $45,000 to $49,999 | 28 (1.8%) | 160 (8.4%) |
| $50,000 to $54,999 | 50 (3.2%) | 31 (1.6%) |
| $55,000 to $64,999 | 126 (8.1%) | 148 (7.8%) |
| $65,000 to $74,999 | 159 (10.2%) | 55 (2.9%) |
| $75,000 to $99,999 | 48 (3.1%) | 111 (5.8%) |
| $100,000+ | 135 (8.7%) | 25 (1.3%) |
| Total | 1,553 (100.0%) | 1,902 (100.0%) |
Earnings by Sex by Educational Attainment in Madison Parish
Average earnings in Madison Parish are $37,350 for men and $26,238 for women, a difference of 29.7%. Men with an educational attainment of graduate degree enjoy the highest average annual earnings of $90,556, while those with less than high school education earn the least with $19,653. Women with an educational attainment of graduate degree earn the most with the average annual earnings of $62,763, while those with less than high school education have the smallest earnings of $10,877.
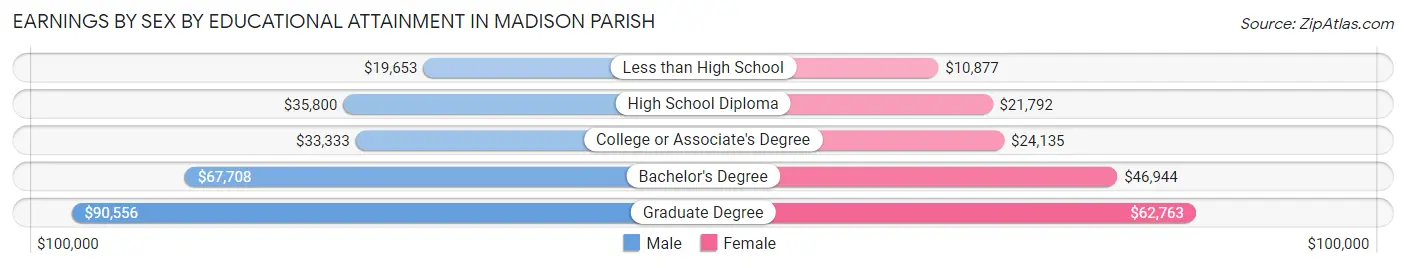
| Educational Attainment | Male Income | Female Income |
| Less than High School | $19,653 | $10,877 |
| High School Diploma | $35,800 | $21,792 |
| College or Associate's Degree | $33,333 | $24,135 |
| Bachelor's Degree | $67,708 | $46,944 |
| Graduate Degree | $90,556 | $62,763 |
| Total | $37,350 | $26,238 |
Family Income in Madison Parish
Family Income Brackets in Madison Parish
According to the Madison Parish family income data, there are 356 families falling into the $50,000 to $74,999 income range, which is the most common income bracket and makes up 17.5% of all families. Conversely, the $200,000+ income bracket is the least frequent group with only 94 families (4.6%) belonging to this category.
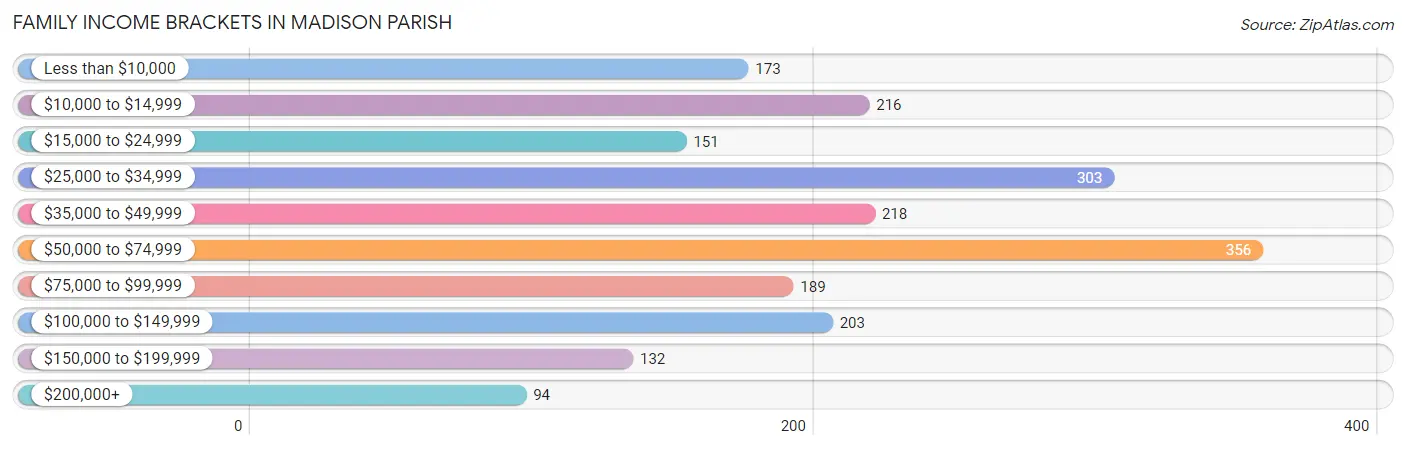
| Income Bracket | # Families | % Families |
| Less than $10,000 | 173 | 8.5% |
| $10,000 to $14,999 | 216 | 10.6% |
| $15,000 to $24,999 | 151 | 7.4% |
| $25,000 to $34,999 | 303 | 14.9% |
| $35,000 to $49,999 | 218 | 10.7% |
| $50,000 to $74,999 | 356 | 17.5% |
| $75,000 to $99,999 | 189 | 9.3% |
| $100,000 to $149,999 | 203 | 10.0% |
| $150,000 to $199,999 | 132 | 6.5% |
| $200,000+ | 94 | 4.6% |
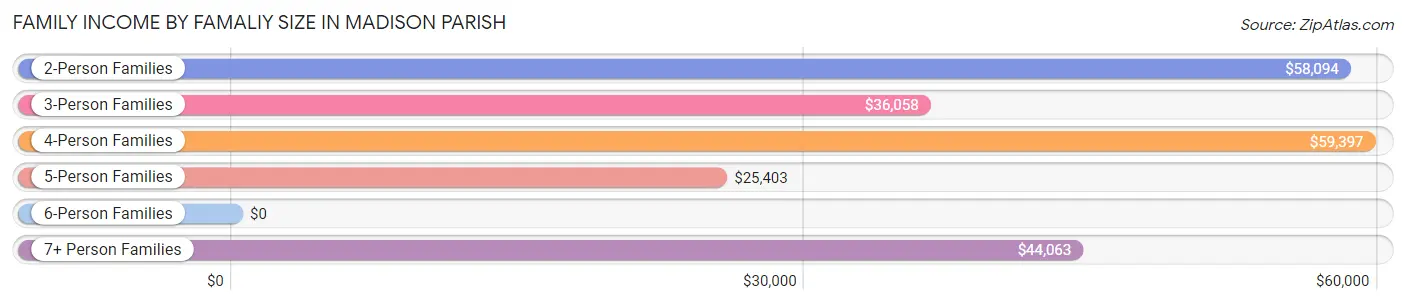
Family Income by Famaliy Size in Madison Parish
4-person families (252 | 12.4%) account for the highest median family income in Madison Parish with $59,397 per family, while 2-person families (929 | 45.7%) have the highest median income of $29,047 per family member.
| Income Bracket | # Families | Median Income |
| 2-Person Families | 929 (45.7%) | $58,094 |
| 3-Person Families | 625 (30.7%) | $36,058 |
| 4-Person Families | 252 (12.4%) | $59,397 |
| 5-Person Families | 146 (7.2%) | $25,403 |
| 6-Person Families | 22 (1.1%) | $0 |
| 7+ Person Families | 60 (2.9%) | $44,063 |
| Total | 2,034 (100.0%) | $45,203 |
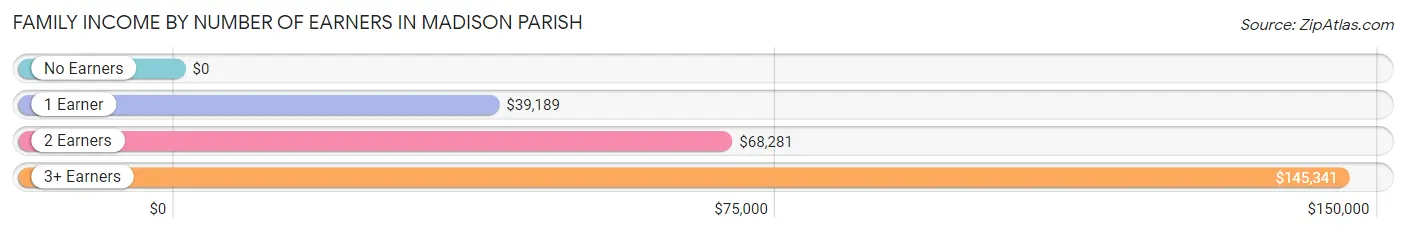
Family Income by Number of Earners in Madison Parish
| Number of Earners | # Families | Median Income |
| No Earners | 417 (20.5%) | $0 |
| 1 Earner | 754 (37.1%) | $39,189 |
| 2 Earners | 787 (38.7%) | $68,281 |
| 3+ Earners | 76 (3.7%) | $145,341 |
| Total | 2,034 (100.0%) | $45,203 |
Household Income in Madison Parish
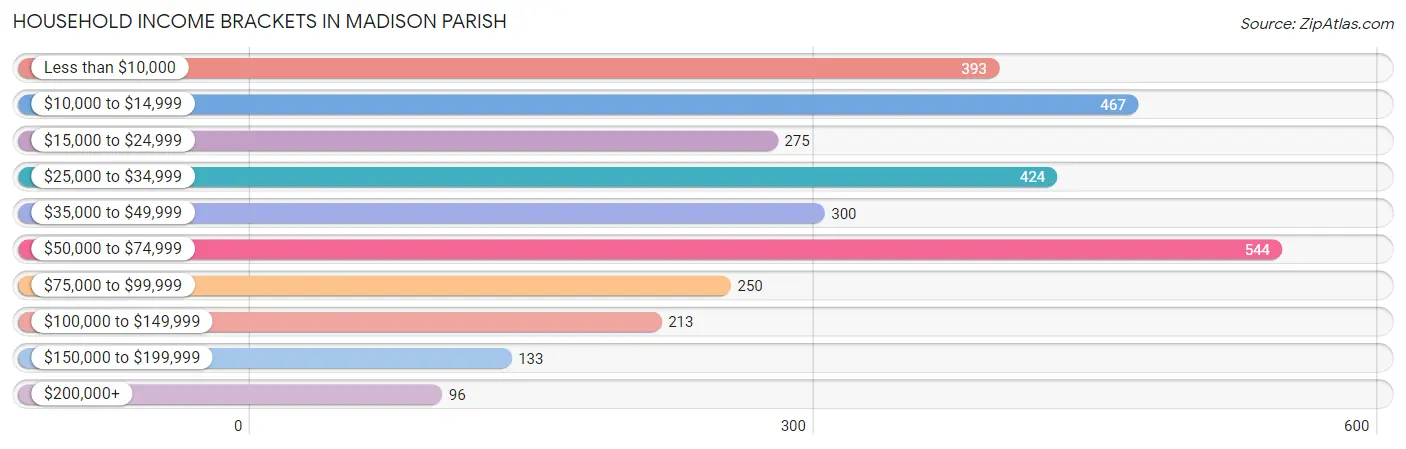
Household Income Brackets in Madison Parish
With 544 households falling in the category, the $50,000 to $74,999 income range is the most frequent in Madison Parish, accounting for 17.6% of all households. In contrast, only 96 households (3.1%) fall into the $200,000+ income bracket, making it the least populous group.
| Income Bracket | # Households | % Households |
| Less than $10,000 | 393 | 12.7% |
| $10,000 to $14,999 | 467 | 15.1% |
| $15,000 to $24,999 | 275 | 8.9% |
| $25,000 to $34,999 | 424 | 13.7% |
| $35,000 to $49,999 | 300 | 9.7% |
| $50,000 to $74,999 | 544 | 17.6% |
| $75,000 to $99,999 | 250 | 8.1% |
| $100,000 to $149,999 | 213 | 6.9% |
| $150,000 to $199,999 | 133 | 4.3% |
| $200,000+ | 96 | 3.1% |
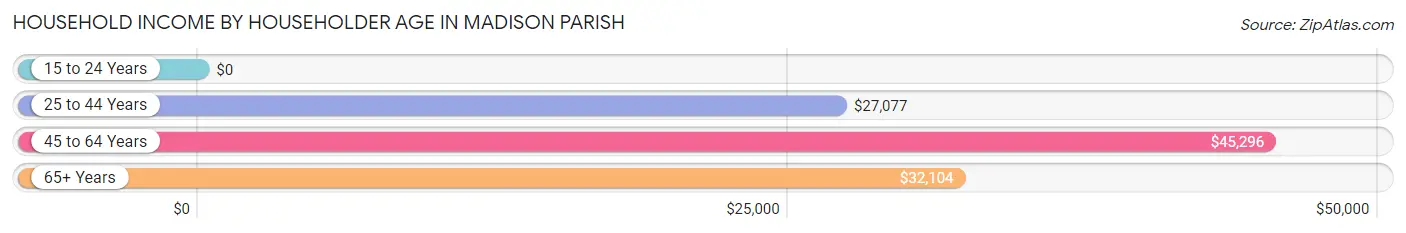
Household Income by Householder Age in Madison Parish
The median household income in Madison Parish is $34,508, with the highest median household income of $45,296 found in the 45 to 64 years age bracket for the primary householder. A total of 1,185 households (38.3%) fall into this category. Meanwhile, the 15 to 24 years age bracket for the primary householder has the lowest median household income of $0, with 83 households (2.7%) in this group.
| Income Bracket | # Households | Median Income |
| 15 to 24 Years | 83 (2.7%) | $0 |
| 25 to 44 Years | 714 (23.1%) | $27,077 |
| 45 to 64 Years | 1,185 (38.3%) | $45,296 |
| 65+ Years | 1,110 (35.9%) | $32,104 |
| Total | 3,092 (100.0%) | $34,508 |
Poverty in Madison Parish
Income Below Poverty by Sex and Age in Madison Parish
With 31.7% poverty level for males and 43.4% for females among the residents of Madison Parish, under 5 year old males and under 5 year old females are the most vulnerable to poverty, with 203 males (66.6%) and 282 females (70.2%) in their respective age groups living below the poverty level.
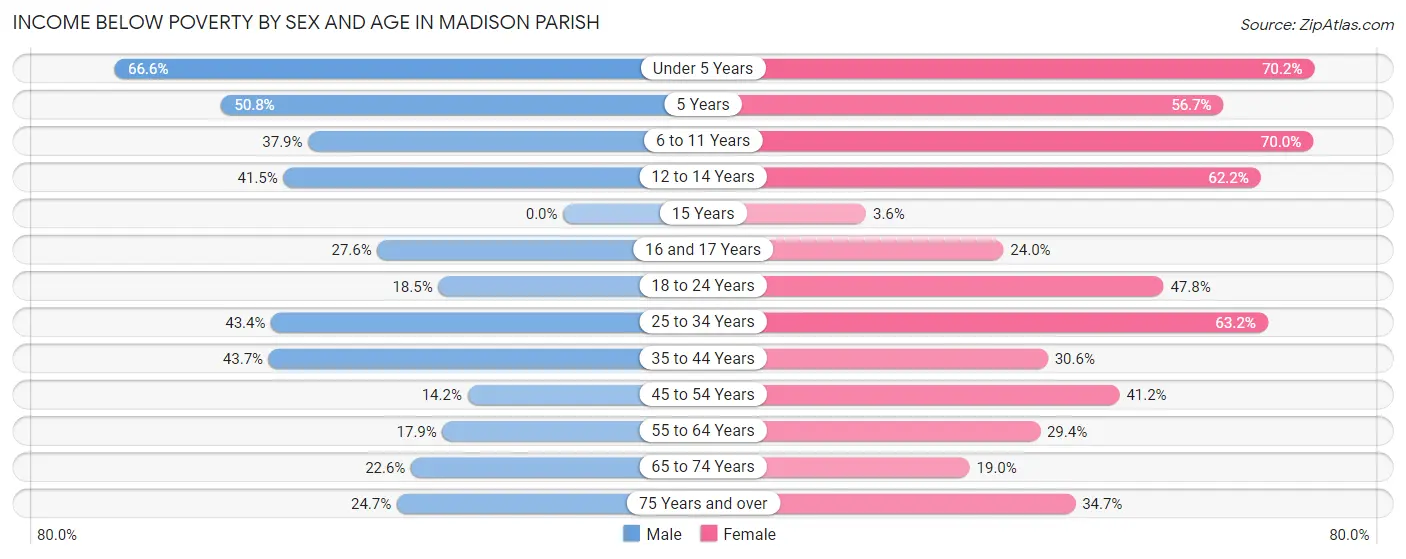
| Age Bracket | Male | Female |
| Under 5 Years | 203 (66.6%) | 282 (70.2%) |
| 5 Years | 66 (50.8%) | 51 (56.7%) |
| 6 to 11 Years | 131 (37.9%) | 331 (70.0%) |
| 12 to 14 Years | 81 (41.5%) | 97 (62.2%) |
| 15 Years | 0 (0.0%) | 5 (3.6%) |
| 16 and 17 Years | 40 (27.6%) | 18 (24.0%) |
| 18 to 24 Years | 71 (18.5%) | 193 (47.8%) |
| 25 to 34 Years | 134 (43.4%) | 282 (63.2%) |
| 35 to 44 Years | 174 (43.7%) | 126 (30.6%) |
| 45 to 54 Years | 48 (14.2%) | 228 (41.2%) |
| 55 to 64 Years | 90 (17.9%) | 191 (29.4%) |
| 65 to 74 Years | 108 (22.6%) | 100 (19.0%) |
| 75 Years and over | 60 (24.7%) | 113 (34.7%) |
| Total | 1,206 (31.7%) | 2,017 (43.4%) |
Income Above Poverty by Sex and Age in Madison Parish
According to the poverty statistics in Madison Parish, males aged 15 years and females aged 15 years are the age groups that are most secure financially, with 100.0% of males and 96.4% of females in these age groups living above the poverty line.
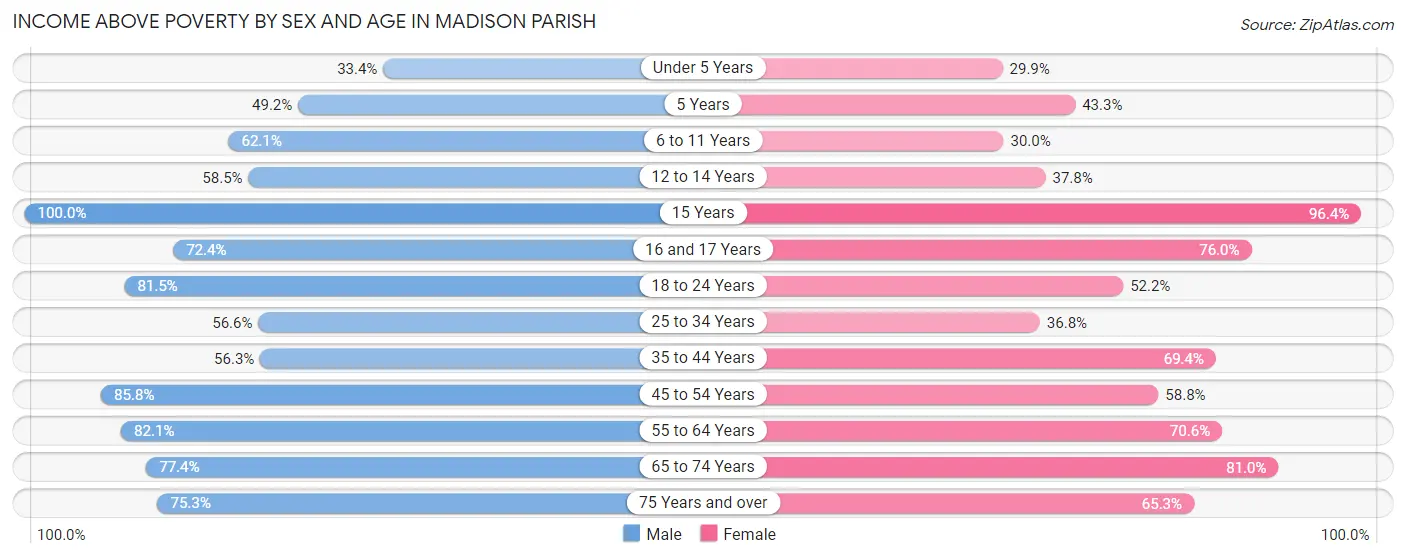
| Age Bracket | Male | Female |
| Under 5 Years | 102 (33.4%) | 120 (29.8%) |
| 5 Years | 64 (49.2%) | 39 (43.3%) |
| 6 to 11 Years | 215 (62.1%) | 142 (30.0%) |
| 12 to 14 Years | 114 (58.5%) | 59 (37.8%) |
| 15 Years | 36 (100.0%) | 134 (96.4%) |
| 16 and 17 Years | 105 (72.4%) | 57 (76.0%) |
| 18 to 24 Years | 312 (81.5%) | 211 (52.2%) |
| 25 to 34 Years | 175 (56.6%) | 164 (36.8%) |
| 35 to 44 Years | 224 (56.3%) | 286 (69.4%) |
| 45 to 54 Years | 290 (85.8%) | 325 (58.8%) |
| 55 to 64 Years | 412 (82.1%) | 458 (70.6%) |
| 65 to 74 Years | 370 (77.4%) | 427 (81.0%) |
| 75 Years and over | 183 (75.3%) | 213 (65.3%) |
| Total | 2,602 (68.3%) | 2,635 (56.6%) |
Income Below Poverty Among Married-Couple Families in Madison Parish
The poverty statistics for married-couple families in Madison Parish show that 10.1% or 100 of the total 987 families live below the poverty line. Families with 3 or 4 children have the highest poverty rate of 53.7%, comprising of 22 families. On the other hand, families with 5 or more children have the lowest poverty rate of 0.0%, which includes 0 families.
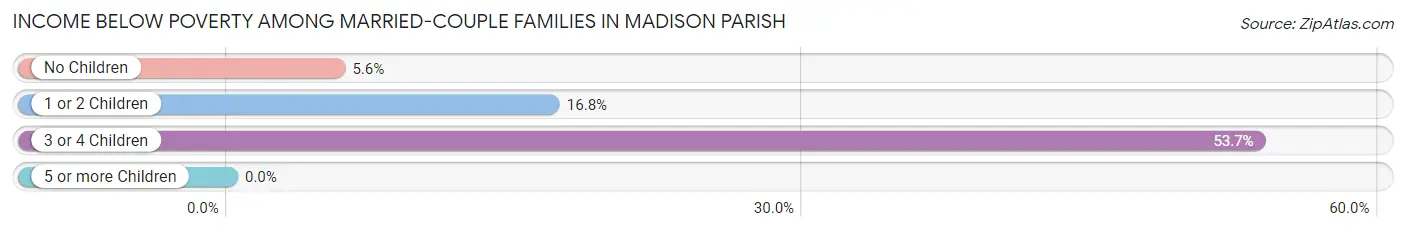
| Children | Above Poverty | Below Poverty |
| No Children | 656 (94.4%) | 39 (5.6%) |
| 1 or 2 Children | 193 (83.2%) | 39 (16.8%) |
| 3 or 4 Children | 19 (46.3%) | 22 (53.7%) |
| 5 or more Children | 19 (100.0%) | 0 (0.0%) |
| Total | 887 (89.9%) | 100 (10.1%) |
Income Below Poverty Among Single-Parent Households in Madison Parish
According to the poverty data in Madison Parish, 10.9% or 16 single-father households and 49.4% or 445 single-mother households are living below the poverty line. Among single-father households, those with no children have the highest poverty rate, with 12 households (12.0%) experiencing poverty. Likewise, among single-mother households, those with 3 or 4 children have the highest poverty rate, with 104 households (75.4%) falling below the poverty line.
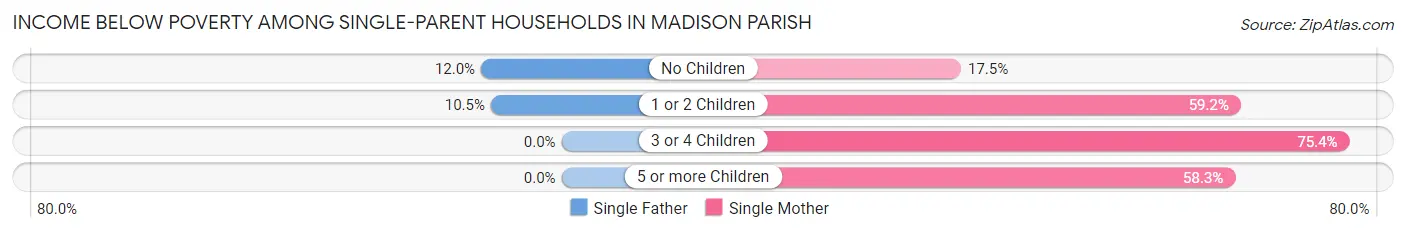
| Children | Single Father | Single Mother |
| No Children | 12 (12.0%) | 46 (17.5%) |
| 1 or 2 Children | 4 (10.5%) | 281 (59.2%) |
| 3 or 4 Children | 0 (0.0%) | 104 (75.4%) |
| 5 or more Children | 0 (0.0%) | 14 (58.3%) |
| Total | 16 (10.9%) | 445 (49.4%) |
Income Below Poverty Among Married-Couple vs Single-Parent Households in Madison Parish
The poverty data for Madison Parish shows that 100 of the married-couple family households (10.1%) and 461 of the single-parent households (44.0%) are living below the poverty level. Within the married-couple family households, those with 3 or 4 children have the highest poverty rate, with 22 households (53.7%) falling below the poverty line. Among the single-parent households, those with 3 or 4 children have the highest poverty rate, with 104 household (70.8%) living below poverty.
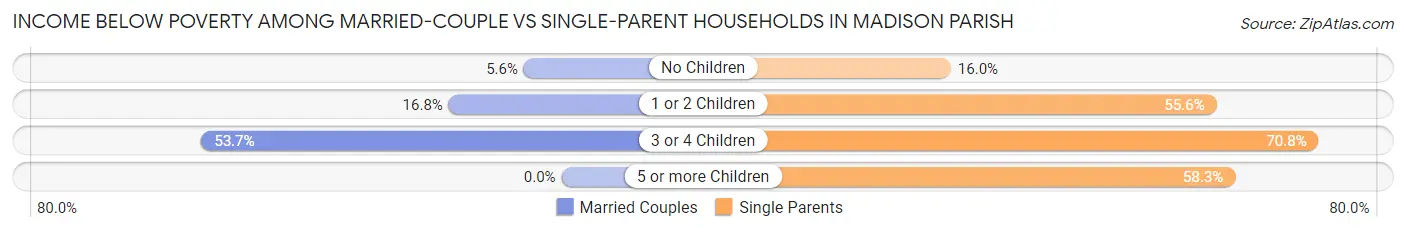
| Children | Married-Couple Families | Single-Parent Households |
| No Children | 39 (5.6%) | 58 (16.0%) |
| 1 or 2 Children | 39 (16.8%) | 285 (55.6%) |
| 3 or 4 Children | 22 (53.7%) | 104 (70.8%) |
| 5 or more Children | 0 (0.0%) | 14 (58.3%) |
| Total | 100 (10.1%) | 461 (44.0%) |
Employment Characteristics in Madison Parish
Employment by Class of Employer in Madison Parish
Among the 2,902 employed individuals in Madison Parish, private company employees (1,751 | 60.3%), local government employees (334 | 11.5%), and self-employed (not incorporated) (274 | 9.4%) make up the most common classes of employment.
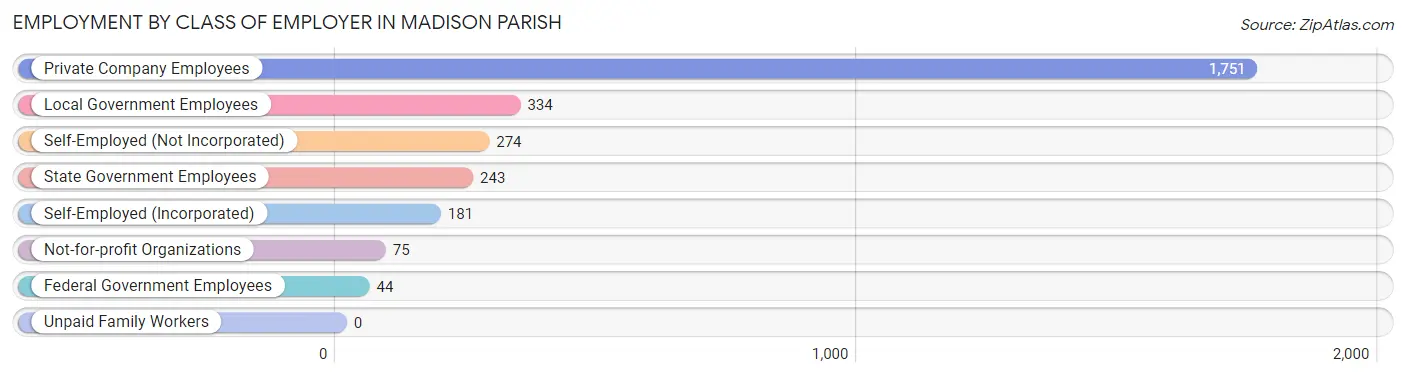
| Employer Class | # Employees | % Employees |
| Private Company Employees | 1,751 | 60.3% |
| Self-Employed (Incorporated) | 181 | 6.2% |
| Self-Employed (Not Incorporated) | 274 | 9.4% |
| Not-for-profit Organizations | 75 | 2.6% |
| Local Government Employees | 334 | 11.5% |
| State Government Employees | 243 | 8.4% |
| Federal Government Employees | 44 | 1.5% |
| Unpaid Family Workers | 0 | 0.0% |
| Total | 2,902 | 100.0% |
Employment Status by Age in Madison Parish
According to the labor force statistics for Madison Parish, out of the total population over 16 years of age (7,684), 40.9% or 3,143 individuals are in the labor force, with 5.8% or 182 of them unemployed. The age group with the highest labor force participation rate is 55 to 59 years, with 60.7% or 372 individuals in the labor force. Within the labor force, the 16 to 19 years age range has the highest percentage of unemployed individuals, with 19.5% or 33 of them being unemployed.
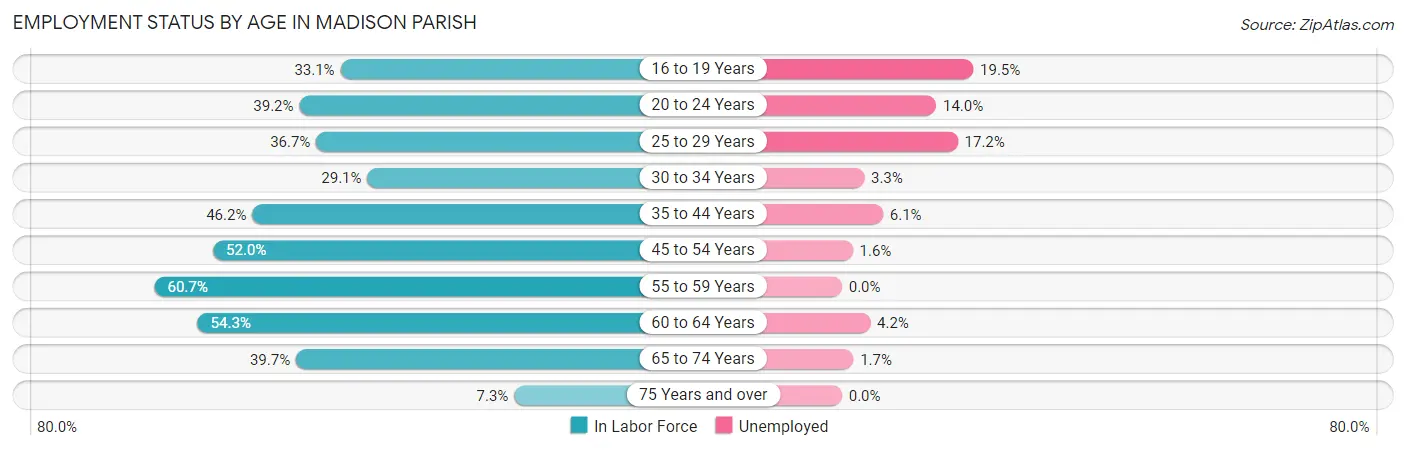
| Age Bracket | In Labor Force | Unemployed |
| 16 to 19 Years | 169 (33.1%) | 33 (19.5%) |
| 20 to 24 Years | 265 (39.2%) | 37 (14.0%) |
| 25 to 29 Years | 251 (36.7%) | 43 (17.2%) |
| 30 to 34 Years | 211 (29.1%) | 7 (3.3%) |
| 35 to 44 Years | 539 (46.2%) | 33 (6.1%) |
| 45 to 54 Years | 551 (52.0%) | 9 (1.6%) |
| 55 to 59 Years | 372 (60.7%) | 0 (0.0%) |
| 60 to 64 Years | 336 (54.3%) | 14 (4.2%) |
| 65 to 74 Years | 409 (39.7%) | 7 (1.7%) |
| 75 Years and over | 44 (7.3%) | 0 (0.0%) |
| Total | 3,143 (40.9%) | 182 (5.8%) |
Employment Status by Educational Attainment in Madison Parish
According to labor force statistics for Madison Parish, 46.5% of individuals (2,262) out of the total population between 25 and 64 years of age (4,865) are in the labor force, with 4.7% or 106 of them being unemployed. The group with the highest labor force participation rate are those with the educational attainment of bachelor's degree or higher, with 84.5% or 563 individuals in the labor force. Within the labor force, individuals with high school diploma education have the highest percentage of unemployment, with 5.6% or 48 of them being unemployed.
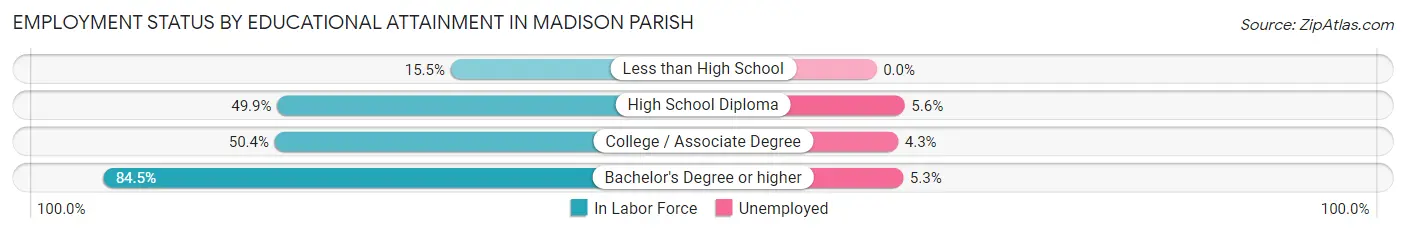
| Educational Attainment | In Labor Force | Unemployed |
| Less than High School | 183 (15.5%) | 0 (0.0%) |
| High School Diploma | 864 (49.9%) | 97 (5.6%) |
| College / Associate Degree | 650 (50.4%) | 55 (4.3%) |
| Bachelor's Degree or higher | 563 (84.5%) | 35 (5.3%) |
| Total | 2,262 (46.5%) | 229 (4.7%) |
Employment Occupations by Sex in Madison Parish
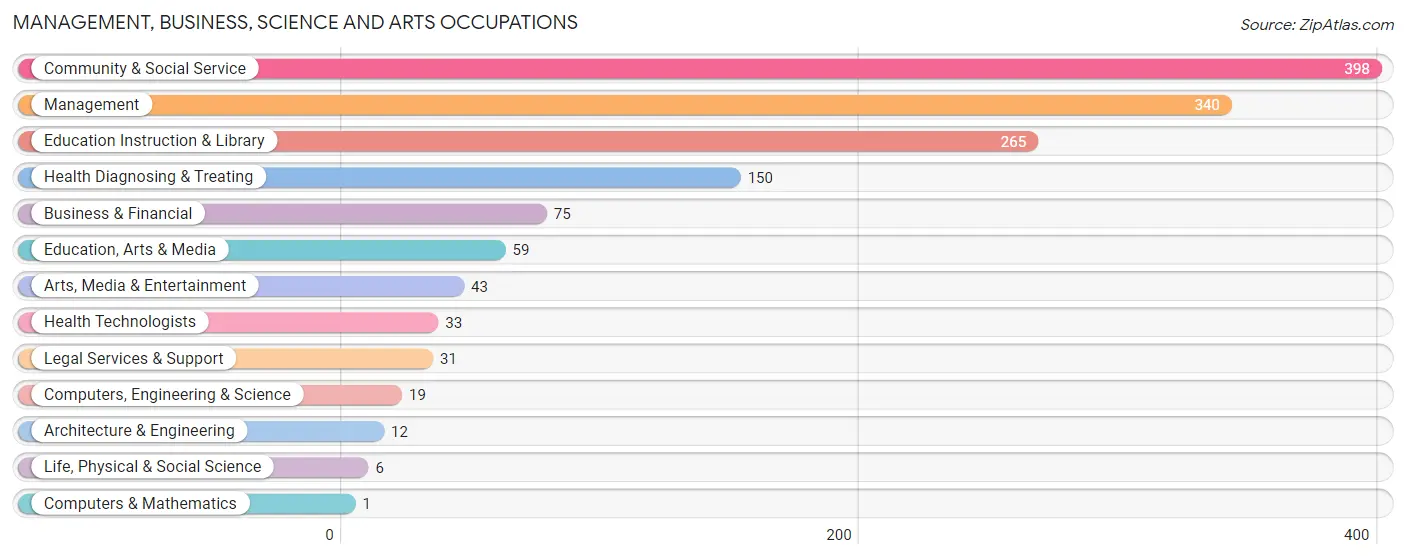
Management, Business, Science and Arts Occupations
The most common Management, Business, Science and Arts occupations in Madison Parish are Community & Social Service (398 | 13.4%), Management (340 | 11.5%), Education Instruction & Library (265 | 8.9%), Health Diagnosing & Treating (150 | 5.1%), and Business & Financial (75 | 2.5%).
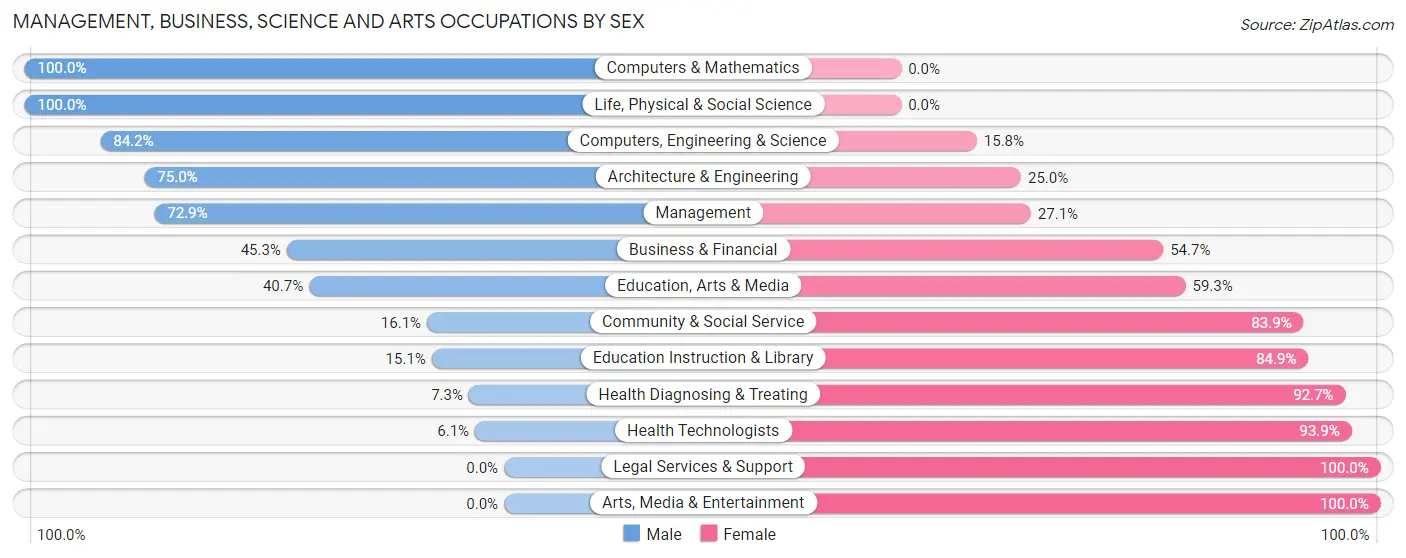
Management, Business, Science and Arts Occupations by Sex
Within the Management, Business, Science and Arts occupations in Madison Parish, the most male-oriented occupations are Computers & Mathematics (100.0%), Life, Physical & Social Science (100.0%), and Computers, Engineering & Science (84.2%), while the most female-oriented occupations are Legal Services & Support (100.0%), Arts, Media & Entertainment (100.0%), and Health Technologists (93.9%).
| Occupation | Male | Female |
| Management | 248 (72.9%) | 92 (27.1%) |
| Business & Financial | 34 (45.3%) | 41 (54.7%) |
| Computers, Engineering & Science | 16 (84.2%) | 3 (15.8%) |
| Computers & Mathematics | 1 (100.0%) | 0 (0.0%) |
| Architecture & Engineering | 9 (75.0%) | 3 (25.0%) |
| Life, Physical & Social Science | 6 (100.0%) | 0 (0.0%) |
| Community & Social Service | 64 (16.1%) | 334 (83.9%) |
| Education, Arts & Media | 24 (40.7%) | 35 (59.3%) |
| Legal Services & Support | 0 (0.0%) | 31 (100.0%) |
| Education Instruction & Library | 40 (15.1%) | 225 (84.9%) |
| Arts, Media & Entertainment | 0 (0.0%) | 43 (100.0%) |
| Health Diagnosing & Treating | 11 (7.3%) | 139 (92.7%) |
| Health Technologists | 2 (6.1%) | 31 (93.9%) |
| Total (Category) | 373 (38.0%) | 609 (62.0%) |
| Total (Overall) | 1,278 (43.1%) | 1,684 (56.9%) |
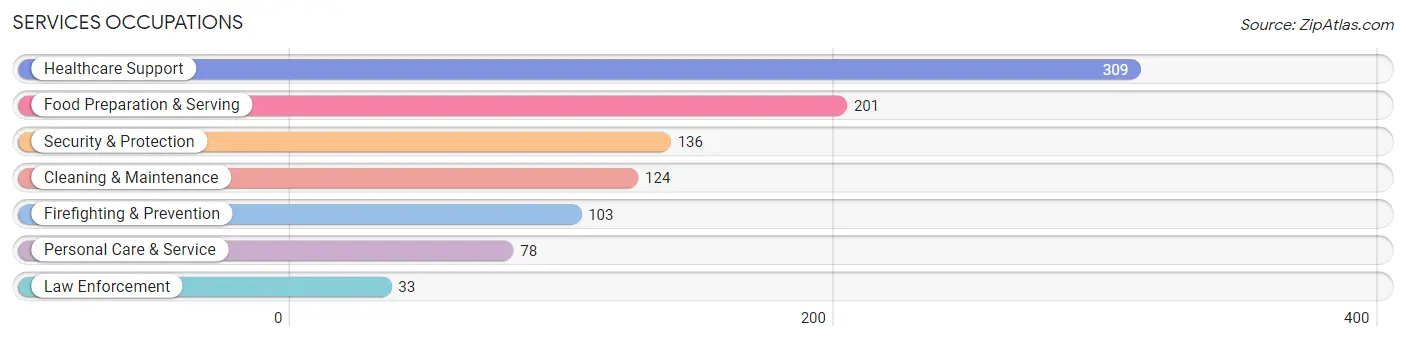
Services Occupations
The most common Services occupations in Madison Parish are Healthcare Support (309 | 10.4%), Food Preparation & Serving (201 | 6.8%), Security & Protection (136 | 4.6%), Cleaning & Maintenance (124 | 4.2%), and Firefighting & Prevention (103 | 3.5%).
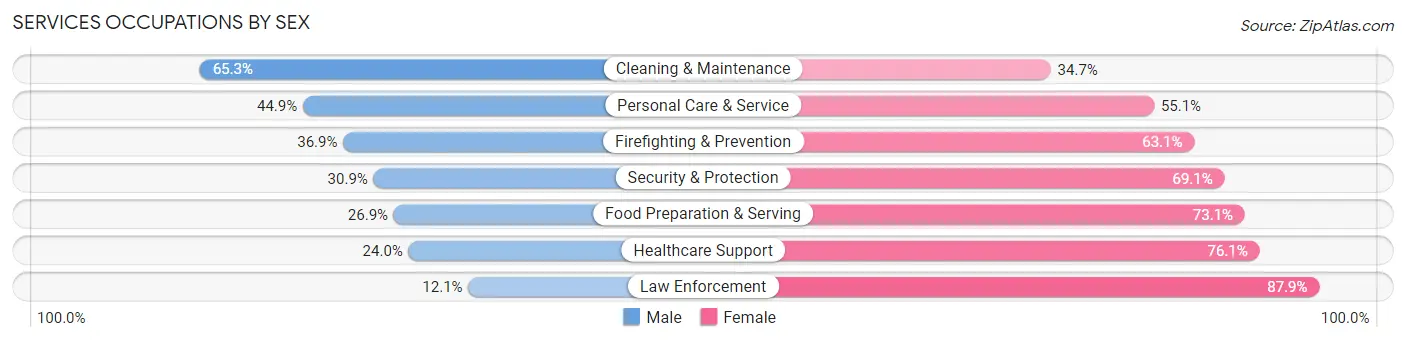
Services Occupations by Sex
Within the Services occupations in Madison Parish, the most male-oriented occupations are Cleaning & Maintenance (65.3%), Personal Care & Service (44.9%), and Firefighting & Prevention (36.9%), while the most female-oriented occupations are Law Enforcement (87.9%), Healthcare Support (76.0%), and Food Preparation & Serving (73.1%).
| Occupation | Male | Female |
| Healthcare Support | 74 (23.9%) | 235 (76.0%) |
| Security & Protection | 42 (30.9%) | 94 (69.1%) |
| Firefighting & Prevention | 38 (36.9%) | 65 (63.1%) |
| Law Enforcement | 4 (12.1%) | 29 (87.9%) |
| Food Preparation & Serving | 54 (26.9%) | 147 (73.1%) |
| Cleaning & Maintenance | 81 (65.3%) | 43 (34.7%) |
| Personal Care & Service | 35 (44.9%) | 43 (55.1%) |
| Total (Category) | 286 (33.7%) | 562 (66.3%) |
| Total (Overall) | 1,278 (43.1%) | 1,684 (56.9%) |
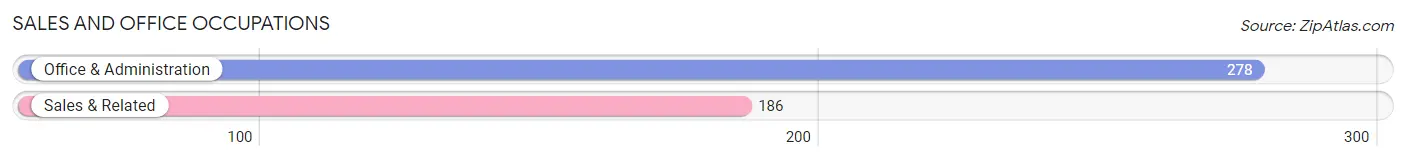
Sales and Office Occupations
The most common Sales and Office occupations in Madison Parish are Office & Administration (278 | 9.4%), and Sales & Related (186 | 6.3%).
Sales and Office Occupations by Sex
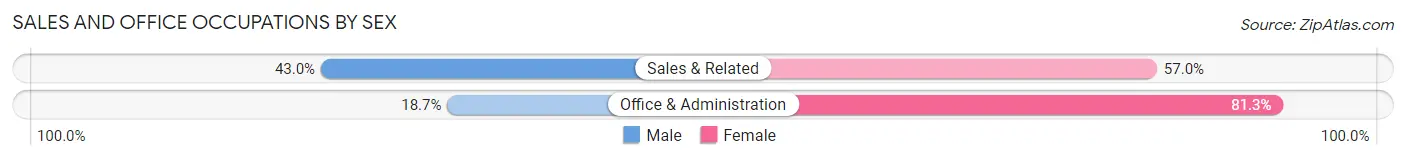
| Occupation | Male | Female |
| Sales & Related | 80 (43.0%) | 106 (57.0%) |
| Office & Administration | 52 (18.7%) | 226 (81.3%) |
| Total (Category) | 132 (28.4%) | 332 (71.6%) |
| Total (Overall) | 1,278 (43.1%) | 1,684 (56.9%) |
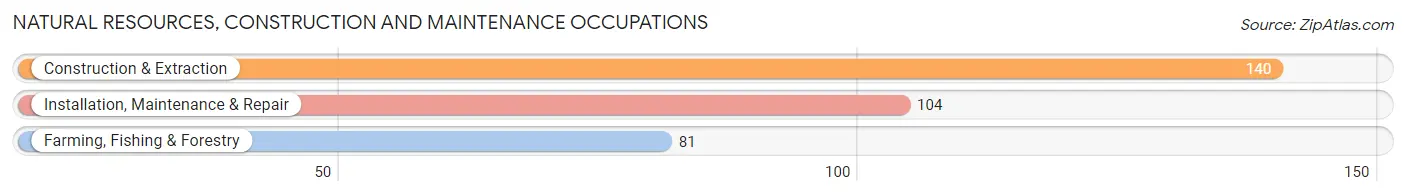
Natural Resources, Construction and Maintenance Occupations
The most common Natural Resources, Construction and Maintenance occupations in Madison Parish are Construction & Extraction (140 | 4.7%), Installation, Maintenance & Repair (104 | 3.5%), and Farming, Fishing & Forestry (81 | 2.7%).
Natural Resources, Construction and Maintenance Occupations by Sex
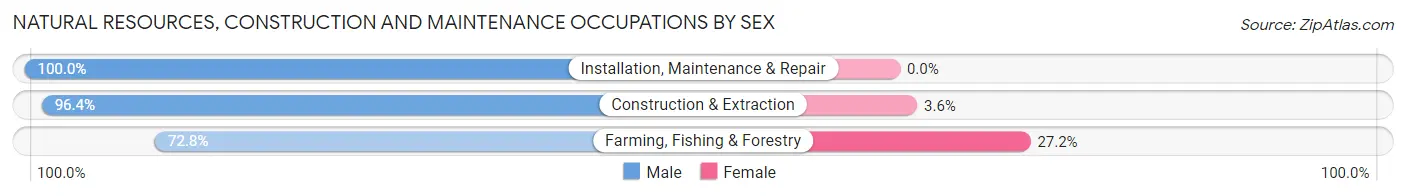
| Occupation | Male | Female |
| Farming, Fishing & Forestry | 59 (72.8%) | 22 (27.2%) |
| Construction & Extraction | 135 (96.4%) | 5 (3.6%) |
| Installation, Maintenance & Repair | 104 (100.0%) | 0 (0.0%) |
| Total (Category) | 298 (91.7%) | 27 (8.3%) |
| Total (Overall) | 1,278 (43.1%) | 1,684 (56.9%) |
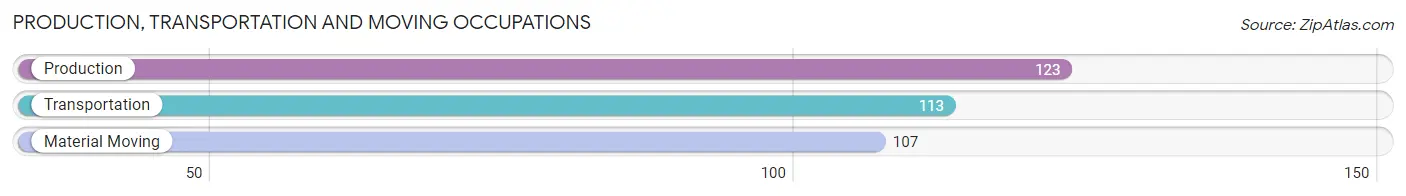
Production, Transportation and Moving Occupations
The most common Production, Transportation and Moving occupations in Madison Parish are Production (123 | 4.2%), Transportation (113 | 3.8%), and Material Moving (107 | 3.6%).
Production, Transportation and Moving Occupations by Sex
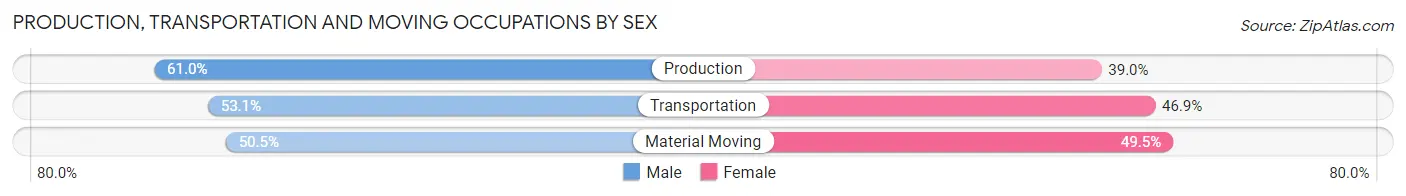
| Occupation | Male | Female |
| Production | 75 (61.0%) | 48 (39.0%) |
| Transportation | 60 (53.1%) | 53 (46.9%) |
| Material Moving | 54 (50.5%) | 53 (49.5%) |
| Total (Category) | 189 (55.1%) | 154 (44.9%) |
| Total (Overall) | 1,278 (43.1%) | 1,684 (56.9%) |
Employment Industries by Sex in Madison Parish
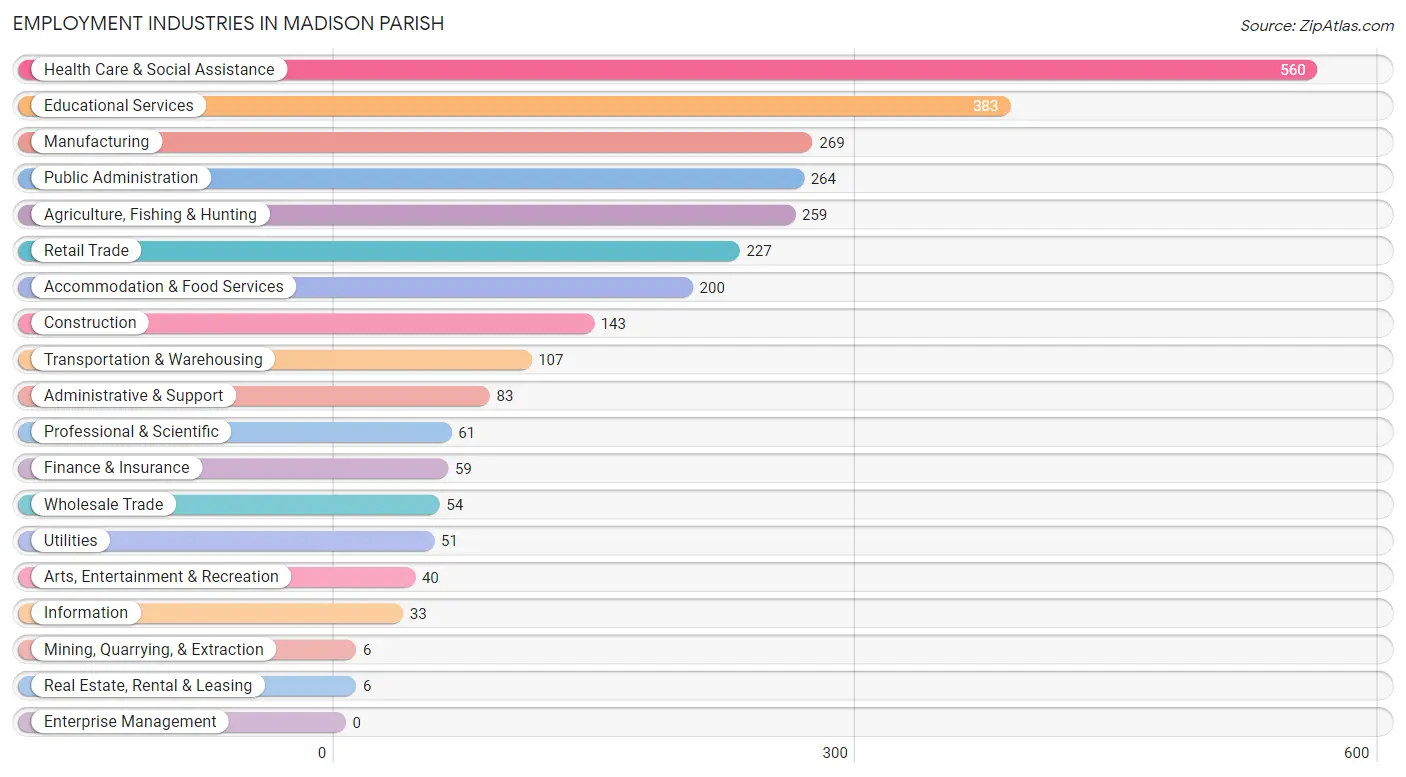
Employment Industries in Madison Parish
The major employment industries in Madison Parish include Health Care & Social Assistance (560 | 18.9%), Educational Services (383 | 12.9%), Manufacturing (269 | 9.1%), Public Administration (264 | 8.9%), and Agriculture, Fishing & Hunting (259 | 8.7%).
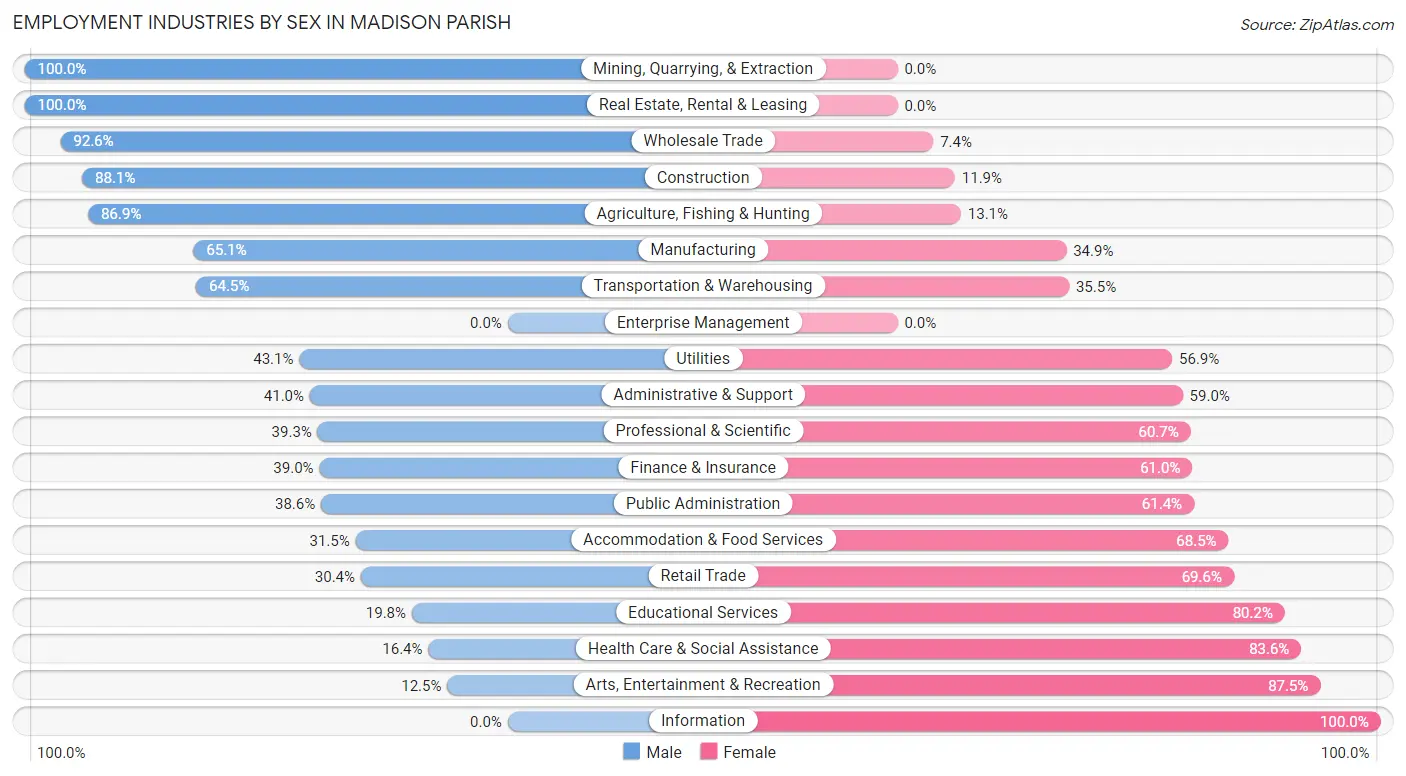
Employment Industries by Sex in Madison Parish
The Madison Parish industries that see more men than women are Mining, Quarrying, & Extraction (100.0%), Real Estate, Rental & Leasing (100.0%), and Wholesale Trade (92.6%), whereas the industries that tend to have a higher number of women are Information (100.0%), Arts, Entertainment & Recreation (87.5%), and Health Care & Social Assistance (83.6%).
| Industry | Male | Female |
| Agriculture, Fishing & Hunting | 225 (86.9%) | 34 (13.1%) |
| Mining, Quarrying, & Extraction | 6 (100.0%) | 0 (0.0%) |
| Construction | 126 (88.1%) | 17 (11.9%) |
| Manufacturing | 175 (65.1%) | 94 (34.9%) |
| Wholesale Trade | 50 (92.6%) | 4 (7.4%) |
| Retail Trade | 69 (30.4%) | 158 (69.6%) |
| Transportation & Warehousing | 69 (64.5%) | 38 (35.5%) |
| Utilities | 22 (43.1%) | 29 (56.9%) |
| Information | 0 (0.0%) | 33 (100.0%) |
| Finance & Insurance | 23 (39.0%) | 36 (61.0%) |
| Real Estate, Rental & Leasing | 6 (100.0%) | 0 (0.0%) |
| Professional & Scientific | 24 (39.3%) | 37 (60.7%) |
| Enterprise Management | 0 (0.0%) | 0 (0.0%) |
| Administrative & Support | 34 (41.0%) | 49 (59.0%) |
| Educational Services | 76 (19.8%) | 307 (80.2%) |
| Health Care & Social Assistance | 92 (16.4%) | 468 (83.6%) |
| Arts, Entertainment & Recreation | 5 (12.5%) | 35 (87.5%) |
| Accommodation & Food Services | 63 (31.5%) | 137 (68.5%) |
| Public Administration | 102 (38.6%) | 162 (61.4%) |
| Total | 1,278 (43.1%) | 1,684 (56.9%) |
Education in Madison Parish
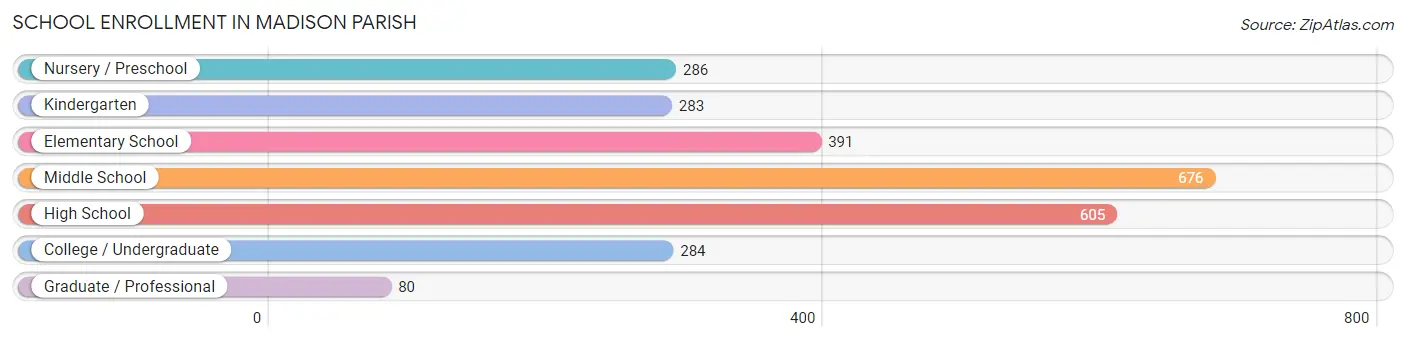
School Enrollment in Madison Parish
The most common levels of schooling among the 2,605 students in Madison Parish are middle school (676 | 26.0%), high school (605 | 23.2%), and elementary school (391 | 15.0%).
| School Level | # Students | % Students |
| Nursery / Preschool | 286 | 11.0% |
| Kindergarten | 283 | 10.9% |
| Elementary School | 391 | 15.0% |
| Middle School | 676 | 26.0% |
| High School | 605 | 23.2% |
| College / Undergraduate | 284 | 10.9% |
| Graduate / Professional | 80 | 3.1% |
| Total | 2,605 | 100.0% |
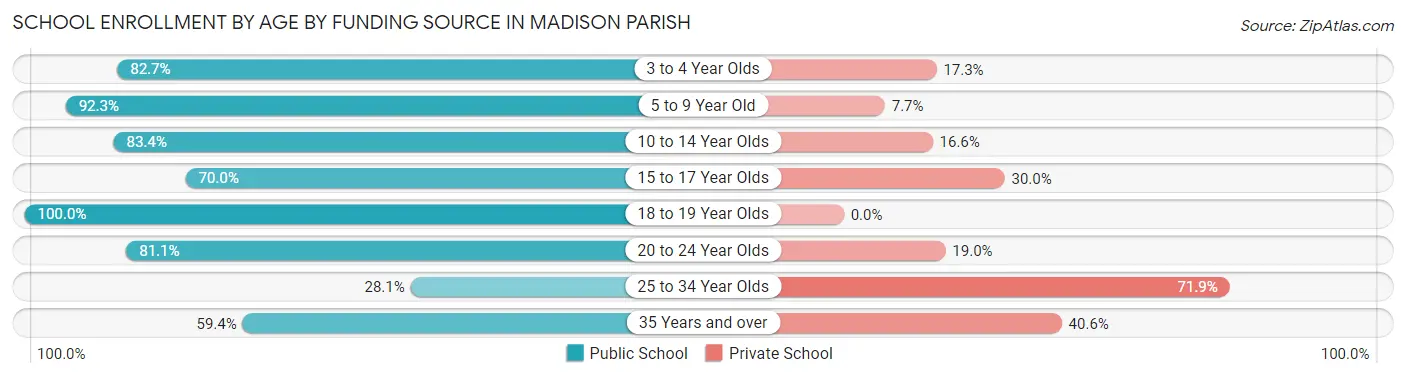
School Enrollment by Age by Funding Source in Madison Parish
Out of a total of 2,605 students who are enrolled in schools in Madison Parish, 539 (20.7%) attend a private institution, while the remaining 2,066 (79.3%) are enrolled in public schools. The age group of 25 to 34 year olds has the highest likelihood of being enrolled in private schools, with 138 (71.9% in the age bracket) enrolled. Conversely, the age group of 18 to 19 year olds has the lowest likelihood of being enrolled in a private school, with 153 (100.0% in the age bracket) attending a public institution.
| Age Bracket | Public School | Private School |
| 3 to 4 Year Olds | 225 (82.7%) | 47 (17.3%) |
| 5 to 9 Year Old | 627 (92.3%) | 52 (7.7%) |
| 10 to 14 Year Olds | 579 (83.4%) | 115 (16.6%) |
| 15 to 17 Year Olds | 271 (70.0%) | 116 (30.0%) |
| 18 to 19 Year Olds | 153 (100.0%) | 0 (0.0%) |
| 20 to 24 Year Olds | 77 (81.0%) | 18 (19.0%) |
| 25 to 34 Year Olds | 54 (28.1%) | 138 (71.9%) |
| 35 Years and over | 79 (59.4%) | 54 (40.6%) |
| Total | 2,066 (79.3%) | 539 (20.7%) |
Educational Attainment by Field of Study in Madison Parish
Business (204 | 21.3%), education (195 | 20.3%), bio, nature & agricultural (128 | 13.4%), arts & humanities (99 | 10.3%), and engineering (71 | 7.4%) are the most common fields of study among 959 individuals in Madison Parish who have obtained a bachelor's degree or higher.
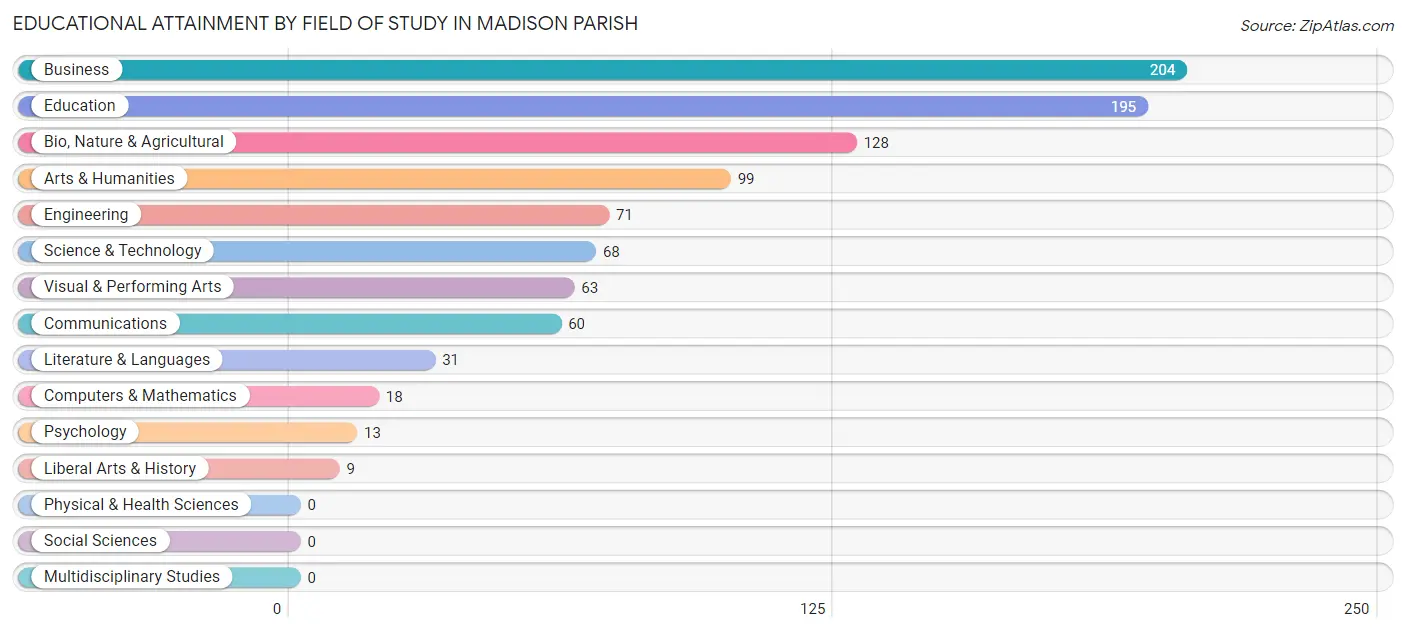
| Field of Study | # Graduates | % Graduates |
| Computers & Mathematics | 18 | 1.9% |
| Bio, Nature & Agricultural | 128 | 13.4% |
| Physical & Health Sciences | 0 | 0.0% |
| Psychology | 13 | 1.4% |
| Social Sciences | 0 | 0.0% |
| Engineering | 71 | 7.4% |
| Multidisciplinary Studies | 0 | 0.0% |
| Science & Technology | 68 | 7.1% |
| Business | 204 | 21.3% |
| Education | 195 | 20.3% |
| Literature & Languages | 31 | 3.2% |
| Liberal Arts & History | 9 | 0.9% |
| Visual & Performing Arts | 63 | 6.6% |
| Communications | 60 | 6.3% |
| Arts & Humanities | 99 | 10.3% |
| Total | 959 | 100.0% |
Transportation & Commute in Madison Parish
Vehicle Availability by Sex in Madison Parish
The most prevalent vehicle ownership categories in Madison Parish are males with 2 vehicles (665, accounting for 53.5%) and females with 2 vehicles (699, making up 40.2%).
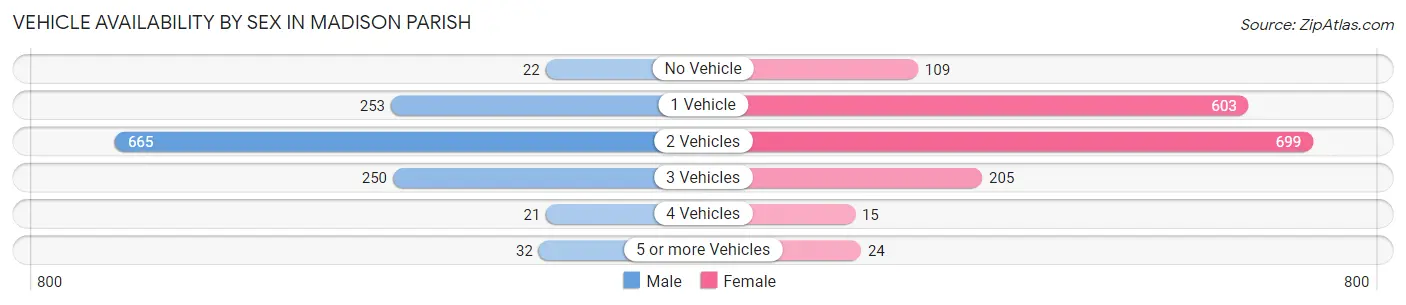
| Vehicles Available | Male | Female |
| No Vehicle | 22 (1.8%) | 109 (6.6%) |
| 1 Vehicle | 253 (20.3%) | 603 (36.4%) |
| 2 Vehicles | 665 (53.5%) | 699 (42.2%) |
| 3 Vehicles | 250 (20.1%) | 205 (12.4%) |
| 4 Vehicles | 21 (1.7%) | 15 (0.9%) |
| 5 or more Vehicles | 32 (2.6%) | 24 (1.5%) |
| Total | 1,243 (100.0%) | 1,655 (100.0%) |
Commute Time in Madison Parish
The most frequently occuring commute durations in Madison Parish are 5 to 9 minutes (708 commuters, 25.0%), 10 to 14 minutes (431 commuters, 15.2%), and 20 to 24 minutes (396 commuters, 14.0%).
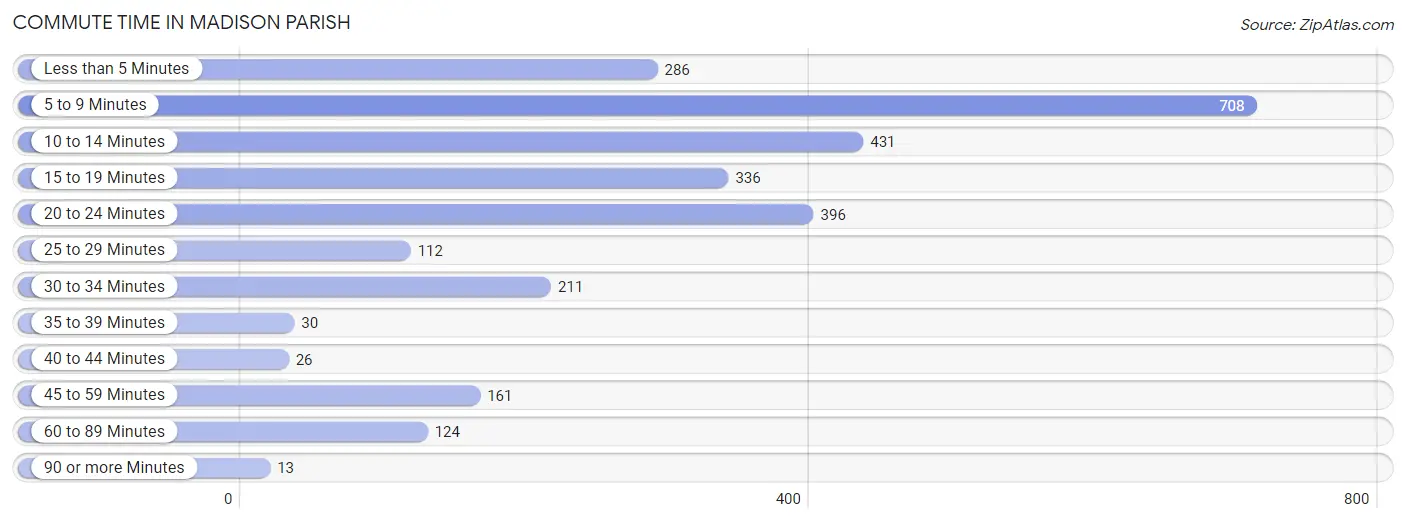
| Commute Time | # Commuters | % Commuters |
| Less than 5 Minutes | 286 | 10.1% |
| 5 to 9 Minutes | 708 | 25.0% |
| 10 to 14 Minutes | 431 | 15.2% |
| 15 to 19 Minutes | 336 | 11.9% |
| 20 to 24 Minutes | 396 | 14.0% |
| 25 to 29 Minutes | 112 | 4.0% |
| 30 to 34 Minutes | 211 | 7.4% |
| 35 to 39 Minutes | 30 | 1.1% |
| 40 to 44 Minutes | 26 | 0.9% |
| 45 to 59 Minutes | 161 | 5.7% |
| 60 to 89 Minutes | 124 | 4.4% |
| 90 or more Minutes | 13 | 0.5% |
Commute Time by Sex in Madison Parish
The most common commute times in Madison Parish are 20 to 24 minutes (215 commuters, 17.7%) for males and 5 to 9 minutes (516 commuters, 31.8%) for females.
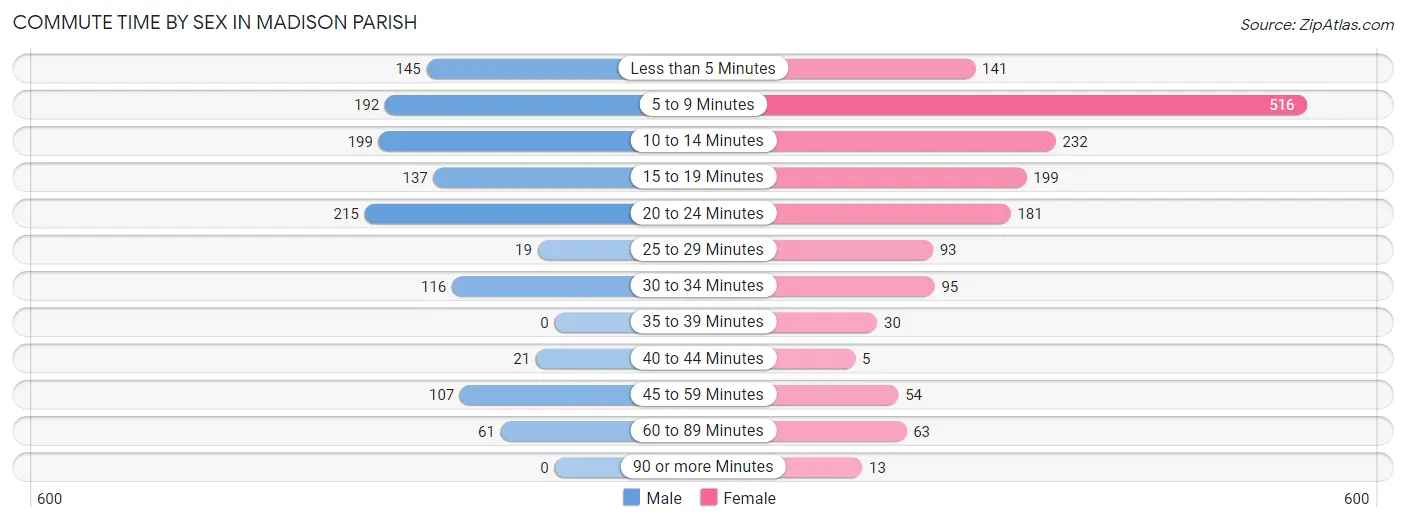
| Commute Time | Male | Female |
| Less than 5 Minutes | 145 (12.0%) | 141 (8.7%) |
| 5 to 9 Minutes | 192 (15.8%) | 516 (31.8%) |
| 10 to 14 Minutes | 199 (16.4%) | 232 (14.3%) |
| 15 to 19 Minutes | 137 (11.3%) | 199 (12.3%) |
| 20 to 24 Minutes | 215 (17.7%) | 181 (11.2%) |
| 25 to 29 Minutes | 19 (1.6%) | 93 (5.7%) |
| 30 to 34 Minutes | 116 (9.6%) | 95 (5.9%) |
| 35 to 39 Minutes | 0 (0.0%) | 30 (1.8%) |
| 40 to 44 Minutes | 21 (1.7%) | 5 (0.3%) |
| 45 to 59 Minutes | 107 (8.8%) | 54 (3.3%) |
| 60 to 89 Minutes | 61 (5.0%) | 63 (3.9%) |
| 90 or more Minutes | 0 (0.0%) | 13 (0.8%) |
Time of Departure to Work by Sex in Madison Parish
The most frequent times of departure to work in Madison Parish are 7:30 AM to 7:59 AM (210, 17.3%) for males and 7:30 AM to 7:59 AM (428, 26.4%) for females.
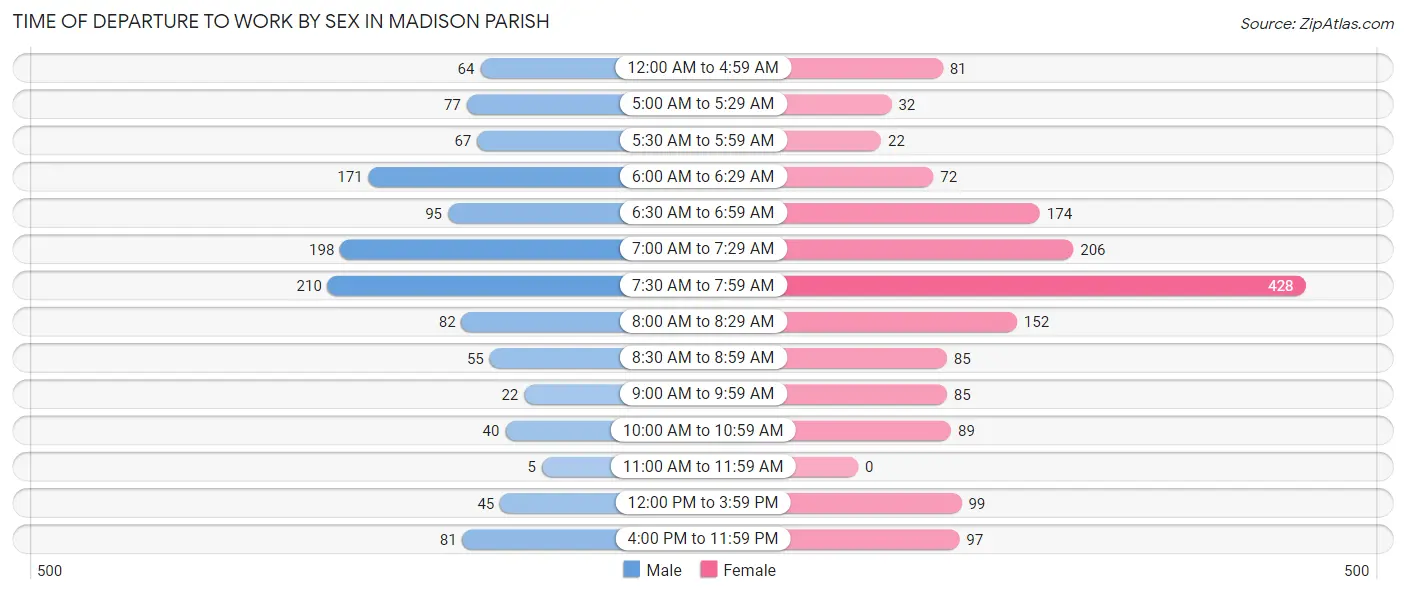
| Time of Departure | Male | Female |
| 12:00 AM to 4:59 AM | 64 (5.3%) | 81 (5.0%) |
| 5:00 AM to 5:29 AM | 77 (6.4%) | 32 (2.0%) |
| 5:30 AM to 5:59 AM | 67 (5.5%) | 22 (1.4%) |
| 6:00 AM to 6:29 AM | 171 (14.1%) | 72 (4.4%) |
| 6:30 AM to 6:59 AM | 95 (7.8%) | 174 (10.7%) |
| 7:00 AM to 7:29 AM | 198 (16.3%) | 206 (12.7%) |
| 7:30 AM to 7:59 AM | 210 (17.3%) | 428 (26.4%) |
| 8:00 AM to 8:29 AM | 82 (6.8%) | 152 (9.4%) |
| 8:30 AM to 8:59 AM | 55 (4.5%) | 85 (5.2%) |
| 9:00 AM to 9:59 AM | 22 (1.8%) | 85 (5.2%) |
| 10:00 AM to 10:59 AM | 40 (3.3%) | 89 (5.5%) |
| 11:00 AM to 11:59 AM | 5 (0.4%) | 0 (0.0%) |
| 12:00 PM to 3:59 PM | 45 (3.7%) | 99 (6.1%) |
| 4:00 PM to 11:59 PM | 81 (6.7%) | 97 (6.0%) |
| Total | 1,212 (100.0%) | 1,622 (100.0%) |
Housing Occupancy in Madison Parish
Occupancy by Ownership in Madison Parish
Of the total 3,092 dwellings in Madison Parish, owner-occupied units account for 1,713 (55.4%), while renter-occupied units make up 1,379 (44.6%).
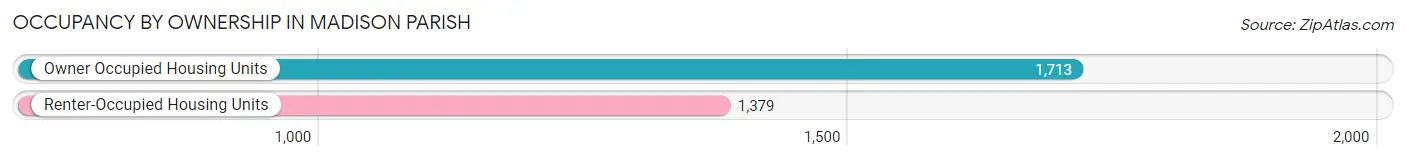
| Occupancy | # Housing Units | % Housing Units |
| Owner Occupied Housing Units | 1,713 | 55.4% |
| Renter-Occupied Housing Units | 1,379 | 44.6% |
| Total Occupied Housing Units | 3,092 | 100.0% |
Occupancy by Household Size in Madison Parish
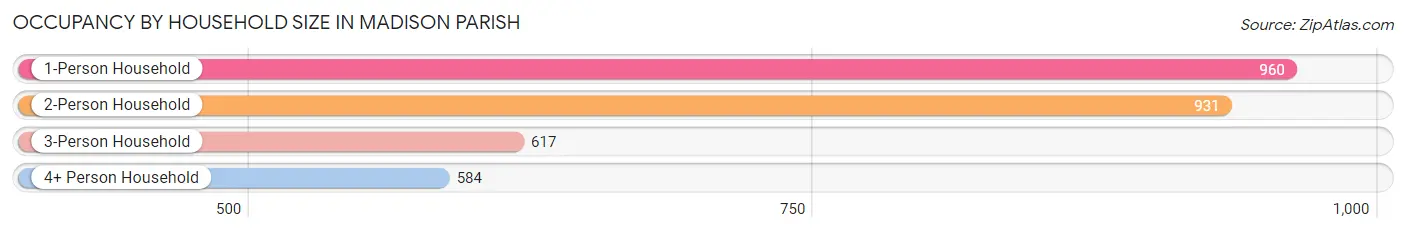
| Household Size | # Housing Units | % Housing Units |
| 1-Person Household | 960 | 31.0% |
| 2-Person Household | 931 | 30.1% |
| 3-Person Household | 617 | 20.0% |
| 4+ Person Household | 584 | 18.9% |
| Total Housing Units | 3,092 | 100.0% |
Occupancy by Ownership by Household Size in Madison Parish
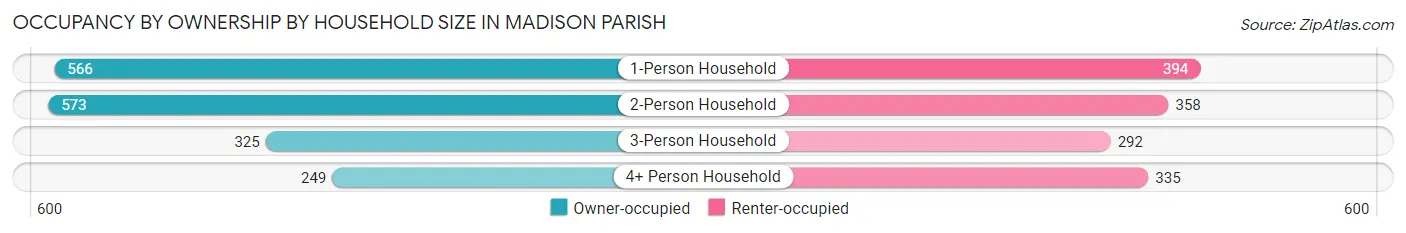
| Household Size | Owner-occupied | Renter-occupied |
| 1-Person Household | 566 (59.0%) | 394 (41.0%) |
| 2-Person Household | 573 (61.6%) | 358 (38.5%) |
| 3-Person Household | 325 (52.7%) | 292 (47.3%) |
| 4+ Person Household | 249 (42.6%) | 335 (57.4%) |
| Total Housing Units | 1,713 (55.4%) | 1,379 (44.6%) |
Occupancy by Educational Attainment in Madison Parish
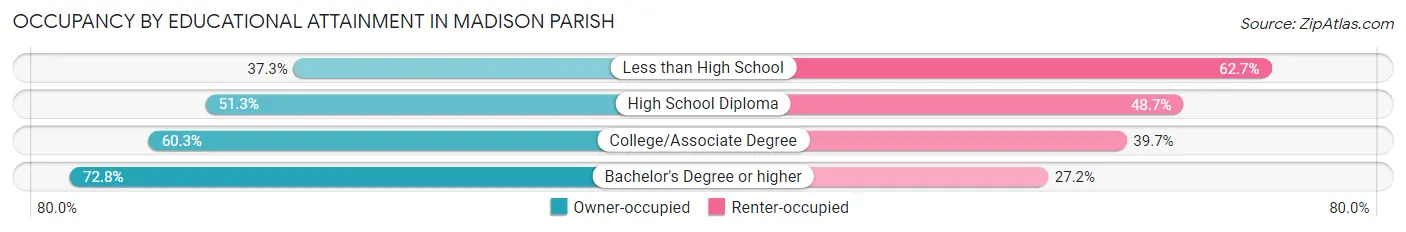
| Household Size | Owner-occupied | Renter-occupied |
| Less than High School | 162 (37.3%) | 272 (62.7%) |
| High School Diploma | 630 (51.3%) | 598 (48.7%) |
| College/Associate Degree | 579 (60.3%) | 381 (39.7%) |
| Bachelor's Degree or higher | 342 (72.8%) | 128 (27.2%) |
Occupancy by Age of Householder in Madison Parish
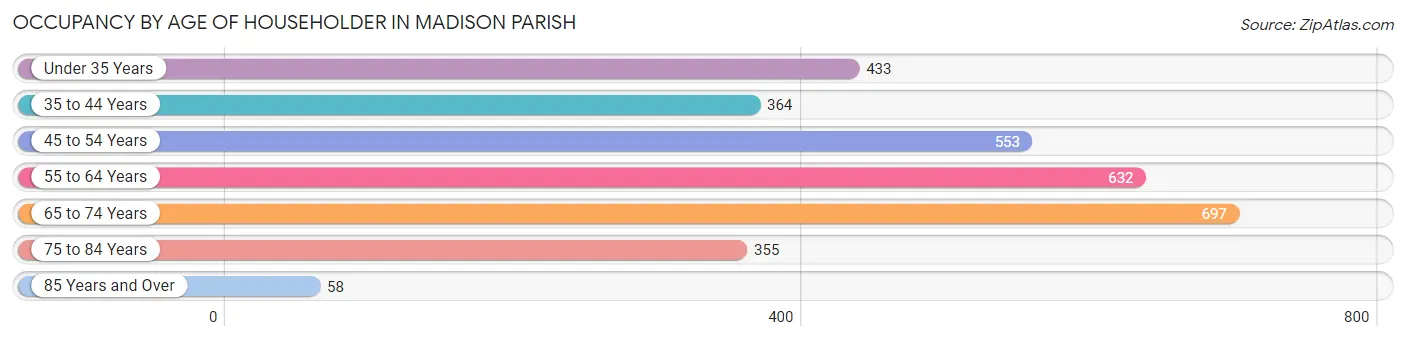
| Age Bracket | # Households | % Households |
| Under 35 Years | 433 | 14.0% |
| 35 to 44 Years | 364 | 11.8% |
| 45 to 54 Years | 553 | 17.9% |
| 55 to 64 Years | 632 | 20.4% |
| 65 to 74 Years | 697 | 22.5% |
| 75 to 84 Years | 355 | 11.5% |
| 85 Years and Over | 58 | 1.9% |
| Total | 3,092 | 100.0% |
Housing Finances in Madison Parish
Median Income by Occupancy in Madison Parish
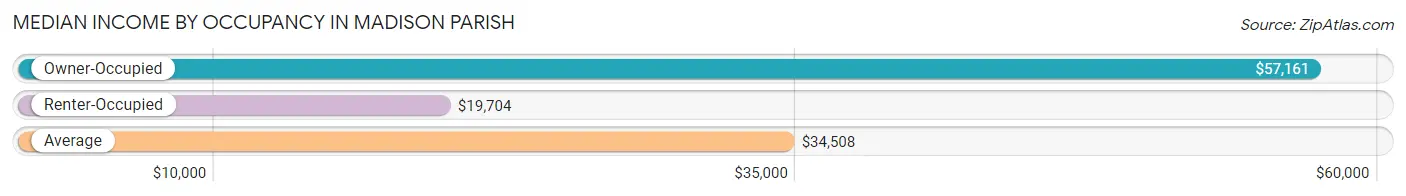
| Occupancy Type | # Households | Median Income |
| Owner-Occupied | 1,713 (55.4%) | $57,161 |
| Renter-Occupied | 1,379 (44.6%) | $19,704 |
| Average | 3,092 (100.0%) | $34,508 |
Occupancy by Householder Income Bracket in Madison Parish
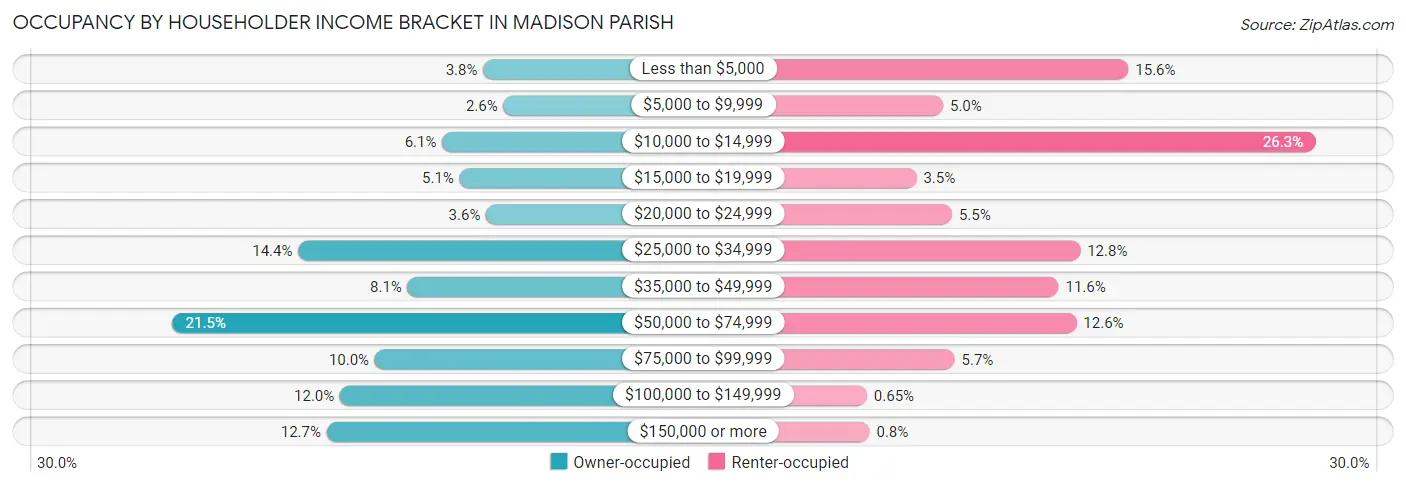
| Income Bracket | Owner-occupied | Renter-occupied |
| Less than $5,000 | 65 (3.8%) | 215 (15.6%) |
| $5,000 to $9,999 | 45 (2.6%) | 69 (5.0%) |
| $10,000 to $14,999 | 105 (6.1%) | 362 (26.3%) |
| $15,000 to $19,999 | 88 (5.1%) | 48 (3.5%) |
| $20,000 to $24,999 | 62 (3.6%) | 76 (5.5%) |
| $25,000 to $34,999 | 246 (14.4%) | 177 (12.8%) |
| $35,000 to $49,999 | 139 (8.1%) | 160 (11.6%) |
| $50,000 to $74,999 | 369 (21.5%) | 174 (12.6%) |
| $75,000 to $99,999 | 171 (10.0%) | 78 (5.7%) |
| $100,000 to $149,999 | 205 (12.0%) | 9 (0.6%) |
| $150,000 or more | 218 (12.7%) | 11 (0.8%) |
| Total | 1,713 (100.0%) | 1,379 (100.0%) |
Monthly Housing Cost Tiers in Madison Parish
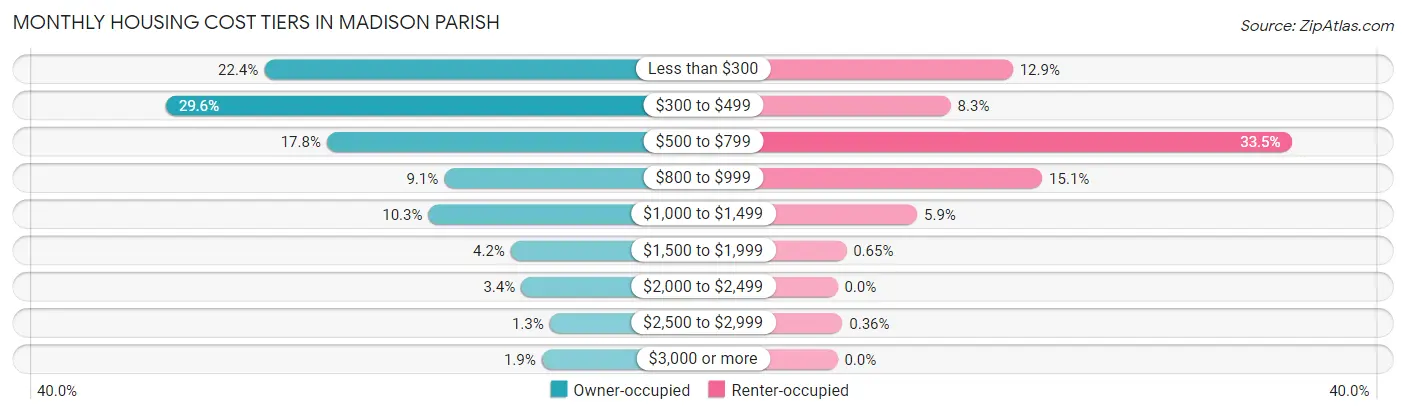
| Monthly Cost | Owner-occupied | Renter-occupied |
| Less than $300 | 383 (22.4%) | 178 (12.9%) |
| $300 to $499 | 507 (29.6%) | 115 (8.3%) |
| $500 to $799 | 304 (17.7%) | 462 (33.5%) |
| $800 to $999 | 156 (9.1%) | 208 (15.1%) |
| $1,000 to $1,499 | 176 (10.3%) | 81 (5.9%) |
| $1,500 to $1,999 | 72 (4.2%) | 9 (0.6%) |
| $2,000 to $2,499 | 59 (3.4%) | 0 (0.0%) |
| $2,500 to $2,999 | 23 (1.3%) | 5 (0.4%) |
| $3,000 or more | 33 (1.9%) | 0 (0.0%) |
| Total | 1,713 (100.0%) | 1,379 (100.0%) |
Physical Housing Characteristics in Madison Parish
Housing Structures in Madison Parish
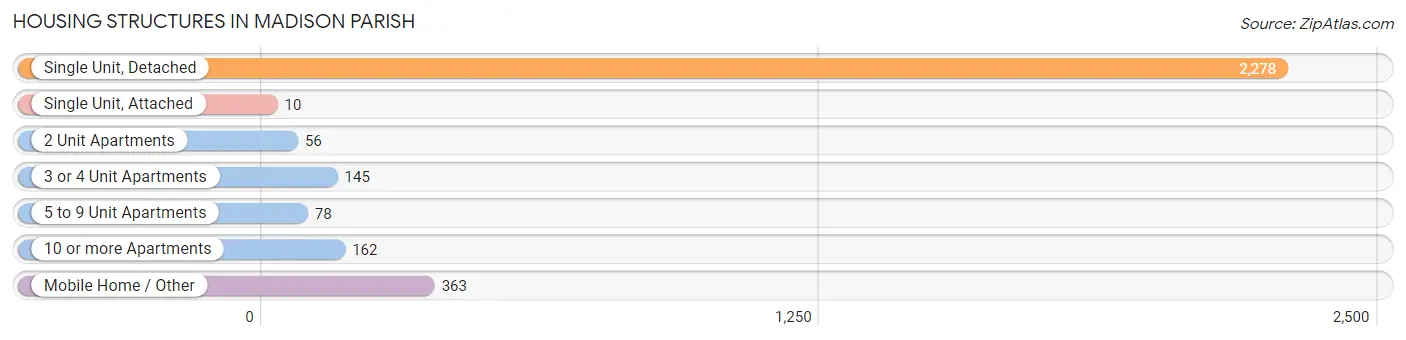
| Structure Type | # Housing Units | % Housing Units |
| Single Unit, Detached | 2,278 | 73.7% |
| Single Unit, Attached | 10 | 0.3% |
| 2 Unit Apartments | 56 | 1.8% |
| 3 or 4 Unit Apartments | 145 | 4.7% |
| 5 to 9 Unit Apartments | 78 | 2.5% |
| 10 or more Apartments | 162 | 5.2% |
| Mobile Home / Other | 363 | 11.7% |
| Total | 3,092 | 100.0% |
Housing Structures by Occupancy in Madison Parish
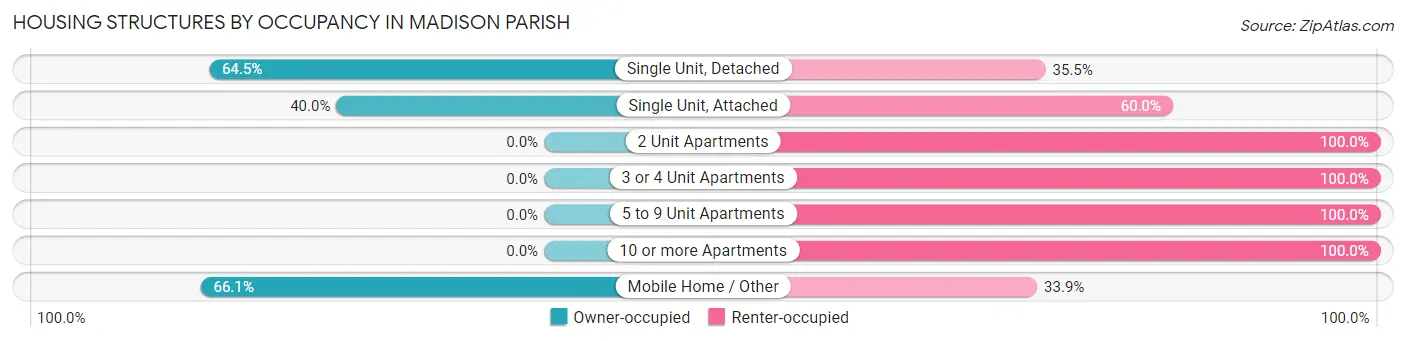
| Structure Type | Owner-occupied | Renter-occupied |
| Single Unit, Detached | 1,469 (64.5%) | 809 (35.5%) |
| Single Unit, Attached | 4 (40.0%) | 6 (60.0%) |
| 2 Unit Apartments | 0 (0.0%) | 56 (100.0%) |
| 3 or 4 Unit Apartments | 0 (0.0%) | 145 (100.0%) |
| 5 to 9 Unit Apartments | 0 (0.0%) | 78 (100.0%) |
| 10 or more Apartments | 0 (0.0%) | 162 (100.0%) |
| Mobile Home / Other | 240 (66.1%) | 123 (33.9%) |
| Total | 1,713 (55.4%) | 1,379 (44.6%) |
Housing Structures by Number of Rooms in Madison Parish
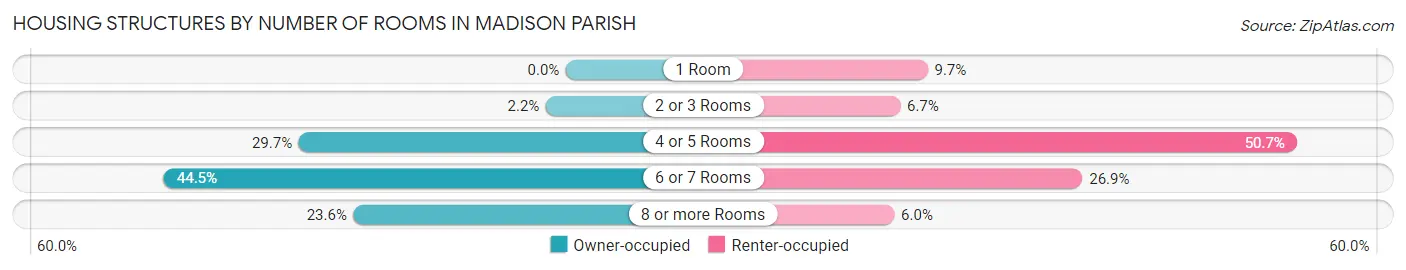
| Number of Rooms | Owner-occupied | Renter-occupied |
| 1 Room | 0 (0.0%) | 134 (9.7%) |
| 2 or 3 Rooms | 38 (2.2%) | 92 (6.7%) |
| 4 or 5 Rooms | 508 (29.7%) | 699 (50.7%) |
| 6 or 7 Rooms | 763 (44.5%) | 371 (26.9%) |
| 8 or more Rooms | 404 (23.6%) | 83 (6.0%) |
| Total | 1,713 (100.0%) | 1,379 (100.0%) |
Housing Structure by Heating Type in Madison Parish
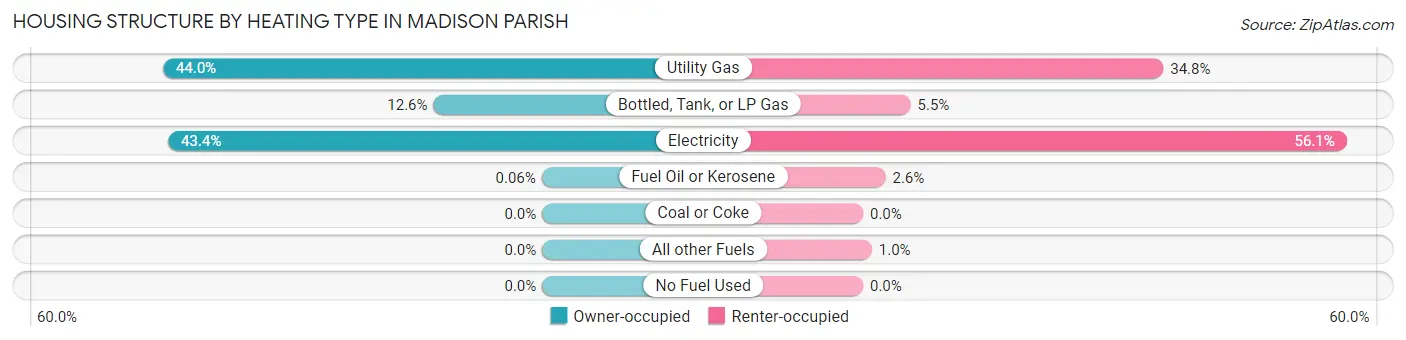
| Heating Type | Owner-occupied | Renter-occupied |
| Utility Gas | 753 (44.0%) | 480 (34.8%) |
| Bottled, Tank, or LP Gas | 216 (12.6%) | 76 (5.5%) |
| Electricity | 743 (43.4%) | 773 (56.1%) |
| Fuel Oil or Kerosene | 1 (0.1%) | 36 (2.6%) |
| Coal or Coke | 0 (0.0%) | 0 (0.0%) |
| All other Fuels | 0 (0.0%) | 14 (1.0%) |
| No Fuel Used | 0 (0.0%) | 0 (0.0%) |
| Total | 1,713 (100.0%) | 1,379 (100.0%) |
Household Vehicle Usage in Madison Parish
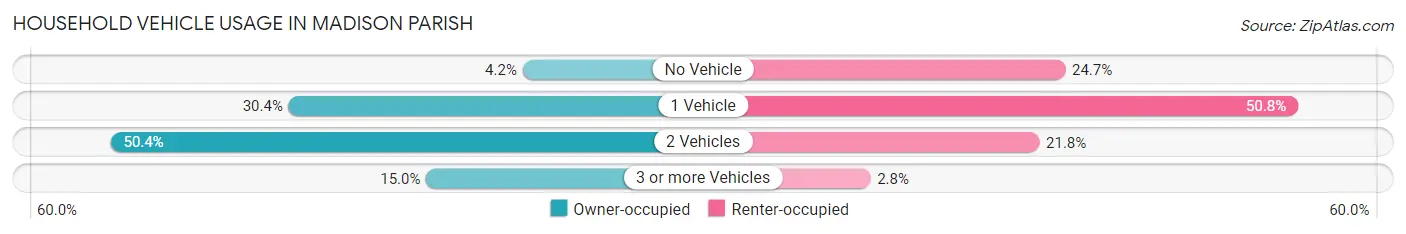
| Vehicles per Household | Owner-occupied | Renter-occupied |
| No Vehicle | 72 (4.2%) | 340 (24.7%) |
| 1 Vehicle | 521 (30.4%) | 700 (50.8%) |
| 2 Vehicles | 863 (50.4%) | 300 (21.7%) |
| 3 or more Vehicles | 257 (15.0%) | 39 (2.8%) |
| Total | 1,713 (100.0%) | 1,379 (100.0%) |
Real Estate & Mortgages in Madison Parish
Real Estate and Mortgage Overview in Madison Parish
| Characteristic | Without Mortgage | With Mortgage |
| Housing Units | 1,154 | 559 |
| Median Property Value | $63,000 | $144,000 |
| Median Household Income | $47,500 | $91 |
| Monthly Housing Costs | $362 | $33 |
| Real Estate Taxes | $199 | $87 |
Property Value by Mortgage Status in Madison Parish
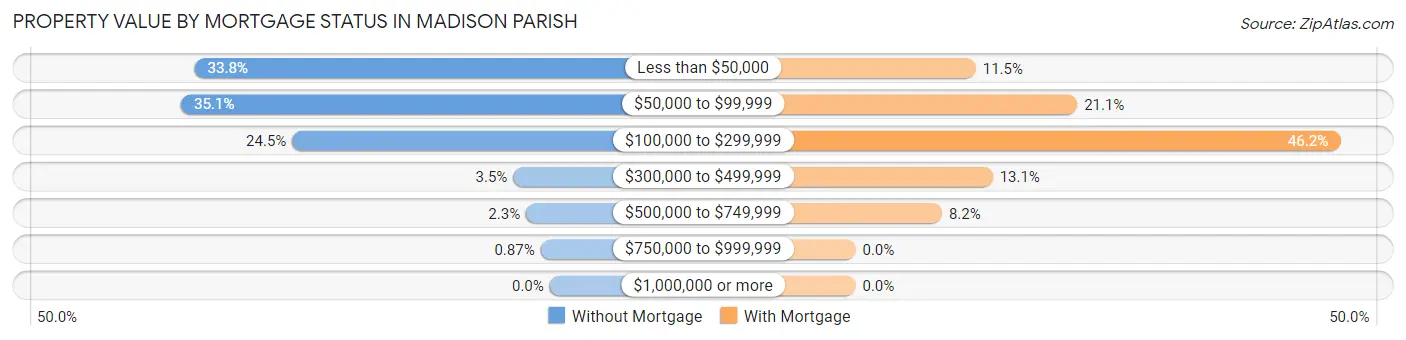
| Property Value | Without Mortgage | With Mortgage |
| Less than $50,000 | 390 (33.8%) | 64 (11.5%) |
| $50,000 to $99,999 | 405 (35.1%) | 118 (21.1%) |
| $100,000 to $299,999 | 283 (24.5%) | 258 (46.2%) |
| $300,000 to $499,999 | 40 (3.5%) | 73 (13.1%) |
| $500,000 to $749,999 | 26 (2.2%) | 46 (8.2%) |
| $750,000 to $999,999 | 10 (0.9%) | 0 (0.0%) |
| $1,000,000 or more | 0 (0.0%) | 0 (0.0%) |
| Total | 1,154 (100.0%) | 559 (100.0%) |
Household Income by Mortgage Status in Madison Parish
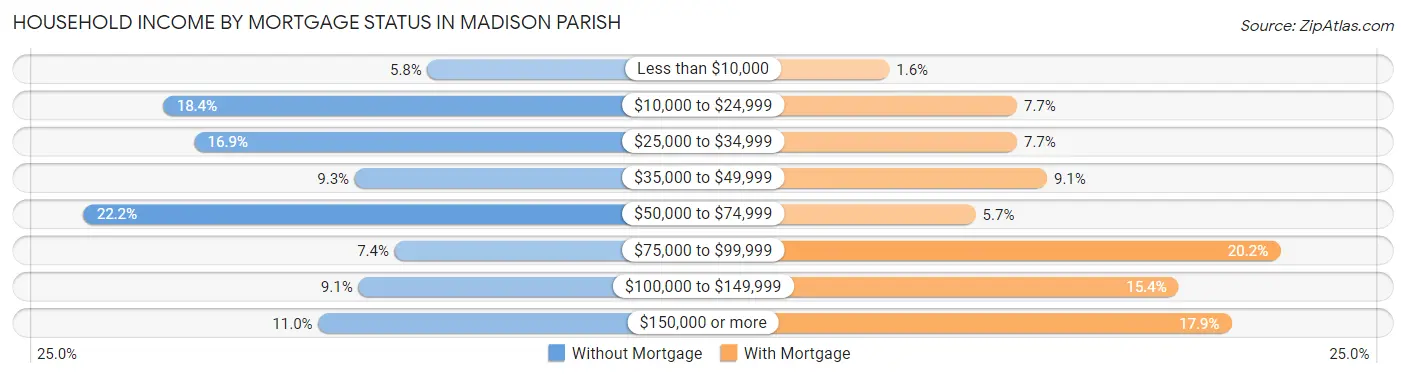
| Household Income | Without Mortgage | With Mortgage |
| Less than $10,000 | 67 (5.8%) | 9 (1.6%) |
| $10,000 to $24,999 | 212 (18.4%) | 43 (7.7%) |
| $25,000 to $34,999 | 195 (16.9%) | 43 (7.7%) |
| $35,000 to $49,999 | 107 (9.3%) | 51 (9.1%) |
| $50,000 to $74,999 | 256 (22.2%) | 32 (5.7%) |
| $75,000 to $99,999 | 85 (7.4%) | 113 (20.2%) |
| $100,000 to $149,999 | 105 (9.1%) | 86 (15.4%) |
| $150,000 or more | 127 (11.0%) | 100 (17.9%) |
| Total | 1,154 (100.0%) | 559 (100.0%) |
Property Value to Household Income Ratio in Madison Parish
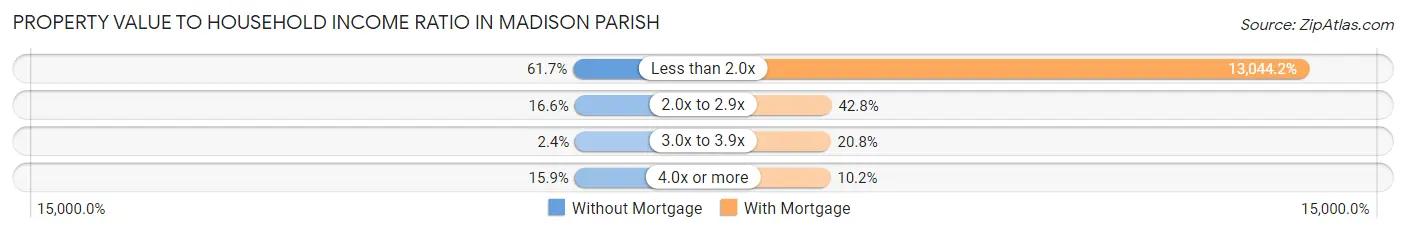
| Value-to-Income Ratio | Without Mortgage | With Mortgage |
| Less than 2.0x | 712 (61.7%) | 72,917 (13,044.2%) |
| 2.0x to 2.9x | 192 (16.6%) | 239 (42.7%) |
| 3.0x to 3.9x | 28 (2.4%) | 116 (20.7%) |
| 4.0x or more | 183 (15.9%) | 57 (10.2%) |
| Total | 1,154 (100.0%) | 559 (100.0%) |
Real Estate Taxes by Mortgage Status in Madison Parish
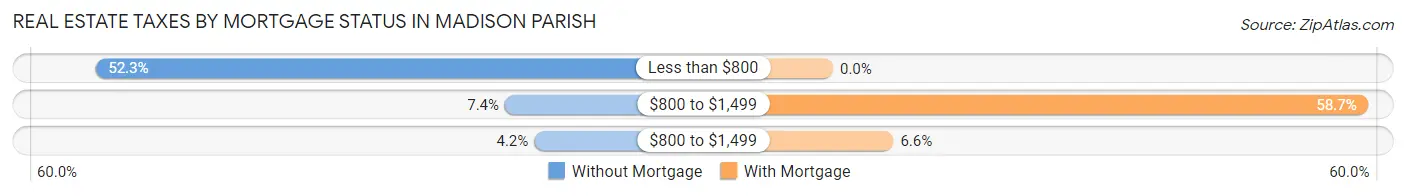
| Property Taxes | Without Mortgage | With Mortgage |
| Less than $800 | 603 (52.2%) | 0 (0.0%) |
| $800 to $1,499 | 85 (7.4%) | 328 (58.7%) |
| $800 to $1,499 | 48 (4.2%) | 37 (6.6%) |
| Total | 1,154 (100.0%) | 559 (100.0%) |
Health & Disability in Madison Parish
Health Insurance Coverage by Age in Madison Parish
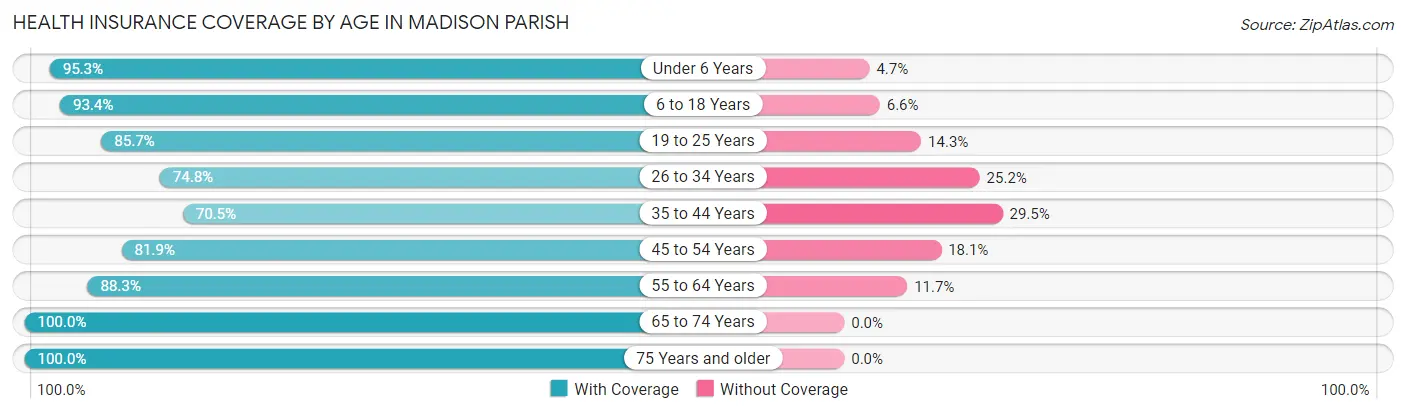
| Age Bracket | With Coverage | Without Coverage |
| Under 6 Years | 912 (95.3%) | 45 (4.7%) |
| 6 to 18 Years | 1,679 (93.4%) | 119 (6.6%) |
| 19 to 25 Years | 610 (85.7%) | 102 (14.3%) |
| 26 to 34 Years | 477 (74.8%) | 161 (25.2%) |
| 35 to 44 Years | 571 (70.5%) | 239 (29.5%) |
| 45 to 54 Years | 730 (81.9%) | 161 (18.1%) |
| 55 to 64 Years | 1,016 (88.3%) | 135 (11.7%) |
| 65 to 74 Years | 1,005 (100.0%) | 0 (0.0%) |
| 75 Years and older | 569 (100.0%) | 0 (0.0%) |
| Total | 7,569 (88.7%) | 962 (11.3%) |
Health Insurance Coverage by Citizenship Status in Madison Parish
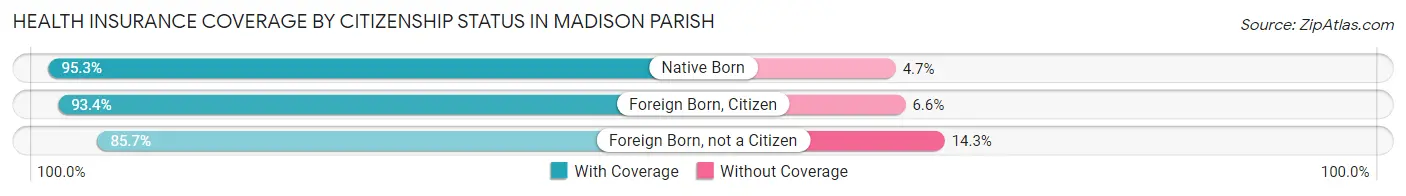
| Citizenship Status | With Coverage | Without Coverage |
| Native Born | 912 (95.3%) | 45 (4.7%) |
| Foreign Born, Citizen | 1,679 (93.4%) | 119 (6.6%) |
| Foreign Born, not a Citizen | 610 (85.7%) | 102 (14.3%) |
Health Insurance Coverage by Household Income in Madison Parish
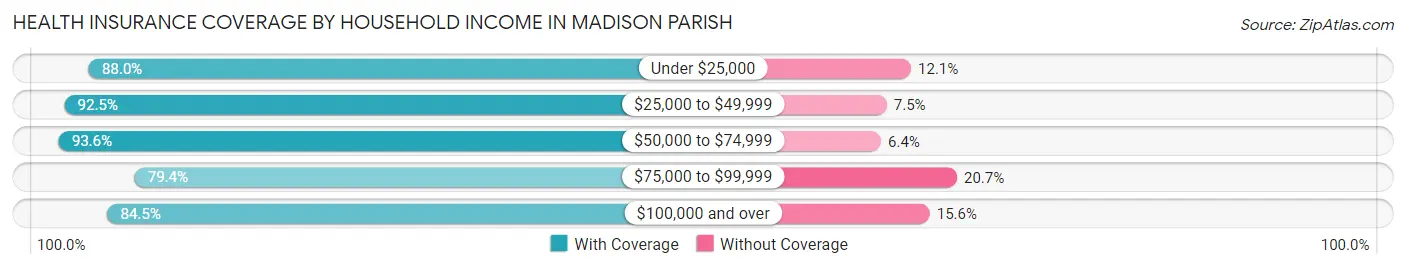
| Household Income | With Coverage | Without Coverage |
| Under $25,000 | 2,424 (87.9%) | 332 (12.0%) |
| $25,000 to $49,999 | 1,973 (92.5%) | 160 (7.5%) |
| $50,000 to $74,999 | 1,224 (93.6%) | 84 (6.4%) |
| $75,000 to $99,999 | 611 (79.3%) | 159 (20.6%) |
| $100,000 and over | 1,227 (84.5%) | 226 (15.5%) |
Public vs Private Health Insurance Coverage by Age in Madison Parish
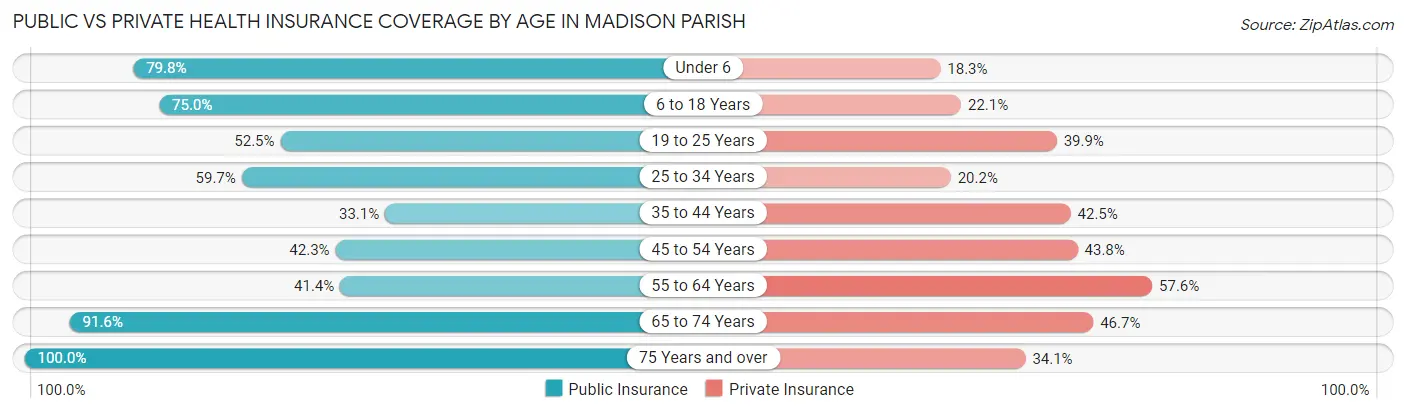
| Age Bracket | Public Insurance | Private Insurance |
| Under 6 | 764 (79.8%) | 175 (18.3%) |
| 6 to 18 Years | 1,349 (75.0%) | 398 (22.1%) |
| 19 to 25 Years | 374 (52.5%) | 284 (39.9%) |
| 25 to 34 Years | 381 (59.7%) | 129 (20.2%) |
| 35 to 44 Years | 268 (33.1%) | 344 (42.5%) |
| 45 to 54 Years | 377 (42.3%) | 390 (43.8%) |
| 55 to 64 Years | 477 (41.4%) | 663 (57.6%) |
| 65 to 74 Years | 921 (91.6%) | 469 (46.7%) |
| 75 Years and over | 569 (100.0%) | 194 (34.1%) |
| Total | 5,480 (64.2%) | 3,046 (35.7%) |
Disability Status by Sex by Age in Madison Parish
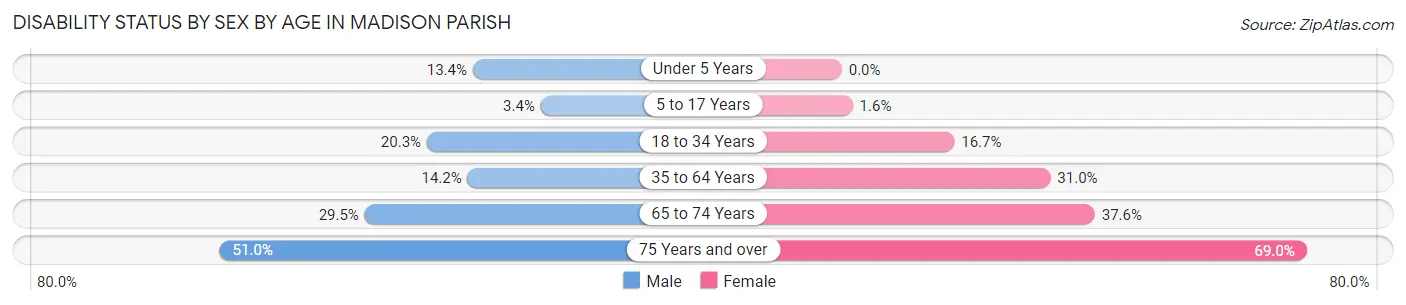
| Age Bracket | Male | Female |
| Under 5 Years | 41 (13.4%) | 0 (0.0%) |
| 5 to 17 Years | 30 (3.4%) | 15 (1.6%) |
| 18 to 34 Years | 140 (20.3%) | 142 (16.7%) |
| 35 to 64 Years | 176 (14.2%) | 500 (31.0%) |
| 65 to 74 Years | 141 (29.5%) | 198 (37.6%) |
| 75 Years and over | 124 (51.0%) | 225 (69.0%) |
Disability Class by Sex by Age in Madison Parish
Disability Class: Hearing Difficulty
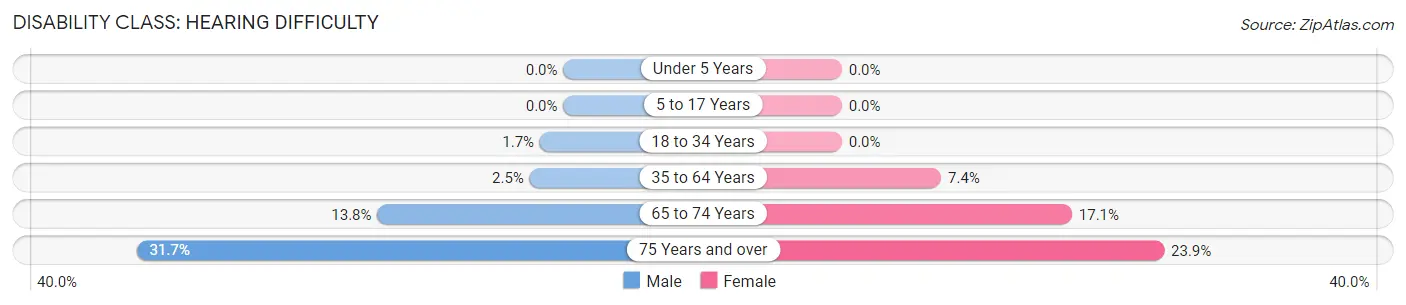
| Age Bracket | Male | Female |
| Under 5 Years | 0 (0.0%) | 0 (0.0%) |
| 5 to 17 Years | 0 (0.0%) | 0 (0.0%) |
| 18 to 34 Years | 12 (1.7%) | 0 (0.0%) |
| 35 to 64 Years | 31 (2.5%) | 119 (7.4%) |
| 65 to 74 Years | 66 (13.8%) | 90 (17.1%) |
| 75 Years and over | 77 (31.7%) | 78 (23.9%) |
Disability Class: Vision Difficulty
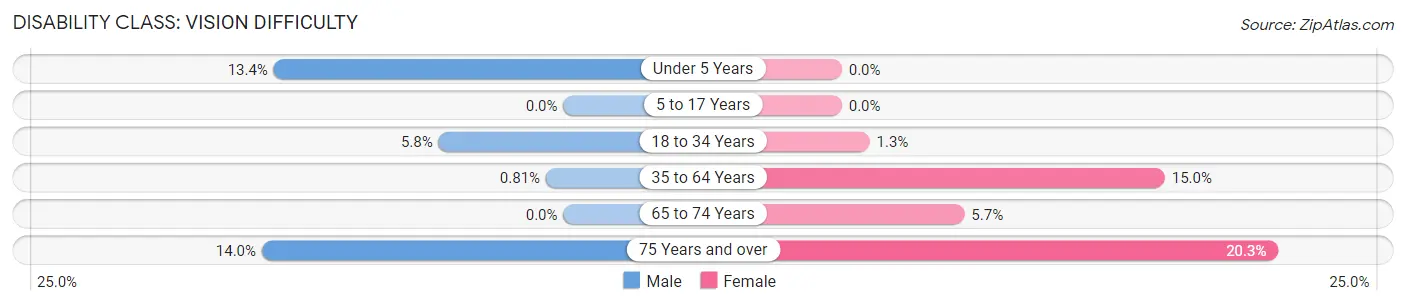
| Age Bracket | Male | Female |
| Under 5 Years | 41 (13.4%) | 0 (0.0%) |
| 5 to 17 Years | 0 (0.0%) | 0 (0.0%) |
| 18 to 34 Years | 40 (5.8%) | 11 (1.3%) |
| 35 to 64 Years | 10 (0.8%) | 242 (15.0%) |
| 65 to 74 Years | 0 (0.0%) | 30 (5.7%) |
| 75 Years and over | 34 (14.0%) | 66 (20.3%) |
Disability Class: Cognitive Difficulty
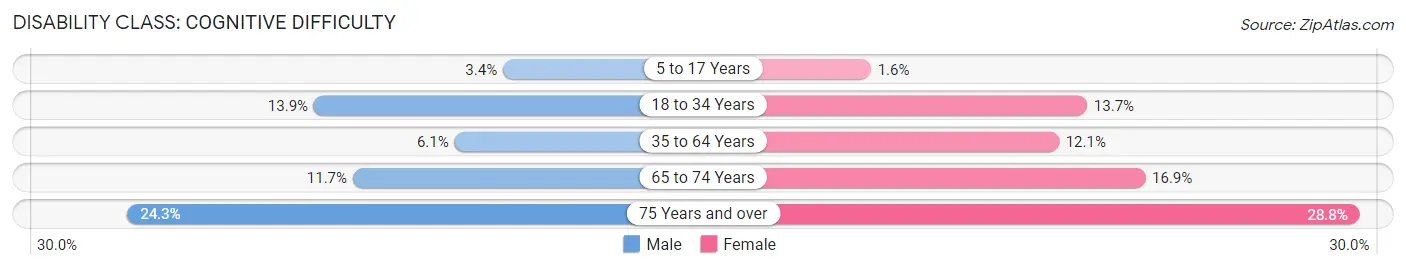
| Age Bracket | Male | Female |
| 5 to 17 Years | 30 (3.4%) | 15 (1.6%) |
| 18 to 34 Years | 96 (13.9%) | 116 (13.7%) |
| 35 to 64 Years | 75 (6.1%) | 195 (12.1%) |
| 65 to 74 Years | 56 (11.7%) | 89 (16.9%) |
| 75 Years and over | 59 (24.3%) | 94 (28.8%) |
Disability Class: Ambulatory Difficulty
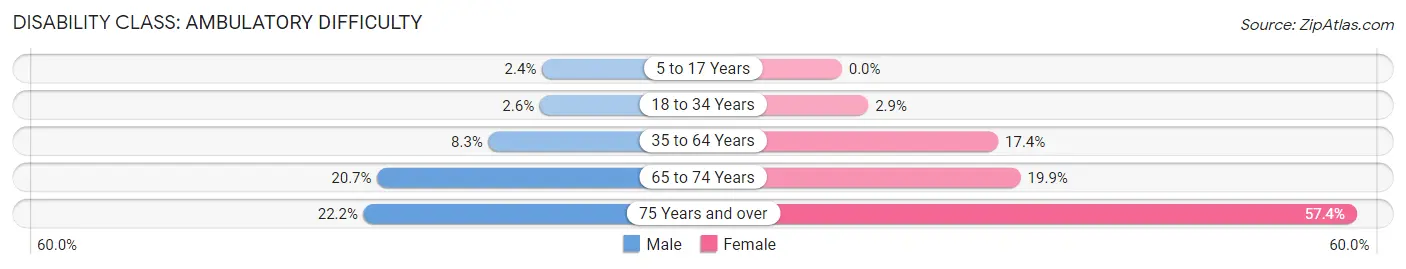
| Age Bracket | Male | Female |
| 5 to 17 Years | 21 (2.4%) | 0 (0.0%) |
| 18 to 34 Years | 18 (2.6%) | 25 (2.9%) |
| 35 to 64 Years | 103 (8.3%) | 281 (17.4%) |
| 65 to 74 Years | 99 (20.7%) | 105 (19.9%) |
| 75 Years and over | 54 (22.2%) | 187 (57.4%) |
Disability Class: Self-Care Difficulty
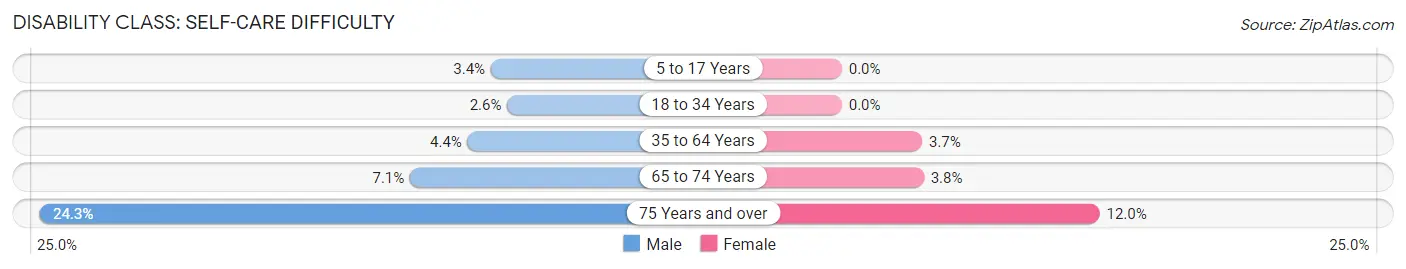
| Age Bracket | Male | Female |
| 5 to 17 Years | 30 (3.4%) | 0 (0.0%) |
| 18 to 34 Years | 18 (2.6%) | 0 (0.0%) |
| 35 to 64 Years | 55 (4.4%) | 60 (3.7%) |
| 65 to 74 Years | 34 (7.1%) | 20 (3.8%) |
| 75 Years and over | 59 (24.3%) | 39 (12.0%) |
Technology Access in Madison Parish
Computing Device Access in Madison Parish
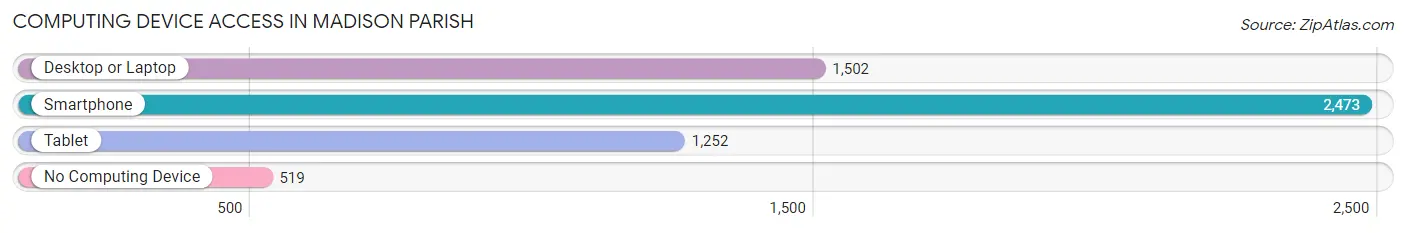
| Device Type | # Households | % Households |
| Desktop or Laptop | 1,502 | 48.6% |
| Smartphone | 2,473 | 80.0% |
| Tablet | 1,252 | 40.5% |
| No Computing Device | 519 | 16.8% |
| Total | 3,092 | 100.0% |
Internet Access in Madison Parish
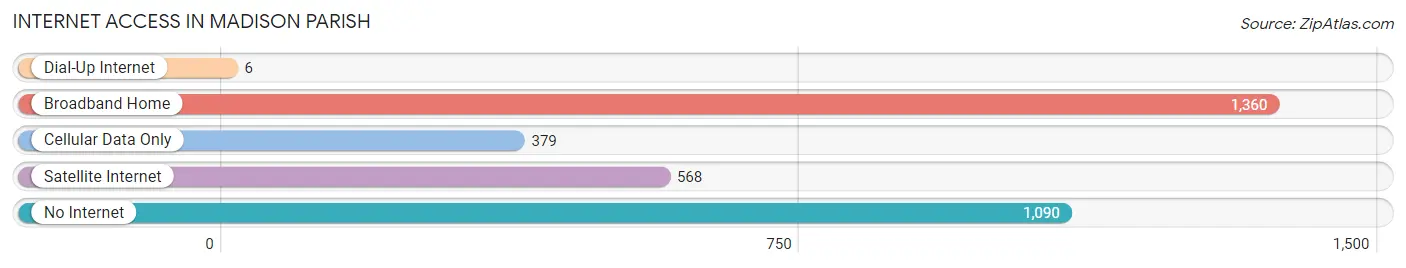
| Internet Type | # Households | % Households |
| Dial-Up Internet | 6 | 0.2% |
| Broadband Home | 1,360 | 44.0% |
| Cellular Data Only | 379 | 12.3% |
| Satellite Internet | 568 | 18.4% |
| No Internet | 1,090 | 35.2% |
| Total | 3,092 | 100.0% |
Madison Parish Summary
Introduction
Madison Parish is located in the northeastern corner of Louisiana, and is part of the larger Ark-La-Tex region. It is bordered by the Mississippi River to the east, and the Ouachita River to the west. The parish is home to a diverse population, with a mix of rural and urban areas. The parish has a rich history, and has been home to many different cultures over the years. This paper will explore the history, geography, economy, and demographics of Madison Parish in 2000 words.
History
Madison Parish was established in 1839, and was named after President James Madison. The parish was originally part of the larger Ouachita Parish, and was created to provide better access to the Mississippi River. The parish was home to a variety of Native American tribes, including the Choctaw, Chickasaw, and Caddo. The first European settlers arrived in the area in the early 1800s, and the parish was quickly populated by farmers and ranchers.
The parish was also home to a large African American population, and many of the slaves who were brought to the area were put to work on the plantations. After the Civil War, many of the freed slaves stayed in the area and established their own communities. The parish was also home to a large number of immigrants from Europe, particularly from Germany and Italy.
Geography
Madison Parish is located in the northeastern corner of Louisiana, and is part of the larger Ark-La-Tex region. It is bordered by the Mississippi River to the east, and the Ouachita River to the west. The parish is mostly rural, with a few small towns and cities. The largest city in the parish is Tallulah, which is located on the banks of the Mississippi River. The parish is also home to a number of smaller towns, including Delta, Delhi, and Epps.
The parish is mostly flat, with some rolling hills in the northern part of the parish. The parish is home to a variety of wildlife, including deer, turkey, and waterfowl. The parish is also home to a number of lakes and rivers, including the Ouachita River, the Tensas River, and Lake St. Joseph.
Economy
The economy of Madison Parish is largely based on agriculture and forestry. The parish is home to a number of large farms, and the main crops grown in the area are cotton, soybeans, corn, and wheat. The parish is also home to a number of timber companies, and the timber industry is a major source of employment in the area.
The parish is also home to a number of manufacturing companies, including a paper mill, a furniture factory, and a chemical plant. The parish is also home to a number of small businesses, including restaurants, shops, and other services.
Demographics
As of the 2010 census, the population of Madison Parish was 12,093. The population is mostly white, with African Americans making up the largest minority group. The median household income in the parish is $35,945, and the median age is 38.7 years. The parish is home to a number of churches, and the largest religious denomination is Baptist.
Conclusion
Madison Parish is a rural parish located in the northeastern corner of Louisiana. The parish has a rich history, and has been home to many different cultures over the years. The parish is mostly rural, with a few small towns and cities. The economy of the parish is largely based on agriculture and forestry, and the parish is home to a number of manufacturing companies. The population of the parish is mostly white, with African Americans making up the largest minority group.
Common Questions
What is the Total Population of Madison Parish?
Total Population of Madison Parish is 10,028.
What is the Total Male Population of Madison Parish?
Total Male Population of Madison Parish is 4,770.
What is the Total Female Population of Madison Parish?
Total Female Population of Madison Parish is 5,258.
What is the Ratio of Males per 100 Females in Madison Parish?
There are 90.72 Males per 100 Females in Madison Parish.
What is the Ratio of Females per 100 Males in Madison Parish?
There are 110.23 Females per 100 Males in Madison Parish.
What is the Median Population Age in Madison Parish?
Median Population Age in Madison Parish is 36.2 Years.
What is the Average Family Size in Madison Parish
Average Family Size in Madison Parish is 3.4 People.
What is the Average Household Size in Madison Parish
Average Household Size in Madison Parish is 2.7 People.
What is Per Capita Income in Madison Parish?
Per Capita income in Madison Parish is $18,314.
What is the Median Family Income in Madison Parish?
Median Family Income in Madison Parish is $45,203.
What is the Median Household income in Madison Parish?
Median Household Income in Madison Parish is $34,508.
What is Income or Wage Gap in Madison Parish?
Income or Wage Gap in Madison Parish is 25.3%.
Women in Madison Parish earn 74.7 cents for every dollar earned by a man.
What is Family Income Deficit in Madison Parish?
Family Income Deficit in Madison Parish is $12,462.
Families that are below poverty line in Madison Parish earn $12,462 less on average than the poverty threshold level.
What is Inequality or Gini Index in Madison Parish?
Inequality or Gini Index in Madison Parish is 0.54.
How Large is the Labor Force in Madison Parish?
There are 3,143 People in the Labor Forcein in Madison Parish.
What is the Percentage of People in the Labor Force in Madison Parish?
40.9% of People are in the Labor Force in Madison Parish.
What is the Unemployment Rate in Madison Parish?
Unemployment Rate in Madison Parish is 5.8%.