Livingston Parish, LA
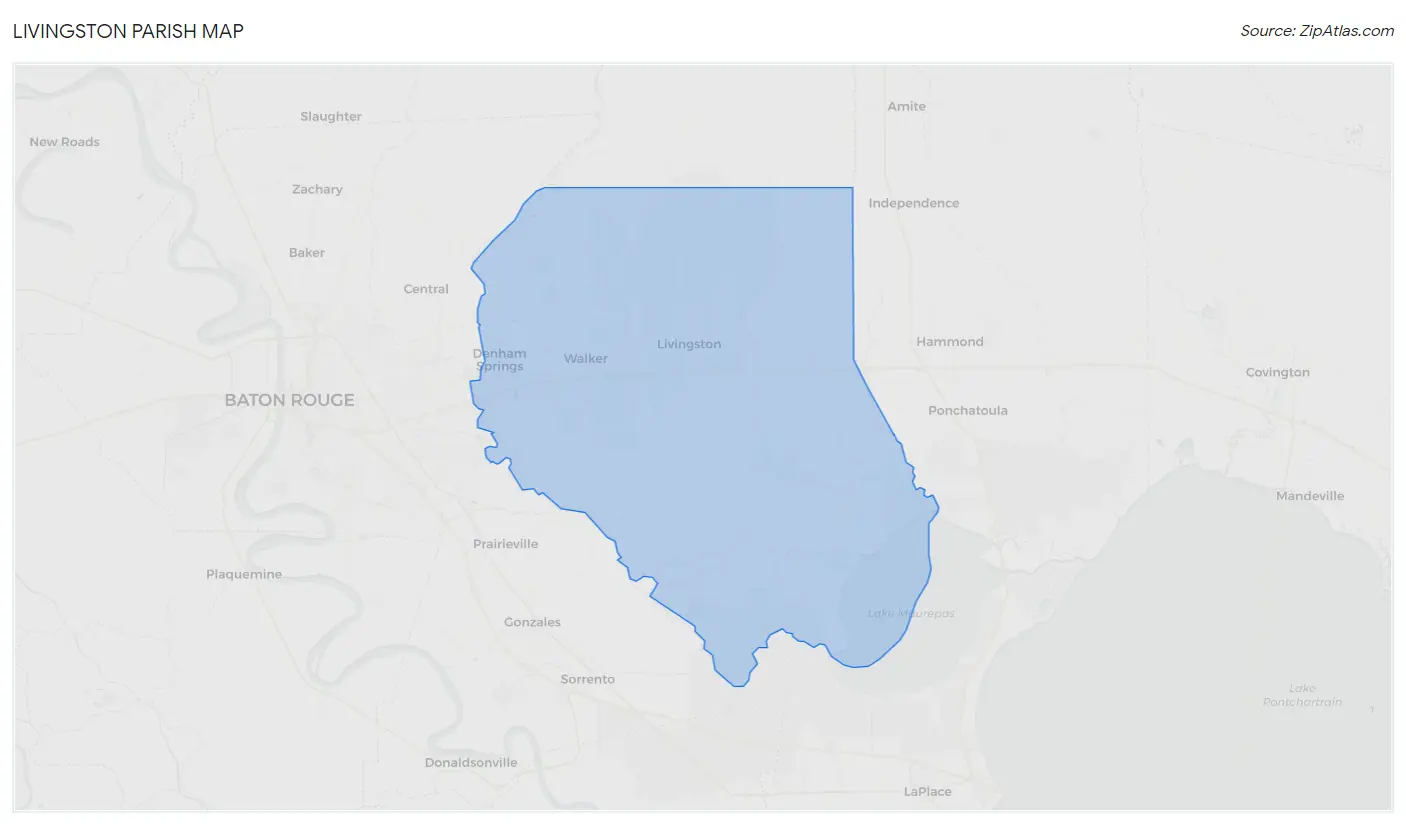
Livingston Parish Map
Livingston Parish Overview
143,425
TOTAL POPULATION
70,817
MALE POPULATION
72,608
FEMALE POPULATION
97.53
MALES / 100 FEMALES
102.53
FEMALES / 100 MALES
36.6
MEDIAN AGE
3.4
AVG FAMILY SIZE
2.9
AVG HOUSEHOLD SIZE
$34,237
PER CAPITA INCOME
$89,645
AVG FAMILY INCOME
$77,978
AVG HOUSEHOLD INCOME
39.1%
WAGE / INCOME GAP [ % ]
60.9¢/ $1
WAGE / INCOME GAP [ $ ]
$10,611
FAMILY INCOME DEFICIT
0.41
INEQUALITY / GINI INDEX
68,449
LABOR FORCE [ PEOPLE ]
61.3%
PERCENT IN LABOR FORCE
4.5%
UNEMPLOYMENT RATE
Livingston Parish Area Codes
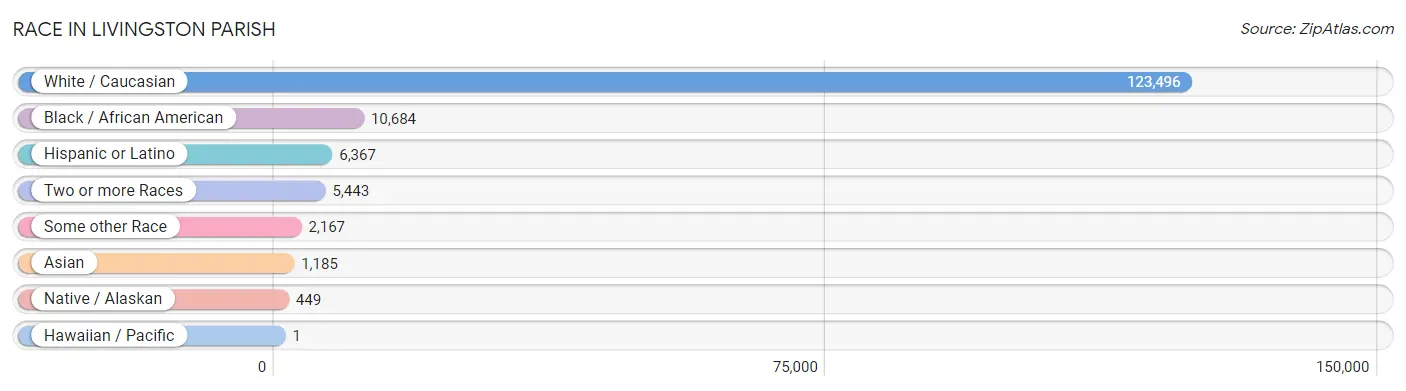
Race in Livingston Parish
The most populous races in Livingston Parish are White / Caucasian (123,496 | 86.1%), Black / African American (10,684 | 7.4%), and Hispanic or Latino (6,367 | 4.4%).
| Race | # Population | % Population |
| Asian | 1,185 | 0.8% |
| Black / African American | 10,684 | 7.4% |
| Hawaiian / Pacific | 1 | 0.0% |
| Hispanic or Latino | 6,367 | 4.4% |
| Native / Alaskan | 449 | 0.3% |
| White / Caucasian | 123,496 | 86.1% |
| Two or more Races | 5,443 | 3.8% |
| Some other Race | 2,167 | 1.5% |
| Total | 143,425 | 100.0% |
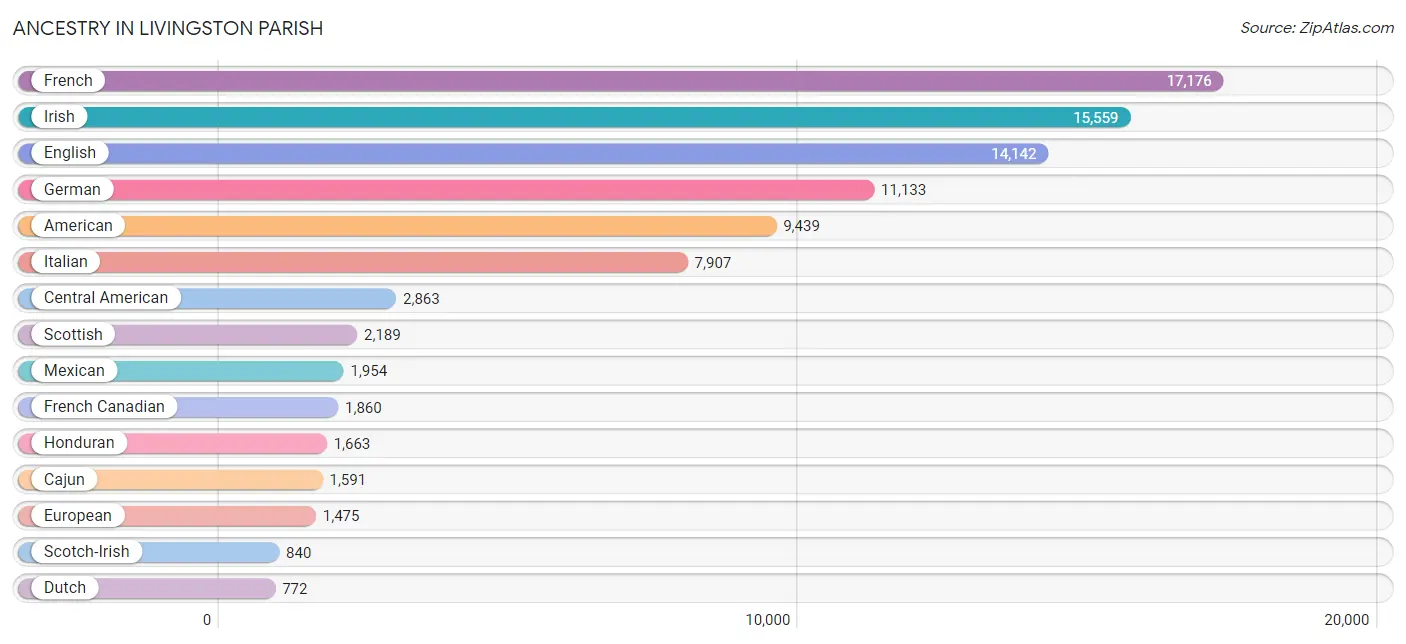
Ancestry in Livingston Parish
The most populous ancestries reported in Livingston Parish are French (17,176 | 12.0%), Irish (15,559 | 10.8%), English (14,142 | 9.9%), German (11,133 | 7.8%), and American (9,439 | 6.6%), together accounting for 47.0% of all Livingston Parish residents.
| Ancestry | # Population | % Population |
| Afghan | 31 | 0.0% |
| African | 248 | 0.2% |
| Alaska Native | 9 | 0.0% |
| American | 9,439 | 6.6% |
| Apache | 32 | 0.0% |
| Arab | 349 | 0.2% |
| Austrian | 52 | 0.0% |
| Belgian | 23 | 0.0% |
| Bhutanese | 43 | 0.0% |
| Blackfeet | 44 | 0.0% |
| Bolivian | 38 | 0.0% |
| Brazilian | 347 | 0.2% |
| British | 335 | 0.2% |
| Bulgarian | 5 | 0.0% |
| Burmese | 272 | 0.2% |
| Cajun | 1,591 | 1.1% |
| Canadian | 81 | 0.1% |
| Celtic | 16 | 0.0% |
| Central American | 2,863 | 2.0% |
| Central American Indian | 43 | 0.0% |
| Cherokee | 290 | 0.2% |
| Chickasaw | 6 | 0.0% |
| Choctaw | 223 | 0.2% |
| Colombian | 192 | 0.1% |
| Costa Rican | 125 | 0.1% |
| Creek | 17 | 0.0% |
| Crow | 9 | 0.0% |
| Cuban | 210 | 0.2% |
| Czech | 102 | 0.1% |
| Czechoslovakian | 57 | 0.0% |
| Danish | 46 | 0.0% |
| Dutch | 772 | 0.5% |
| Eastern European | 199 | 0.1% |
| English | 14,142 | 9.9% |
| European | 1,475 | 1.0% |
| Finnish | 41 | 0.0% |
| French | 17,176 | 12.0% |
| French American Indian | 96 | 0.1% |
| French Canadian | 1,860 | 1.3% |
| German | 11,133 | 7.8% |
| Greek | 135 | 0.1% |
| Guatemalan | 195 | 0.1% |
| Honduran | 1,663 | 1.2% |
| Houma | 64 | 0.0% |
| Hungarian | 722 | 0.5% |
| Icelander | 110 | 0.1% |
| Indian (Asian) | 458 | 0.3% |
| Iranian | 70 | 0.1% |
| Irish | 15,559 | 10.8% |
| Iroquois | 10 | 0.0% |
| Italian | 7,907 | 5.5% |
| Jamaican | 194 | 0.1% |
| Kiowa | 53 | 0.0% |
| Korean | 194 | 0.1% |
| Laotian | 7 | 0.0% |
| Lebanese | 316 | 0.2% |
| Lithuanian | 7 | 0.0% |
| Mexican | 1,954 | 1.4% |
| Mexican American Indian | 206 | 0.1% |
| Native Hawaiian | 31 | 0.0% |
| Navajo | 117 | 0.1% |
| Nicaraguan | 279 | 0.2% |
| Nigerian | 73 | 0.1% |
| Northern European | 286 | 0.2% |
| Norwegian | 479 | 0.3% |
| Polish | 480 | 0.3% |
| Portuguese | 101 | 0.1% |
| Pueblo | 32 | 0.0% |
| Puerto Rican | 208 | 0.2% |
| Russian | 225 | 0.2% |
| Salvadoran | 296 | 0.2% |
| Scandinavian | 146 | 0.1% |
| Scotch-Irish | 840 | 0.6% |
| Scottish | 2,189 | 1.5% |
| Sioux | 45 | 0.0% |
| Slovak | 7 | 0.0% |
| South American | 230 | 0.2% |
| Spaniard | 267 | 0.2% |
| Spanish | 435 | 0.3% |
| Spanish American | 17 | 0.0% |
| Sri Lankan | 511 | 0.4% |
| Subsaharan African | 321 | 0.2% |
| Swedish | 630 | 0.4% |
| Swiss | 122 | 0.1% |
| Thai | 86 | 0.1% |
| Ukrainian | 114 | 0.1% |
| Welsh | 544 | 0.4% |
| West Indian | 34 | 0.0% |
| Yugoslavian | 61 | 0.0% | View All 89 Rows |
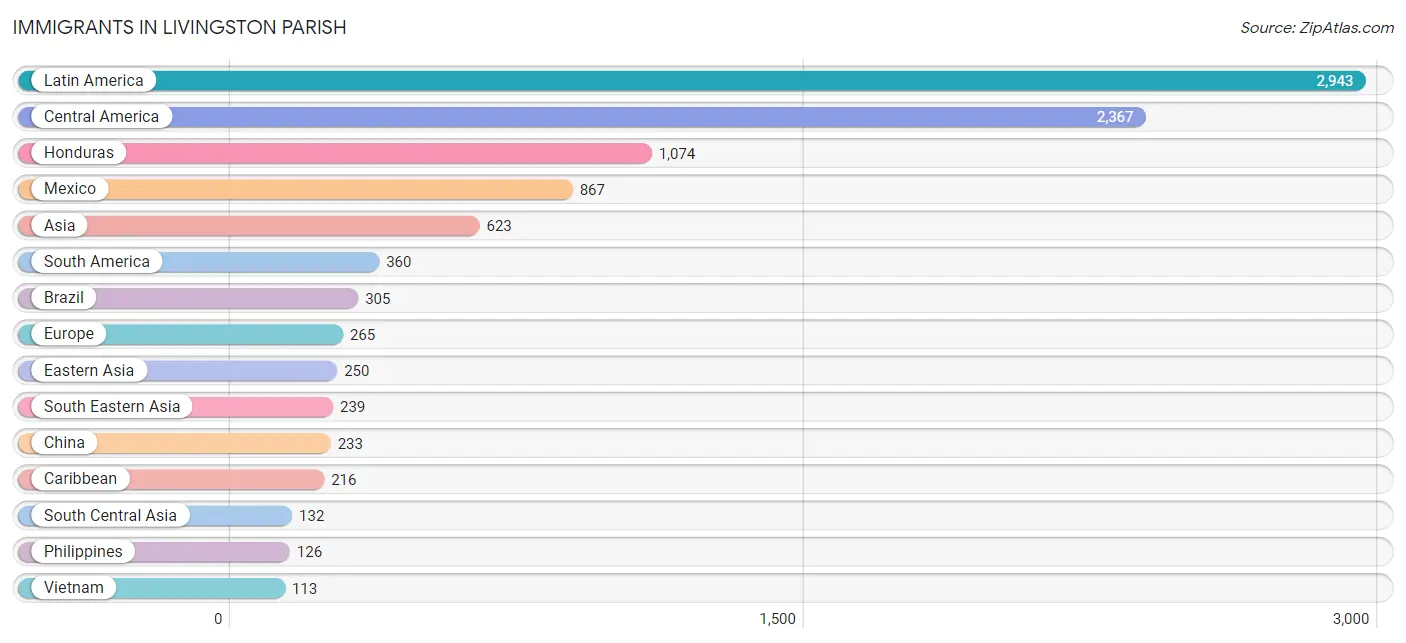
Immigrants in Livingston Parish
The most numerous immigrant groups reported in Livingston Parish came from Latin America (2,943 | 2.1%), Central America (2,367 | 1.7%), Honduras (1,074 | 0.7%), Mexico (867 | 0.6%), and Asia (623 | 0.4%), together accounting for 5.5% of all Livingston Parish residents.
| Immigration Origin | # Population | % Population |
| Afghanistan | 12 | 0.0% |
| Africa | 14 | 0.0% |
| Argentina | 27 | 0.0% |
| Asia | 623 | 0.4% |
| Brazil | 305 | 0.2% |
| Canada | 47 | 0.0% |
| Caribbean | 216 | 0.2% |
| Central America | 2,367 | 1.7% |
| China | 233 | 0.2% |
| Colombia | 15 | 0.0% |
| Costa Rica | 21 | 0.0% |
| Cuba | 28 | 0.0% |
| Czechoslovakia | 22 | 0.0% |
| Eastern Asia | 250 | 0.2% |
| Eastern Europe | 108 | 0.1% |
| Egypt | 14 | 0.0% |
| El Salvador | 100 | 0.1% |
| England | 35 | 0.0% |
| Europe | 265 | 0.2% |
| France | 28 | 0.0% |
| Germany | 84 | 0.1% |
| Honduras | 1,074 | 0.7% |
| India | 68 | 0.1% |
| Iran | 52 | 0.0% |
| Italy | 4 | 0.0% |
| Jamaica | 59 | 0.0% |
| Korea | 17 | 0.0% |
| Latin America | 2,943 | 2.1% |
| Lithuania | 3 | 0.0% |
| Mexico | 867 | 0.6% |
| Northern Africa | 14 | 0.0% |
| Northern Europe | 35 | 0.0% |
| Peru | 13 | 0.0% |
| Philippines | 126 | 0.1% |
| Poland | 18 | 0.0% |
| Russia | 52 | 0.0% |
| Saudi Arabia | 2 | 0.0% |
| South America | 360 | 0.3% |
| South Central Asia | 132 | 0.1% |
| South Eastern Asia | 239 | 0.2% |
| Southern Europe | 10 | 0.0% |
| Spain | 6 | 0.0% |
| Taiwan | 21 | 0.0% |
| Vietnam | 113 | 0.1% |
| Western Asia | 2 | 0.0% |
| Western Europe | 112 | 0.1% | View All 46 Rows |
Sex and Age in Livingston Parish
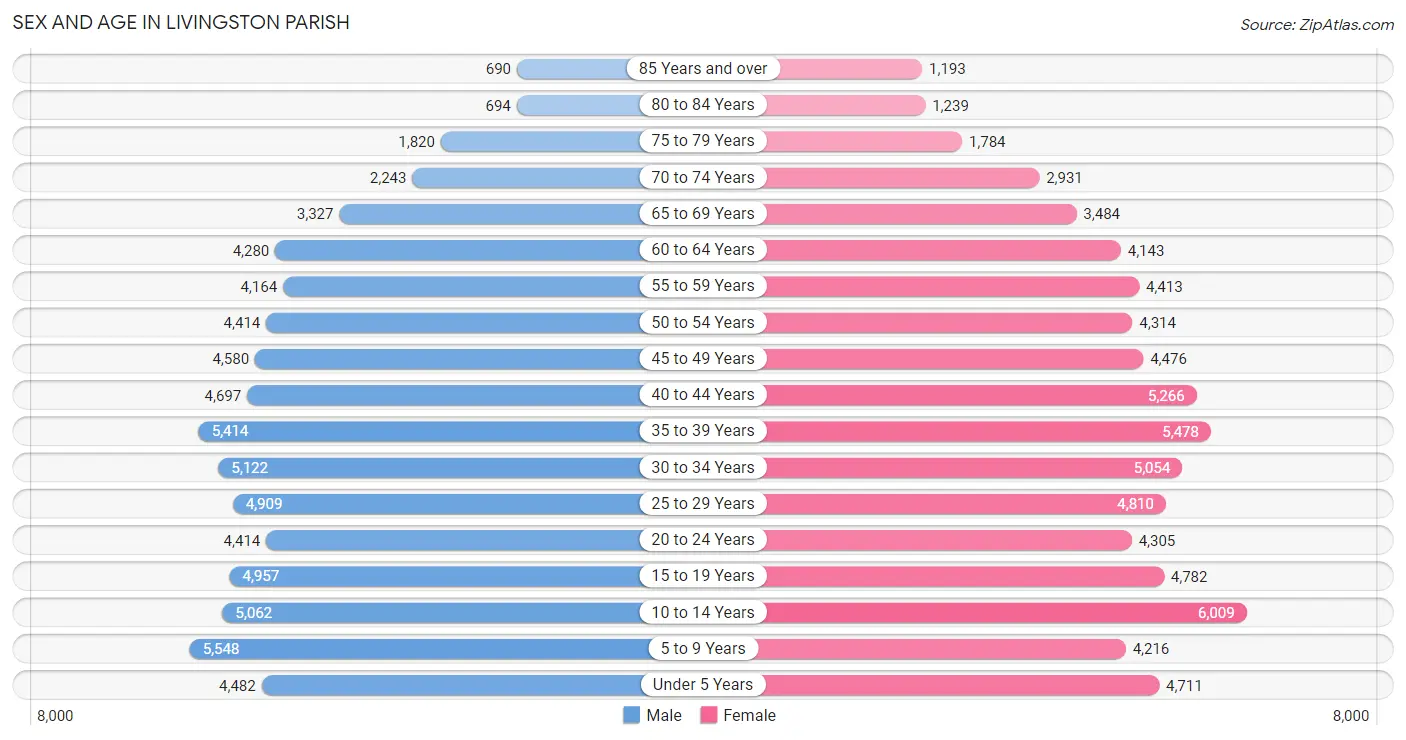
Sex and Age in Livingston Parish
The most populous age groups in Livingston Parish are 5 to 9 Years (5,548 | 7.8%) for men and 10 to 14 Years (6,009 | 8.3%) for women.
| Age Bracket | Male | Female |
| Under 5 Years | 4,482 (6.3%) | 4,711 (6.5%) |
| 5 to 9 Years | 5,548 (7.8%) | 4,216 (5.8%) |
| 10 to 14 Years | 5,062 (7.1%) | 6,009 (8.3%) |
| 15 to 19 Years | 4,957 (7.0%) | 4,782 (6.6%) |
| 20 to 24 Years | 4,414 (6.2%) | 4,305 (5.9%) |
| 25 to 29 Years | 4,909 (6.9%) | 4,810 (6.6%) |
| 30 to 34 Years | 5,122 (7.2%) | 5,054 (7.0%) |
| 35 to 39 Years | 5,414 (7.6%) | 5,478 (7.5%) |
| 40 to 44 Years | 4,697 (6.6%) | 5,266 (7.2%) |
| 45 to 49 Years | 4,580 (6.5%) | 4,476 (6.2%) |
| 50 to 54 Years | 4,414 (6.2%) | 4,314 (5.9%) |
| 55 to 59 Years | 4,164 (5.9%) | 4,413 (6.1%) |
| 60 to 64 Years | 4,280 (6.0%) | 4,143 (5.7%) |
| 65 to 69 Years | 3,327 (4.7%) | 3,484 (4.8%) |
| 70 to 74 Years | 2,243 (3.2%) | 2,931 (4.0%) |
| 75 to 79 Years | 1,820 (2.6%) | 1,784 (2.5%) |
| 80 to 84 Years | 694 (1.0%) | 1,239 (1.7%) |
| 85 Years and over | 690 (1.0%) | 1,193 (1.6%) |
| Total | 70,817 (100.0%) | 72,608 (100.0%) |
Families and Households in Livingston Parish
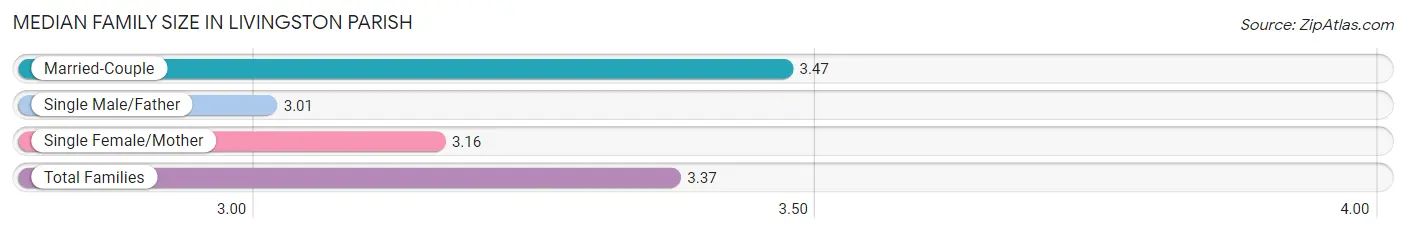
Median Family Size in Livingston Parish
The median family size in Livingston Parish is 3.37 persons per family, with married-couple families (25,555 | 71.3%) accounting for the largest median family size of 3.47 persons per family. On the other hand, single male/father families (3,318 | 9.2%) represent the smallest median family size with 3.01 persons per family.
| Family Type | # Families | Family Size |
| Married-Couple | 25,555 (71.3%) | 3.47 |
| Single Male/Father | 3,318 (9.2%) | 3.01 |
| Single Female/Mother | 6,987 (19.5%) | 3.16 |
| Total Families | 35,860 (100.0%) | 3.37 |
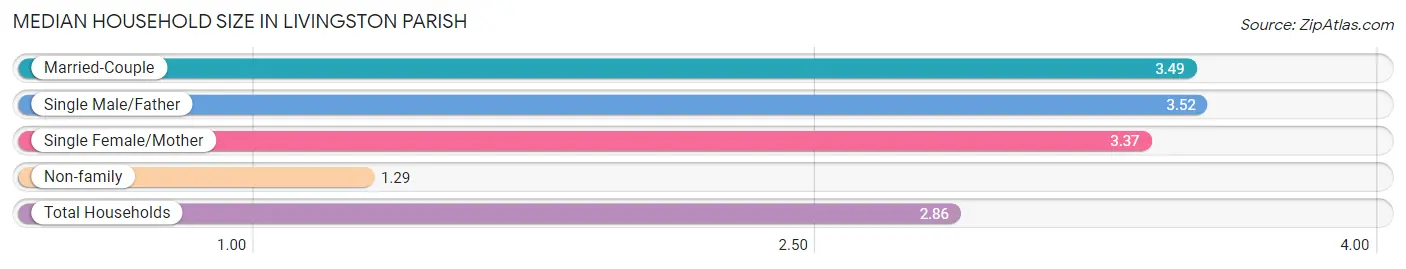
Median Household Size in Livingston Parish
The median household size in Livingston Parish is 2.86 persons per household, with single male/father households (3,318 | 6.7%) accounting for the largest median household size of 3.52 persons per household. non-family households (13,910 | 28.0%) represent the smallest median household size with 1.29 persons per household.
| Household Type | # Households | Household Size |
| Married-Couple | 25,555 (51.3%) | 3.49 |
| Single Male/Father | 3,318 (6.7%) | 3.52 |
| Single Female/Mother | 6,987 (14.0%) | 3.37 |
| Non-family | 13,910 (28.0%) | 1.29 |
| Total Households | 49,770 (100.0%) | 2.86 |
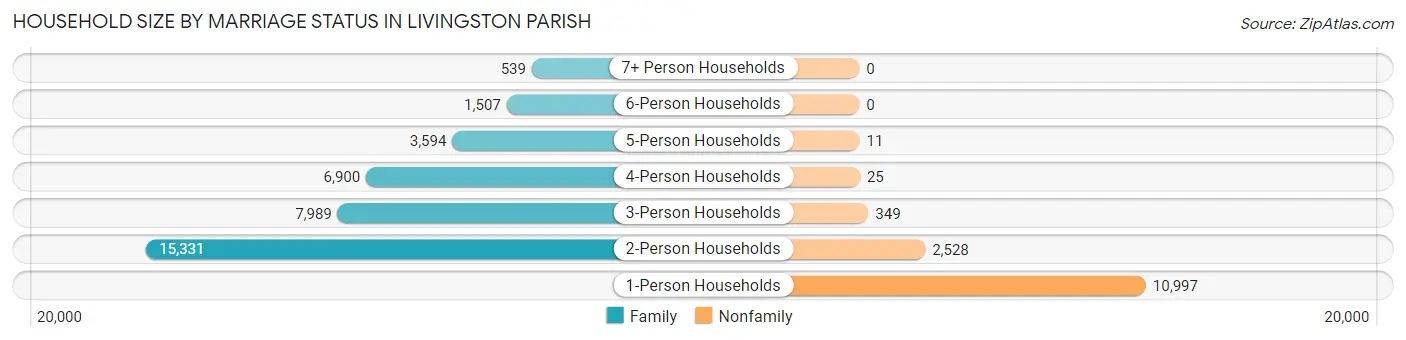
Household Size by Marriage Status in Livingston Parish
Out of a total of 49,770 households in Livingston Parish, 35,860 (72.1%) are family households, while 13,910 (28.0%) are nonfamily households. The most numerous type of family households are 2-person households, comprising 15,331, and the most common type of nonfamily households are 1-person households, comprising 10,997.
| Household Size | Family Households | Nonfamily Households |
| 1-Person Households | - | 10,997 (22.1%) |
| 2-Person Households | 15,331 (30.8%) | 2,528 (5.1%) |
| 3-Person Households | 7,989 (16.1%) | 349 (0.7%) |
| 4-Person Households | 6,900 (13.9%) | 25 (0.1%) |
| 5-Person Households | 3,594 (7.2%) | 11 (0.0%) |
| 6-Person Households | 1,507 (3.0%) | 0 (0.0%) |
| 7+ Person Households | 539 (1.1%) | 0 (0.0%) |
| Total | 35,860 (72.1%) | 13,910 (28.0%) |
Female Fertility in Livingston Parish
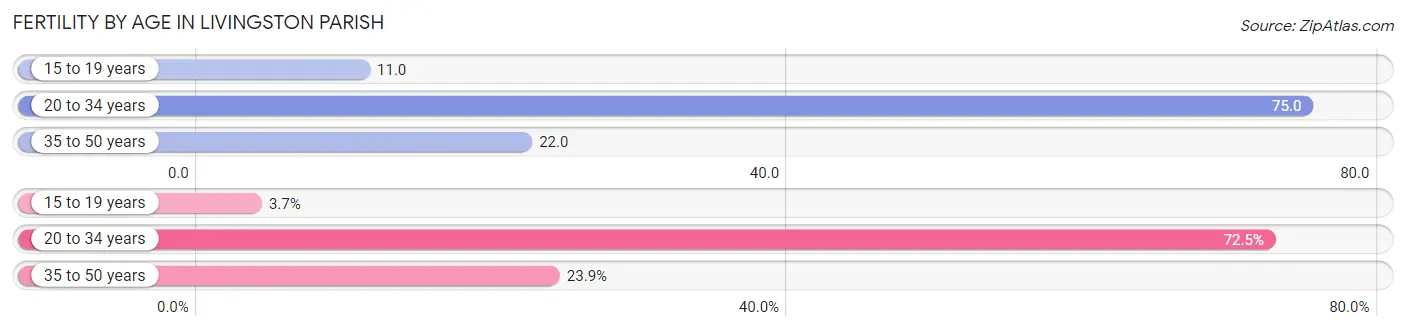
Fertility by Age in Livingston Parish
Average fertility rate in Livingston Parish is 42.0 births per 1,000 women. Women in the age bracket of 20 to 34 years have the highest fertility rate with 75.0 births per 1,000 women. Women in the age bracket of 20 to 34 years acount for 72.5% of all women with births.
| Age Bracket | Women with Births | Births / 1,000 Women |
| 15 to 19 years | 54 (3.7%) | 11.0 |
| 20 to 34 years | 1,068 (72.5%) | 75.0 |
| 35 to 50 years | 352 (23.9%) | 22.0 |
| Total | 1,474 (100.0%) | 42.0 |
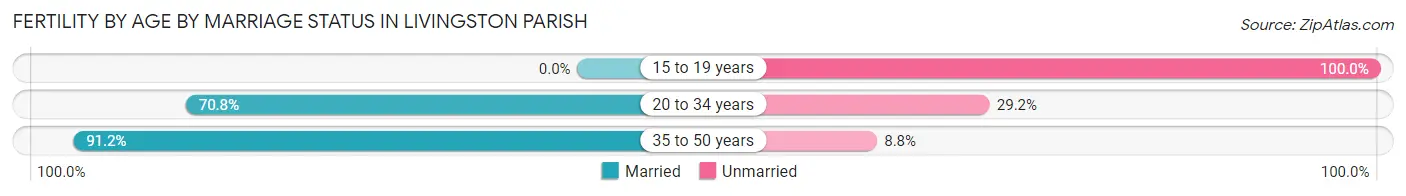
Fertility by Age by Marriage Status in Livingston Parish
73.1% of women with births (1,474) in Livingston Parish are married. The highest percentage of unmarried women with births falls into 15 to 19 years age bracket with 100.0% of them unmarried at the time of birth, while the lowest percentage of unmarried women with births belong to 35 to 50 years age bracket with 8.8% of them unmarried.
| Age Bracket | Married | Unmarried |
| 15 to 19 years | 0 (0.0%) | 54 (100.0%) |
| 20 to 34 years | 756 (70.8%) | 312 (29.2%) |
| 35 to 50 years | 321 (91.2%) | 31 (8.8%) |
| Total | 1,077 (73.1%) | 397 (26.9%) |
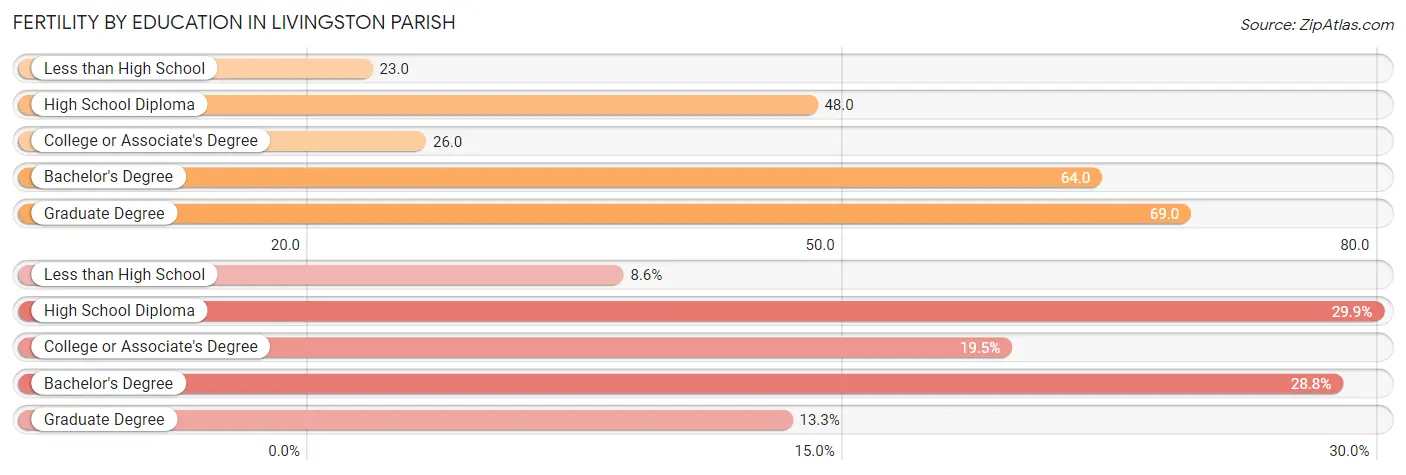
Fertility by Education in Livingston Parish
Average fertility rate in Livingston Parish is 42.0 births per 1,000 women. Women with the education attainment of graduate degree have the highest fertility rate of 69.0 births per 1,000 women, while women with the education attainment of less than high school have the lowest fertility at 23.0 births per 1,000 women. Women with the education attainment of high school diploma represent 29.9% of all women with births.
| Educational Attainment | Women with Births | Births / 1,000 Women |
| Less than High School | 126 (8.6%) | 23.0 |
| High School Diploma | 441 (29.9%) | 48.0 |
| College or Associate's Degree | 287 (19.5%) | 26.0 |
| Bachelor's Degree | 424 (28.8%) | 64.0 |
| Graduate Degree | 196 (13.3%) | 69.0 |
| Total | 1,474 (100.0%) | 42.0 |
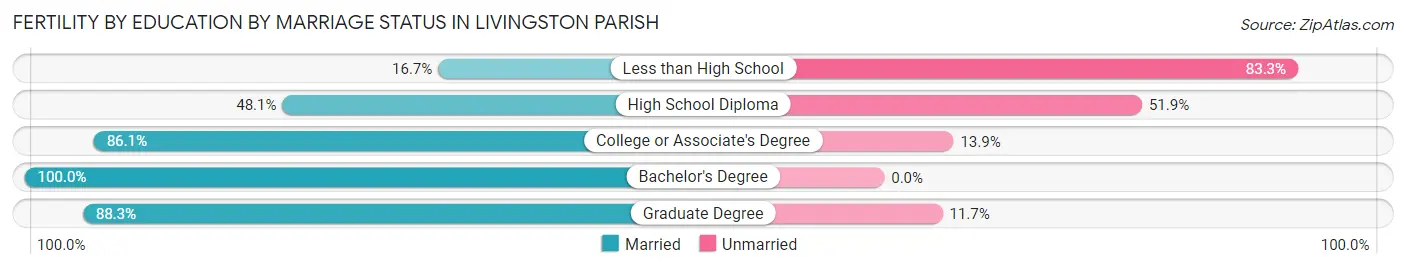
Fertility by Education by Marriage Status in Livingston Parish
26.9% of women with births in Livingston Parish are unmarried. Women with the educational attainment of bachelor's degree are most likely to be married with 100.0% of them married at childbirth, while women with the educational attainment of less than high school are least likely to be married with 83.3% of them unmarried at childbirth.
| Educational Attainment | Married | Unmarried |
| Less than High School | 21 (16.7%) | 105 (83.3%) |
| High School Diploma | 212 (48.1%) | 229 (51.9%) |
| College or Associate's Degree | 247 (86.1%) | 40 (13.9%) |
| Bachelor's Degree | 424 (100.0%) | 0 (0.0%) |
| Graduate Degree | 173 (88.3%) | 23 (11.7%) |
| Total | 1,077 (73.1%) | 397 (26.9%) |
Income in Livingston Parish
Income Overview in Livingston Parish
Per Capita Income in Livingston Parish is $34,237, while median incomes of families and households are $89,645 and $77,978 respectively.
| Characteristic | Number | Measure |
| Per Capita Income | 143,425 | $34,237 |
| Median Family Income | 35,860 | $89,645 |
| Mean Family Income | 35,860 | $101,802 |
| Median Household Income | 49,770 | $77,978 |
| Mean Household Income | 49,770 | $93,117 |
| Income Deficit | 35,860 | $10,611 |
| Wage / Income Gap (%) | 143,425 | 39.14% |
| Wage / Income Gap ($) | 143,425 | 60.86¢ per $1 |
| Gini / Inequality Index | 143,425 | 0.41 |
Earnings by Sex in Livingston Parish
Average Earnings in Livingston Parish are $45,468, $57,519 for men and $35,006 for women, a difference of 39.1%.
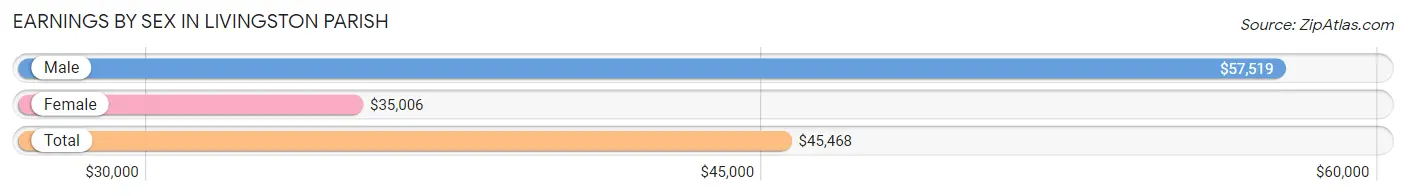
| Sex | Number | Average Earnings |
| Male | 38,646 (54.2%) | $57,519 |
| Female | 32,690 (45.8%) | $35,006 |
| Total | 71,336 (100.0%) | $45,468 |
Earnings by Sex by Income Bracket in Livingston Parish
The most common earnings brackets in Livingston Parish are $100,000+ for men (7,894 | 20.4%) and $55,000 to $64,999 for women (3,197 | 9.8%).
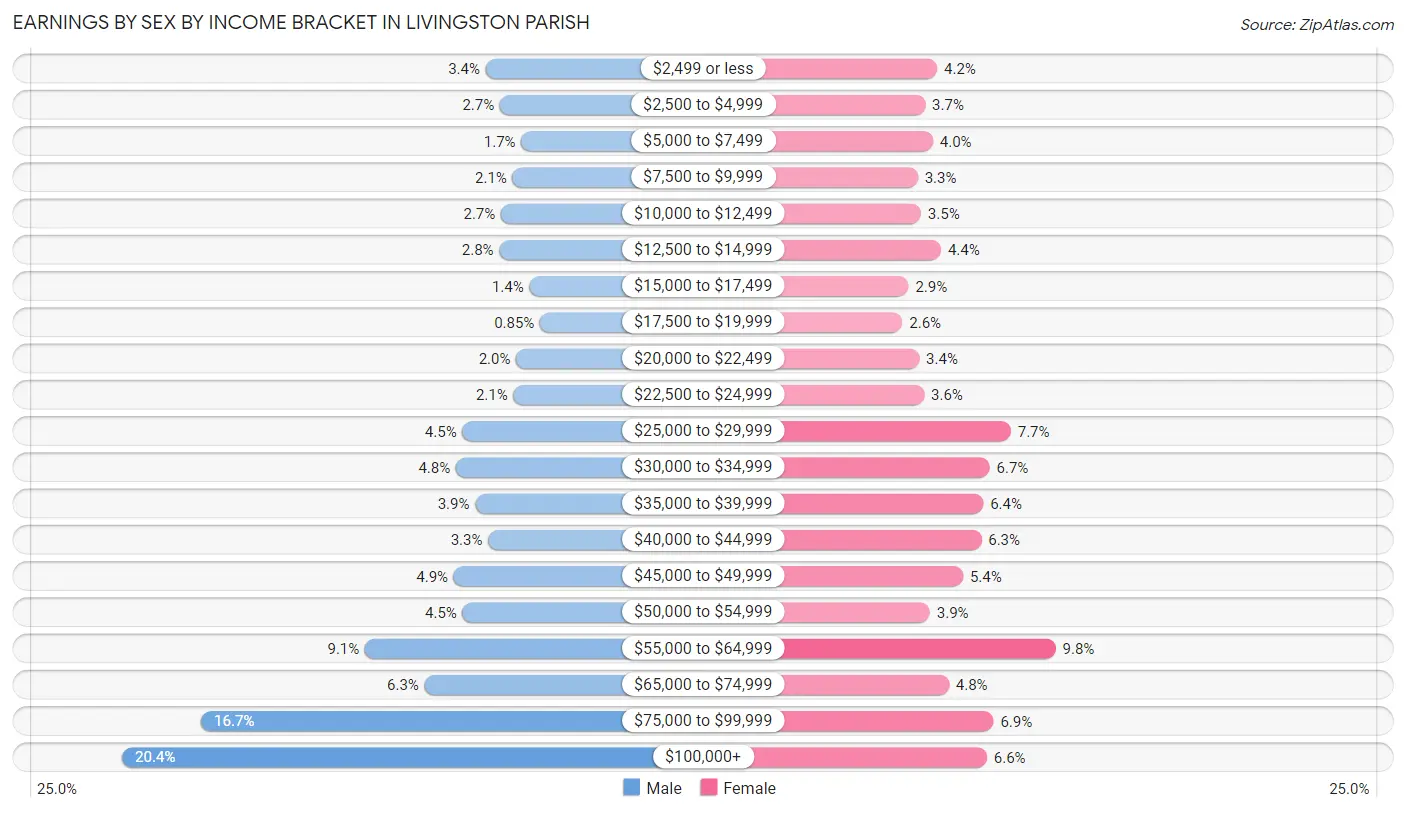
| Income | Male | Female |
| $2,499 or less | 1,314 (3.4%) | 1,382 (4.2%) |
| $2,500 to $4,999 | 1,056 (2.7%) | 1,199 (3.7%) |
| $5,000 to $7,499 | 669 (1.7%) | 1,319 (4.0%) |
| $7,500 to $9,999 | 826 (2.1%) | 1,086 (3.3%) |
| $10,000 to $12,499 | 1,036 (2.7%) | 1,133 (3.5%) |
| $12,500 to $14,999 | 1,067 (2.8%) | 1,440 (4.4%) |
| $15,000 to $17,499 | 522 (1.3%) | 944 (2.9%) |
| $17,500 to $19,999 | 329 (0.9%) | 850 (2.6%) |
| $20,000 to $22,499 | 762 (2.0%) | 1,108 (3.4%) |
| $22,500 to $24,999 | 812 (2.1%) | 1,182 (3.6%) |
| $25,000 to $29,999 | 1,735 (4.5%) | 2,512 (7.7%) |
| $30,000 to $34,999 | 1,852 (4.8%) | 2,188 (6.7%) |
| $35,000 to $39,999 | 1,503 (3.9%) | 2,090 (6.4%) |
| $40,000 to $44,999 | 1,266 (3.3%) | 2,061 (6.3%) |
| $45,000 to $49,999 | 1,890 (4.9%) | 1,777 (5.4%) |
| $50,000 to $54,999 | 1,733 (4.5%) | 1,271 (3.9%) |
| $55,000 to $64,999 | 3,498 (9.0%) | 3,197 (9.8%) |
| $65,000 to $74,999 | 2,418 (6.3%) | 1,561 (4.8%) |
| $75,000 to $99,999 | 6,464 (16.7%) | 2,246 (6.9%) |
| $100,000+ | 7,894 (20.4%) | 2,144 (6.6%) |
| Total | 38,646 (100.0%) | 32,690 (100.0%) |
Earnings by Sex by Educational Attainment in Livingston Parish
Average earnings in Livingston Parish are $63,504 for men and $40,182 for women, a difference of 36.7%. Men with an educational attainment of graduate degree enjoy the highest average annual earnings of $89,028, while those with less than high school education earn the least with $37,426. Women with an educational attainment of graduate degree earn the most with the average annual earnings of $61,703, while those with less than high school education have the smallest earnings of $25,382.
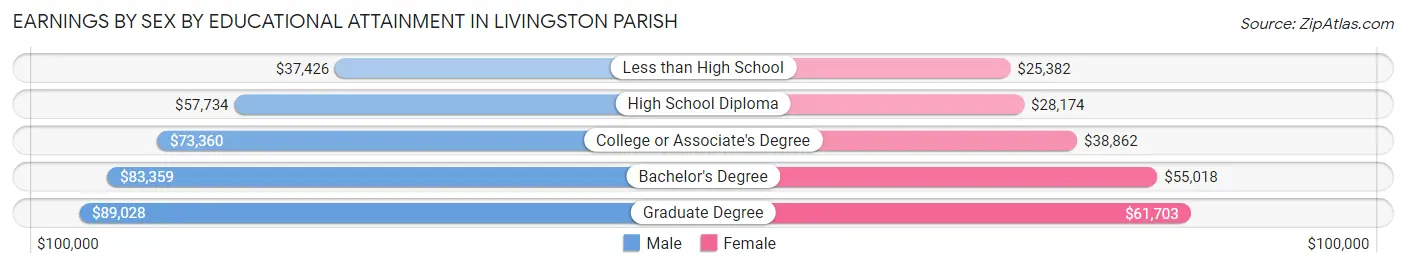
| Educational Attainment | Male Income | Female Income |
| Less than High School | $37,426 | $25,382 |
| High School Diploma | $57,734 | $28,174 |
| College or Associate's Degree | $73,360 | $38,862 |
| Bachelor's Degree | $83,359 | $55,018 |
| Graduate Degree | $89,028 | $61,703 |
| Total | $63,504 | $40,182 |
Family Income in Livingston Parish
Family Income Brackets in Livingston Parish
According to the Livingston Parish family income data, there are 8,929 families falling into the $100,000 to $149,999 income range, which is the most common income bracket and makes up 24.9% of all families. Conversely, the $10,000 to $14,999 income bracket is the least frequent group with only 681 families (1.9%) belonging to this category.
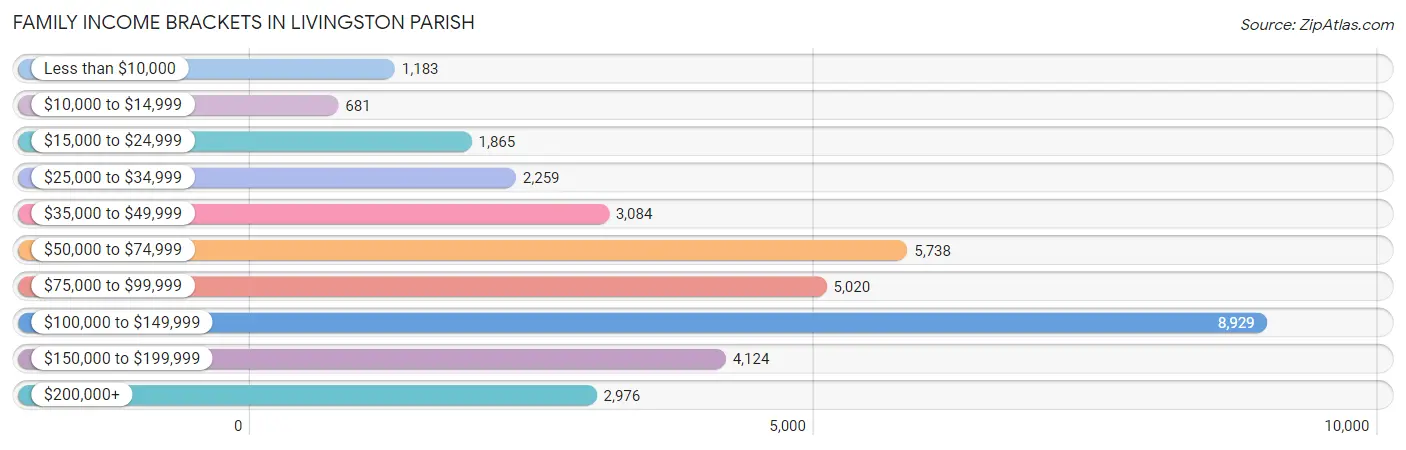
| Income Bracket | # Families | % Families |
| Less than $10,000 | 1,183 | 3.3% |
| $10,000 to $14,999 | 681 | 1.9% |
| $15,000 to $24,999 | 1,865 | 5.2% |
| $25,000 to $34,999 | 2,259 | 6.3% |
| $35,000 to $49,999 | 3,084 | 8.6% |
| $50,000 to $74,999 | 5,738 | 16.0% |
| $75,000 to $99,999 | 5,020 | 14.0% |
| $100,000 to $149,999 | 8,929 | 24.9% |
| $150,000 to $199,999 | 4,124 | 11.5% |
| $200,000+ | 2,976 | 8.3% |
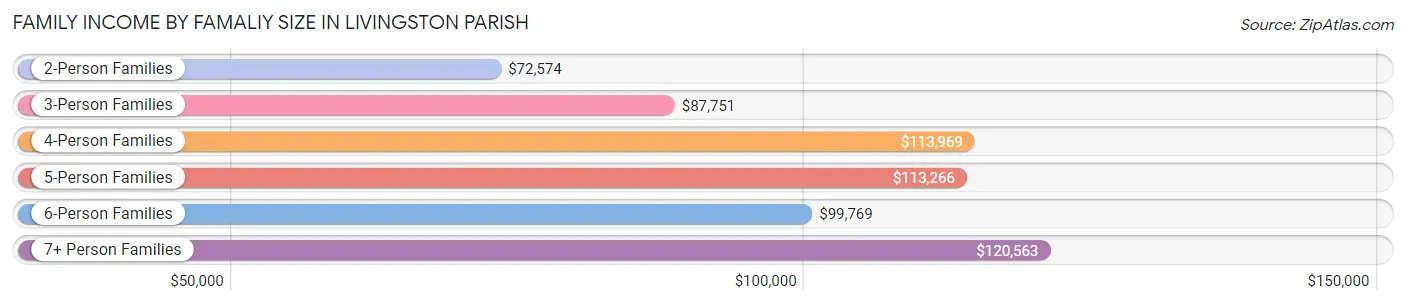
Family Income by Famaliy Size in Livingston Parish
7+ person families (539 | 1.5%) account for the highest median family income in Livingston Parish with $120,563 per family, while 2-person families (16,581 | 46.2%) have the highest median income of $36,287 per family member.
| Income Bracket | # Families | Median Income |
| 2-Person Families | 16,581 (46.2%) | $72,574 |
| 3-Person Families | 7,584 (21.1%) | $87,751 |
| 4-Person Families | 6,641 (18.5%) | $113,969 |
| 5-Person Families | 3,328 (9.3%) | $113,266 |
| 6-Person Families | 1,187 (3.3%) | $99,769 |
| 7+ Person Families | 539 (1.5%) | $120,563 |
| Total | 35,860 (100.0%) | $89,645 |
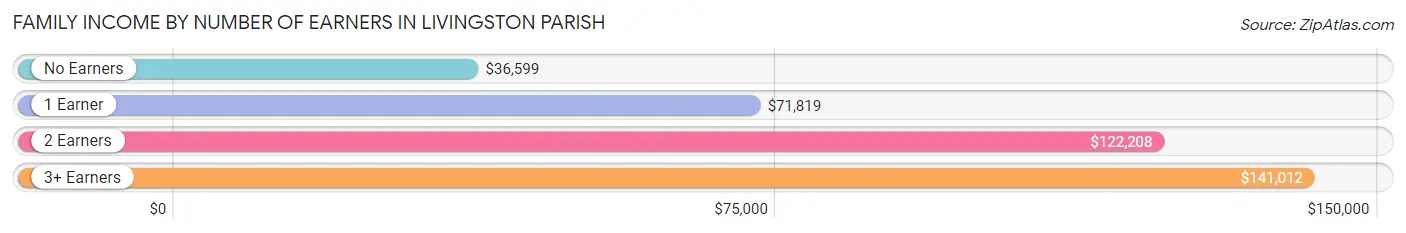
Family Income by Number of Earners in Livingston Parish
The median family income in Livingston Parish is $89,645, with families comprising 3+ earners (3,372) having the highest median family income of $141,012, while families with no earners (5,663) have the lowest median family income of $36,599, accounting for 9.4% and 15.8% of families, respectively.
| Number of Earners | # Families | Median Income |
| No Earners | 5,663 (15.8%) | $36,599 |
| 1 Earner | 12,762 (35.6%) | $71,819 |
| 2 Earners | 14,063 (39.2%) | $122,208 |
| 3+ Earners | 3,372 (9.4%) | $141,012 |
| Total | 35,860 (100.0%) | $89,645 |
Household Income in Livingston Parish
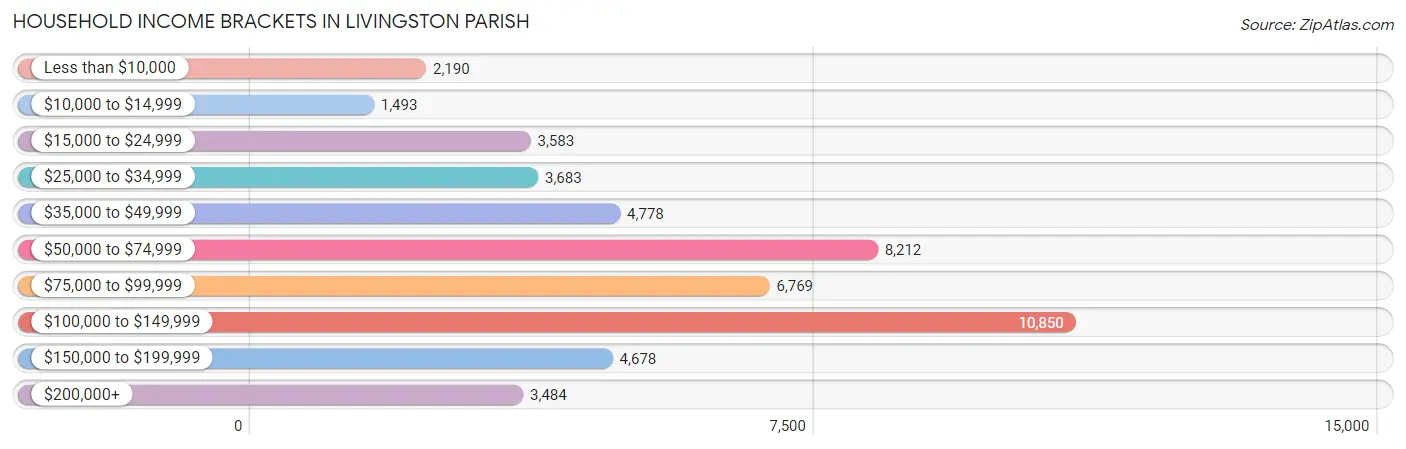
Household Income Brackets in Livingston Parish
With 10,850 households falling in the category, the $100,000 to $149,999 income range is the most frequent in Livingston Parish, accounting for 21.8% of all households. In contrast, only 1,493 households (3.0%) fall into the $10,000 to $14,999 income bracket, making it the least populous group.
| Income Bracket | # Households | % Households |
| Less than $10,000 | 2,190 | 4.4% |
| $10,000 to $14,999 | 1,493 | 3.0% |
| $15,000 to $24,999 | 3,583 | 7.2% |
| $25,000 to $34,999 | 3,683 | 7.4% |
| $35,000 to $49,999 | 4,778 | 9.6% |
| $50,000 to $74,999 | 8,212 | 16.5% |
| $75,000 to $99,999 | 6,769 | 13.6% |
| $100,000 to $149,999 | 10,850 | 21.8% |
| $150,000 to $199,999 | 4,678 | 9.4% |
| $200,000+ | 3,484 | 7.0% |
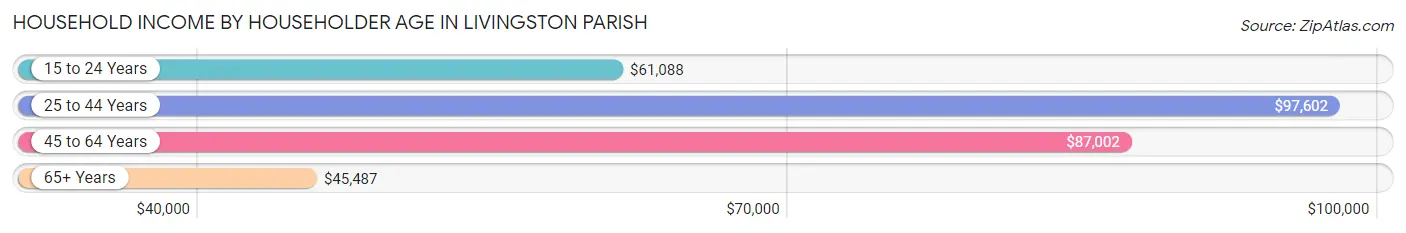
Household Income by Householder Age in Livingston Parish
The median household income in Livingston Parish is $77,978, with the highest median household income of $97,602 found in the 25 to 44 years age bracket for the primary householder. A total of 17,899 households (36.0%) fall into this category. Meanwhile, the 65+ years age bracket for the primary householder has the lowest median household income of $45,487, with 10,833 households (21.8%) in this group.
| Income Bracket | # Households | Median Income |
| 15 to 24 Years | 1,562 (3.1%) | $61,088 |
| 25 to 44 Years | 17,899 (36.0%) | $97,602 |
| 45 to 64 Years | 19,476 (39.1%) | $87,002 |
| 65+ Years | 10,833 (21.8%) | $45,487 |
| Total | 49,770 (100.0%) | $77,978 |
Poverty in Livingston Parish
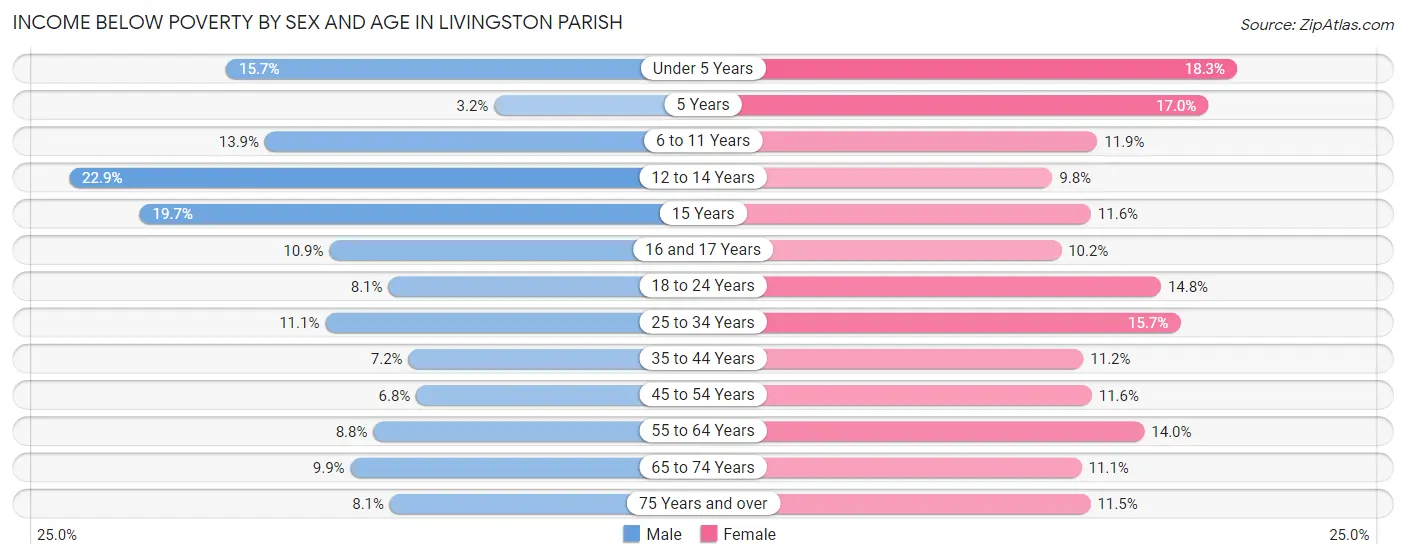
Income Below Poverty by Sex and Age in Livingston Parish
With 10.2% poverty level for males and 13.0% for females among the residents of Livingston Parish, 12 to 14 year old males and under 5 year old females are the most vulnerable to poverty, with 735 males (22.9%) and 861 females (18.3%) in their respective age groups living below the poverty level.
| Age Bracket | Male | Female |
| Under 5 Years | 693 (15.7%) | 861 (18.3%) |
| 5 Years | 49 (3.2%) | 93 (17.0%) |
| 6 to 11 Years | 800 (13.9%) | 692 (11.9%) |
| 12 to 14 Years | 735 (22.9%) | 355 (9.8%) |
| 15 Years | 164 (19.7%) | 104 (11.6%) |
| 16 and 17 Years | 260 (10.9%) | 236 (10.2%) |
| 18 to 24 Years | 493 (8.1%) | 868 (14.8%) |
| 25 to 34 Years | 1,085 (11.1%) | 1,543 (15.7%) |
| 35 to 44 Years | 715 (7.2%) | 1,200 (11.2%) |
| 45 to 54 Years | 610 (6.8%) | 1,020 (11.6%) |
| 55 to 64 Years | 741 (8.8%) | 1,200 (14.0%) |
| 65 to 74 Years | 549 (9.9%) | 709 (11.1%) |
| 75 Years and over | 254 (8.1%) | 467 (11.5%) |
| Total | 7,148 (10.2%) | 9,348 (13.0%) |
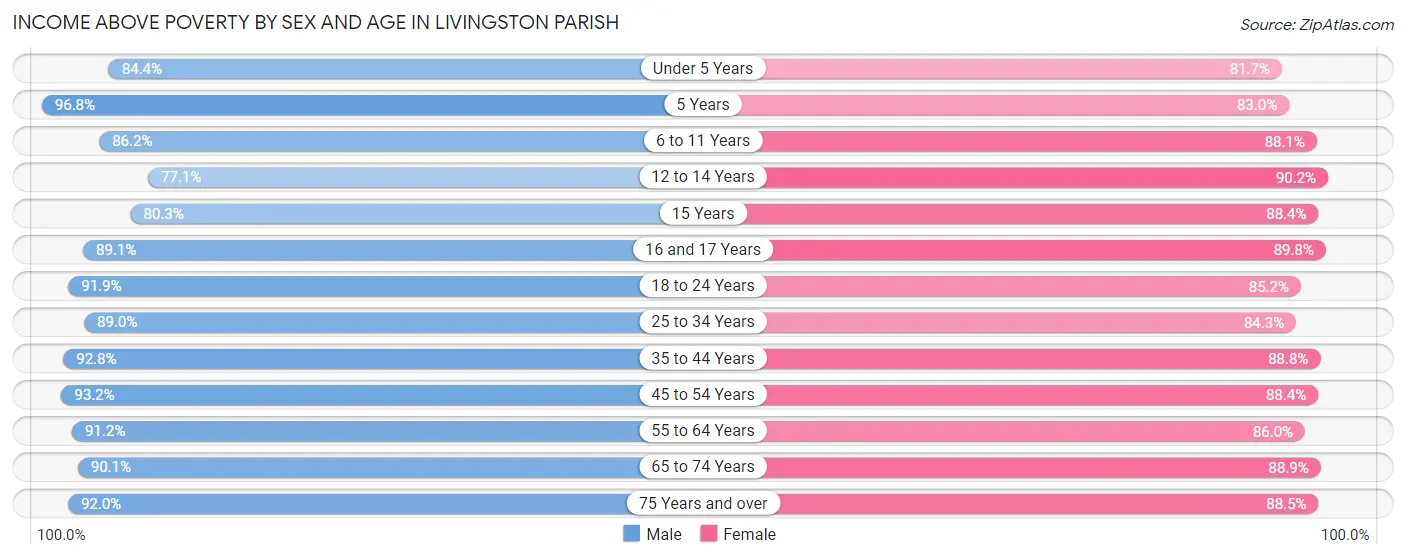
Income Above Poverty by Sex and Age in Livingston Parish
According to the poverty statistics in Livingston Parish, males aged 5 years and females aged 12 to 14 years are the age groups that are most secure financially, with 96.8% of males and 90.2% of females in these age groups living above the poverty line.
| Age Bracket | Male | Female |
| Under 5 Years | 3,736 (84.4%) | 3,835 (81.7%) |
| 5 Years | 1,477 (96.8%) | 454 (83.0%) |
| 6 to 11 Years | 4,977 (86.2%) | 5,145 (88.1%) |
| 12 to 14 Years | 2,471 (77.1%) | 3,279 (90.2%) |
| 15 Years | 670 (80.3%) | 796 (88.4%) |
| 16 and 17 Years | 2,135 (89.1%) | 2,082 (89.8%) |
| 18 to 24 Years | 5,581 (91.9%) | 4,992 (85.2%) |
| 25 to 34 Years | 8,732 (88.9%) | 8,288 (84.3%) |
| 35 to 44 Years | 9,227 (92.8%) | 9,508 (88.8%) |
| 45 to 54 Years | 8,316 (93.2%) | 7,770 (88.4%) |
| 55 to 64 Years | 7,660 (91.2%) | 7,348 (86.0%) |
| 65 to 74 Years | 5,008 (90.1%) | 5,660 (88.9%) |
| 75 Years and over | 2,902 (91.9%) | 3,579 (88.5%) |
| Total | 62,892 (89.8%) | 62,736 (87.0%) |
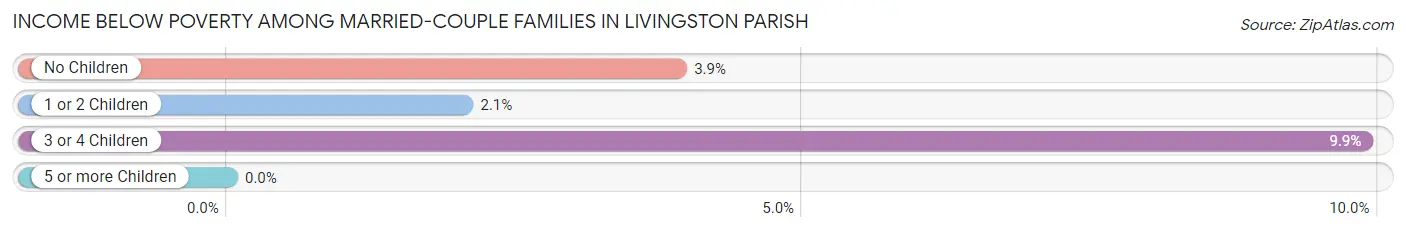
Income Below Poverty Among Married-Couple Families in Livingston Parish
The poverty statistics for married-couple families in Livingston Parish show that 3.8% or 984 of the total 25,555 families live below the poverty line. Families with 3 or 4 children have the highest poverty rate of 9.9%, comprising of 248 families. On the other hand, families with 5 or more children have the lowest poverty rate of 0.0%, which includes 0 families.
| Children | Above Poverty | Below Poverty |
| No Children | 13,896 (96.1%) | 565 (3.9%) |
| 1 or 2 Children | 8,153 (98.0%) | 171 (2.1%) |
| 3 or 4 Children | 2,263 (90.1%) | 248 (9.9%) |
| 5 or more Children | 259 (100.0%) | 0 (0.0%) |
| Total | 24,571 (96.2%) | 984 (3.8%) |
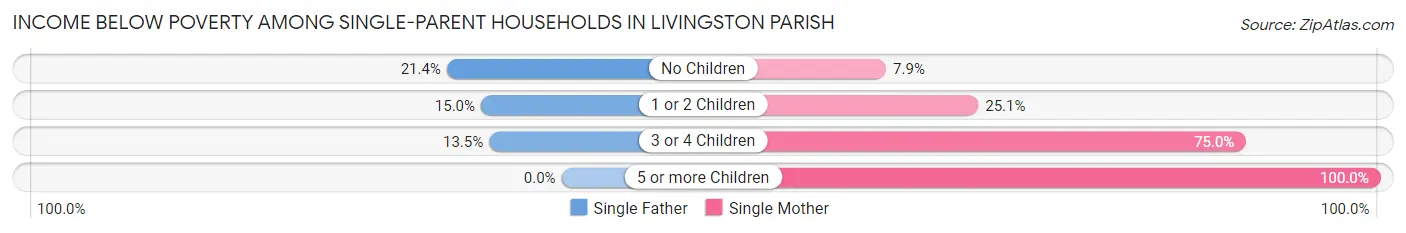
Income Below Poverty Among Single-Parent Households in Livingston Parish
According to the poverty data in Livingston Parish, 17.1% or 566 single-father households and 26.1% or 1,820 single-mother households are living below the poverty line. Among single-father households, those with no children have the highest poverty rate, with 245 households (21.4%) experiencing poverty. Likewise, among single-mother households, those with 5 or more children have the highest poverty rate, with 4 households (100.0%) falling below the poverty line.
| Children | Single Father | Single Mother |
| No Children | 245 (21.4%) | 152 (7.9%) |
| 1 or 2 Children | 275 (15.0%) | 1,071 (25.1%) |
| 3 or 4 Children | 46 (13.5%) | 593 (75.0%) |
| 5 or more Children | 0 (0.0%) | 4 (100.0%) |
| Total | 566 (17.1%) | 1,820 (26.1%) |
Income Below Poverty Among Married-Couple vs Single-Parent Households in Livingston Parish
The poverty data for Livingston Parish shows that 984 of the married-couple family households (3.8%) and 2,386 of the single-parent households (23.2%) are living below the poverty level. Within the married-couple family households, those with 3 or 4 children have the highest poverty rate, with 248 households (9.9%) falling below the poverty line. Among the single-parent households, those with 5 or more children have the highest poverty rate, with 4 household (100.0%) living below poverty.
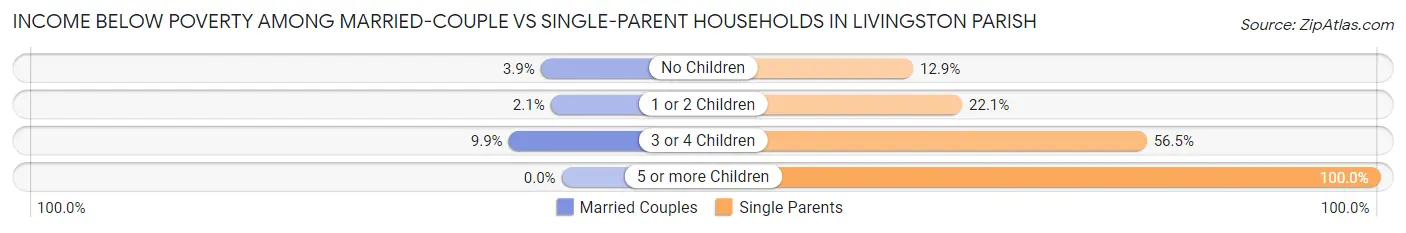
| Children | Married-Couple Families | Single-Parent Households |
| No Children | 565 (3.9%) | 397 (12.9%) |
| 1 or 2 Children | 171 (2.1%) | 1,346 (22.1%) |
| 3 or 4 Children | 248 (9.9%) | 639 (56.5%) |
| 5 or more Children | 0 (0.0%) | 4 (100.0%) |
| Total | 984 (3.8%) | 2,386 (23.2%) |
Employment Characteristics in Livingston Parish
Employment by Class of Employer in Livingston Parish
Among the 64,898 employed individuals in Livingston Parish, private company employees (45,102 | 69.5%), local government employees (5,200 | 8.0%), and self-employed (not incorporated) (4,786 | 7.4%) make up the most common classes of employment.
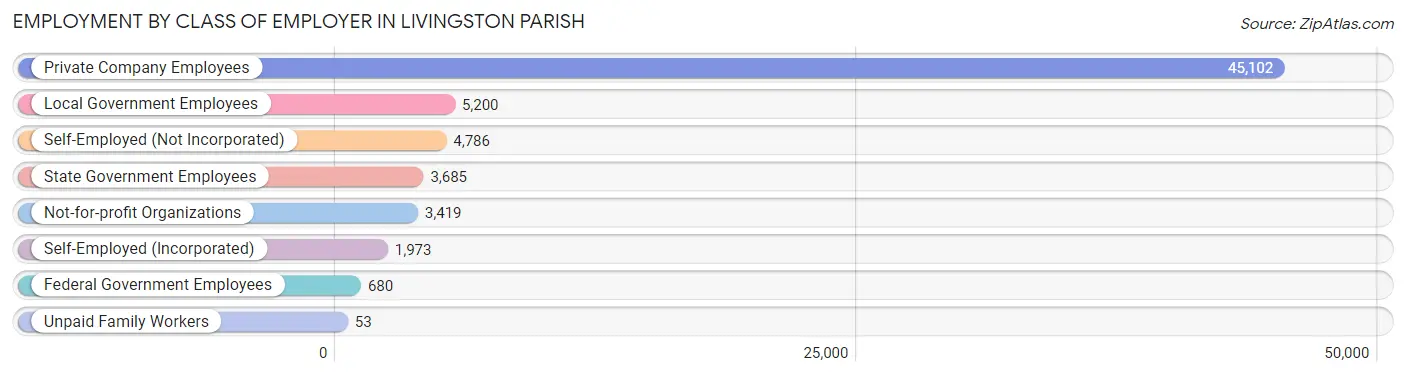
| Employer Class | # Employees | % Employees |
| Private Company Employees | 45,102 | 69.5% |
| Self-Employed (Incorporated) | 1,973 | 3.0% |
| Self-Employed (Not Incorporated) | 4,786 | 7.4% |
| Not-for-profit Organizations | 3,419 | 5.3% |
| Local Government Employees | 5,200 | 8.0% |
| State Government Employees | 3,685 | 5.7% |
| Federal Government Employees | 680 | 1.1% |
| Unpaid Family Workers | 53 | 0.1% |
| Total | 64,898 | 100.0% |
Employment Status by Age in Livingston Parish
According to the labor force statistics for Livingston Parish, out of the total population over 16 years of age (111,663), 61.3% or 68,449 individuals are in the labor force, with 4.5% or 3,080 of them unemployed. The age group with the highest labor force participation rate is 25 to 29 years, with 81.6% or 7,931 individuals in the labor force. Within the labor force, the 16 to 19 years age range has the highest percentage of unemployed individuals, with 14.2% or 441 of them being unemployed.
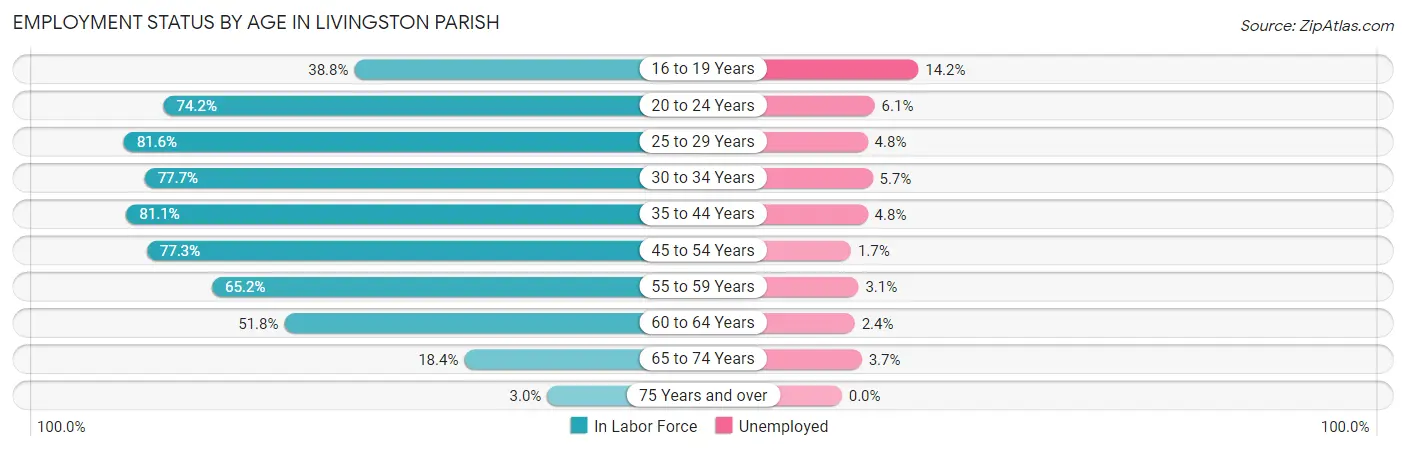
| Age Bracket | In Labor Force | Unemployed |
| 16 to 19 Years | 3,106 (38.8%) | 441 (14.2%) |
| 20 to 24 Years | 6,469 (74.2%) | 395 (6.1%) |
| 25 to 29 Years | 7,931 (81.6%) | 381 (4.8%) |
| 30 to 34 Years | 7,907 (77.7%) | 451 (5.7%) |
| 35 to 44 Years | 16,913 (81.1%) | 812 (4.8%) |
| 45 to 54 Years | 13,747 (77.3%) | 234 (1.7%) |
| 55 to 59 Years | 5,592 (65.2%) | 173 (3.1%) |
| 60 to 64 Years | 4,363 (51.8%) | 105 (2.4%) |
| 65 to 74 Years | 2,205 (18.4%) | 82 (3.7%) |
| 75 Years and over | 223 (3.0%) | 0 (0.0%) |
| Total | 68,449 (61.3%) | 3,080 (4.5%) |
Employment Status by Educational Attainment in Livingston Parish
According to labor force statistics for Livingston Parish, 74.7% of individuals (56,424) out of the total population between 25 and 64 years of age (75,534) are in the labor force, with 3.8% or 2,144 of them being unemployed. The group with the highest labor force participation rate are those with the educational attainment of bachelor's degree or higher, with 86.0% or 14,979 individuals in the labor force. Within the labor force, individuals with high school diploma education have the highest percentage of unemployment, with 6.8% or 1,315 of them being unemployed.
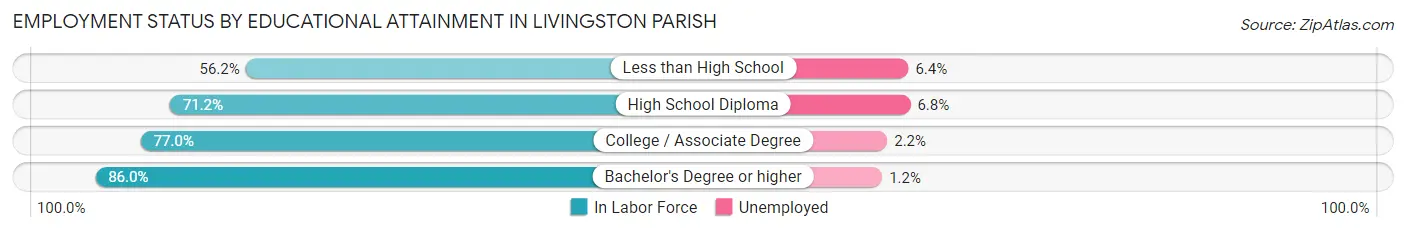
| Educational Attainment | In Labor Force | Unemployed |
| Less than High School | 4,634 (56.2%) | 528 (6.4%) |
| High School Diploma | 19,333 (71.2%) | 1,846 (6.8%) |
| College / Associate Degree | 17,493 (77.0%) | 500 (2.2%) |
| Bachelor's Degree or higher | 14,979 (86.0%) | 209 (1.2%) |
| Total | 56,424 (74.7%) | 2,870 (3.8%) |
Employment Occupations by Sex in Livingston Parish
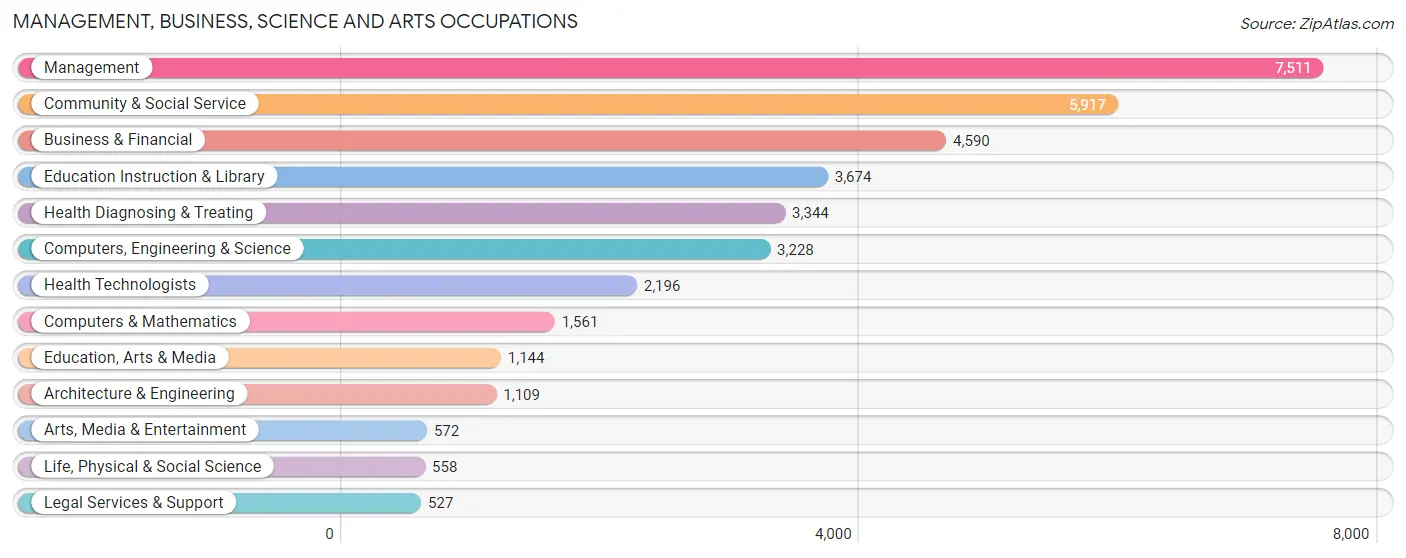
Management, Business, Science and Arts Occupations
The most common Management, Business, Science and Arts occupations in Livingston Parish are Management (7,511 | 11.5%), Community & Social Service (5,917 | 9.1%), Business & Financial (4,590 | 7.0%), Education Instruction & Library (3,674 | 5.6%), and Health Diagnosing & Treating (3,344 | 5.1%).
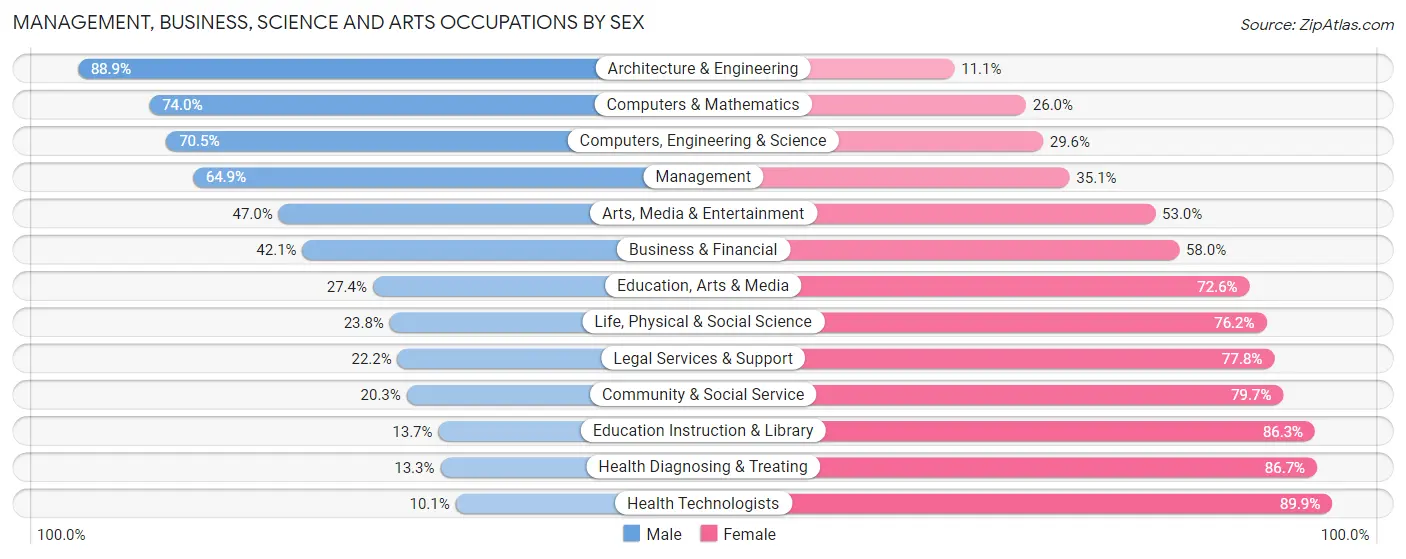
Management, Business, Science and Arts Occupations by Sex
Within the Management, Business, Science and Arts occupations in Livingston Parish, the most male-oriented occupations are Architecture & Engineering (88.9%), Computers & Mathematics (74.0%), and Computers, Engineering & Science (70.5%), while the most female-oriented occupations are Health Technologists (89.9%), Health Diagnosing & Treating (86.7%), and Education Instruction & Library (86.3%).
| Occupation | Male | Female |
| Management | 4,875 (64.9%) | 2,636 (35.1%) |
| Business & Financial | 1,930 (42.0%) | 2,660 (58.0%) |
| Computers, Engineering & Science | 2,274 (70.5%) | 954 (29.5%) |
| Computers & Mathematics | 1,155 (74.0%) | 406 (26.0%) |
| Architecture & Engineering | 986 (88.9%) | 123 (11.1%) |
| Life, Physical & Social Science | 133 (23.8%) | 425 (76.2%) |
| Community & Social Service | 1,202 (20.3%) | 4,715 (79.7%) |
| Education, Arts & Media | 313 (27.4%) | 831 (72.6%) |
| Legal Services & Support | 117 (22.2%) | 410 (77.8%) |
| Education Instruction & Library | 503 (13.7%) | 3,171 (86.3%) |
| Arts, Media & Entertainment | 269 (47.0%) | 303 (53.0%) |
| Health Diagnosing & Treating | 444 (13.3%) | 2,900 (86.7%) |
| Health Technologists | 222 (10.1%) | 1,974 (89.9%) |
| Total (Category) | 10,725 (43.6%) | 13,865 (56.4%) |
| Total (Overall) | 35,202 (54.0%) | 30,011 (46.0%) |
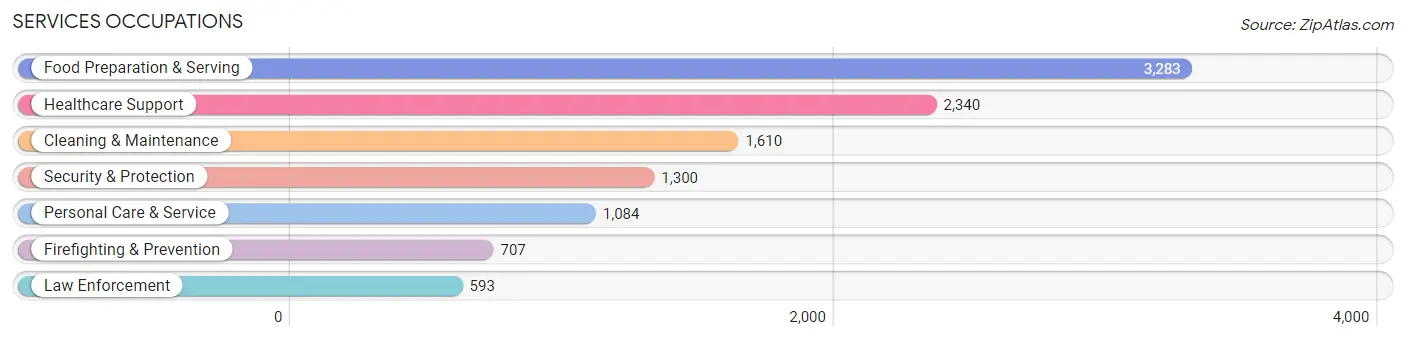
Services Occupations
The most common Services occupations in Livingston Parish are Food Preparation & Serving (3,283 | 5.0%), Healthcare Support (2,340 | 3.6%), Cleaning & Maintenance (1,610 | 2.5%), Security & Protection (1,300 | 2.0%), and Personal Care & Service (1,084 | 1.7%).
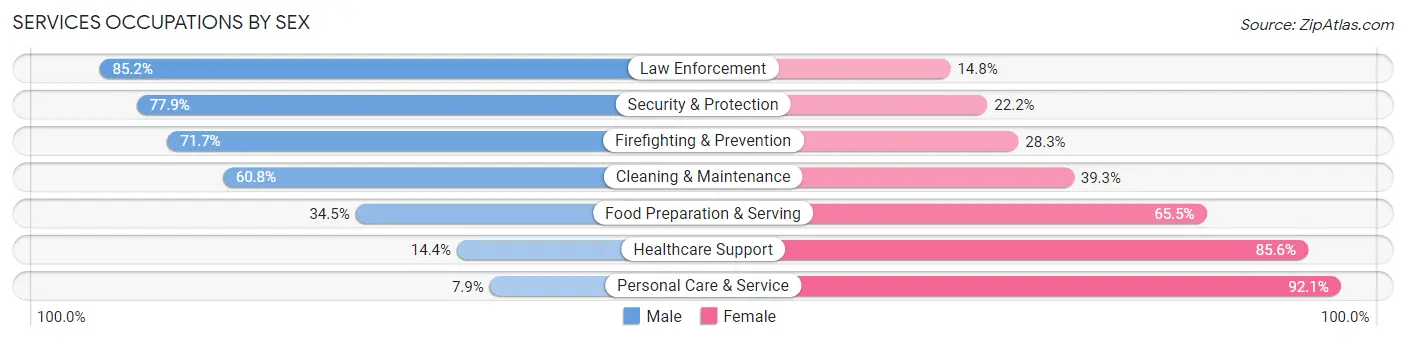
Services Occupations by Sex
Within the Services occupations in Livingston Parish, the most male-oriented occupations are Law Enforcement (85.2%), Security & Protection (77.8%), and Firefighting & Prevention (71.7%), while the most female-oriented occupations are Personal Care & Service (92.1%), Healthcare Support (85.6%), and Food Preparation & Serving (65.5%).
| Occupation | Male | Female |
| Healthcare Support | 337 (14.4%) | 2,003 (85.6%) |
| Security & Protection | 1,012 (77.8%) | 288 (22.2%) |
| Firefighting & Prevention | 507 (71.7%) | 200 (28.3%) |
| Law Enforcement | 505 (85.2%) | 88 (14.8%) |
| Food Preparation & Serving | 1,132 (34.5%) | 2,151 (65.5%) |
| Cleaning & Maintenance | 978 (60.8%) | 632 (39.3%) |
| Personal Care & Service | 86 (7.9%) | 998 (92.1%) |
| Total (Category) | 3,545 (36.9%) | 6,072 (63.1%) |
| Total (Overall) | 35,202 (54.0%) | 30,011 (46.0%) |
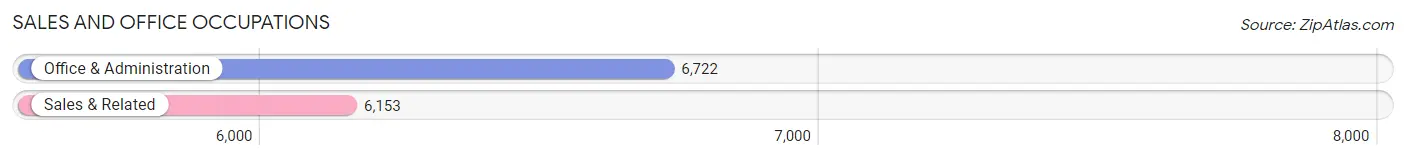
Sales and Office Occupations
The most common Sales and Office occupations in Livingston Parish are Office & Administration (6,722 | 10.3%), and Sales & Related (6,153 | 9.4%).
Sales and Office Occupations by Sex
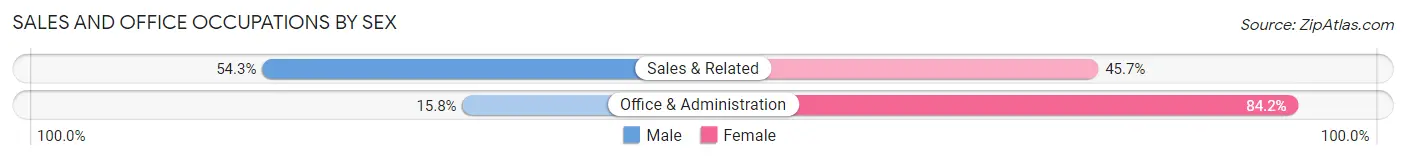
| Occupation | Male | Female |
| Sales & Related | 3,341 (54.3%) | 2,812 (45.7%) |
| Office & Administration | 1,062 (15.8%) | 5,660 (84.2%) |
| Total (Category) | 4,403 (34.2%) | 8,472 (65.8%) |
| Total (Overall) | 35,202 (54.0%) | 30,011 (46.0%) |
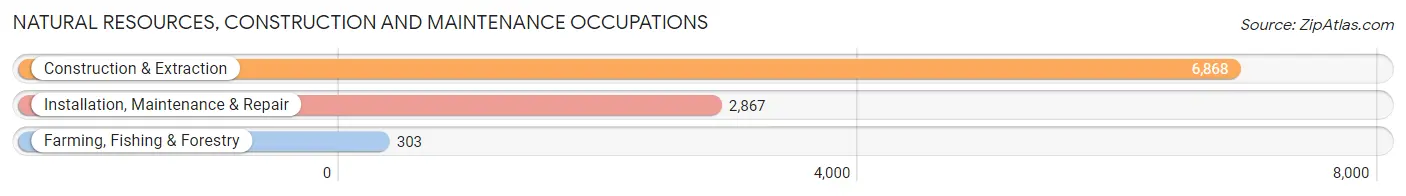
Natural Resources, Construction and Maintenance Occupations
The most common Natural Resources, Construction and Maintenance occupations in Livingston Parish are Construction & Extraction (6,868 | 10.5%), Installation, Maintenance & Repair (2,867 | 4.4%), and Farming, Fishing & Forestry (303 | 0.5%).
Natural Resources, Construction and Maintenance Occupations by Sex
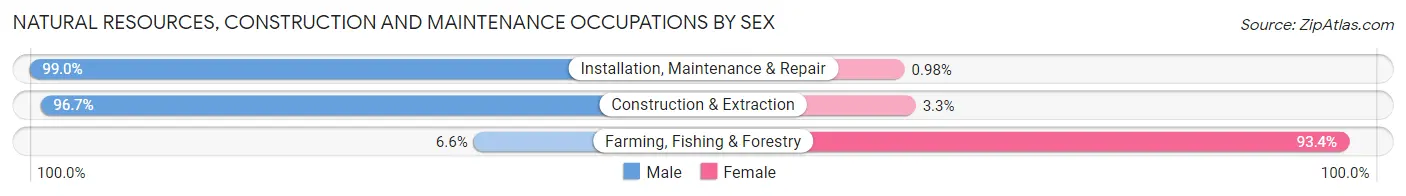
| Occupation | Male | Female |
| Farming, Fishing & Forestry | 20 (6.6%) | 283 (93.4%) |
| Construction & Extraction | 6,642 (96.7%) | 226 (3.3%) |
| Installation, Maintenance & Repair | 2,839 (99.0%) | 28 (1.0%) |
| Total (Category) | 9,501 (94.7%) | 537 (5.3%) |
| Total (Overall) | 35,202 (54.0%) | 30,011 (46.0%) |
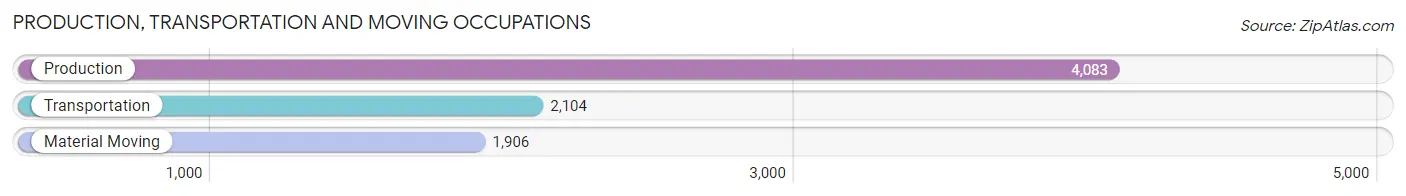
Production, Transportation and Moving Occupations
The most common Production, Transportation and Moving occupations in Livingston Parish are Production (4,083 | 6.3%), Transportation (2,104 | 3.2%), and Material Moving (1,906 | 2.9%).
Production, Transportation and Moving Occupations by Sex
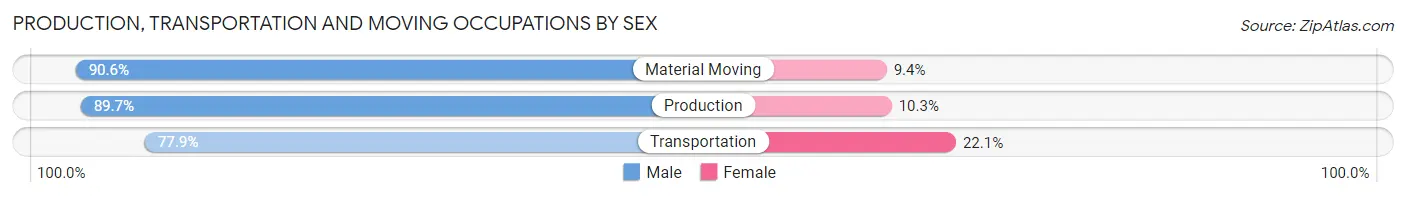
| Occupation | Male | Female |
| Production | 3,662 (89.7%) | 421 (10.3%) |
| Transportation | 1,639 (77.9%) | 465 (22.1%) |
| Material Moving | 1,727 (90.6%) | 179 (9.4%) |
| Total (Category) | 7,028 (86.8%) | 1,065 (13.2%) |
| Total (Overall) | 35,202 (54.0%) | 30,011 (46.0%) |
Employment Industries by Sex in Livingston Parish
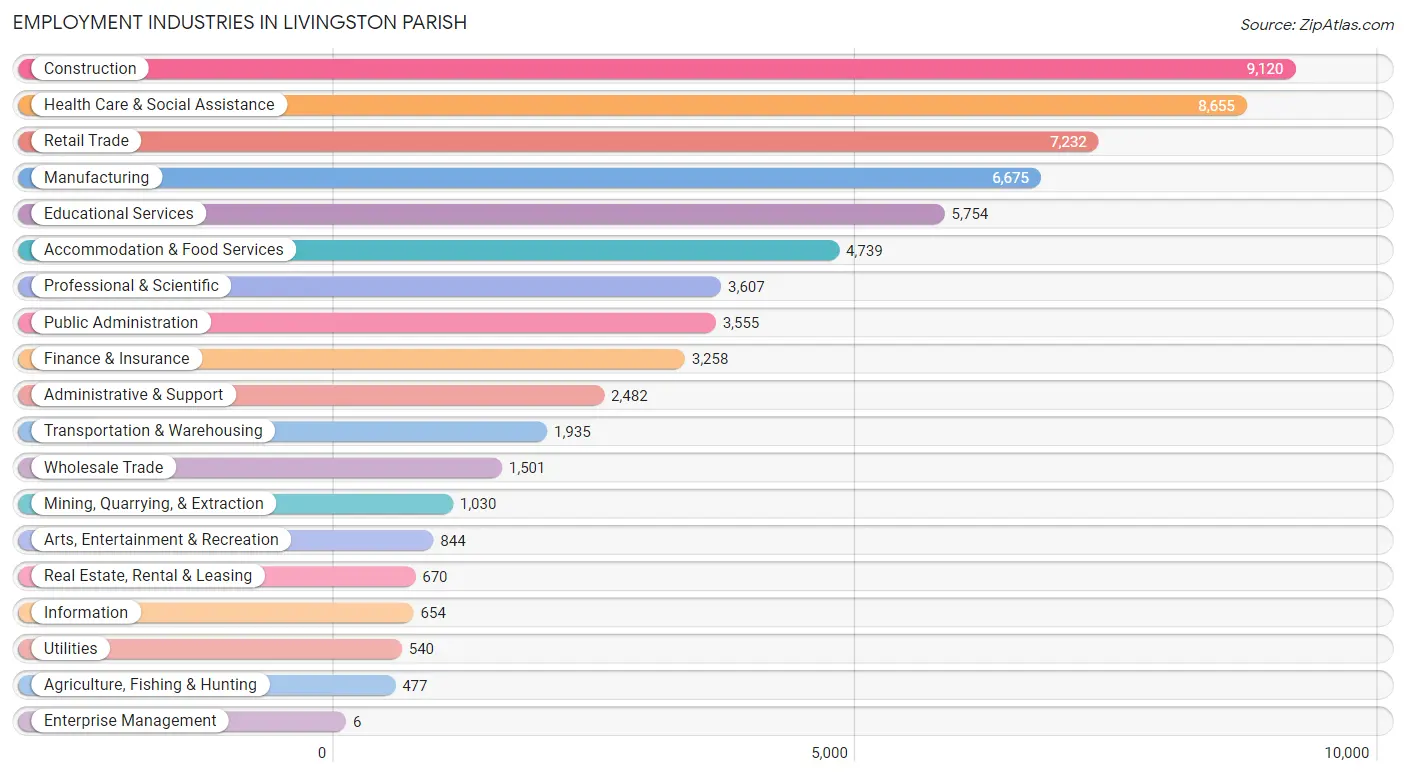
Employment Industries in Livingston Parish
The major employment industries in Livingston Parish include Construction (9,120 | 14.0%), Health Care & Social Assistance (8,655 | 13.3%), Retail Trade (7,232 | 11.1%), Manufacturing (6,675 | 10.2%), and Educational Services (5,754 | 8.8%).
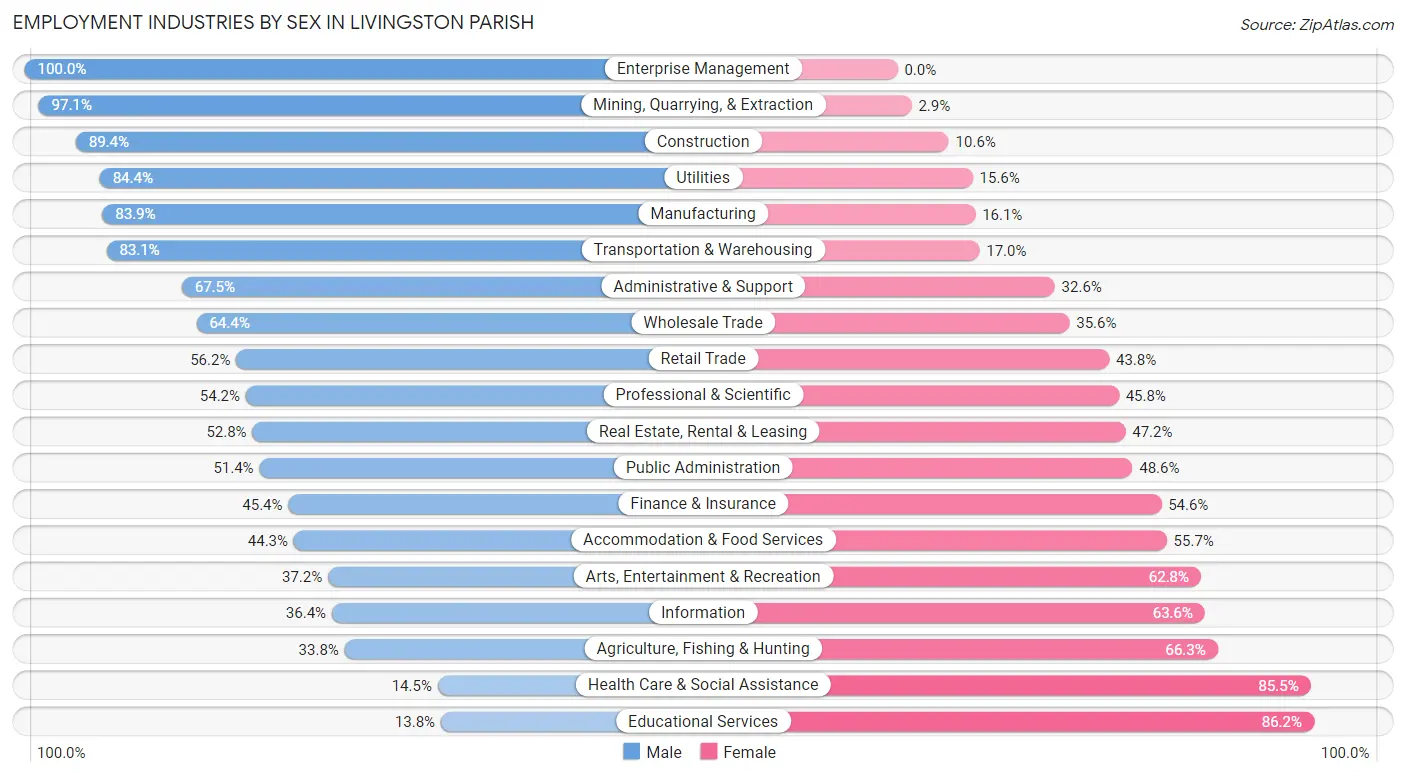
Employment Industries by Sex in Livingston Parish
The Livingston Parish industries that see more men than women are Enterprise Management (100.0%), Mining, Quarrying, & Extraction (97.1%), and Construction (89.4%), whereas the industries that tend to have a higher number of women are Educational Services (86.2%), Health Care & Social Assistance (85.5%), and Agriculture, Fishing & Hunting (66.2%).
| Industry | Male | Female |
| Agriculture, Fishing & Hunting | 161 (33.8%) | 316 (66.2%) |
| Mining, Quarrying, & Extraction | 1,000 (97.1%) | 30 (2.9%) |
| Construction | 8,153 (89.4%) | 967 (10.6%) |
| Manufacturing | 5,600 (83.9%) | 1,075 (16.1%) |
| Wholesale Trade | 967 (64.4%) | 534 (35.6%) |
| Retail Trade | 4,064 (56.2%) | 3,168 (43.8%) |
| Transportation & Warehousing | 1,607 (83.1%) | 328 (17.0%) |
| Utilities | 456 (84.4%) | 84 (15.6%) |
| Information | 238 (36.4%) | 416 (63.6%) |
| Finance & Insurance | 1,479 (45.4%) | 1,779 (54.6%) |
| Real Estate, Rental & Leasing | 354 (52.8%) | 316 (47.2%) |
| Professional & Scientific | 1,955 (54.2%) | 1,652 (45.8%) |
| Enterprise Management | 6 (100.0%) | 0 (0.0%) |
| Administrative & Support | 1,674 (67.4%) | 808 (32.6%) |
| Educational Services | 795 (13.8%) | 4,959 (86.2%) |
| Health Care & Social Assistance | 1,254 (14.5%) | 7,401 (85.5%) |
| Arts, Entertainment & Recreation | 314 (37.2%) | 530 (62.8%) |
| Accommodation & Food Services | 2,098 (44.3%) | 2,641 (55.7%) |
| Public Administration | 1,827 (51.4%) | 1,728 (48.6%) |
| Total | 35,202 (54.0%) | 30,011 (46.0%) |
Education in Livingston Parish
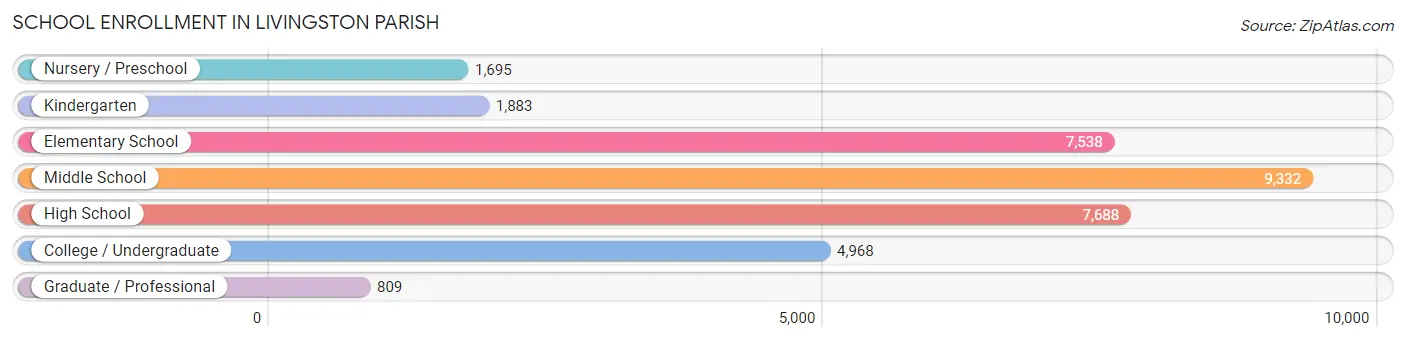
School Enrollment in Livingston Parish
The most common levels of schooling among the 33,913 students in Livingston Parish are middle school (9,332 | 27.5%), high school (7,688 | 22.7%), and elementary school (7,538 | 22.2%).
| School Level | # Students | % Students |
| Nursery / Preschool | 1,695 | 5.0% |
| Kindergarten | 1,883 | 5.6% |
| Elementary School | 7,538 | 22.2% |
| Middle School | 9,332 | 27.5% |
| High School | 7,688 | 22.7% |
| College / Undergraduate | 4,968 | 14.6% |
| Graduate / Professional | 809 | 2.4% |
| Total | 33,913 | 100.0% |
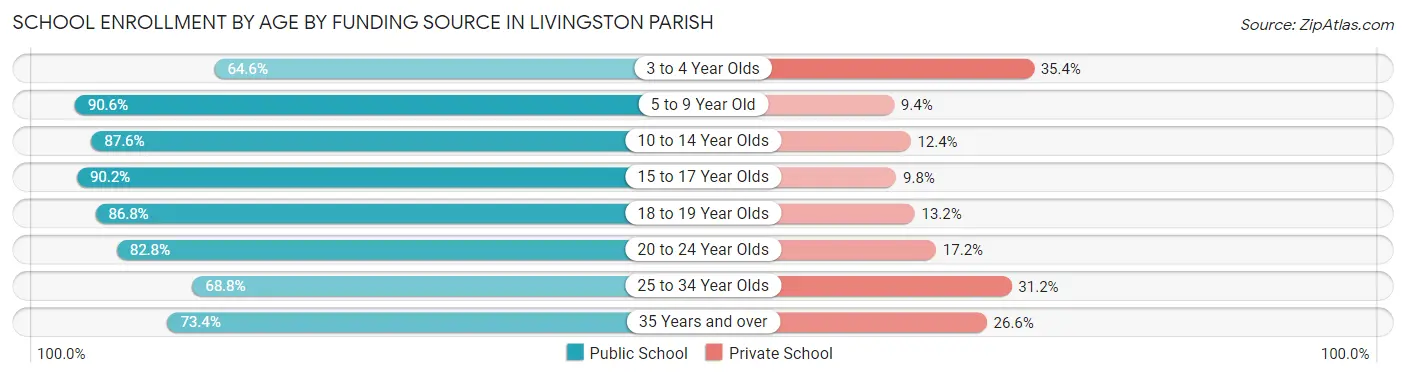
School Enrollment by Age by Funding Source in Livingston Parish
Out of a total of 33,913 students who are enrolled in schools in Livingston Parish, 4,544 (13.4%) attend a private institution, while the remaining 29,369 (86.6%) are enrolled in public schools. The age group of 3 to 4 year olds has the highest likelihood of being enrolled in private schools, with 418 (35.4% in the age bracket) enrolled. Conversely, the age group of 5 to 9 year old has the lowest likelihood of being enrolled in a private school, with 8,458 (90.6% in the age bracket) attending a public institution.
| Age Bracket | Public School | Private School |
| 3 to 4 Year Olds | 763 (64.6%) | 418 (35.4%) |
| 5 to 9 Year Old | 8,458 (90.6%) | 873 (9.4%) |
| 10 to 14 Year Olds | 9,470 (87.6%) | 1,345 (12.4%) |
| 15 to 17 Year Olds | 5,417 (90.2%) | 586 (9.8%) |
| 18 to 19 Year Olds | 1,703 (86.8%) | 259 (13.2%) |
| 20 to 24 Year Olds | 2,145 (82.8%) | 445 (17.2%) |
| 25 to 34 Year Olds | 973 (68.8%) | 442 (31.2%) |
| 35 Years and over | 452 (73.4%) | 164 (26.6%) |
| Total | 29,369 (86.6%) | 4,544 (13.4%) |
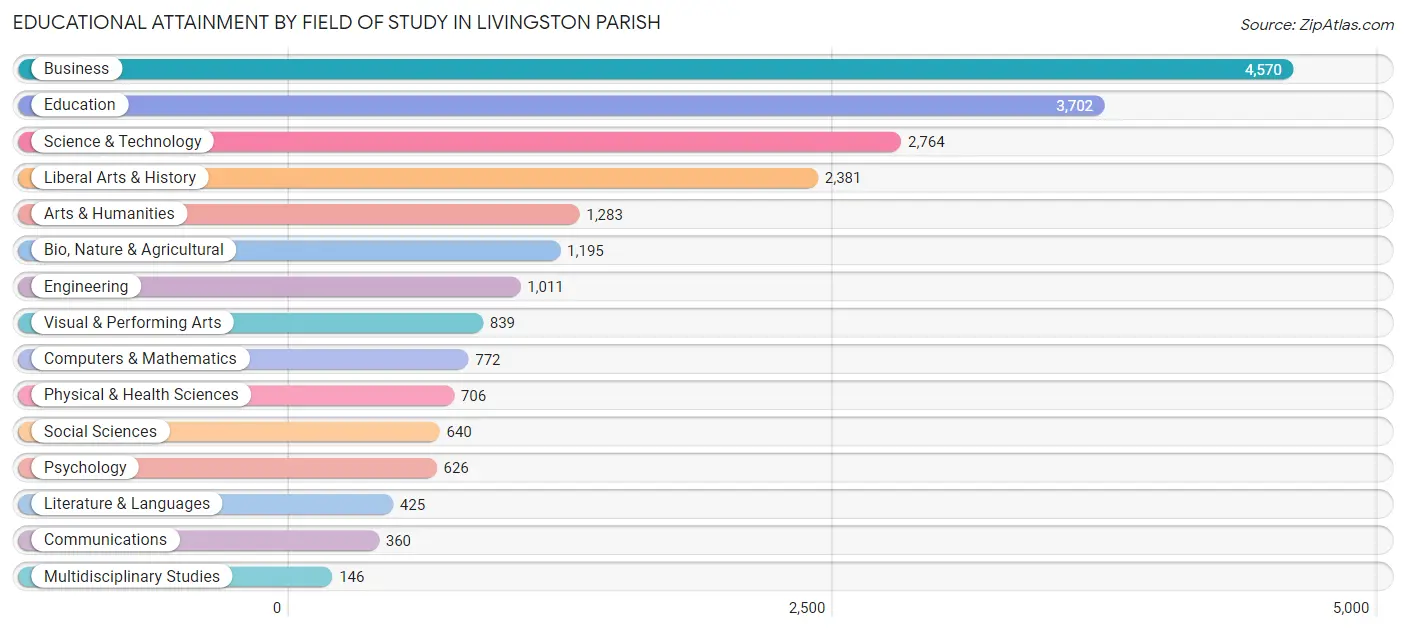
Educational Attainment by Field of Study in Livingston Parish
Business (4,570 | 21.3%), education (3,702 | 17.3%), science & technology (2,764 | 12.9%), liberal arts & history (2,381 | 11.1%), and arts & humanities (1,283 | 6.0%) are the most common fields of study among 21,420 individuals in Livingston Parish who have obtained a bachelor's degree or higher.
| Field of Study | # Graduates | % Graduates |
| Computers & Mathematics | 772 | 3.6% |
| Bio, Nature & Agricultural | 1,195 | 5.6% |
| Physical & Health Sciences | 706 | 3.3% |
| Psychology | 626 | 2.9% |
| Social Sciences | 640 | 3.0% |
| Engineering | 1,011 | 4.7% |
| Multidisciplinary Studies | 146 | 0.7% |
| Science & Technology | 2,764 | 12.9% |
| Business | 4,570 | 21.3% |
| Education | 3,702 | 17.3% |
| Literature & Languages | 425 | 2.0% |
| Liberal Arts & History | 2,381 | 11.1% |
| Visual & Performing Arts | 839 | 3.9% |
| Communications | 360 | 1.7% |
| Arts & Humanities | 1,283 | 6.0% |
| Total | 21,420 | 100.0% |
Transportation & Commute in Livingston Parish
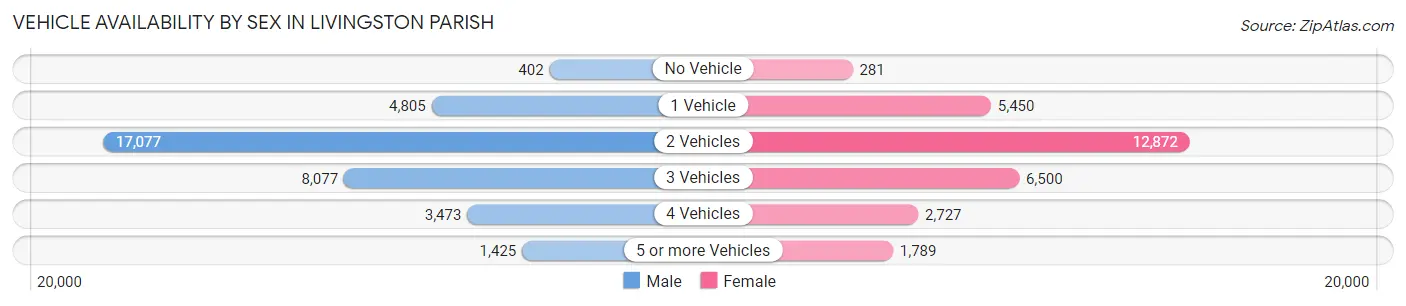
Vehicle Availability by Sex in Livingston Parish
The most prevalent vehicle ownership categories in Livingston Parish are males with 2 vehicles (17,077, accounting for 48.4%) and females with 2 vehicles (12,872, making up 57.7%).
| Vehicles Available | Male | Female |
| No Vehicle | 402 (1.1%) | 281 (0.9%) |
| 1 Vehicle | 4,805 (13.6%) | 5,450 (18.4%) |
| 2 Vehicles | 17,077 (48.4%) | 12,872 (43.5%) |
| 3 Vehicles | 8,077 (22.9%) | 6,500 (22.0%) |
| 4 Vehicles | 3,473 (9.9%) | 2,727 (9.2%) |
| 5 or more Vehicles | 1,425 (4.0%) | 1,789 (6.0%) |
| Total | 35,259 (100.0%) | 29,619 (100.0%) |
Commute Time in Livingston Parish
The most frequently occuring commute durations in Livingston Parish are 45 to 59 minutes (10,814 commuters, 17.6%), 30 to 34 minutes (10,193 commuters, 16.6%), and 20 to 24 minutes (6,851 commuters, 11.2%).
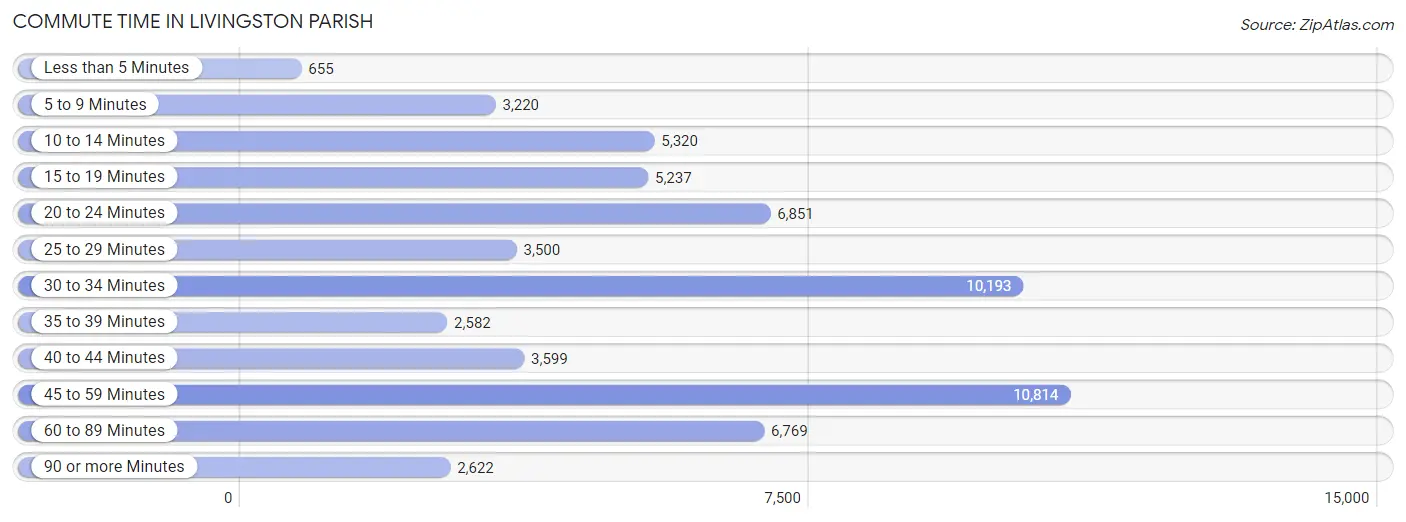
| Commute Time | # Commuters | % Commuters |
| Less than 5 Minutes | 655 | 1.1% |
| 5 to 9 Minutes | 3,220 | 5.2% |
| 10 to 14 Minutes | 5,320 | 8.7% |
| 15 to 19 Minutes | 5,237 | 8.5% |
| 20 to 24 Minutes | 6,851 | 11.2% |
| 25 to 29 Minutes | 3,500 | 5.7% |
| 30 to 34 Minutes | 10,193 | 16.6% |
| 35 to 39 Minutes | 2,582 | 4.2% |
| 40 to 44 Minutes | 3,599 | 5.9% |
| 45 to 59 Minutes | 10,814 | 17.6% |
| 60 to 89 Minutes | 6,769 | 11.0% |
| 90 or more Minutes | 2,622 | 4.3% |
Commute Time by Sex in Livingston Parish
The most common commute times in Livingston Parish are 45 to 59 minutes (6,998 commuters, 20.8%) for males and 30 to 34 minutes (4,967 commuters, 17.9%) for females.
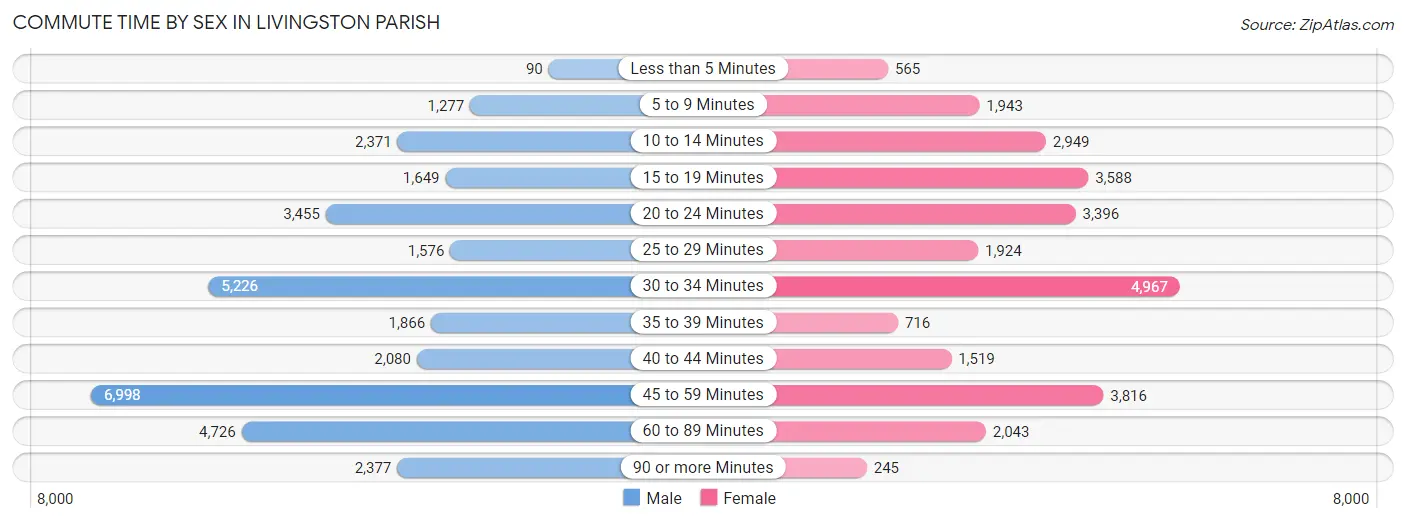
| Commute Time | Male | Female |
| Less than 5 Minutes | 90 (0.3%) | 565 (2.0%) |
| 5 to 9 Minutes | 1,277 (3.8%) | 1,943 (7.0%) |
| 10 to 14 Minutes | 2,371 (7.0%) | 2,949 (10.7%) |
| 15 to 19 Minutes | 1,649 (4.9%) | 3,588 (13.0%) |
| 20 to 24 Minutes | 3,455 (10.2%) | 3,396 (12.3%) |
| 25 to 29 Minutes | 1,576 (4.7%) | 1,924 (7.0%) |
| 30 to 34 Minutes | 5,226 (15.5%) | 4,967 (17.9%) |
| 35 to 39 Minutes | 1,866 (5.5%) | 716 (2.6%) |
| 40 to 44 Minutes | 2,080 (6.2%) | 1,519 (5.5%) |
| 45 to 59 Minutes | 6,998 (20.8%) | 3,816 (13.8%) |
| 60 to 89 Minutes | 4,726 (14.0%) | 2,043 (7.4%) |
| 90 or more Minutes | 2,377 (7.1%) | 245 (0.9%) |
Time of Departure to Work by Sex in Livingston Parish
The most frequent times of departure to work in Livingston Parish are 12:00 AM to 4:59 AM (7,247, 21.5%) for males and 7:00 AM to 7:29 AM (5,117, 18.5%) for females.
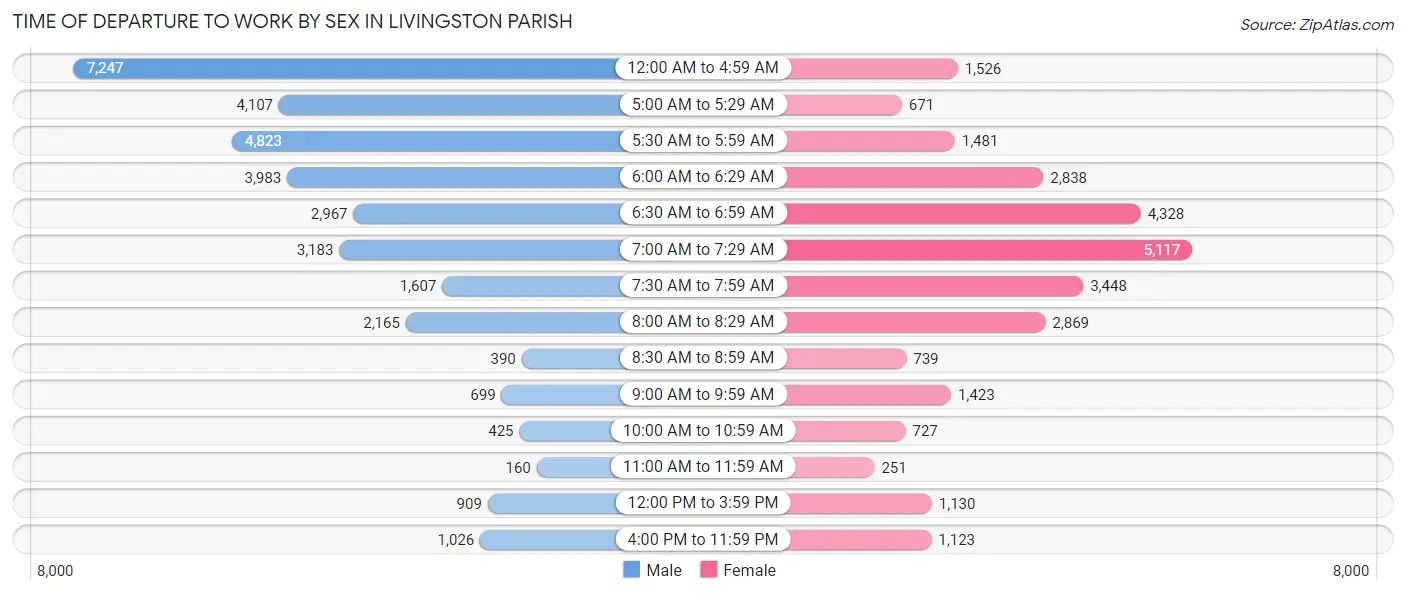
| Time of Departure | Male | Female |
| 12:00 AM to 4:59 AM | 7,247 (21.5%) | 1,526 (5.5%) |
| 5:00 AM to 5:29 AM | 4,107 (12.2%) | 671 (2.4%) |
| 5:30 AM to 5:59 AM | 4,823 (14.3%) | 1,481 (5.3%) |
| 6:00 AM to 6:29 AM | 3,983 (11.8%) | 2,838 (10.3%) |
| 6:30 AM to 6:59 AM | 2,967 (8.8%) | 4,328 (15.6%) |
| 7:00 AM to 7:29 AM | 3,183 (9.5%) | 5,117 (18.5%) |
| 7:30 AM to 7:59 AM | 1,607 (4.8%) | 3,448 (12.5%) |
| 8:00 AM to 8:29 AM | 2,165 (6.4%) | 2,869 (10.4%) |
| 8:30 AM to 8:59 AM | 390 (1.2%) | 739 (2.7%) |
| 9:00 AM to 9:59 AM | 699 (2.1%) | 1,423 (5.1%) |
| 10:00 AM to 10:59 AM | 425 (1.3%) | 727 (2.6%) |
| 11:00 AM to 11:59 AM | 160 (0.5%) | 251 (0.9%) |
| 12:00 PM to 3:59 PM | 909 (2.7%) | 1,130 (4.1%) |
| 4:00 PM to 11:59 PM | 1,026 (3.0%) | 1,123 (4.1%) |
| Total | 33,691 (100.0%) | 27,671 (100.0%) |
Housing Occupancy in Livingston Parish
Occupancy by Ownership in Livingston Parish
Of the total 49,770 dwellings in Livingston Parish, owner-occupied units account for 40,937 (82.3%), while renter-occupied units make up 8,833 (17.7%).
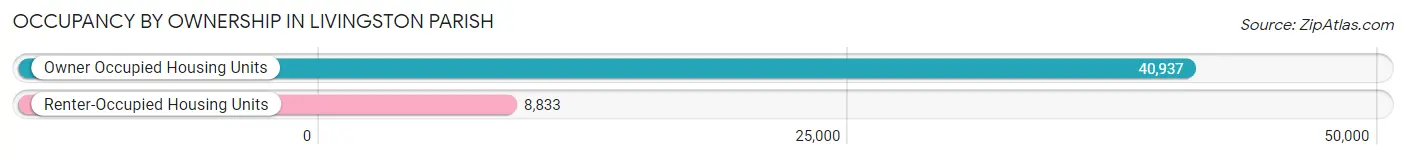
| Occupancy | # Housing Units | % Housing Units |
| Owner Occupied Housing Units | 40,937 | 82.3% |
| Renter-Occupied Housing Units | 8,833 | 17.7% |
| Total Occupied Housing Units | 49,770 | 100.0% |
Occupancy by Household Size in Livingston Parish
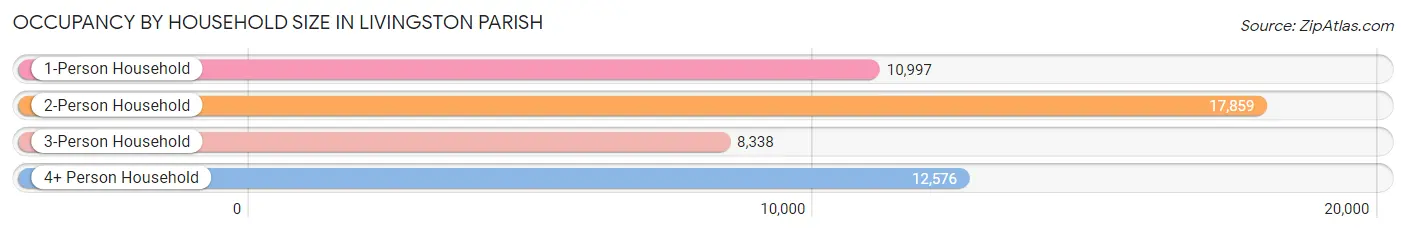
| Household Size | # Housing Units | % Housing Units |
| 1-Person Household | 10,997 | 22.1% |
| 2-Person Household | 17,859 | 35.9% |
| 3-Person Household | 8,338 | 16.8% |
| 4+ Person Household | 12,576 | 25.3% |
| Total Housing Units | 49,770 | 100.0% |
Occupancy by Ownership by Household Size in Livingston Parish
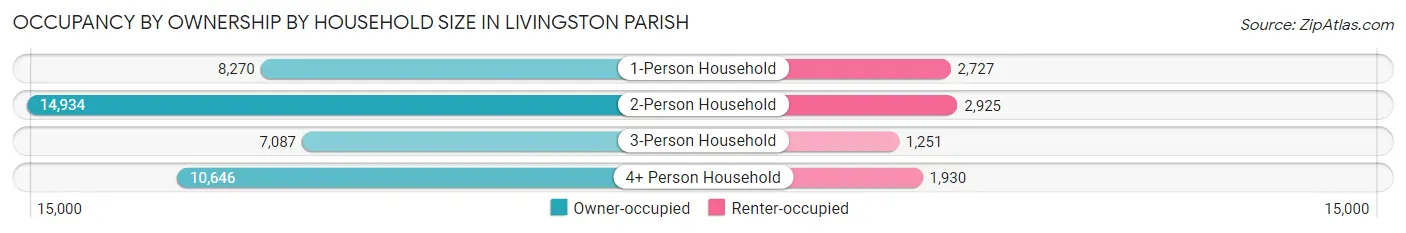
| Household Size | Owner-occupied | Renter-occupied |
| 1-Person Household | 8,270 (75.2%) | 2,727 (24.8%) |
| 2-Person Household | 14,934 (83.6%) | 2,925 (16.4%) |
| 3-Person Household | 7,087 (85.0%) | 1,251 (15.0%) |
| 4+ Person Household | 10,646 (84.7%) | 1,930 (15.3%) |
| Total Housing Units | 40,937 (82.3%) | 8,833 (17.7%) |
Occupancy by Educational Attainment in Livingston Parish
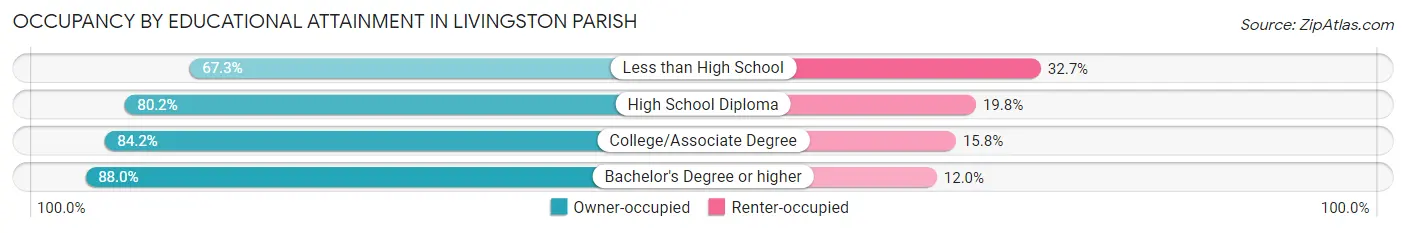
| Household Size | Owner-occupied | Renter-occupied |
| Less than High School | 3,132 (67.3%) | 1,519 (32.7%) |
| High School Diploma | 13,090 (80.2%) | 3,230 (19.8%) |
| College/Associate Degree | 13,714 (84.2%) | 2,579 (15.8%) |
| Bachelor's Degree or higher | 11,001 (88.0%) | 1,505 (12.0%) |
Occupancy by Age of Householder in Livingston Parish
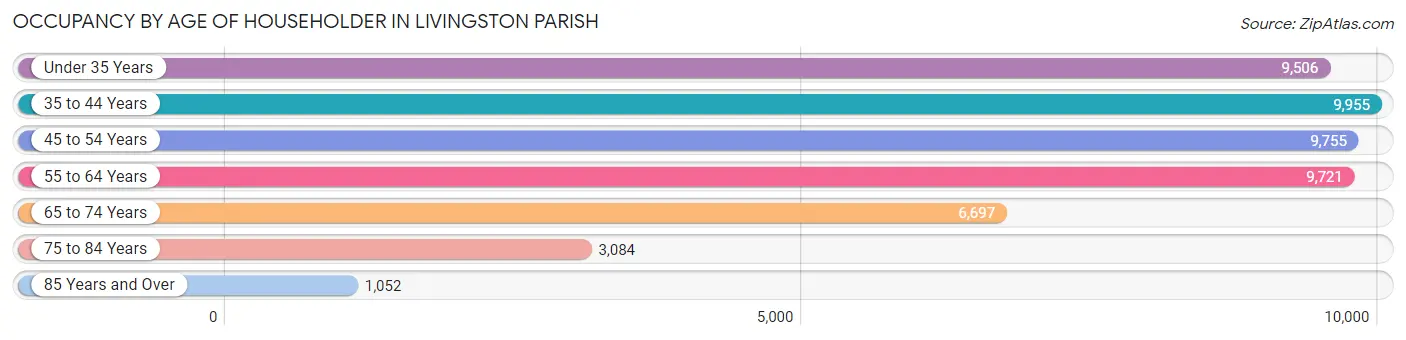
| Age Bracket | # Households | % Households |
| Under 35 Years | 9,506 | 19.1% |
| 35 to 44 Years | 9,955 | 20.0% |
| 45 to 54 Years | 9,755 | 19.6% |
| 55 to 64 Years | 9,721 | 19.5% |
| 65 to 74 Years | 6,697 | 13.5% |
| 75 to 84 Years | 3,084 | 6.2% |
| 85 Years and Over | 1,052 | 2.1% |
| Total | 49,770 | 100.0% |
Housing Finances in Livingston Parish
Median Income by Occupancy in Livingston Parish
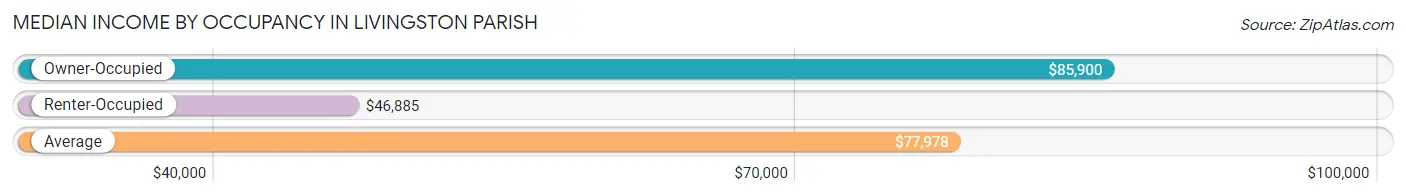
| Occupancy Type | # Households | Median Income |
| Owner-Occupied | 40,937 (82.3%) | $85,900 |
| Renter-Occupied | 8,833 (17.7%) | $46,885 |
| Average | 49,770 (100.0%) | $77,978 |
Occupancy by Householder Income Bracket in Livingston Parish
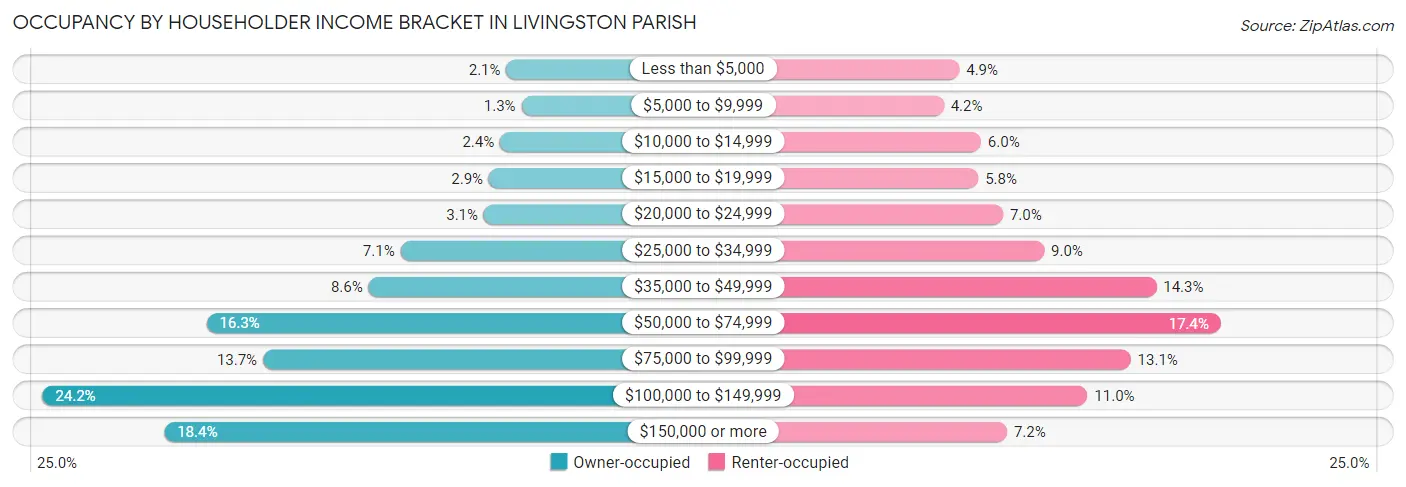
| Income Bracket | Owner-occupied | Renter-occupied |
| Less than $5,000 | 844 (2.1%) | 436 (4.9%) |
| $5,000 to $9,999 | 550 (1.3%) | 371 (4.2%) |
| $10,000 to $14,999 | 966 (2.4%) | 527 (6.0%) |
| $15,000 to $19,999 | 1,183 (2.9%) | 516 (5.8%) |
| $20,000 to $24,999 | 1,283 (3.1%) | 620 (7.0%) |
| $25,000 to $34,999 | 2,908 (7.1%) | 793 (9.0%) |
| $35,000 to $49,999 | 3,529 (8.6%) | 1,265 (14.3%) |
| $50,000 to $74,999 | 6,690 (16.3%) | 1,536 (17.4%) |
| $75,000 to $99,999 | 5,587 (13.7%) | 1,157 (13.1%) |
| $100,000 to $149,999 | 9,887 (24.1%) | 975 (11.0%) |
| $150,000 or more | 7,510 (18.3%) | 637 (7.2%) |
| Total | 40,937 (100.0%) | 8,833 (100.0%) |
Monthly Housing Cost Tiers in Livingston Parish
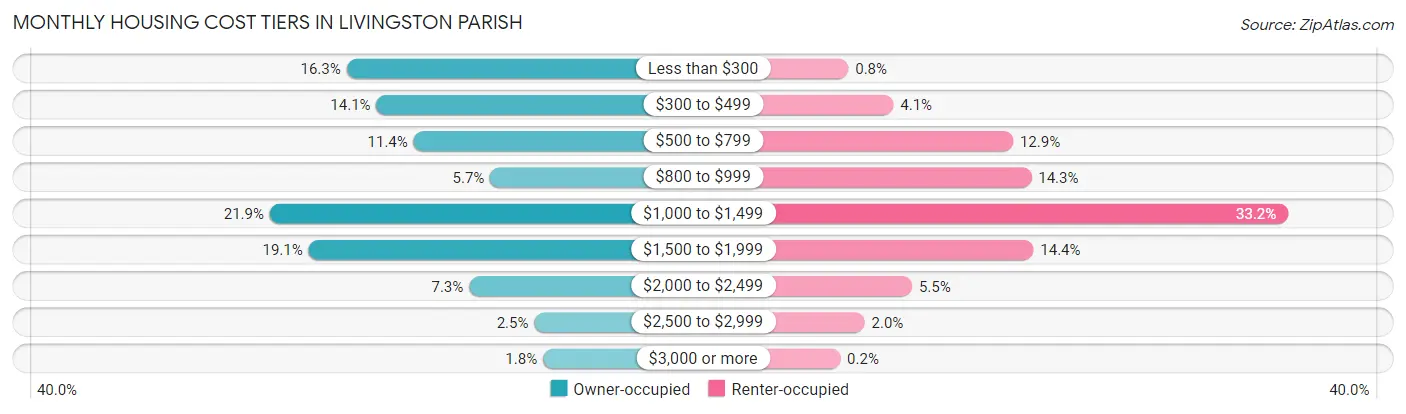
| Monthly Cost | Owner-occupied | Renter-occupied |
| Less than $300 | 6,668 (16.3%) | 71 (0.8%) |
| $300 to $499 | 5,767 (14.1%) | 364 (4.1%) |
| $500 to $799 | 4,645 (11.4%) | 1,142 (12.9%) |
| $800 to $999 | 2,337 (5.7%) | 1,261 (14.3%) |
| $1,000 to $1,499 | 8,981 (21.9%) | 2,932 (33.2%) |
| $1,500 to $1,999 | 7,816 (19.1%) | 1,275 (14.4%) |
| $2,000 to $2,499 | 2,971 (7.3%) | 485 (5.5%) |
| $2,500 to $2,999 | 1,008 (2.5%) | 177 (2.0%) |
| $3,000 or more | 744 (1.8%) | 18 (0.2%) |
| Total | 40,937 (100.0%) | 8,833 (100.0%) |
Physical Housing Characteristics in Livingston Parish
Housing Structures in Livingston Parish
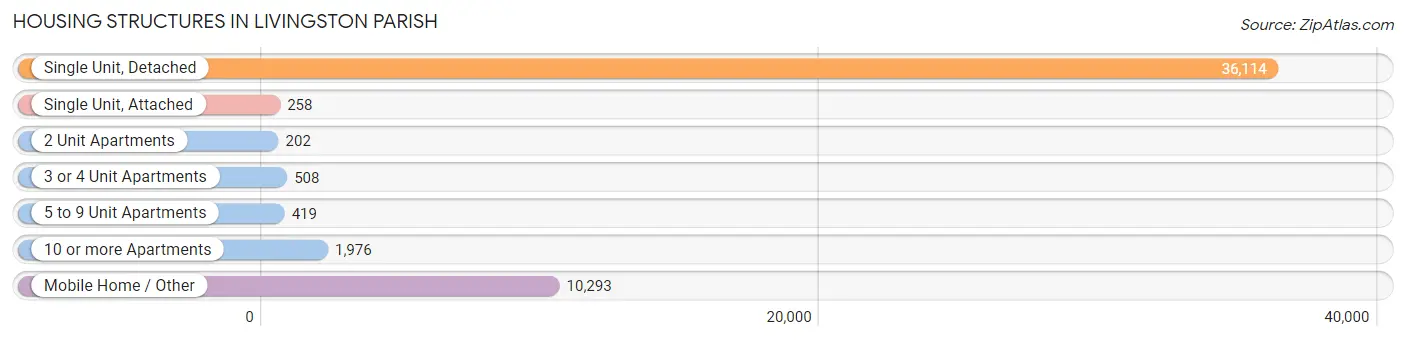
| Structure Type | # Housing Units | % Housing Units |
| Single Unit, Detached | 36,114 | 72.6% |
| Single Unit, Attached | 258 | 0.5% |
| 2 Unit Apartments | 202 | 0.4% |
| 3 or 4 Unit Apartments | 508 | 1.0% |
| 5 to 9 Unit Apartments | 419 | 0.8% |
| 10 or more Apartments | 1,976 | 4.0% |
| Mobile Home / Other | 10,293 | 20.7% |
| Total | 49,770 | 100.0% |
Housing Structures by Occupancy in Livingston Parish
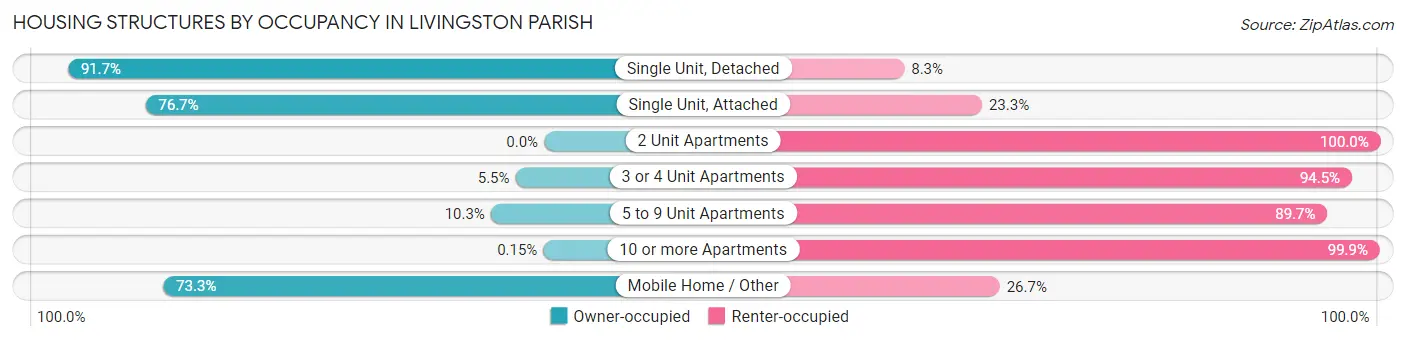
| Structure Type | Owner-occupied | Renter-occupied |
| Single Unit, Detached | 33,118 (91.7%) | 2,996 (8.3%) |
| Single Unit, Attached | 198 (76.7%) | 60 (23.3%) |
| 2 Unit Apartments | 0 (0.0%) | 202 (100.0%) |
| 3 or 4 Unit Apartments | 28 (5.5%) | 480 (94.5%) |
| 5 to 9 Unit Apartments | 43 (10.3%) | 376 (89.7%) |
| 10 or more Apartments | 3 (0.2%) | 1,973 (99.9%) |
| Mobile Home / Other | 7,547 (73.3%) | 2,746 (26.7%) |
| Total | 40,937 (82.3%) | 8,833 (17.7%) |
Housing Structures by Number of Rooms in Livingston Parish
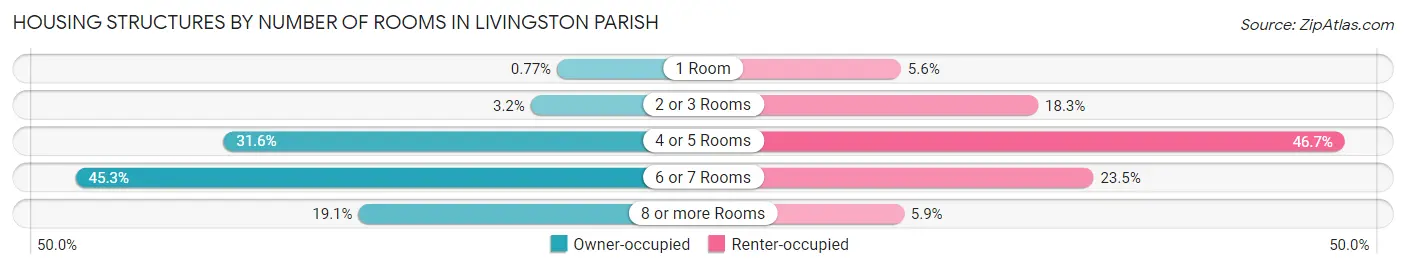
| Number of Rooms | Owner-occupied | Renter-occupied |
| 1 Room | 317 (0.8%) | 498 (5.6%) |
| 2 or 3 Rooms | 1,311 (3.2%) | 1,619 (18.3%) |
| 4 or 5 Rooms | 12,944 (31.6%) | 4,123 (46.7%) |
| 6 or 7 Rooms | 18,535 (45.3%) | 2,071 (23.4%) |
| 8 or more Rooms | 7,830 (19.1%) | 522 (5.9%) |
| Total | 40,937 (100.0%) | 8,833 (100.0%) |
Housing Structure by Heating Type in Livingston Parish
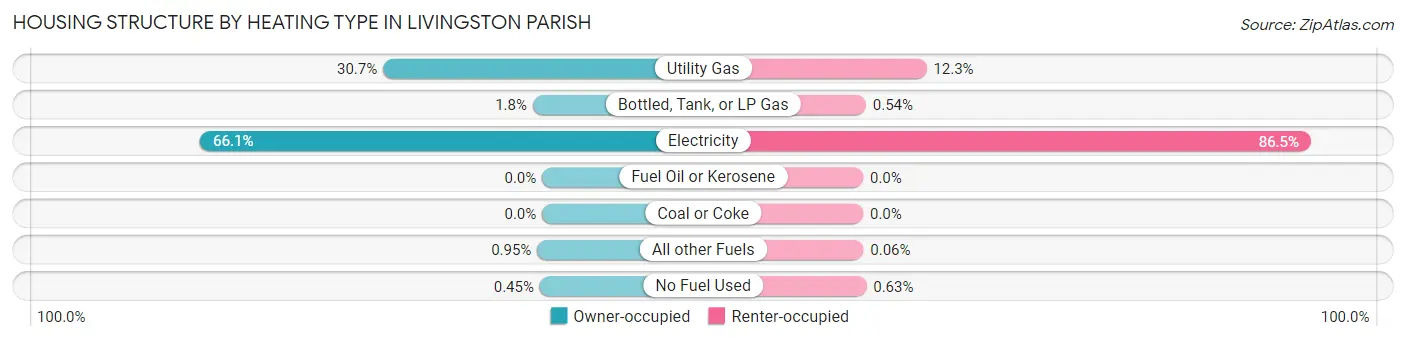
| Heating Type | Owner-occupied | Renter-occupied |
| Utility Gas | 12,580 (30.7%) | 1,082 (12.2%) |
| Bottled, Tank, or LP Gas | 735 (1.8%) | 48 (0.5%) |
| Electricity | 27,047 (66.1%) | 7,642 (86.5%) |
| Fuel Oil or Kerosene | 0 (0.0%) | 0 (0.0%) |
| Coal or Coke | 0 (0.0%) | 0 (0.0%) |
| All other Fuels | 390 (0.9%) | 5 (0.1%) |
| No Fuel Used | 185 (0.4%) | 56 (0.6%) |
| Total | 40,937 (100.0%) | 8,833 (100.0%) |
Household Vehicle Usage in Livingston Parish
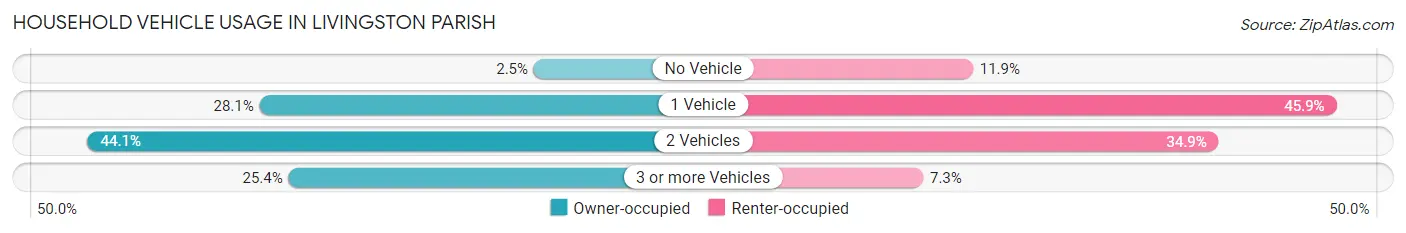
| Vehicles per Household | Owner-occupied | Renter-occupied |
| No Vehicle | 1,008 (2.5%) | 1,055 (11.9%) |
| 1 Vehicle | 11,491 (28.1%) | 4,053 (45.9%) |
| 2 Vehicles | 18,056 (44.1%) | 3,081 (34.9%) |
| 3 or more Vehicles | 10,382 (25.4%) | 644 (7.3%) |
| Total | 40,937 (100.0%) | 8,833 (100.0%) |
Real Estate & Mortgages in Livingston Parish
Real Estate and Mortgage Overview in Livingston Parish
| Characteristic | Without Mortgage | With Mortgage |
| Housing Units | 16,370 | 24,567 |
| Median Property Value | $170,900 | $223,000 |
| Median Household Income | $55,058 | $6,157 |
| Monthly Housing Costs | $358 | $686 |
| Real Estate Taxes | $647 | $2,356 |
Property Value by Mortgage Status in Livingston Parish
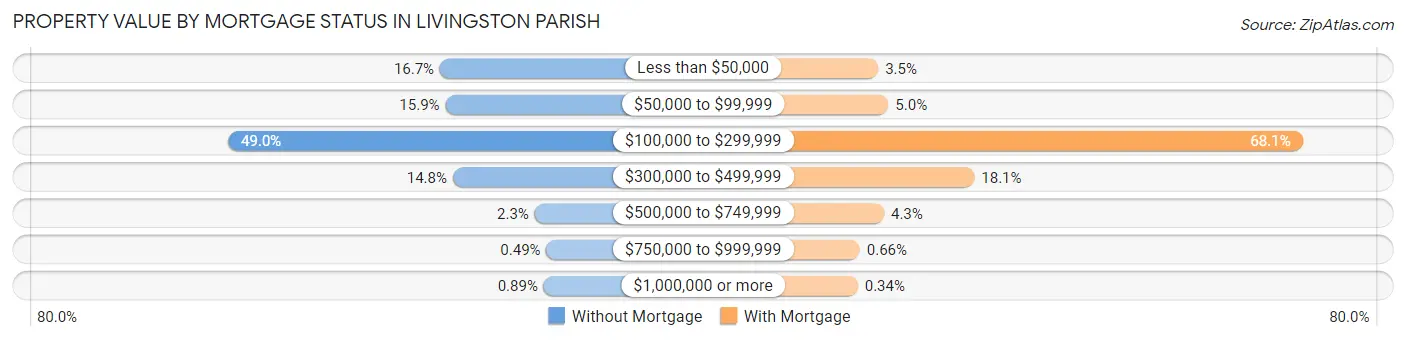
| Property Value | Without Mortgage | With Mortgage |
| Less than $50,000 | 2,736 (16.7%) | 847 (3.5%) |
| $50,000 to $99,999 | 2,599 (15.9%) | 1,231 (5.0%) |
| $100,000 to $299,999 | 8,023 (49.0%) | 16,730 (68.1%) |
| $300,000 to $499,999 | 2,414 (14.7%) | 4,449 (18.1%) |
| $500,000 to $749,999 | 372 (2.3%) | 1,065 (4.3%) |
| $750,000 to $999,999 | 81 (0.5%) | 162 (0.7%) |
| $1,000,000 or more | 145 (0.9%) | 83 (0.3%) |
| Total | 16,370 (100.0%) | 24,567 (100.0%) |
Household Income by Mortgage Status in Livingston Parish
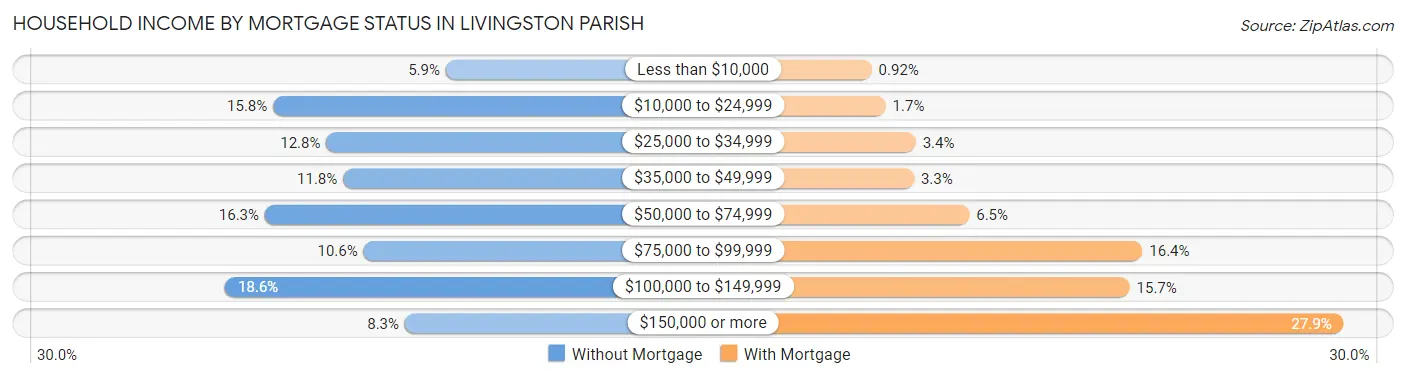
| Household Income | Without Mortgage | With Mortgage |
| Less than $10,000 | 971 (5.9%) | 225 (0.9%) |
| $10,000 to $24,999 | 2,587 (15.8%) | 423 (1.7%) |
| $25,000 to $34,999 | 2,088 (12.8%) | 845 (3.4%) |
| $35,000 to $49,999 | 1,931 (11.8%) | 820 (3.3%) |
| $50,000 to $74,999 | 2,664 (16.3%) | 1,598 (6.5%) |
| $75,000 to $99,999 | 1,740 (10.6%) | 4,026 (16.4%) |
| $100,000 to $149,999 | 3,036 (18.5%) | 3,847 (15.7%) |
| $150,000 or more | 1,353 (8.3%) | 6,851 (27.9%) |
| Total | 16,370 (100.0%) | 24,567 (100.0%) |
Property Value to Household Income Ratio in Livingston Parish
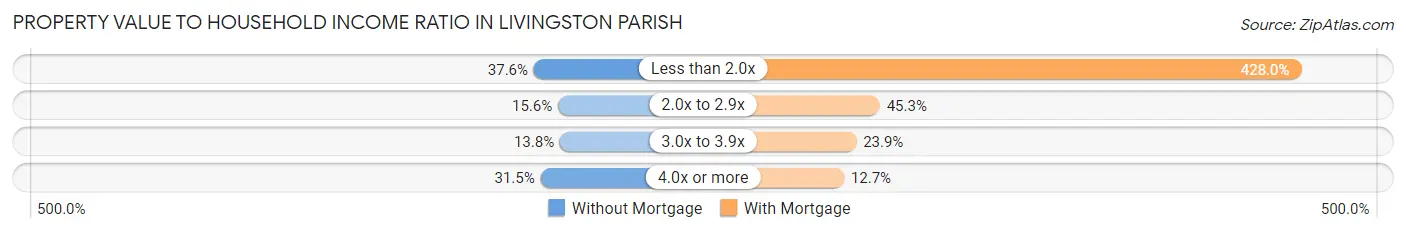
| Value-to-Income Ratio | Without Mortgage | With Mortgage |
| Less than 2.0x | 6,150 (37.6%) | 105,145 (428.0%) |
| 2.0x to 2.9x | 2,553 (15.6%) | 11,116 (45.3%) |
| 3.0x to 3.9x | 2,264 (13.8%) | 5,860 (23.8%) |
| 4.0x or more | 5,152 (31.5%) | 3,126 (12.7%) |
| Total | 16,370 (100.0%) | 24,567 (100.0%) |
Real Estate Taxes by Mortgage Status in Livingston Parish
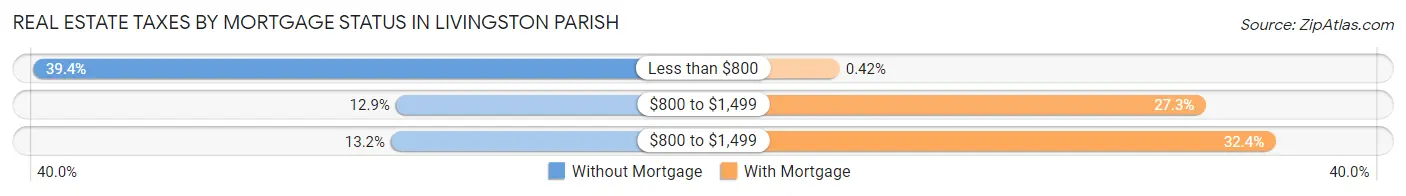
| Property Taxes | Without Mortgage | With Mortgage |
| Less than $800 | 6,448 (39.4%) | 102 (0.4%) |
| $800 to $1,499 | 2,110 (12.9%) | 6,697 (27.3%) |
| $800 to $1,499 | 2,168 (13.2%) | 7,950 (32.4%) |
| Total | 16,370 (100.0%) | 24,567 (100.0%) |
Health & Disability in Livingston Parish
Health Insurance Coverage by Age in Livingston Parish
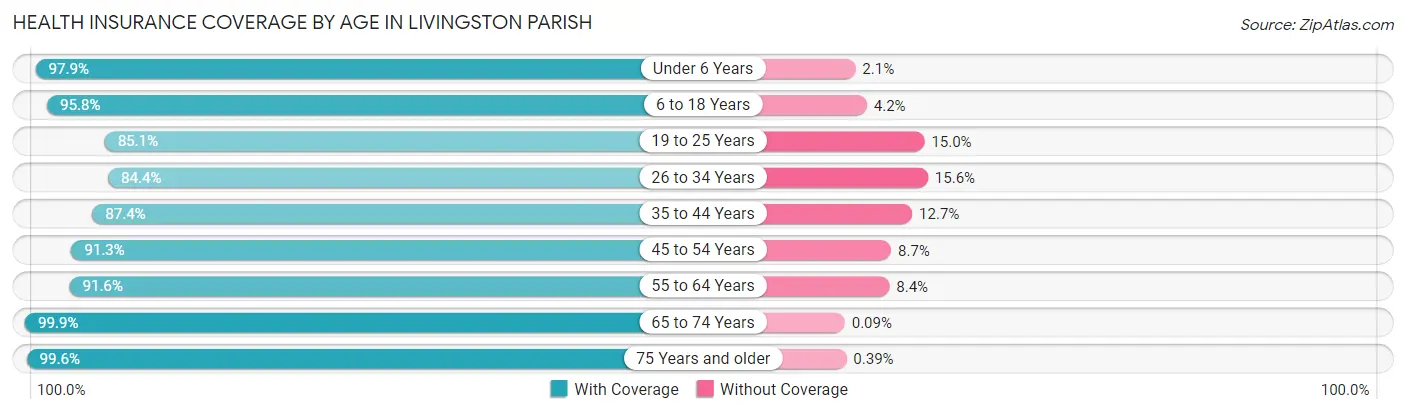
| Age Bracket | With Coverage | Without Coverage |
| Under 6 Years | 11,052 (97.9%) | 234 (2.1%) |
| 6 to 18 Years | 25,712 (95.8%) | 1,126 (4.2%) |
| 19 to 25 Years | 10,652 (85.1%) | 1,873 (14.9%) |
| 26 to 34 Years | 14,593 (84.4%) | 2,695 (15.6%) |
| 35 to 44 Years | 18,023 (87.4%) | 2,609 (12.7%) |
| 45 to 54 Years | 16,127 (91.3%) | 1,543 (8.7%) |
| 55 to 64 Years | 15,526 (91.6%) | 1,423 (8.4%) |
| 65 to 74 Years | 11,915 (99.9%) | 11 (0.1%) |
| 75 Years and older | 7,174 (99.6%) | 28 (0.4%) |
| Total | 130,774 (91.9%) | 11,542 (8.1%) |
Health Insurance Coverage by Citizenship Status in Livingston Parish
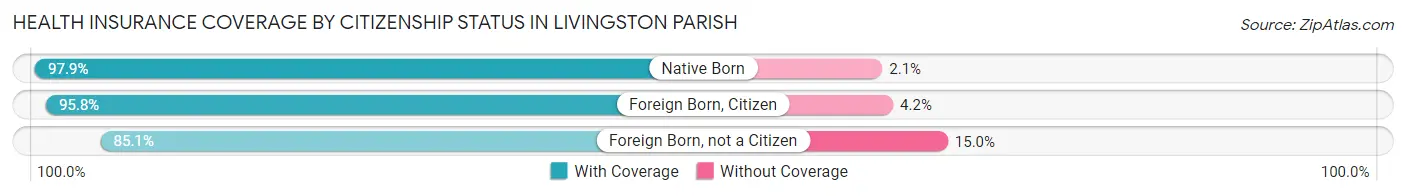
| Citizenship Status | With Coverage | Without Coverage |
| Native Born | 11,052 (97.9%) | 234 (2.1%) |
| Foreign Born, Citizen | 25,712 (95.8%) | 1,126 (4.2%) |
| Foreign Born, not a Citizen | 10,652 (85.1%) | 1,873 (14.9%) |
Health Insurance Coverage by Household Income in Livingston Parish
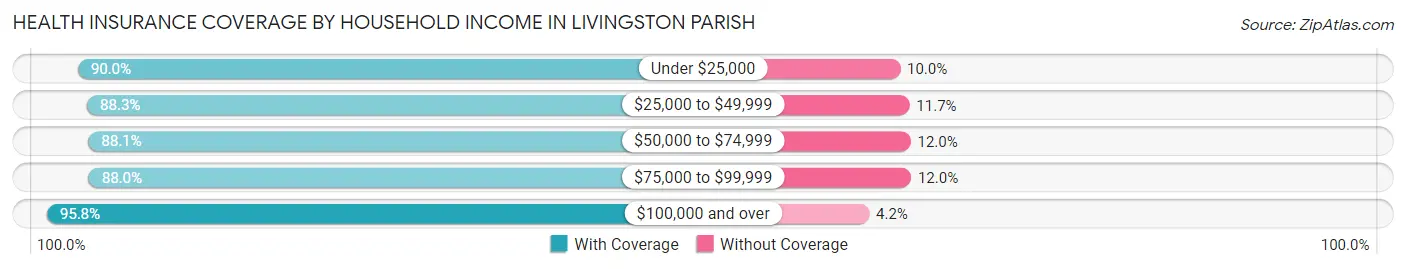
| Household Income | With Coverage | Without Coverage |
| Under $25,000 | 12,063 (90.0%) | 1,336 (10.0%) |
| $25,000 to $49,999 | 18,177 (88.3%) | 2,415 (11.7%) |
| $50,000 to $74,999 | 19,877 (88.0%) | 2,698 (11.9%) |
| $75,000 to $99,999 | 16,837 (88.0%) | 2,302 (12.0%) |
| $100,000 and over | 63,736 (95.8%) | 2,782 (4.2%) |
Public vs Private Health Insurance Coverage by Age in Livingston Parish
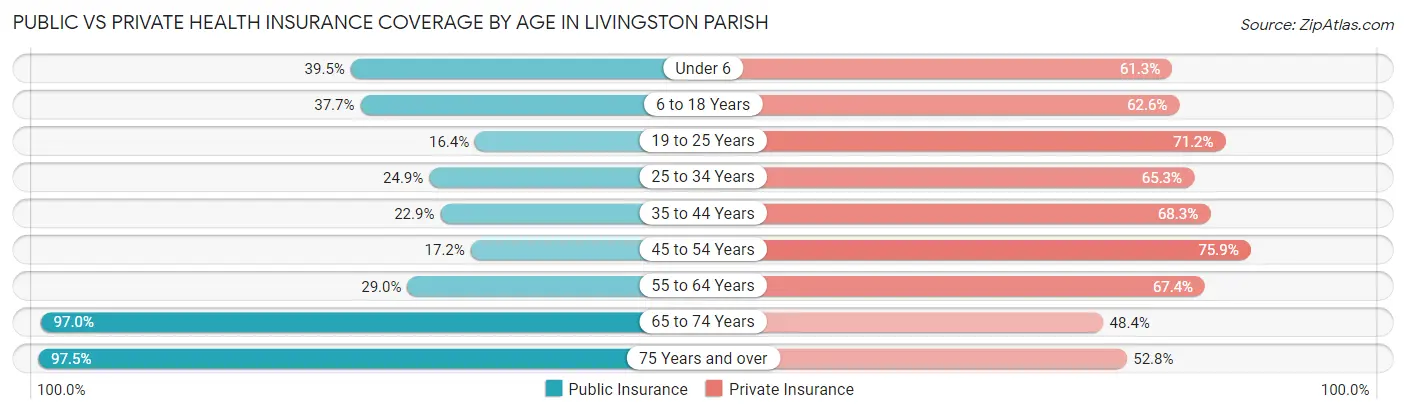
| Age Bracket | Public Insurance | Private Insurance |
| Under 6 | 4,456 (39.5%) | 6,917 (61.3%) |
| 6 to 18 Years | 10,116 (37.7%) | 16,807 (62.6%) |
| 19 to 25 Years | 2,053 (16.4%) | 8,917 (71.2%) |
| 25 to 34 Years | 4,309 (24.9%) | 11,296 (65.3%) |
| 35 to 44 Years | 4,715 (22.9%) | 14,100 (68.3%) |
| 45 to 54 Years | 3,043 (17.2%) | 13,402 (75.8%) |
| 55 to 64 Years | 4,908 (29.0%) | 11,424 (67.4%) |
| 65 to 74 Years | 11,571 (97.0%) | 5,775 (48.4%) |
| 75 Years and over | 7,022 (97.5%) | 3,803 (52.8%) |
| Total | 52,193 (36.7%) | 92,441 (64.9%) |
Disability Status by Sex by Age in Livingston Parish
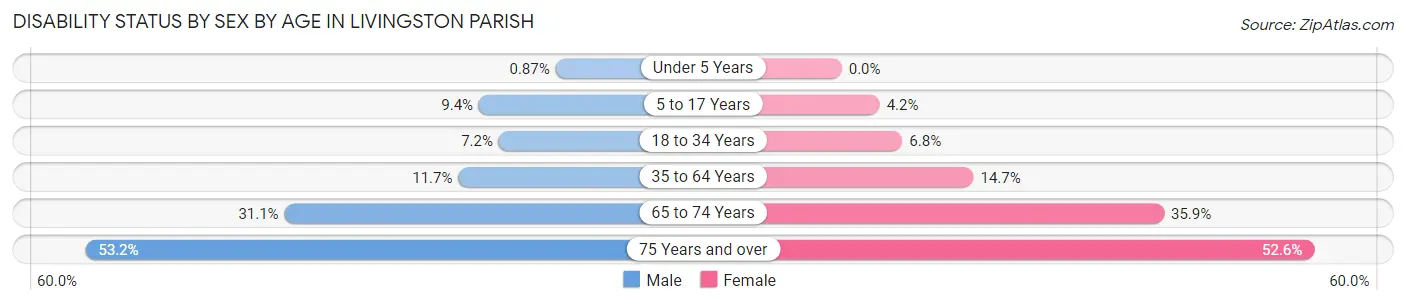
| Age Bracket | Male | Female |
| Under 5 Years | 39 (0.9%) | 0 (0.0%) |
| 5 to 17 Years | 1,301 (9.4%) | 567 (4.2%) |
| 18 to 34 Years | 1,134 (7.2%) | 1,059 (6.8%) |
| 35 to 64 Years | 3,183 (11.7%) | 4,115 (14.7%) |
| 65 to 74 Years | 1,726 (31.1%) | 2,286 (35.9%) |
| 75 Years and over | 1,680 (53.2%) | 2,128 (52.6%) |
Disability Class by Sex by Age in Livingston Parish
Disability Class: Hearing Difficulty
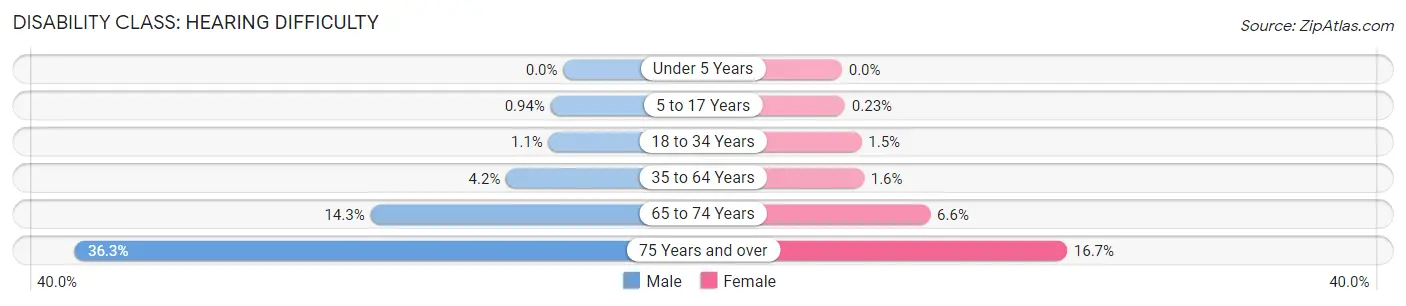
| Age Bracket | Male | Female |
| Under 5 Years | 0 (0.0%) | 0 (0.0%) |
| 5 to 17 Years | 130 (0.9%) | 31 (0.2%) |
| 18 to 34 Years | 172 (1.1%) | 228 (1.5%) |
| 35 to 64 Years | 1,154 (4.2%) | 457 (1.6%) |
| 65 to 74 Years | 796 (14.3%) | 418 (6.6%) |
| 75 Years and over | 1,144 (36.2%) | 676 (16.7%) |
Disability Class: Vision Difficulty
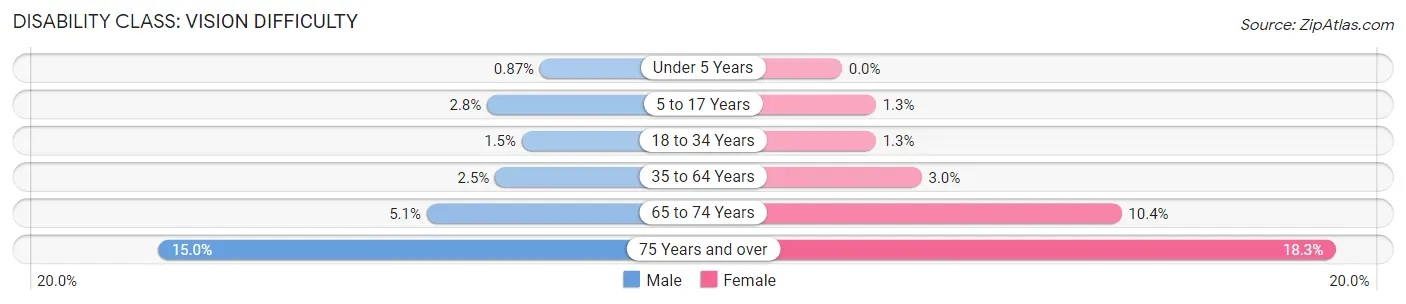
| Age Bracket | Male | Female |
| Under 5 Years | 39 (0.9%) | 0 (0.0%) |
| 5 to 17 Years | 392 (2.8%) | 169 (1.3%) |
| 18 to 34 Years | 243 (1.5%) | 197 (1.3%) |
| 35 to 64 Years | 687 (2.5%) | 829 (3.0%) |
| 65 to 74 Years | 282 (5.1%) | 661 (10.4%) |
| 75 Years and over | 474 (15.0%) | 741 (18.3%) |
Disability Class: Cognitive Difficulty
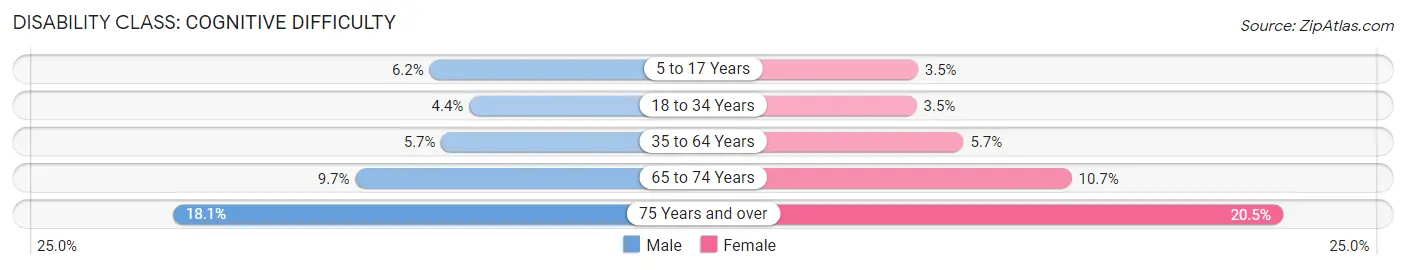
| Age Bracket | Male | Female |
| 5 to 17 Years | 859 (6.2%) | 474 (3.5%) |
| 18 to 34 Years | 690 (4.4%) | 544 (3.5%) |
| 35 to 64 Years | 1,540 (5.7%) | 1,585 (5.7%) |
| 65 to 74 Years | 536 (9.7%) | 679 (10.7%) |
| 75 Years and over | 572 (18.1%) | 828 (20.5%) |
Disability Class: Ambulatory Difficulty
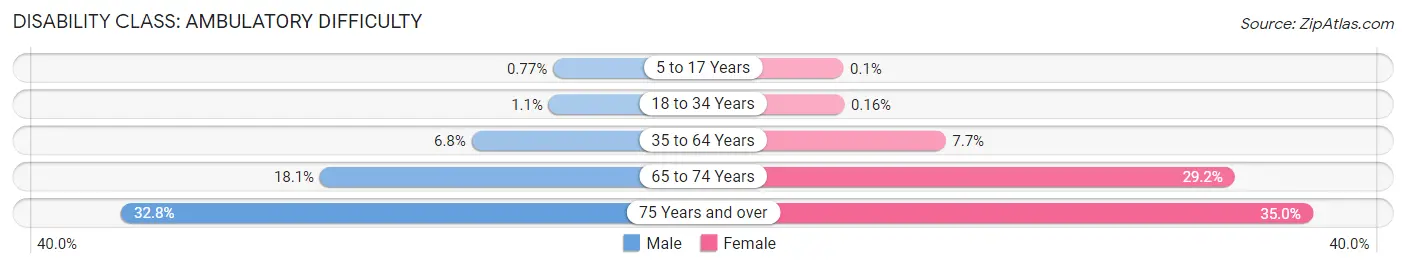
| Age Bracket | Male | Female |
| 5 to 17 Years | 106 (0.8%) | 14 (0.1%) |
| 18 to 34 Years | 170 (1.1%) | 25 (0.2%) |
| 35 to 64 Years | 1,854 (6.8%) | 2,157 (7.7%) |
| 65 to 74 Years | 1,004 (18.1%) | 1,858 (29.2%) |
| 75 Years and over | 1,036 (32.8%) | 1,414 (34.9%) |
Disability Class: Self-Care Difficulty
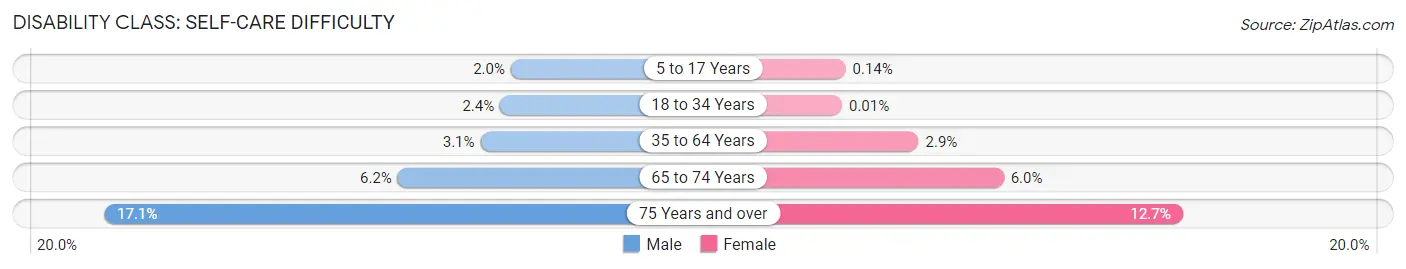
| Age Bracket | Male | Female |
| 5 to 17 Years | 270 (1.9%) | 19 (0.1%) |
| 18 to 34 Years | 371 (2.4%) | 2 (0.0%) |
| 35 to 64 Years | 839 (3.1%) | 798 (2.9%) |
| 65 to 74 Years | 342 (6.1%) | 383 (6.0%) |
| 75 Years and over | 538 (17.1%) | 512 (12.7%) |
Technology Access in Livingston Parish
Computing Device Access in Livingston Parish
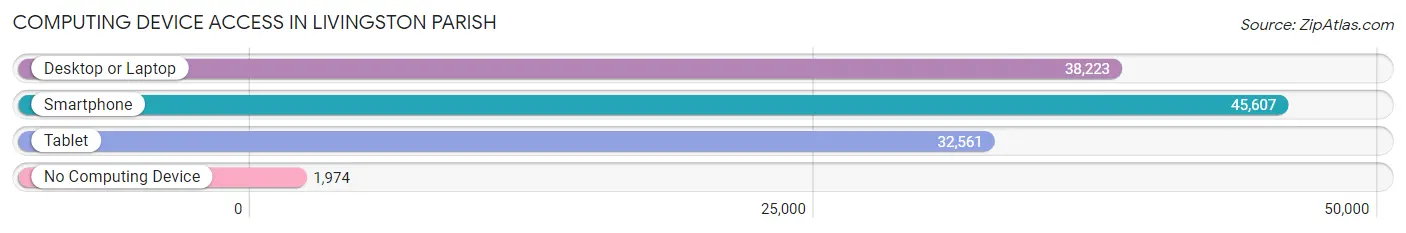
| Device Type | # Households | % Households |
| Desktop or Laptop | 38,223 | 76.8% |
| Smartphone | 45,607 | 91.6% |
| Tablet | 32,561 | 65.4% |
| No Computing Device | 1,974 | 4.0% |
| Total | 49,770 | 100.0% |
Internet Access in Livingston Parish
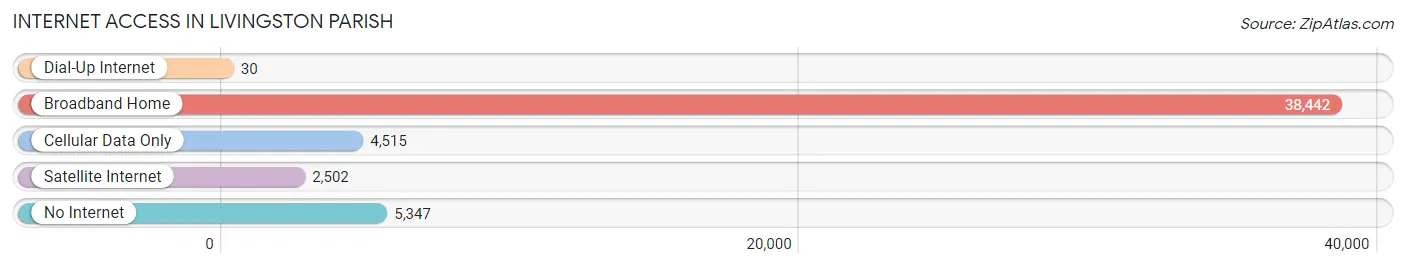
| Internet Type | # Households | % Households |
| Dial-Up Internet | 30 | 0.1% |
| Broadband Home | 38,442 | 77.2% |
| Cellular Data Only | 4,515 | 9.1% |
| Satellite Internet | 2,502 | 5.0% |
| No Internet | 5,347 | 10.7% |
| Total | 49,770 | 100.0% |
Livingston Parish Summary
Livingston Parish is a parish located in the southeastern part of the state of Louisiana. It is part of the Baton Rouge Metropolitan Statistical Area. As of the 2010 census, the population was 128,026, making it the fifth-most populous parish in Louisiana. The parish seat is Livingston.
History
Livingston Parish was created in 1832 from parts of St. Helena and St. Tammany parishes. It was named for Edward Livingston, a prominent American statesman and jurist who served as the U.S. Secretary of State from 1831 to 1833.
The parish was originally part of the Florida Parishes, a region of the state that was originally part of Spanish West Florida. The area was first settled by French and Spanish colonists in the early 1700s. The parish was later settled by American settlers in the early 1800s.
Geography
Livingston Parish is located in the southeastern part of the state of Louisiana. It is bordered by St. Helena Parish to the north, Tangipahoa Parish to the east, St. Tammany Parish to the south, and East Baton Rouge Parish to the west.
The parish has a total area of 576 square miles, of which 571 square miles is land and 5.2 square miles is water. The parish is located in the Gulf Coastal Plain region of the state. The terrain is mostly flat, with some rolling hills in the northern part of the parish.
The parish is drained by the Amite River, which flows through the center of the parish. Other major waterways in the parish include the Tickfaw River, the Blind River, and the Tchefuncte River.
Economy
The economy of Livingston Parish is largely based on agriculture and manufacturing. The parish is home to a number of large industrial plants, including a chemical plant, a paper mill, and a steel mill.
Agriculture is also an important part of the local economy. The parish is home to a number of large farms, which produce a variety of crops, including cotton, soybeans, corn, and wheat. Livestock production is also important, with cattle, hogs, and poultry being raised in the parish.
Demographics
As of the 2010 census, there were 128,026 people living in Livingston Parish. The population density was 223.3 people per square mile. The racial makeup of the parish was 79.2% White, 17.7% African American, 0.5% Native American, 0.7% Asian, 0.1% Pacific Islander, 0.7% from other races, and 1.2% from two or more races. Hispanic or Latino of any race were 2.7% of the population.
The median income for a household in the parish was $45,945, and the median income for a family was $54,817. The per capita income for the parish was $21,945. About 11.2% of families and 14.3% of the population were below the poverty line, including 19.2% of those under age 18 and 10.2% of those age 65 or over.
Common Questions
What is the Total Population of Livingston Parish?
Total Population of Livingston Parish is 143,425.
What is the Total Male Population of Livingston Parish?
Total Male Population of Livingston Parish is 70,817.
What is the Total Female Population of Livingston Parish?
Total Female Population of Livingston Parish is 72,608.
What is the Ratio of Males per 100 Females in Livingston Parish?
There are 97.53 Males per 100 Females in Livingston Parish.
What is the Ratio of Females per 100 Males in Livingston Parish?
There are 102.53 Females per 100 Males in Livingston Parish.
What is the Median Population Age in Livingston Parish?
Median Population Age in Livingston Parish is 36.6 Years.
What is the Average Family Size in Livingston Parish
Average Family Size in Livingston Parish is 3.4 People.
What is the Average Household Size in Livingston Parish
Average Household Size in Livingston Parish is 2.9 People.
What is Per Capita Income in Livingston Parish?
Per Capita income in Livingston Parish is $34,237.
What is the Median Family Income in Livingston Parish?
Median Family Income in Livingston Parish is $89,645.
What is the Median Household income in Livingston Parish?
Median Household Income in Livingston Parish is $77,978.
What is Income or Wage Gap in Livingston Parish?
Income or Wage Gap in Livingston Parish is 39.1%.
Women in Livingston Parish earn 60.9 cents for every dollar earned by a man.
What is Family Income Deficit in Livingston Parish?
Family Income Deficit in Livingston Parish is $10,611.
Families that are below poverty line in Livingston Parish earn $10,611 less on average than the poverty threshold level.
What is Inequality or Gini Index in Livingston Parish?
Inequality or Gini Index in Livingston Parish is 0.41.
How Large is the Labor Force in Livingston Parish?
There are 68,449 People in the Labor Forcein in Livingston Parish.
What is the Percentage of People in the Labor Force in Livingston Parish?
61.3% of People are in the Labor Force in Livingston Parish.
What is the Unemployment Rate in Livingston Parish?
Unemployment Rate in Livingston Parish is 4.5%.