Lincoln Parish, LA
Lincoln Parish Map
Lincoln Parish Overview
48,323
TOTAL POPULATION
23,783
MALE POPULATION
24,540
FEMALE POPULATION
96.92
MALES / 100 FEMALES
103.18
FEMALES / 100 MALES
28.3
MEDIAN AGE
3.2
AVG FAMILY SIZE
2.5
AVG HOUSEHOLD SIZE
$24,411
PER CAPITA INCOME
$58,542
AVG FAMILY INCOME
$37,001
AVG HOUSEHOLD INCOME
27.7%
WAGE / INCOME GAP [ % ]
72.3¢/ $1
WAGE / INCOME GAP [ $ ]
$11,363
FAMILY INCOME DEFICIT
0.52
INEQUALITY / GINI INDEX
22,150
LABOR FORCE [ PEOPLE ]
55.4%
PERCENT IN LABOR FORCE
4.2%
UNEMPLOYMENT RATE
Lincoln Parish Area Codes
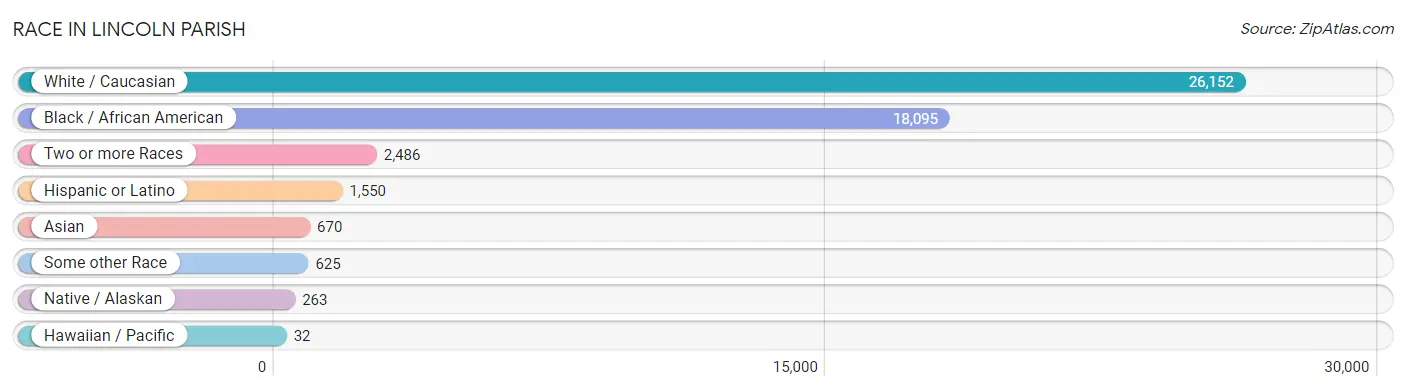
Race in Lincoln Parish
The most populous races in Lincoln Parish are White / Caucasian (26,152 | 54.1%), Black / African American (18,095 | 37.4%), and Two or more Races (2,486 | 5.1%).
| Race | # Population | % Population |
| Asian | 670 | 1.4% |
| Black / African American | 18,095 | 37.4% |
| Hawaiian / Pacific | 32 | 0.1% |
| Hispanic or Latino | 1,550 | 3.2% |
| Native / Alaskan | 263 | 0.5% |
| White / Caucasian | 26,152 | 54.1% |
| Two or more Races | 2,486 | 5.1% |
| Some other Race | 625 | 1.3% |
| Total | 48,323 | 100.0% |
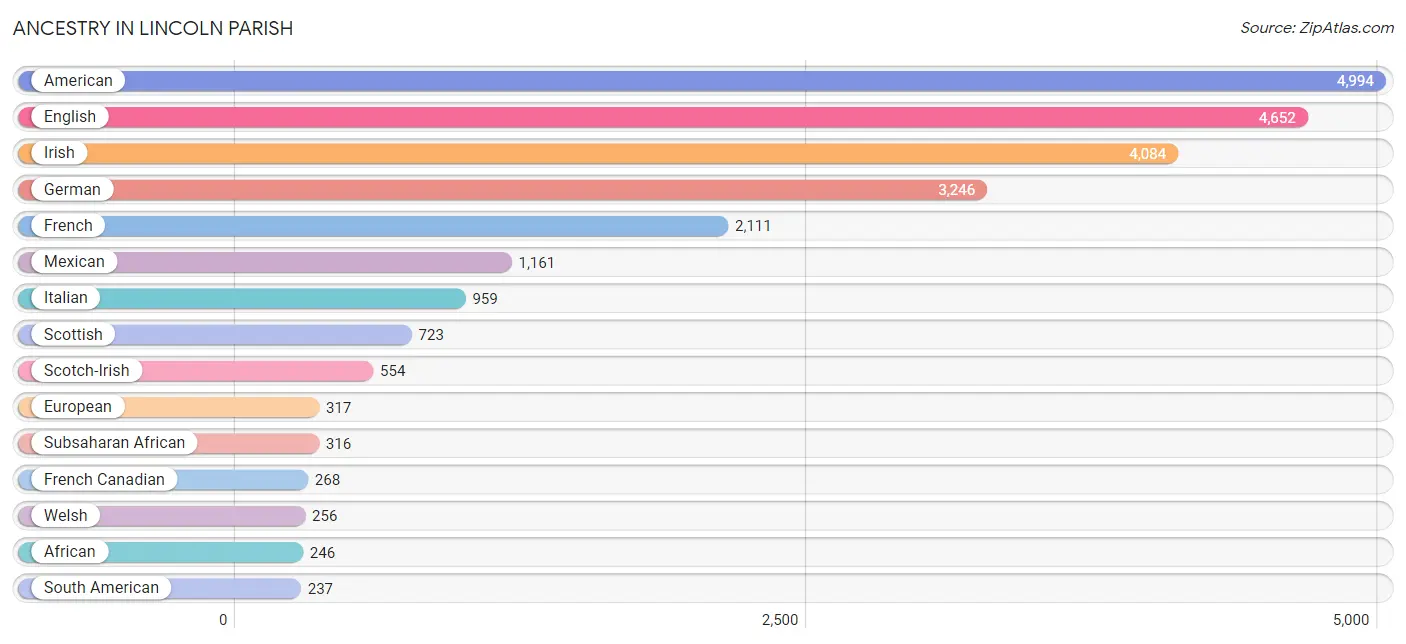
Ancestry in Lincoln Parish
The most populous ancestries reported in Lincoln Parish are American (4,994 | 10.3%), English (4,652 | 9.6%), Irish (4,084 | 8.5%), German (3,246 | 6.7%), and French (2,111 | 4.4%), together accounting for 39.5% of all Lincoln Parish residents.
| Ancestry | # Population | % Population |
| African | 246 | 0.5% |
| American | 4,994 | 10.3% |
| Arab | 212 | 0.4% |
| Argentinean | 89 | 0.2% |
| Australian | 18 | 0.0% |
| Austrian | 140 | 0.3% |
| Belgian | 43 | 0.1% |
| Bhutanese | 27 | 0.1% |
| Brazilian | 17 | 0.0% |
| British | 188 | 0.4% |
| Burmese | 212 | 0.4% |
| Cajun | 128 | 0.3% |
| Canadian | 45 | 0.1% |
| Central American | 55 | 0.1% |
| Cherokee | 132 | 0.3% |
| Choctaw | 153 | 0.3% |
| Colombian | 131 | 0.3% |
| Creek | 37 | 0.1% |
| Croatian | 32 | 0.1% |
| Cuban | 23 | 0.1% |
| Czechoslovakian | 9 | 0.0% |
| Danish | 25 | 0.1% |
| Dutch | 204 | 0.4% |
| Eastern European | 140 | 0.3% |
| Egyptian | 17 | 0.0% |
| English | 4,652 | 9.6% |
| Ethiopian | 37 | 0.1% |
| European | 317 | 0.7% |
| French | 2,111 | 4.4% |
| French Canadian | 268 | 0.5% |
| German | 3,246 | 6.7% |
| Greek | 84 | 0.2% |
| Guatemalan | 55 | 0.1% |
| Houma | 71 | 0.2% |
| Hungarian | 32 | 0.1% |
| Indian (Asian) | 122 | 0.3% |
| Iranian | 38 | 0.1% |
| Iraqi | 2 | 0.0% |
| Irish | 4,084 | 8.5% |
| Italian | 959 | 2.0% |
| Korean | 107 | 0.2% |
| Laotian | 22 | 0.1% |
| Lebanese | 13 | 0.0% |
| Mexican | 1,161 | 2.4% |
| Mexican American Indian | 16 | 0.0% |
| Mongolian | 5 | 0.0% |
| Navajo | 34 | 0.1% |
| Nigerian | 20 | 0.0% |
| Northern European | 71 | 0.2% |
| Norwegian | 128 | 0.3% |
| Pakistani | 13 | 0.0% |
| Peruvian | 17 | 0.0% |
| Polish | 104 | 0.2% |
| Portuguese | 122 | 0.3% |
| Puerto Rican | 53 | 0.1% |
| Romanian | 17 | 0.0% |
| Russian | 114 | 0.2% |
| Scandinavian | 17 | 0.0% |
| Scotch-Irish | 554 | 1.1% |
| Scottish | 723 | 1.5% |
| Seminole | 37 | 0.1% |
| Slovak | 13 | 0.0% |
| South American | 237 | 0.5% |
| Spanish | 8 | 0.0% |
| Sri Lankan | 146 | 0.3% |
| Subsaharan African | 316 | 0.6% |
| Swedish | 127 | 0.3% |
| Swiss | 2 | 0.0% |
| Thai | 60 | 0.1% |
| Ukrainian | 22 | 0.1% |
| Vietnamese | 39 | 0.1% |
| Welsh | 256 | 0.5% |
| West Indian | 11 | 0.0% | View All 73 Rows |
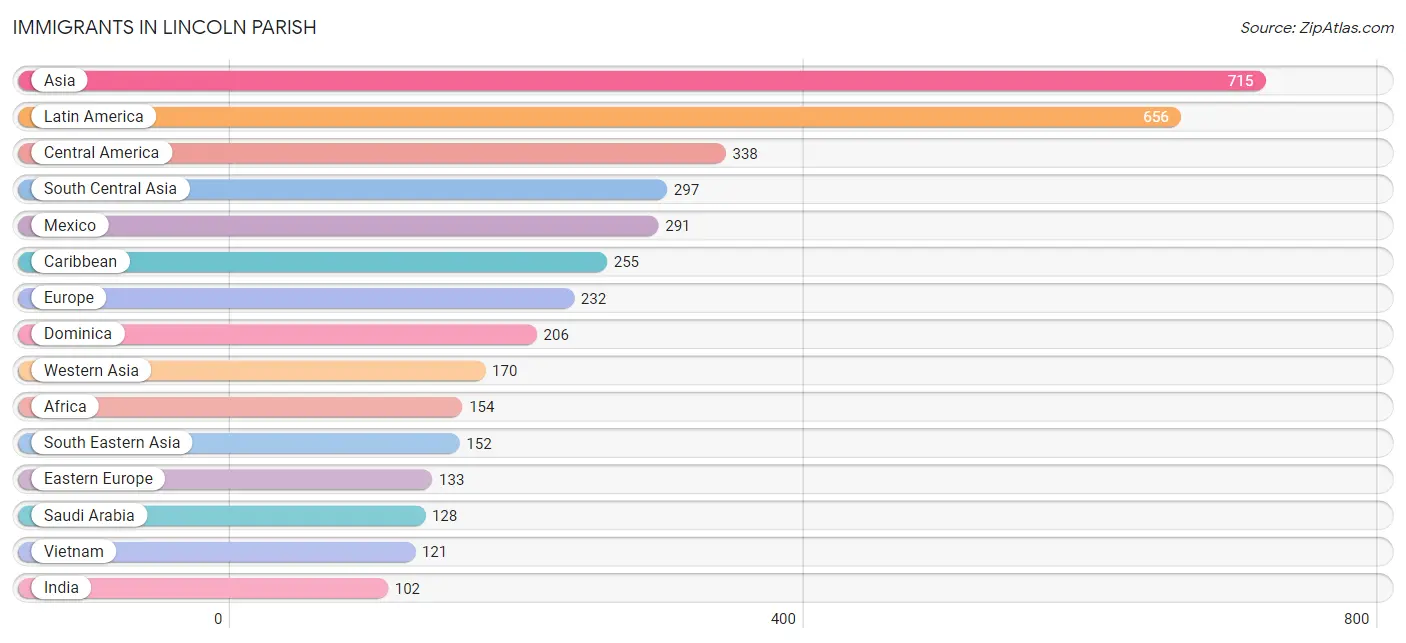
Immigrants in Lincoln Parish
The most numerous immigrant groups reported in Lincoln Parish came from Asia (715 | 1.5%), Latin America (656 | 1.4%), Central America (338 | 0.7%), South Central Asia (297 | 0.6%), and Mexico (291 | 0.6%), together accounting for 4.8% of all Lincoln Parish residents.
| Immigration Origin | # Population | % Population |
| Africa | 154 | 0.3% |
| Argentina | 17 | 0.0% |
| Asia | 715 | 1.5% |
| Azores | 5 | 0.0% |
| Bangladesh | 39 | 0.1% |
| Brazil | 29 | 0.1% |
| Canada | 42 | 0.1% |
| Caribbean | 255 | 0.5% |
| Central America | 338 | 0.7% |
| China | 60 | 0.1% |
| Croatia | 17 | 0.0% |
| Cuba | 10 | 0.0% |
| Dominica | 206 | 0.4% |
| Eastern Africa | 44 | 0.1% |
| Eastern Asia | 96 | 0.2% |
| Eastern Europe | 133 | 0.3% |
| Egypt | 17 | 0.0% |
| England | 20 | 0.0% |
| Ethiopia | 37 | 0.1% |
| Europe | 232 | 0.5% |
| Germany | 68 | 0.1% |
| Guatemala | 47 | 0.1% |
| India | 102 | 0.2% |
| Iran | 22 | 0.1% |
| Italy | 4 | 0.0% |
| Jamaica | 9 | 0.0% |
| Japan | 5 | 0.0% |
| Korea | 31 | 0.1% |
| Latin America | 656 | 1.4% |
| Mexico | 291 | 0.6% |
| Nepal | 47 | 0.1% |
| Northern Africa | 17 | 0.0% |
| Northern Europe | 22 | 0.1% |
| Pakistan | 87 | 0.2% |
| Peru | 17 | 0.0% |
| Philippines | 31 | 0.1% |
| Poland | 2 | 0.0% |
| Portugal | 5 | 0.0% |
| Romania | 15 | 0.0% |
| Russia | 99 | 0.2% |
| Saudi Arabia | 128 | 0.3% |
| South Africa | 80 | 0.2% |
| South America | 63 | 0.1% |
| South Central Asia | 297 | 0.6% |
| South Eastern Asia | 152 | 0.3% |
| Southern Europe | 9 | 0.0% |
| Taiwan | 13 | 0.0% |
| Trinidad and Tobago | 30 | 0.1% |
| Vietnam | 121 | 0.3% |
| Western Asia | 170 | 0.4% |
| Western Europe | 68 | 0.1% |
| Yemen | 42 | 0.1% | View All 52 Rows |
Sex and Age in Lincoln Parish
Sex and Age in Lincoln Parish
The most populous age groups in Lincoln Parish are 20 to 24 Years (4,490 | 18.9%) for men and 20 to 24 Years (4,600 | 18.7%) for women.
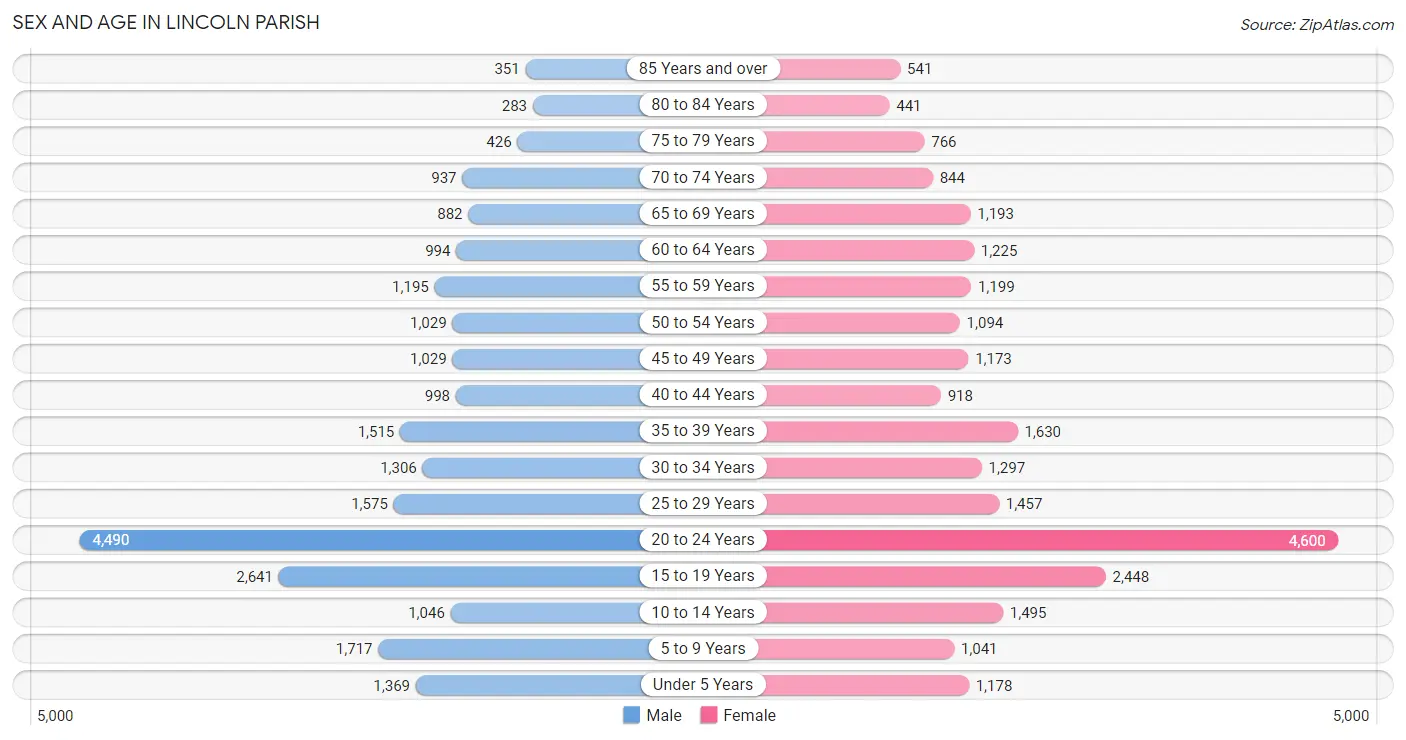
| Age Bracket | Male | Female |
| Under 5 Years | 1,369 (5.8%) | 1,178 (4.8%) |
| 5 to 9 Years | 1,717 (7.2%) | 1,041 (4.2%) |
| 10 to 14 Years | 1,046 (4.4%) | 1,495 (6.1%) |
| 15 to 19 Years | 2,641 (11.1%) | 2,448 (10.0%) |
| 20 to 24 Years | 4,490 (18.9%) | 4,600 (18.7%) |
| 25 to 29 Years | 1,575 (6.6%) | 1,457 (5.9%) |
| 30 to 34 Years | 1,306 (5.5%) | 1,297 (5.3%) |
| 35 to 39 Years | 1,515 (6.4%) | 1,630 (6.6%) |
| 40 to 44 Years | 998 (4.2%) | 918 (3.7%) |
| 45 to 49 Years | 1,029 (4.3%) | 1,173 (4.8%) |
| 50 to 54 Years | 1,029 (4.3%) | 1,094 (4.5%) |
| 55 to 59 Years | 1,195 (5.0%) | 1,199 (4.9%) |
| 60 to 64 Years | 994 (4.2%) | 1,225 (5.0%) |
| 65 to 69 Years | 882 (3.7%) | 1,193 (4.9%) |
| 70 to 74 Years | 937 (3.9%) | 844 (3.4%) |
| 75 to 79 Years | 426 (1.8%) | 766 (3.1%) |
| 80 to 84 Years | 283 (1.2%) | 441 (1.8%) |
| 85 Years and over | 351 (1.5%) | 541 (2.2%) |
| Total | 23,783 (100.0%) | 24,540 (100.0%) |
Families and Households in Lincoln Parish
Median Family Size in Lincoln Parish
The median family size in Lincoln Parish is 3.23 persons per family, with single female/mother families (2,952 | 29.8%) accounting for the largest median family size of 3.53 persons per family. On the other hand, single male/father families (773 | 7.8%) represent the smallest median family size with 2.24 persons per family.
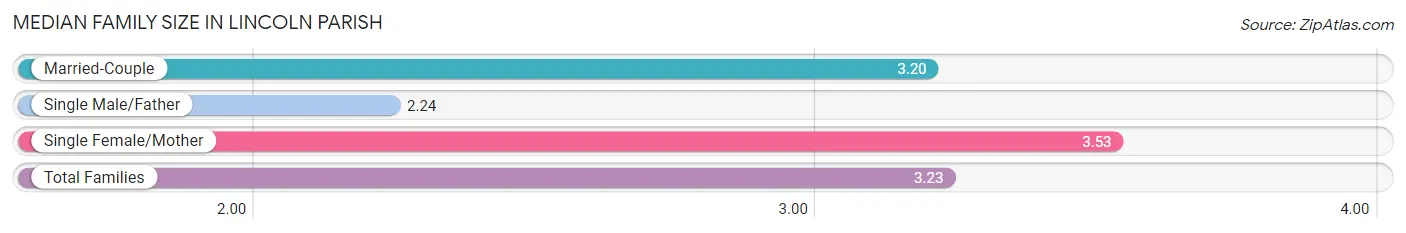
| Family Type | # Families | Family Size |
| Married-Couple | 6,189 (62.4%) | 3.20 |
| Single Male/Father | 773 (7.8%) | 2.24 |
| Single Female/Mother | 2,952 (29.8%) | 3.53 |
| Total Families | 9,914 (100.0%) | 3.23 |
Median Household Size in Lincoln Parish
The median household size in Lincoln Parish is 2.46 persons per household, with single female/mother households (2,952 | 16.4%) accounting for the largest median household size of 3.7 persons per household. non-family households (8,129 | 45.1%) represent the smallest median household size with 1.41 persons per household.
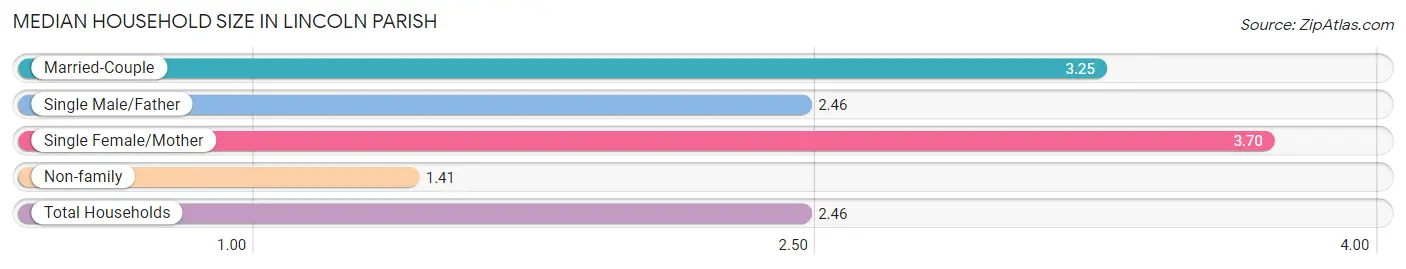
| Household Type | # Households | Household Size |
| Married-Couple | 6,189 (34.3%) | 3.25 |
| Single Male/Father | 773 (4.3%) | 2.46 |
| Single Female/Mother | 2,952 (16.4%) | 3.70 |
| Non-family | 8,129 (45.1%) | 1.41 |
| Total Households | 18,043 (100.0%) | 2.46 |
Household Size by Marriage Status in Lincoln Parish
Out of a total of 18,043 households in Lincoln Parish, 9,914 (54.9%) are family households, while 8,129 (45.1%) are nonfamily households. The most numerous type of family households are 2-person households, comprising 4,950, and the most common type of nonfamily households are 1-person households, comprising 5,881.
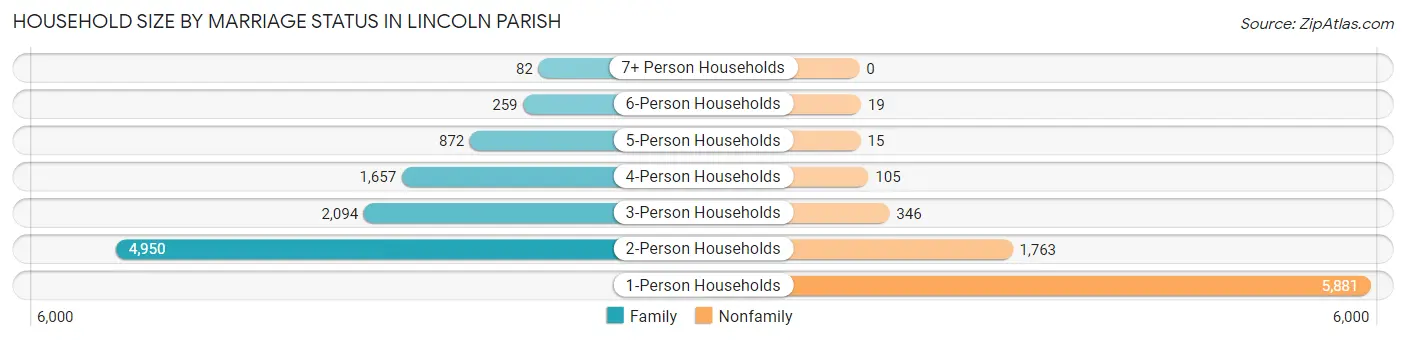
| Household Size | Family Households | Nonfamily Households |
| 1-Person Households | - | 5,881 (32.6%) |
| 2-Person Households | 4,950 (27.4%) | 1,763 (9.8%) |
| 3-Person Households | 2,094 (11.6%) | 346 (1.9%) |
| 4-Person Households | 1,657 (9.2%) | 105 (0.6%) |
| 5-Person Households | 872 (4.8%) | 15 (0.1%) |
| 6-Person Households | 259 (1.4%) | 19 (0.1%) |
| 7+ Person Households | 82 (0.4%) | 0 (0.0%) |
| Total | 9,914 (54.9%) | 8,129 (45.1%) |
Female Fertility in Lincoln Parish
Fertility by Age in Lincoln Parish
Average fertility rate in Lincoln Parish is 40.0 births per 1,000 women. Women in the age bracket of 20 to 34 years have the highest fertility rate with 61.0 births per 1,000 women. Women in the age bracket of 20 to 34 years acount for 81.4% of all women with births.
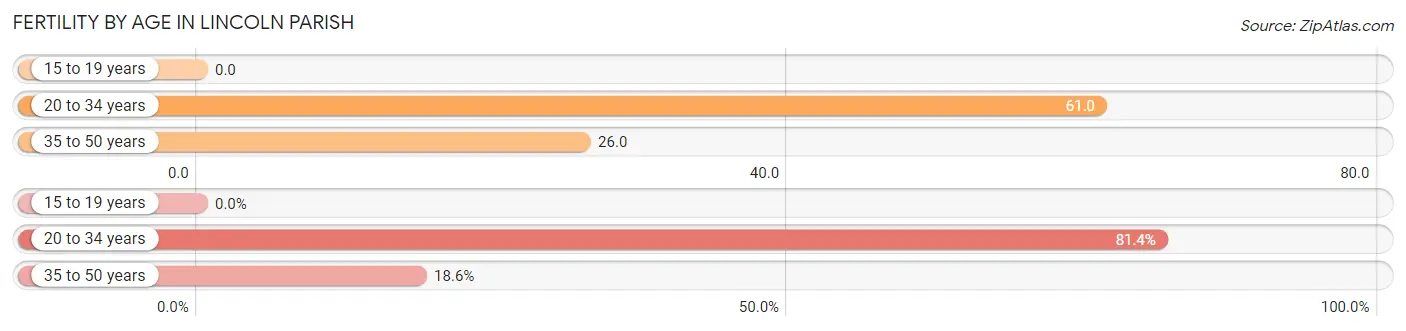
| Age Bracket | Women with Births | Births / 1,000 Women |
| 15 to 19 years | 0 (0.0%) | 0.0 |
| 20 to 34 years | 451 (81.4%) | 61.0 |
| 35 to 50 years | 103 (18.6%) | 26.0 |
| Total | 554 (100.0%) | 40.0 |
Fertility by Age by Marriage Status in Lincoln Parish
27.3% of women with births (554) in Lincoln Parish are married. The highest percentage of unmarried women with births falls into 20 to 34 years age bracket with 85.4% of them unmarried at the time of birth, while the lowest percentage of unmarried women with births belong to 35 to 50 years age bracket with 17.5% of them unmarried.
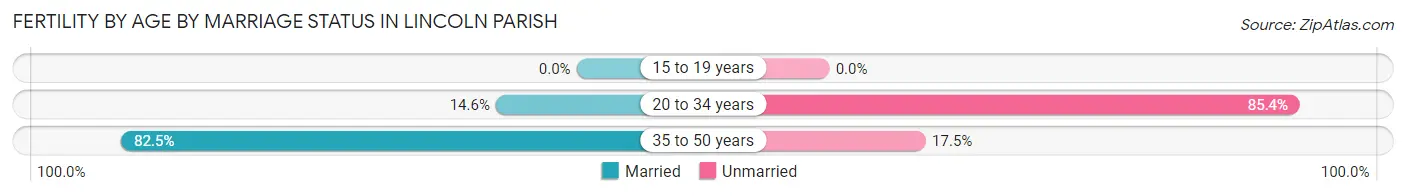
| Age Bracket | Married | Unmarried |
| 15 to 19 years | 0 (0.0%) | 0 (0.0%) |
| 20 to 34 years | 66 (14.6%) | 385 (85.4%) |
| 35 to 50 years | 85 (82.5%) | 18 (17.5%) |
| Total | 151 (27.3%) | 403 (72.7%) |
Fertility by Education in Lincoln Parish
Average fertility rate in Lincoln Parish is 40.0 births per 1,000 women. Women with the education attainment of college or associate's degree have the highest fertility rate of 60.0 births per 1,000 women, while women with the education attainment of high school diploma have the lowest fertility at 17.0 births per 1,000 women. Women with the education attainment of college or associate's degree represent 67.0% of all women with births.
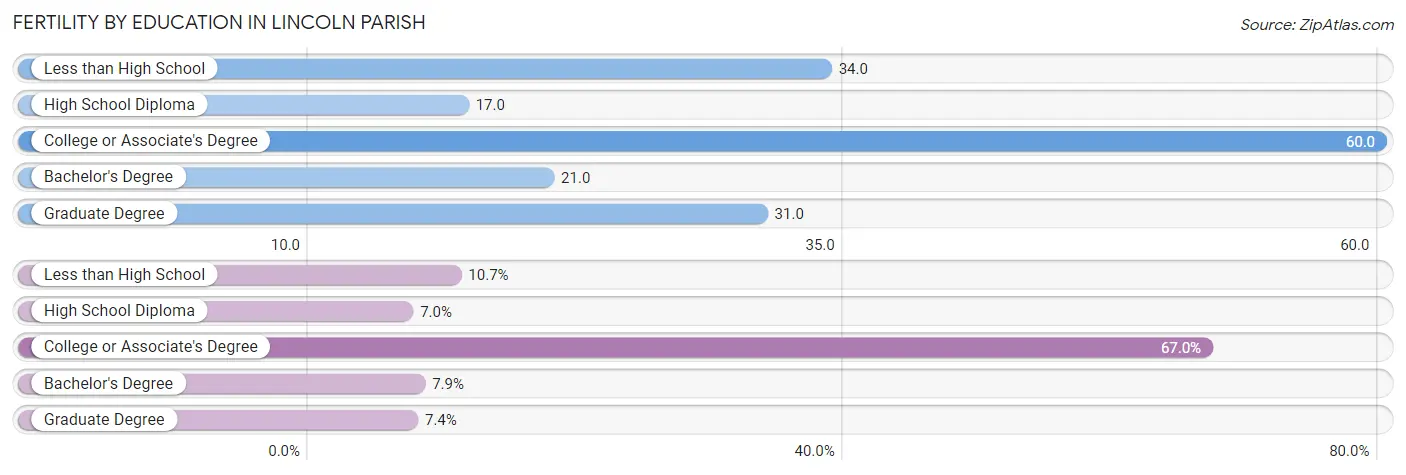
| Educational Attainment | Women with Births | Births / 1,000 Women |
| Less than High School | 59 (10.6%) | 34.0 |
| High School Diploma | 39 (7.0%) | 17.0 |
| College or Associate's Degree | 371 (67.0%) | 60.0 |
| Bachelor's Degree | 44 (7.9%) | 21.0 |
| Graduate Degree | 41 (7.4%) | 31.0 |
| Total | 554 (100.0%) | 40.0 |
Fertility by Education by Marriage Status in Lincoln Parish
72.7% of women with births in Lincoln Parish are unmarried. Women with the educational attainment of bachelor's degree are most likely to be married with 100.0% of them married at childbirth, while women with the educational attainment of college or associate's degree are least likely to be married with 98.4% of them unmarried at childbirth.
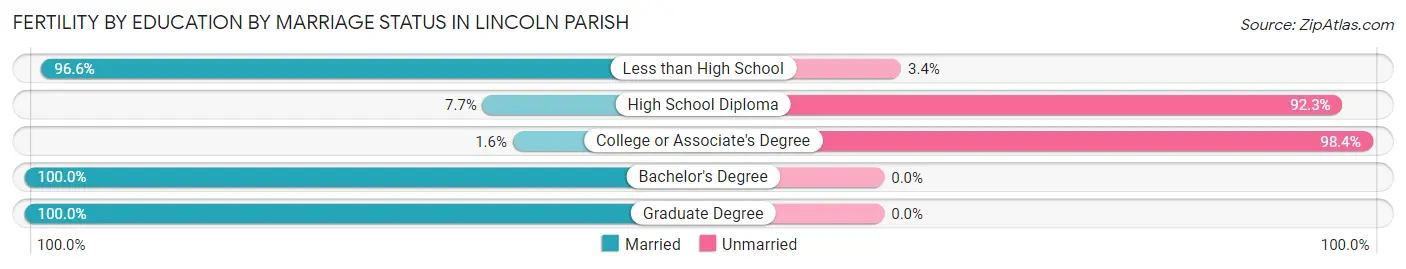
| Educational Attainment | Married | Unmarried |
| Less than High School | 57 (96.6%) | 2 (3.4%) |
| High School Diploma | 3 (7.7%) | 36 (92.3%) |
| College or Associate's Degree | 6 (1.6%) | 365 (98.4%) |
| Bachelor's Degree | 44 (100.0%) | 0 (0.0%) |
| Graduate Degree | 41 (100.0%) | 0 (0.0%) |
| Total | 151 (27.3%) | 403 (72.7%) |
Income in Lincoln Parish
Income Overview in Lincoln Parish
Per Capita Income in Lincoln Parish is $24,411, while median incomes of families and households are $58,542 and $37,001 respectively.
| Characteristic | Number | Measure |
| Per Capita Income | 48,323 | $24,411 |
| Median Family Income | 9,914 | $58,542 |
| Mean Family Income | 9,914 | $83,684 |
| Median Household Income | 18,043 | $37,001 |
| Mean Household Income | 18,043 | $62,188 |
| Income Deficit | 9,914 | $11,363 |
| Wage / Income Gap (%) | 48,323 | 27.71% |
| Wage / Income Gap ($) | 48,323 | 72.29¢ per $1 |
| Gini / Inequality Index | 48,323 | 0.52 |
Earnings by Sex in Lincoln Parish
Average Earnings in Lincoln Parish are $22,957, $27,922 for men and $20,184 for women, a difference of 27.7%.
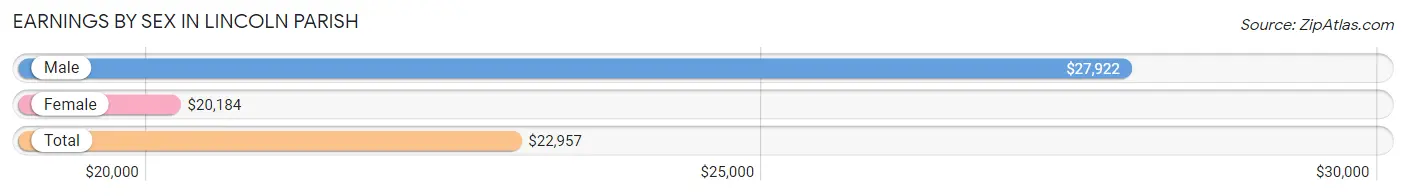
| Sex | Number | Average Earnings |
| Male | 12,012 (50.4%) | $27,922 |
| Female | 11,831 (49.6%) | $20,184 |
| Total | 23,843 (100.0%) | $22,957 |
Earnings by Sex by Income Bracket in Lincoln Parish
The most common earnings brackets in Lincoln Parish are $100,000+ for men (1,192 | 9.9%) and $2,500 to $4,999 for women (1,126 | 9.5%).
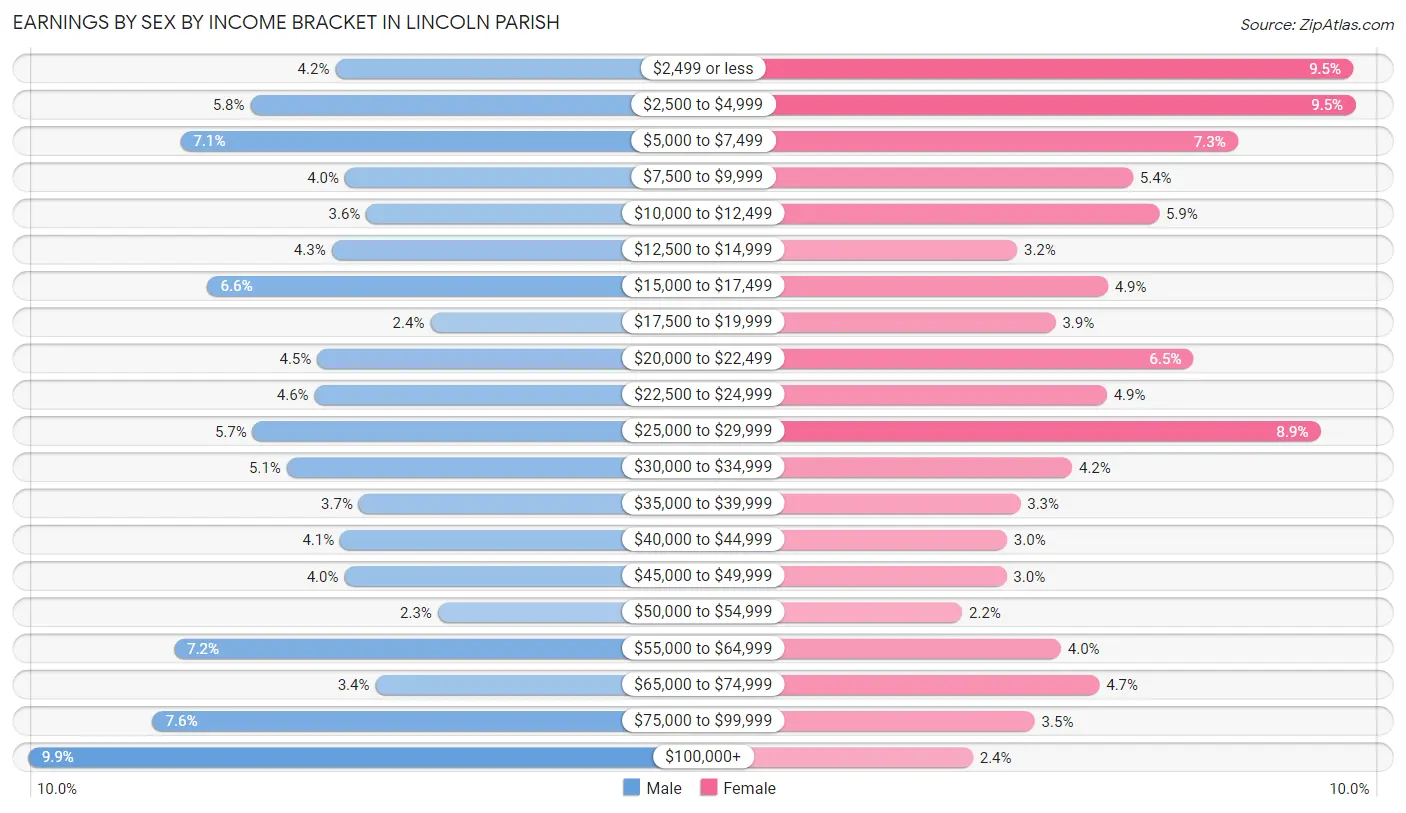
| Income | Male | Female |
| $2,499 or less | 502 (4.2%) | 1,122 (9.5%) |
| $2,500 to $4,999 | 693 (5.8%) | 1,126 (9.5%) |
| $5,000 to $7,499 | 850 (7.1%) | 866 (7.3%) |
| $7,500 to $9,999 | 481 (4.0%) | 634 (5.4%) |
| $10,000 to $12,499 | 432 (3.6%) | 692 (5.9%) |
| $12,500 to $14,999 | 511 (4.3%) | 377 (3.2%) |
| $15,000 to $17,499 | 789 (6.6%) | 579 (4.9%) |
| $17,500 to $19,999 | 288 (2.4%) | 463 (3.9%) |
| $20,000 to $22,499 | 543 (4.5%) | 768 (6.5%) |
| $22,500 to $24,999 | 549 (4.6%) | 576 (4.9%) |
| $25,000 to $29,999 | 688 (5.7%) | 1,050 (8.9%) |
| $30,000 to $34,999 | 611 (5.1%) | 499 (4.2%) |
| $35,000 to $39,999 | 449 (3.7%) | 384 (3.3%) |
| $40,000 to $44,999 | 491 (4.1%) | 355 (3.0%) |
| $45,000 to $49,999 | 482 (4.0%) | 354 (3.0%) |
| $50,000 to $54,999 | 271 (2.3%) | 256 (2.2%) |
| $55,000 to $64,999 | 865 (7.2%) | 474 (4.0%) |
| $65,000 to $74,999 | 412 (3.4%) | 560 (4.7%) |
| $75,000 to $99,999 | 913 (7.6%) | 417 (3.5%) |
| $100,000+ | 1,192 (9.9%) | 279 (2.4%) |
| Total | 12,012 (100.0%) | 11,831 (100.0%) |
Earnings by Sex by Educational Attainment in Lincoln Parish
Average earnings in Lincoln Parish are $43,712 for men and $28,193 for women, a difference of 35.5%. Men with an educational attainment of bachelor's degree enjoy the highest average annual earnings of $65,245, while those with less than high school education earn the least with $22,778. Women with an educational attainment of graduate degree earn the most with the average annual earnings of $49,788, while those with less than high school education have the smallest earnings of $11,821.
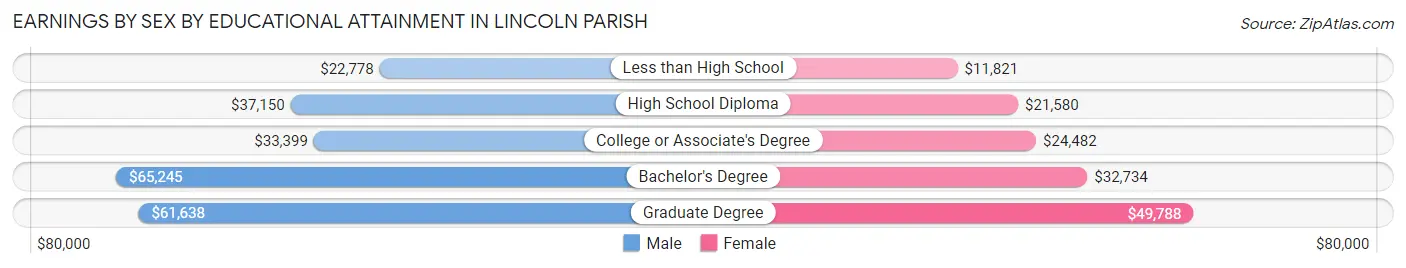
| Educational Attainment | Male Income | Female Income |
| Less than High School | $22,778 | $11,821 |
| High School Diploma | $37,150 | $21,580 |
| College or Associate's Degree | $33,399 | $24,482 |
| Bachelor's Degree | $65,245 | $32,734 |
| Graduate Degree | $61,638 | $49,788 |
| Total | $43,712 | $28,193 |
Family Income in Lincoln Parish
Family Income Brackets in Lincoln Parish
According to the Lincoln Parish family income data, there are 1,775 families falling into the $100,000 to $149,999 income range, which is the most common income bracket and makes up 17.9% of all families. Conversely, the $10,000 to $14,999 income bracket is the least frequent group with only 377 families (3.8%) belonging to this category.
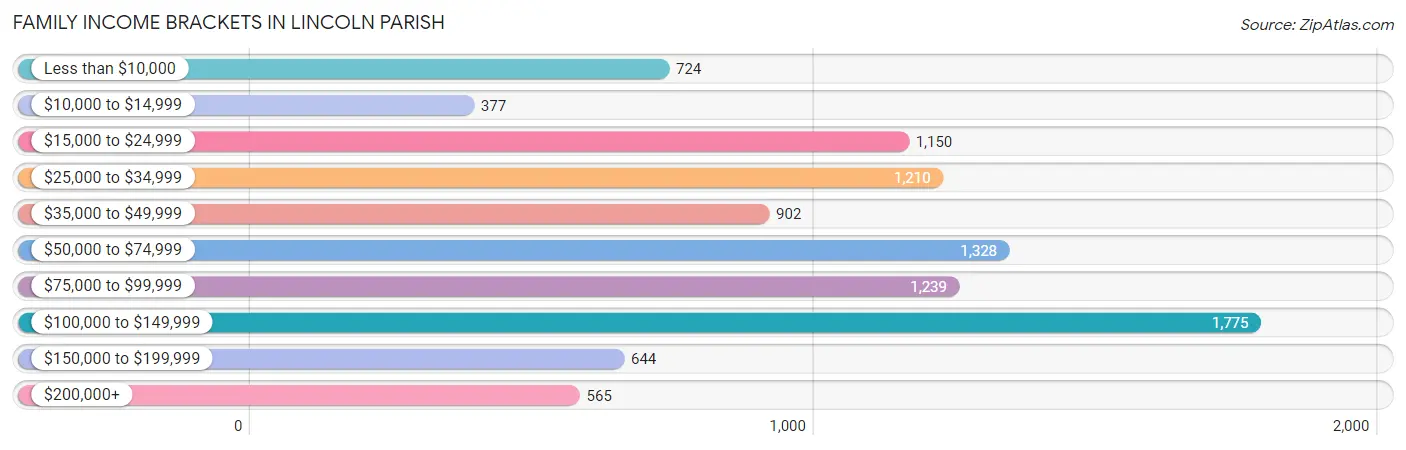
| Income Bracket | # Families | % Families |
| Less than $10,000 | 724 | 7.3% |
| $10,000 to $14,999 | 377 | 3.8% |
| $15,000 to $24,999 | 1,150 | 11.6% |
| $25,000 to $34,999 | 1,210 | 12.2% |
| $35,000 to $49,999 | 902 | 9.1% |
| $50,000 to $74,999 | 1,328 | 13.4% |
| $75,000 to $99,999 | 1,239 | 12.5% |
| $100,000 to $149,999 | 1,775 | 17.9% |
| $150,000 to $199,999 | 644 | 6.5% |
| $200,000+ | 565 | 5.7% |
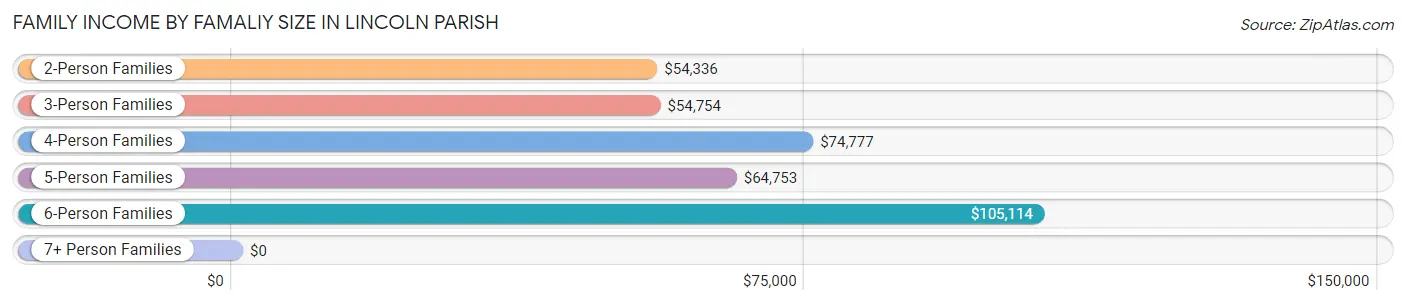
Family Income by Famaliy Size in Lincoln Parish
6-person families (233 | 2.4%) account for the highest median family income in Lincoln Parish with $105,114 per family, while 2-person families (5,193 | 52.4%) have the highest median income of $27,168 per family member.
| Income Bracket | # Families | Median Income |
| 2-Person Families | 5,193 (52.4%) | $54,336 |
| 3-Person Families | 2,144 (21.6%) | $54,754 |
| 4-Person Families | 1,433 (14.4%) | $74,777 |
| 5-Person Families | 833 (8.4%) | $64,753 |
| 6-Person Families | 233 (2.4%) | $105,114 |
| 7+ Person Families | 78 (0.8%) | $0 |
| Total | 9,914 (100.0%) | $58,542 |
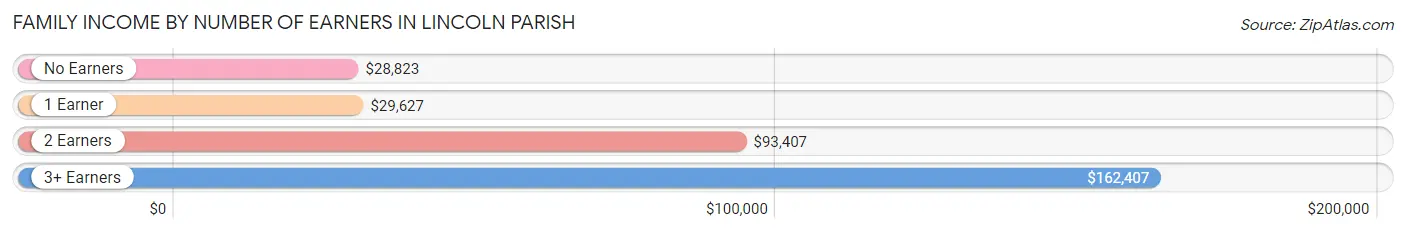
Family Income by Number of Earners in Lincoln Parish
The median family income in Lincoln Parish is $58,542, with families comprising 3+ earners (466) having the highest median family income of $162,407, while families with no earners (1,917) have the lowest median family income of $28,823, accounting for 4.7% and 19.3% of families, respectively.
| Number of Earners | # Families | Median Income |
| No Earners | 1,917 (19.3%) | $28,823 |
| 1 Earner | 3,649 (36.8%) | $29,627 |
| 2 Earners | 3,882 (39.2%) | $93,407 |
| 3+ Earners | 466 (4.7%) | $162,407 |
| Total | 9,914 (100.0%) | $58,542 |
Household Income in Lincoln Parish
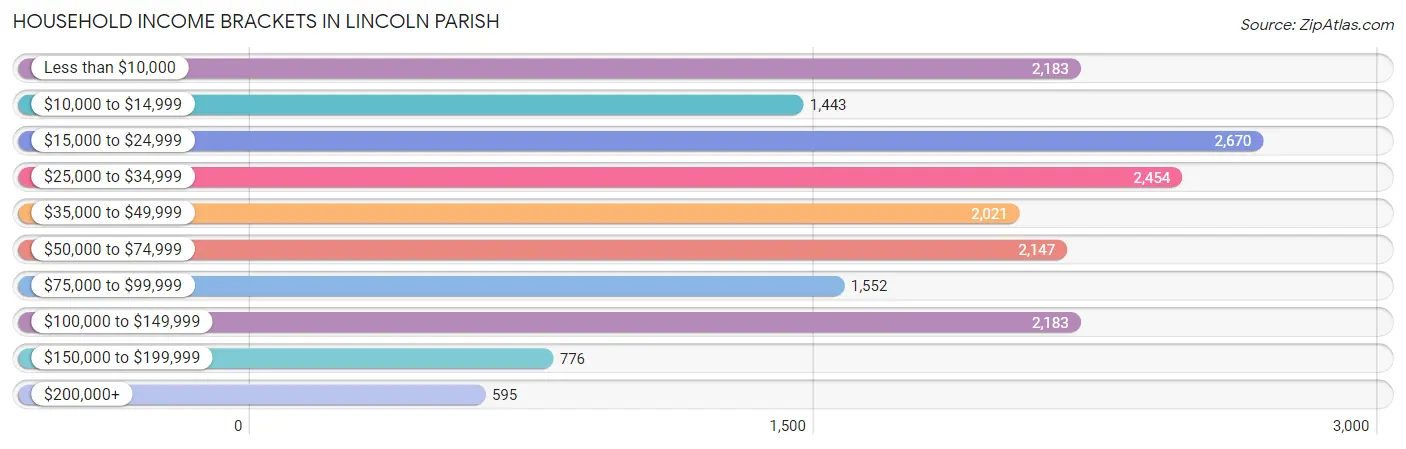
Household Income Brackets in Lincoln Parish
With 2,670 households falling in the category, the $15,000 to $24,999 income range is the most frequent in Lincoln Parish, accounting for 14.8% of all households. In contrast, only 595 households (3.3%) fall into the $200,000+ income bracket, making it the least populous group.
| Income Bracket | # Households | % Households |
| Less than $10,000 | 2,183 | 12.1% |
| $10,000 to $14,999 | 1,443 | 8.0% |
| $15,000 to $24,999 | 2,670 | 14.8% |
| $25,000 to $34,999 | 2,454 | 13.6% |
| $35,000 to $49,999 | 2,021 | 11.2% |
| $50,000 to $74,999 | 2,147 | 11.9% |
| $75,000 to $99,999 | 1,552 | 8.6% |
| $100,000 to $149,999 | 2,183 | 12.1% |
| $150,000 to $199,999 | 776 | 4.3% |
| $200,000+ | 595 | 3.3% |
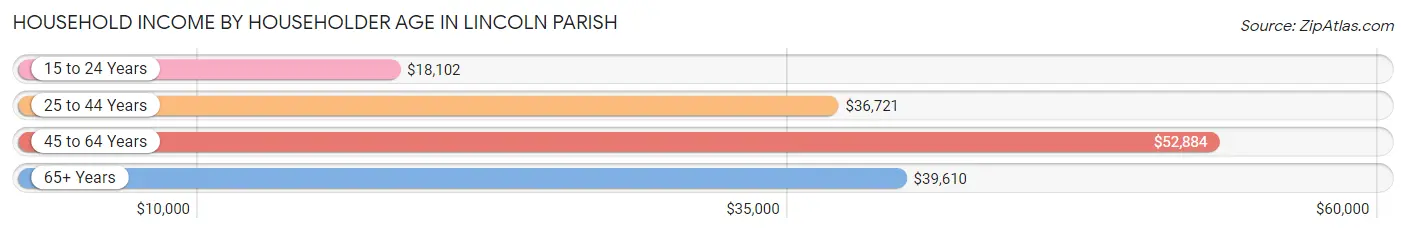
Household Income by Householder Age in Lincoln Parish
The median household income in Lincoln Parish is $37,001, with the highest median household income of $52,884 found in the 45 to 64 years age bracket for the primary householder. A total of 5,355 households (29.7%) fall into this category. Meanwhile, the 15 to 24 years age bracket for the primary householder has the lowest median household income of $18,102, with 2,661 households (14.7%) in this group.
| Income Bracket | # Households | Median Income |
| 15 to 24 Years | 2,661 (14.7%) | $18,102 |
| 25 to 44 Years | 5,579 (30.9%) | $36,721 |
| 45 to 64 Years | 5,355 (29.7%) | $52,884 |
| 65+ Years | 4,448 (24.6%) | $39,610 |
| Total | 18,043 (100.0%) | $37,001 |
Poverty in Lincoln Parish
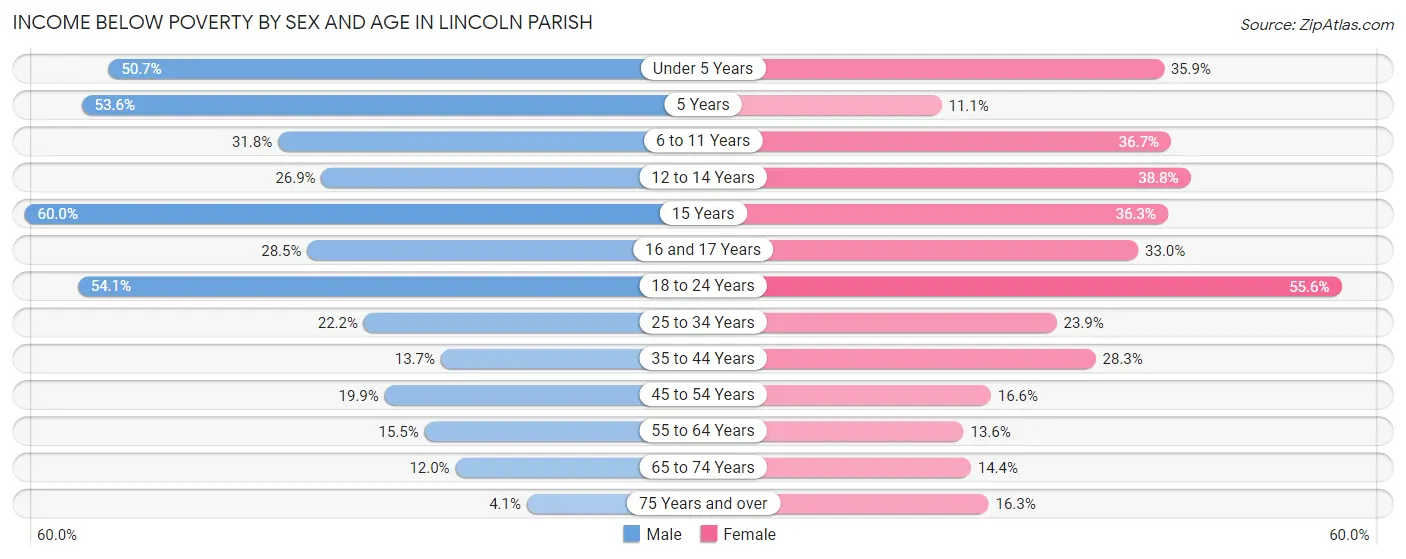
Income Below Poverty by Sex and Age in Lincoln Parish
With 29.2% poverty level for males and 30.2% for females among the residents of Lincoln Parish, 15 year old males and 18 to 24 year old females are the most vulnerable to poverty, with 135 males (60.0%) and 2,721 females (55.6%) in their respective age groups living below the poverty level.
| Age Bracket | Male | Female |
| Under 5 Years | 677 (50.7%) | 404 (35.8%) |
| 5 Years | 199 (53.6%) | 23 (11.1%) |
| 6 to 11 Years | 593 (31.8%) | 493 (36.6%) |
| 12 to 14 Years | 132 (26.9%) | 375 (38.8%) |
| 15 Years | 135 (60.0%) | 98 (36.3%) |
| 16 and 17 Years | 174 (28.5%) | 164 (33.0%) |
| 18 to 24 Years | 2,462 (54.1%) | 2,721 (55.6%) |
| 25 to 34 Years | 617 (22.2%) | 655 (23.9%) |
| 35 to 44 Years | 333 (13.7%) | 720 (28.3%) |
| 45 to 54 Years | 399 (19.9%) | 375 (16.6%) |
| 55 to 64 Years | 333 (15.5%) | 327 (13.6%) |
| 65 to 74 Years | 214 (12.0%) | 289 (14.4%) |
| 75 Years and over | 42 (4.1%) | 256 (16.3%) |
| Total | 6,310 (29.2%) | 6,900 (30.2%) |
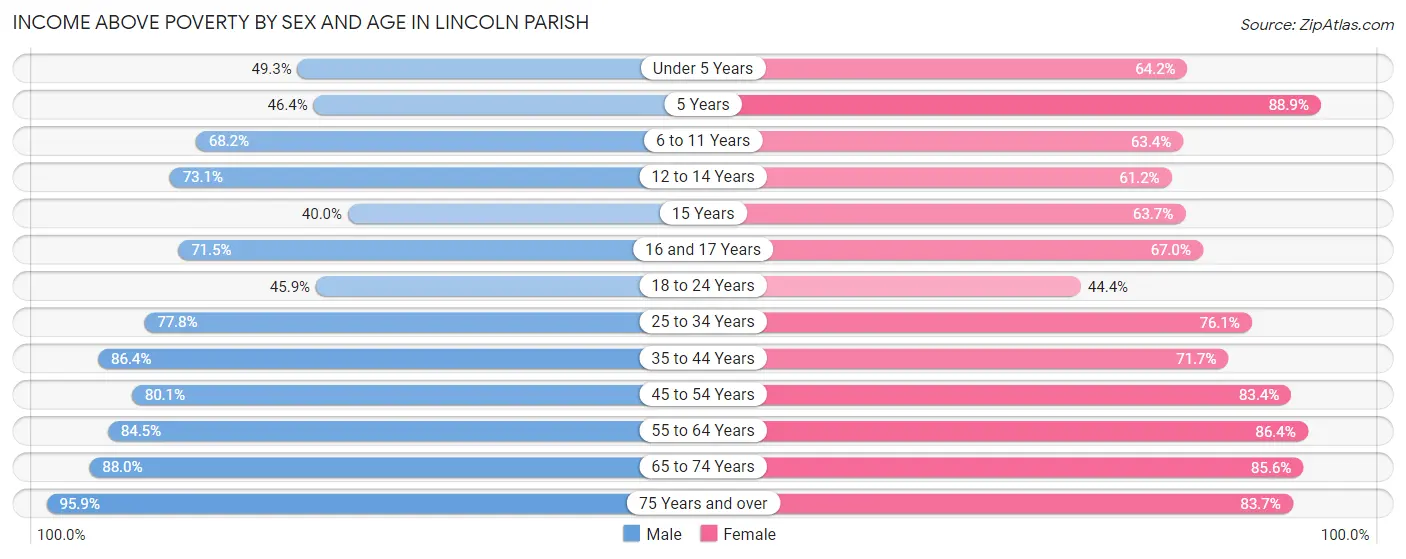
Income Above Poverty by Sex and Age in Lincoln Parish
According to the poverty statistics in Lincoln Parish, males aged 75 years and over and females aged 5 years are the age groups that are most secure financially, with 95.9% of males and 88.9% of females in these age groups living above the poverty line.
| Age Bracket | Male | Female |
| Under 5 Years | 659 (49.3%) | 723 (64.1%) |
| 5 Years | 172 (46.4%) | 184 (88.9%) |
| 6 to 11 Years | 1,273 (68.2%) | 852 (63.3%) |
| 12 to 14 Years | 358 (73.1%) | 591 (61.2%) |
| 15 Years | 90 (40.0%) | 172 (63.7%) |
| 16 and 17 Years | 436 (71.5%) | 333 (67.0%) |
| 18 to 24 Years | 2,091 (45.9%) | 2,171 (44.4%) |
| 25 to 34 Years | 2,160 (77.8%) | 2,083 (76.1%) |
| 35 to 44 Years | 2,107 (86.4%) | 1,828 (71.7%) |
| 45 to 54 Years | 1,605 (80.1%) | 1,884 (83.4%) |
| 55 to 64 Years | 1,821 (84.5%) | 2,084 (86.4%) |
| 65 to 74 Years | 1,566 (88.0%) | 1,722 (85.6%) |
| 75 Years and over | 991 (95.9%) | 1,311 (83.7%) |
| Total | 15,329 (70.8%) | 15,938 (69.8%) |
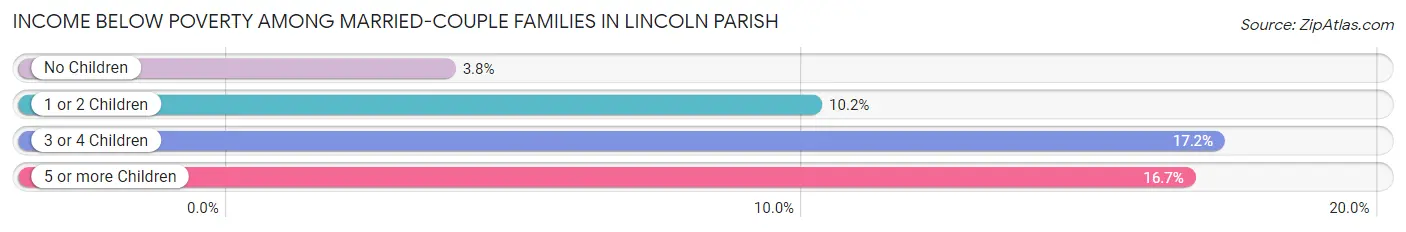
Income Below Poverty Among Married-Couple Families in Lincoln Parish
The poverty statistics for married-couple families in Lincoln Parish show that 7.0% or 431 of the total 6,189 families live below the poverty line. Families with 3 or 4 children have the highest poverty rate of 17.2%, comprising of 95 families. On the other hand, families with no children have the lowest poverty rate of 3.8%, which includes 142 families.
| Children | Above Poverty | Below Poverty |
| No Children | 3,606 (96.2%) | 142 (3.8%) |
| 1 or 2 Children | 1,669 (89.8%) | 189 (10.2%) |
| 3 or 4 Children | 458 (82.8%) | 95 (17.2%) |
| 5 or more Children | 25 (83.3%) | 5 (16.7%) |
| Total | 5,758 (93.0%) | 431 (7.0%) |
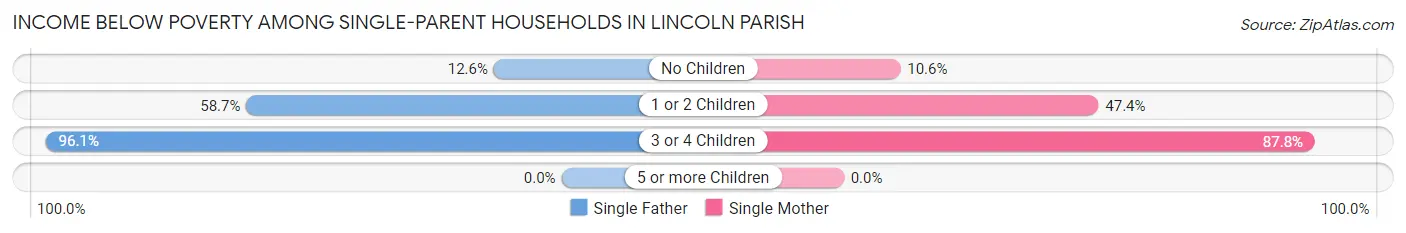
Income Below Poverty Among Single-Parent Households in Lincoln Parish
According to the poverty data in Lincoln Parish, 45.5% or 352 single-father households and 38.7% or 1,141 single-mother households are living below the poverty line. Among single-father households, those with 3 or 4 children have the highest poverty rate, with 49 households (96.1%) experiencing poverty. Likewise, among single-mother households, those with 3 or 4 children have the highest poverty rate, with 280 households (87.8%) falling below the poverty line.
| Children | Single Father | Single Mother |
| No Children | 33 (12.6%) | 111 (10.5%) |
| 1 or 2 Children | 270 (58.7%) | 750 (47.4%) |
| 3 or 4 Children | 49 (96.1%) | 280 (87.8%) |
| 5 or more Children | 0 (0.0%) | 0 (0.0%) |
| Total | 352 (45.5%) | 1,141 (38.7%) |
Income Below Poverty Among Married-Couple vs Single-Parent Households in Lincoln Parish
The poverty data for Lincoln Parish shows that 431 of the married-couple family households (7.0%) and 1,493 of the single-parent households (40.1%) are living below the poverty level. Within the married-couple family households, those with 3 or 4 children have the highest poverty rate, with 95 households (17.2%) falling below the poverty line. Among the single-parent households, those with 3 or 4 children have the highest poverty rate, with 329 household (88.9%) living below poverty.
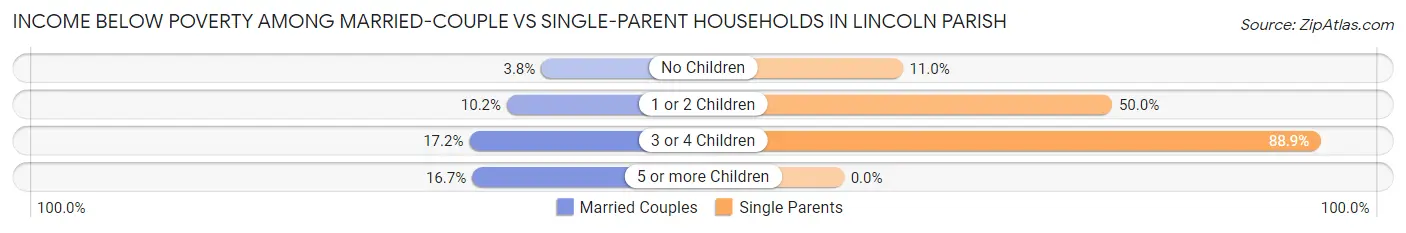
| Children | Married-Couple Families | Single-Parent Households |
| No Children | 142 (3.8%) | 144 (11.0%) |
| 1 or 2 Children | 189 (10.2%) | 1,020 (50.0%) |
| 3 or 4 Children | 95 (17.2%) | 329 (88.9%) |
| 5 or more Children | 5 (16.7%) | 0 (0.0%) |
| Total | 431 (7.0%) | 1,493 (40.1%) |
Employment Characteristics in Lincoln Parish
Employment by Class of Employer in Lincoln Parish
Among the 20,920 employed individuals in Lincoln Parish, private company employees (12,931 | 61.8%), state government employees (3,169 | 15.1%), and self-employed (not incorporated) (1,329 | 6.4%) make up the most common classes of employment.
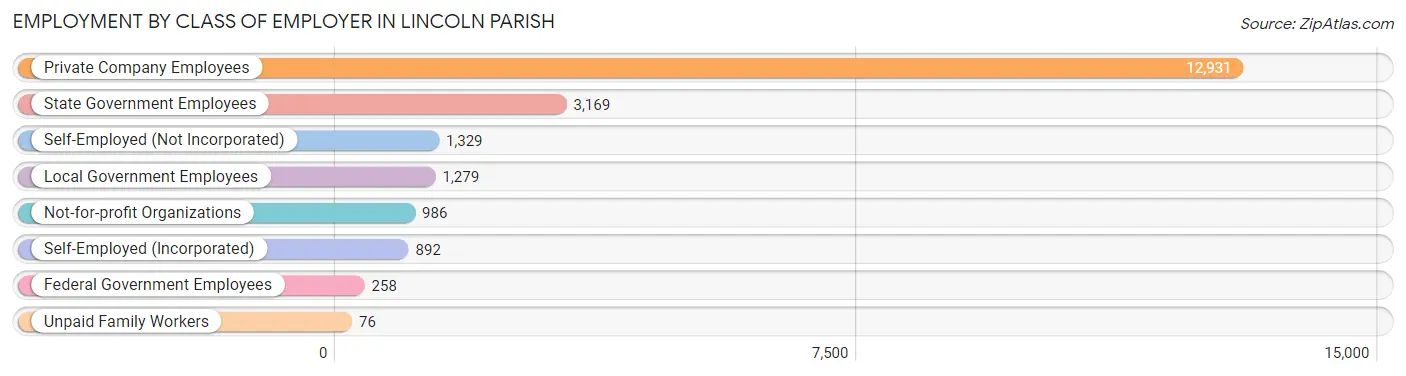
| Employer Class | # Employees | % Employees |
| Private Company Employees | 12,931 | 61.8% |
| Self-Employed (Incorporated) | 892 | 4.3% |
| Self-Employed (Not Incorporated) | 1,329 | 6.4% |
| Not-for-profit Organizations | 986 | 4.7% |
| Local Government Employees | 1,279 | 6.1% |
| State Government Employees | 3,169 | 15.1% |
| Federal Government Employees | 258 | 1.2% |
| Unpaid Family Workers | 76 | 0.4% |
| Total | 20,920 | 100.0% |
Employment Status by Age in Lincoln Parish
According to the labor force statistics for Lincoln Parish, out of the total population over 16 years of age (39,982), 55.4% or 22,150 individuals are in the labor force, with 4.2% or 930 of them unemployed. The age group with the highest labor force participation rate is 25 to 29 years, with 85.1% or 2,580 individuals in the labor force. Within the labor force, the 20 to 24 years age range has the highest percentage of unemployed individuals, with 8.8% or 479 of them being unemployed.
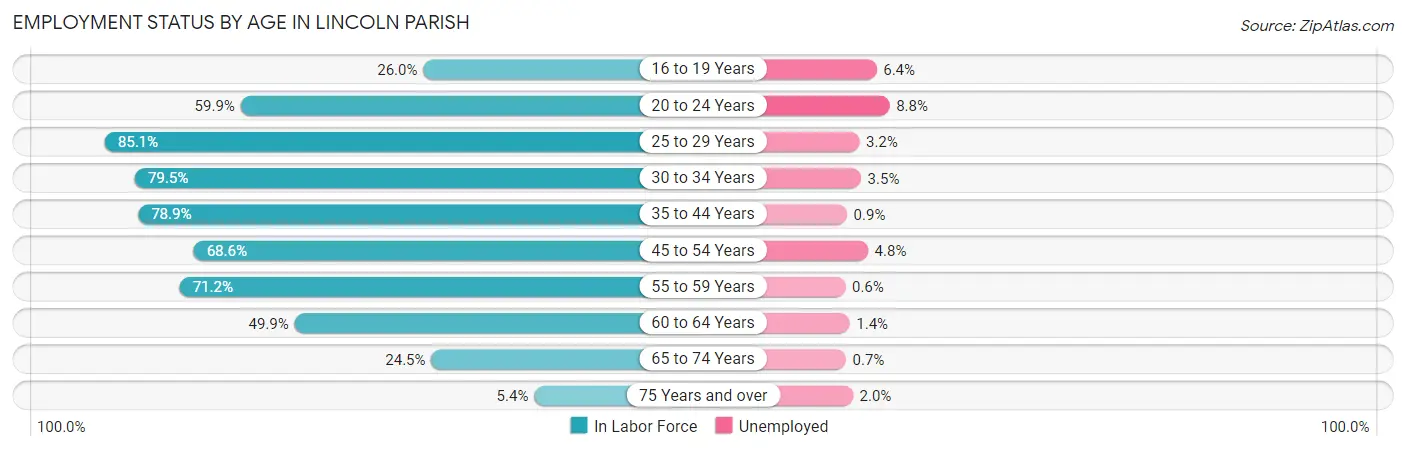
| Age Bracket | In Labor Force | Unemployed |
| 16 to 19 Years | 1,194 (26.0%) | 76 (6.4%) |
| 20 to 24 Years | 5,445 (59.9%) | 479 (8.8%) |
| 25 to 29 Years | 2,580 (85.1%) | 83 (3.2%) |
| 30 to 34 Years | 2,069 (79.5%) | 72 (3.5%) |
| 35 to 44 Years | 3,993 (78.9%) | 36 (0.9%) |
| 45 to 54 Years | 2,967 (68.6%) | 142 (4.8%) |
| 55 to 59 Years | 1,705 (71.2%) | 10 (0.6%) |
| 60 to 64 Years | 1,107 (49.9%) | 15 (1.4%) |
| 65 to 74 Years | 945 (24.5%) | 7 (0.7%) |
| 75 Years and over | 152 (5.4%) | 3 (2.0%) |
| Total | 22,150 (55.4%) | 930 (4.2%) |
Employment Status by Educational Attainment in Lincoln Parish
According to labor force statistics for Lincoln Parish, 73.4% of individuals (14,411) out of the total population between 25 and 64 years of age (19,634) are in the labor force, with 2.5% or 360 of them being unemployed. The group with the highest labor force participation rate are those with the educational attainment of bachelor's degree or higher, with 84.4% or 6,052 individuals in the labor force. Within the labor force, individuals with college / associate degree education have the highest percentage of unemployment, with 3.5% or 121 of them being unemployed.
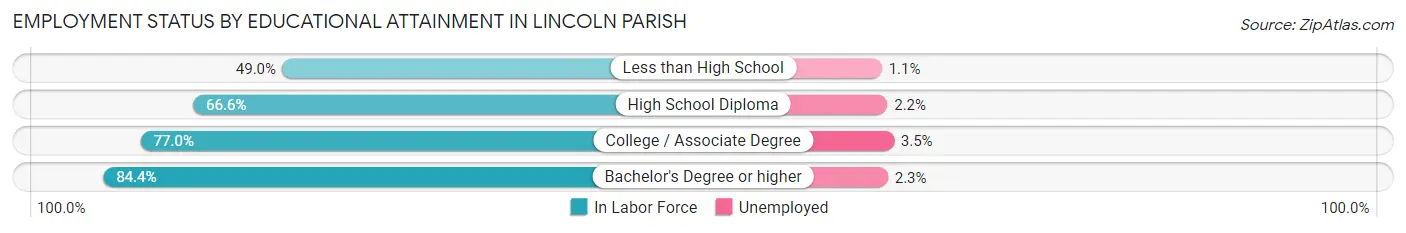
| Educational Attainment | In Labor Force | Unemployed |
| Less than High School | 1,135 (49.0%) | 25 (1.1%) |
| High School Diploma | 3,758 (66.6%) | 124 (2.2%) |
| College / Associate Degree | 3,467 (77.0%) | 158 (3.5%) |
| Bachelor's Degree or higher | 6,052 (84.4%) | 165 (2.3%) |
| Total | 14,411 (73.4%) | 491 (2.5%) |
Employment Occupations by Sex in Lincoln Parish
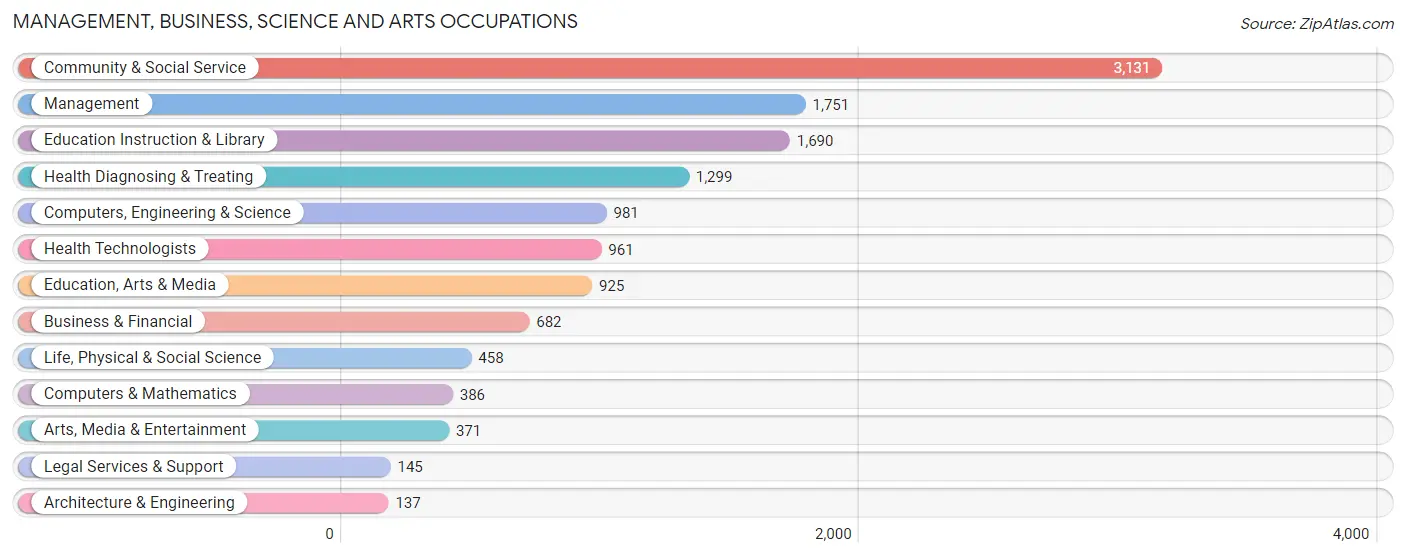
Management, Business, Science and Arts Occupations
The most common Management, Business, Science and Arts occupations in Lincoln Parish are Community & Social Service (3,131 | 14.8%), Management (1,751 | 8.3%), Education Instruction & Library (1,690 | 8.0%), Health Diagnosing & Treating (1,299 | 6.1%), and Computers, Engineering & Science (981 | 4.6%).
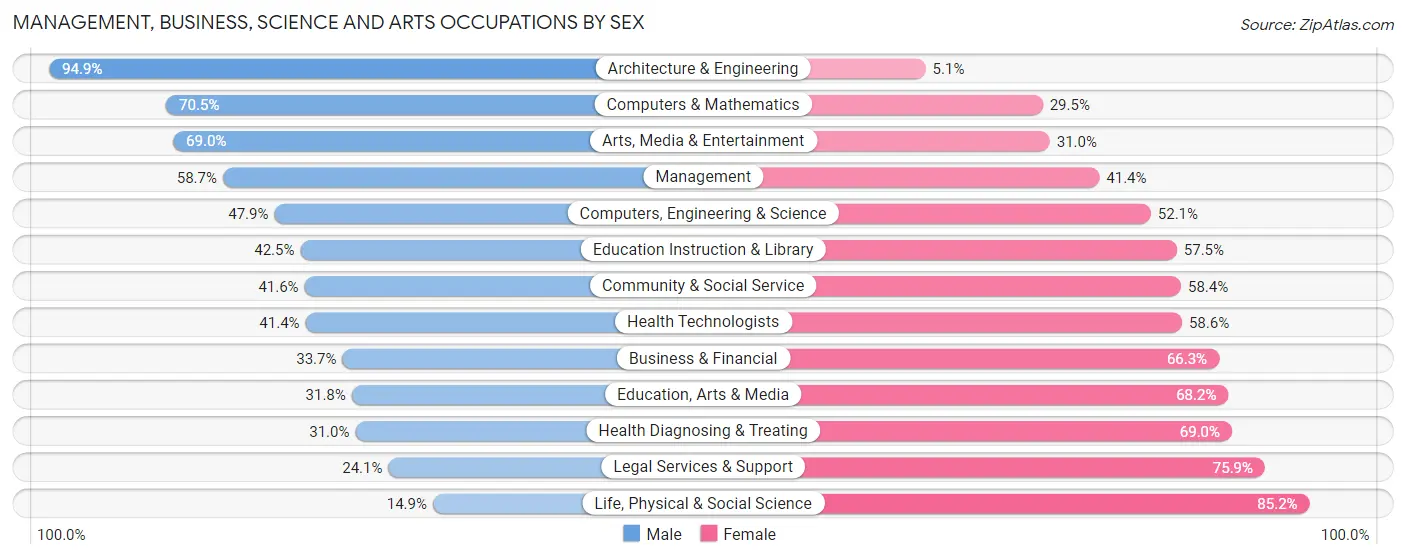
Management, Business, Science and Arts Occupations by Sex
Within the Management, Business, Science and Arts occupations in Lincoln Parish, the most male-oriented occupations are Architecture & Engineering (94.9%), Computers & Mathematics (70.5%), and Arts, Media & Entertainment (69.0%), while the most female-oriented occupations are Life, Physical & Social Science (85.2%), Legal Services & Support (75.9%), and Health Diagnosing & Treating (69.0%).
| Occupation | Male | Female |
| Management | 1,027 (58.7%) | 724 (41.3%) |
| Business & Financial | 230 (33.7%) | 452 (66.3%) |
| Computers, Engineering & Science | 470 (47.9%) | 511 (52.1%) |
| Computers & Mathematics | 272 (70.5%) | 114 (29.5%) |
| Architecture & Engineering | 130 (94.9%) | 7 (5.1%) |
| Life, Physical & Social Science | 68 (14.8%) | 390 (85.2%) |
| Community & Social Service | 1,303 (41.6%) | 1,828 (58.4%) |
| Education, Arts & Media | 294 (31.8%) | 631 (68.2%) |
| Legal Services & Support | 35 (24.1%) | 110 (75.9%) |
| Education Instruction & Library | 718 (42.5%) | 972 (57.5%) |
| Arts, Media & Entertainment | 256 (69.0%) | 115 (31.0%) |
| Health Diagnosing & Treating | 403 (31.0%) | 896 (69.0%) |
| Health Technologists | 398 (41.4%) | 563 (58.6%) |
| Total (Category) | 3,433 (43.8%) | 4,411 (56.2%) |
| Total (Overall) | 10,619 (50.1%) | 10,559 (49.9%) |
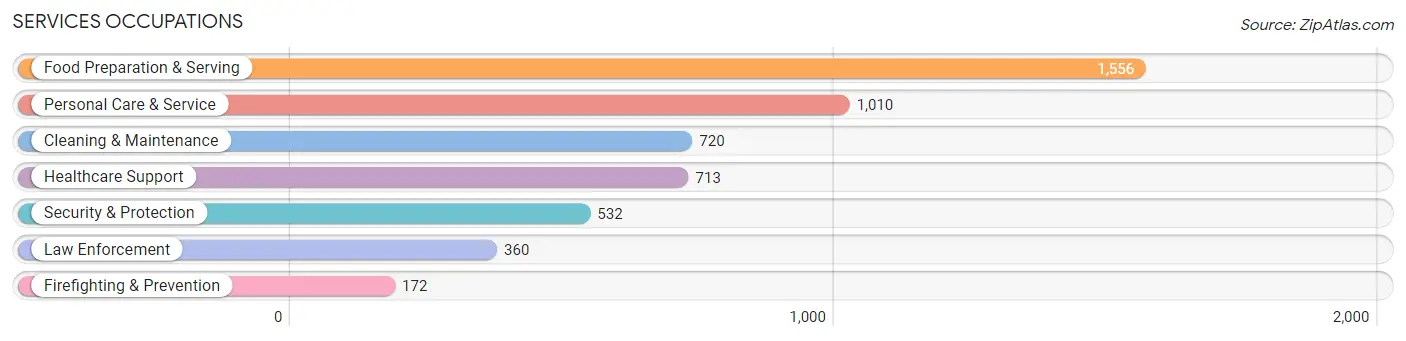
Services Occupations
The most common Services occupations in Lincoln Parish are Food Preparation & Serving (1,556 | 7.3%), Personal Care & Service (1,010 | 4.8%), Cleaning & Maintenance (720 | 3.4%), Healthcare Support (713 | 3.4%), and Security & Protection (532 | 2.5%).
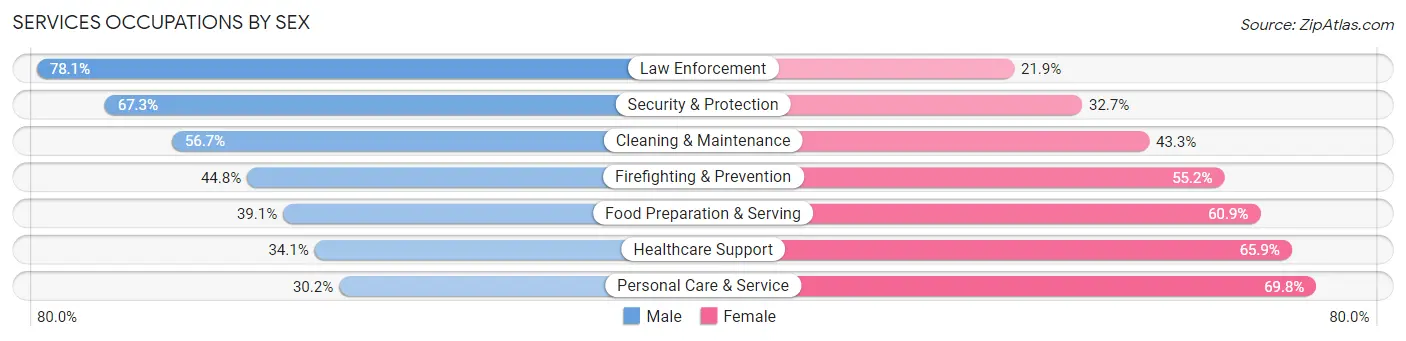
Services Occupations by Sex
Within the Services occupations in Lincoln Parish, the most male-oriented occupations are Law Enforcement (78.1%), Security & Protection (67.3%), and Cleaning & Maintenance (56.7%), while the most female-oriented occupations are Personal Care & Service (69.8%), Healthcare Support (65.9%), and Food Preparation & Serving (60.9%).
| Occupation | Male | Female |
| Healthcare Support | 243 (34.1%) | 470 (65.9%) |
| Security & Protection | 358 (67.3%) | 174 (32.7%) |
| Firefighting & Prevention | 77 (44.8%) | 95 (55.2%) |
| Law Enforcement | 281 (78.1%) | 79 (21.9%) |
| Food Preparation & Serving | 608 (39.1%) | 948 (60.9%) |
| Cleaning & Maintenance | 408 (56.7%) | 312 (43.3%) |
| Personal Care & Service | 305 (30.2%) | 705 (69.8%) |
| Total (Category) | 1,922 (42.4%) | 2,609 (57.6%) |
| Total (Overall) | 10,619 (50.1%) | 10,559 (49.9%) |
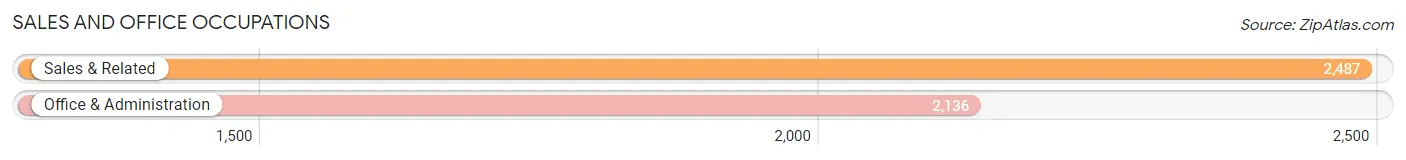
Sales and Office Occupations
The most common Sales and Office occupations in Lincoln Parish are Sales & Related (2,487 | 11.7%), and Office & Administration (2,136 | 10.1%).
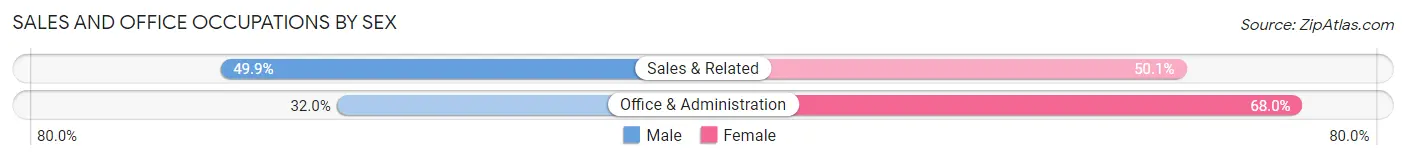
Sales and Office Occupations by Sex
| Occupation | Male | Female |
| Sales & Related | 1,241 (49.9%) | 1,246 (50.1%) |
| Office & Administration | 684 (32.0%) | 1,452 (68.0%) |
| Total (Category) | 1,925 (41.6%) | 2,698 (58.4%) |
| Total (Overall) | 10,619 (50.1%) | 10,559 (49.9%) |
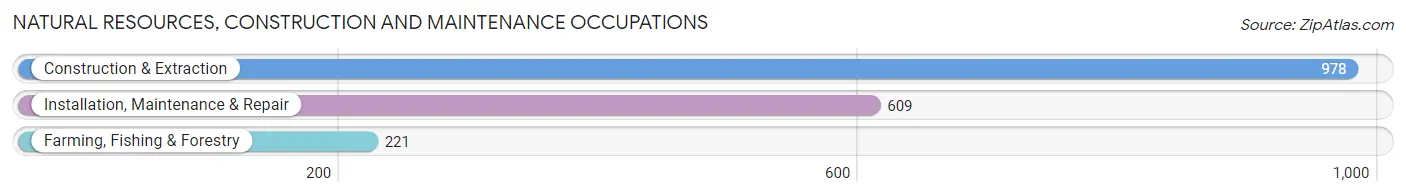
Natural Resources, Construction and Maintenance Occupations
The most common Natural Resources, Construction and Maintenance occupations in Lincoln Parish are Construction & Extraction (978 | 4.6%), Installation, Maintenance & Repair (609 | 2.9%), and Farming, Fishing & Forestry (221 | 1.0%).
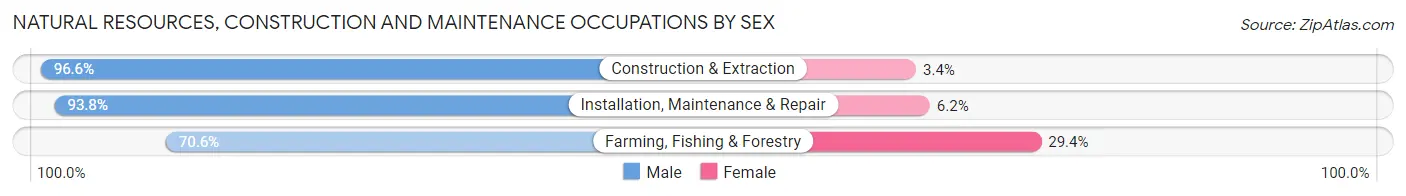
Natural Resources, Construction and Maintenance Occupations by Sex
| Occupation | Male | Female |
| Farming, Fishing & Forestry | 156 (70.6%) | 65 (29.4%) |
| Construction & Extraction | 945 (96.6%) | 33 (3.4%) |
| Installation, Maintenance & Repair | 571 (93.8%) | 38 (6.2%) |
| Total (Category) | 1,672 (92.5%) | 136 (7.5%) |
| Total (Overall) | 10,619 (50.1%) | 10,559 (49.9%) |
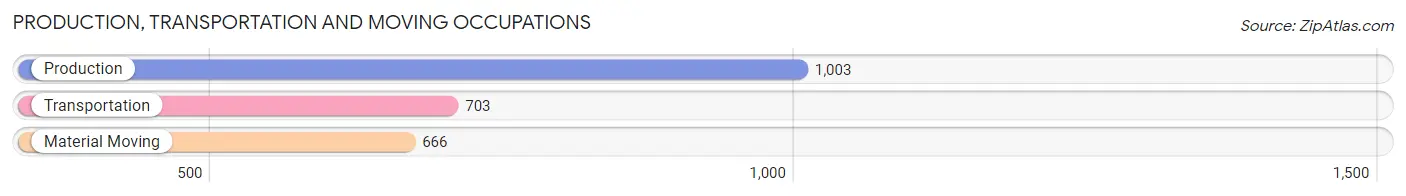
Production, Transportation and Moving Occupations
The most common Production, Transportation and Moving occupations in Lincoln Parish are Production (1,003 | 4.7%), Transportation (703 | 3.3%), and Material Moving (666 | 3.1%).
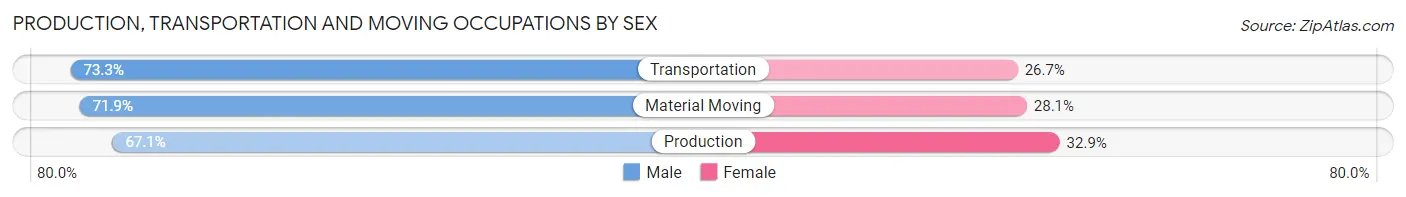
Production, Transportation and Moving Occupations by Sex
| Occupation | Male | Female |
| Production | 673 (67.1%) | 330 (32.9%) |
| Transportation | 515 (73.3%) | 188 (26.7%) |
| Material Moving | 479 (71.9%) | 187 (28.1%) |
| Total (Category) | 1,667 (70.3%) | 705 (29.7%) |
| Total (Overall) | 10,619 (50.1%) | 10,559 (49.9%) |
Employment Industries by Sex in Lincoln Parish
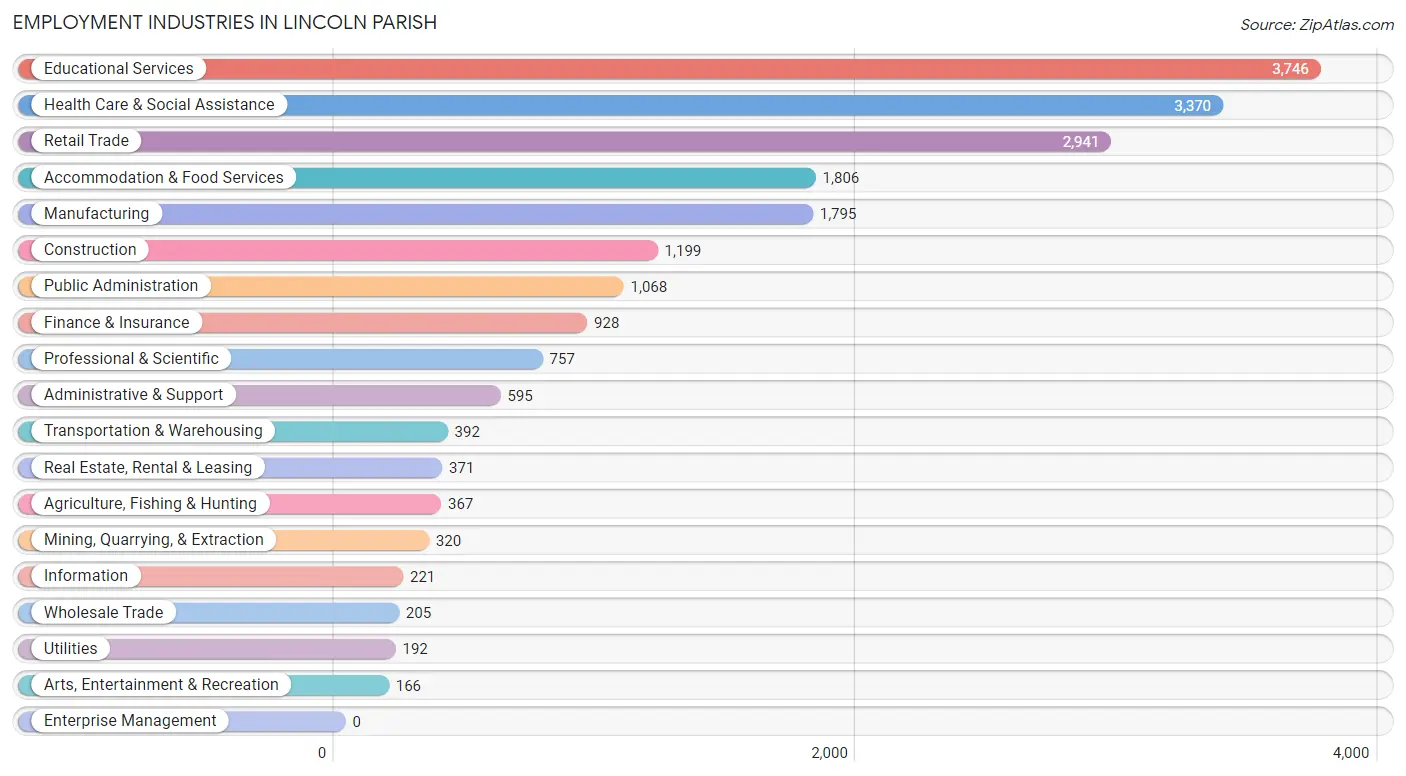
Employment Industries in Lincoln Parish
The major employment industries in Lincoln Parish include Educational Services (3,746 | 17.7%), Health Care & Social Assistance (3,370 | 15.9%), Retail Trade (2,941 | 13.9%), Accommodation & Food Services (1,806 | 8.5%), and Manufacturing (1,795 | 8.5%).
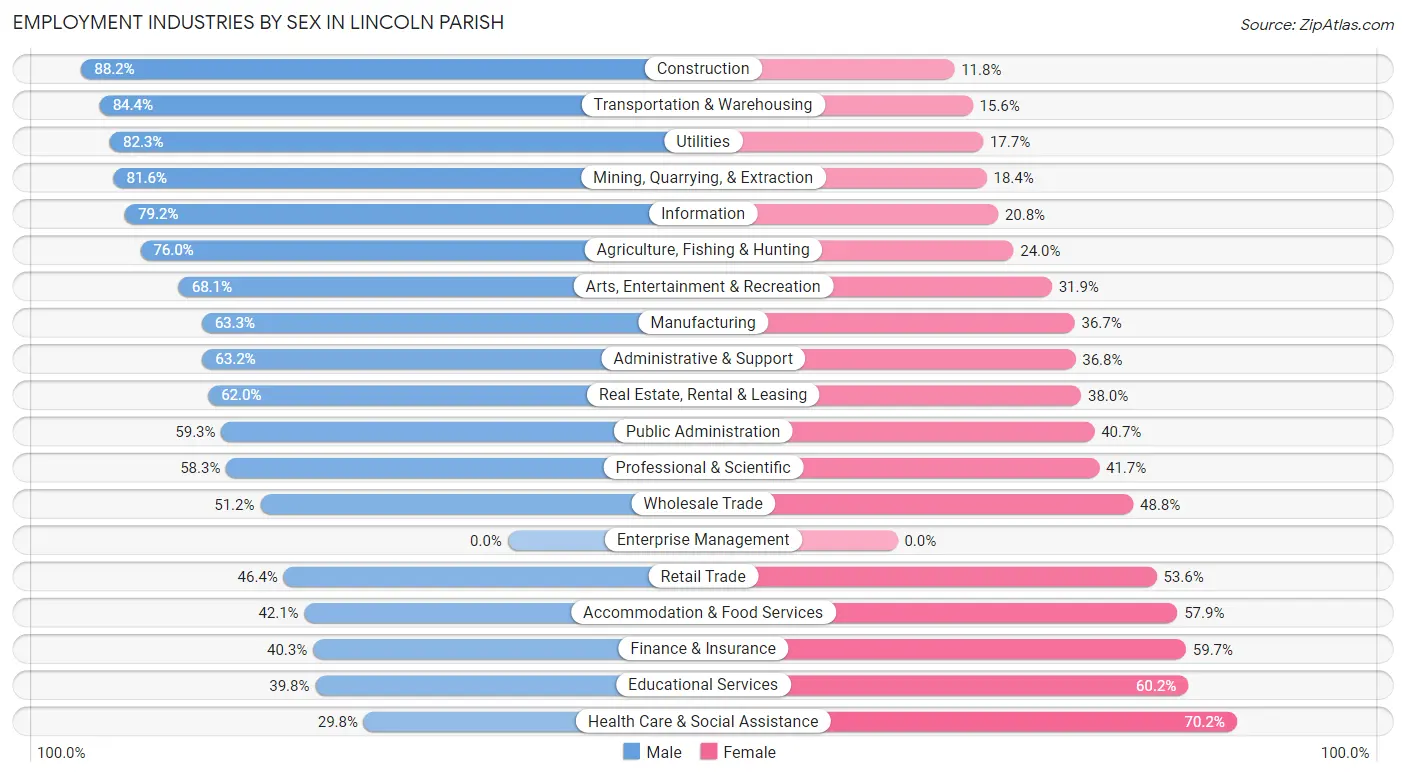
Employment Industries by Sex in Lincoln Parish
The Lincoln Parish industries that see more men than women are Construction (88.2%), Transportation & Warehousing (84.4%), and Utilities (82.3%), whereas the industries that tend to have a higher number of women are Health Care & Social Assistance (70.2%), Educational Services (60.2%), and Finance & Insurance (59.7%).
| Industry | Male | Female |
| Agriculture, Fishing & Hunting | 279 (76.0%) | 88 (24.0%) |
| Mining, Quarrying, & Extraction | 261 (81.6%) | 59 (18.4%) |
| Construction | 1,058 (88.2%) | 141 (11.8%) |
| Manufacturing | 1,137 (63.3%) | 658 (36.7%) |
| Wholesale Trade | 105 (51.2%) | 100 (48.8%) |
| Retail Trade | 1,364 (46.4%) | 1,577 (53.6%) |
| Transportation & Warehousing | 331 (84.4%) | 61 (15.6%) |
| Utilities | 158 (82.3%) | 34 (17.7%) |
| Information | 175 (79.2%) | 46 (20.8%) |
| Finance & Insurance | 374 (40.3%) | 554 (59.7%) |
| Real Estate, Rental & Leasing | 230 (62.0%) | 141 (38.0%) |
| Professional & Scientific | 441 (58.3%) | 316 (41.7%) |
| Enterprise Management | 0 (0.0%) | 0 (0.0%) |
| Administrative & Support | 376 (63.2%) | 219 (36.8%) |
| Educational Services | 1,492 (39.8%) | 2,254 (60.2%) |
| Health Care & Social Assistance | 1,004 (29.8%) | 2,366 (70.2%) |
| Arts, Entertainment & Recreation | 113 (68.1%) | 53 (31.9%) |
| Accommodation & Food Services | 760 (42.1%) | 1,046 (57.9%) |
| Public Administration | 633 (59.3%) | 435 (40.7%) |
| Total | 10,619 (50.1%) | 10,559 (49.9%) |
Education in Lincoln Parish
School Enrollment in Lincoln Parish
The most common levels of schooling among the 17,605 students in Lincoln Parish are college / undergraduate (8,610 | 48.9%), elementary school (2,376 | 13.5%), and high school (2,174 | 12.3%).
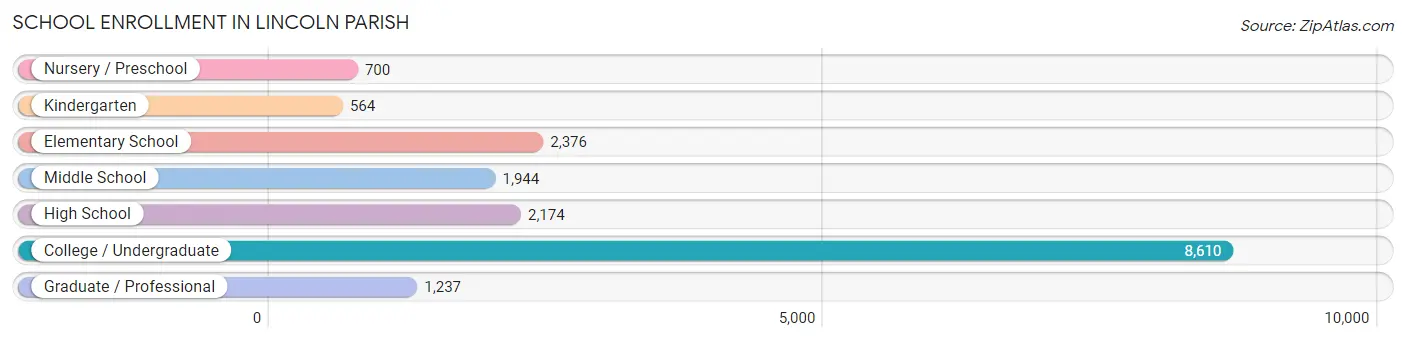
| School Level | # Students | % Students |
| Nursery / Preschool | 700 | 4.0% |
| Kindergarten | 564 | 3.2% |
| Elementary School | 2,376 | 13.5% |
| Middle School | 1,944 | 11.0% |
| High School | 2,174 | 12.3% |
| College / Undergraduate | 8,610 | 48.9% |
| Graduate / Professional | 1,237 | 7.0% |
| Total | 17,605 | 100.0% |
School Enrollment by Age by Funding Source in Lincoln Parish
Out of a total of 17,605 students who are enrolled in schools in Lincoln Parish, 1,584 (9.0%) attend a private institution, while the remaining 16,021 (91.0%) are enrolled in public schools. The age group of 10 to 14 year olds has the highest likelihood of being enrolled in private schools, with 392 (15.4% in the age bracket) enrolled. Conversely, the age group of 18 to 19 year olds has the lowest likelihood of being enrolled in a private school, with 3,028 (98.1% in the age bracket) attending a public institution.
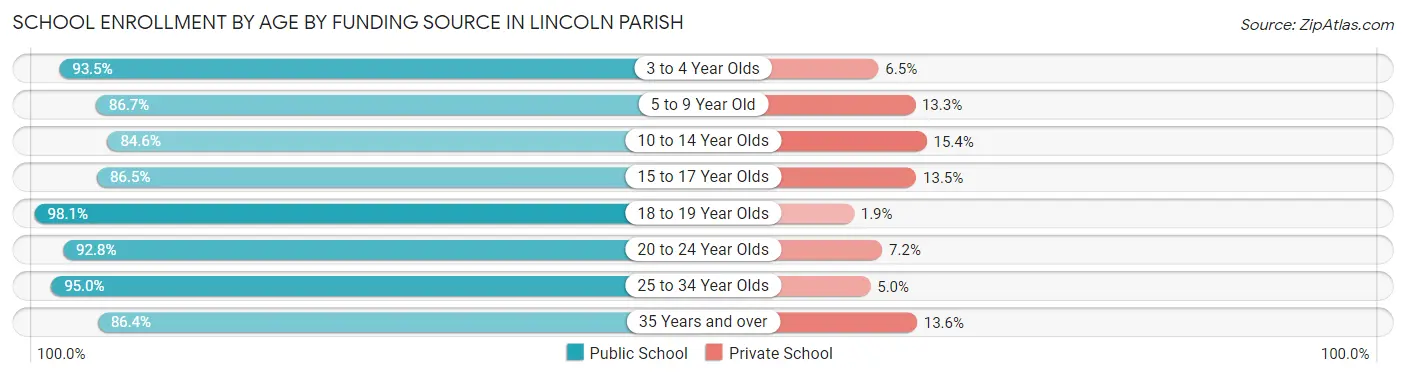
| Age Bracket | Public School | Private School |
| 3 to 4 Year Olds | 564 (93.5%) | 39 (6.5%) |
| 5 to 9 Year Old | 2,325 (86.7%) | 356 (13.3%) |
| 10 to 14 Year Olds | 2,147 (84.6%) | 392 (15.4%) |
| 15 to 17 Year Olds | 1,321 (86.5%) | 206 (13.5%) |
| 18 to 19 Year Olds | 3,028 (98.1%) | 58 (1.9%) |
| 20 to 24 Year Olds | 5,039 (92.8%) | 389 (7.2%) |
| 25 to 34 Year Olds | 978 (95.0%) | 51 (5.0%) |
| 35 Years and over | 615 (86.4%) | 97 (13.6%) |
| Total | 16,021 (91.0%) | 1,584 (9.0%) |
Educational Attainment by Field of Study in Lincoln Parish
Education (1,855 | 18.3%), business (1,613 | 16.0%), arts & humanities (1,553 | 15.4%), science & technology (1,032 | 10.2%), and bio, nature & agricultural (662 | 6.6%) are the most common fields of study among 10,107 individuals in Lincoln Parish who have obtained a bachelor's degree or higher.
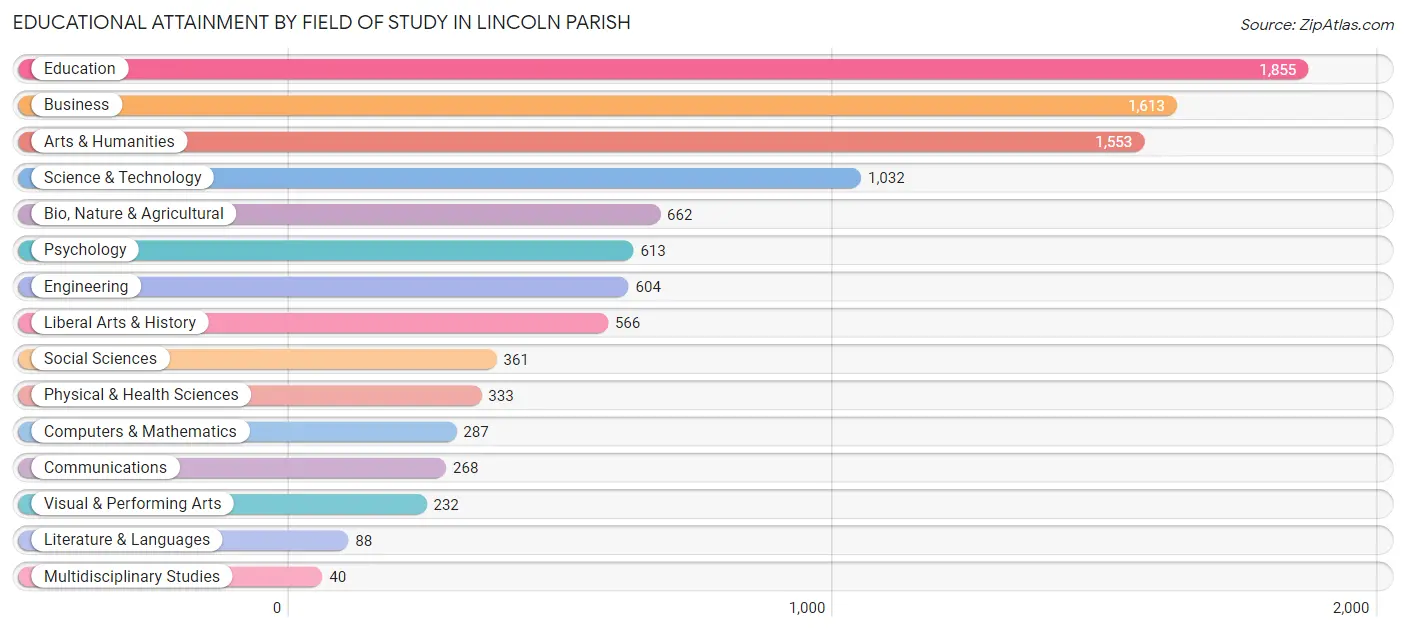
| Field of Study | # Graduates | % Graduates |
| Computers & Mathematics | 287 | 2.8% |
| Bio, Nature & Agricultural | 662 | 6.6% |
| Physical & Health Sciences | 333 | 3.3% |
| Psychology | 613 | 6.1% |
| Social Sciences | 361 | 3.6% |
| Engineering | 604 | 6.0% |
| Multidisciplinary Studies | 40 | 0.4% |
| Science & Technology | 1,032 | 10.2% |
| Business | 1,613 | 16.0% |
| Education | 1,855 | 18.3% |
| Literature & Languages | 88 | 0.9% |
| Liberal Arts & History | 566 | 5.6% |
| Visual & Performing Arts | 232 | 2.3% |
| Communications | 268 | 2.6% |
| Arts & Humanities | 1,553 | 15.4% |
| Total | 10,107 | 100.0% |
Transportation & Commute in Lincoln Parish
Vehicle Availability by Sex in Lincoln Parish
The most prevalent vehicle ownership categories in Lincoln Parish are males with 2 vehicles (4,331, accounting for 43.7%) and females with 2 vehicles (3,727, making up 45.2%).
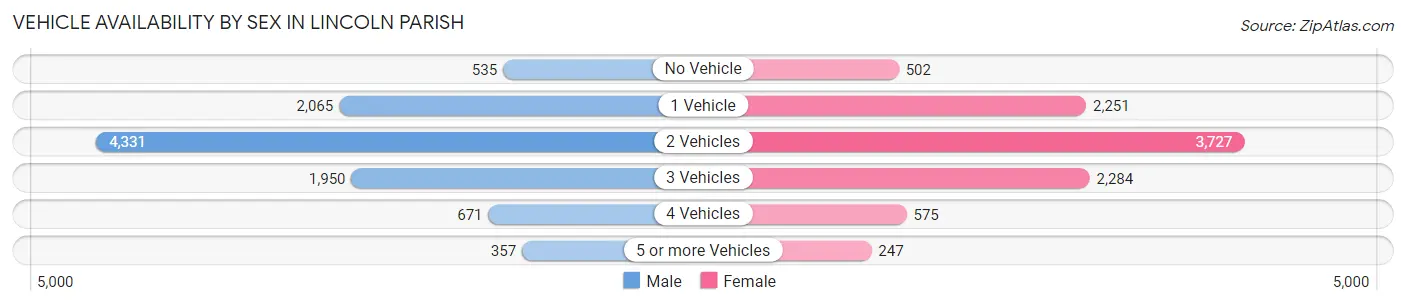
| Vehicles Available | Male | Female |
| No Vehicle | 535 (5.4%) | 502 (5.2%) |
| 1 Vehicle | 2,065 (20.8%) | 2,251 (23.5%) |
| 2 Vehicles | 4,331 (43.7%) | 3,727 (38.9%) |
| 3 Vehicles | 1,950 (19.7%) | 2,284 (23.8%) |
| 4 Vehicles | 671 (6.8%) | 575 (6.0%) |
| 5 or more Vehicles | 357 (3.6%) | 247 (2.6%) |
| Total | 9,909 (100.0%) | 9,586 (100.0%) |
Commute Time in Lincoln Parish
The most frequently occuring commute durations in Lincoln Parish are 10 to 14 minutes (4,376 commuters, 23.2%), 15 to 19 minutes (4,037 commuters, 21.4%), and 5 to 9 minutes (3,521 commuters, 18.7%).
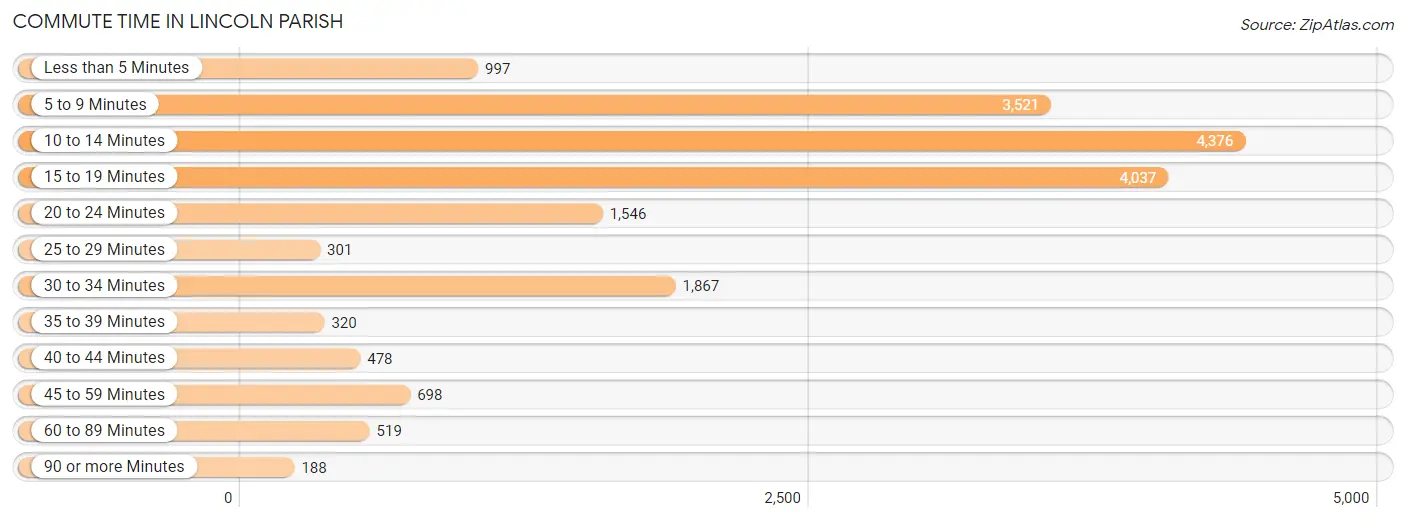
| Commute Time | # Commuters | % Commuters |
| Less than 5 Minutes | 997 | 5.3% |
| 5 to 9 Minutes | 3,521 | 18.7% |
| 10 to 14 Minutes | 4,376 | 23.2% |
| 15 to 19 Minutes | 4,037 | 21.4% |
| 20 to 24 Minutes | 1,546 | 8.2% |
| 25 to 29 Minutes | 301 | 1.6% |
| 30 to 34 Minutes | 1,867 | 9.9% |
| 35 to 39 Minutes | 320 | 1.7% |
| 40 to 44 Minutes | 478 | 2.5% |
| 45 to 59 Minutes | 698 | 3.7% |
| 60 to 89 Minutes | 519 | 2.8% |
| 90 or more Minutes | 188 | 1.0% |
Commute Time by Sex in Lincoln Parish
The most common commute times in Lincoln Parish are 10 to 14 minutes (2,356 commuters, 24.5%) for males and 10 to 14 minutes (2,020 commuters, 21.9%) for females.
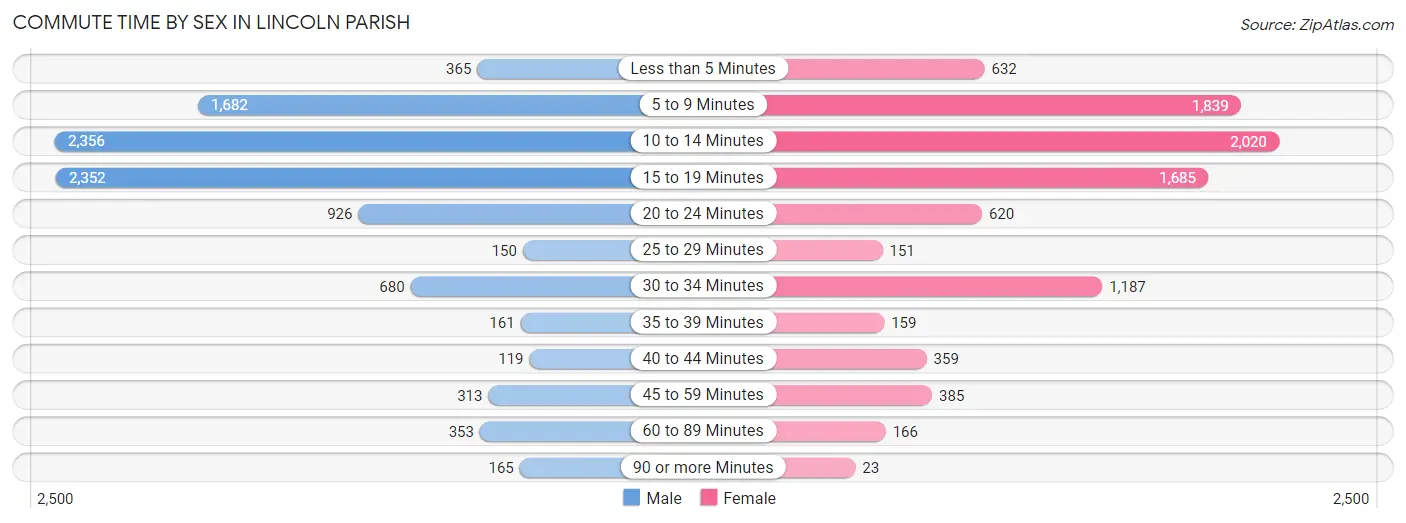
| Commute Time | Male | Female |
| Less than 5 Minutes | 365 (3.8%) | 632 (6.9%) |
| 5 to 9 Minutes | 1,682 (17.5%) | 1,839 (19.9%) |
| 10 to 14 Minutes | 2,356 (24.5%) | 2,020 (21.9%) |
| 15 to 19 Minutes | 2,352 (24.4%) | 1,685 (18.3%) |
| 20 to 24 Minutes | 926 (9.6%) | 620 (6.7%) |
| 25 to 29 Minutes | 150 (1.6%) | 151 (1.6%) |
| 30 to 34 Minutes | 680 (7.1%) | 1,187 (12.9%) |
| 35 to 39 Minutes | 161 (1.7%) | 159 (1.7%) |
| 40 to 44 Minutes | 119 (1.2%) | 359 (3.9%) |
| 45 to 59 Minutes | 313 (3.3%) | 385 (4.2%) |
| 60 to 89 Minutes | 353 (3.7%) | 166 (1.8%) |
| 90 or more Minutes | 165 (1.7%) | 23 (0.3%) |
Time of Departure to Work by Sex in Lincoln Parish
The most frequent times of departure to work in Lincoln Parish are 7:00 AM to 7:29 AM (1,727, 17.9%) for males and 7:30 AM to 7:59 AM (1,607, 17.4%) for females.
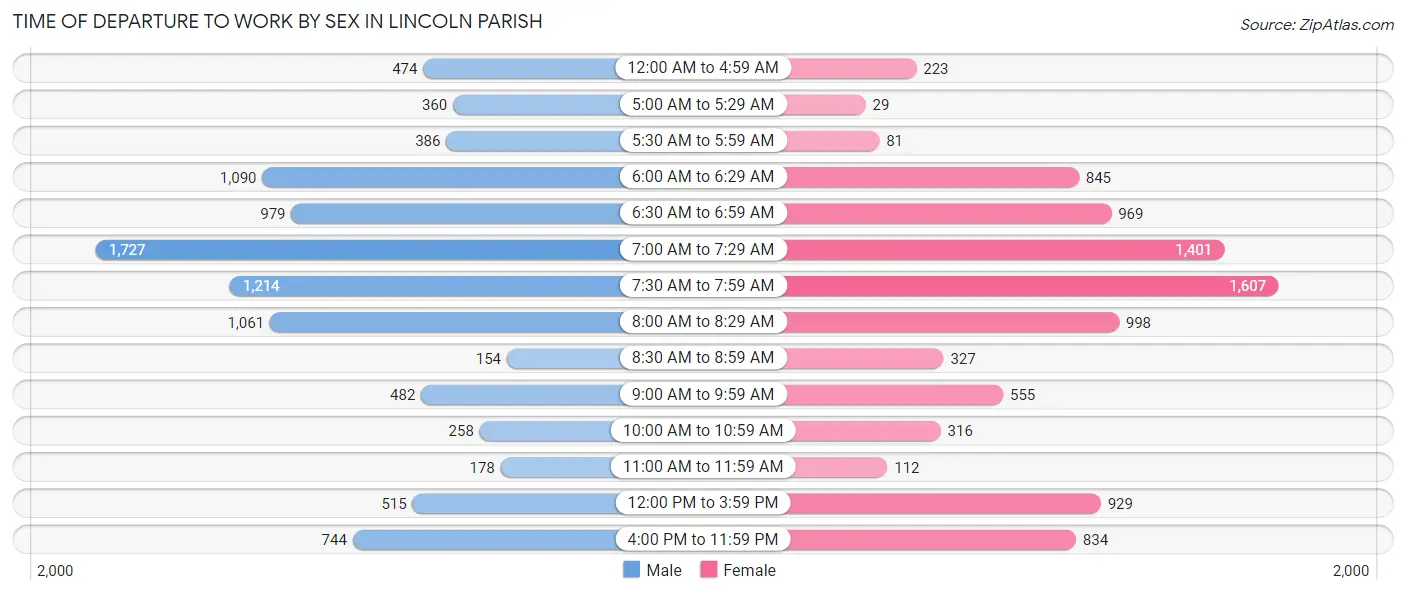
| Time of Departure | Male | Female |
| 12:00 AM to 4:59 AM | 474 (4.9%) | 223 (2.4%) |
| 5:00 AM to 5:29 AM | 360 (3.7%) | 29 (0.3%) |
| 5:30 AM to 5:59 AM | 386 (4.0%) | 81 (0.9%) |
| 6:00 AM to 6:29 AM | 1,090 (11.3%) | 845 (9.2%) |
| 6:30 AM to 6:59 AM | 979 (10.2%) | 969 (10.5%) |
| 7:00 AM to 7:29 AM | 1,727 (17.9%) | 1,401 (15.2%) |
| 7:30 AM to 7:59 AM | 1,214 (12.6%) | 1,607 (17.4%) |
| 8:00 AM to 8:29 AM | 1,061 (11.0%) | 998 (10.8%) |
| 8:30 AM to 8:59 AM | 154 (1.6%) | 327 (3.5%) |
| 9:00 AM to 9:59 AM | 482 (5.0%) | 555 (6.0%) |
| 10:00 AM to 10:59 AM | 258 (2.7%) | 316 (3.4%) |
| 11:00 AM to 11:59 AM | 178 (1.8%) | 112 (1.2%) |
| 12:00 PM to 3:59 PM | 515 (5.3%) | 929 (10.1%) |
| 4:00 PM to 11:59 PM | 744 (7.7%) | 834 (9.0%) |
| Total | 9,622 (100.0%) | 9,226 (100.0%) |
Housing Occupancy in Lincoln Parish
Occupancy by Ownership in Lincoln Parish
Of the total 18,043 dwellings in Lincoln Parish, owner-occupied units account for 9,367 (51.9%), while renter-occupied units make up 8,676 (48.1%).
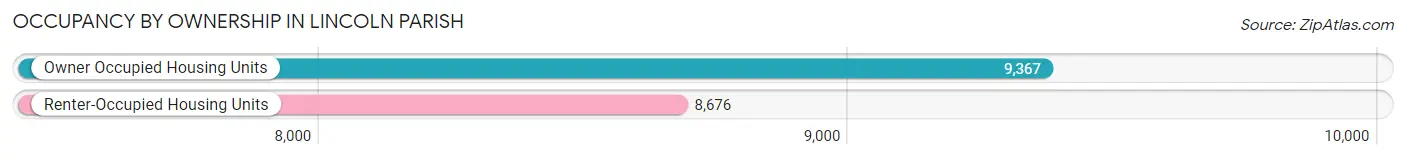
| Occupancy | # Housing Units | % Housing Units |
| Owner Occupied Housing Units | 9,367 | 51.9% |
| Renter-Occupied Housing Units | 8,676 | 48.1% |
| Total Occupied Housing Units | 18,043 | 100.0% |
Occupancy by Household Size in Lincoln Parish
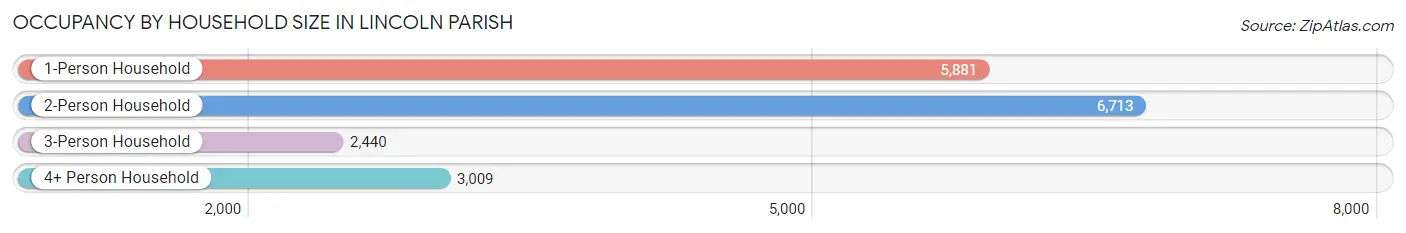
| Household Size | # Housing Units | % Housing Units |
| 1-Person Household | 5,881 | 32.6% |
| 2-Person Household | 6,713 | 37.2% |
| 3-Person Household | 2,440 | 13.5% |
| 4+ Person Household | 3,009 | 16.7% |
| Total Housing Units | 18,043 | 100.0% |
Occupancy by Ownership by Household Size in Lincoln Parish
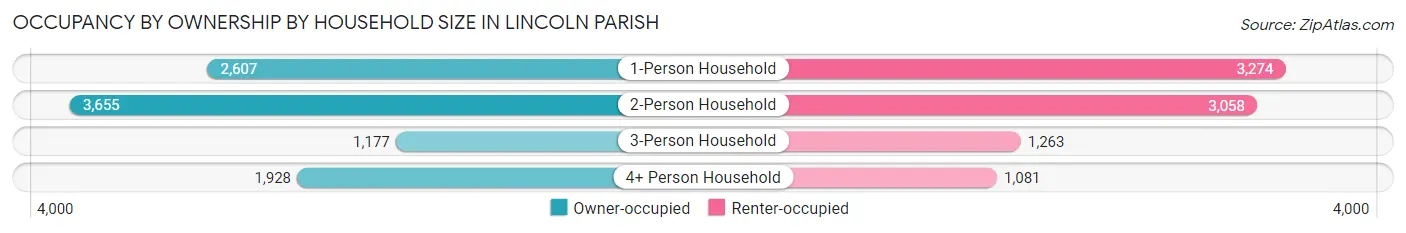
| Household Size | Owner-occupied | Renter-occupied |
| 1-Person Household | 2,607 (44.3%) | 3,274 (55.7%) |
| 2-Person Household | 3,655 (54.4%) | 3,058 (45.6%) |
| 3-Person Household | 1,177 (48.2%) | 1,263 (51.8%) |
| 4+ Person Household | 1,928 (64.1%) | 1,081 (35.9%) |
| Total Housing Units | 9,367 (51.9%) | 8,676 (48.1%) |
Occupancy by Educational Attainment in Lincoln Parish
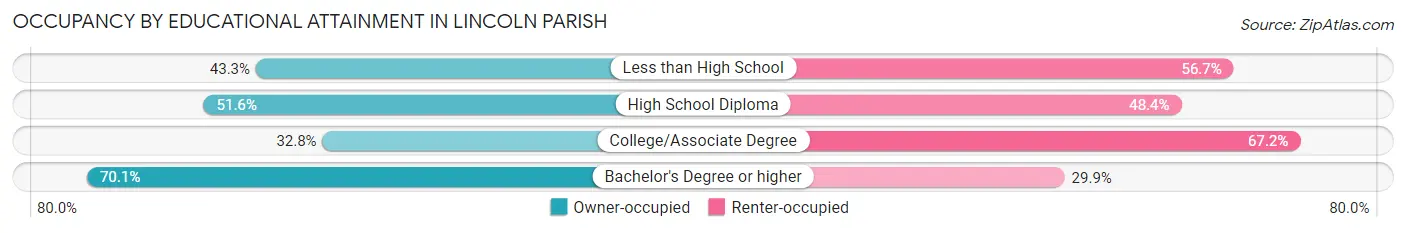
| Household Size | Owner-occupied | Renter-occupied |
| Less than High School | 688 (43.3%) | 900 (56.7%) |
| High School Diploma | 2,621 (51.6%) | 2,458 (48.4%) |
| College/Associate Degree | 1,681 (32.8%) | 3,451 (67.2%) |
| Bachelor's Degree or higher | 4,377 (70.1%) | 1,867 (29.9%) |
Occupancy by Age of Householder in Lincoln Parish
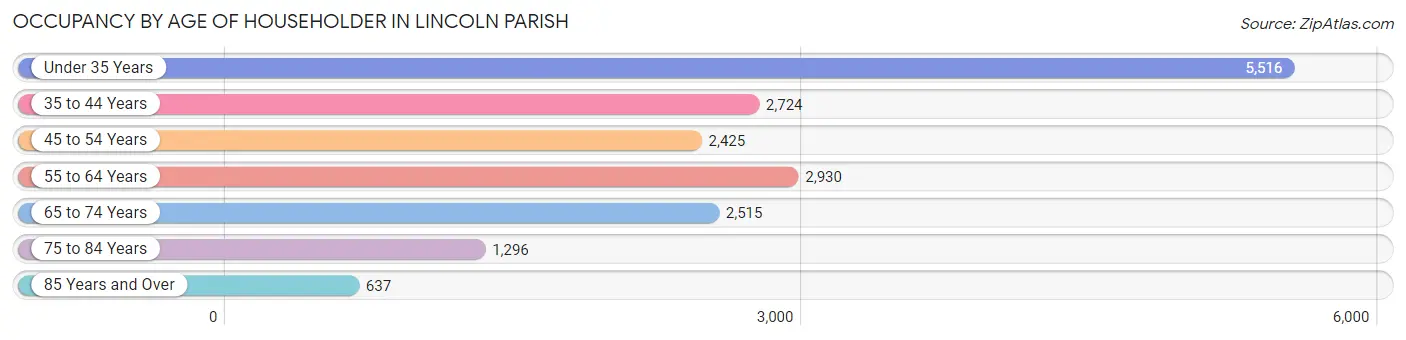
| Age Bracket | # Households | % Households |
| Under 35 Years | 5,516 | 30.6% |
| 35 to 44 Years | 2,724 | 15.1% |
| 45 to 54 Years | 2,425 | 13.4% |
| 55 to 64 Years | 2,930 | 16.2% |
| 65 to 74 Years | 2,515 | 13.9% |
| 75 to 84 Years | 1,296 | 7.2% |
| 85 Years and Over | 637 | 3.5% |
| Total | 18,043 | 100.0% |
Housing Finances in Lincoln Parish
Median Income by Occupancy in Lincoln Parish
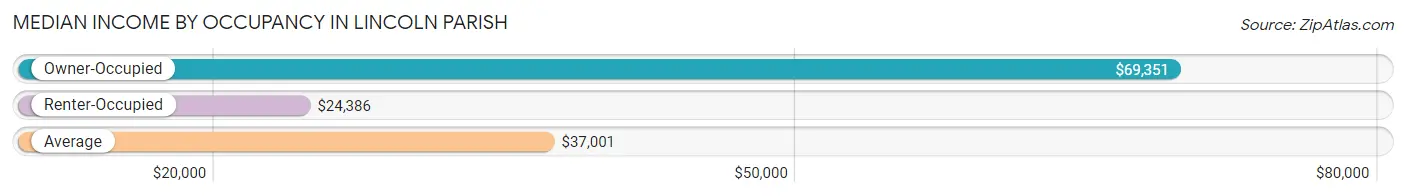
| Occupancy Type | # Households | Median Income |
| Owner-Occupied | 9,367 (51.9%) | $69,351 |
| Renter-Occupied | 8,676 (48.1%) | $24,386 |
| Average | 18,043 (100.0%) | $37,001 |
Occupancy by Householder Income Bracket in Lincoln Parish
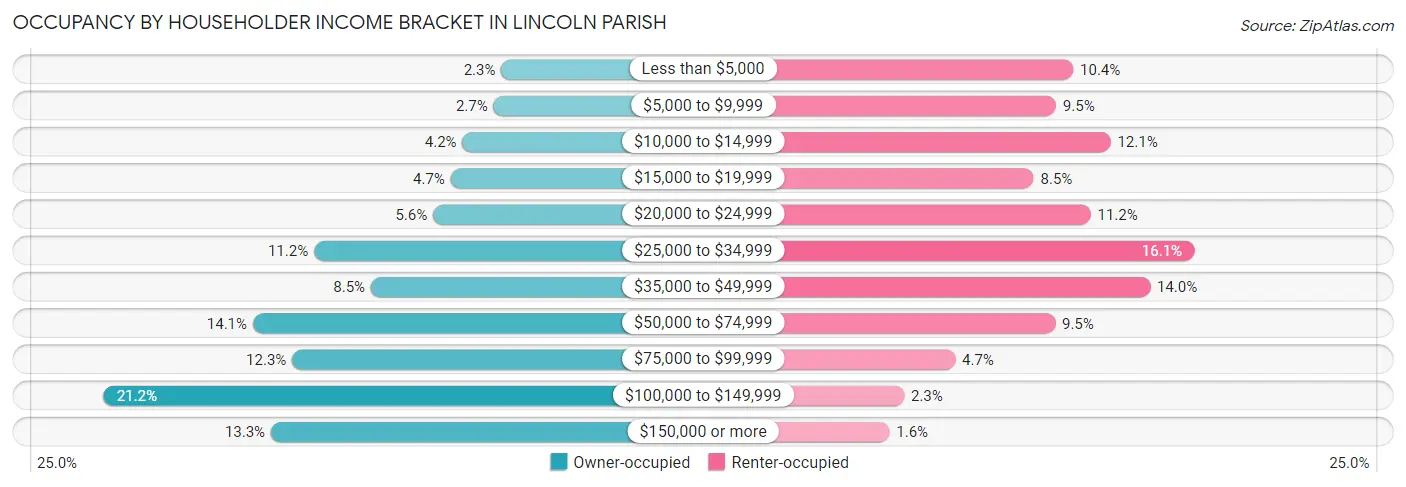
| Income Bracket | Owner-occupied | Renter-occupied |
| Less than $5,000 | 215 (2.3%) | 899 (10.4%) |
| $5,000 to $9,999 | 250 (2.7%) | 828 (9.5%) |
| $10,000 to $14,999 | 389 (4.2%) | 1,053 (12.1%) |
| $15,000 to $19,999 | 441 (4.7%) | 736 (8.5%) |
| $20,000 to $24,999 | 520 (5.6%) | 971 (11.2%) |
| $25,000 to $34,999 | 1,051 (11.2%) | 1,398 (16.1%) |
| $35,000 to $49,999 | 797 (8.5%) | 1,216 (14.0%) |
| $50,000 to $74,999 | 1,324 (14.1%) | 824 (9.5%) |
| $75,000 to $99,999 | 1,148 (12.3%) | 411 (4.7%) |
| $100,000 to $149,999 | 1,989 (21.2%) | 200 (2.3%) |
| $150,000 or more | 1,243 (13.3%) | 140 (1.6%) |
| Total | 9,367 (100.0%) | 8,676 (100.0%) |
Monthly Housing Cost Tiers in Lincoln Parish
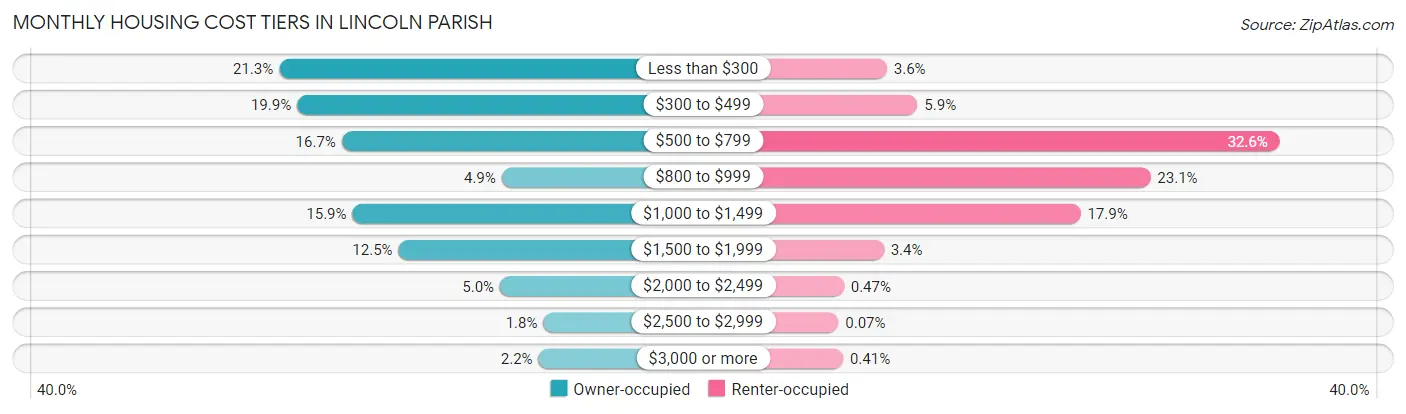
| Monthly Cost | Owner-occupied | Renter-occupied |
| Less than $300 | 1,991 (21.3%) | 316 (3.6%) |
| $300 to $499 | 1,868 (19.9%) | 511 (5.9%) |
| $500 to $799 | 1,560 (16.7%) | 2,826 (32.6%) |
| $800 to $999 | 456 (4.9%) | 2,000 (23.1%) |
| $1,000 to $1,499 | 1,486 (15.9%) | 1,553 (17.9%) |
| $1,500 to $1,999 | 1,168 (12.5%) | 296 (3.4%) |
| $2,000 to $2,499 | 467 (5.0%) | 41 (0.5%) |
| $2,500 to $2,999 | 169 (1.8%) | 6 (0.1%) |
| $3,000 or more | 202 (2.2%) | 36 (0.4%) |
| Total | 9,367 (100.0%) | 8,676 (100.0%) |
Physical Housing Characteristics in Lincoln Parish
Housing Structures in Lincoln Parish
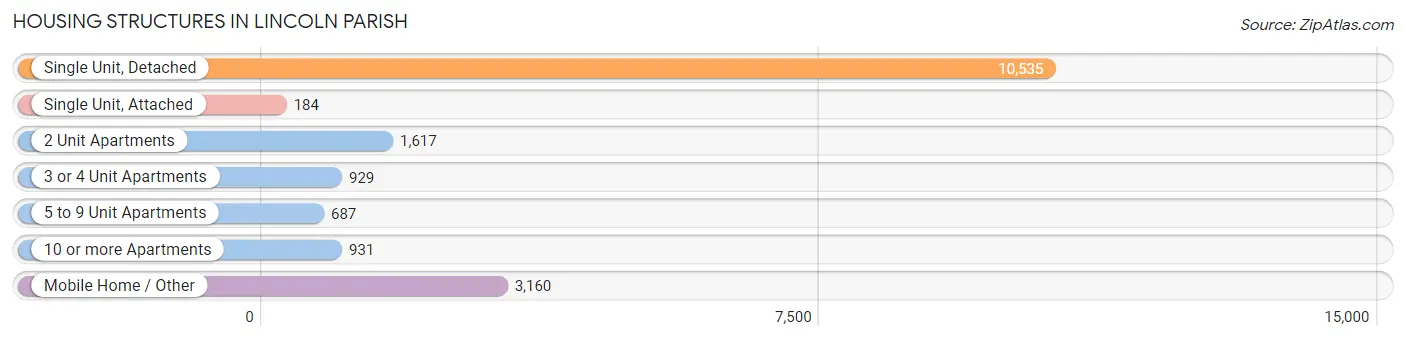
| Structure Type | # Housing Units | % Housing Units |
| Single Unit, Detached | 10,535 | 58.4% |
| Single Unit, Attached | 184 | 1.0% |
| 2 Unit Apartments | 1,617 | 9.0% |
| 3 or 4 Unit Apartments | 929 | 5.1% |
| 5 to 9 Unit Apartments | 687 | 3.8% |
| 10 or more Apartments | 931 | 5.2% |
| Mobile Home / Other | 3,160 | 17.5% |
| Total | 18,043 | 100.0% |
Housing Structures by Occupancy in Lincoln Parish
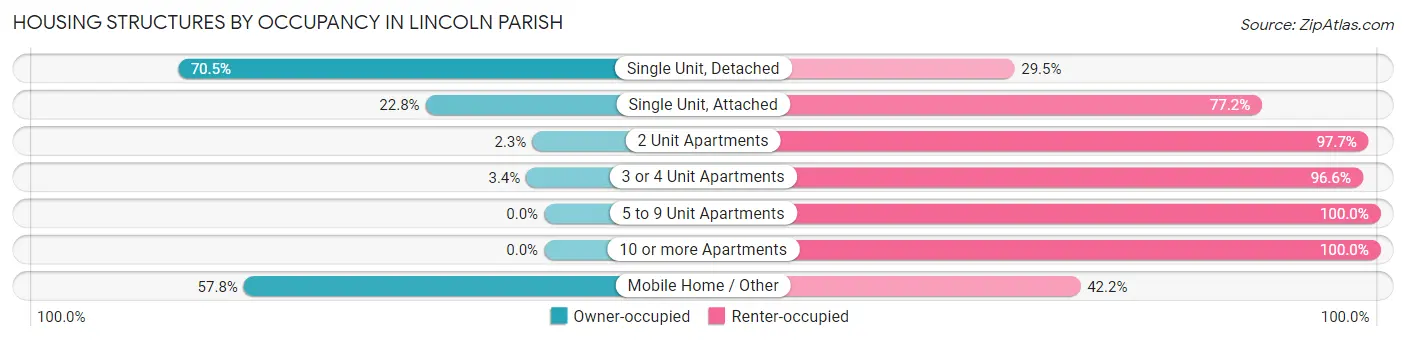
| Structure Type | Owner-occupied | Renter-occupied |
| Single Unit, Detached | 7,429 (70.5%) | 3,106 (29.5%) |
| Single Unit, Attached | 42 (22.8%) | 142 (77.2%) |
| 2 Unit Apartments | 37 (2.3%) | 1,580 (97.7%) |
| 3 or 4 Unit Apartments | 32 (3.4%) | 897 (96.6%) |
| 5 to 9 Unit Apartments | 0 (0.0%) | 687 (100.0%) |
| 10 or more Apartments | 0 (0.0%) | 931 (100.0%) |
| Mobile Home / Other | 1,827 (57.8%) | 1,333 (42.2%) |
| Total | 9,367 (51.9%) | 8,676 (48.1%) |
Housing Structures by Number of Rooms in Lincoln Parish
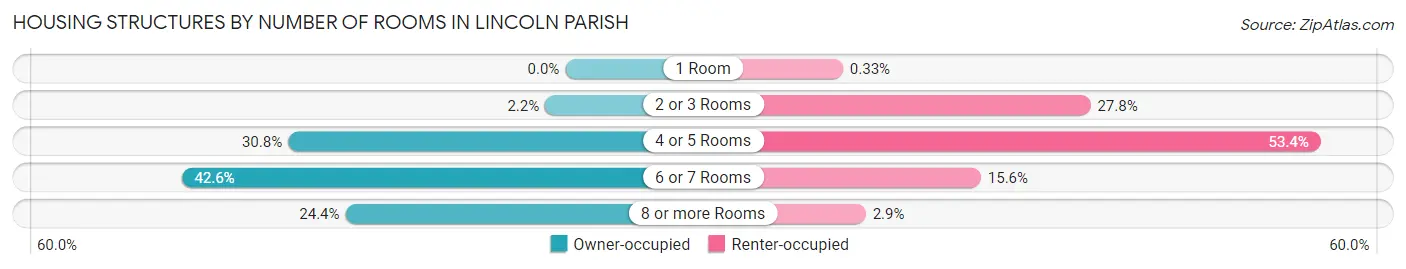
| Number of Rooms | Owner-occupied | Renter-occupied |
| 1 Room | 0 (0.0%) | 29 (0.3%) |
| 2 or 3 Rooms | 210 (2.2%) | 2,413 (27.8%) |
| 4 or 5 Rooms | 2,882 (30.8%) | 4,629 (53.3%) |
| 6 or 7 Rooms | 3,989 (42.6%) | 1,357 (15.6%) |
| 8 or more Rooms | 2,286 (24.4%) | 248 (2.9%) |
| Total | 9,367 (100.0%) | 8,676 (100.0%) |
Housing Structure by Heating Type in Lincoln Parish
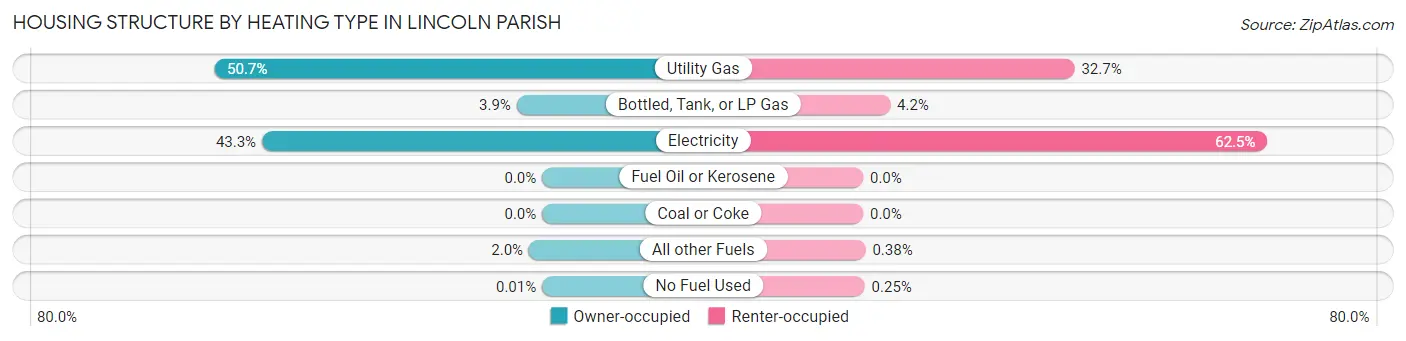
| Heating Type | Owner-occupied | Renter-occupied |
| Utility Gas | 4,750 (50.7%) | 2,836 (32.7%) |
| Bottled, Tank, or LP Gas | 368 (3.9%) | 363 (4.2%) |
| Electricity | 4,057 (43.3%) | 5,422 (62.5%) |
| Fuel Oil or Kerosene | 0 (0.0%) | 0 (0.0%) |
| Coal or Coke | 0 (0.0%) | 0 (0.0%) |
| All other Fuels | 191 (2.0%) | 33 (0.4%) |
| No Fuel Used | 1 (0.0%) | 22 (0.3%) |
| Total | 9,367 (100.0%) | 8,676 (100.0%) |
Household Vehicle Usage in Lincoln Parish
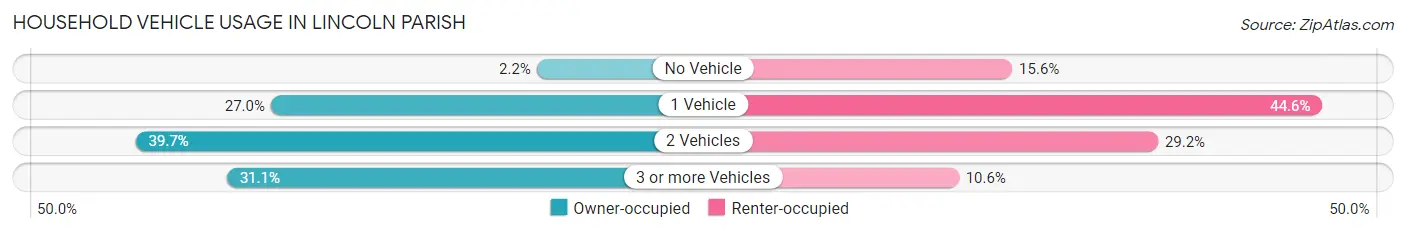
| Vehicles per Household | Owner-occupied | Renter-occupied |
| No Vehicle | 206 (2.2%) | 1,354 (15.6%) |
| 1 Vehicle | 2,531 (27.0%) | 3,866 (44.6%) |
| 2 Vehicles | 3,714 (39.7%) | 2,535 (29.2%) |
| 3 or more Vehicles | 2,916 (31.1%) | 921 (10.6%) |
| Total | 9,367 (100.0%) | 8,676 (100.0%) |
Real Estate & Mortgages in Lincoln Parish
Real Estate and Mortgage Overview in Lincoln Parish
| Characteristic | Without Mortgage | With Mortgage |
| Housing Units | 5,161 | 4,206 |
| Median Property Value | $139,900 | $240,700 |
| Median Household Income | $46,390 | $804 |
| Monthly Housing Costs | $344 | $193 |
| Real Estate Taxes | $557 | $514 |
Property Value by Mortgage Status in Lincoln Parish
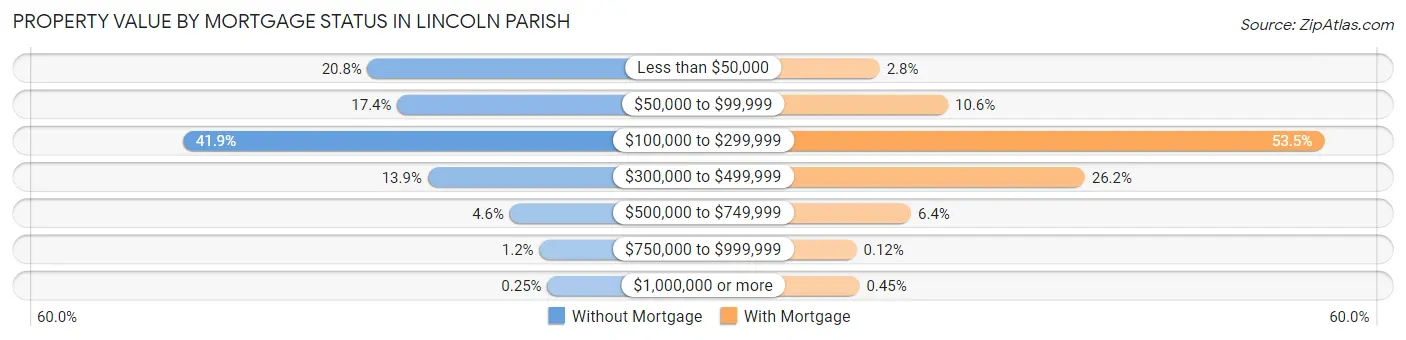
| Property Value | Without Mortgage | With Mortgage |
| Less than $50,000 | 1,073 (20.8%) | 116 (2.8%) |
| $50,000 to $99,999 | 898 (17.4%) | 445 (10.6%) |
| $100,000 to $299,999 | 2,163 (41.9%) | 2,252 (53.5%) |
| $300,000 to $499,999 | 719 (13.9%) | 1,102 (26.2%) |
| $500,000 to $749,999 | 235 (4.5%) | 267 (6.4%) |
| $750,000 to $999,999 | 60 (1.2%) | 5 (0.1%) |
| $1,000,000 or more | 13 (0.3%) | 19 (0.4%) |
| Total | 5,161 (100.0%) | 4,206 (100.0%) |
Household Income by Mortgage Status in Lincoln Parish
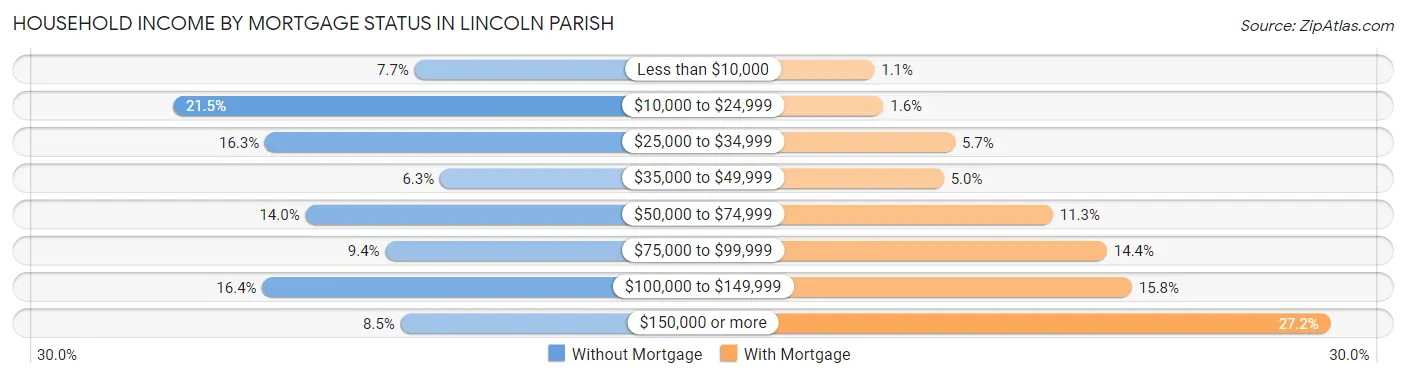
| Household Income | Without Mortgage | With Mortgage |
| Less than $10,000 | 398 (7.7%) | 45 (1.1%) |
| $10,000 to $24,999 | 1,111 (21.5%) | 67 (1.6%) |
| $25,000 to $34,999 | 839 (16.3%) | 239 (5.7%) |
| $35,000 to $49,999 | 323 (6.3%) | 212 (5.0%) |
| $50,000 to $74,999 | 720 (14.0%) | 474 (11.3%) |
| $75,000 to $99,999 | 484 (9.4%) | 604 (14.4%) |
| $100,000 to $149,999 | 847 (16.4%) | 664 (15.8%) |
| $150,000 or more | 439 (8.5%) | 1,142 (27.2%) |
| Total | 5,161 (100.0%) | 4,206 (100.0%) |
Property Value to Household Income Ratio in Lincoln Parish
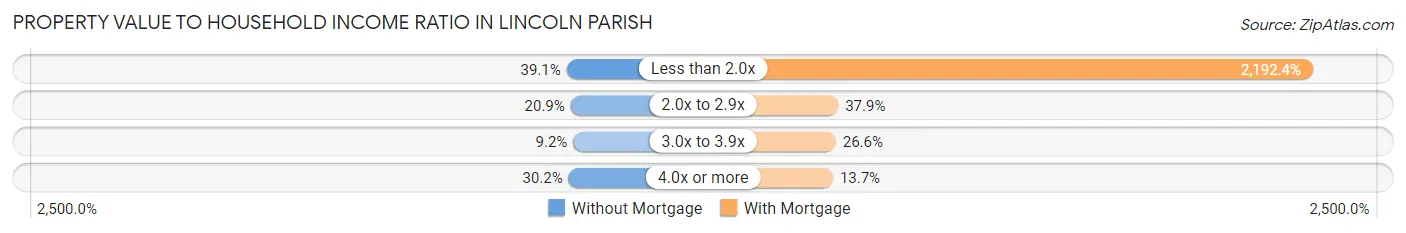
| Value-to-Income Ratio | Without Mortgage | With Mortgage |
| Less than 2.0x | 2,017 (39.1%) | 92,213 (2,192.4%) |
| 2.0x to 2.9x | 1,079 (20.9%) | 1,592 (37.9%) |
| 3.0x to 3.9x | 472 (9.1%) | 1,118 (26.6%) |
| 4.0x or more | 1,557 (30.2%) | 575 (13.7%) |
| Total | 5,161 (100.0%) | 4,206 (100.0%) |
Real Estate Taxes by Mortgage Status in Lincoln Parish
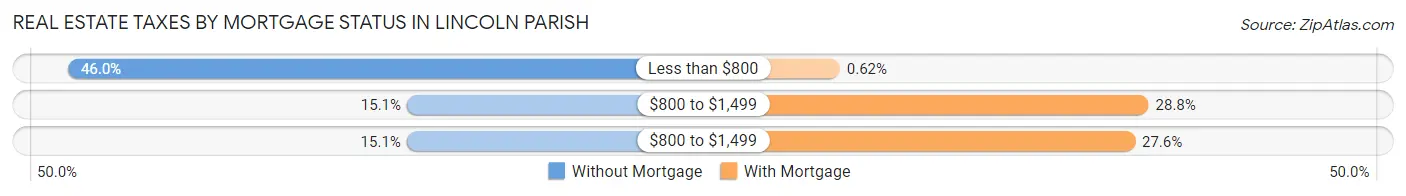
| Property Taxes | Without Mortgage | With Mortgage |
| Less than $800 | 2,376 (46.0%) | 26 (0.6%) |
| $800 to $1,499 | 779 (15.1%) | 1,212 (28.8%) |
| $800 to $1,499 | 780 (15.1%) | 1,160 (27.6%) |
| Total | 5,161 (100.0%) | 4,206 (100.0%) |
Health & Disability in Lincoln Parish
Health Insurance Coverage by Age in Lincoln Parish
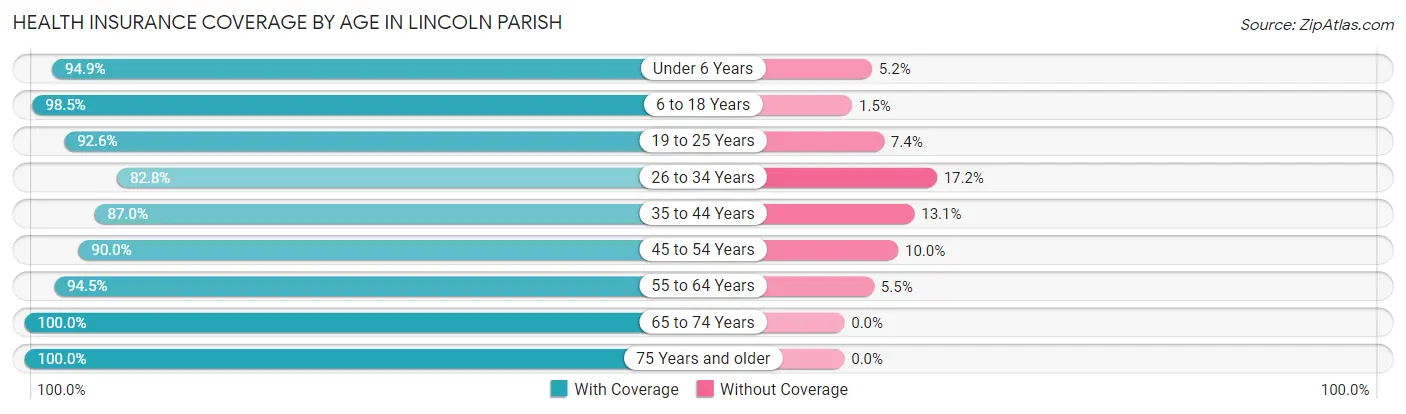
| Age Bracket | With Coverage | Without Coverage |
| Under 6 Years | 2,964 (94.9%) | 161 (5.1%) |
| 6 to 18 Years | 7,914 (98.5%) | 117 (1.5%) |
| 19 to 25 Years | 10,457 (92.6%) | 835 (7.4%) |
| 26 to 34 Years | 4,147 (82.8%) | 863 (17.2%) |
| 35 to 44 Years | 4,317 (87.0%) | 648 (13.1%) |
| 45 to 54 Years | 3,815 (90.0%) | 425 (10.0%) |
| 55 to 64 Years | 4,313 (94.5%) | 252 (5.5%) |
| 65 to 74 Years | 3,791 (100.0%) | 0 (0.0%) |
| 75 Years and older | 2,600 (100.0%) | 0 (0.0%) |
| Total | 44,318 (93.1%) | 3,301 (6.9%) |
Health Insurance Coverage by Citizenship Status in Lincoln Parish
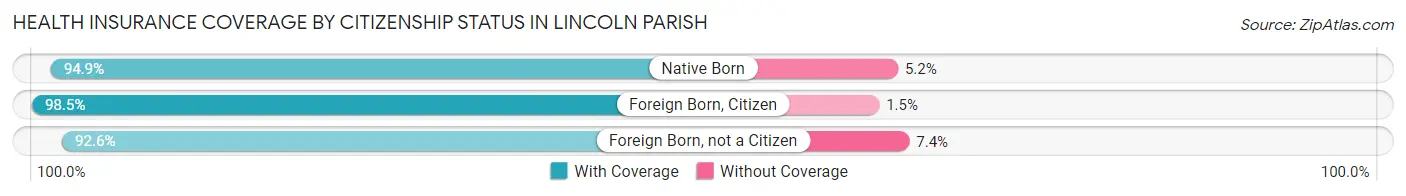
| Citizenship Status | With Coverage | Without Coverage |
| Native Born | 2,964 (94.9%) | 161 (5.1%) |
| Foreign Born, Citizen | 7,914 (98.5%) | 117 (1.5%) |
| Foreign Born, not a Citizen | 10,457 (92.6%) | 835 (7.4%) |
Health Insurance Coverage by Household Income in Lincoln Parish
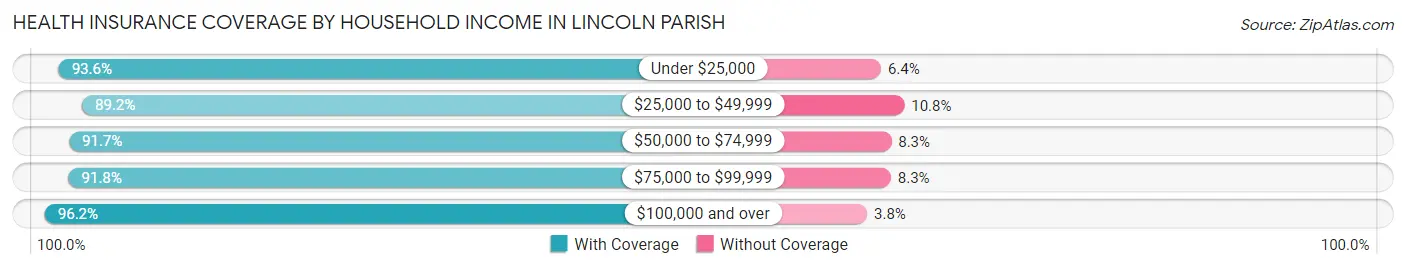
| Household Income | With Coverage | Without Coverage |
| Under $25,000 | 11,956 (93.6%) | 817 (6.4%) |
| $25,000 to $49,999 | 8,644 (89.2%) | 1,043 (10.8%) |
| $50,000 to $74,999 | 5,939 (91.7%) | 540 (8.3%) |
| $75,000 to $99,999 | 4,082 (91.7%) | 367 (8.3%) |
| $100,000 and over | 10,597 (96.2%) | 419 (3.8%) |
Public vs Private Health Insurance Coverage by Age in Lincoln Parish
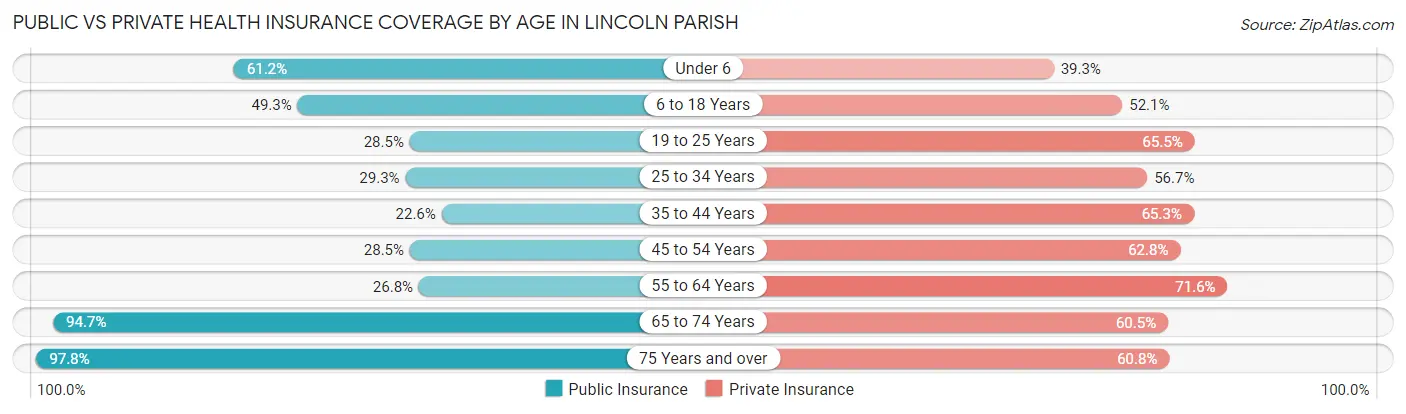
| Age Bracket | Public Insurance | Private Insurance |
| Under 6 | 1,911 (61.2%) | 1,229 (39.3%) |
| 6 to 18 Years | 3,962 (49.3%) | 4,181 (52.1%) |
| 19 to 25 Years | 3,219 (28.5%) | 7,395 (65.5%) |
| 25 to 34 Years | 1,469 (29.3%) | 2,840 (56.7%) |
| 35 to 44 Years | 1,122 (22.6%) | 3,243 (65.3%) |
| 45 to 54 Years | 1,208 (28.5%) | 2,663 (62.8%) |
| 55 to 64 Years | 1,224 (26.8%) | 3,267 (71.6%) |
| 65 to 74 Years | 3,591 (94.7%) | 2,295 (60.5%) |
| 75 Years and over | 2,543 (97.8%) | 1,580 (60.8%) |
| Total | 20,249 (42.5%) | 28,693 (60.3%) |
Disability Status by Sex by Age in Lincoln Parish
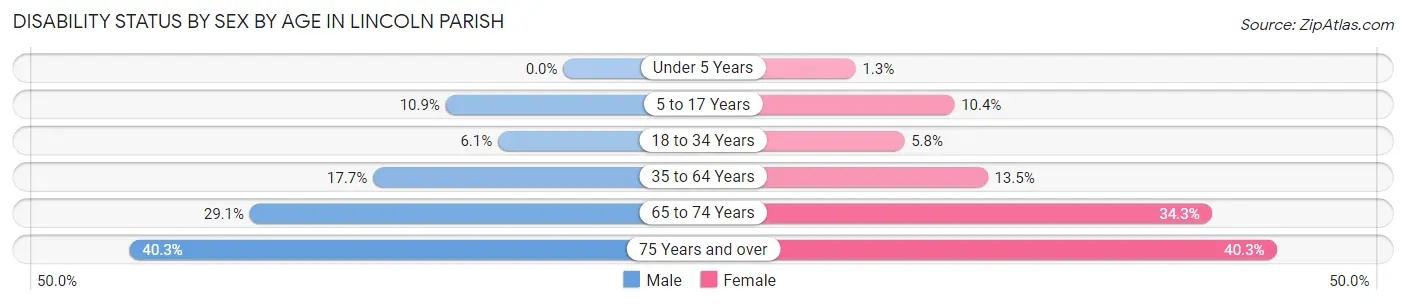
| Age Bracket | Male | Female |
| Under 5 Years | 0 (0.0%) | 15 (1.3%) |
| 5 to 17 Years | 393 (10.9%) | 344 (10.4%) |
| 18 to 34 Years | 545 (6.1%) | 523 (5.8%) |
| 35 to 64 Years | 1,157 (17.7%) | 976 (13.5%) |
| 65 to 74 Years | 518 (29.1%) | 690 (34.3%) |
| 75 Years and over | 416 (40.3%) | 632 (40.3%) |
Disability Class by Sex by Age in Lincoln Parish
Disability Class: Hearing Difficulty
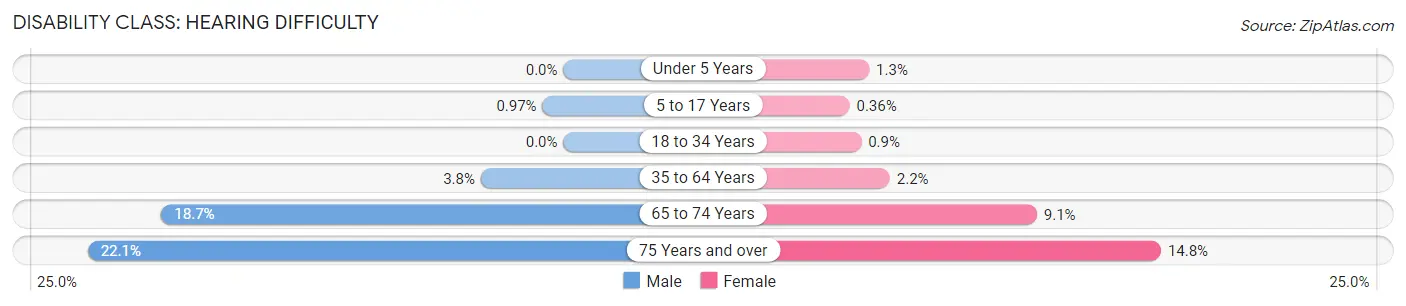
| Age Bracket | Male | Female |
| Under 5 Years | 0 (0.0%) | 15 (1.3%) |
| 5 to 17 Years | 35 (1.0%) | 12 (0.4%) |
| 18 to 34 Years | 0 (0.0%) | 81 (0.9%) |
| 35 to 64 Years | 251 (3.8%) | 161 (2.2%) |
| 65 to 74 Years | 332 (18.6%) | 182 (9.0%) |
| 75 Years and over | 228 (22.1%) | 232 (14.8%) |
Disability Class: Vision Difficulty
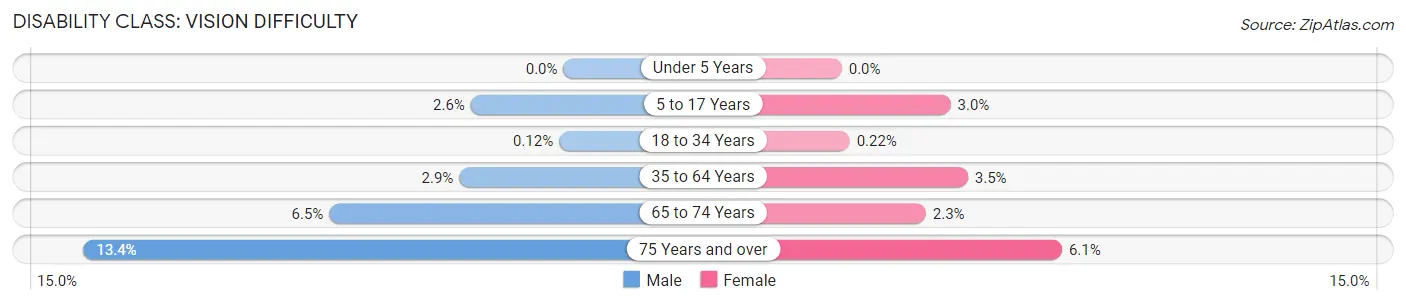
| Age Bracket | Male | Female |
| Under 5 Years | 0 (0.0%) | 0 (0.0%) |
| 5 to 17 Years | 93 (2.6%) | 100 (3.0%) |
| 18 to 34 Years | 11 (0.1%) | 20 (0.2%) |
| 35 to 64 Years | 190 (2.9%) | 253 (3.5%) |
| 65 to 74 Years | 116 (6.5%) | 47 (2.3%) |
| 75 Years and over | 138 (13.4%) | 96 (6.1%) |
Disability Class: Cognitive Difficulty
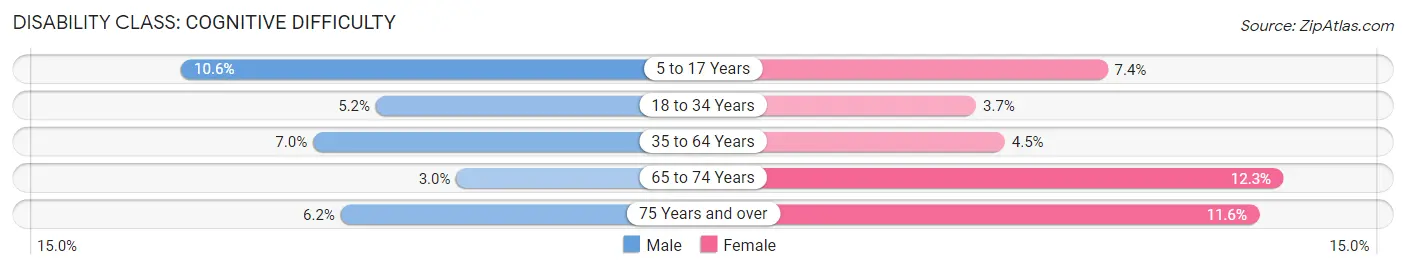
| Age Bracket | Male | Female |
| 5 to 17 Years | 383 (10.6%) | 244 (7.4%) |
| 18 to 34 Years | 469 (5.2%) | 338 (3.7%) |
| 35 to 64 Years | 457 (7.0%) | 328 (4.5%) |
| 65 to 74 Years | 53 (3.0%) | 247 (12.3%) |
| 75 Years and over | 64 (6.2%) | 182 (11.6%) |
Disability Class: Ambulatory Difficulty
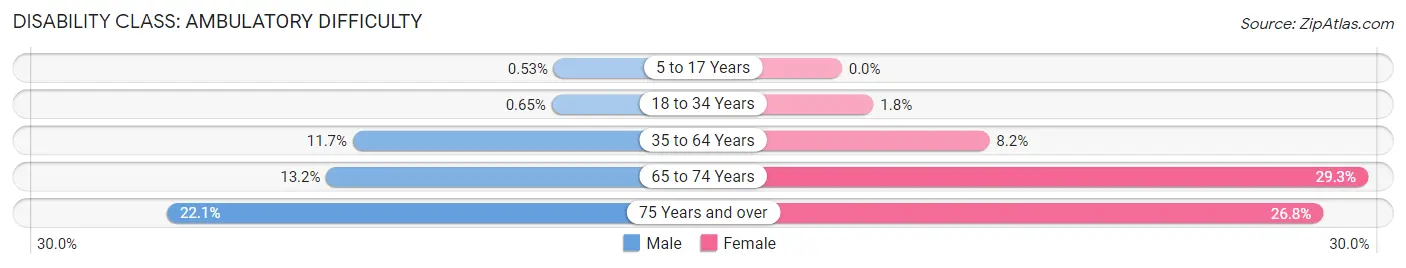
| Age Bracket | Male | Female |
| 5 to 17 Years | 19 (0.5%) | 0 (0.0%) |
| 18 to 34 Years | 58 (0.6%) | 159 (1.8%) |
| 35 to 64 Years | 768 (11.7%) | 593 (8.2%) |
| 65 to 74 Years | 235 (13.2%) | 589 (29.3%) |
| 75 Years and over | 228 (22.1%) | 420 (26.8%) |
Disability Class: Self-Care Difficulty
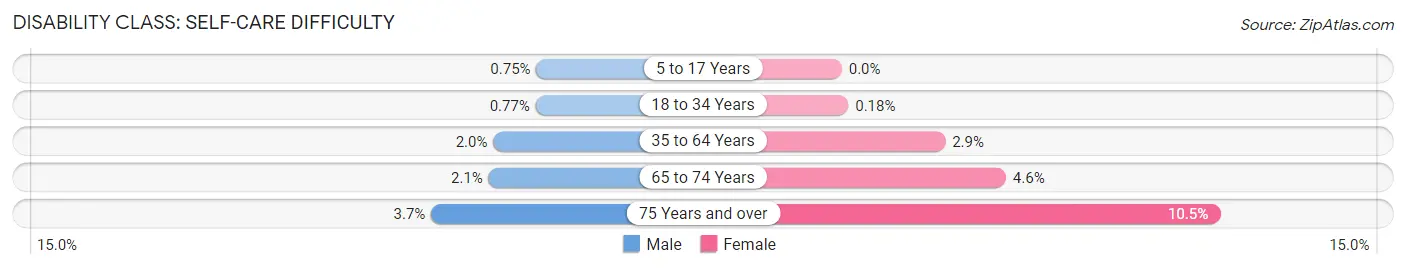
| Age Bracket | Male | Female |
| 5 to 17 Years | 27 (0.7%) | 0 (0.0%) |
| 18 to 34 Years | 69 (0.8%) | 16 (0.2%) |
| 35 to 64 Years | 128 (1.9%) | 208 (2.9%) |
| 65 to 74 Years | 37 (2.1%) | 92 (4.6%) |
| 75 Years and over | 38 (3.7%) | 165 (10.5%) |
Technology Access in Lincoln Parish
Computing Device Access in Lincoln Parish
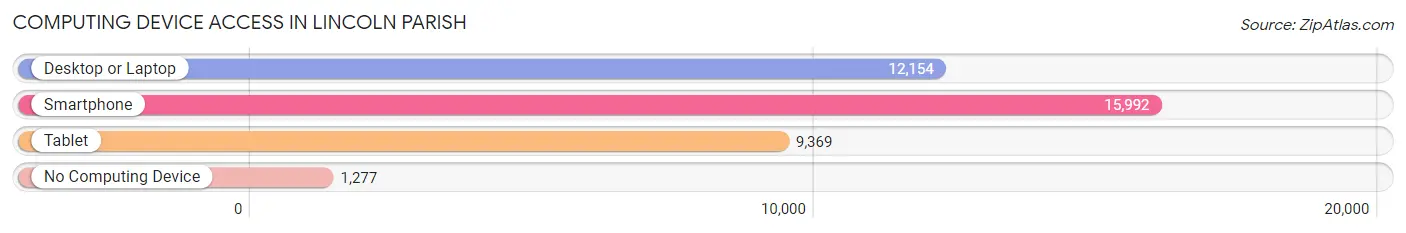
| Device Type | # Households | % Households |
| Desktop or Laptop | 12,154 | 67.4% |
| Smartphone | 15,992 | 88.6% |
| Tablet | 9,369 | 51.9% |
| No Computing Device | 1,277 | 7.1% |
| Total | 18,043 | 100.0% |
Internet Access in Lincoln Parish
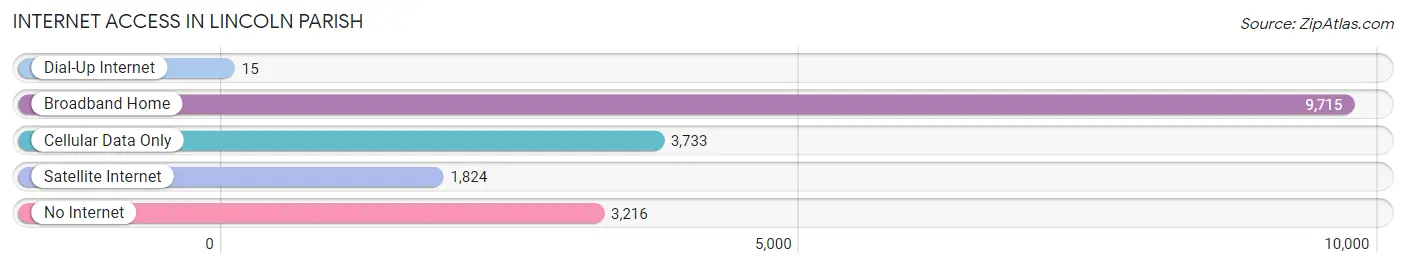
| Internet Type | # Households | % Households |
| Dial-Up Internet | 15 | 0.1% |
| Broadband Home | 9,715 | 53.8% |
| Cellular Data Only | 3,733 | 20.7% |
| Satellite Internet | 1,824 | 10.1% |
| No Internet | 3,216 | 17.8% |
| Total | 18,043 | 100.0% |
Lincoln Parish Summary
Lincoln Parish is a parish located in the northern part of the U.S. state of Louisiana. It is part of the Ruston, LA Metropolitan Statistical Area. As of the 2010 census, the population was 46,735. The parish seat is Ruston.
History
Lincoln Parish was created in 1873 from parts of Bienville, Claiborne, Union, and Jackson parishes. It was named for the late President Abraham Lincoln.
Geography
Lincoln Parish is located in the northern part of Louisiana. It is bordered by Bienville Parish to the north, Jackson Parish to the east, Union Parish to the south, and Claiborne Parish to the west. The parish covers an area of 576 square miles.
The parish is mostly rural, with the majority of the land being used for farming and timber production. The parish is home to several small towns, including Ruston, Grambling, Choudrant, and Simsboro.
The parish is home to several bodies of water, including Lake D'Arbonne, Lake Claiborne, and Lake Bistineau.
Economy
Lincoln Parish is home to several industries, including manufacturing, agriculture, and timber production. The parish is also home to Louisiana Tech University, which is located in Ruston.
The largest employers in the parish are Louisiana Tech University, Ruston Regional Medical Center, and the Lincoln Parish School Board.
Demographics
As of the 2010 census, the population of Lincoln Parish was 46,735. The racial makeup of the parish was 70.3% White, 24.3% African American, 0.3% Native American, 1.7% Asian, 0.1% Pacific Islander, 1.2% from other races, and 2.2% from two or more races. Hispanic or Latino of any race were 3.3% of the population.
The median income for a household in the parish was $37,945, and the median income for a family was $45,919. The per capita income for the parish was $19,945. About 15.2% of families and 20.2% of the population were below the poverty line, including 28.2% of those under age 18 and 11.2% of those age 65 or over.
Common Questions
What is the Total Population of Lincoln Parish?
Total Population of Lincoln Parish is 48,323.
What is the Total Male Population of Lincoln Parish?
Total Male Population of Lincoln Parish is 23,783.
What is the Total Female Population of Lincoln Parish?
Total Female Population of Lincoln Parish is 24,540.
What is the Ratio of Males per 100 Females in Lincoln Parish?
There are 96.92 Males per 100 Females in Lincoln Parish.
What is the Ratio of Females per 100 Males in Lincoln Parish?
There are 103.18 Females per 100 Males in Lincoln Parish.
What is the Median Population Age in Lincoln Parish?
Median Population Age in Lincoln Parish is 28.3 Years.
What is the Average Family Size in Lincoln Parish
Average Family Size in Lincoln Parish is 3.2 People.
What is the Average Household Size in Lincoln Parish
Average Household Size in Lincoln Parish is 2.5 People.
What is Per Capita Income in Lincoln Parish?
Per Capita income in Lincoln Parish is $24,411.
What is the Median Family Income in Lincoln Parish?
Median Family Income in Lincoln Parish is $58,542.
What is the Median Household income in Lincoln Parish?
Median Household Income in Lincoln Parish is $37,001.
What is Income or Wage Gap in Lincoln Parish?
Income or Wage Gap in Lincoln Parish is 27.7%.
Women in Lincoln Parish earn 72.3 cents for every dollar earned by a man.
What is Family Income Deficit in Lincoln Parish?
Family Income Deficit in Lincoln Parish is $11,363.
Families that are below poverty line in Lincoln Parish earn $11,363 less on average than the poverty threshold level.
What is Inequality or Gini Index in Lincoln Parish?
Inequality or Gini Index in Lincoln Parish is 0.52.
How Large is the Labor Force in Lincoln Parish?
There are 22,150 People in the Labor Forcein in Lincoln Parish.
What is the Percentage of People in the Labor Force in Lincoln Parish?
55.4% of People are in the Labor Force in Lincoln Parish.
What is the Unemployment Rate in Lincoln Parish?
Unemployment Rate in Lincoln Parish is 4.2%.