LaSalle Parish, LA
LaSalle Parish Map
LaSalle Parish Overview
14,764
TOTAL POPULATION
7,999
MALE POPULATION
6,765
FEMALE POPULATION
118.24
MALES / 100 FEMALES
84.57
FEMALES / 100 MALES
38.3
MEDIAN AGE
3.4
AVG FAMILY SIZE
2.9
AVG HOUSEHOLD SIZE
$29,769
PER CAPITA INCOME
$74,525
AVG FAMILY INCOME
$59,926
AVG HOUSEHOLD INCOME
47.6%
WAGE / INCOME GAP [ % ]
52.4¢/ $1
WAGE / INCOME GAP [ $ ]
0.45
INEQUALITY / GINI INDEX
6,723
LABOR FORCE [ PEOPLE ]
55.8%
PERCENT IN LABOR FORCE
4.6%
UNEMPLOYMENT RATE
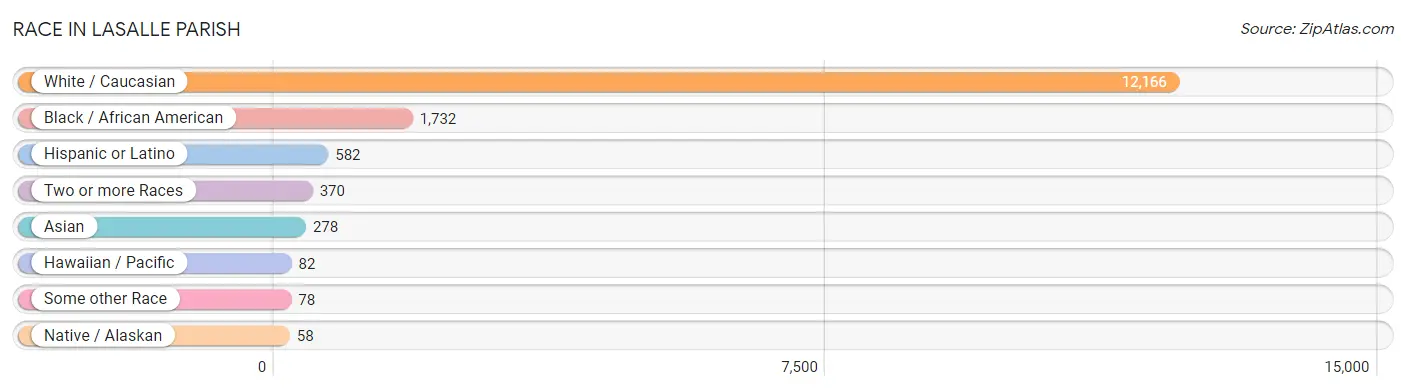
Race in LaSalle Parish
The most populous races in LaSalle Parish are White / Caucasian (12,166 | 82.4%), Black / African American (1,732 | 11.7%), and Hispanic or Latino (582 | 3.9%).
| Race | # Population | % Population |
| Asian | 278 | 1.9% |
| Black / African American | 1,732 | 11.7% |
| Hawaiian / Pacific | 82 | 0.6% |
| Hispanic or Latino | 582 | 3.9% |
| Native / Alaskan | 58 | 0.4% |
| White / Caucasian | 12,166 | 82.4% |
| Two or more Races | 370 | 2.5% |
| Some other Race | 78 | 0.5% |
| Total | 14,764 | 100.0% |
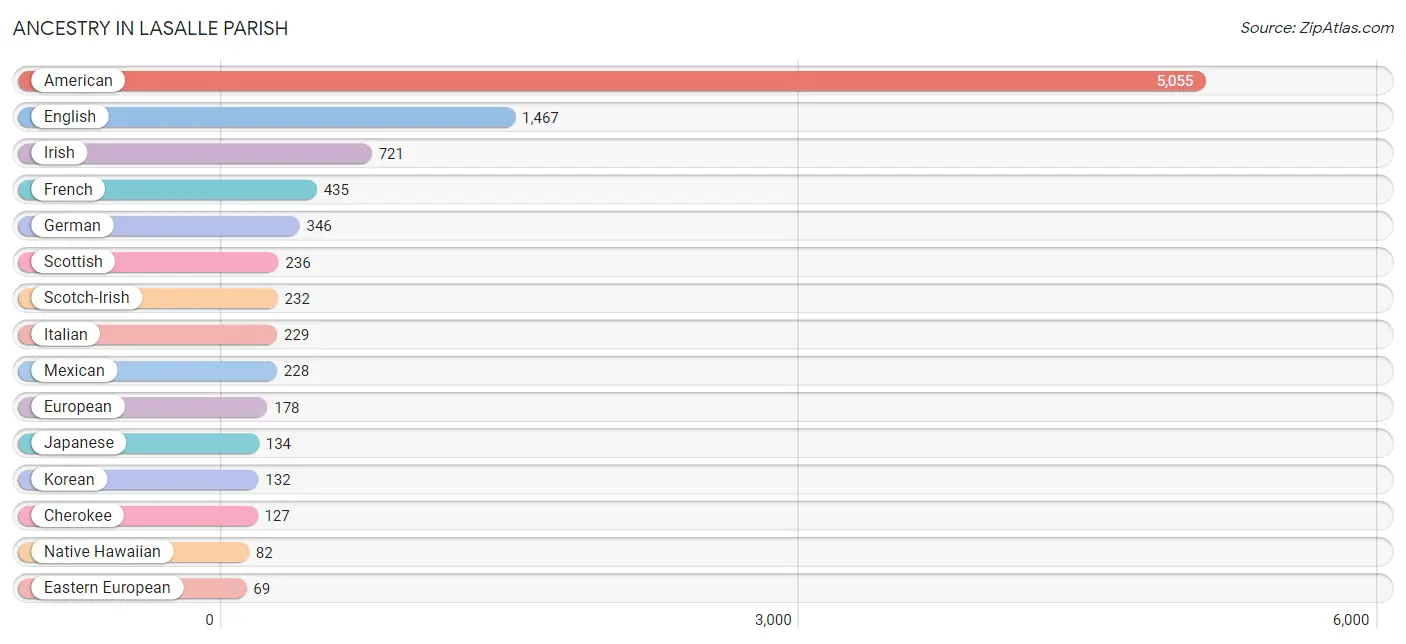
Ancestry in LaSalle Parish
The most populous ancestries reported in LaSalle Parish are American (5,055 | 34.2%), English (1,467 | 9.9%), Irish (721 | 4.9%), French (435 | 2.9%), and German (346 | 2.3%), together accounting for 54.3% of all LaSalle Parish residents.
| Ancestry | # Population | % Population |
| American | 5,055 | 34.2% |
| Arab | 11 | 0.1% |
| Austrian | 10 | 0.1% |
| Belgian | 3 | 0.0% |
| British | 16 | 0.1% |
| Cajun | 41 | 0.3% |
| Canadian | 2 | 0.0% |
| Central American | 48 | 0.3% |
| Cherokee | 127 | 0.9% |
| Choctaw | 42 | 0.3% |
| Comanche | 17 | 0.1% |
| Cuban | 17 | 0.1% |
| Danish | 11 | 0.1% |
| Dutch | 19 | 0.1% |
| Eastern European | 69 | 0.5% |
| English | 1,467 | 9.9% |
| European | 178 | 1.2% |
| French | 435 | 2.9% |
| French Canadian | 19 | 0.1% |
| German | 346 | 2.3% |
| Greek | 13 | 0.1% |
| Guatemalan | 5 | 0.0% |
| Honduran | 13 | 0.1% |
| Houma | 10 | 0.1% |
| Iraqi | 6 | 0.0% |
| Irish | 721 | 4.9% |
| Italian | 229 | 1.5% |
| Japanese | 134 | 0.9% |
| Korean | 132 | 0.9% |
| Mexican | 228 | 1.5% |
| Native Hawaiian | 82 | 0.6% |
| Nicaraguan | 11 | 0.1% |
| Norwegian | 18 | 0.1% |
| Polish | 18 | 0.1% |
| Portuguese | 14 | 0.1% |
| Puerto Rican | 29 | 0.2% |
| Salvadoran | 19 | 0.1% |
| Scandinavian | 8 | 0.1% |
| Scotch-Irish | 232 | 1.6% |
| Scottish | 236 | 1.6% |
| Sioux | 3 | 0.0% |
| South American | 2 | 0.0% |
| Spanish | 22 | 0.2% |
| Swiss | 9 | 0.1% |
| Thai | 10 | 0.1% |
| Venezuelan | 2 | 0.0% |
| Welsh | 10 | 0.1% |
| West Indian | 3 | 0.0% | View All 48 Rows |
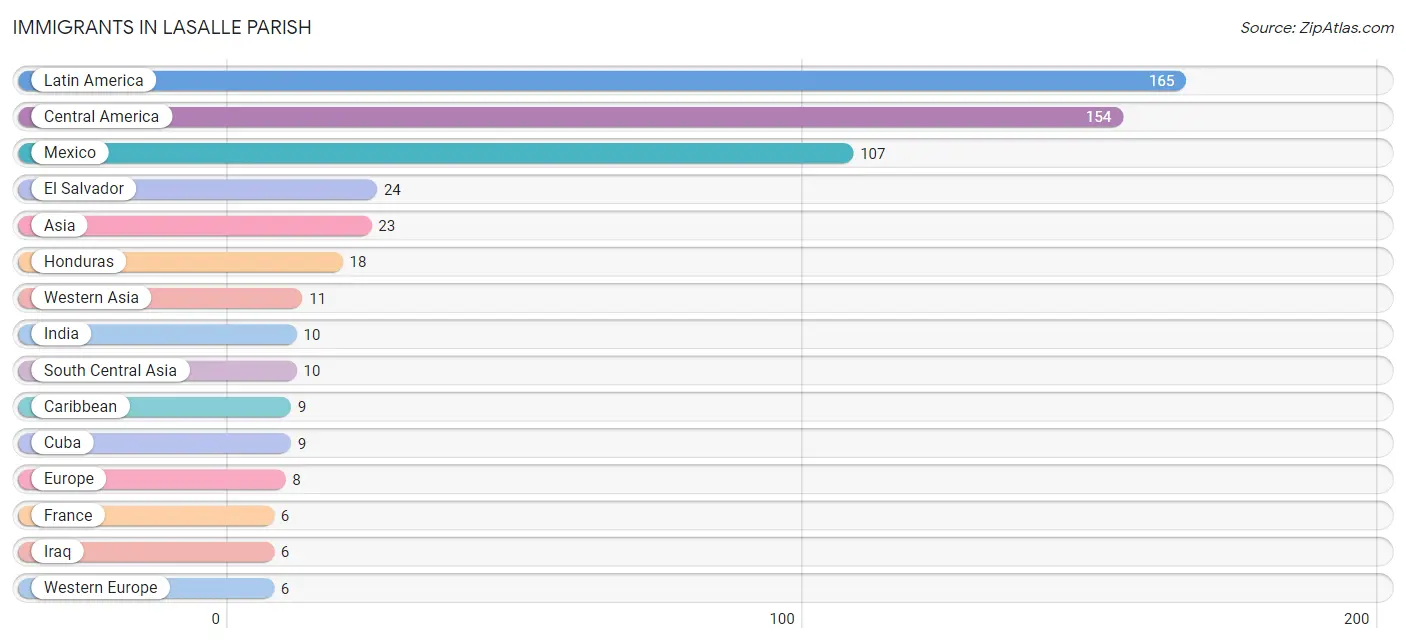
Immigrants in LaSalle Parish
The most numerous immigrant groups reported in LaSalle Parish came from Latin America (165 | 1.1%), Central America (154 | 1.0%), Mexico (107 | 0.7%), El Salvador (24 | 0.2%), and Asia (23 | 0.2%), together accounting for 3.2% of all LaSalle Parish residents.
| Immigration Origin | # Population | % Population |
| Asia | 23 | 0.2% |
| Caribbean | 9 | 0.1% |
| Central America | 154 | 1.0% |
| China | 2 | 0.0% |
| Cuba | 9 | 0.1% |
| Eastern Asia | 2 | 0.0% |
| Eastern Europe | 2 | 0.0% |
| El Salvador | 24 | 0.2% |
| Europe | 8 | 0.1% |
| France | 6 | 0.0% |
| Guatemala | 5 | 0.0% |
| Honduras | 18 | 0.1% |
| India | 10 | 0.1% |
| Iraq | 6 | 0.0% |
| Latin America | 165 | 1.1% |
| Mexico | 107 | 0.7% |
| Romania | 2 | 0.0% |
| South America | 2 | 0.0% |
| South Central Asia | 10 | 0.1% |
| Venezuela | 2 | 0.0% |
| Western Asia | 11 | 0.1% |
| Western Europe | 6 | 0.0% |
| Yemen | 5 | 0.0% | View All 23 Rows |
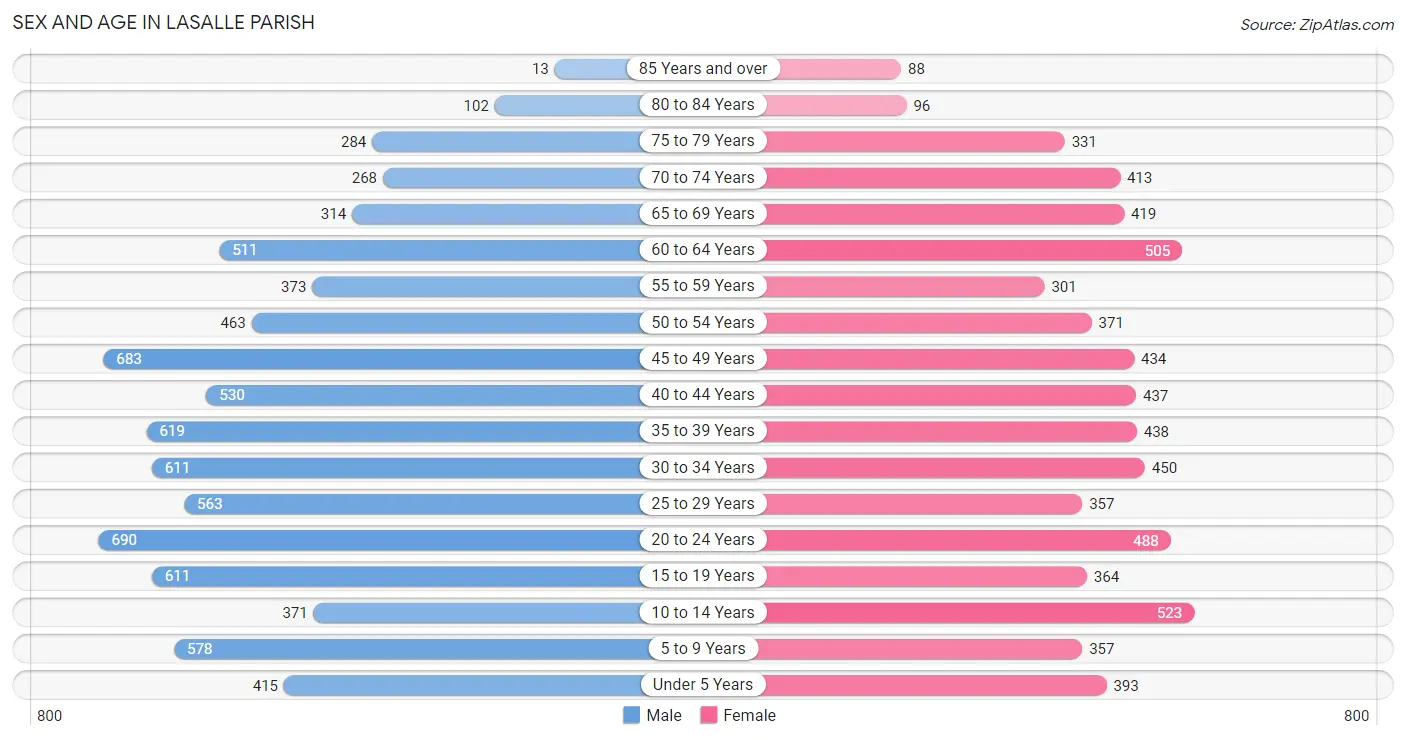
Sex and Age in LaSalle Parish
Sex and Age in LaSalle Parish
The most populous age groups in LaSalle Parish are 20 to 24 Years (690 | 8.6%) for men and 10 to 14 Years (523 | 7.7%) for women.
| Age Bracket | Male | Female |
| Under 5 Years | 415 (5.2%) | 393 (5.8%) |
| 5 to 9 Years | 578 (7.2%) | 357 (5.3%) |
| 10 to 14 Years | 371 (4.6%) | 523 (7.7%) |
| 15 to 19 Years | 611 (7.6%) | 364 (5.4%) |
| 20 to 24 Years | 690 (8.6%) | 488 (7.2%) |
| 25 to 29 Years | 563 (7.0%) | 357 (5.3%) |
| 30 to 34 Years | 611 (7.6%) | 450 (6.7%) |
| 35 to 39 Years | 619 (7.7%) | 438 (6.5%) |
| 40 to 44 Years | 530 (6.6%) | 437 (6.5%) |
| 45 to 49 Years | 683 (8.5%) | 434 (6.4%) |
| 50 to 54 Years | 463 (5.8%) | 371 (5.5%) |
| 55 to 59 Years | 373 (4.7%) | 301 (4.4%) |
| 60 to 64 Years | 511 (6.4%) | 505 (7.5%) |
| 65 to 69 Years | 314 (3.9%) | 419 (6.2%) |
| 70 to 74 Years | 268 (3.4%) | 413 (6.1%) |
| 75 to 79 Years | 284 (3.5%) | 331 (4.9%) |
| 80 to 84 Years | 102 (1.3%) | 96 (1.4%) |
| 85 Years and over | 13 (0.2%) | 88 (1.3%) |
| Total | 7,999 (100.0%) | 6,765 (100.0%) |
Families and Households in LaSalle Parish
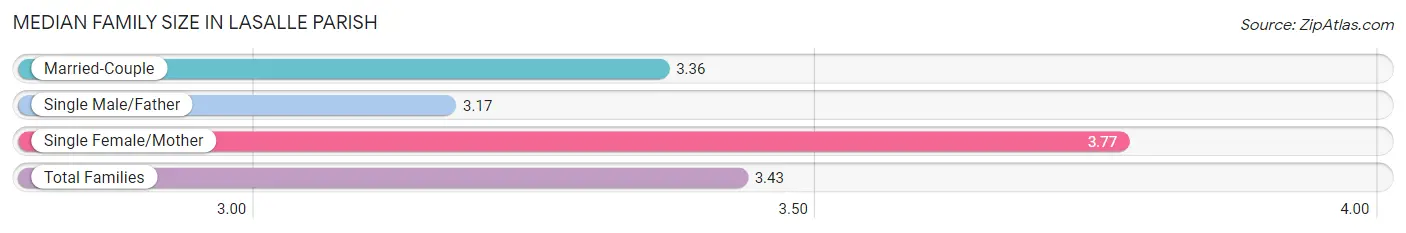
Median Family Size in LaSalle Parish
The median family size in LaSalle Parish is 3.43 persons per family, with single female/mother families (753 | 21.3%) accounting for the largest median family size of 3.77 persons per family. On the other hand, single male/father families (277 | 7.8%) represent the smallest median family size with 3.17 persons per family.
| Family Type | # Families | Family Size |
| Married-Couple | 2,510 (70.9%) | 3.36 |
| Single Male/Father | 277 (7.8%) | 3.17 |
| Single Female/Mother | 753 (21.3%) | 3.77 |
| Total Families | 3,540 (100.0%) | 3.43 |
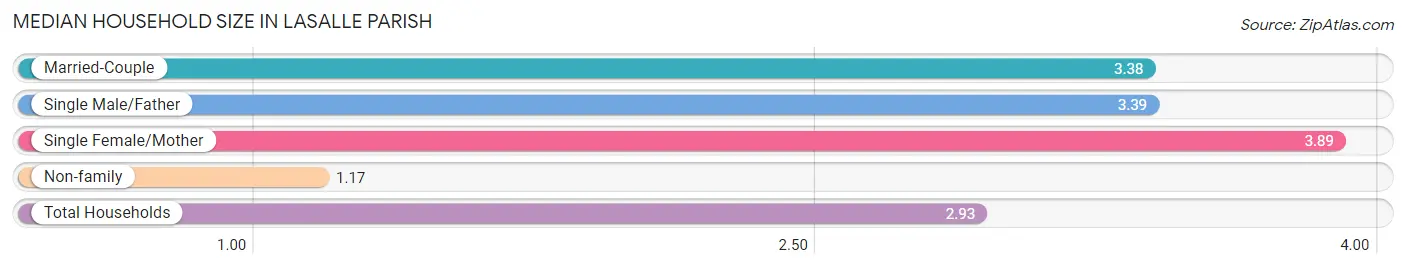
Median Household Size in LaSalle Parish
The median household size in LaSalle Parish is 2.93 persons per household, with single female/mother households (753 | 16.1%) accounting for the largest median household size of 3.89 persons per household. non-family households (1,125 | 24.1%) represent the smallest median household size with 1.17 persons per household.
| Household Type | # Households | Household Size |
| Married-Couple | 2,510 (53.8%) | 3.38 |
| Single Male/Father | 277 (5.9%) | 3.39 |
| Single Female/Mother | 753 (16.1%) | 3.89 |
| Non-family | 1,125 (24.1%) | 1.17 |
| Total Households | 4,665 (100.0%) | 2.93 |
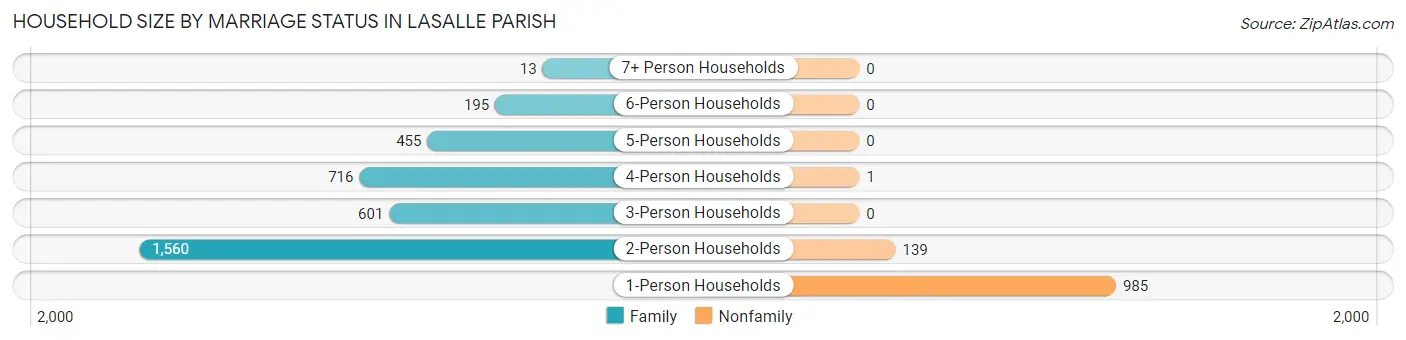
Household Size by Marriage Status in LaSalle Parish
Out of a total of 4,665 households in LaSalle Parish, 3,540 (75.9%) are family households, while 1,125 (24.1%) are nonfamily households. The most numerous type of family households are 2-person households, comprising 1,560, and the most common type of nonfamily households are 1-person households, comprising 985.
| Household Size | Family Households | Nonfamily Households |
| 1-Person Households | - | 985 (21.1%) |
| 2-Person Households | 1,560 (33.4%) | 139 (3.0%) |
| 3-Person Households | 601 (12.9%) | 0 (0.0%) |
| 4-Person Households | 716 (15.3%) | 1 (0.0%) |
| 5-Person Households | 455 (9.8%) | 0 (0.0%) |
| 6-Person Households | 195 (4.2%) | 0 (0.0%) |
| 7+ Person Households | 13 (0.3%) | 0 (0.0%) |
| Total | 3,540 (75.9%) | 1,125 (24.1%) |
Female Fertility in LaSalle Parish
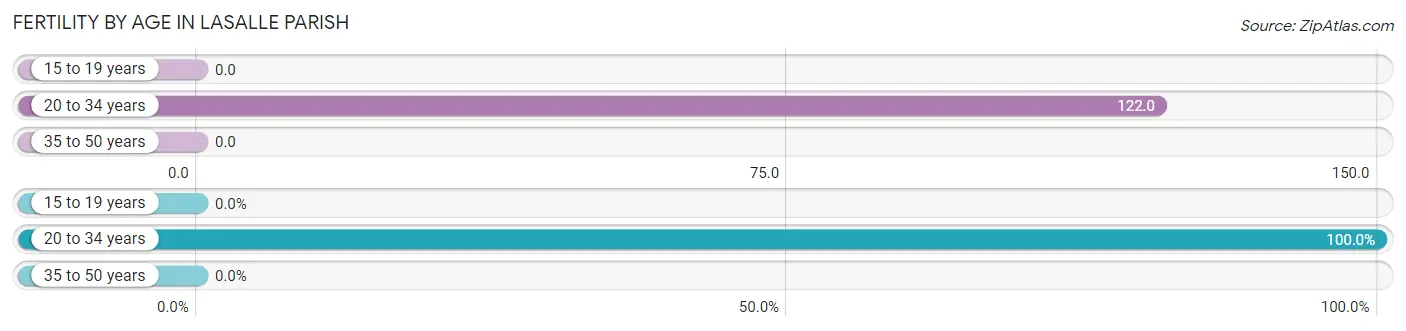
Fertility by Age in LaSalle Parish
Average fertility rate in LaSalle Parish is 52.0 births per 1,000 women. Women in the age bracket of 20 to 34 years have the highest fertility rate with 122.0 births per 1,000 women. Women in the age bracket of 20 to 34 years acount for 100.0% of all women with births.
| Age Bracket | Women with Births | Births / 1,000 Women |
| 15 to 19 years | 0 (0.0%) | 0.0 |
| 20 to 34 years | 158 (100.0%) | 122.0 |
| 35 to 50 years | 0 (0.0%) | 0.0 |
| Total | 158 (100.0%) | 52.0 |
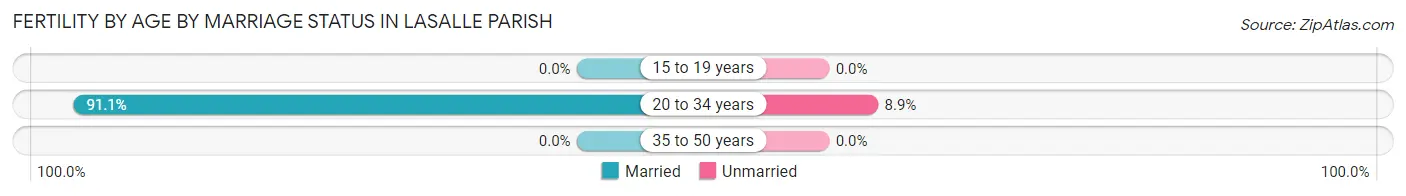
Fertility by Age by Marriage Status in LaSalle Parish
91.1% of women with births (158) in LaSalle Parish are married. The highest percentage of unmarried women with births falls into 20 to 34 years age bracket with 8.9% of them unmarried at the time of birth, while the lowest percentage of unmarried women with births belong to 20 to 34 years age bracket with 8.9% of them unmarried.
| Age Bracket | Married | Unmarried |
| 15 to 19 years | 0 (0.0%) | 0 (0.0%) |
| 20 to 34 years | 144 (91.1%) | 14 (8.9%) |
| 35 to 50 years | 0 (0.0%) | 0 (0.0%) |
| Total | 144 (91.1%) | 14 (8.9%) |
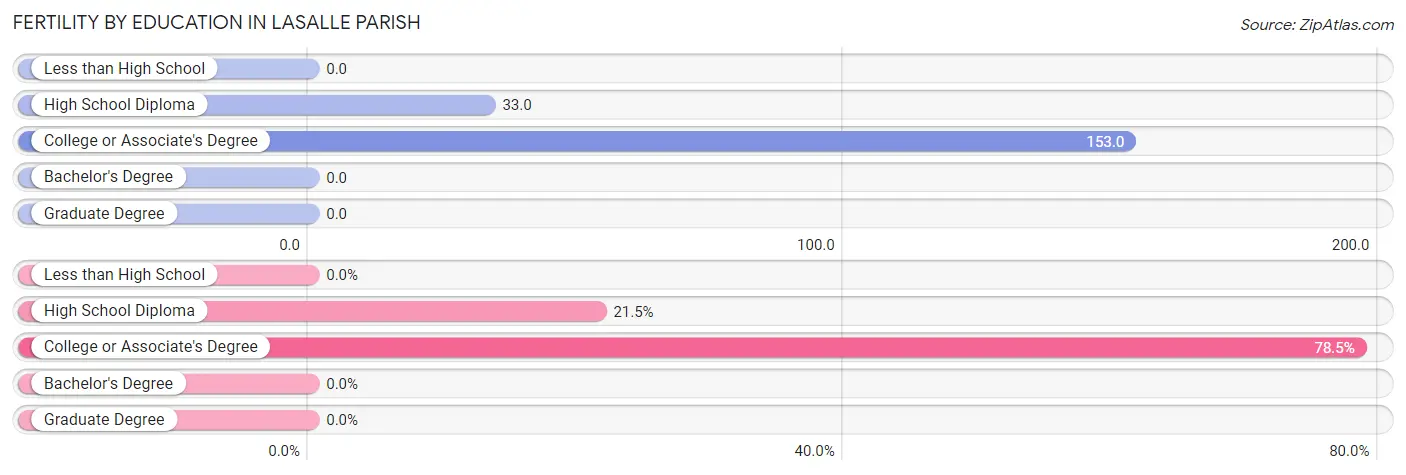
Fertility by Education in LaSalle Parish
| Educational Attainment | Women with Births | Births / 1,000 Women |
| Less than High School | 0 (0.0%) | 0.0 |
| High School Diploma | 34 (21.5%) | 33.0 |
| College or Associate's Degree | 124 (78.5%) | 153.0 |
| Bachelor's Degree | 0 (0.0%) | 0.0 |
| Graduate Degree | 0 (0.0%) | 0.0 |
| Total | 158 (100.0%) | 52.0 |
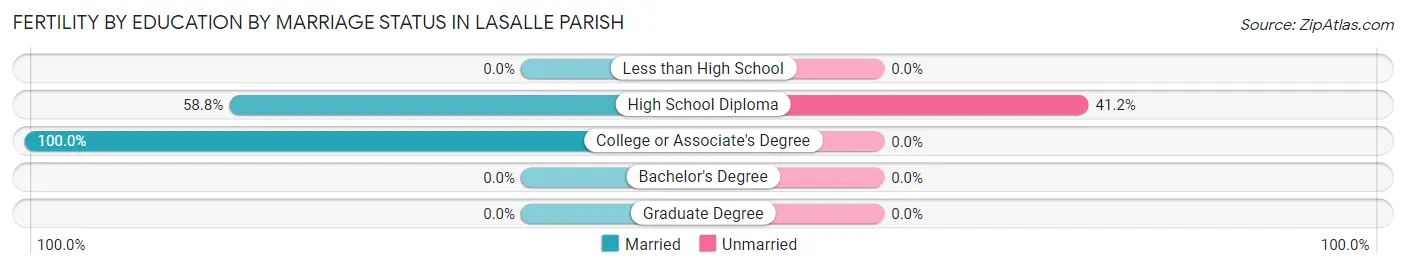
Fertility by Education by Marriage Status in LaSalle Parish
8.9% of women with births in LaSalle Parish are unmarried. Women with the educational attainment of college or associate's degree are most likely to be married with 100.0% of them married at childbirth, while women with the educational attainment of high school diploma are least likely to be married with 41.2% of them unmarried at childbirth.
| Educational Attainment | Married | Unmarried |
| Less than High School | 0 (0.0%) | 0 (0.0%) |
| High School Diploma | 20 (58.8%) | 14 (41.2%) |
| College or Associate's Degree | 124 (100.0%) | 0 (0.0%) |
| Bachelor's Degree | 0 (0.0%) | 0 (0.0%) |
| Graduate Degree | 0 (0.0%) | 0 (0.0%) |
| Total | 144 (91.1%) | 14 (8.9%) |
Income in LaSalle Parish
Income Overview in LaSalle Parish
Per Capita Income in LaSalle Parish is $29,769, while median incomes of families and households are $74,525 and $59,926 respectively.
| Characteristic | Number | Measure |
| Per Capita Income | 14,764 | $29,769 |
| Median Family Income | 3,540 | $74,525 |
| Mean Family Income | 3,540 | $94,083 |
| Median Household Income | 4,665 | $59,926 |
| Mean Household Income | 4,665 | $79,073 |
| Income Deficit | 3,540 | $0 |
| Wage / Income Gap (%) | 14,764 | 47.64% |
| Wage / Income Gap ($) | 14,764 | 52.36¢ per $1 |
| Gini / Inequality Index | 14,764 | 0.45 |
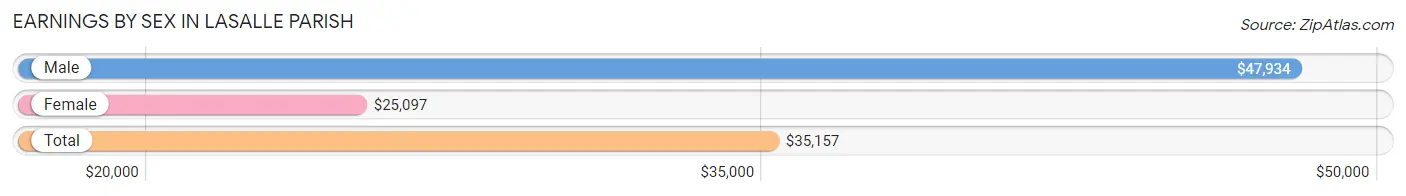
Earnings by Sex in LaSalle Parish
Average Earnings in LaSalle Parish are $35,157, $47,934 for men and $25,097 for women, a difference of 47.6%.
| Sex | Number | Average Earnings |
| Male | 4,237 (60.0%) | $47,934 |
| Female | 2,828 (40.0%) | $25,097 |
| Total | 7,065 (100.0%) | $35,157 |
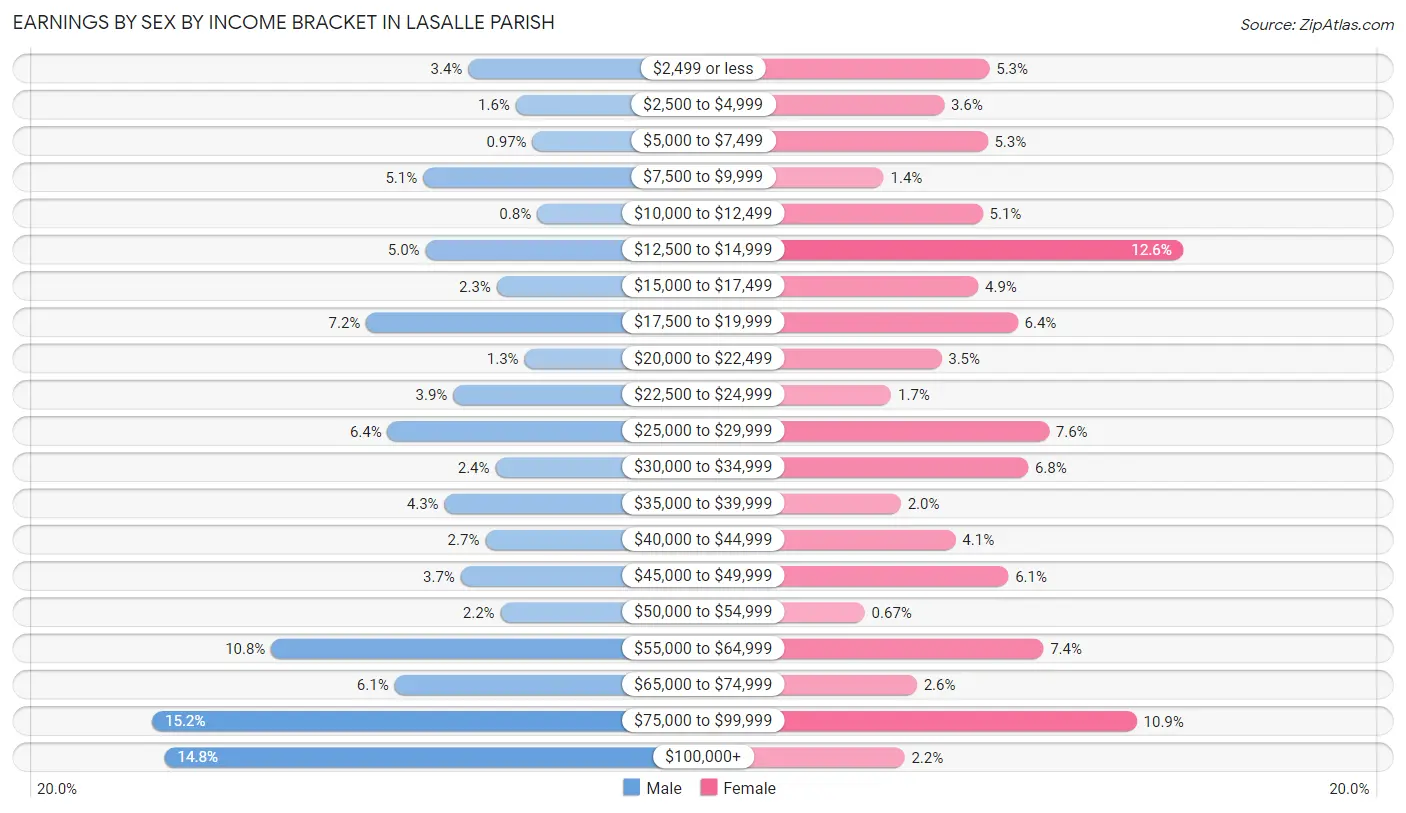
Earnings by Sex by Income Bracket in LaSalle Parish
The most common earnings brackets in LaSalle Parish are $75,000 to $99,999 for men (645 | 15.2%) and $12,500 to $14,999 for women (357 | 12.6%).
| Income | Male | Female |
| $2,499 or less | 143 (3.4%) | 151 (5.3%) |
| $2,500 to $4,999 | 68 (1.6%) | 103 (3.6%) |
| $5,000 to $7,499 | 41 (1.0%) | 149 (5.3%) |
| $7,500 to $9,999 | 215 (5.1%) | 39 (1.4%) |
| $10,000 to $12,499 | 34 (0.8%) | 144 (5.1%) |
| $12,500 to $14,999 | 211 (5.0%) | 357 (12.6%) |
| $15,000 to $17,499 | 98 (2.3%) | 139 (4.9%) |
| $17,500 to $19,999 | 305 (7.2%) | 181 (6.4%) |
| $20,000 to $22,499 | 54 (1.3%) | 100 (3.5%) |
| $22,500 to $24,999 | 167 (3.9%) | 47 (1.7%) |
| $25,000 to $29,999 | 271 (6.4%) | 214 (7.6%) |
| $30,000 to $34,999 | 100 (2.4%) | 192 (6.8%) |
| $35,000 to $39,999 | 181 (4.3%) | 57 (2.0%) |
| $40,000 to $44,999 | 116 (2.7%) | 115 (4.1%) |
| $45,000 to $49,999 | 155 (3.7%) | 171 (6.0%) |
| $50,000 to $54,999 | 92 (2.2%) | 19 (0.7%) |
| $55,000 to $64,999 | 456 (10.8%) | 208 (7.4%) |
| $65,000 to $74,999 | 260 (6.1%) | 74 (2.6%) |
| $75,000 to $99,999 | 645 (15.2%) | 307 (10.9%) |
| $100,000+ | 625 (14.7%) | 61 (2.2%) |
| Total | 4,237 (100.0%) | 2,828 (100.0%) |
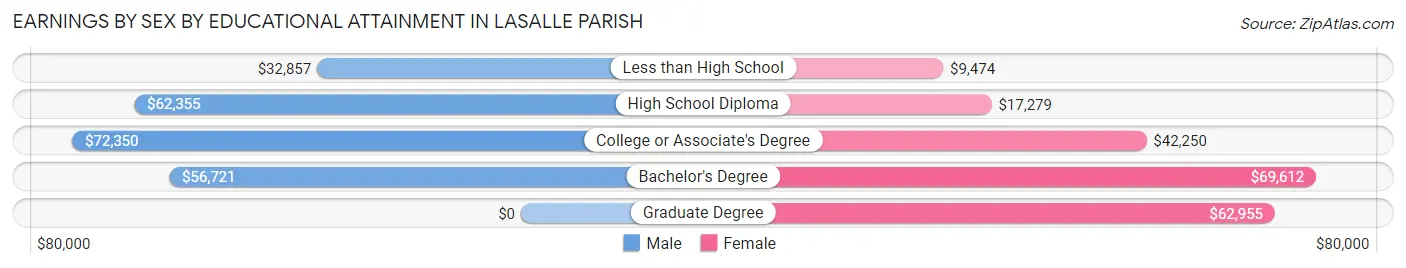
Earnings by Sex by Educational Attainment in LaSalle Parish
Average earnings in LaSalle Parish are $60,374 for men and $29,910 for women, a difference of 50.5%. Men with an educational attainment of college or associate's degree enjoy the highest average annual earnings of $72,350, while those with less than high school education earn the least with $32,857. Women with an educational attainment of bachelor's degree earn the most with the average annual earnings of $69,612, while those with less than high school education have the smallest earnings of $9,474.
| Educational Attainment | Male Income | Female Income |
| Less than High School | $32,857 | $9,474 |
| High School Diploma | $62,355 | $17,279 |
| College or Associate's Degree | $72,350 | $42,250 |
| Bachelor's Degree | $56,721 | $69,612 |
| Graduate Degree | - | - |
| Total | $60,374 | $29,910 |
Family Income in LaSalle Parish
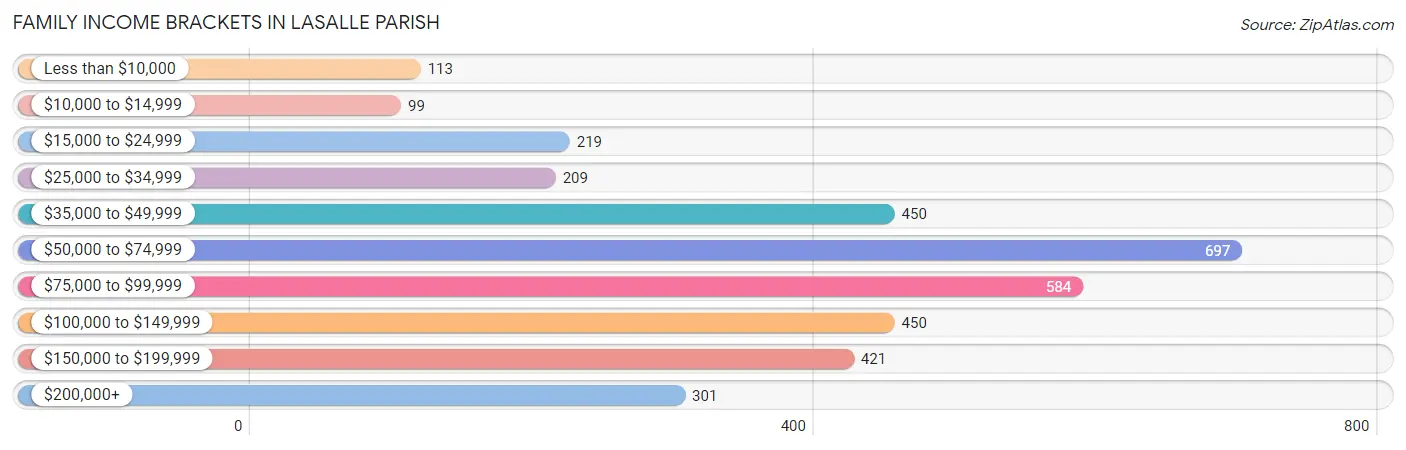
Family Income Brackets in LaSalle Parish
According to the LaSalle Parish family income data, there are 697 families falling into the $50,000 to $74,999 income range, which is the most common income bracket and makes up 19.7% of all families. Conversely, the $10,000 to $14,999 income bracket is the least frequent group with only 99 families (2.8%) belonging to this category.
| Income Bracket | # Families | % Families |
| Less than $10,000 | 113 | 3.2% |
| $10,000 to $14,999 | 99 | 2.8% |
| $15,000 to $24,999 | 219 | 6.2% |
| $25,000 to $34,999 | 209 | 5.9% |
| $35,000 to $49,999 | 450 | 12.7% |
| $50,000 to $74,999 | 697 | 19.7% |
| $75,000 to $99,999 | 584 | 16.5% |
| $100,000 to $149,999 | 450 | 12.7% |
| $150,000 to $199,999 | 421 | 11.9% |
| $200,000+ | 301 | 8.5% |
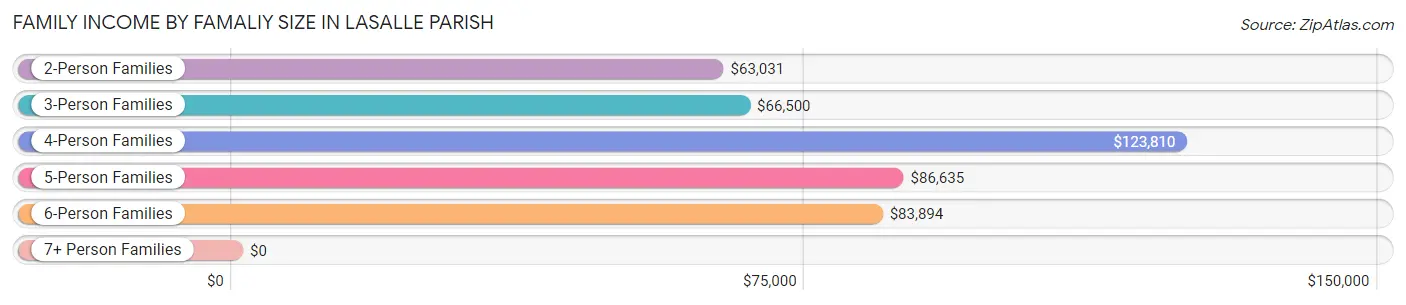
Family Income by Famaliy Size in LaSalle Parish
4-person families (686 | 19.4%) account for the highest median family income in LaSalle Parish with $123,810 per family, while 2-person families (1,621 | 45.8%) have the highest median income of $31,516 per family member.
| Income Bracket | # Families | Median Income |
| 2-Person Families | 1,621 (45.8%) | $63,031 |
| 3-Person Families | 604 (17.1%) | $66,500 |
| 4-Person Families | 686 (19.4%) | $123,810 |
| 5-Person Families | 423 (11.9%) | $86,635 |
| 6-Person Families | 193 (5.4%) | $83,894 |
| 7+ Person Families | 13 (0.4%) | $0 |
| Total | 3,540 (100.0%) | $74,525 |
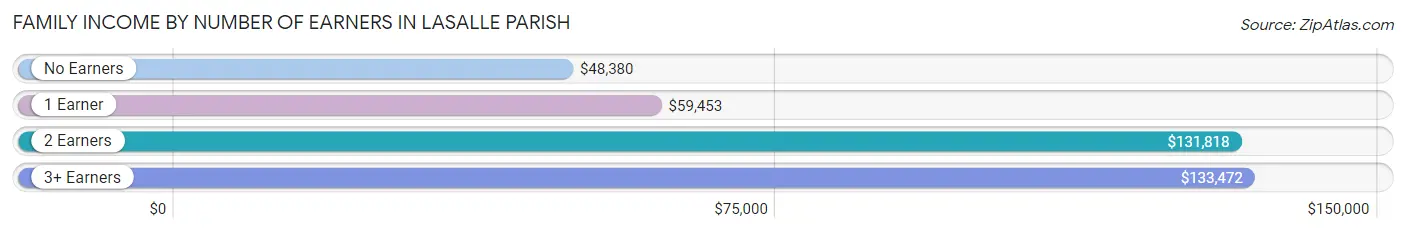
Family Income by Number of Earners in LaSalle Parish
The median family income in LaSalle Parish is $74,525, with families comprising 3+ earners (263) having the highest median family income of $133,472, while families with no earners (584) have the lowest median family income of $48,380, accounting for 7.4% and 16.5% of families, respectively.
| Number of Earners | # Families | Median Income |
| No Earners | 584 (16.5%) | $48,380 |
| 1 Earner | 1,259 (35.6%) | $59,453 |
| 2 Earners | 1,434 (40.5%) | $131,818 |
| 3+ Earners | 263 (7.4%) | $133,472 |
| Total | 3,540 (100.0%) | $74,525 |
Household Income in LaSalle Parish
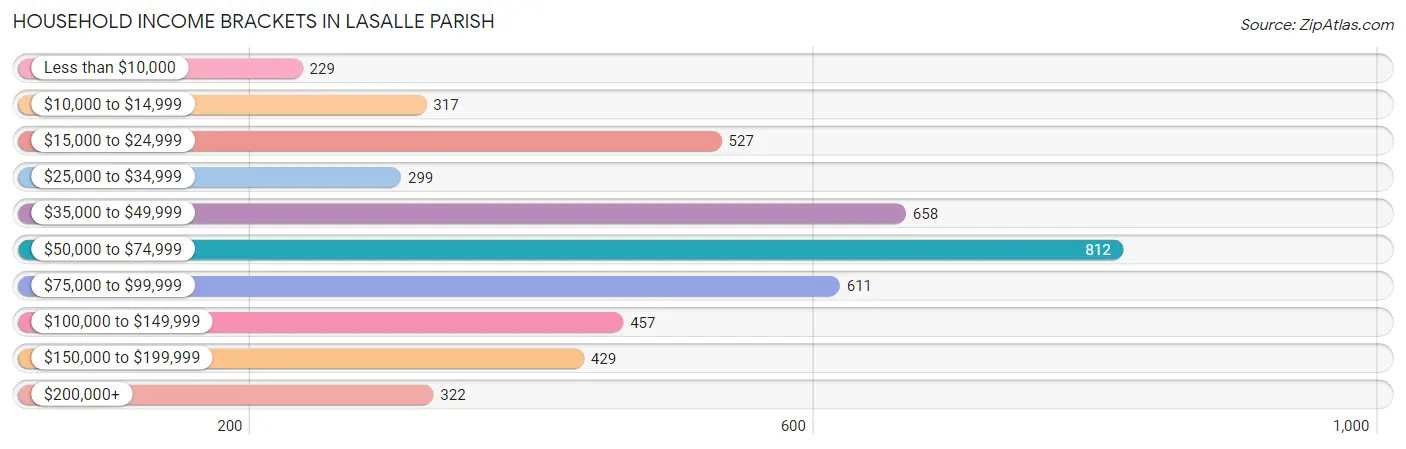
Household Income Brackets in LaSalle Parish
With 812 households falling in the category, the $50,000 to $74,999 income range is the most frequent in LaSalle Parish, accounting for 17.4% of all households. In contrast, only 229 households (4.9%) fall into the less than $10,000 income bracket, making it the least populous group.
| Income Bracket | # Households | % Households |
| Less than $10,000 | 229 | 4.9% |
| $10,000 to $14,999 | 317 | 6.8% |
| $15,000 to $24,999 | 527 | 11.3% |
| $25,000 to $34,999 | 299 | 6.4% |
| $35,000 to $49,999 | 658 | 14.1% |
| $50,000 to $74,999 | 812 | 17.4% |
| $75,000 to $99,999 | 611 | 13.1% |
| $100,000 to $149,999 | 457 | 9.8% |
| $150,000 to $199,999 | 429 | 9.2% |
| $200,000+ | 322 | 6.9% |
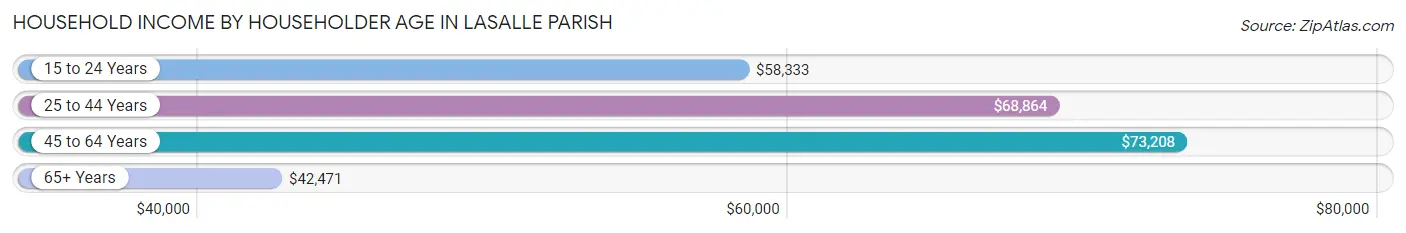
Household Income by Householder Age in LaSalle Parish
The median household income in LaSalle Parish is $59,926, with the highest median household income of $73,208 found in the 45 to 64 years age bracket for the primary householder. A total of 1,842 households (39.5%) fall into this category. Meanwhile, the 65+ years age bracket for the primary householder has the lowest median household income of $42,471, with 1,437 households (30.8%) in this group.
| Income Bracket | # Households | Median Income |
| 15 to 24 Years | 94 (2.0%) | $58,333 |
| 25 to 44 Years | 1,292 (27.7%) | $68,864 |
| 45 to 64 Years | 1,842 (39.5%) | $73,208 |
| 65+ Years | 1,437 (30.8%) | $42,471 |
| Total | 4,665 (100.0%) | $59,926 |
Poverty in LaSalle Parish
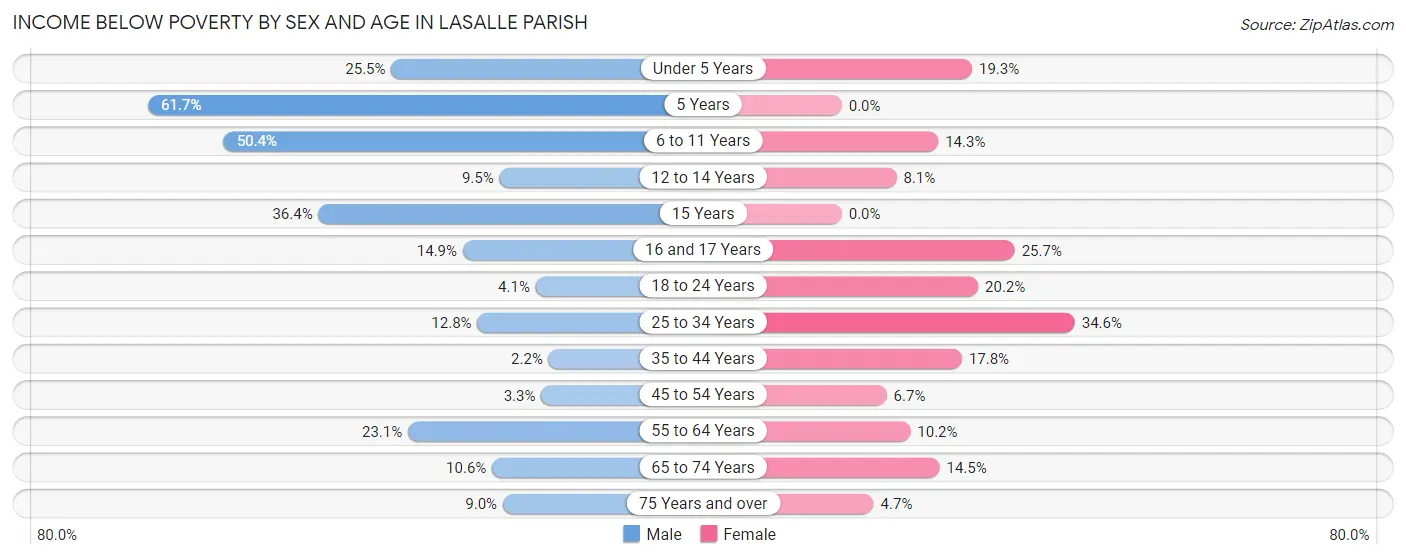
Income Below Poverty by Sex and Age in LaSalle Parish
With 14.7% poverty level for males and 15.7% for females among the residents of LaSalle Parish, 5 year old males and 25 to 34 year old females are the most vulnerable to poverty, with 74 males (61.7%) and 273 females (34.6%) in their respective age groups living below the poverty level.
| Age Bracket | Male | Female |
| Under 5 Years | 106 (25.5%) | 76 (19.3%) |
| 5 Years | 74 (61.7%) | 0 (0.0%) |
| 6 to 11 Years | 295 (50.4%) | 66 (14.3%) |
| 12 to 14 Years | 23 (9.5%) | 28 (8.1%) |
| 15 Years | 8 (36.4%) | 0 (0.0%) |
| 16 and 17 Years | 47 (14.9%) | 47 (25.7%) |
| 18 to 24 Years | 35 (4.1%) | 120 (20.2%) |
| 25 to 34 Years | 127 (12.8%) | 273 (34.6%) |
| 35 to 44 Years | 17 (2.2%) | 154 (17.8%) |
| 45 to 54 Years | 33 (3.3%) | 53 (6.7%) |
| 55 to 64 Years | 184 (23.1%) | 81 (10.2%) |
| 65 to 74 Years | 59 (10.6%) | 119 (14.5%) |
| 75 Years and over | 35 (9.0%) | 21 (4.7%) |
| Total | 1,043 (14.7%) | 1,038 (15.7%) |
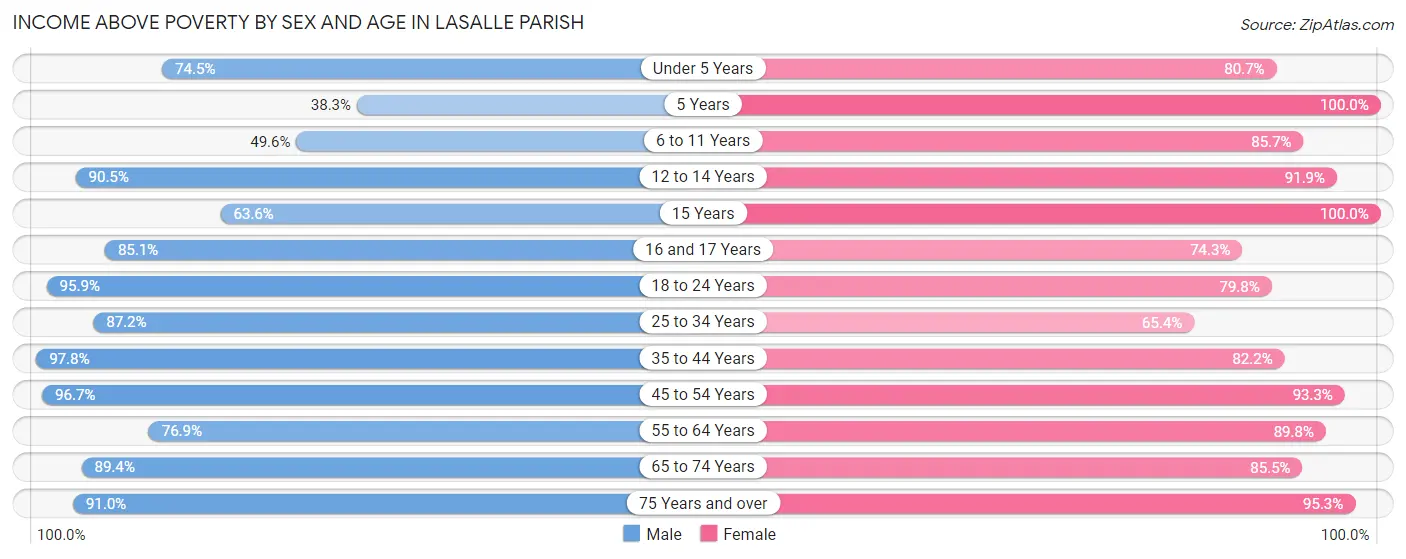
Income Above Poverty by Sex and Age in LaSalle Parish
According to the poverty statistics in LaSalle Parish, males aged 35 to 44 years and females aged 5 years are the age groups that are most secure financially, with 97.8% of males and 100.0% of females in these age groups living above the poverty line.
| Age Bracket | Male | Female |
| Under 5 Years | 309 (74.5%) | 317 (80.7%) |
| 5 Years | 46 (38.3%) | 74 (100.0%) |
| 6 to 11 Years | 290 (49.6%) | 395 (85.7%) |
| 12 to 14 Years | 220 (90.5%) | 317 (91.9%) |
| 15 Years | 14 (63.6%) | 57 (100.0%) |
| 16 and 17 Years | 268 (85.1%) | 136 (74.3%) |
| 18 to 24 Years | 819 (95.9%) | 473 (79.8%) |
| 25 to 34 Years | 868 (87.2%) | 516 (65.4%) |
| 35 to 44 Years | 765 (97.8%) | 709 (82.2%) |
| 45 to 54 Years | 975 (96.7%) | 743 (93.3%) |
| 55 to 64 Years | 614 (76.9%) | 715 (89.8%) |
| 65 to 74 Years | 499 (89.4%) | 701 (85.5%) |
| 75 Years and over | 355 (91.0%) | 423 (95.3%) |
| Total | 6,042 (85.3%) | 5,576 (84.3%) |
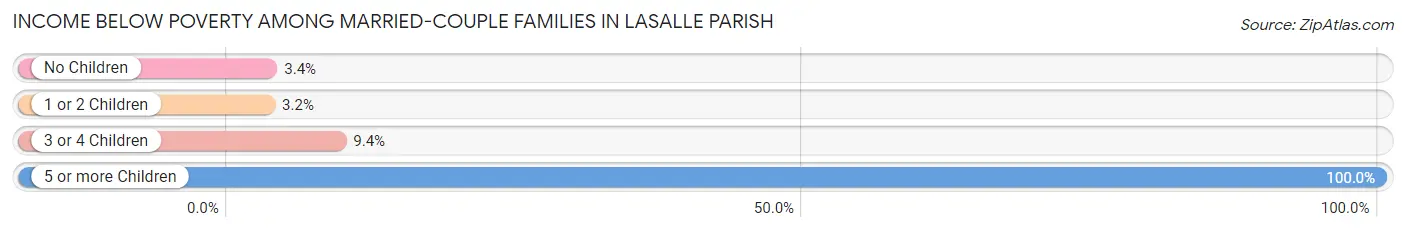
Income Below Poverty Among Married-Couple Families in LaSalle Parish
The poverty statistics for married-couple families in LaSalle Parish show that 4.5% or 112 of the total 2,510 families live below the poverty line. Families with 5 or more children have the highest poverty rate of 100.0%, comprising of 2 families. On the other hand, families with 1 or 2 children have the lowest poverty rate of 3.2%, which includes 20 families.
| Children | Above Poverty | Below Poverty |
| No Children | 1,414 (96.6%) | 50 (3.4%) |
| 1 or 2 Children | 600 (96.8%) | 20 (3.2%) |
| 3 or 4 Children | 384 (90.6%) | 40 (9.4%) |
| 5 or more Children | 0 (0.0%) | 2 (100.0%) |
| Total | 2,398 (95.5%) | 112 (4.5%) |
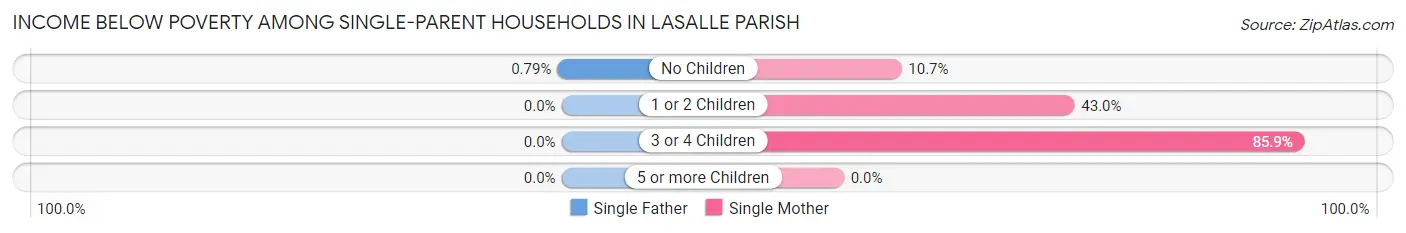
Income Below Poverty Among Single-Parent Households in LaSalle Parish
According to the poverty data in LaSalle Parish, 0.4% or 1 single-father households and 41.8% or 315 single-mother households are living below the poverty line. Among single-father households, those with no children have the highest poverty rate, with 1 households (0.8%) experiencing poverty. Likewise, among single-mother households, those with 3 or 4 children have the highest poverty rate, with 79 households (85.9%) falling below the poverty line.
| Children | Single Father | Single Mother |
| No Children | 1 (0.8%) | 16 (10.7%) |
| 1 or 2 Children | 0 (0.0%) | 220 (43.0%) |
| 3 or 4 Children | 0 (0.0%) | 79 (85.9%) |
| 5 or more Children | 0 (0.0%) | 0 (0.0%) |
| Total | 1 (0.4%) | 315 (41.8%) |
Income Below Poverty Among Married-Couple vs Single-Parent Households in LaSalle Parish
The poverty data for LaSalle Parish shows that 112 of the married-couple family households (4.5%) and 316 of the single-parent households (30.7%) are living below the poverty level. Within the married-couple family households, those with 5 or more children have the highest poverty rate, with 2 households (100.0%) falling below the poverty line. Among the single-parent households, those with 3 or 4 children have the highest poverty rate, with 79 household (78.2%) living below poverty.
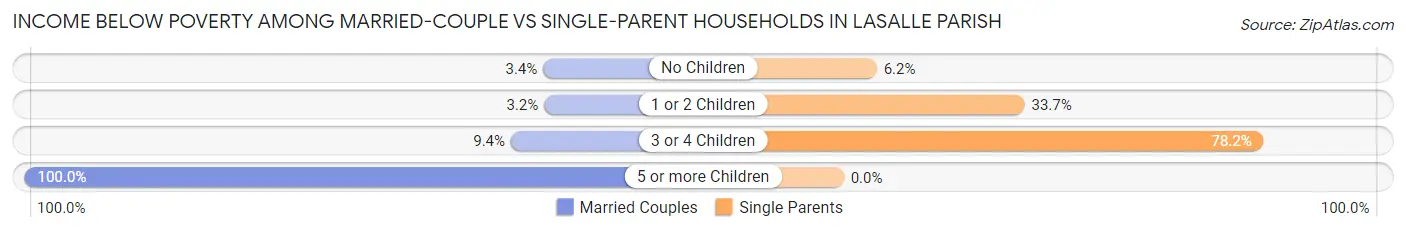
| Children | Married-Couple Families | Single-Parent Households |
| No Children | 50 (3.4%) | 17 (6.2%) |
| 1 or 2 Children | 20 (3.2%) | 220 (33.7%) |
| 3 or 4 Children | 40 (9.4%) | 79 (78.2%) |
| 5 or more Children | 2 (100.0%) | 0 (0.0%) |
| Total | 112 (4.5%) | 316 (30.7%) |
Employment Characteristics in LaSalle Parish
Employment by Class of Employer in LaSalle Parish
Among the 6,278 employed individuals in LaSalle Parish, private company employees (4,154 | 66.2%), local government employees (650 | 10.3%), and not-for-profit organizations (474 | 7.5%) make up the most common classes of employment.
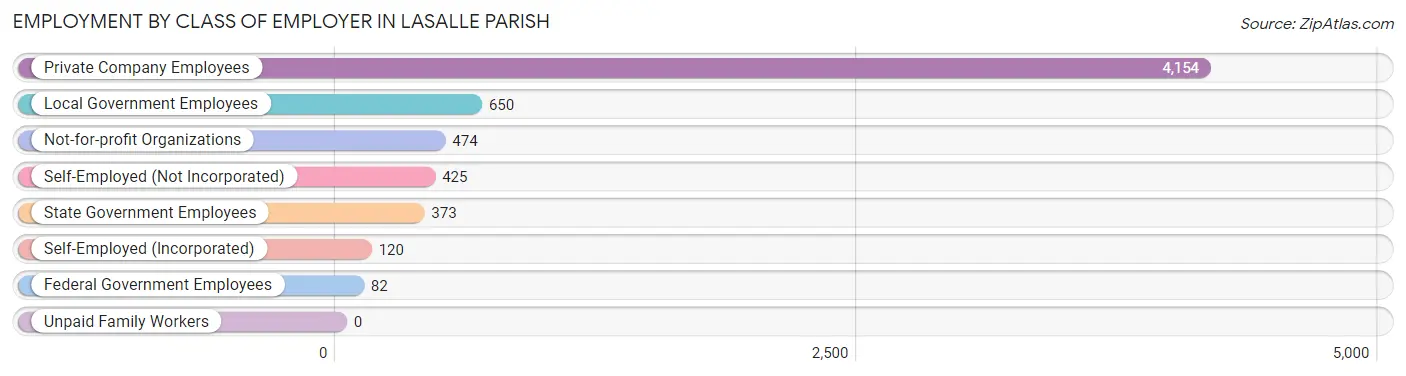
| Employer Class | # Employees | % Employees |
| Private Company Employees | 4,154 | 66.2% |
| Self-Employed (Incorporated) | 120 | 1.9% |
| Self-Employed (Not Incorporated) | 425 | 6.8% |
| Not-for-profit Organizations | 474 | 7.5% |
| Local Government Employees | 650 | 10.3% |
| State Government Employees | 373 | 5.9% |
| Federal Government Employees | 82 | 1.3% |
| Unpaid Family Workers | 0 | 0.0% |
| Total | 6,278 | 100.0% |
Employment Status by Age in LaSalle Parish
According to the labor force statistics for LaSalle Parish, out of the total population over 16 years of age (12,048), 55.8% or 6,723 individuals are in the labor force, with 4.6% or 309 of them unemployed. The age group with the highest labor force participation rate is 45 to 54 years, with 78.8% or 1,537 individuals in the labor force. Within the labor force, the 75 years and over age range has the highest percentage of unemployed individuals, with 18.9% or 7 of them being unemployed.
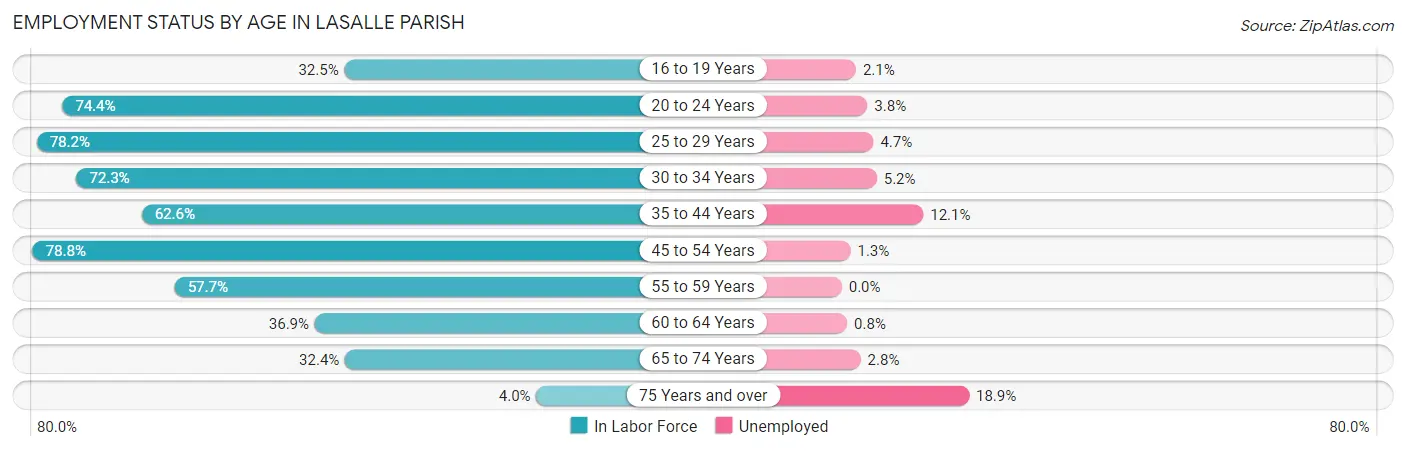
| Age Bracket | In Labor Force | Unemployed |
| 16 to 19 Years | 291 (32.5%) | 6 (2.1%) |
| 20 to 24 Years | 876 (74.4%) | 33 (3.8%) |
| 25 to 29 Years | 719 (78.2%) | 34 (4.7%) |
| 30 to 34 Years | 767 (72.3%) | 40 (5.2%) |
| 35 to 44 Years | 1,267 (62.6%) | 153 (12.1%) |
| 45 to 54 Years | 1,537 (78.8%) | 20 (1.3%) |
| 55 to 59 Years | 389 (57.7%) | 0 (0.0%) |
| 60 to 64 Years | 375 (36.9%) | 3 (0.8%) |
| 65 to 74 Years | 458 (32.4%) | 13 (2.8%) |
| 75 Years and over | 37 (4.0%) | 7 (18.9%) |
| Total | 6,723 (55.8%) | 309 (4.6%) |
Employment Status by Educational Attainment in LaSalle Parish
According to labor force statistics for LaSalle Parish, 66.1% of individuals (5,054) out of the total population between 25 and 64 years of age (7,646) are in the labor force, with 4.9% or 248 of them being unemployed. The group with the highest labor force participation rate are those with the educational attainment of bachelor's degree or higher, with 86.7% or 1,215 individuals in the labor force. Within the labor force, individuals with less than high school education have the highest percentage of unemployment, with 39.9% or 212 of them being unemployed.
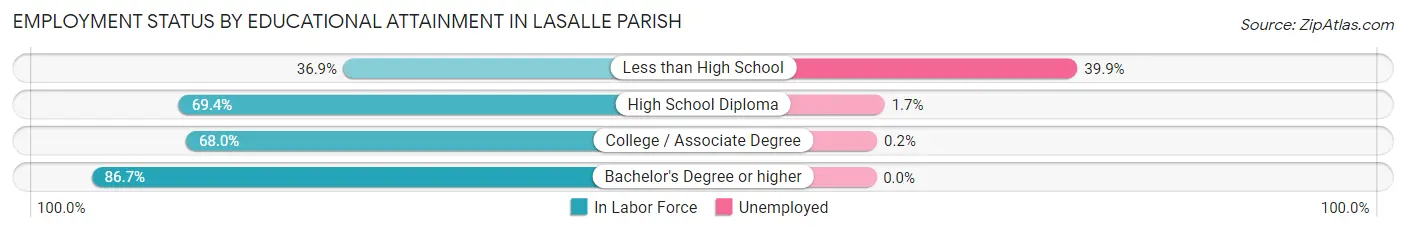
| Educational Attainment | In Labor Force | Unemployed |
| Less than High School | 531 (36.9%) | 574 (39.9%) |
| High School Diploma | 2,058 (69.4%) | 50 (1.7%) |
| College / Associate Degree | 1,251 (68.0%) | 4 (0.2%) |
| Bachelor's Degree or higher | 1,215 (86.7%) | 0 (0.0%) |
| Total | 5,054 (66.1%) | 375 (4.9%) |
Employment Occupations by Sex in LaSalle Parish
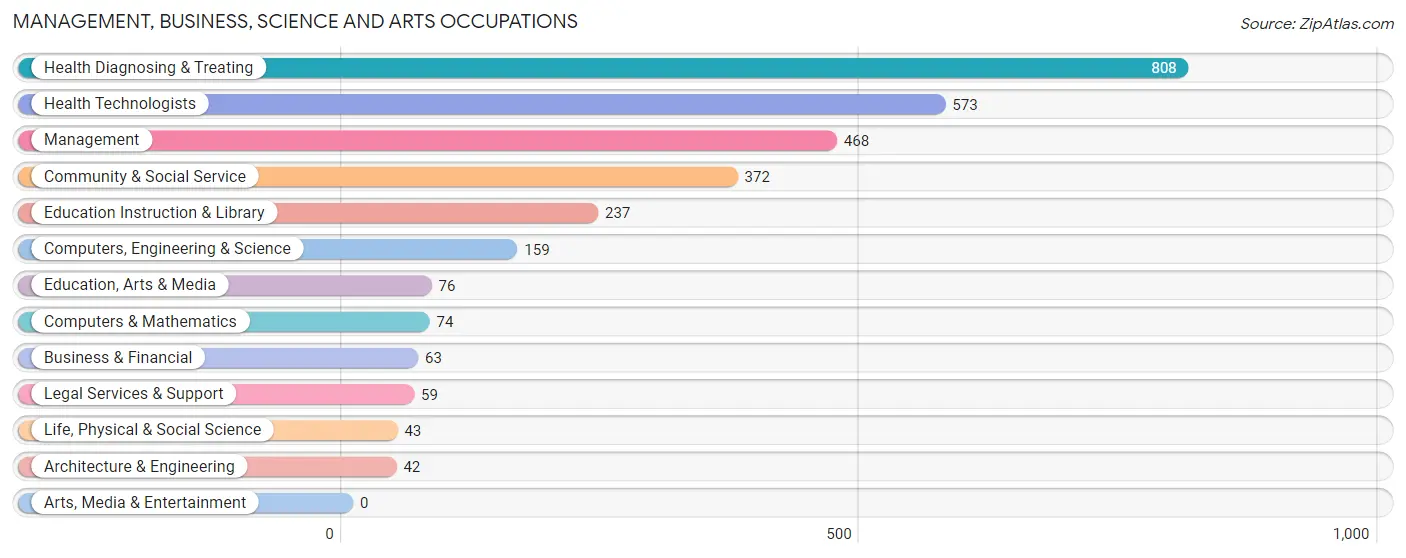
Management, Business, Science and Arts Occupations
The most common Management, Business, Science and Arts occupations in LaSalle Parish are Health Diagnosing & Treating (808 | 12.6%), Health Technologists (573 | 8.9%), Management (468 | 7.3%), Community & Social Service (372 | 5.8%), and Education Instruction & Library (237 | 3.7%).
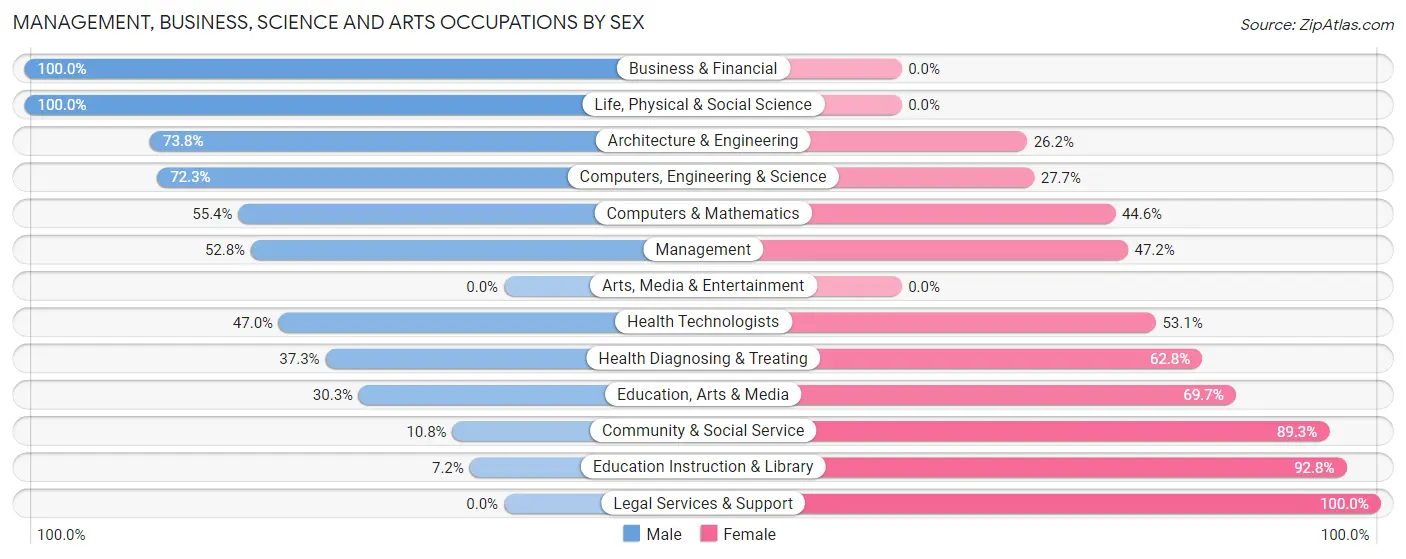
Management, Business, Science and Arts Occupations by Sex
Within the Management, Business, Science and Arts occupations in LaSalle Parish, the most male-oriented occupations are Business & Financial (100.0%), Life, Physical & Social Science (100.0%), and Architecture & Engineering (73.8%), while the most female-oriented occupations are Legal Services & Support (100.0%), Education Instruction & Library (92.8%), and Community & Social Service (89.2%).
| Occupation | Male | Female |
| Management | 247 (52.8%) | 221 (47.2%) |
| Business & Financial | 63 (100.0%) | 0 (0.0%) |
| Computers, Engineering & Science | 115 (72.3%) | 44 (27.7%) |
| Computers & Mathematics | 41 (55.4%) | 33 (44.6%) |
| Architecture & Engineering | 31 (73.8%) | 11 (26.2%) |
| Life, Physical & Social Science | 43 (100.0%) | 0 (0.0%) |
| Community & Social Service | 40 (10.7%) | 332 (89.2%) |
| Education, Arts & Media | 23 (30.3%) | 53 (69.7%) |
| Legal Services & Support | 0 (0.0%) | 59 (100.0%) |
| Education Instruction & Library | 17 (7.2%) | 220 (92.8%) |
| Arts, Media & Entertainment | 0 (0.0%) | 0 (0.0%) |
| Health Diagnosing & Treating | 301 (37.2%) | 507 (62.7%) |
| Health Technologists | 269 (46.9%) | 304 (53.0%) |
| Total (Category) | 766 (41.0%) | 1,104 (59.0%) |
| Total (Overall) | 3,788 (59.1%) | 2,619 (40.9%) |
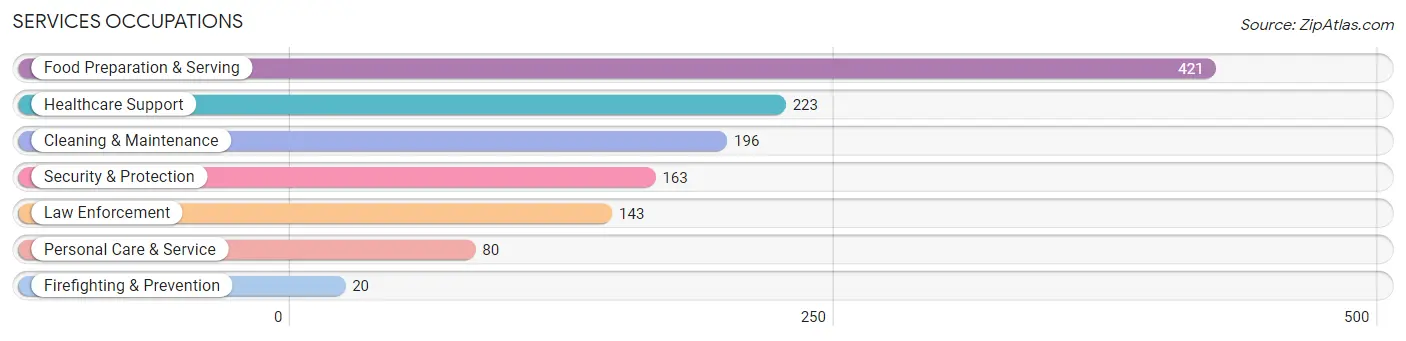
Services Occupations
The most common Services occupations in LaSalle Parish are Food Preparation & Serving (421 | 6.6%), Healthcare Support (223 | 3.5%), Cleaning & Maintenance (196 | 3.1%), Security & Protection (163 | 2.5%), and Law Enforcement (143 | 2.2%).
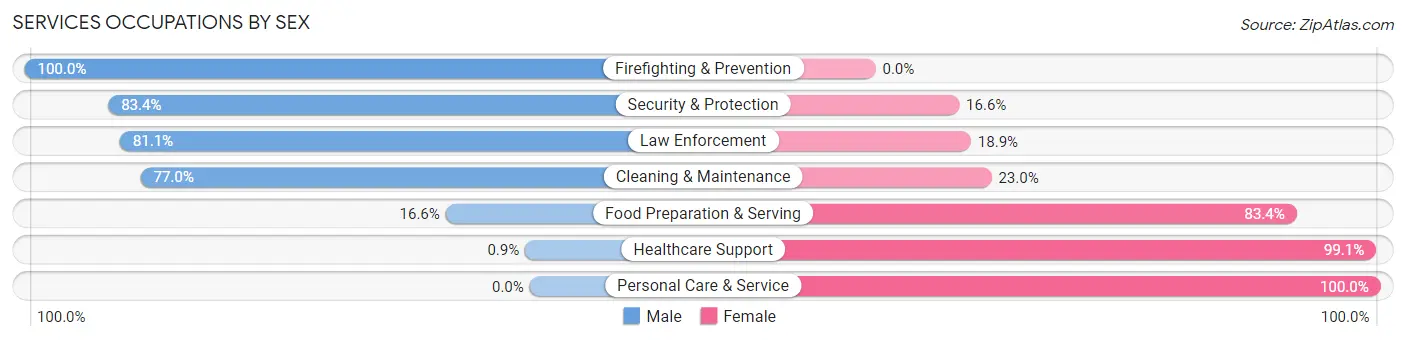
Services Occupations by Sex
Within the Services occupations in LaSalle Parish, the most male-oriented occupations are Firefighting & Prevention (100.0%), Security & Protection (83.4%), and Law Enforcement (81.1%), while the most female-oriented occupations are Personal Care & Service (100.0%), Healthcare Support (99.1%), and Food Preparation & Serving (83.4%).
| Occupation | Male | Female |
| Healthcare Support | 2 (0.9%) | 221 (99.1%) |
| Security & Protection | 136 (83.4%) | 27 (16.6%) |
| Firefighting & Prevention | 20 (100.0%) | 0 (0.0%) |
| Law Enforcement | 116 (81.1%) | 27 (18.9%) |
| Food Preparation & Serving | 70 (16.6%) | 351 (83.4%) |
| Cleaning & Maintenance | 151 (77.0%) | 45 (23.0%) |
| Personal Care & Service | 0 (0.0%) | 80 (100.0%) |
| Total (Category) | 359 (33.2%) | 724 (66.8%) |
| Total (Overall) | 3,788 (59.1%) | 2,619 (40.9%) |
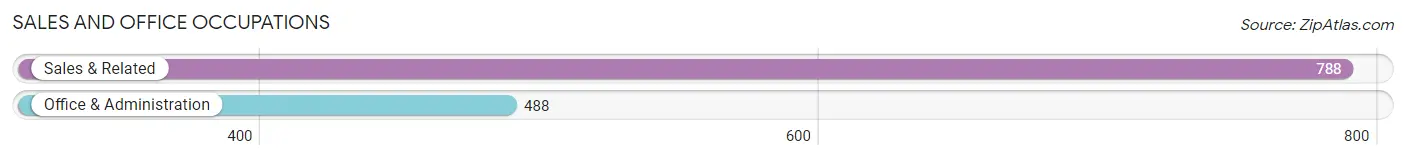
Sales and Office Occupations
The most common Sales and Office occupations in LaSalle Parish are Sales & Related (788 | 12.3%), and Office & Administration (488 | 7.6%).
Sales and Office Occupations by Sex
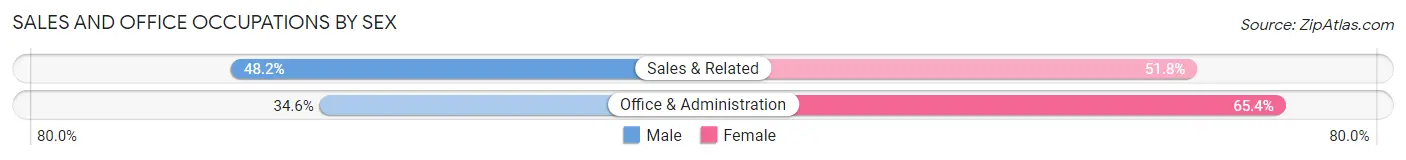
| Occupation | Male | Female |
| Sales & Related | 380 (48.2%) | 408 (51.8%) |
| Office & Administration | 169 (34.6%) | 319 (65.4%) |
| Total (Category) | 549 (43.0%) | 727 (57.0%) |
| Total (Overall) | 3,788 (59.1%) | 2,619 (40.9%) |
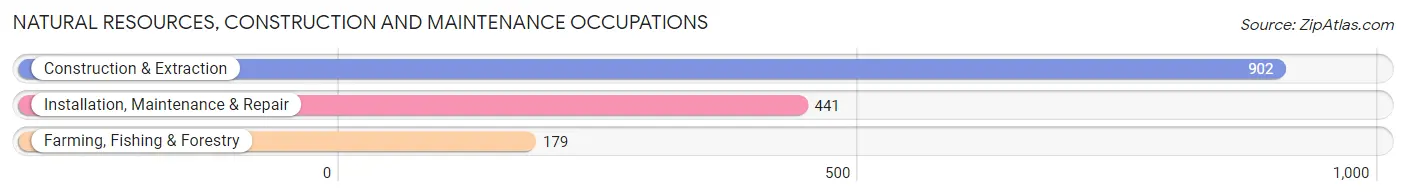
Natural Resources, Construction and Maintenance Occupations
The most common Natural Resources, Construction and Maintenance occupations in LaSalle Parish are Construction & Extraction (902 | 14.1%), Installation, Maintenance & Repair (441 | 6.9%), and Farming, Fishing & Forestry (179 | 2.8%).
Natural Resources, Construction and Maintenance Occupations by Sex
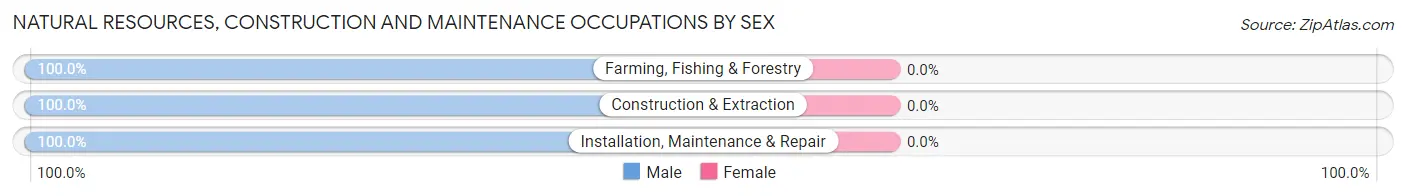
| Occupation | Male | Female |
| Farming, Fishing & Forestry | 179 (100.0%) | 0 (0.0%) |
| Construction & Extraction | 902 (100.0%) | 0 (0.0%) |
| Installation, Maintenance & Repair | 441 (100.0%) | 0 (0.0%) |
| Total (Category) | 1,522 (100.0%) | 0 (0.0%) |
| Total (Overall) | 3,788 (59.1%) | 2,619 (40.9%) |
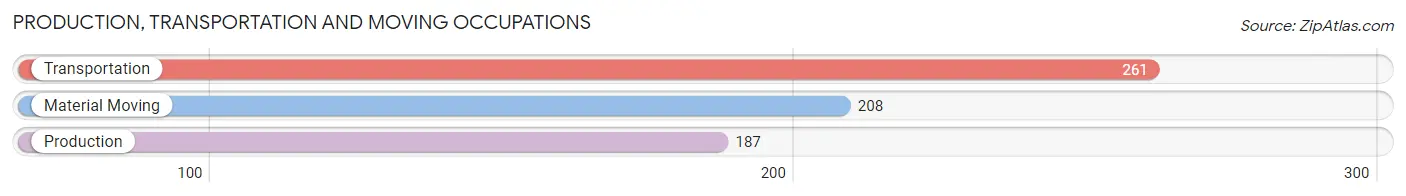
Production, Transportation and Moving Occupations
The most common Production, Transportation and Moving occupations in LaSalle Parish are Transportation (261 | 4.1%), Material Moving (208 | 3.3%), and Production (187 | 2.9%).
Production, Transportation and Moving Occupations by Sex
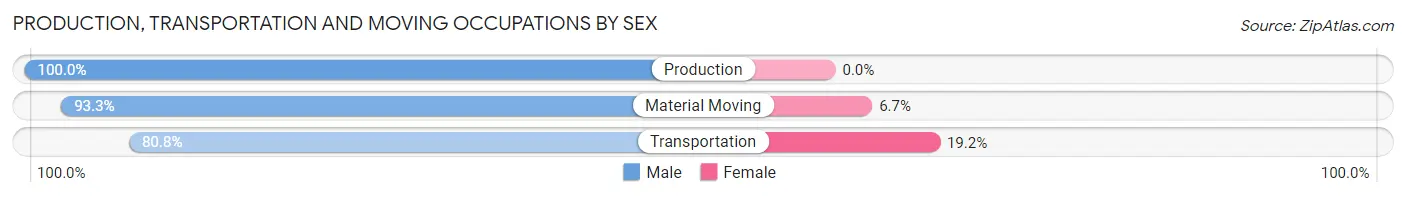
| Occupation | Male | Female |
| Production | 187 (100.0%) | 0 (0.0%) |
| Transportation | 211 (80.8%) | 50 (19.2%) |
| Material Moving | 194 (93.3%) | 14 (6.7%) |
| Total (Category) | 592 (90.2%) | 64 (9.8%) |
| Total (Overall) | 3,788 (59.1%) | 2,619 (40.9%) |
Employment Industries by Sex in LaSalle Parish
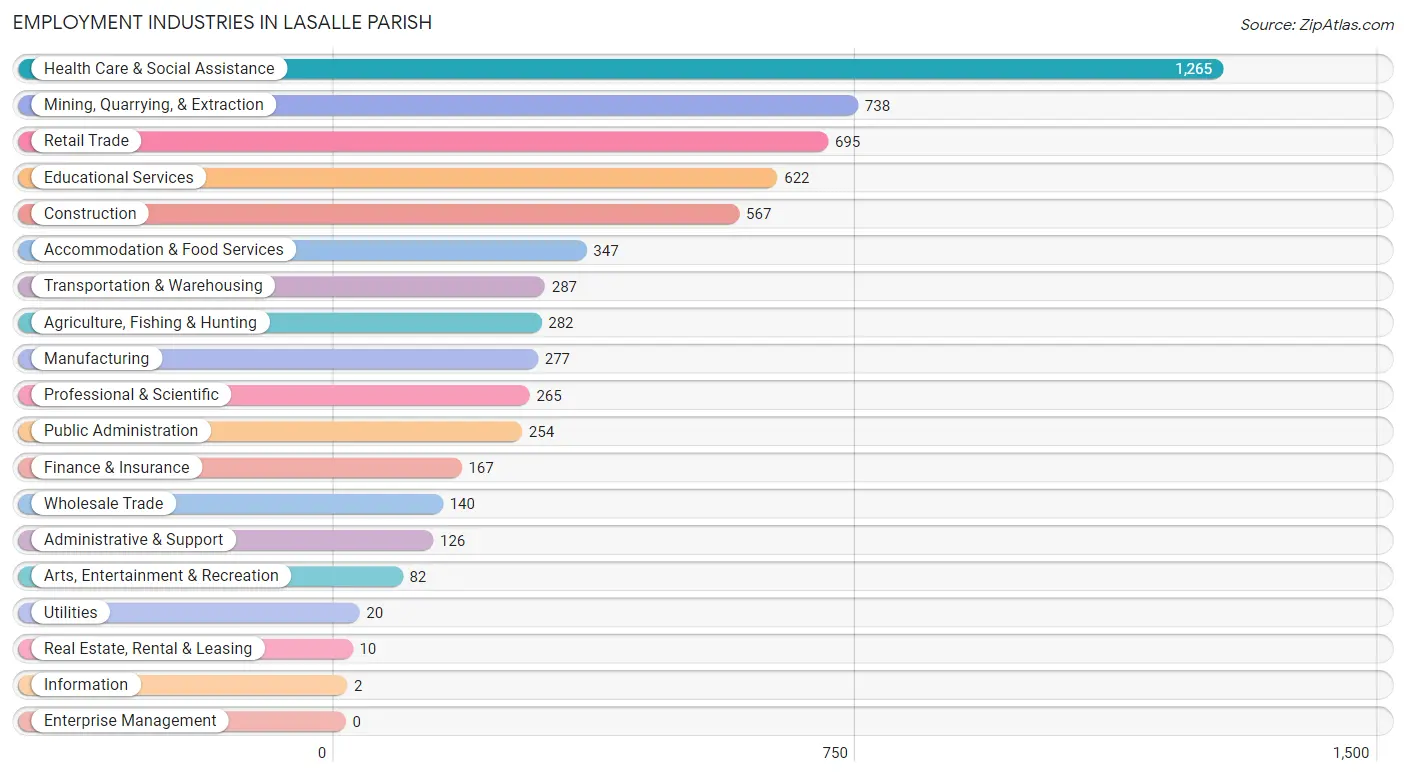
Employment Industries in LaSalle Parish
The major employment industries in LaSalle Parish include Health Care & Social Assistance (1,265 | 19.7%), Mining, Quarrying, & Extraction (738 | 11.5%), Retail Trade (695 | 10.8%), Educational Services (622 | 9.7%), and Construction (567 | 8.8%).
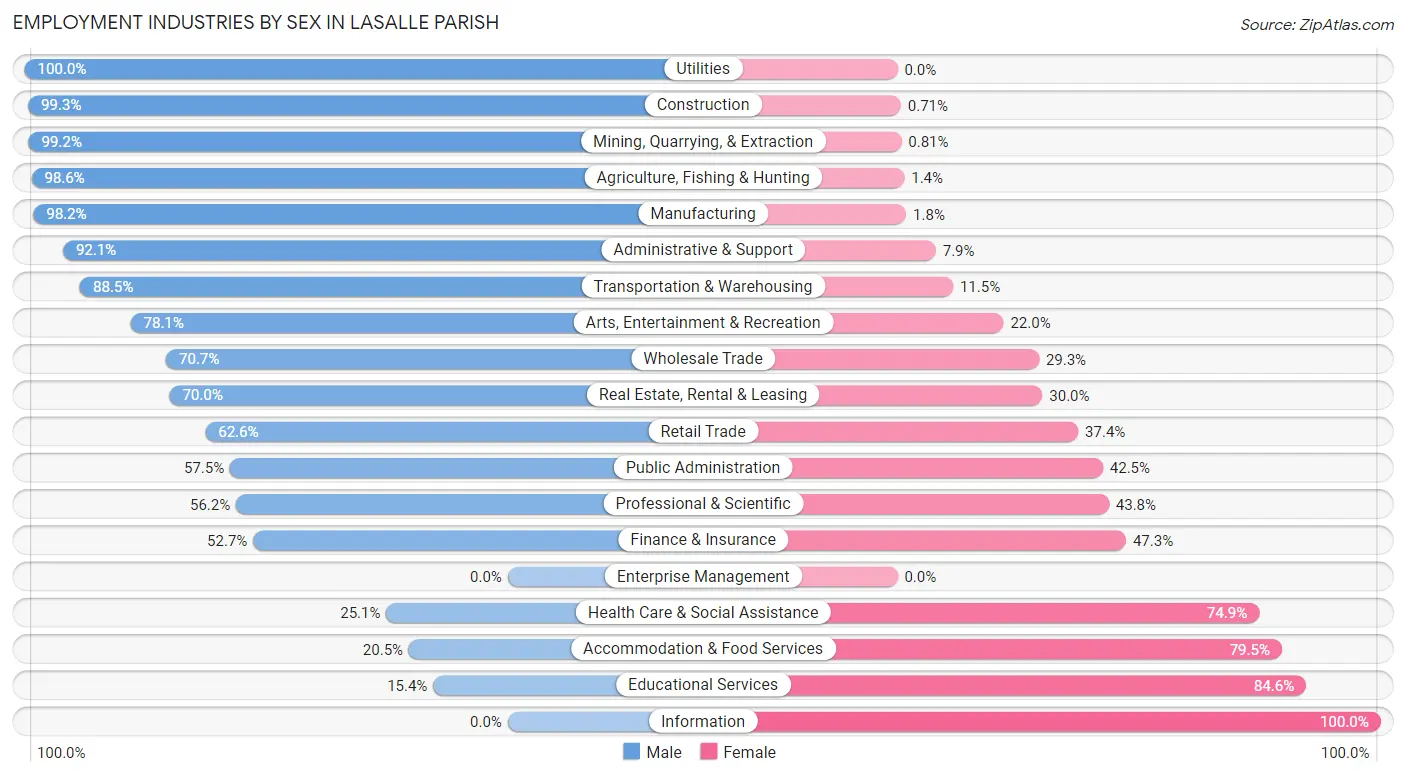
Employment Industries by Sex in LaSalle Parish
The LaSalle Parish industries that see more men than women are Utilities (100.0%), Construction (99.3%), and Mining, Quarrying, & Extraction (99.2%), whereas the industries that tend to have a higher number of women are Information (100.0%), Educational Services (84.6%), and Accommodation & Food Services (79.5%).
| Industry | Male | Female |
| Agriculture, Fishing & Hunting | 278 (98.6%) | 4 (1.4%) |
| Mining, Quarrying, & Extraction | 732 (99.2%) | 6 (0.8%) |
| Construction | 563 (99.3%) | 4 (0.7%) |
| Manufacturing | 272 (98.2%) | 5 (1.8%) |
| Wholesale Trade | 99 (70.7%) | 41 (29.3%) |
| Retail Trade | 435 (62.6%) | 260 (37.4%) |
| Transportation & Warehousing | 254 (88.5%) | 33 (11.5%) |
| Utilities | 20 (100.0%) | 0 (0.0%) |
| Information | 0 (0.0%) | 2 (100.0%) |
| Finance & Insurance | 88 (52.7%) | 79 (47.3%) |
| Real Estate, Rental & Leasing | 7 (70.0%) | 3 (30.0%) |
| Professional & Scientific | 149 (56.2%) | 116 (43.8%) |
| Enterprise Management | 0 (0.0%) | 0 (0.0%) |
| Administrative & Support | 116 (92.1%) | 10 (7.9%) |
| Educational Services | 96 (15.4%) | 526 (84.6%) |
| Health Care & Social Assistance | 318 (25.1%) | 947 (74.9%) |
| Arts, Entertainment & Recreation | 64 (78.0%) | 18 (22.0%) |
| Accommodation & Food Services | 71 (20.5%) | 276 (79.5%) |
| Public Administration | 146 (57.5%) | 108 (42.5%) |
| Total | 3,788 (59.1%) | 2,619 (40.9%) |
Education in LaSalle Parish
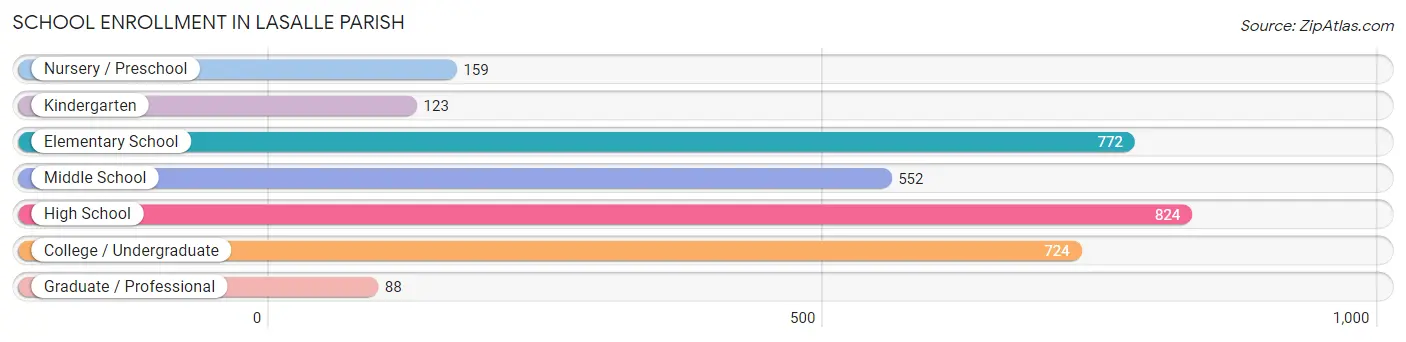
School Enrollment in LaSalle Parish
The most common levels of schooling among the 3,242 students in LaSalle Parish are high school (824 | 25.4%), elementary school (772 | 23.8%), and college / undergraduate (724 | 22.3%).
| School Level | # Students | % Students |
| Nursery / Preschool | 159 | 4.9% |
| Kindergarten | 123 | 3.8% |
| Elementary School | 772 | 23.8% |
| Middle School | 552 | 17.0% |
| High School | 824 | 25.4% |
| College / Undergraduate | 724 | 22.3% |
| Graduate / Professional | 88 | 2.7% |
| Total | 3,242 | 100.0% |
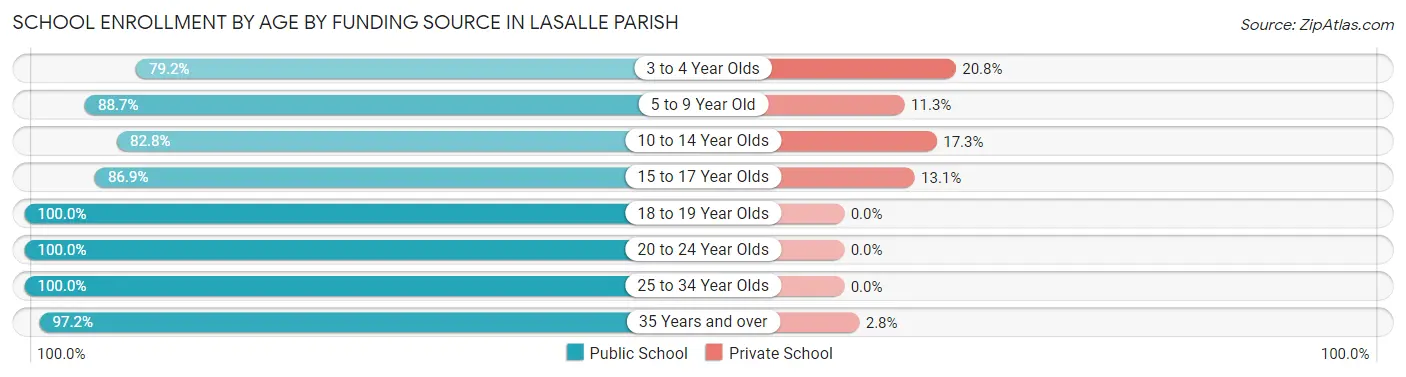
School Enrollment by Age by Funding Source in LaSalle Parish
Out of a total of 3,242 students who are enrolled in schools in LaSalle Parish, 347 (10.7%) attend a private institution, while the remaining 2,895 (89.3%) are enrolled in public schools. The age group of 3 to 4 year olds has the highest likelihood of being enrolled in private schools, with 21 (20.8% in the age bracket) enrolled. Conversely, the age group of 18 to 19 year olds has the lowest likelihood of being enrolled in a private school, with 296 (100.0% in the age bracket) attending a public institution.
| Age Bracket | Public School | Private School |
| 3 to 4 Year Olds | 80 (79.2%) | 21 (20.8%) |
| 5 to 9 Year Old | 764 (88.7%) | 97 (11.3%) |
| 10 to 14 Year Olds | 715 (82.8%) | 149 (17.2%) |
| 15 to 17 Year Olds | 490 (86.9%) | 74 (13.1%) |
| 18 to 19 Year Olds | 296 (100.0%) | 0 (0.0%) |
| 20 to 24 Year Olds | 167 (100.0%) | 0 (0.0%) |
| 25 to 34 Year Olds | 211 (100.0%) | 0 (0.0%) |
| 35 Years and over | 173 (97.2%) | 5 (2.8%) |
| Total | 2,895 (89.3%) | 347 (10.7%) |
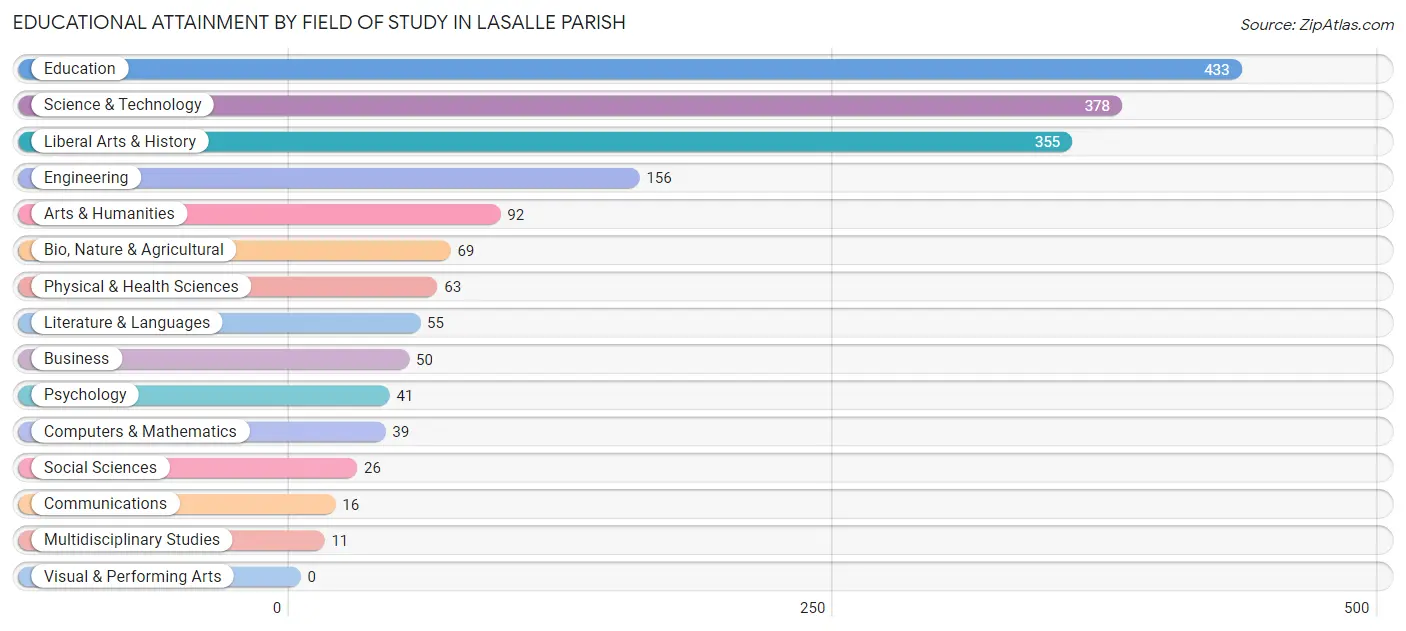
Educational Attainment by Field of Study in LaSalle Parish
Education (433 | 24.3%), science & technology (378 | 21.2%), liberal arts & history (355 | 19.9%), engineering (156 | 8.7%), and arts & humanities (92 | 5.2%) are the most common fields of study among 1,784 individuals in LaSalle Parish who have obtained a bachelor's degree or higher.
| Field of Study | # Graduates | % Graduates |
| Computers & Mathematics | 39 | 2.2% |
| Bio, Nature & Agricultural | 69 | 3.9% |
| Physical & Health Sciences | 63 | 3.5% |
| Psychology | 41 | 2.3% |
| Social Sciences | 26 | 1.5% |
| Engineering | 156 | 8.7% |
| Multidisciplinary Studies | 11 | 0.6% |
| Science & Technology | 378 | 21.2% |
| Business | 50 | 2.8% |
| Education | 433 | 24.3% |
| Literature & Languages | 55 | 3.1% |
| Liberal Arts & History | 355 | 19.9% |
| Visual & Performing Arts | 0 | 0.0% |
| Communications | 16 | 0.9% |
| Arts & Humanities | 92 | 5.2% |
| Total | 1,784 | 100.0% |
Transportation & Commute in LaSalle Parish
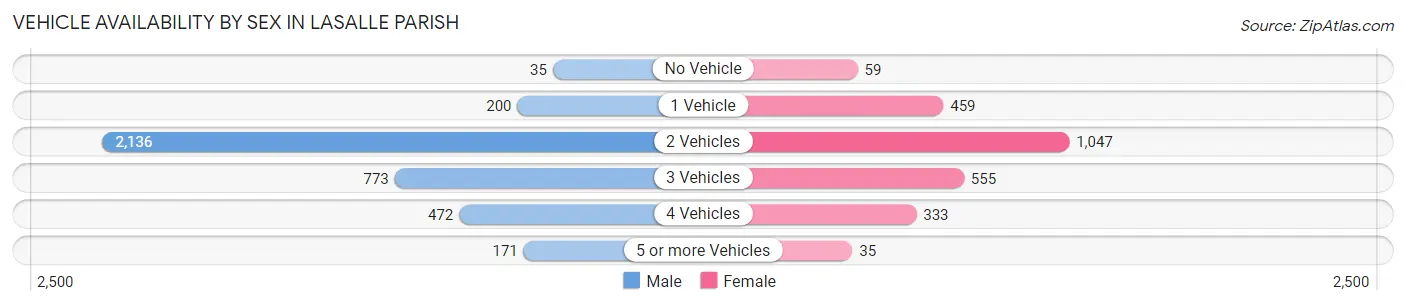
Vehicle Availability by Sex in LaSalle Parish
The most prevalent vehicle ownership categories in LaSalle Parish are males with 2 vehicles (2,136, accounting for 56.4%) and females with 2 vehicles (1,047, making up 85.9%).
| Vehicles Available | Male | Female |
| No Vehicle | 35 (0.9%) | 59 (2.4%) |
| 1 Vehicle | 200 (5.3%) | 459 (18.4%) |
| 2 Vehicles | 2,136 (56.4%) | 1,047 (42.1%) |
| 3 Vehicles | 773 (20.4%) | 555 (22.3%) |
| 4 Vehicles | 472 (12.5%) | 333 (13.4%) |
| 5 or more Vehicles | 171 (4.5%) | 35 (1.4%) |
| Total | 3,787 (100.0%) | 2,488 (100.0%) |
Commute Time in LaSalle Parish
The most frequently occuring commute durations in LaSalle Parish are 5 to 9 minutes (1,255 commuters, 20.4%), 45 to 59 minutes (1,160 commuters, 18.9%), and 10 to 14 minutes (1,052 commuters, 17.1%).
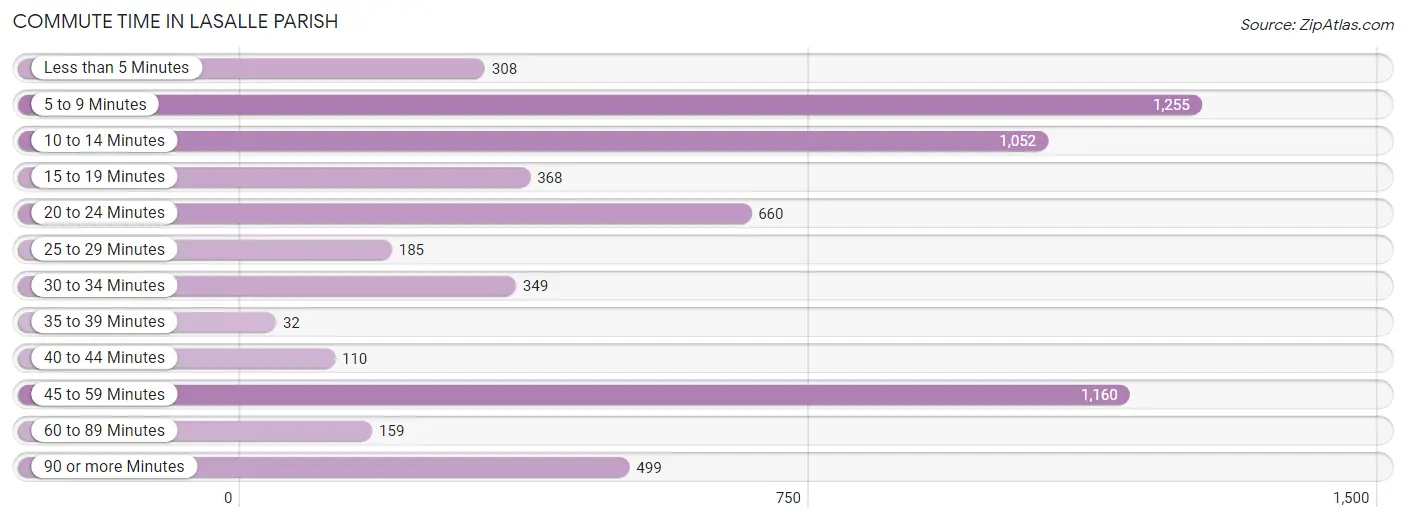
| Commute Time | # Commuters | % Commuters |
| Less than 5 Minutes | 308 | 5.0% |
| 5 to 9 Minutes | 1,255 | 20.4% |
| 10 to 14 Minutes | 1,052 | 17.1% |
| 15 to 19 Minutes | 368 | 6.0% |
| 20 to 24 Minutes | 660 | 10.7% |
| 25 to 29 Minutes | 185 | 3.0% |
| 30 to 34 Minutes | 349 | 5.7% |
| 35 to 39 Minutes | 32 | 0.5% |
| 40 to 44 Minutes | 110 | 1.8% |
| 45 to 59 Minutes | 1,160 | 18.9% |
| 60 to 89 Minutes | 159 | 2.6% |
| 90 or more Minutes | 499 | 8.1% |
Commute Time by Sex in LaSalle Parish
The most common commute times in LaSalle Parish are 45 to 59 minutes (849 commuters, 22.8%) for males and 5 to 9 minutes (717 commuters, 29.8%) for females.
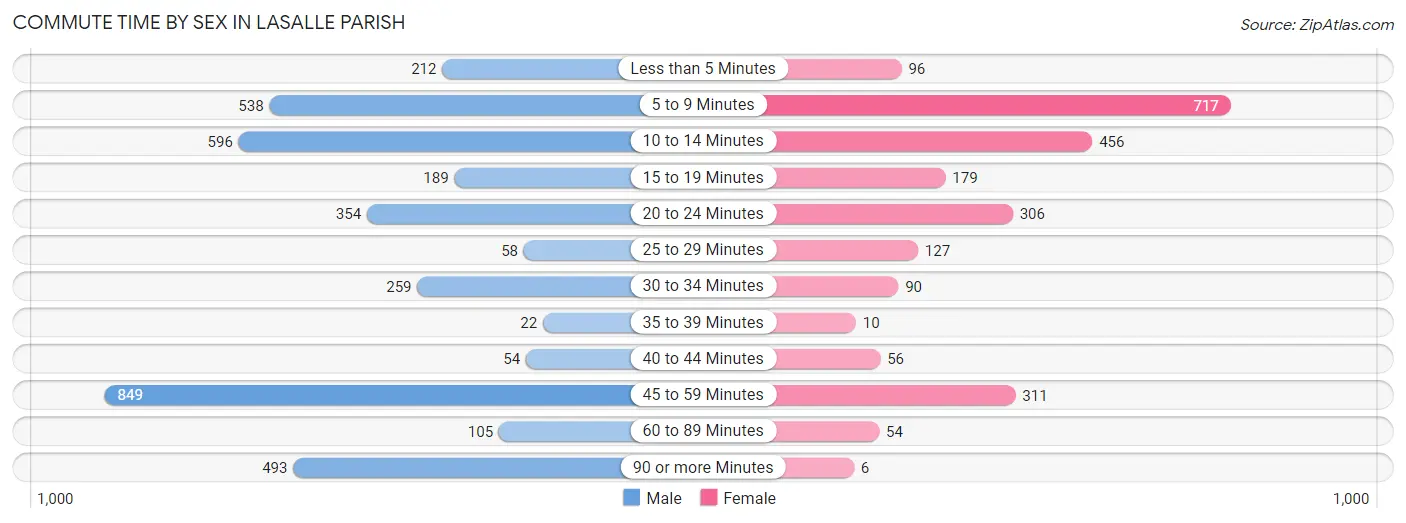
| Commute Time | Male | Female |
| Less than 5 Minutes | 212 (5.7%) | 96 (4.0%) |
| 5 to 9 Minutes | 538 (14.4%) | 717 (29.8%) |
| 10 to 14 Minutes | 596 (16.0%) | 456 (18.9%) |
| 15 to 19 Minutes | 189 (5.1%) | 179 (7.4%) |
| 20 to 24 Minutes | 354 (9.5%) | 306 (12.7%) |
| 25 to 29 Minutes | 58 (1.6%) | 127 (5.3%) |
| 30 to 34 Minutes | 259 (7.0%) | 90 (3.7%) |
| 35 to 39 Minutes | 22 (0.6%) | 10 (0.4%) |
| 40 to 44 Minutes | 54 (1.5%) | 56 (2.3%) |
| 45 to 59 Minutes | 849 (22.8%) | 311 (12.9%) |
| 60 to 89 Minutes | 105 (2.8%) | 54 (2.2%) |
| 90 or more Minutes | 493 (13.2%) | 6 (0.3%) |
Time of Departure to Work by Sex in LaSalle Parish
The most frequent times of departure to work in LaSalle Parish are 6:00 AM to 6:29 AM (610, 16.4%) for males and 7:30 AM to 7:59 AM (531, 22.1%) for females.
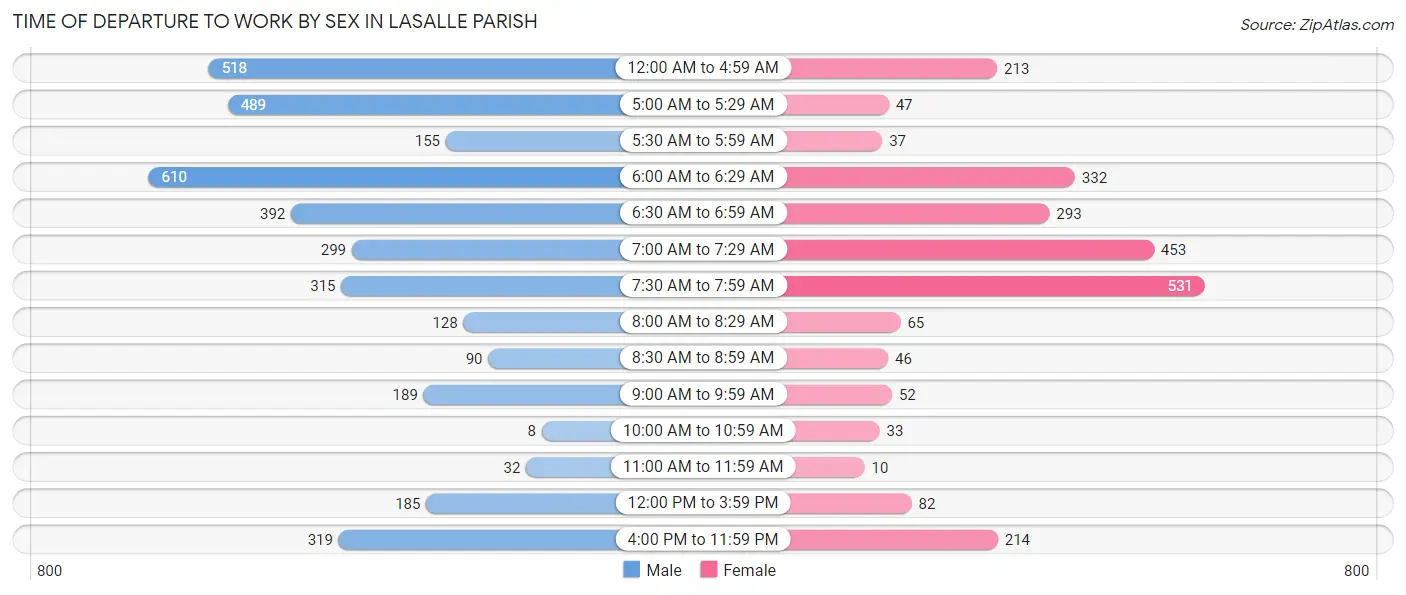
| Time of Departure | Male | Female |
| 12:00 AM to 4:59 AM | 518 (13.9%) | 213 (8.8%) |
| 5:00 AM to 5:29 AM | 489 (13.1%) | 47 (1.9%) |
| 5:30 AM to 5:59 AM | 155 (4.2%) | 37 (1.5%) |
| 6:00 AM to 6:29 AM | 610 (16.4%) | 332 (13.8%) |
| 6:30 AM to 6:59 AM | 392 (10.5%) | 293 (12.2%) |
| 7:00 AM to 7:29 AM | 299 (8.0%) | 453 (18.8%) |
| 7:30 AM to 7:59 AM | 315 (8.5%) | 531 (22.1%) |
| 8:00 AM to 8:29 AM | 128 (3.4%) | 65 (2.7%) |
| 8:30 AM to 8:59 AM | 90 (2.4%) | 46 (1.9%) |
| 9:00 AM to 9:59 AM | 189 (5.1%) | 52 (2.2%) |
| 10:00 AM to 10:59 AM | 8 (0.2%) | 33 (1.4%) |
| 11:00 AM to 11:59 AM | 32 (0.9%) | 10 (0.4%) |
| 12:00 PM to 3:59 PM | 185 (5.0%) | 82 (3.4%) |
| 4:00 PM to 11:59 PM | 319 (8.6%) | 214 (8.9%) |
| Total | 3,729 (100.0%) | 2,408 (100.0%) |
Housing Occupancy in LaSalle Parish
Occupancy by Ownership in LaSalle Parish
Of the total 4,665 dwellings in LaSalle Parish, owner-occupied units account for 3,875 (83.1%), while renter-occupied units make up 790 (16.9%).
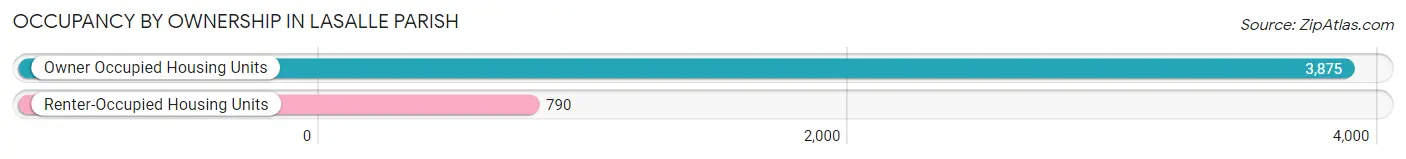
| Occupancy | # Housing Units | % Housing Units |
| Owner Occupied Housing Units | 3,875 | 83.1% |
| Renter-Occupied Housing Units | 790 | 16.9% |
| Total Occupied Housing Units | 4,665 | 100.0% |
Occupancy by Household Size in LaSalle Parish
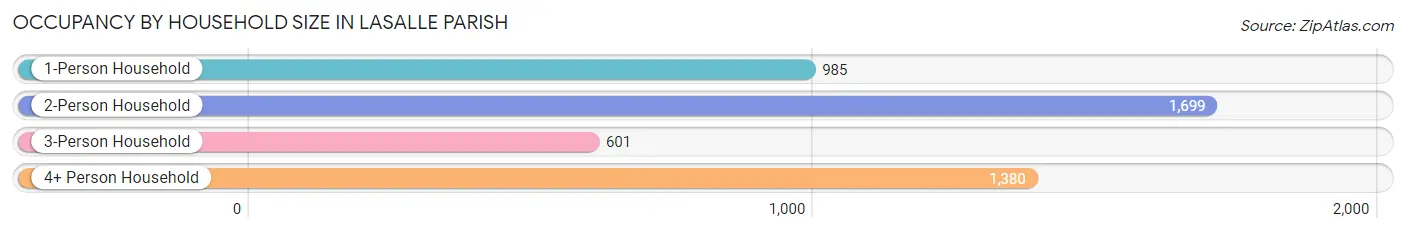
| Household Size | # Housing Units | % Housing Units |
| 1-Person Household | 985 | 21.1% |
| 2-Person Household | 1,699 | 36.4% |
| 3-Person Household | 601 | 12.9% |
| 4+ Person Household | 1,380 | 29.6% |
| Total Housing Units | 4,665 | 100.0% |
Occupancy by Ownership by Household Size in LaSalle Parish
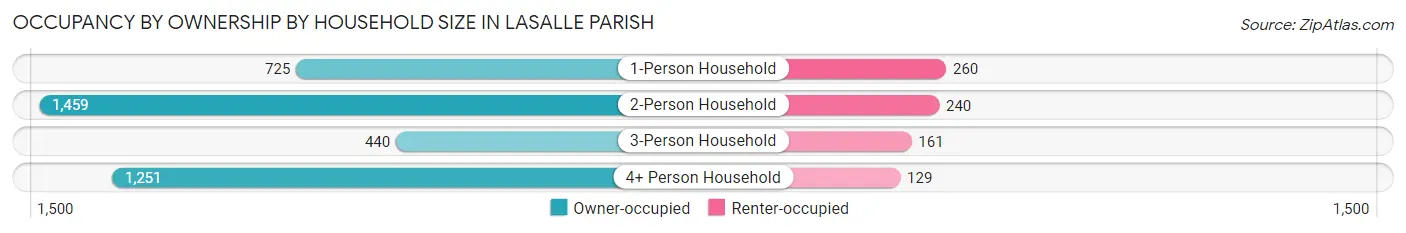
| Household Size | Owner-occupied | Renter-occupied |
| 1-Person Household | 725 (73.6%) | 260 (26.4%) |
| 2-Person Household | 1,459 (85.9%) | 240 (14.1%) |
| 3-Person Household | 440 (73.2%) | 161 (26.8%) |
| 4+ Person Household | 1,251 (90.6%) | 129 (9.3%) |
| Total Housing Units | 3,875 (83.1%) | 790 (16.9%) |
Occupancy by Educational Attainment in LaSalle Parish
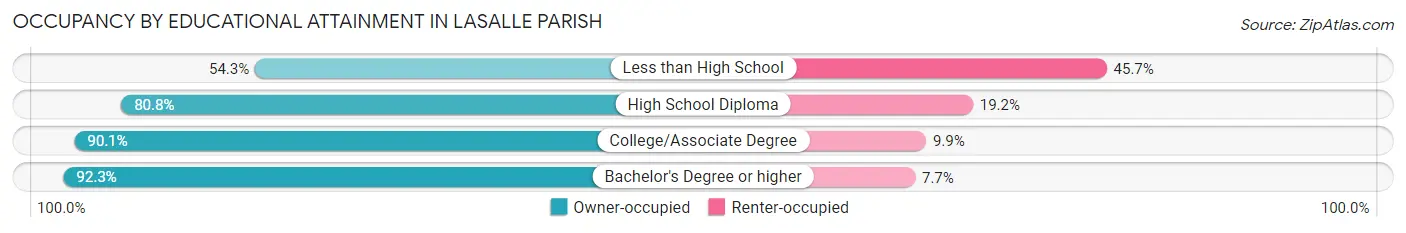
| Household Size | Owner-occupied | Renter-occupied |
| Less than High School | 271 (54.3%) | 228 (45.7%) |
| High School Diploma | 1,506 (80.8%) | 357 (19.2%) |
| College/Associate Degree | 1,151 (90.1%) | 126 (9.9%) |
| Bachelor's Degree or higher | 947 (92.3%) | 79 (7.7%) |
Occupancy by Age of Householder in LaSalle Parish
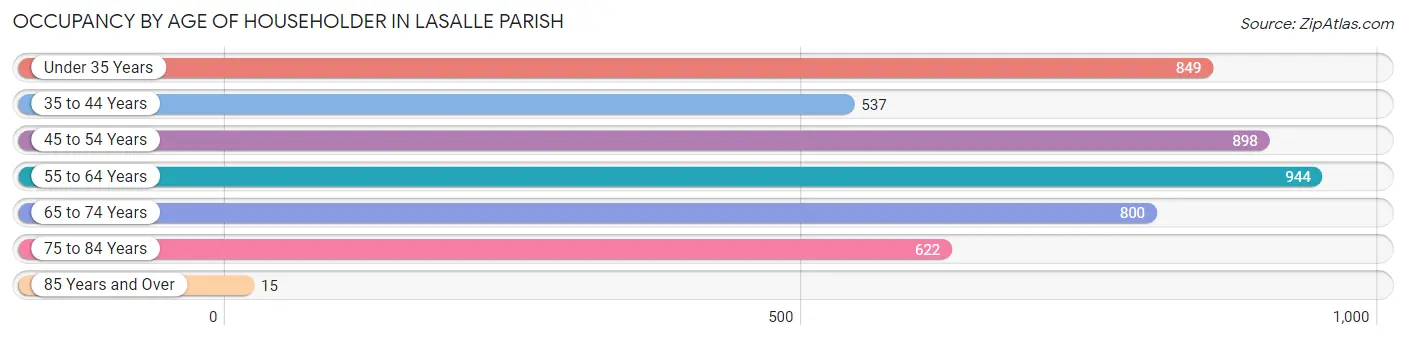
| Age Bracket | # Households | % Households |
| Under 35 Years | 849 | 18.2% |
| 35 to 44 Years | 537 | 11.5% |
| 45 to 54 Years | 898 | 19.3% |
| 55 to 64 Years | 944 | 20.2% |
| 65 to 74 Years | 800 | 17.2% |
| 75 to 84 Years | 622 | 13.3% |
| 85 Years and Over | 15 | 0.3% |
| Total | 4,665 | 100.0% |
Housing Finances in LaSalle Parish
Median Income by Occupancy in LaSalle Parish
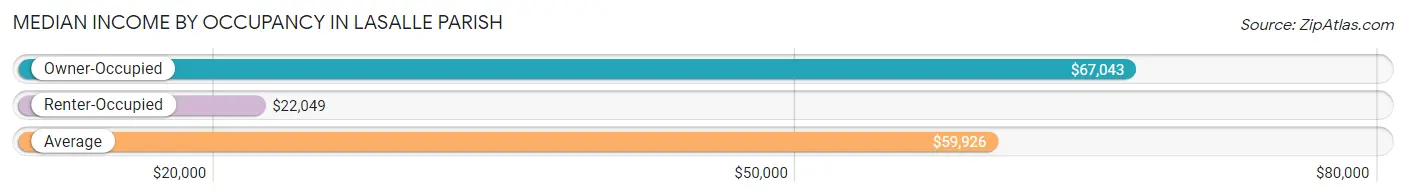
| Occupancy Type | # Households | Median Income |
| Owner-Occupied | 3,875 (83.1%) | $67,043 |
| Renter-Occupied | 790 (16.9%) | $22,049 |
| Average | 4,665 (100.0%) | $59,926 |
Occupancy by Householder Income Bracket in LaSalle Parish
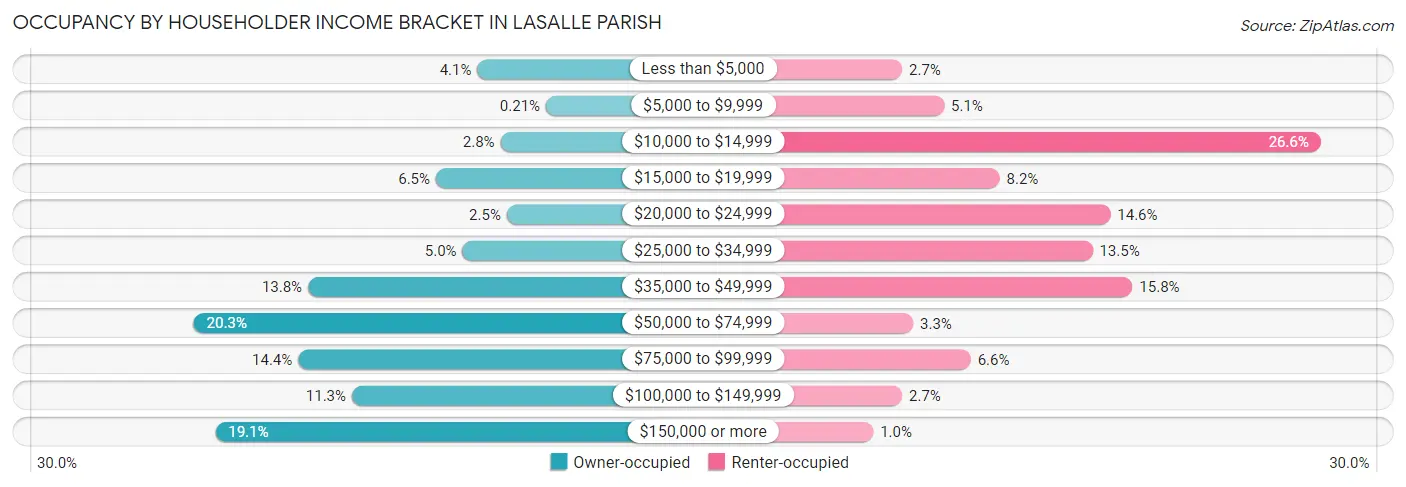
| Income Bracket | Owner-occupied | Renter-occupied |
| Less than $5,000 | 160 (4.1%) | 21 (2.7%) |
| $5,000 to $9,999 | 8 (0.2%) | 40 (5.1%) |
| $10,000 to $14,999 | 109 (2.8%) | 210 (26.6%) |
| $15,000 to $19,999 | 252 (6.5%) | 65 (8.2%) |
| $20,000 to $24,999 | 95 (2.5%) | 115 (14.6%) |
| $25,000 to $34,999 | 193 (5.0%) | 107 (13.5%) |
| $35,000 to $49,999 | 535 (13.8%) | 125 (15.8%) |
| $50,000 to $74,999 | 788 (20.3%) | 26 (3.3%) |
| $75,000 to $99,999 | 557 (14.4%) | 52 (6.6%) |
| $100,000 to $149,999 | 438 (11.3%) | 21 (2.7%) |
| $150,000 or more | 740 (19.1%) | 8 (1.0%) |
| Total | 3,875 (100.0%) | 790 (100.0%) |
Monthly Housing Cost Tiers in LaSalle Parish
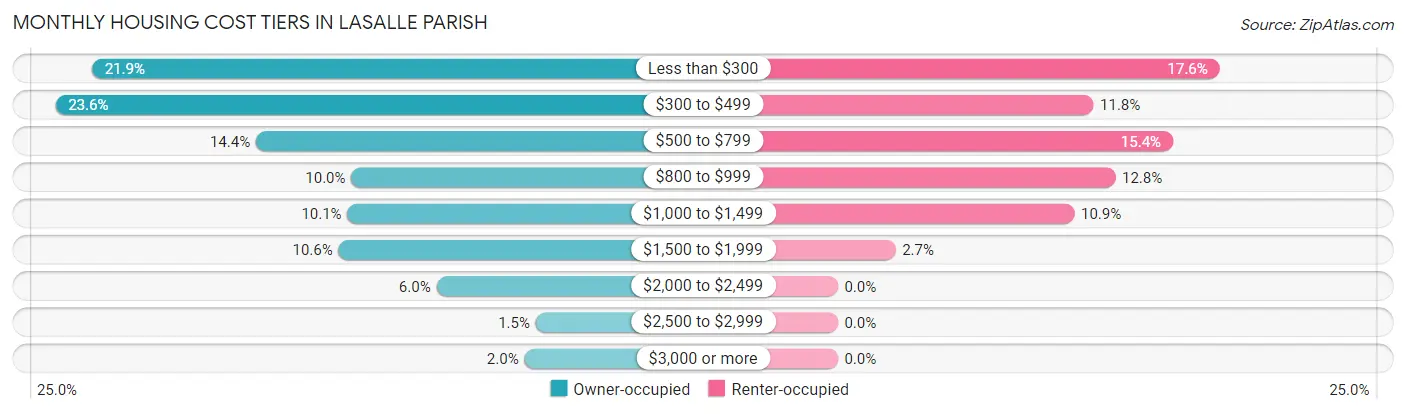
| Monthly Cost | Owner-occupied | Renter-occupied |
| Less than $300 | 849 (21.9%) | 139 (17.6%) |
| $300 to $499 | 914 (23.6%) | 93 (11.8%) |
| $500 to $799 | 556 (14.3%) | 122 (15.4%) |
| $800 to $999 | 386 (10.0%) | 101 (12.8%) |
| $1,000 to $1,499 | 393 (10.1%) | 86 (10.9%) |
| $1,500 to $1,999 | 409 (10.5%) | 21 (2.7%) |
| $2,000 to $2,499 | 234 (6.0%) | 0 (0.0%) |
| $2,500 to $2,999 | 57 (1.5%) | 0 (0.0%) |
| $3,000 or more | 77 (2.0%) | 0 (0.0%) |
| Total | 3,875 (100.0%) | 790 (100.0%) |
Physical Housing Characteristics in LaSalle Parish
Housing Structures in LaSalle Parish
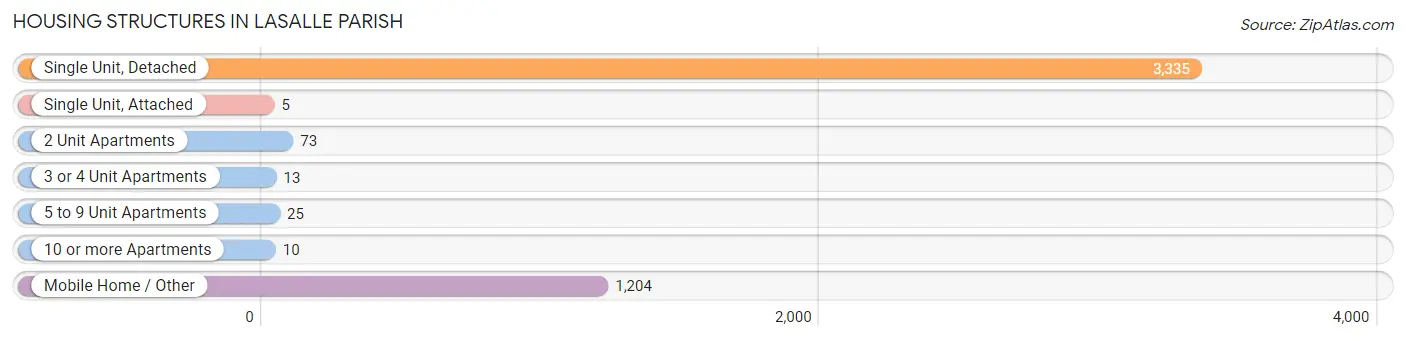
| Structure Type | # Housing Units | % Housing Units |
| Single Unit, Detached | 3,335 | 71.5% |
| Single Unit, Attached | 5 | 0.1% |
| 2 Unit Apartments | 73 | 1.6% |
| 3 or 4 Unit Apartments | 13 | 0.3% |
| 5 to 9 Unit Apartments | 25 | 0.5% |
| 10 or more Apartments | 10 | 0.2% |
| Mobile Home / Other | 1,204 | 25.8% |
| Total | 4,665 | 100.0% |
Housing Structures by Occupancy in LaSalle Parish
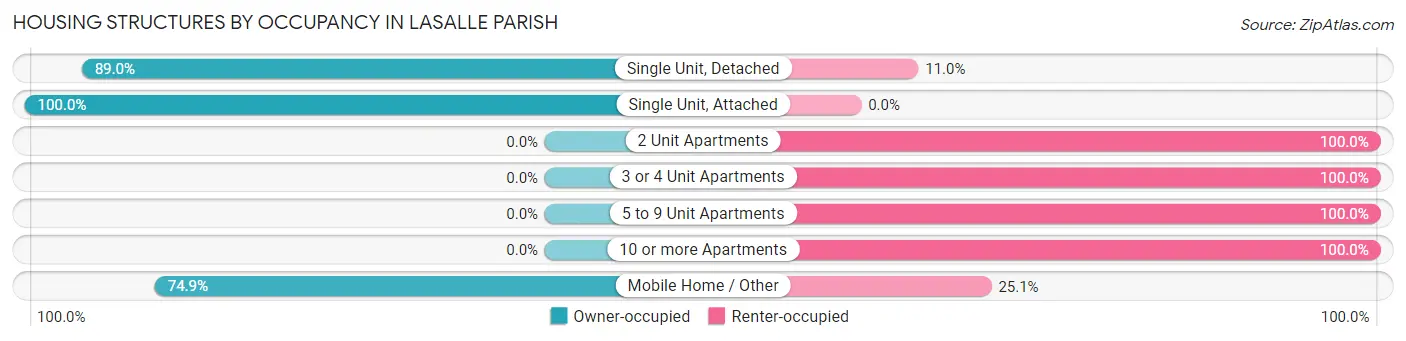
| Structure Type | Owner-occupied | Renter-occupied |
| Single Unit, Detached | 2,968 (89.0%) | 367 (11.0%) |
| Single Unit, Attached | 5 (100.0%) | 0 (0.0%) |
| 2 Unit Apartments | 0 (0.0%) | 73 (100.0%) |
| 3 or 4 Unit Apartments | 0 (0.0%) | 13 (100.0%) |
| 5 to 9 Unit Apartments | 0 (0.0%) | 25 (100.0%) |
| 10 or more Apartments | 0 (0.0%) | 10 (100.0%) |
| Mobile Home / Other | 902 (74.9%) | 302 (25.1%) |
| Total | 3,875 (83.1%) | 790 (16.9%) |
Housing Structures by Number of Rooms in LaSalle Parish
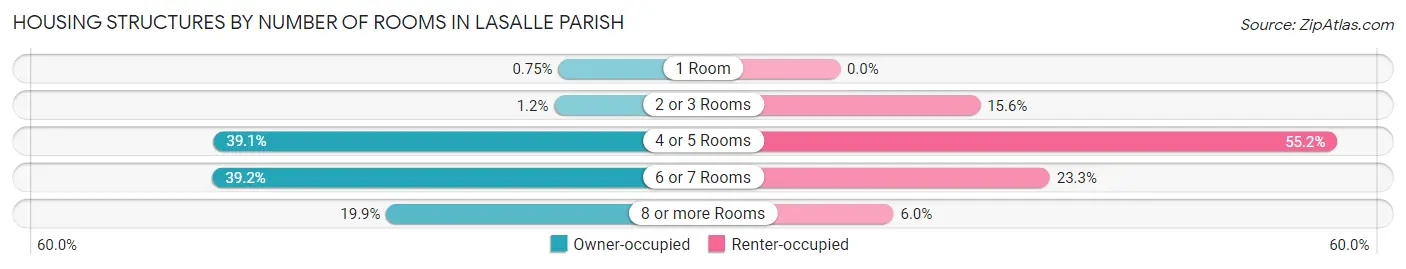
| Number of Rooms | Owner-occupied | Renter-occupied |
| 1 Room | 29 (0.7%) | 0 (0.0%) |
| 2 or 3 Rooms | 47 (1.2%) | 123 (15.6%) |
| 4 or 5 Rooms | 1,513 (39.1%) | 436 (55.2%) |
| 6 or 7 Rooms | 1,517 (39.2%) | 184 (23.3%) |
| 8 or more Rooms | 769 (19.9%) | 47 (5.9%) |
| Total | 3,875 (100.0%) | 790 (100.0%) |
Housing Structure by Heating Type in LaSalle Parish
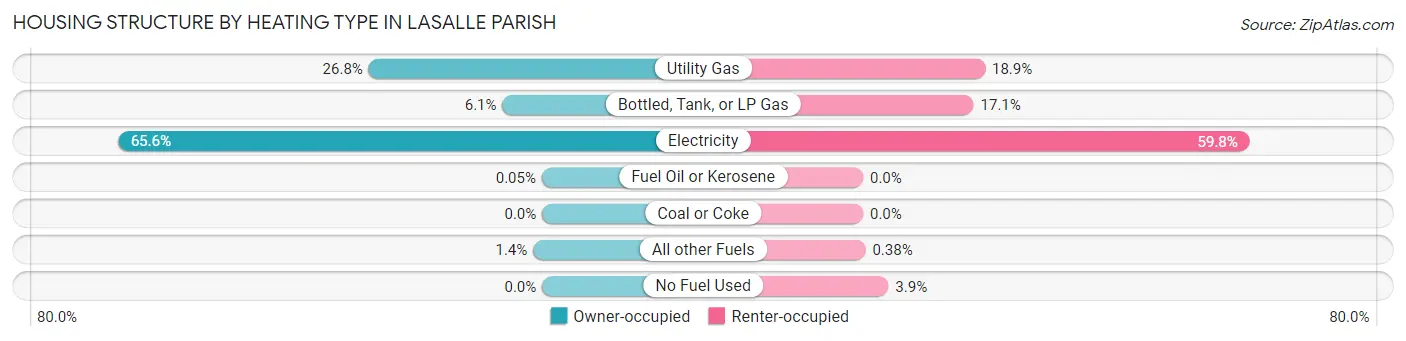
| Heating Type | Owner-occupied | Renter-occupied |
| Utility Gas | 1,039 (26.8%) | 149 (18.9%) |
| Bottled, Tank, or LP Gas | 238 (6.1%) | 135 (17.1%) |
| Electricity | 2,542 (65.6%) | 472 (59.8%) |
| Fuel Oil or Kerosene | 2 (0.1%) | 0 (0.0%) |
| Coal or Coke | 0 (0.0%) | 0 (0.0%) |
| All other Fuels | 54 (1.4%) | 3 (0.4%) |
| No Fuel Used | 0 (0.0%) | 31 (3.9%) |
| Total | 3,875 (100.0%) | 790 (100.0%) |
Household Vehicle Usage in LaSalle Parish
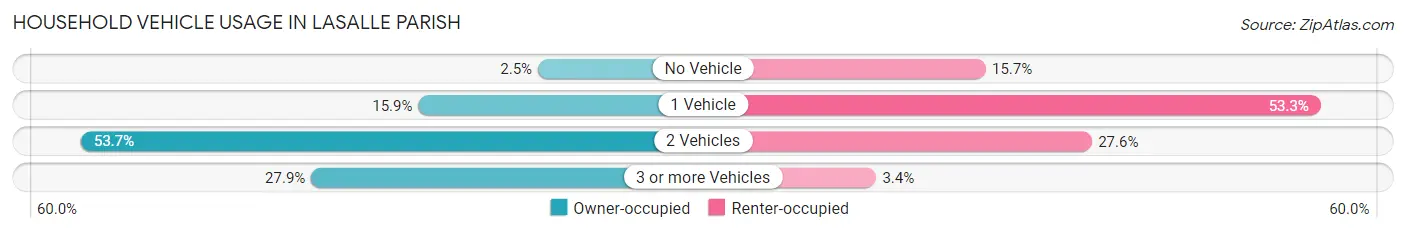
| Vehicles per Household | Owner-occupied | Renter-occupied |
| No Vehicle | 97 (2.5%) | 124 (15.7%) |
| 1 Vehicle | 616 (15.9%) | 421 (53.3%) |
| 2 Vehicles | 2,081 (53.7%) | 218 (27.6%) |
| 3 or more Vehicles | 1,081 (27.9%) | 27 (3.4%) |
| Total | 3,875 (100.0%) | 790 (100.0%) |
Real Estate & Mortgages in LaSalle Parish
Real Estate and Mortgage Overview in LaSalle Parish
| Characteristic | Without Mortgage | With Mortgage |
| Housing Units | 2,039 | 1,836 |
| Median Property Value | $83,000 | $166,900 |
| Median Household Income | $48,415 | $558 |
| Monthly Housing Costs | $339 | $77 |
| Real Estate Taxes | $480 | $787 |
Property Value by Mortgage Status in LaSalle Parish
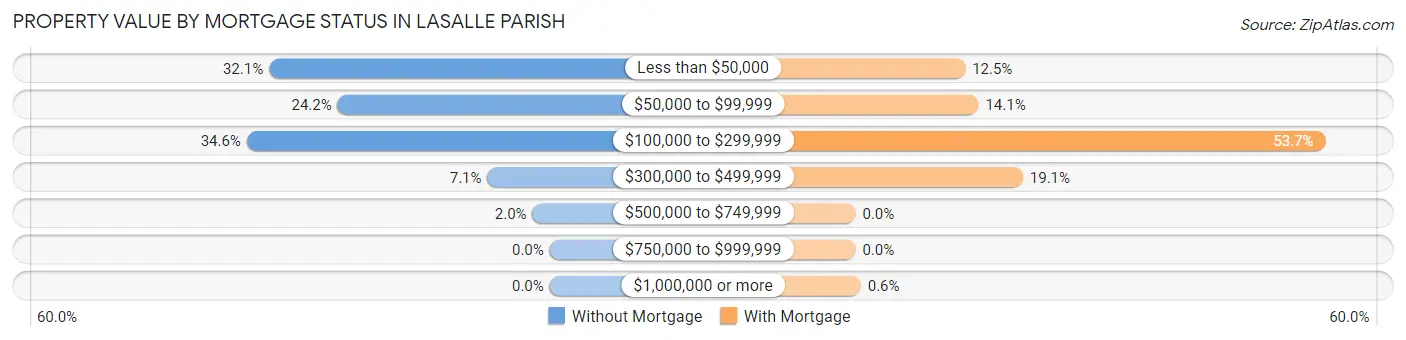
| Property Value | Without Mortgage | With Mortgage |
| Less than $50,000 | 654 (32.1%) | 230 (12.5%) |
| $50,000 to $99,999 | 494 (24.2%) | 258 (14.1%) |
| $100,000 to $299,999 | 706 (34.6%) | 986 (53.7%) |
| $300,000 to $499,999 | 145 (7.1%) | 351 (19.1%) |
| $500,000 to $749,999 | 40 (2.0%) | 0 (0.0%) |
| $750,000 to $999,999 | 0 (0.0%) | 0 (0.0%) |
| $1,000,000 or more | 0 (0.0%) | 11 (0.6%) |
| Total | 2,039 (100.0%) | 1,836 (100.0%) |
Household Income by Mortgage Status in LaSalle Parish
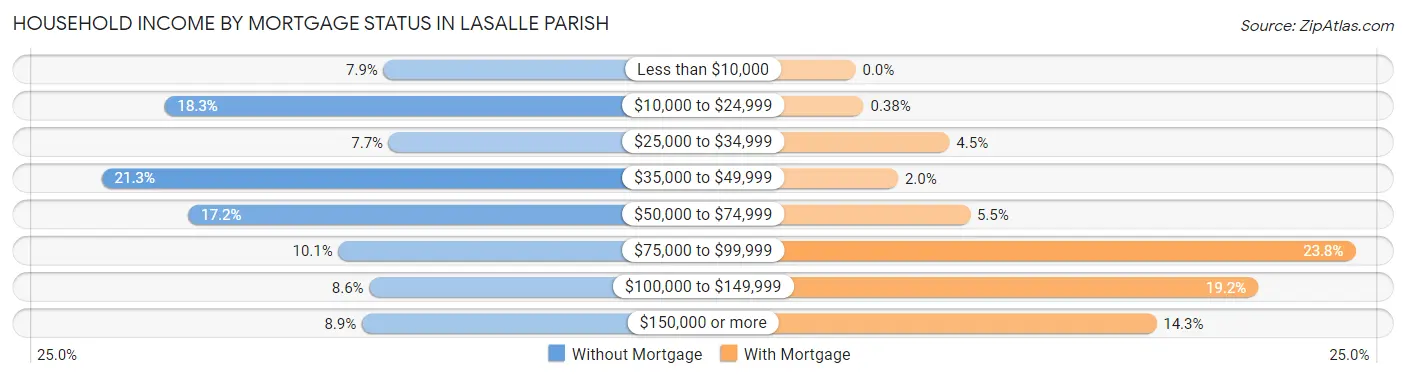
| Household Income | Without Mortgage | With Mortgage |
| Less than $10,000 | 161 (7.9%) | 0 (0.0%) |
| $10,000 to $24,999 | 374 (18.3%) | 7 (0.4%) |
| $25,000 to $34,999 | 156 (7.6%) | 82 (4.5%) |
| $35,000 to $49,999 | 435 (21.3%) | 37 (2.0%) |
| $50,000 to $74,999 | 351 (17.2%) | 100 (5.4%) |
| $75,000 to $99,999 | 205 (10.1%) | 437 (23.8%) |
| $100,000 to $149,999 | 175 (8.6%) | 352 (19.2%) |
| $150,000 or more | 182 (8.9%) | 263 (14.3%) |
| Total | 2,039 (100.0%) | 1,836 (100.0%) |
Property Value to Household Income Ratio in LaSalle Parish
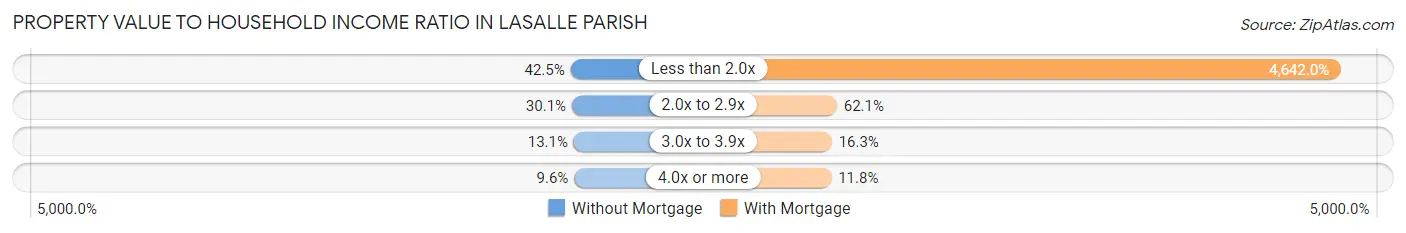
| Value-to-Income Ratio | Without Mortgage | With Mortgage |
| Less than 2.0x | 866 (42.5%) | 85,227 (4,642.0%) |
| 2.0x to 2.9x | 613 (30.1%) | 1,140 (62.1%) |
| 3.0x to 3.9x | 266 (13.1%) | 299 (16.3%) |
| 4.0x or more | 195 (9.6%) | 216 (11.8%) |
| Total | 2,039 (100.0%) | 1,836 (100.0%) |
Real Estate Taxes by Mortgage Status in LaSalle Parish
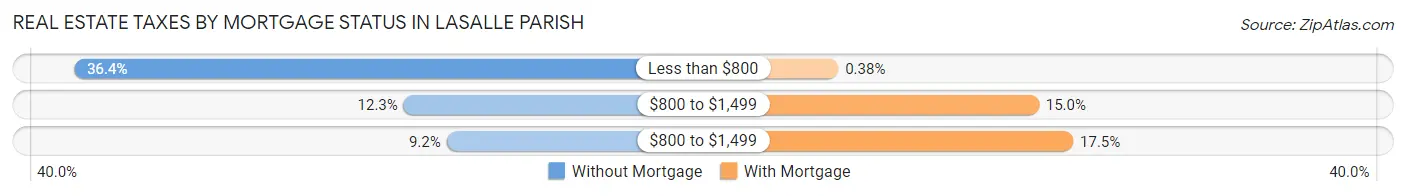
| Property Taxes | Without Mortgage | With Mortgage |
| Less than $800 | 742 (36.4%) | 7 (0.4%) |
| $800 to $1,499 | 251 (12.3%) | 276 (15.0%) |
| $800 to $1,499 | 187 (9.2%) | 322 (17.5%) |
| Total | 2,039 (100.0%) | 1,836 (100.0%) |
Health & Disability in LaSalle Parish
Health Insurance Coverage by Age in LaSalle Parish
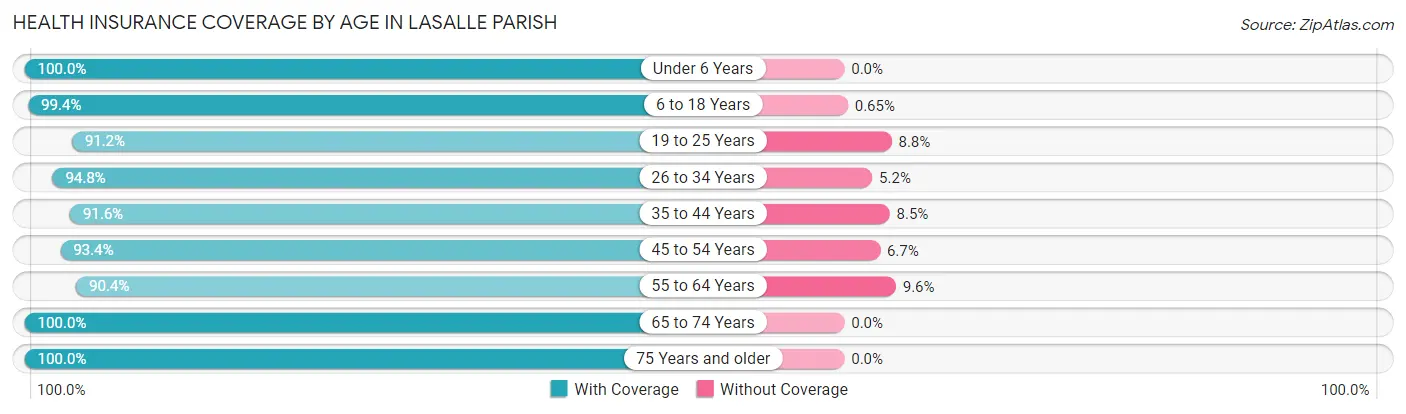
| Age Bracket | With Coverage | Without Coverage |
| Under 6 Years | 1,002 (100.0%) | 0 (0.0%) |
| 6 to 18 Years | 2,301 (99.4%) | 15 (0.6%) |
| 19 to 25 Years | 1,429 (91.2%) | 138 (8.8%) |
| 26 to 34 Years | 1,476 (94.8%) | 81 (5.2%) |
| 35 to 44 Years | 1,506 (91.5%) | 139 (8.5%) |
| 45 to 54 Years | 1,684 (93.3%) | 120 (6.7%) |
| 55 to 64 Years | 1,441 (90.4%) | 153 (9.6%) |
| 65 to 74 Years | 1,378 (100.0%) | 0 (0.0%) |
| 75 Years and older | 834 (100.0%) | 0 (0.0%) |
| Total | 13,051 (95.3%) | 646 (4.7%) |
Health Insurance Coverage by Citizenship Status in LaSalle Parish

| Citizenship Status | With Coverage | Without Coverage |
| Native Born | 1,002 (100.0%) | 0 (0.0%) |
| Foreign Born, Citizen | 2,301 (99.4%) | 15 (0.6%) |
| Foreign Born, not a Citizen | 1,429 (91.2%) | 138 (8.8%) |
Health Insurance Coverage by Household Income in LaSalle Parish
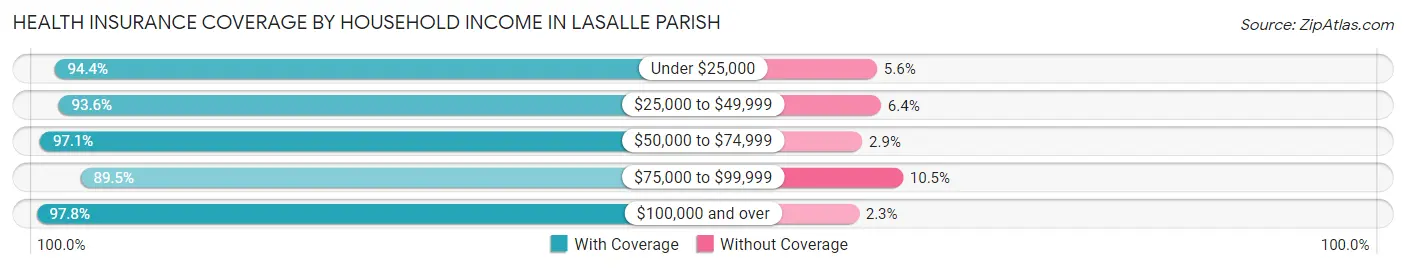
| Household Income | With Coverage | Without Coverage |
| Under $25,000 | 1,889 (94.4%) | 113 (5.6%) |
| $25,000 to $49,999 | 2,155 (93.6%) | 147 (6.4%) |
| $50,000 to $74,999 | 2,498 (97.1%) | 74 (2.9%) |
| $75,000 to $99,999 | 1,730 (89.5%) | 203 (10.5%) |
| $100,000 and over | 4,738 (97.8%) | 109 (2.2%) |
Public vs Private Health Insurance Coverage by Age in LaSalle Parish
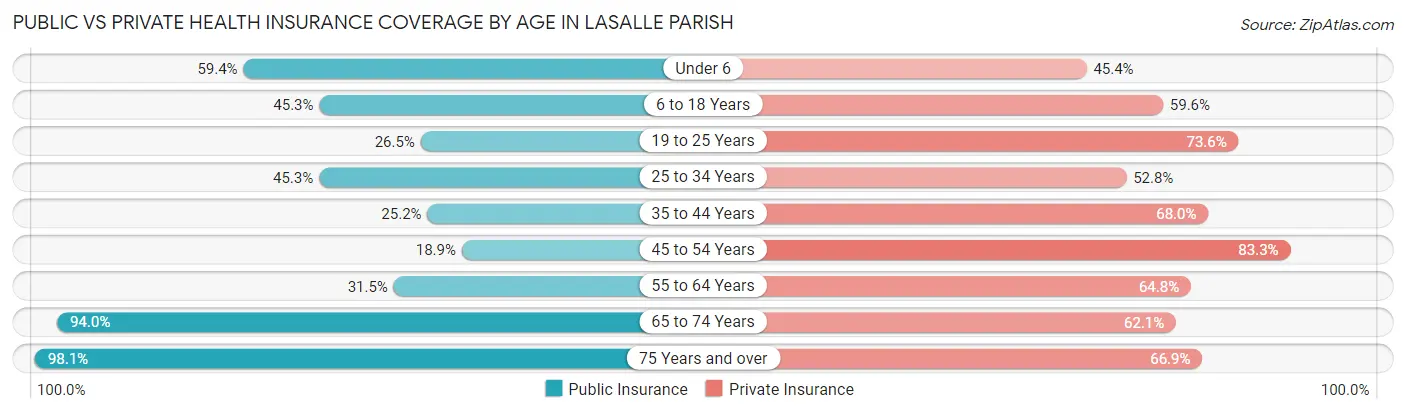
| Age Bracket | Public Insurance | Private Insurance |
| Under 6 | 595 (59.4%) | 455 (45.4%) |
| 6 to 18 Years | 1,049 (45.3%) | 1,380 (59.6%) |
| 19 to 25 Years | 415 (26.5%) | 1,154 (73.6%) |
| 25 to 34 Years | 706 (45.3%) | 822 (52.8%) |
| 35 to 44 Years | 415 (25.2%) | 1,119 (68.0%) |
| 45 to 54 Years | 340 (18.9%) | 1,502 (83.3%) |
| 55 to 64 Years | 502 (31.5%) | 1,033 (64.8%) |
| 65 to 74 Years | 1,295 (94.0%) | 855 (62.1%) |
| 75 Years and over | 818 (98.1%) | 558 (66.9%) |
| Total | 6,135 (44.8%) | 8,878 (64.8%) |
Disability Status by Sex by Age in LaSalle Parish
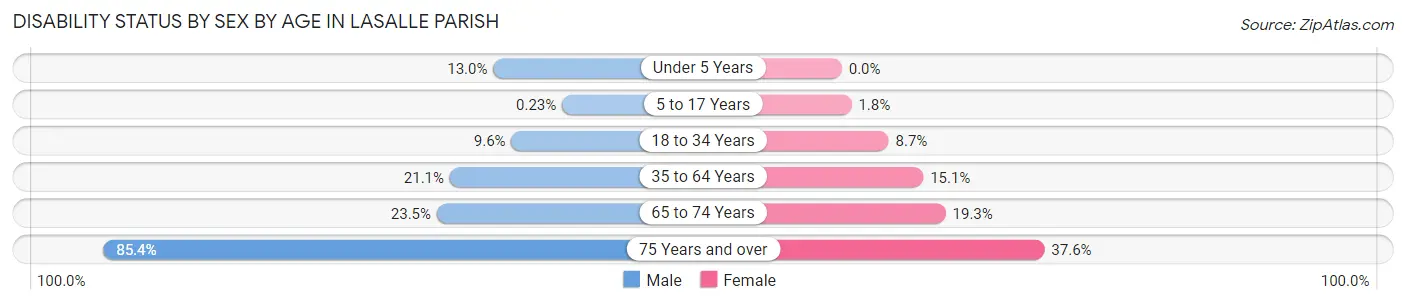
| Age Bracket | Male | Female |
| Under 5 Years | 54 (13.0%) | 0 (0.0%) |
| 5 to 17 Years | 3 (0.2%) | 20 (1.8%) |
| 18 to 34 Years | 178 (9.6%) | 120 (8.7%) |
| 35 to 64 Years | 545 (21.1%) | 371 (15.1%) |
| 65 to 74 Years | 131 (23.5%) | 158 (19.3%) |
| 75 Years and over | 333 (85.4%) | 167 (37.6%) |
Disability Class by Sex by Age in LaSalle Parish
Disability Class: Hearing Difficulty
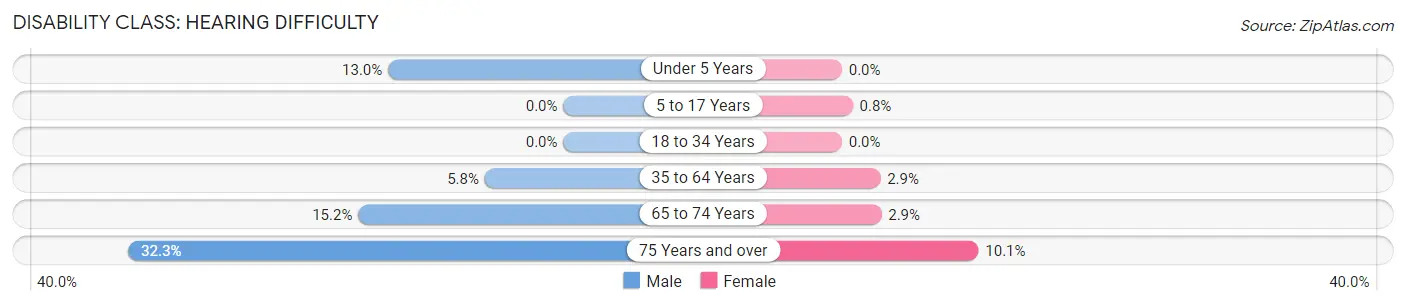
| Age Bracket | Male | Female |
| Under 5 Years | 54 (13.0%) | 0 (0.0%) |
| 5 to 17 Years | 0 (0.0%) | 9 (0.8%) |
| 18 to 34 Years | 0 (0.0%) | 0 (0.0%) |
| 35 to 64 Years | 151 (5.8%) | 70 (2.9%) |
| 65 to 74 Years | 85 (15.2%) | 24 (2.9%) |
| 75 Years and over | 126 (32.3%) | 45 (10.1%) |
Disability Class: Vision Difficulty
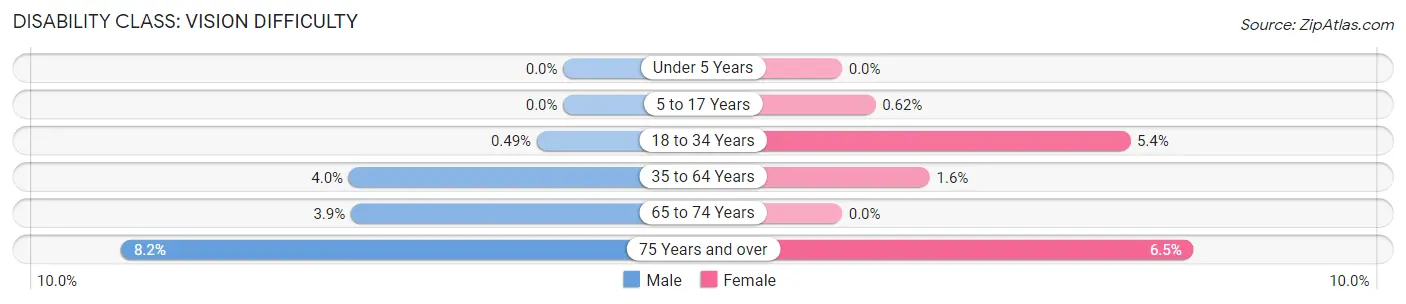
| Age Bracket | Male | Female |
| Under 5 Years | 0 (0.0%) | 0 (0.0%) |
| 5 to 17 Years | 0 (0.0%) | 7 (0.6%) |
| 18 to 34 Years | 9 (0.5%) | 74 (5.3%) |
| 35 to 64 Years | 103 (4.0%) | 40 (1.6%) |
| 65 to 74 Years | 22 (3.9%) | 0 (0.0%) |
| 75 Years and over | 32 (8.2%) | 29 (6.5%) |
Disability Class: Cognitive Difficulty
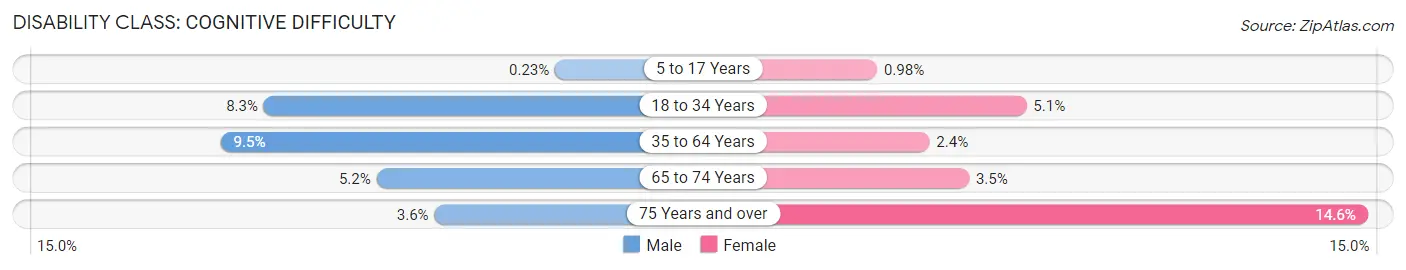
| Age Bracket | Male | Female |
| 5 to 17 Years | 3 (0.2%) | 11 (1.0%) |
| 18 to 34 Years | 154 (8.3%) | 71 (5.1%) |
| 35 to 64 Years | 247 (9.5%) | 60 (2.4%) |
| 65 to 74 Years | 29 (5.2%) | 29 (3.5%) |
| 75 Years and over | 14 (3.6%) | 65 (14.6%) |
Disability Class: Ambulatory Difficulty
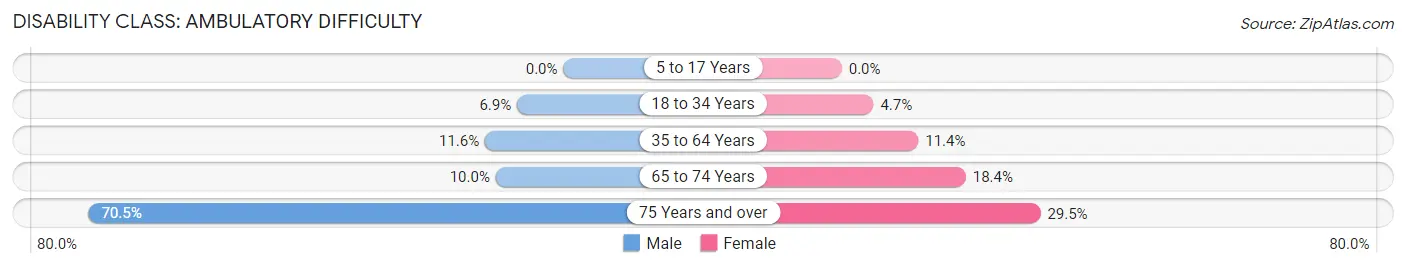
| Age Bracket | Male | Female |
| 5 to 17 Years | 0 (0.0%) | 0 (0.0%) |
| 18 to 34 Years | 127 (6.9%) | 65 (4.7%) |
| 35 to 64 Years | 301 (11.6%) | 279 (11.4%) |
| 65 to 74 Years | 56 (10.0%) | 151 (18.4%) |
| 75 Years and over | 275 (70.5%) | 131 (29.5%) |
Disability Class: Self-Care Difficulty
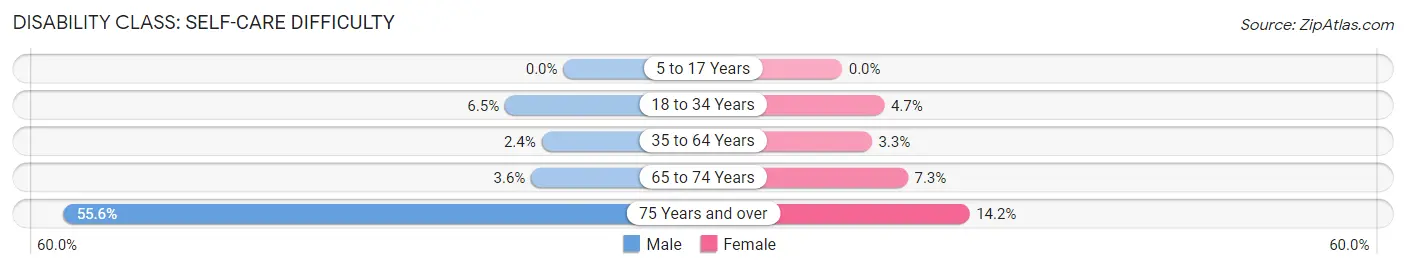
| Age Bracket | Male | Female |
| 5 to 17 Years | 0 (0.0%) | 0 (0.0%) |
| 18 to 34 Years | 120 (6.5%) | 65 (4.7%) |
| 35 to 64 Years | 63 (2.4%) | 81 (3.3%) |
| 65 to 74 Years | 20 (3.6%) | 60 (7.3%) |
| 75 Years and over | 217 (55.6%) | 63 (14.2%) |
Technology Access in LaSalle Parish
Computing Device Access in LaSalle Parish
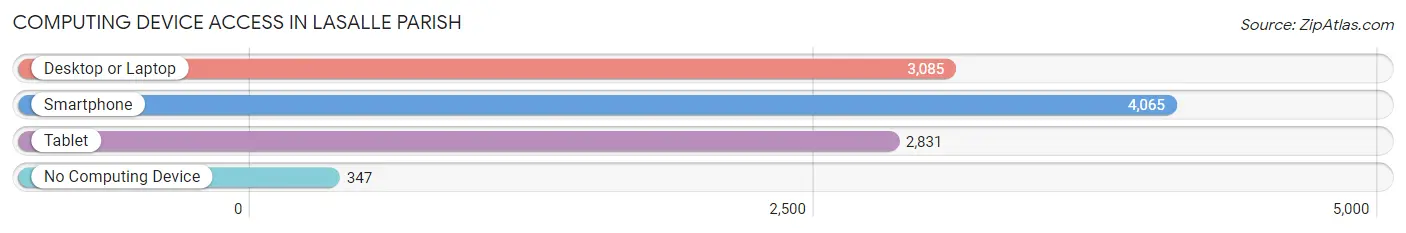
| Device Type | # Households | % Households |
| Desktop or Laptop | 3,085 | 66.1% |
| Smartphone | 4,065 | 87.1% |
| Tablet | 2,831 | 60.7% |
| No Computing Device | 347 | 7.4% |
| Total | 4,665 | 100.0% |
Internet Access in LaSalle Parish
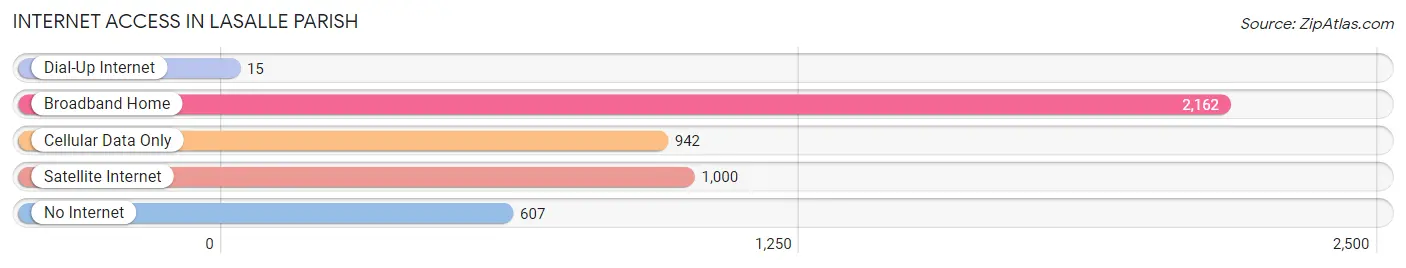
| Internet Type | # Households | % Households |
| Dial-Up Internet | 15 | 0.3% |
| Broadband Home | 2,162 | 46.4% |
| Cellular Data Only | 942 | 20.2% |
| Satellite Internet | 1,000 | 21.4% |
| No Internet | 607 | 13.0% |
| Total | 4,665 | 100.0% |
LaSalle Parish Summary
LaSalle Parish is located in the northern part of Louisiana, in the United States. It is bordered by the state of Arkansas to the north, Winn Parish to the east, Grant Parish to the south, and Natchitoches Parish to the west. The parish seat is Jena, and the largest city is Olla. LaSalle Parish was established in 1843 and named after René-Robert Cavelier, Sieur de La Salle, a French explorer who explored the Mississippi River in the late 1600s.
Geography
LaSalle Parish covers an area of 845 square miles, making it the fourth-largest parish in Louisiana. The terrain is mostly flat, with some rolling hills in the northern part of the parish. The parish is drained by the Ouachita River, which forms its northern boundary. The parish is also home to several small lakes, including Lake D'Arbonne, Lake Bruin, and Lake St. John.
The climate of LaSalle Parish is humid subtropical, with hot, humid summers and mild winters. The average annual temperature is around 68°F, and the average annual precipitation is around 48 inches.
Demographics
As of the 2010 census, LaSalle Parish had a population of 14,890. The racial makeup of the parish was 79.2% White, 19.2% African American, 0.3% Native American, 0.2% Asian, 0.1% Pacific Islander, 0.3% from other races, and 0.9% from two or more races. Hispanic or Latino of any race were 1.3% of the population.
The median household income in LaSalle Parish was $32,917, and the median family income was $41,917. The per capita income was $17,845. About 17.2% of the population was below the poverty line.
Economy
The economy of LaSalle Parish is largely based on agriculture. The main crops grown in the parish are cotton, soybeans, corn, and wheat. Livestock production is also important, with cattle, hogs, and poultry being the main animals raised.
The parish is also home to several manufacturing companies, including a paper mill, a wood products plant, and a plastics plant. The parish also has a large tourism industry, with many visitors coming to the area to enjoy the natural beauty of the Ouachita River and the many lakes in the parish.
Conclusion
LaSalle Parish is a rural parish located in the northern part of Louisiana. It is home to a diverse population and a strong agricultural economy. The parish is also home to several manufacturing companies and a thriving tourism industry. LaSalle Parish is a great place to live, work, and visit.
Common Questions
What is the Total Population of LaSalle Parish?
Total Population of LaSalle Parish is 14,764.
What is the Total Male Population of LaSalle Parish?
Total Male Population of LaSalle Parish is 7,999.
What is the Total Female Population of LaSalle Parish?
Total Female Population of LaSalle Parish is 6,765.
What is the Ratio of Males per 100 Females in LaSalle Parish?
There are 118.24 Males per 100 Females in LaSalle Parish.
What is the Ratio of Females per 100 Males in LaSalle Parish?
There are 84.57 Females per 100 Males in LaSalle Parish.
What is the Median Population Age in LaSalle Parish?
Median Population Age in LaSalle Parish is 38.3 Years.
What is the Average Family Size in LaSalle Parish
Average Family Size in LaSalle Parish is 3.4 People.
What is the Average Household Size in LaSalle Parish
Average Household Size in LaSalle Parish is 2.9 People.
What is Per Capita Income in LaSalle Parish?
Per Capita income in LaSalle Parish is $29,769.
What is the Median Family Income in LaSalle Parish?
Median Family Income in LaSalle Parish is $74,525.
What is the Median Household income in LaSalle Parish?
Median Household Income in LaSalle Parish is $59,926.
What is Income or Wage Gap in LaSalle Parish?
Income or Wage Gap in LaSalle Parish is 47.6%.
Women in LaSalle Parish earn 52.4 cents for every dollar earned by a man.
What is Inequality or Gini Index in LaSalle Parish?
Inequality or Gini Index in LaSalle Parish is 0.45.
How Large is the Labor Force in LaSalle Parish?
There are 6,723 People in the Labor Forcein in LaSalle Parish.
What is the Percentage of People in the Labor Force in LaSalle Parish?
55.8% of People are in the Labor Force in LaSalle Parish.
What is the Unemployment Rate in LaSalle Parish?
Unemployment Rate in LaSalle Parish is 4.6%.