Lafourche Parish, LA
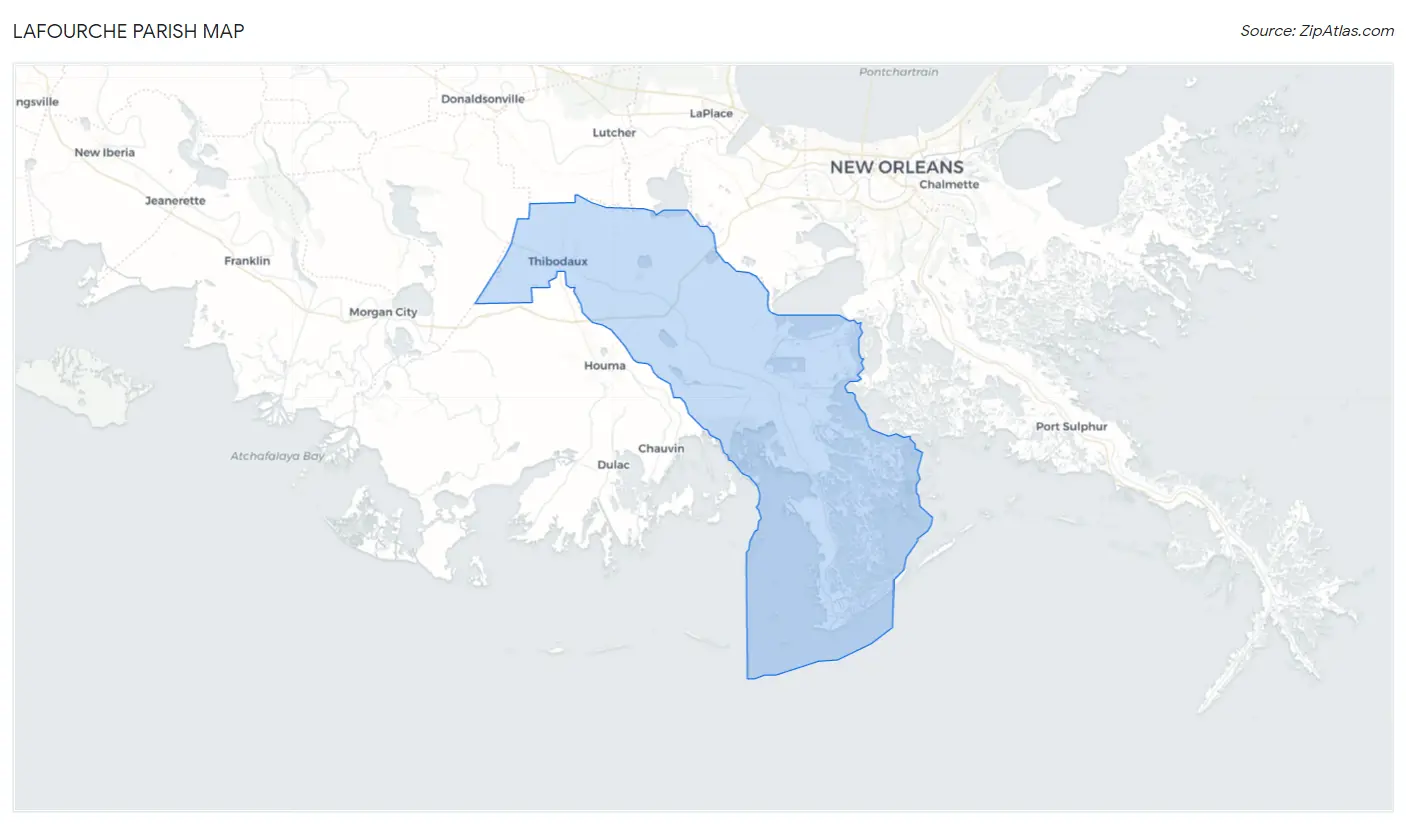
Lafourche Parish Map
Lafourche Parish Overview
97,220
TOTAL POPULATION
47,908
MALE POPULATION
49,312
FEMALE POPULATION
97.15
MALES / 100 FEMALES
102.93
FEMALES / 100 MALES
38.8
MEDIAN AGE
3.1
AVG FAMILY SIZE
2.6
AVG HOUSEHOLD SIZE
$32,716
PER CAPITA INCOME
$78,226
AVG FAMILY INCOME
$61,381
AVG HOUSEHOLD INCOME
45.2%
WAGE / INCOME GAP [ % ]
54.8¢/ $1
WAGE / INCOME GAP [ $ ]
$11,921
FAMILY INCOME DEFICIT
0.48
INEQUALITY / GINI INDEX
44,764
LABOR FORCE [ PEOPLE ]
57.7%
PERCENT IN LABOR FORCE
6.5%
UNEMPLOYMENT RATE
Lafourche Parish Area Codes
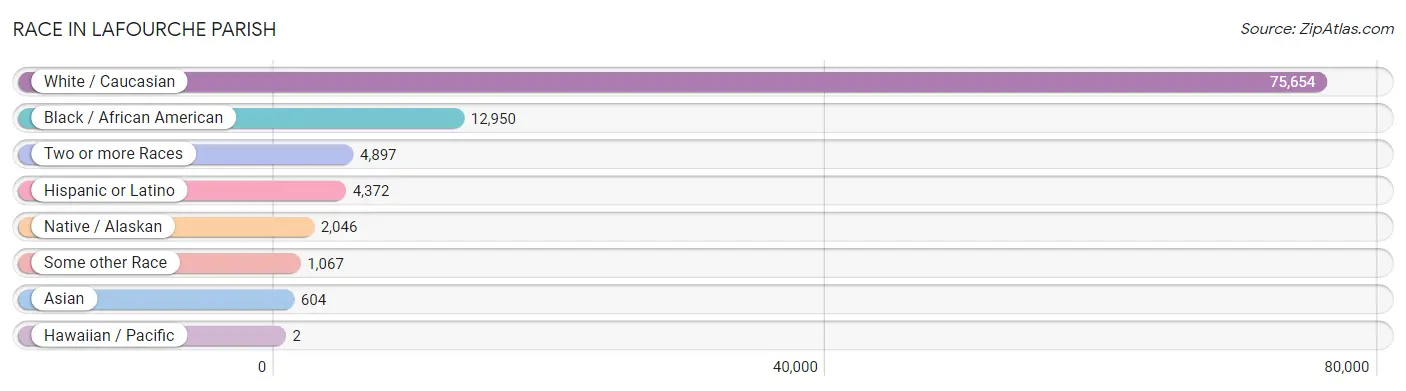
Race in Lafourche Parish
The most populous races in Lafourche Parish are White / Caucasian (75,654 | 77.8%), Black / African American (12,950 | 13.3%), and Two or more Races (4,897 | 5.0%).
| Race | # Population | % Population |
| Asian | 604 | 0.6% |
| Black / African American | 12,950 | 13.3% |
| Hawaiian / Pacific | 2 | 0.0% |
| Hispanic or Latino | 4,372 | 4.5% |
| Native / Alaskan | 2,046 | 2.1% |
| White / Caucasian | 75,654 | 77.8% |
| Two or more Races | 4,897 | 5.0% |
| Some other Race | 1,067 | 1.1% |
| Total | 97,220 | 100.0% |
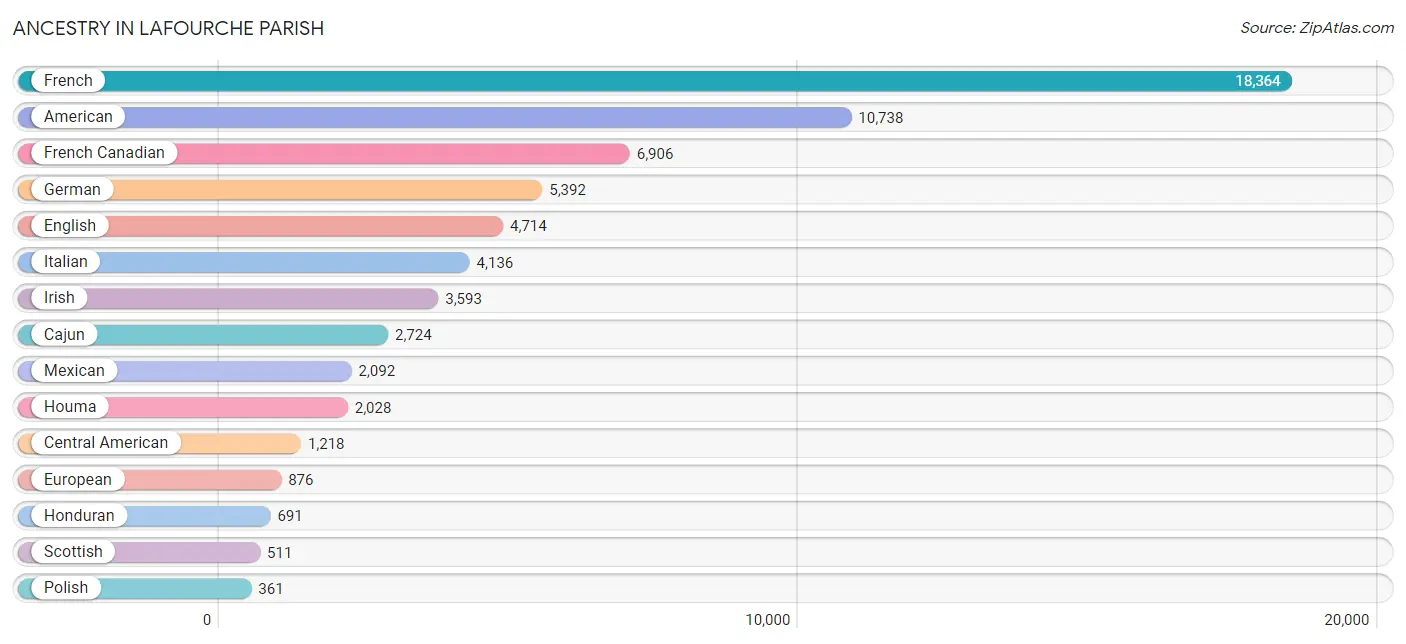
Ancestry in Lafourche Parish
The most populous ancestries reported in Lafourche Parish are French (18,364 | 18.9%), American (10,738 | 11.1%), French Canadian (6,906 | 7.1%), German (5,392 | 5.6%), and English (4,714 | 4.9%), together accounting for 47.4% of all Lafourche Parish residents.
| Ancestry | # Population | % Population |
| African | 62 | 0.1% |
| American | 10,738 | 11.1% |
| Arab | 183 | 0.2% |
| Austrian | 17 | 0.0% |
| Belgian | 35 | 0.0% |
| Bhutanese | 229 | 0.2% |
| Blackfeet | 44 | 0.1% |
| Bolivian | 8 | 0.0% |
| Brazilian | 13 | 0.0% |
| British | 115 | 0.1% |
| Burmese | 68 | 0.1% |
| Cajun | 2,724 | 2.8% |
| Canadian | 154 | 0.2% |
| Central American | 1,218 | 1.3% |
| Cherokee | 242 | 0.3% |
| Chippewa | 6 | 0.0% |
| Choctaw | 37 | 0.0% |
| Colombian | 125 | 0.1% |
| Costa Rican | 120 | 0.1% |
| Creek | 4 | 0.0% |
| Croatian | 35 | 0.0% |
| Crow | 2 | 0.0% |
| Cuban | 100 | 0.1% |
| Czechoslovakian | 10 | 0.0% |
| Dutch | 219 | 0.2% |
| Eastern European | 61 | 0.1% |
| Ecuadorian | 48 | 0.1% |
| Egyptian | 103 | 0.1% |
| English | 4,714 | 4.9% |
| European | 876 | 0.9% |
| French | 18,364 | 18.9% |
| French American Indian | 7 | 0.0% |
| French Canadian | 6,906 | 7.1% |
| German | 5,392 | 5.6% |
| Greek | 231 | 0.2% |
| Guatemalan | 336 | 0.4% |
| Honduran | 691 | 0.7% |
| Houma | 2,028 | 2.1% |
| Hungarian | 67 | 0.1% |
| Indian (Asian) | 69 | 0.1% |
| Irish | 3,593 | 3.7% |
| Italian | 4,136 | 4.3% |
| Korean | 292 | 0.3% |
| Lebanese | 75 | 0.1% |
| Lithuanian | 7 | 0.0% |
| Lumbee | 19 | 0.0% |
| Luxembourger | 4 | 0.0% |
| Malaysian | 49 | 0.1% |
| Mexican | 2,092 | 2.1% |
| Mexican American Indian | 140 | 0.1% |
| Mongolian | 6 | 0.0% |
| Native Hawaiian | 36 | 0.0% |
| Nicaraguan | 33 | 0.0% |
| Nigerian | 32 | 0.0% |
| Northern European | 18 | 0.0% |
| Norwegian | 47 | 0.1% |
| Okinawan | 15 | 0.0% |
| Peruvian | 131 | 0.1% |
| Polish | 361 | 0.4% |
| Portuguese | 195 | 0.2% |
| Puerto Rican | 61 | 0.1% |
| Romanian | 13 | 0.0% |
| Russian | 60 | 0.1% |
| Salvadoran | 38 | 0.0% |
| Scandinavian | 31 | 0.0% |
| Scotch-Irish | 152 | 0.2% |
| Scottish | 511 | 0.5% |
| Serbian | 5 | 0.0% |
| South American | 339 | 0.4% |
| Spaniard | 248 | 0.3% |
| Spanish | 210 | 0.2% |
| Spanish American | 6 | 0.0% |
| Spanish American Indian | 16 | 0.0% |
| Sri Lankan | 169 | 0.2% |
| Subsaharan African | 113 | 0.1% |
| Swedish | 91 | 0.1% |
| Swiss | 86 | 0.1% |
| Thai | 48 | 0.1% |
| Venezuelan | 27 | 0.0% |
| Welsh | 175 | 0.2% |
| West Indian | 2 | 0.0% |
| Yugoslavian | 14 | 0.0% | View All 82 Rows |
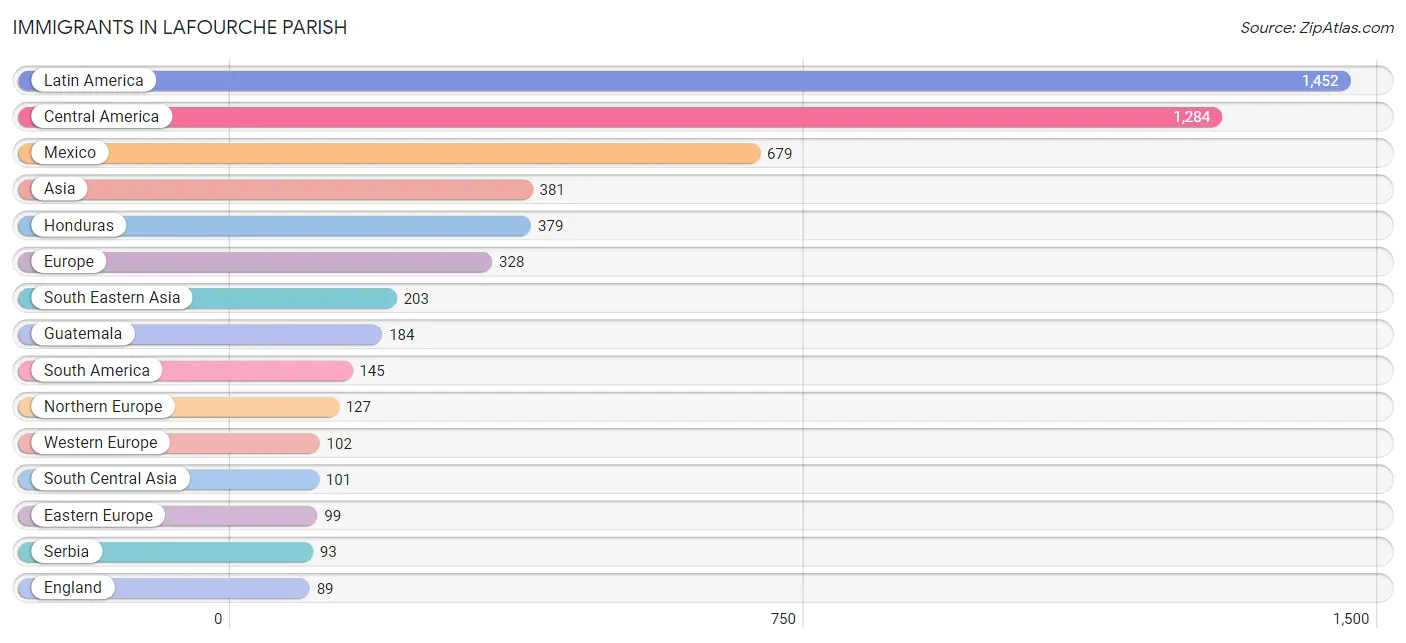
Immigrants in Lafourche Parish
The most numerous immigrant groups reported in Lafourche Parish came from Latin America (1,452 | 1.5%), Central America (1,284 | 1.3%), Mexico (679 | 0.7%), Asia (381 | 0.4%), and Honduras (379 | 0.4%), together accounting for 4.3% of all Lafourche Parish residents.
| Immigration Origin | # Population | % Population |
| Africa | 5 | 0.0% |
| Asia | 381 | 0.4% |
| Bangladesh | 24 | 0.0% |
| Belgium | 19 | 0.0% |
| Belize | 5 | 0.0% |
| Brazil | 28 | 0.0% |
| Canada | 12 | 0.0% |
| Caribbean | 23 | 0.0% |
| Central America | 1,284 | 1.3% |
| China | 32 | 0.0% |
| Colombia | 14 | 0.0% |
| Costa Rica | 26 | 0.0% |
| Cuba | 23 | 0.0% |
| Eastern Asia | 72 | 0.1% |
| Eastern Europe | 99 | 0.1% |
| Ecuador | 43 | 0.0% |
| Egypt | 5 | 0.0% |
| El Salvador | 7 | 0.0% |
| England | 89 | 0.1% |
| Europe | 328 | 0.3% |
| France | 9 | 0.0% |
| Germany | 58 | 0.1% |
| Guatemala | 184 | 0.2% |
| Honduras | 379 | 0.4% |
| India | 45 | 0.1% |
| Ireland | 6 | 0.0% |
| Japan | 21 | 0.0% |
| Jordan | 5 | 0.0% |
| Korea | 19 | 0.0% |
| Laos | 49 | 0.1% |
| Latin America | 1,452 | 1.5% |
| Mexico | 679 | 0.7% |
| Netherlands | 9 | 0.0% |
| Nicaragua | 4 | 0.0% |
| Northern Africa | 5 | 0.0% |
| Northern Europe | 127 | 0.1% |
| Norway | 16 | 0.0% |
| Pakistan | 32 | 0.0% |
| Peru | 33 | 0.0% |
| Philippines | 59 | 0.1% |
| Russia | 6 | 0.0% |
| Serbia | 93 | 0.1% |
| Singapore | 9 | 0.0% |
| South America | 145 | 0.2% |
| South Central Asia | 101 | 0.1% |
| South Eastern Asia | 203 | 0.2% |
| Switzerland | 7 | 0.0% |
| Venezuela | 27 | 0.0% |
| Vietnam | 86 | 0.1% |
| Western Asia | 5 | 0.0% |
| Western Europe | 102 | 0.1% | View All 51 Rows |
Sex and Age in Lafourche Parish
Sex and Age in Lafourche Parish
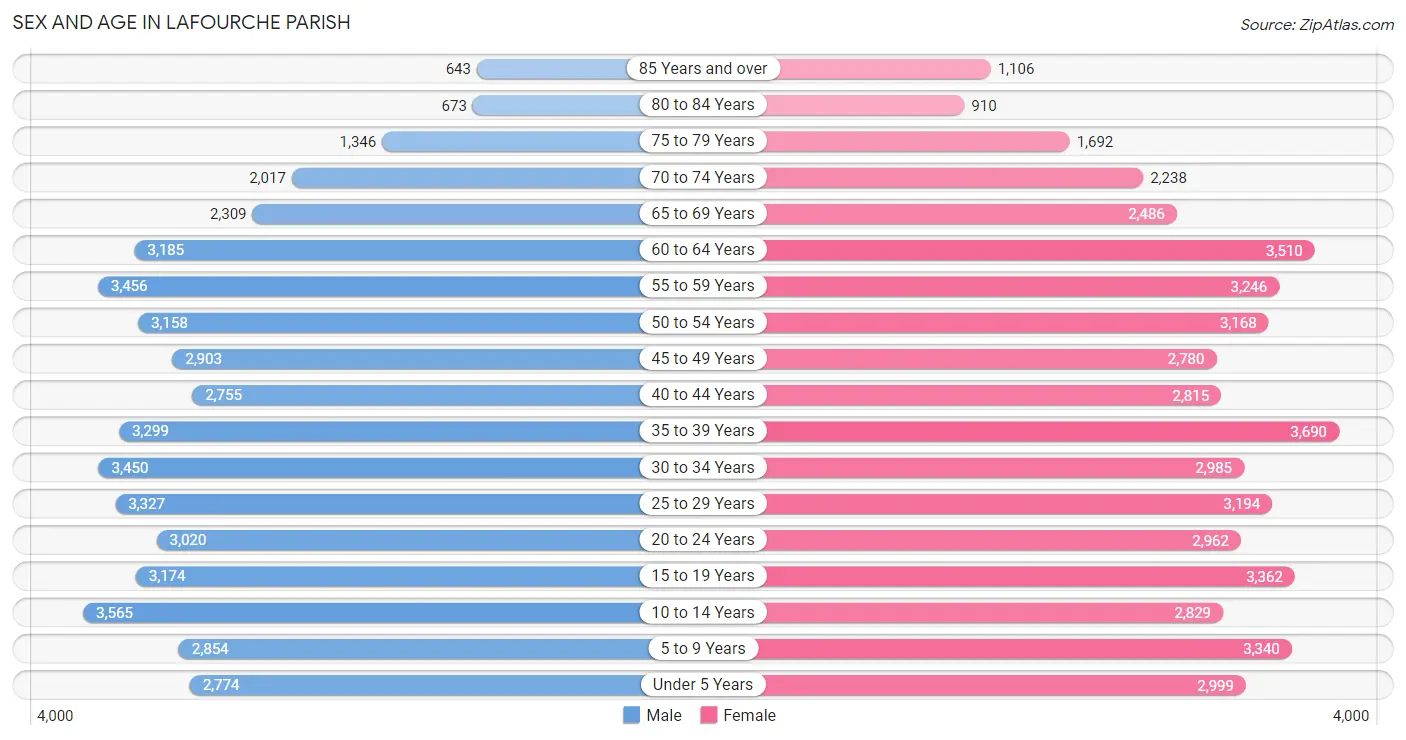
The most populous age groups in Lafourche Parish are 10 to 14 Years (3,565 | 7.4%) for men and 35 to 39 Years (3,690 | 7.5%) for women.
| Age Bracket | Male | Female |
| Under 5 Years | 2,774 (5.8%) | 2,999 (6.1%) |
| 5 to 9 Years | 2,854 (6.0%) | 3,340 (6.8%) |
| 10 to 14 Years | 3,565 (7.4%) | 2,829 (5.7%) |
| 15 to 19 Years | 3,174 (6.6%) | 3,362 (6.8%) |
| 20 to 24 Years | 3,020 (6.3%) | 2,962 (6.0%) |
| 25 to 29 Years | 3,327 (6.9%) | 3,194 (6.5%) |
| 30 to 34 Years | 3,450 (7.2%) | 2,985 (6.0%) |
| 35 to 39 Years | 3,299 (6.9%) | 3,690 (7.5%) |
| 40 to 44 Years | 2,755 (5.8%) | 2,815 (5.7%) |
| 45 to 49 Years | 2,903 (6.1%) | 2,780 (5.6%) |
| 50 to 54 Years | 3,158 (6.6%) | 3,168 (6.4%) |
| 55 to 59 Years | 3,456 (7.2%) | 3,246 (6.6%) |
| 60 to 64 Years | 3,185 (6.7%) | 3,510 (7.1%) |
| 65 to 69 Years | 2,309 (4.8%) | 2,486 (5.0%) |
| 70 to 74 Years | 2,017 (4.2%) | 2,238 (4.5%) |
| 75 to 79 Years | 1,346 (2.8%) | 1,692 (3.4%) |
| 80 to 84 Years | 673 (1.4%) | 910 (1.8%) |
| 85 Years and over | 643 (1.3%) | 1,106 (2.2%) |
| Total | 47,908 (100.0%) | 49,312 (100.0%) |
Families and Households in Lafourche Parish
Median Family Size in Lafourche Parish
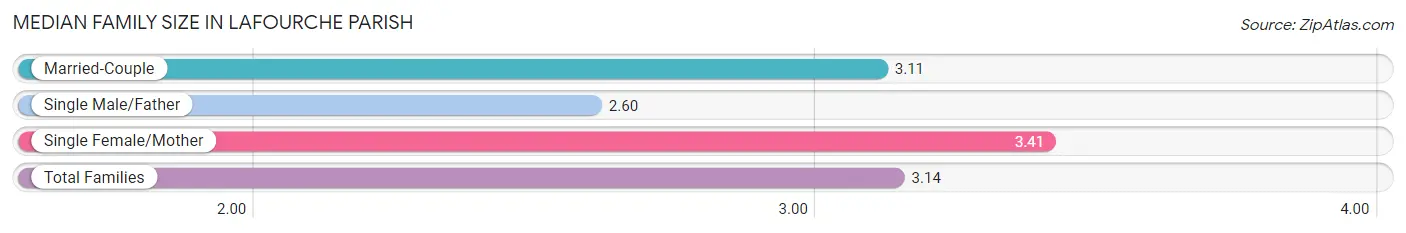
The median family size in Lafourche Parish is 3.14 persons per family, with single female/mother families (4,895 | 19.7%) accounting for the largest median family size of 3.41 persons per family. On the other hand, single male/father families (1,512 | 6.1%) represent the smallest median family size with 2.60 persons per family.
| Family Type | # Families | Family Size |
| Married-Couple | 18,419 (74.2%) | 3.11 |
| Single Male/Father | 1,512 (6.1%) | 2.60 |
| Single Female/Mother | 4,895 (19.7%) | 3.41 |
| Total Families | 24,826 (100.0%) | 3.14 |
Median Household Size in Lafourche Parish
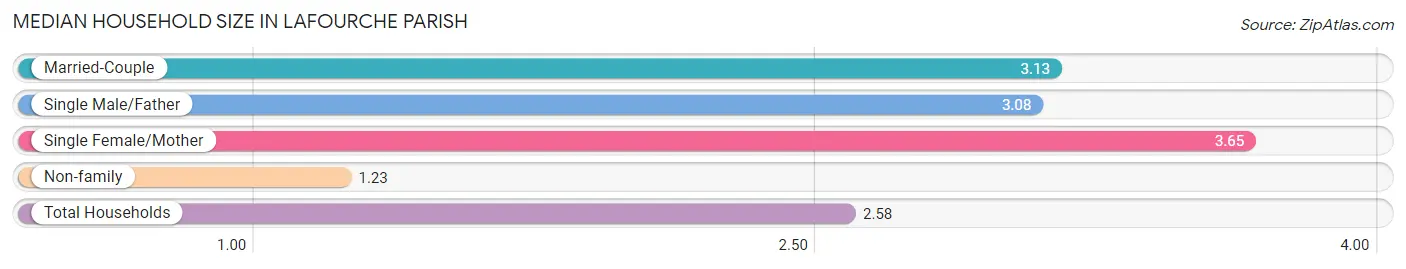
The median household size in Lafourche Parish is 2.58 persons per household, with single female/mother households (4,895 | 13.3%) accounting for the largest median household size of 3.65 persons per household. non-family households (12,002 | 32.6%) represent the smallest median household size with 1.23 persons per household.
| Household Type | # Households | Household Size |
| Married-Couple | 18,419 (50.0%) | 3.13 |
| Single Male/Father | 1,512 (4.1%) | 3.08 |
| Single Female/Mother | 4,895 (13.3%) | 3.65 |
| Non-family | 12,002 (32.6%) | 1.23 |
| Total Households | 36,828 (100.0%) | 2.58 |
Household Size by Marriage Status in Lafourche Parish
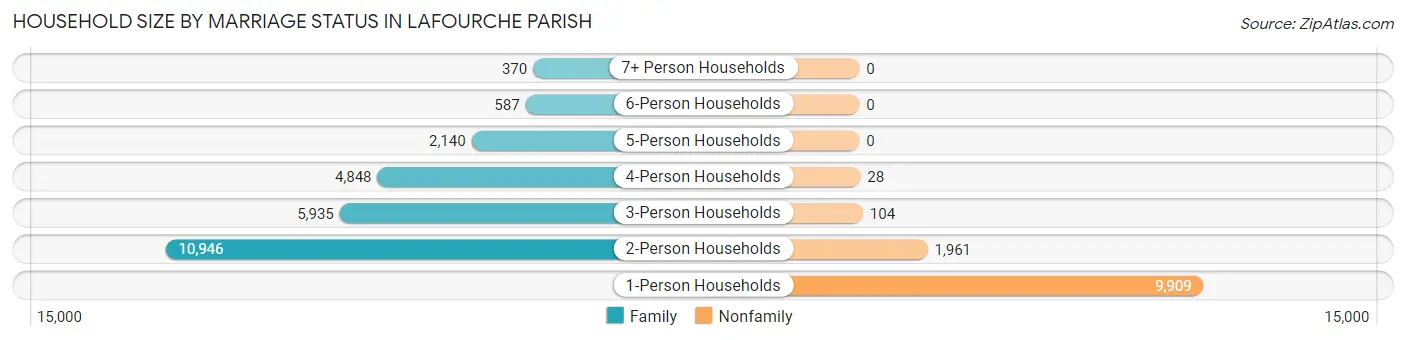
Out of a total of 36,828 households in Lafourche Parish, 24,826 (67.4%) are family households, while 12,002 (32.6%) are nonfamily households. The most numerous type of family households are 2-person households, comprising 10,946, and the most common type of nonfamily households are 1-person households, comprising 9,909.
| Household Size | Family Households | Nonfamily Households |
| 1-Person Households | - | 9,909 (26.9%) |
| 2-Person Households | 10,946 (29.7%) | 1,961 (5.3%) |
| 3-Person Households | 5,935 (16.1%) | 104 (0.3%) |
| 4-Person Households | 4,848 (13.2%) | 28 (0.1%) |
| 5-Person Households | 2,140 (5.8%) | 0 (0.0%) |
| 6-Person Households | 587 (1.6%) | 0 (0.0%) |
| 7+ Person Households | 370 (1.0%) | 0 (0.0%) |
| Total | 24,826 (67.4%) | 12,002 (32.6%) |
Female Fertility in Lafourche Parish
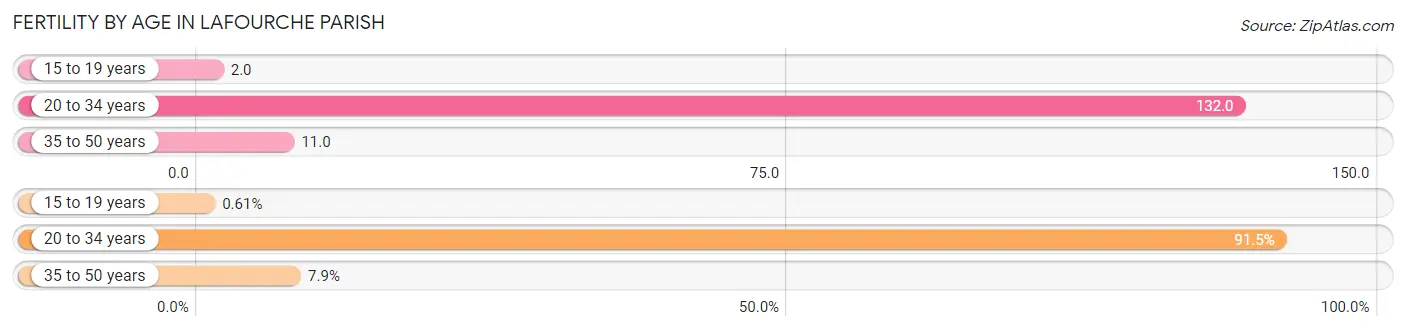
Fertility by Age in Lafourche Parish
Average fertility rate in Lafourche Parish is 59.0 births per 1,000 women. Women in the age bracket of 20 to 34 years have the highest fertility rate with 132.0 births per 1,000 women. Women in the age bracket of 20 to 34 years acount for 91.5% of all women with births.
| Age Bracket | Women with Births | Births / 1,000 Women |
| 15 to 19 years | 8 (0.6%) | 2.0 |
| 20 to 34 years | 1,205 (91.5%) | 132.0 |
| 35 to 50 years | 104 (7.9%) | 11.0 |
| Total | 1,317 (100.0%) | 59.0 |
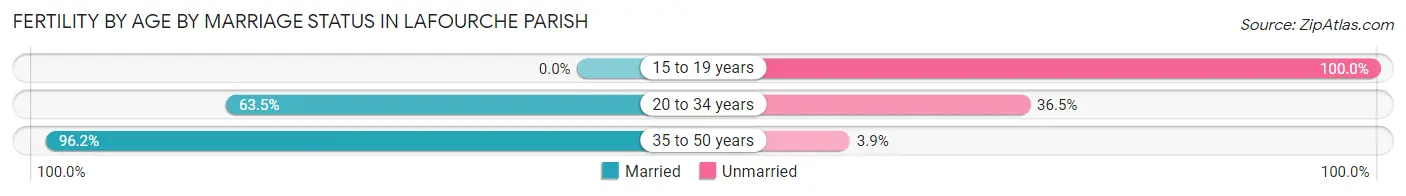
Fertility by Age by Marriage Status in Lafourche Parish
65.7% of women with births (1,317) in Lafourche Parish are married. The highest percentage of unmarried women with births falls into 15 to 19 years age bracket with 100.0% of them unmarried at the time of birth, while the lowest percentage of unmarried women with births belong to 35 to 50 years age bracket with 3.8% of them unmarried.
| Age Bracket | Married | Unmarried |
| 15 to 19 years | 0 (0.0%) | 8 (100.0%) |
| 20 to 34 years | 765 (63.5%) | 440 (36.5%) |
| 35 to 50 years | 100 (96.2%) | 4 (3.8%) |
| Total | 865 (65.7%) | 452 (34.3%) |
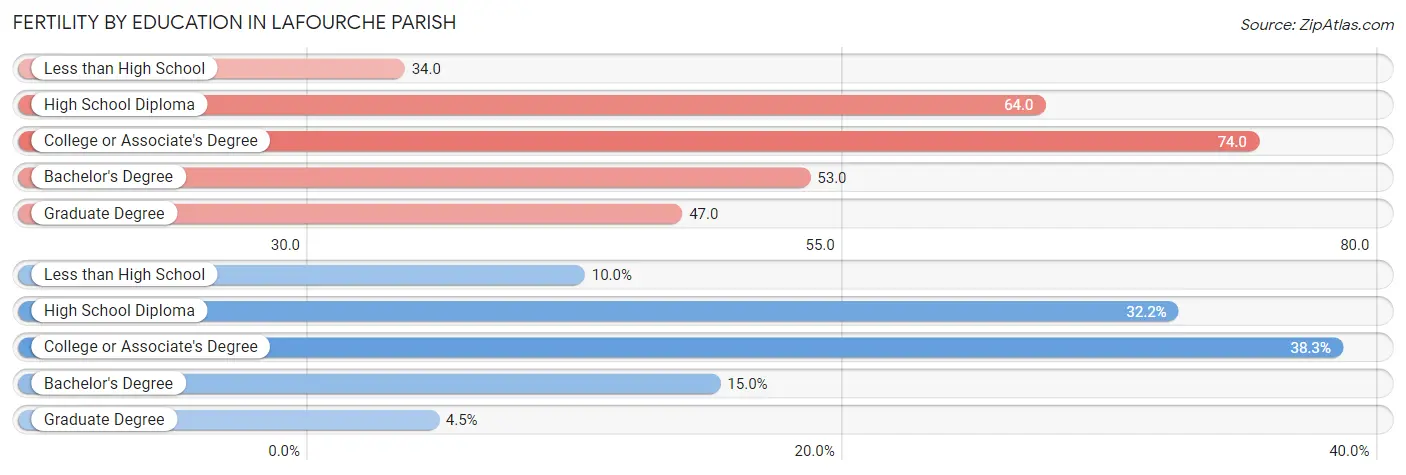
Fertility by Education in Lafourche Parish
Average fertility rate in Lafourche Parish is 59.0 births per 1,000 women. Women with the education attainment of college or associate's degree have the highest fertility rate of 74.0 births per 1,000 women, while women with the education attainment of less than high school have the lowest fertility at 34.0 births per 1,000 women. Women with the education attainment of college or associate's degree represent 38.3% of all women with births.
| Educational Attainment | Women with Births | Births / 1,000 Women |
| Less than High School | 131 (10.0%) | 34.0 |
| High School Diploma | 424 (32.2%) | 64.0 |
| College or Associate's Degree | 505 (38.3%) | 74.0 |
| Bachelor's Degree | 198 (15.0%) | 53.0 |
| Graduate Degree | 59 (4.5%) | 47.0 |
| Total | 1,317 (100.0%) | 59.0 |
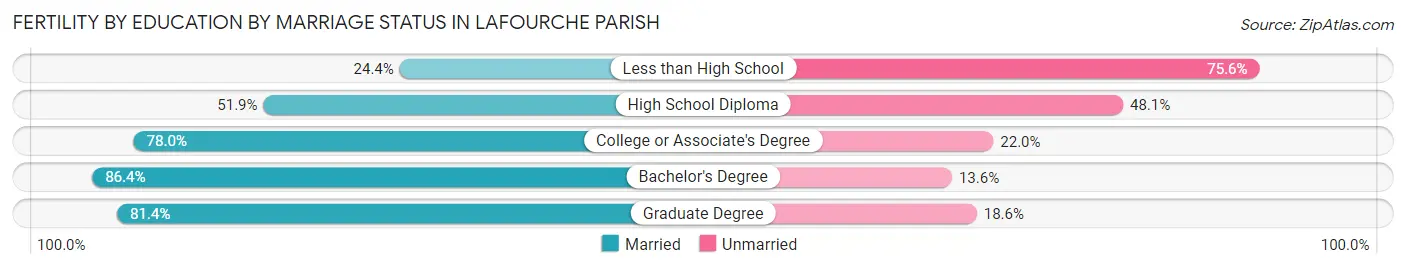
Fertility by Education by Marriage Status in Lafourche Parish
34.3% of women with births in Lafourche Parish are unmarried. Women with the educational attainment of bachelor's degree are most likely to be married with 86.4% of them married at childbirth, while women with the educational attainment of less than high school are least likely to be married with 75.6% of them unmarried at childbirth.
| Educational Attainment | Married | Unmarried |
| Less than High School | 32 (24.4%) | 99 (75.6%) |
| High School Diploma | 220 (51.9%) | 204 (48.1%) |
| College or Associate's Degree | 394 (78.0%) | 111 (22.0%) |
| Bachelor's Degree | 171 (86.4%) | 27 (13.6%) |
| Graduate Degree | 48 (81.4%) | 11 (18.6%) |
| Total | 865 (65.7%) | 452 (34.3%) |
Income in Lafourche Parish
Income Overview in Lafourche Parish
Per Capita Income in Lafourche Parish is $32,716, while median incomes of families and households are $78,226 and $61,381 respectively.
| Characteristic | Number | Measure |
| Per Capita Income | 97,220 | $32,716 |
| Median Family Income | 24,826 | $78,226 |
| Mean Family Income | 24,826 | $97,952 |
| Median Household Income | 36,828 | $61,381 |
| Mean Household Income | 36,828 | $83,072 |
| Income Deficit | 24,826 | $11,921 |
| Wage / Income Gap (%) | 97,220 | 45.15% |
| Wage / Income Gap ($) | 97,220 | 54.85¢ per $1 |
| Gini / Inequality Index | 97,220 | 0.48 |
Earnings by Sex in Lafourche Parish
Average Earnings in Lafourche Parish are $40,424, $52,830 for men and $28,977 for women, a difference of 45.2%.
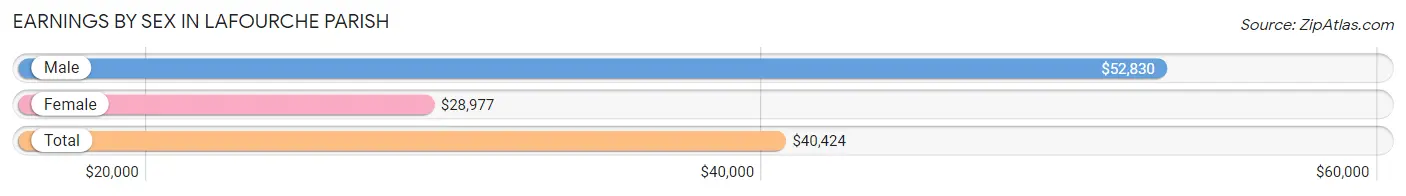
| Sex | Number | Average Earnings |
| Male | 25,394 (54.6%) | $52,830 |
| Female | 21,083 (45.4%) | $28,977 |
| Total | 46,477 (100.0%) | $40,424 |
Earnings by Sex by Income Bracket in Lafourche Parish
The most common earnings brackets in Lafourche Parish are $100,000+ for men (4,697 | 18.5%) and $25,000 to $29,999 for women (1,884 | 8.9%).
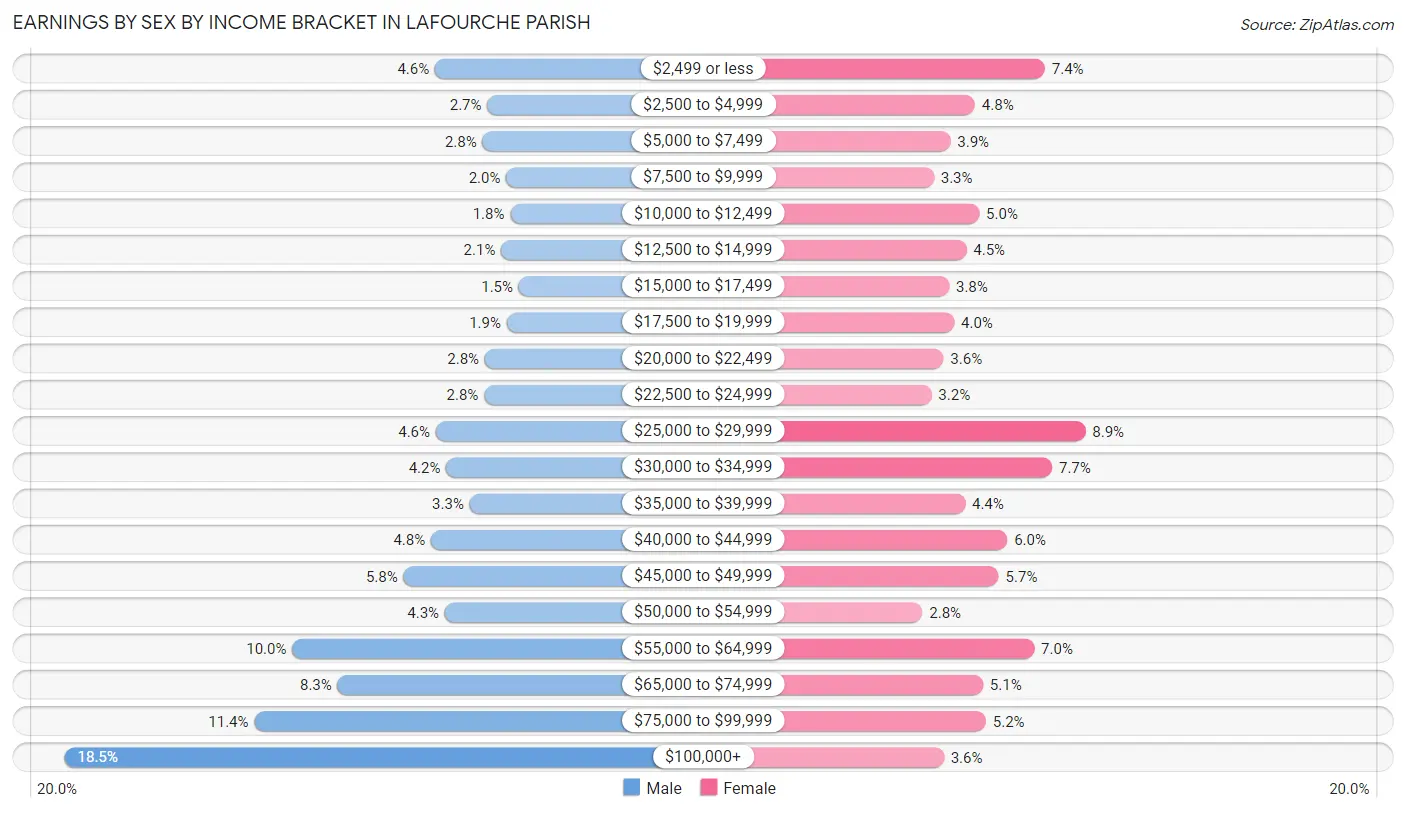
| Income | Male | Female |
| $2,499 or less | 1,174 (4.6%) | 1,565 (7.4%) |
| $2,500 to $4,999 | 675 (2.7%) | 1,013 (4.8%) |
| $5,000 to $7,499 | 721 (2.8%) | 818 (3.9%) |
| $7,500 to $9,999 | 494 (1.9%) | 687 (3.3%) |
| $10,000 to $12,499 | 458 (1.8%) | 1,046 (5.0%) |
| $12,500 to $14,999 | 543 (2.1%) | 945 (4.5%) |
| $15,000 to $17,499 | 375 (1.5%) | 807 (3.8%) |
| $17,500 to $19,999 | 489 (1.9%) | 848 (4.0%) |
| $20,000 to $22,499 | 698 (2.8%) | 764 (3.6%) |
| $22,500 to $24,999 | 706 (2.8%) | 668 (3.2%) |
| $25,000 to $29,999 | 1,166 (4.6%) | 1,884 (8.9%) |
| $30,000 to $34,999 | 1,067 (4.2%) | 1,622 (7.7%) |
| $35,000 to $39,999 | 842 (3.3%) | 933 (4.4%) |
| $40,000 to $44,999 | 1,212 (4.8%) | 1,267 (6.0%) |
| $45,000 to $49,999 | 1,472 (5.8%) | 1,199 (5.7%) |
| $50,000 to $54,999 | 1,079 (4.3%) | 597 (2.8%) |
| $55,000 to $64,999 | 2,533 (10.0%) | 1,480 (7.0%) |
| $65,000 to $74,999 | 2,101 (8.3%) | 1,076 (5.1%) |
| $75,000 to $99,999 | 2,892 (11.4%) | 1,099 (5.2%) |
| $100,000+ | 4,697 (18.5%) | 765 (3.6%) |
| Total | 25,394 (100.0%) | 21,083 (100.0%) |
Earnings by Sex by Educational Attainment in Lafourche Parish
Average earnings in Lafourche Parish are $58,283 for men and $32,383 for women, a difference of 44.4%. Men with an educational attainment of graduate degree enjoy the highest average annual earnings of $107,974, while those with less than high school education earn the least with $34,725. Women with an educational attainment of graduate degree earn the most with the average annual earnings of $61,354, while those with less than high school education have the smallest earnings of $19,809.
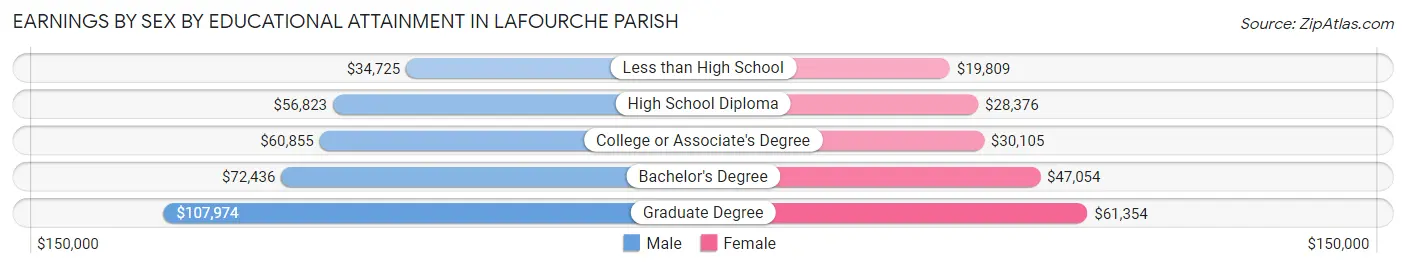
| Educational Attainment | Male Income | Female Income |
| Less than High School | $34,725 | $19,809 |
| High School Diploma | $56,823 | $28,376 |
| College or Associate's Degree | $60,855 | $30,105 |
| Bachelor's Degree | $72,436 | $47,054 |
| Graduate Degree | $107,974 | $61,354 |
| Total | $58,283 | $32,383 |
Family Income in Lafourche Parish
Family Income Brackets in Lafourche Parish
According to the Lafourche Parish family income data, there are 5,586 families falling into the $100,000 to $149,999 income range, which is the most common income bracket and makes up 22.5% of all families. Conversely, the $10,000 to $14,999 income bracket is the least frequent group with only 447 families (1.8%) belonging to this category.
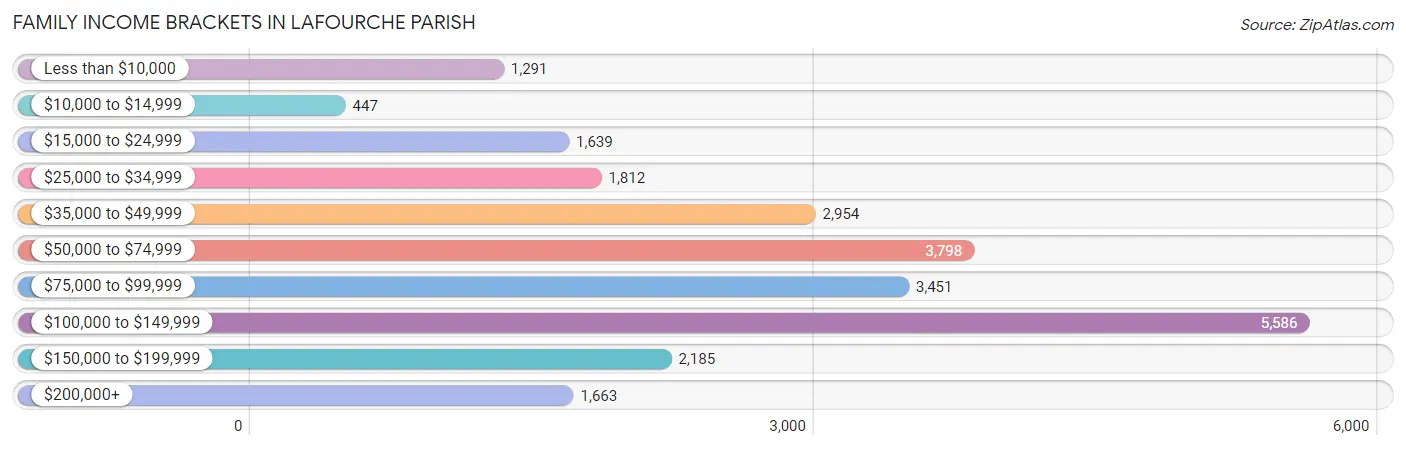
| Income Bracket | # Families | % Families |
| Less than $10,000 | 1,291 | 5.2% |
| $10,000 to $14,999 | 447 | 1.8% |
| $15,000 to $24,999 | 1,639 | 6.6% |
| $25,000 to $34,999 | 1,812 | 7.3% |
| $35,000 to $49,999 | 2,954 | 11.9% |
| $50,000 to $74,999 | 3,798 | 15.3% |
| $75,000 to $99,999 | 3,451 | 13.9% |
| $100,000 to $149,999 | 5,586 | 22.5% |
| $150,000 to $199,999 | 2,185 | 8.8% |
| $200,000+ | 1,663 | 6.7% |
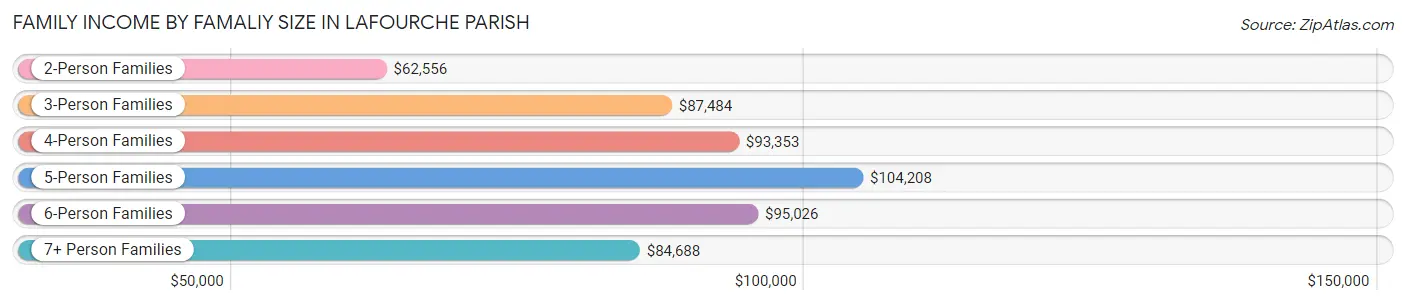
Family Income by Famaliy Size in Lafourche Parish
5-person families (1,660 | 6.7%) account for the highest median family income in Lafourche Parish with $104,208 per family, while 2-person families (11,877 | 47.8%) have the highest median income of $31,278 per family member.
| Income Bracket | # Families | Median Income |
| 2-Person Families | 11,877 (47.8%) | $62,556 |
| 3-Person Families | 5,655 (22.8%) | $87,484 |
| 4-Person Families | 4,785 (19.3%) | $93,353 |
| 5-Person Families | 1,660 (6.7%) | $104,208 |
| 6-Person Families | 497 (2.0%) | $95,026 |
| 7+ Person Families | 352 (1.4%) | $84,688 |
| Total | 24,826 (100.0%) | $78,226 |
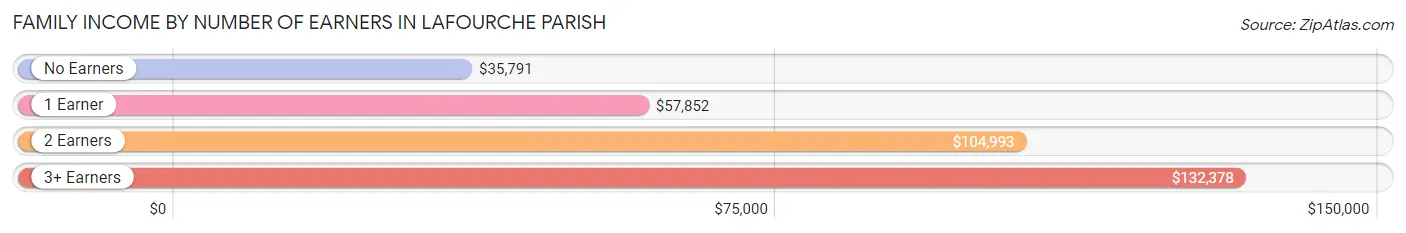
Family Income by Number of Earners in Lafourche Parish
The median family income in Lafourche Parish is $78,226, with families comprising 3+ earners (1,774) having the highest median family income of $132,378, while families with no earners (4,713) have the lowest median family income of $35,791, accounting for 7.1% and 19.0% of families, respectively.
| Number of Earners | # Families | Median Income |
| No Earners | 4,713 (19.0%) | $35,791 |
| 1 Earner | 8,523 (34.3%) | $57,852 |
| 2 Earners | 9,816 (39.5%) | $104,993 |
| 3+ Earners | 1,774 (7.1%) | $132,378 |
| Total | 24,826 (100.0%) | $78,226 |
Household Income in Lafourche Parish
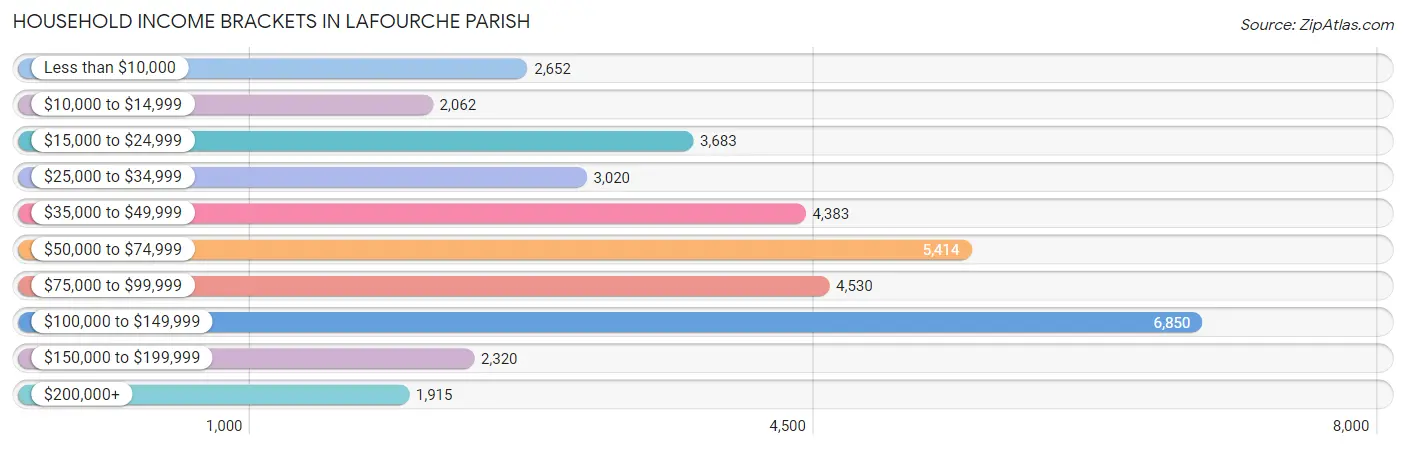
Household Income Brackets in Lafourche Parish
With 6,850 households falling in the category, the $100,000 to $149,999 income range is the most frequent in Lafourche Parish, accounting for 18.6% of all households. In contrast, only 1,915 households (5.2%) fall into the $200,000+ income bracket, making it the least populous group.
| Income Bracket | # Households | % Households |
| Less than $10,000 | 2,652 | 7.2% |
| $10,000 to $14,999 | 2,062 | 5.6% |
| $15,000 to $24,999 | 3,683 | 10.0% |
| $25,000 to $34,999 | 3,020 | 8.2% |
| $35,000 to $49,999 | 4,383 | 11.9% |
| $50,000 to $74,999 | 5,414 | 14.7% |
| $75,000 to $99,999 | 4,530 | 12.3% |
| $100,000 to $149,999 | 6,850 | 18.6% |
| $150,000 to $199,999 | 2,320 | 6.3% |
| $200,000+ | 1,915 | 5.2% |
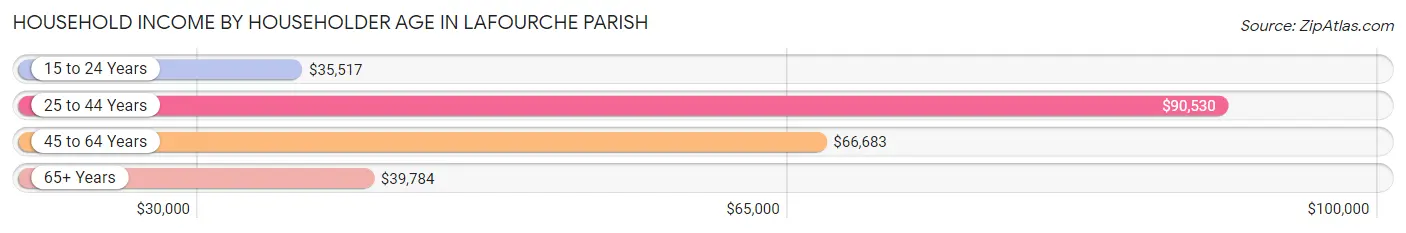
Household Income by Householder Age in Lafourche Parish
The median household income in Lafourche Parish is $61,381, with the highest median household income of $90,530 found in the 25 to 44 years age bracket for the primary householder. A total of 11,823 households (32.1%) fall into this category. Meanwhile, the 15 to 24 years age bracket for the primary householder has the lowest median household income of $35,517, with 1,340 households (3.6%) in this group.
| Income Bracket | # Households | Median Income |
| 15 to 24 Years | 1,340 (3.6%) | $35,517 |
| 25 to 44 Years | 11,823 (32.1%) | $90,530 |
| 45 to 64 Years | 13,985 (38.0%) | $66,683 |
| 65+ Years | 9,680 (26.3%) | $39,784 |
| Total | 36,828 (100.0%) | $61,381 |
Poverty in Lafourche Parish
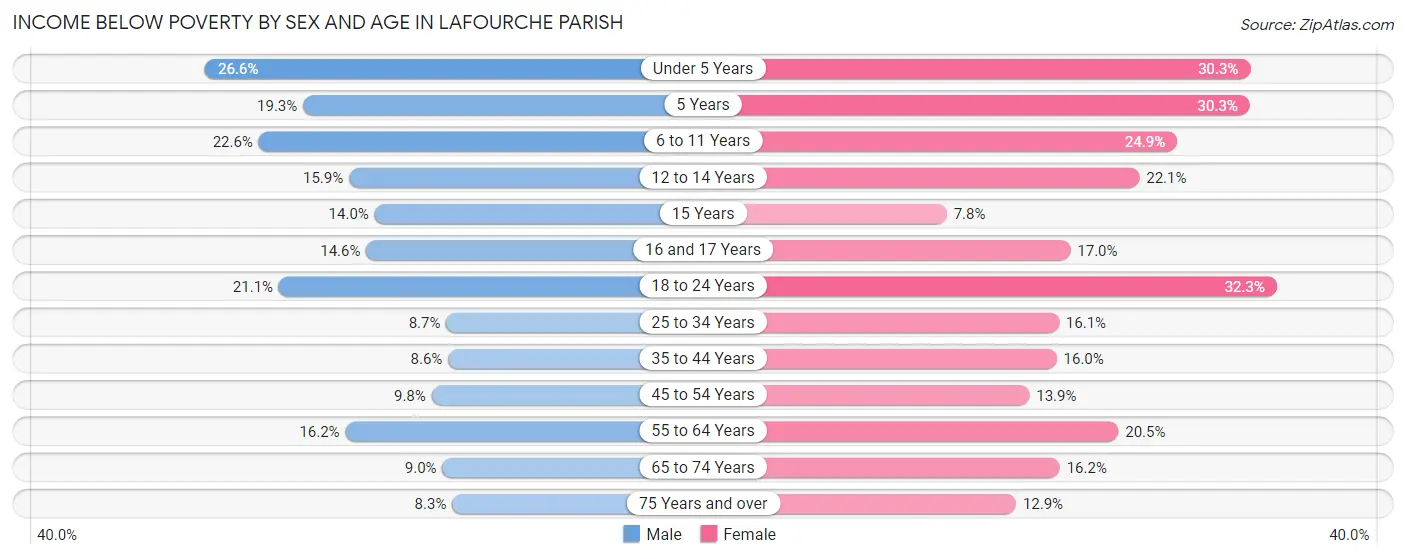
Income Below Poverty by Sex and Age in Lafourche Parish
With 13.7% poverty level for males and 19.3% for females among the residents of Lafourche Parish, under 5 year old males and 18 to 24 year old females are the most vulnerable to poverty, with 726 males (26.6%) and 1,204 females (32.3%) in their respective age groups living below the poverty level.
| Age Bracket | Male | Female |
| Under 5 Years | 726 (26.6%) | 878 (30.3%) |
| 5 Years | 147 (19.3%) | 185 (30.3%) |
| 6 to 11 Years | 789 (22.6%) | 943 (24.9%) |
| 12 to 14 Years | 334 (15.9%) | 376 (22.1%) |
| 15 Years | 100 (14.0%) | 44 (7.8%) |
| 16 and 17 Years | 174 (14.6%) | 223 (17.0%) |
| 18 to 24 Years | 790 (21.1%) | 1,204 (32.3%) |
| 25 to 34 Years | 571 (8.7%) | 996 (16.1%) |
| 35 to 44 Years | 505 (8.6%) | 1,034 (16.0%) |
| 45 to 54 Years | 588 (9.8%) | 828 (13.9%) |
| 55 to 64 Years | 1,070 (16.2%) | 1,382 (20.5%) |
| 65 to 74 Years | 383 (9.0%) | 758 (16.2%) |
| 75 Years and over | 213 (8.3%) | 454 (12.9%) |
| Total | 6,390 (13.7%) | 9,305 (19.3%) |
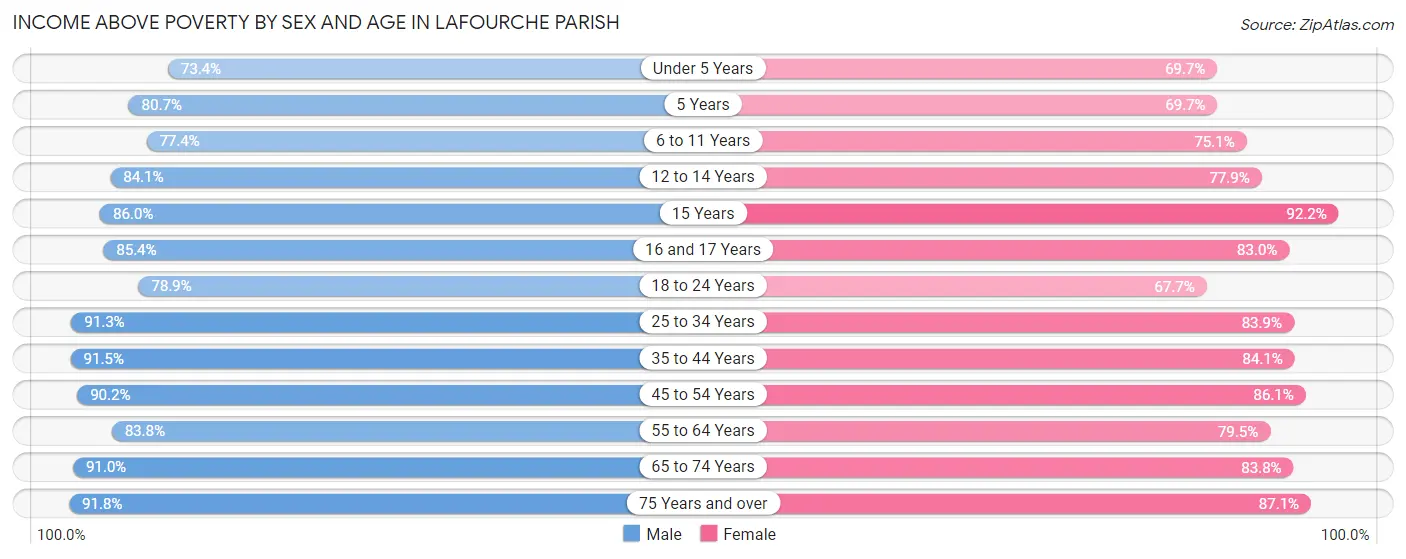
Income Above Poverty by Sex and Age in Lafourche Parish
According to the poverty statistics in Lafourche Parish, males aged 75 years and over and females aged 15 years are the age groups that are most secure financially, with 91.7% of males and 92.2% of females in these age groups living above the poverty line.
| Age Bracket | Male | Female |
| Under 5 Years | 2,003 (73.4%) | 2,018 (69.7%) |
| 5 Years | 614 (80.7%) | 426 (69.7%) |
| 6 to 11 Years | 2,699 (77.4%) | 2,845 (75.1%) |
| 12 to 14 Years | 1,765 (84.1%) | 1,326 (77.9%) |
| 15 Years | 614 (86.0%) | 521 (92.2%) |
| 16 and 17 Years | 1,015 (85.4%) | 1,091 (83.0%) |
| 18 to 24 Years | 2,951 (78.9%) | 2,525 (67.7%) |
| 25 to 34 Years | 6,003 (91.3%) | 5,183 (83.9%) |
| 35 to 44 Years | 5,404 (91.4%) | 5,448 (84.1%) |
| 45 to 54 Years | 5,424 (90.2%) | 5,120 (86.1%) |
| 55 to 64 Years | 5,545 (83.8%) | 5,351 (79.5%) |
| 65 to 74 Years | 3,883 (91.0%) | 3,927 (83.8%) |
| 75 Years and over | 2,370 (91.7%) | 3,056 (87.1%) |
| Total | 40,290 (86.3%) | 38,837 (80.7%) |
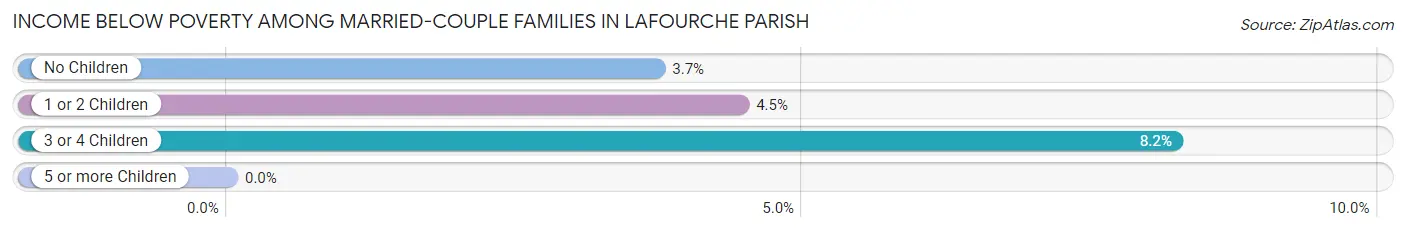
Income Below Poverty Among Married-Couple Families in Lafourche Parish
The poverty statistics for married-couple families in Lafourche Parish show that 4.3% or 800 of the total 18,419 families live below the poverty line. Families with 3 or 4 children have the highest poverty rate of 8.2%, comprising of 133 families. On the other hand, families with 5 or more children have the lowest poverty rate of 0.0%, which includes 0 families.
| Children | Above Poverty | Below Poverty |
| No Children | 10,231 (96.3%) | 395 (3.7%) |
| 1 or 2 Children | 5,842 (95.6%) | 272 (4.4%) |
| 3 or 4 Children | 1,483 (91.8%) | 133 (8.2%) |
| 5 or more Children | 63 (100.0%) | 0 (0.0%) |
| Total | 17,619 (95.7%) | 800 (4.3%) |
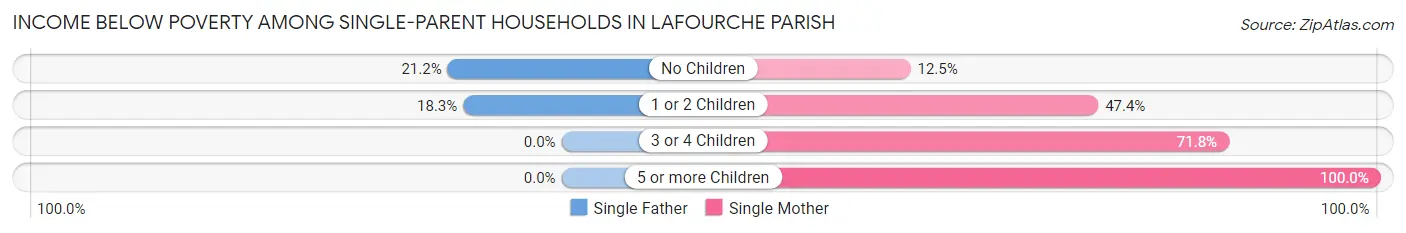
Income Below Poverty Among Single-Parent Households in Lafourche Parish
According to the poverty data in Lafourche Parish, 18.7% or 283 single-father households and 38.1% or 1,865 single-mother households are living below the poverty line. Among single-father households, those with no children have the highest poverty rate, with 152 households (21.2%) experiencing poverty. Likewise, among single-mother households, those with 5 or more children have the highest poverty rate, with 26 households (100.0%) falling below the poverty line.
| Children | Single Father | Single Mother |
| No Children | 152 (21.2%) | 228 (12.4%) |
| 1 or 2 Children | 131 (18.3%) | 1,108 (47.4%) |
| 3 or 4 Children | 0 (0.0%) | 503 (71.8%) |
| 5 or more Children | 0 (0.0%) | 26 (100.0%) |
| Total | 283 (18.7%) | 1,865 (38.1%) |
Income Below Poverty Among Married-Couple vs Single-Parent Households in Lafourche Parish
The poverty data for Lafourche Parish shows that 800 of the married-couple family households (4.3%) and 2,148 of the single-parent households (33.5%) are living below the poverty level. Within the married-couple family households, those with 3 or 4 children have the highest poverty rate, with 133 households (8.2%) falling below the poverty line. Among the single-parent households, those with 5 or more children have the highest poverty rate, with 26 household (100.0%) living below poverty.
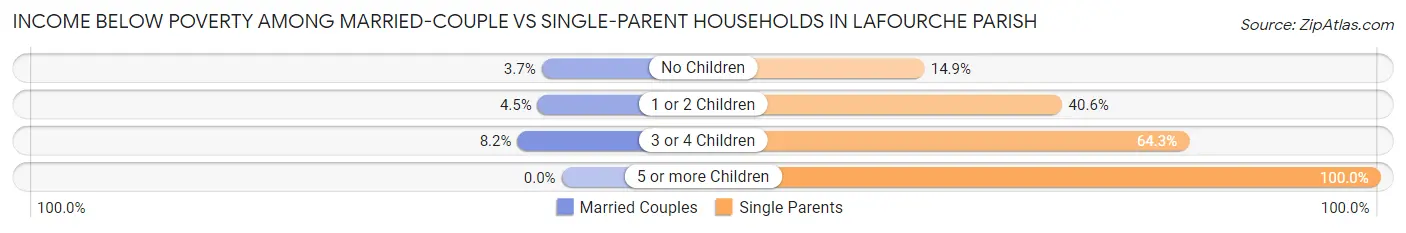
| Children | Married-Couple Families | Single-Parent Households |
| No Children | 395 (3.7%) | 380 (14.9%) |
| 1 or 2 Children | 272 (4.4%) | 1,239 (40.6%) |
| 3 or 4 Children | 133 (8.2%) | 503 (64.3%) |
| 5 or more Children | 0 (0.0%) | 26 (100.0%) |
| Total | 800 (4.3%) | 2,148 (33.5%) |
Employment Characteristics in Lafourche Parish
Employment by Class of Employer in Lafourche Parish
Among the 41,074 employed individuals in Lafourche Parish, private company employees (28,858 | 70.3%), local government employees (3,497 | 8.5%), and self-employed (not incorporated) (2,477 | 6.0%) make up the most common classes of employment.
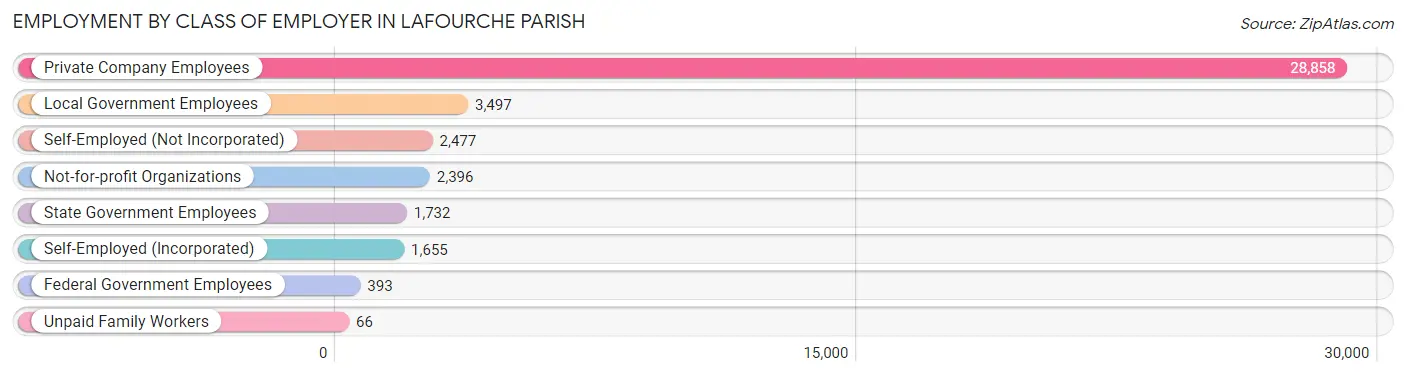
| Employer Class | # Employees | % Employees |
| Private Company Employees | 28,858 | 70.3% |
| Self-Employed (Incorporated) | 1,655 | 4.0% |
| Self-Employed (Not Incorporated) | 2,477 | 6.0% |
| Not-for-profit Organizations | 2,396 | 5.8% |
| Local Government Employees | 3,497 | 8.5% |
| State Government Employees | 1,732 | 4.2% |
| Federal Government Employees | 393 | 1.0% |
| Unpaid Family Workers | 66 | 0.2% |
| Total | 41,074 | 100.0% |
Employment Status by Age in Lafourche Parish
According to the labor force statistics for Lafourche Parish, out of the total population over 16 years of age (77,580), 57.7% or 44,764 individuals are in the labor force, with 6.5% or 2,910 of them unemployed. The age group with the highest labor force participation rate is 35 to 44 years, with 80.1% or 10,060 individuals in the labor force. Within the labor force, the 16 to 19 years age range has the highest percentage of unemployed individuals, with 20.7% or 432 of them being unemployed.
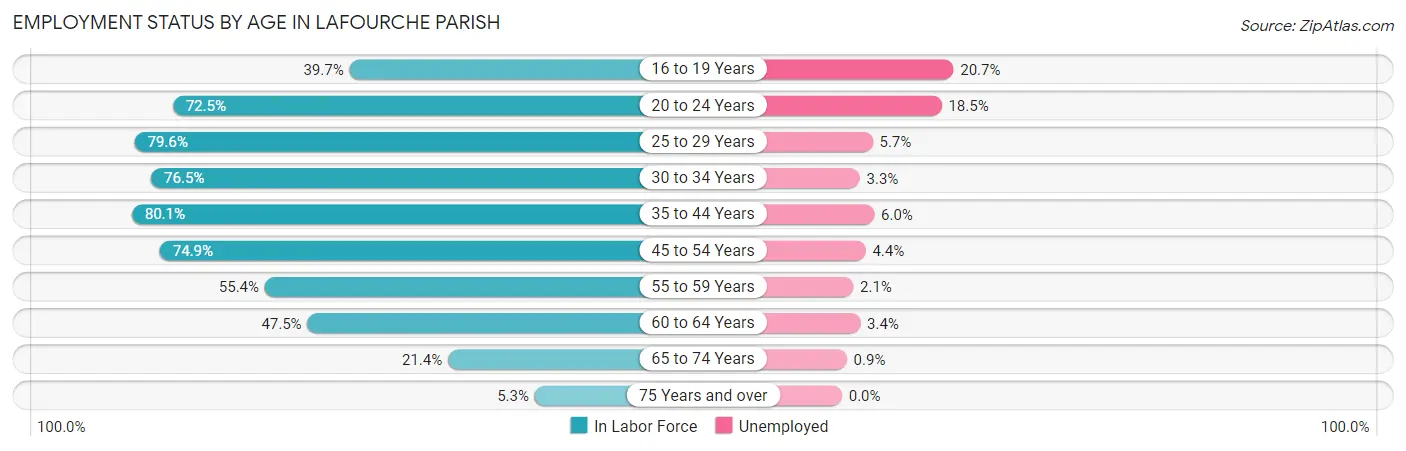
| Age Bracket | In Labor Force | Unemployed |
| 16 to 19 Years | 2,087 (39.7%) | 432 (20.7%) |
| 20 to 24 Years | 4,337 (72.5%) | 802 (18.5%) |
| 25 to 29 Years | 5,191 (79.6%) | 296 (5.7%) |
| 30 to 34 Years | 4,923 (76.5%) | 162 (3.3%) |
| 35 to 44 Years | 10,060 (80.1%) | 604 (6.0%) |
| 45 to 54 Years | 8,995 (74.9%) | 396 (4.4%) |
| 55 to 59 Years | 3,713 (55.4%) | 78 (2.1%) |
| 60 to 64 Years | 3,180 (47.5%) | 108 (3.4%) |
| 65 to 74 Years | 1,937 (21.4%) | 17 (0.9%) |
| 75 Years and over | 338 (5.3%) | 0 (0.0%) |
| Total | 44,764 (57.7%) | 2,910 (6.5%) |
Employment Status by Educational Attainment in Lafourche Parish
According to labor force statistics for Lafourche Parish, 70.8% of individuals (36,052) out of the total population between 25 and 64 years of age (50,921) are in the labor force, with 4.6% or 1,658 of them being unemployed. The group with the highest labor force participation rate are those with the educational attainment of bachelor's degree or higher, with 87.7% or 8,490 individuals in the labor force. Within the labor force, individuals with less than high school education have the highest percentage of unemployment, with 8.0% or 325 of them being unemployed.
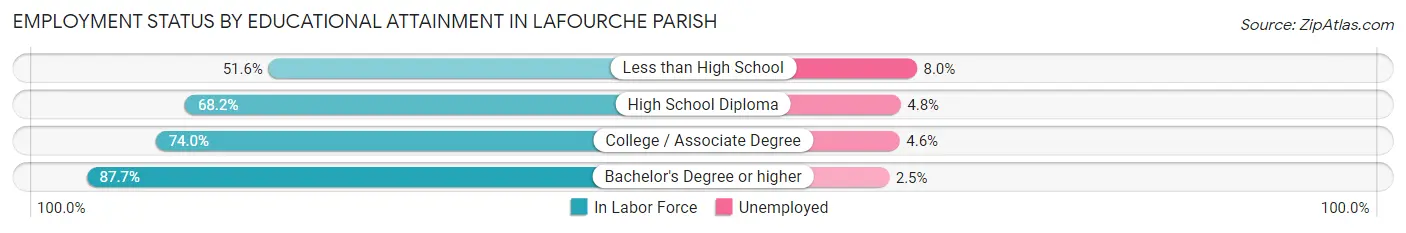
| Educational Attainment | In Labor Force | Unemployed |
| Less than High School | 4,068 (51.6%) | 631 (8.0%) |
| High School Diploma | 14,071 (68.2%) | 990 (4.8%) |
| College / Associate Degree | 9,416 (74.0%) | 585 (4.6%) |
| Bachelor's Degree or higher | 8,490 (87.7%) | 242 (2.5%) |
| Total | 36,052 (70.8%) | 2,342 (4.6%) |
Employment Occupations by Sex in Lafourche Parish
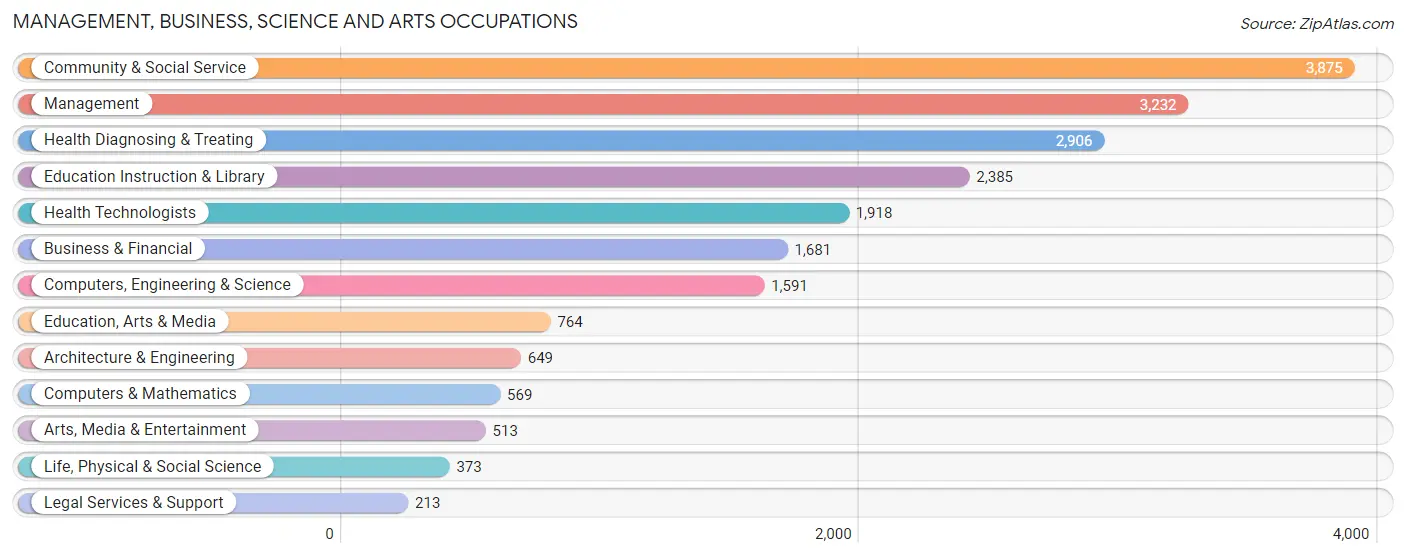
Management, Business, Science and Arts Occupations
The most common Management, Business, Science and Arts occupations in Lafourche Parish are Community & Social Service (3,875 | 9.3%), Management (3,232 | 7.7%), Health Diagnosing & Treating (2,906 | 6.9%), Education Instruction & Library (2,385 | 5.7%), and Health Technologists (1,918 | 4.6%).
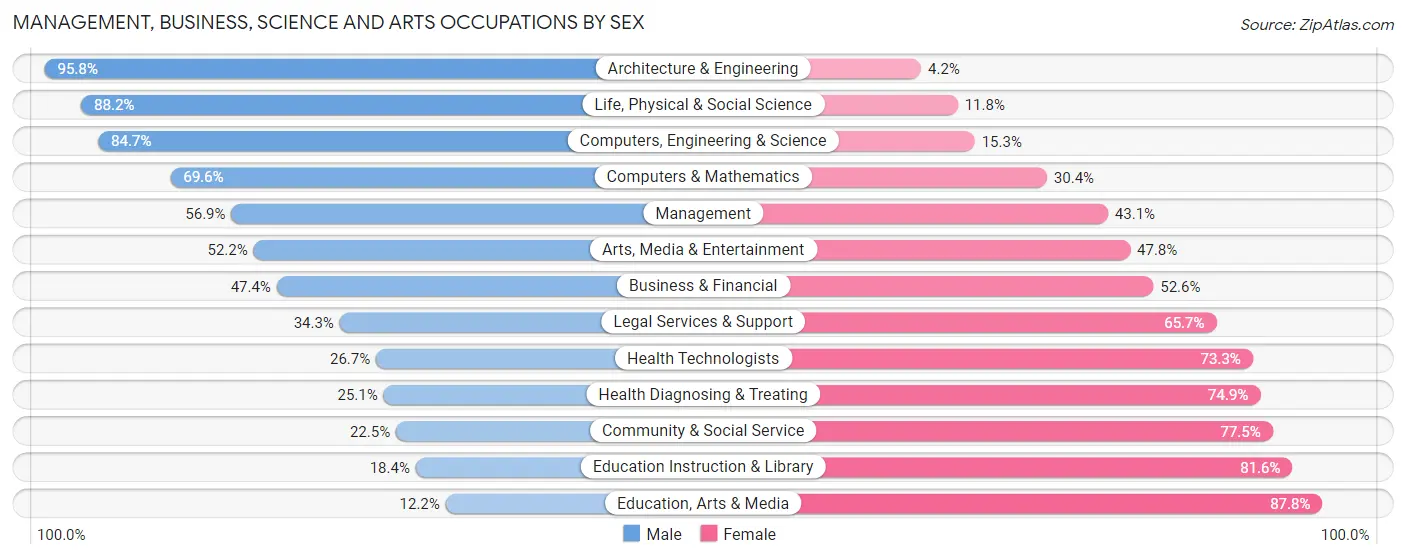
Management, Business, Science and Arts Occupations by Sex
Within the Management, Business, Science and Arts occupations in Lafourche Parish, the most male-oriented occupations are Architecture & Engineering (95.8%), Life, Physical & Social Science (88.2%), and Computers, Engineering & Science (84.7%), while the most female-oriented occupations are Education, Arts & Media (87.8%), Education Instruction & Library (81.6%), and Community & Social Service (77.5%).
| Occupation | Male | Female |
| Management | 1,838 (56.9%) | 1,394 (43.1%) |
| Business & Financial | 797 (47.4%) | 884 (52.6%) |
| Computers, Engineering & Science | 1,347 (84.7%) | 244 (15.3%) |
| Computers & Mathematics | 396 (69.6%) | 173 (30.4%) |
| Architecture & Engineering | 622 (95.8%) | 27 (4.2%) |
| Life, Physical & Social Science | 329 (88.2%) | 44 (11.8%) |
| Community & Social Service | 873 (22.5%) | 3,002 (77.5%) |
| Education, Arts & Media | 93 (12.2%) | 671 (87.8%) |
| Legal Services & Support | 73 (34.3%) | 140 (65.7%) |
| Education Instruction & Library | 439 (18.4%) | 1,946 (81.6%) |
| Arts, Media & Entertainment | 268 (52.2%) | 245 (47.8%) |
| Health Diagnosing & Treating | 730 (25.1%) | 2,176 (74.9%) |
| Health Technologists | 512 (26.7%) | 1,406 (73.3%) |
| Total (Category) | 5,585 (42.0%) | 7,700 (58.0%) |
| Total (Overall) | 23,208 (55.5%) | 18,637 (44.5%) |
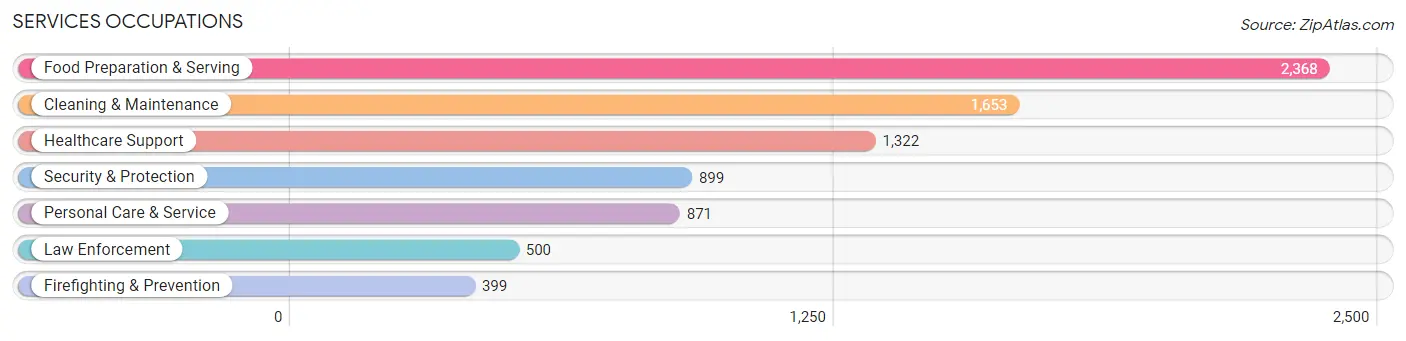
Services Occupations
The most common Services occupations in Lafourche Parish are Food Preparation & Serving (2,368 | 5.7%), Cleaning & Maintenance (1,653 | 4.0%), Healthcare Support (1,322 | 3.2%), Security & Protection (899 | 2.1%), and Personal Care & Service (871 | 2.1%).
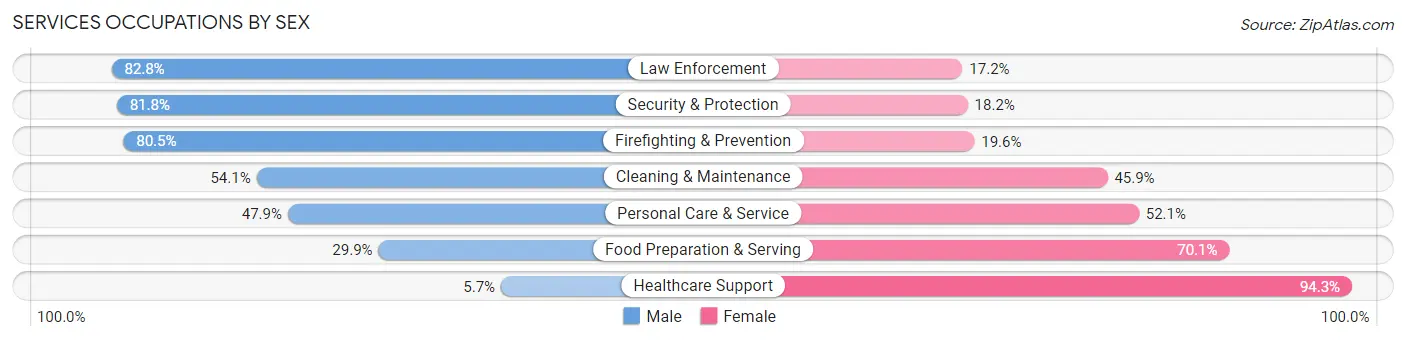
Services Occupations by Sex
Within the Services occupations in Lafourche Parish, the most male-oriented occupations are Law Enforcement (82.8%), Security & Protection (81.8%), and Firefighting & Prevention (80.4%), while the most female-oriented occupations are Healthcare Support (94.3%), Food Preparation & Serving (70.1%), and Personal Care & Service (52.1%).
| Occupation | Male | Female |
| Healthcare Support | 75 (5.7%) | 1,247 (94.3%) |
| Security & Protection | 735 (81.8%) | 164 (18.2%) |
| Firefighting & Prevention | 321 (80.4%) | 78 (19.6%) |
| Law Enforcement | 414 (82.8%) | 86 (17.2%) |
| Food Preparation & Serving | 709 (29.9%) | 1,659 (70.1%) |
| Cleaning & Maintenance | 894 (54.1%) | 759 (45.9%) |
| Personal Care & Service | 417 (47.9%) | 454 (52.1%) |
| Total (Category) | 2,830 (39.8%) | 4,283 (60.2%) |
| Total (Overall) | 23,208 (55.5%) | 18,637 (44.5%) |
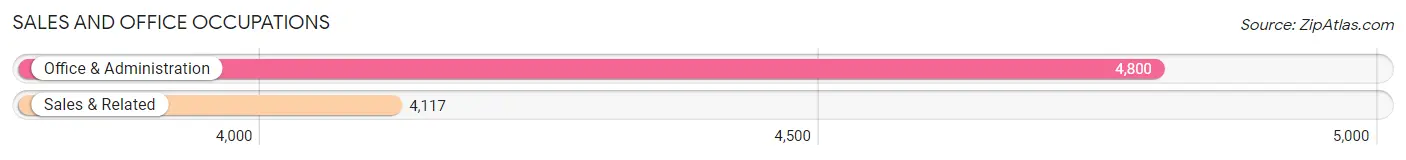
Sales and Office Occupations
The most common Sales and Office occupations in Lafourche Parish are Office & Administration (4,800 | 11.5%), and Sales & Related (4,117 | 9.8%).
Sales and Office Occupations by Sex
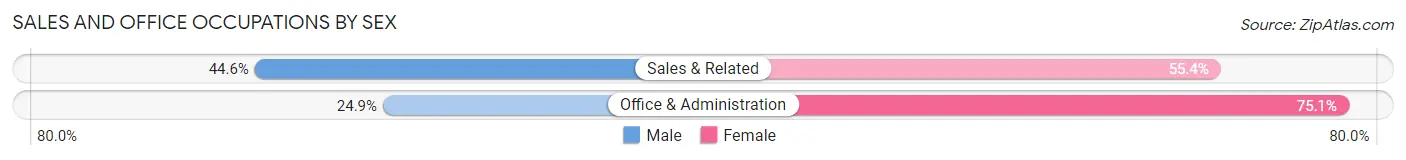
| Occupation | Male | Female |
| Sales & Related | 1,836 (44.6%) | 2,281 (55.4%) |
| Office & Administration | 1,194 (24.9%) | 3,606 (75.1%) |
| Total (Category) | 3,030 (34.0%) | 5,887 (66.0%) |
| Total (Overall) | 23,208 (55.5%) | 18,637 (44.5%) |
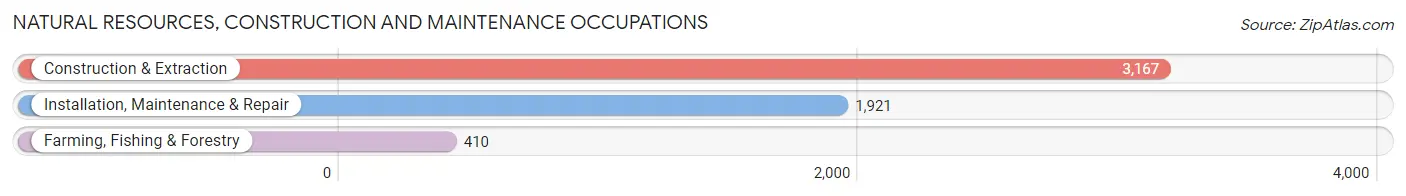
Natural Resources, Construction and Maintenance Occupations
The most common Natural Resources, Construction and Maintenance occupations in Lafourche Parish are Construction & Extraction (3,167 | 7.6%), Installation, Maintenance & Repair (1,921 | 4.6%), and Farming, Fishing & Forestry (410 | 1.0%).
Natural Resources, Construction and Maintenance Occupations by Sex
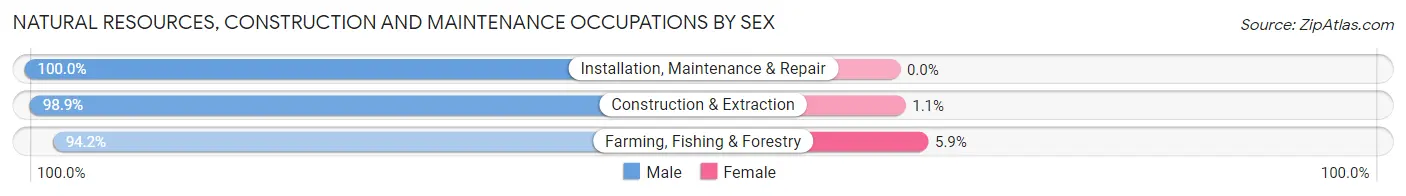
| Occupation | Male | Female |
| Farming, Fishing & Forestry | 386 (94.2%) | 24 (5.9%) |
| Construction & Extraction | 3,132 (98.9%) | 35 (1.1%) |
| Installation, Maintenance & Repair | 1,921 (100.0%) | 0 (0.0%) |
| Total (Category) | 5,439 (98.9%) | 59 (1.1%) |
| Total (Overall) | 23,208 (55.5%) | 18,637 (44.5%) |
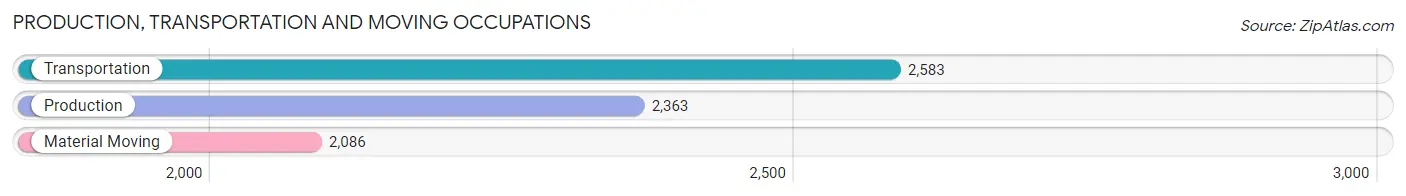
Production, Transportation and Moving Occupations
The most common Production, Transportation and Moving occupations in Lafourche Parish are Transportation (2,583 | 6.2%), Production (2,363 | 5.7%), and Material Moving (2,086 | 5.0%).
Production, Transportation and Moving Occupations by Sex
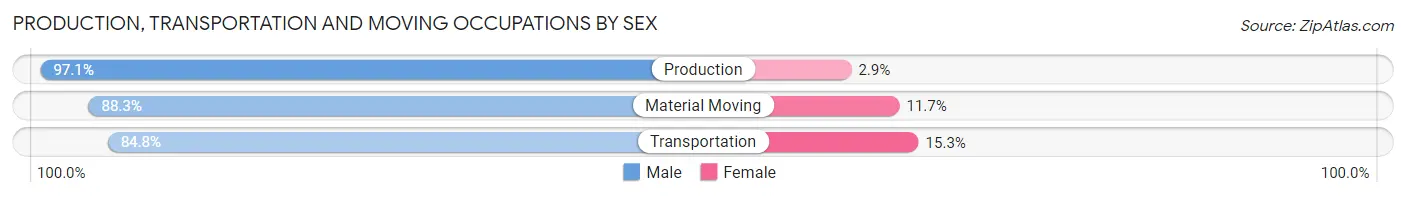
| Occupation | Male | Female |
| Production | 2,294 (97.1%) | 69 (2.9%) |
| Transportation | 2,189 (84.8%) | 394 (15.2%) |
| Material Moving | 1,841 (88.3%) | 245 (11.7%) |
| Total (Category) | 6,324 (89.9%) | 708 (10.1%) |
| Total (Overall) | 23,208 (55.5%) | 18,637 (44.5%) |
Employment Industries by Sex in Lafourche Parish
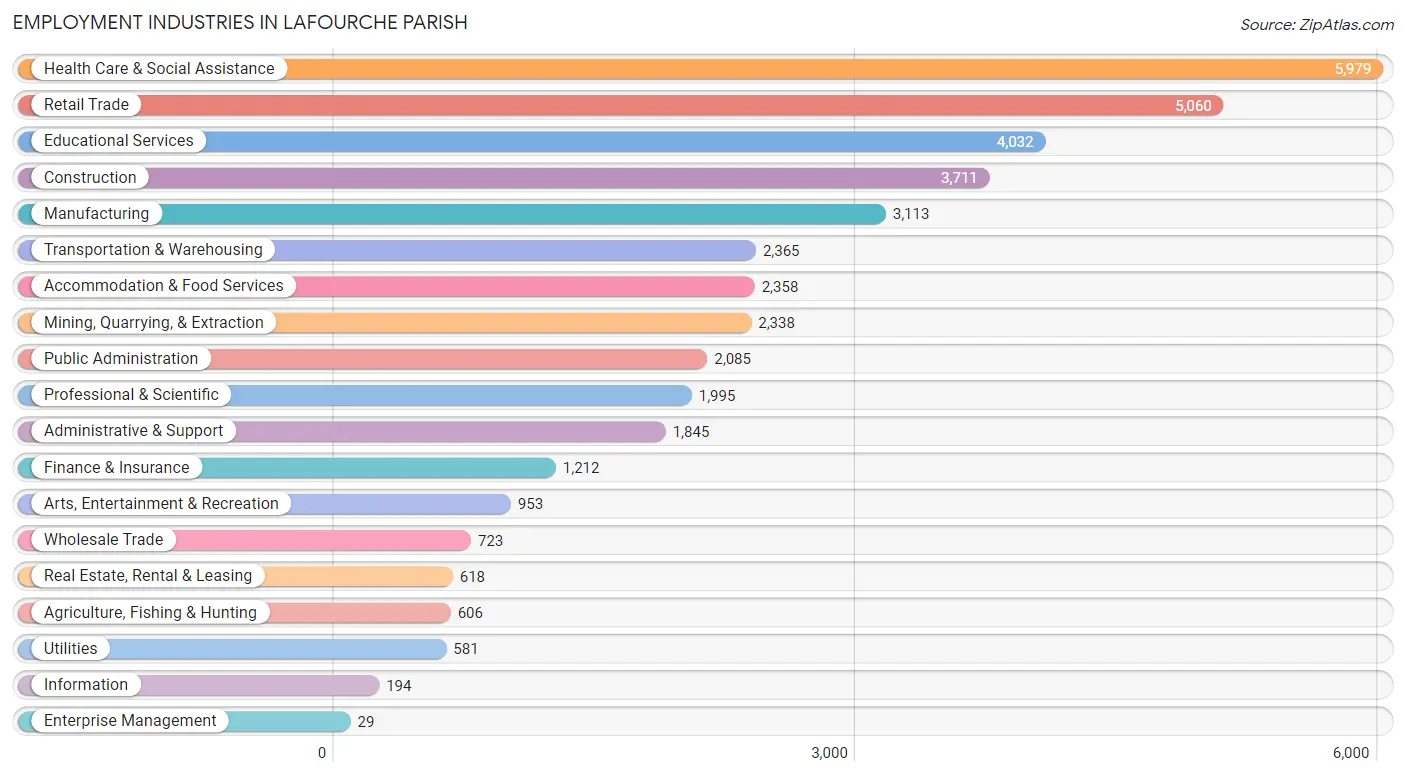
Employment Industries in Lafourche Parish
The major employment industries in Lafourche Parish include Health Care & Social Assistance (5,979 | 14.3%), Retail Trade (5,060 | 12.1%), Educational Services (4,032 | 9.6%), Construction (3,711 | 8.9%), and Manufacturing (3,113 | 7.4%).
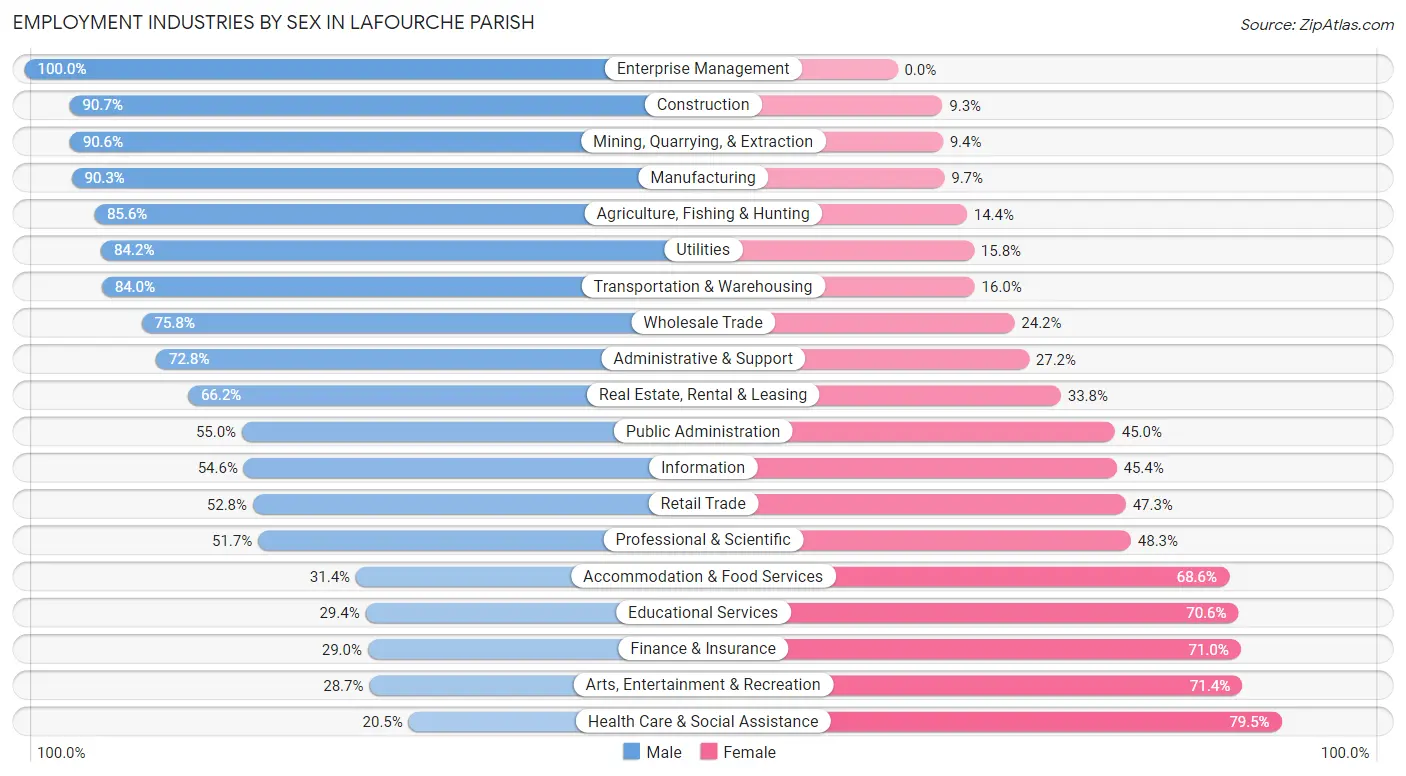
Employment Industries by Sex in Lafourche Parish
The Lafourche Parish industries that see more men than women are Enterprise Management (100.0%), Construction (90.7%), and Mining, Quarrying, & Extraction (90.6%), whereas the industries that tend to have a higher number of women are Health Care & Social Assistance (79.5%), Arts, Entertainment & Recreation (71.4%), and Finance & Insurance (71.0%).
| Industry | Male | Female |
| Agriculture, Fishing & Hunting | 519 (85.6%) | 87 (14.4%) |
| Mining, Quarrying, & Extraction | 2,119 (90.6%) | 219 (9.4%) |
| Construction | 3,366 (90.7%) | 345 (9.3%) |
| Manufacturing | 2,811 (90.3%) | 302 (9.7%) |
| Wholesale Trade | 548 (75.8%) | 175 (24.2%) |
| Retail Trade | 2,669 (52.7%) | 2,391 (47.2%) |
| Transportation & Warehousing | 1,987 (84.0%) | 378 (16.0%) |
| Utilities | 489 (84.2%) | 92 (15.8%) |
| Information | 106 (54.6%) | 88 (45.4%) |
| Finance & Insurance | 351 (29.0%) | 861 (71.0%) |
| Real Estate, Rental & Leasing | 409 (66.2%) | 209 (33.8%) |
| Professional & Scientific | 1,031 (51.7%) | 964 (48.3%) |
| Enterprise Management | 29 (100.0%) | 0 (0.0%) |
| Administrative & Support | 1,343 (72.8%) | 502 (27.2%) |
| Educational Services | 1,187 (29.4%) | 2,845 (70.6%) |
| Health Care & Social Assistance | 1,227 (20.5%) | 4,752 (79.5%) |
| Arts, Entertainment & Recreation | 273 (28.6%) | 680 (71.4%) |
| Accommodation & Food Services | 741 (31.4%) | 1,617 (68.6%) |
| Public Administration | 1,147 (55.0%) | 938 (45.0%) |
| Total | 23,208 (55.5%) | 18,637 (44.5%) |
Education in Lafourche Parish
School Enrollment in Lafourche Parish
The most common levels of schooling among the 21,384 students in Lafourche Parish are middle school (5,281 | 24.7%), elementary school (4,809 | 22.5%), and high school (4,435 | 20.7%).
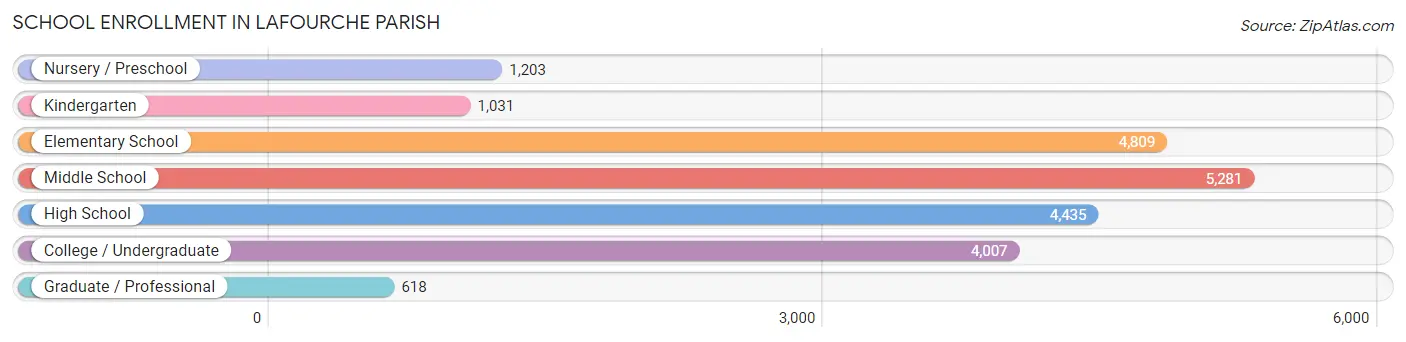
| School Level | # Students | % Students |
| Nursery / Preschool | 1,203 | 5.6% |
| Kindergarten | 1,031 | 4.8% |
| Elementary School | 4,809 | 22.5% |
| Middle School | 5,281 | 24.7% |
| High School | 4,435 | 20.7% |
| College / Undergraduate | 4,007 | 18.7% |
| Graduate / Professional | 618 | 2.9% |
| Total | 21,384 | 100.0% |
School Enrollment by Age by Funding Source in Lafourche Parish
Out of a total of 21,384 students who are enrolled in schools in Lafourche Parish, 3,764 (17.6%) attend a private institution, while the remaining 17,620 (82.4%) are enrolled in public schools. The age group of 3 to 4 year olds has the highest likelihood of being enrolled in private schools, with 190 (22.3% in the age bracket) enrolled. Conversely, the age group of 20 to 24 year olds has the lowest likelihood of being enrolled in a private school, with 1,797 (91.4% in the age bracket) attending a public institution.
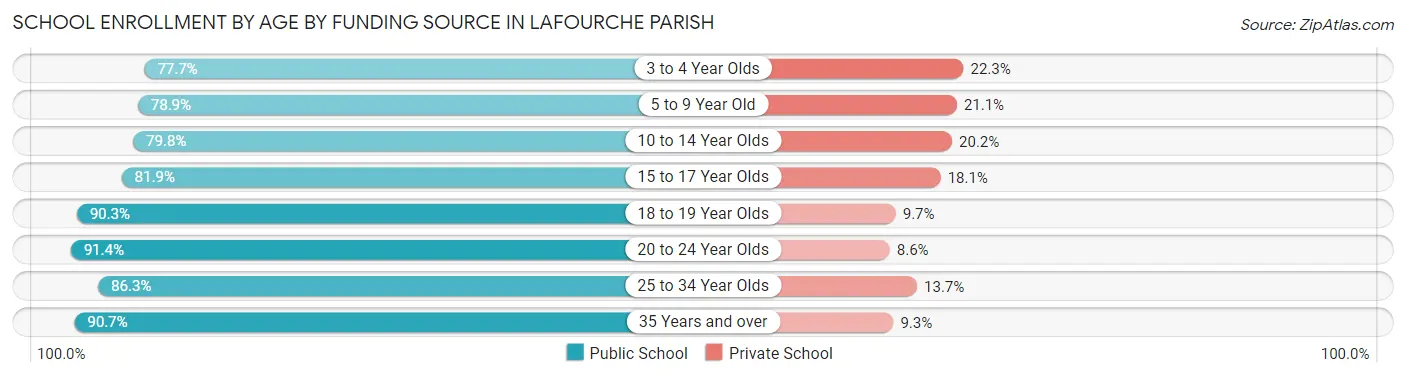
| Age Bracket | Public School | Private School |
| 3 to 4 Year Olds | 661 (77.7%) | 190 (22.3%) |
| 5 to 9 Year Old | 4,501 (78.9%) | 1,204 (21.1%) |
| 10 to 14 Year Olds | 4,831 (79.8%) | 1,223 (20.2%) |
| 15 to 17 Year Olds | 2,765 (81.9%) | 610 (18.1%) |
| 18 to 19 Year Olds | 1,739 (90.3%) | 187 (9.7%) |
| 20 to 24 Year Olds | 1,797 (91.4%) | 169 (8.6%) |
| 25 to 34 Year Olds | 789 (86.3%) | 125 (13.7%) |
| 35 Years and over | 538 (90.7%) | 55 (9.3%) |
| Total | 17,620 (82.4%) | 3,764 (17.6%) |
Educational Attainment by Field of Study in Lafourche Parish
Education (2,958 | 22.9%), business (2,524 | 19.5%), science & technology (2,127 | 16.5%), arts & humanities (750 | 5.8%), and psychology (690 | 5.3%) are the most common fields of study among 12,931 individuals in Lafourche Parish who have obtained a bachelor's degree or higher.
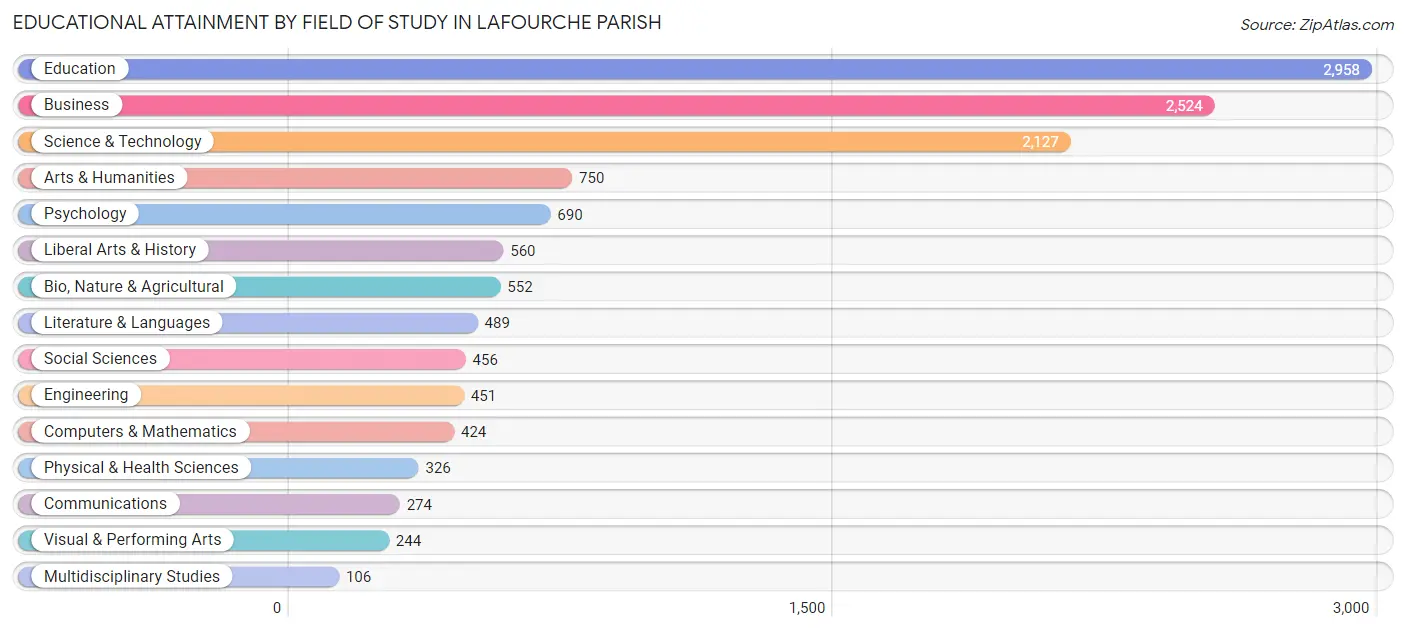
| Field of Study | # Graduates | % Graduates |
| Computers & Mathematics | 424 | 3.3% |
| Bio, Nature & Agricultural | 552 | 4.3% |
| Physical & Health Sciences | 326 | 2.5% |
| Psychology | 690 | 5.3% |
| Social Sciences | 456 | 3.5% |
| Engineering | 451 | 3.5% |
| Multidisciplinary Studies | 106 | 0.8% |
| Science & Technology | 2,127 | 16.5% |
| Business | 2,524 | 19.5% |
| Education | 2,958 | 22.9% |
| Literature & Languages | 489 | 3.8% |
| Liberal Arts & History | 560 | 4.3% |
| Visual & Performing Arts | 244 | 1.9% |
| Communications | 274 | 2.1% |
| Arts & Humanities | 750 | 5.8% |
| Total | 12,931 | 100.0% |
Transportation & Commute in Lafourche Parish
Vehicle Availability by Sex in Lafourche Parish
The most prevalent vehicle ownership categories in Lafourche Parish are males with 2 vehicles (11,181, accounting for 49.7%) and females with 2 vehicles (8,494, making up 62.4%).
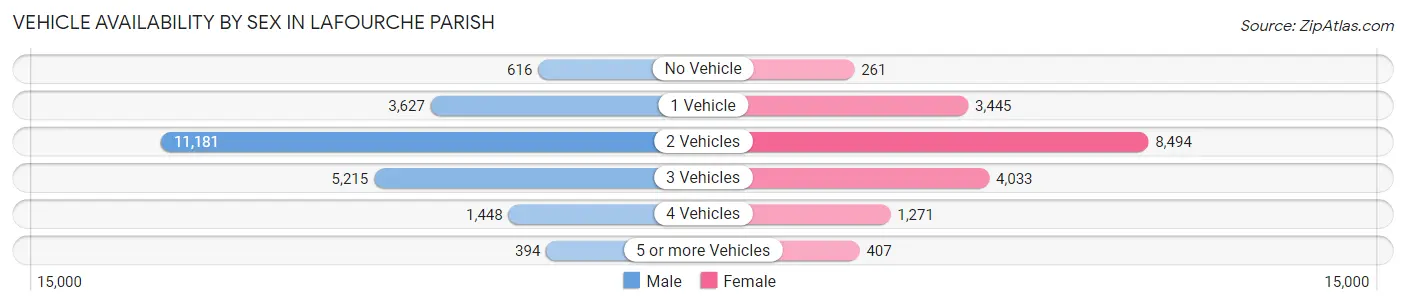
| Vehicles Available | Male | Female |
| No Vehicle | 616 (2.7%) | 261 (1.5%) |
| 1 Vehicle | 3,627 (16.1%) | 3,445 (19.2%) |
| 2 Vehicles | 11,181 (49.7%) | 8,494 (47.4%) |
| 3 Vehicles | 5,215 (23.2%) | 4,033 (22.5%) |
| 4 Vehicles | 1,448 (6.4%) | 1,271 (7.1%) |
| 5 or more Vehicles | 394 (1.8%) | 407 (2.3%) |
| Total | 22,481 (100.0%) | 17,911 (100.0%) |
Commute Time in Lafourche Parish
The most frequently occuring commute durations in Lafourche Parish are 10 to 14 minutes (6,377 commuters, 16.2%), 15 to 19 minutes (5,167 commuters, 13.1%), and 5 to 9 minutes (4,802 commuters, 12.2%).
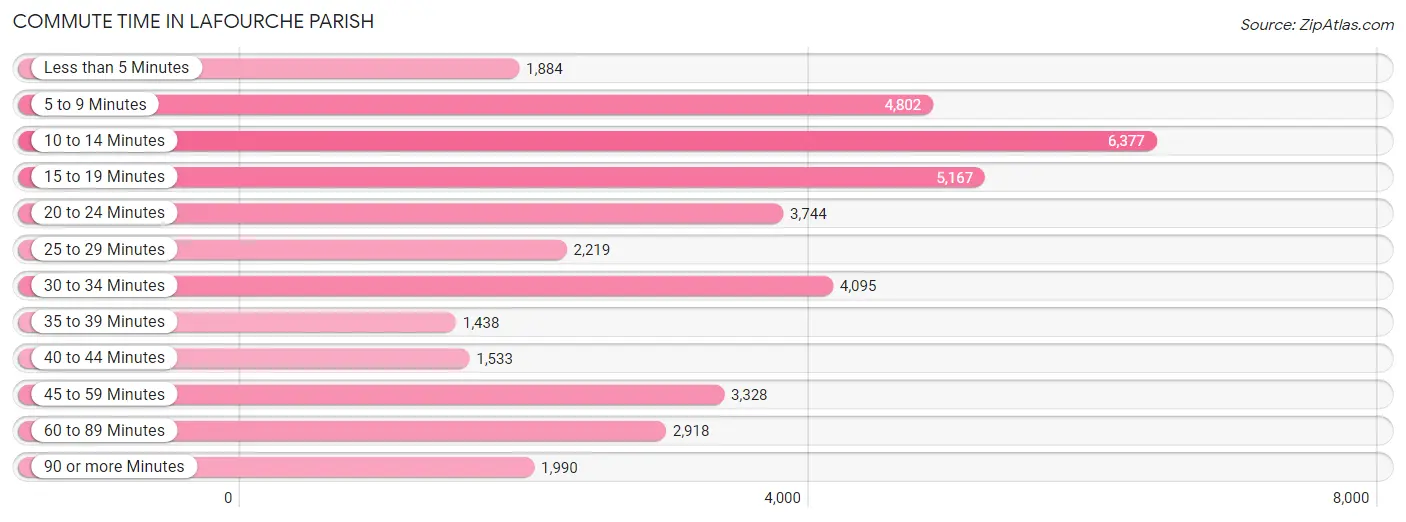
| Commute Time | # Commuters | % Commuters |
| Less than 5 Minutes | 1,884 | 4.8% |
| 5 to 9 Minutes | 4,802 | 12.2% |
| 10 to 14 Minutes | 6,377 | 16.2% |
| 15 to 19 Minutes | 5,167 | 13.1% |
| 20 to 24 Minutes | 3,744 | 9.5% |
| 25 to 29 Minutes | 2,219 | 5.6% |
| 30 to 34 Minutes | 4,095 | 10.4% |
| 35 to 39 Minutes | 1,438 | 3.6% |
| 40 to 44 Minutes | 1,533 | 3.9% |
| 45 to 59 Minutes | 3,328 | 8.4% |
| 60 to 89 Minutes | 2,918 | 7.4% |
| 90 or more Minutes | 1,990 | 5.0% |
Commute Time by Sex in Lafourche Parish
The most common commute times in Lafourche Parish are 10 to 14 minutes (2,995 commuters, 13.5%) for males and 10 to 14 minutes (3,382 commuters, 19.5%) for females.
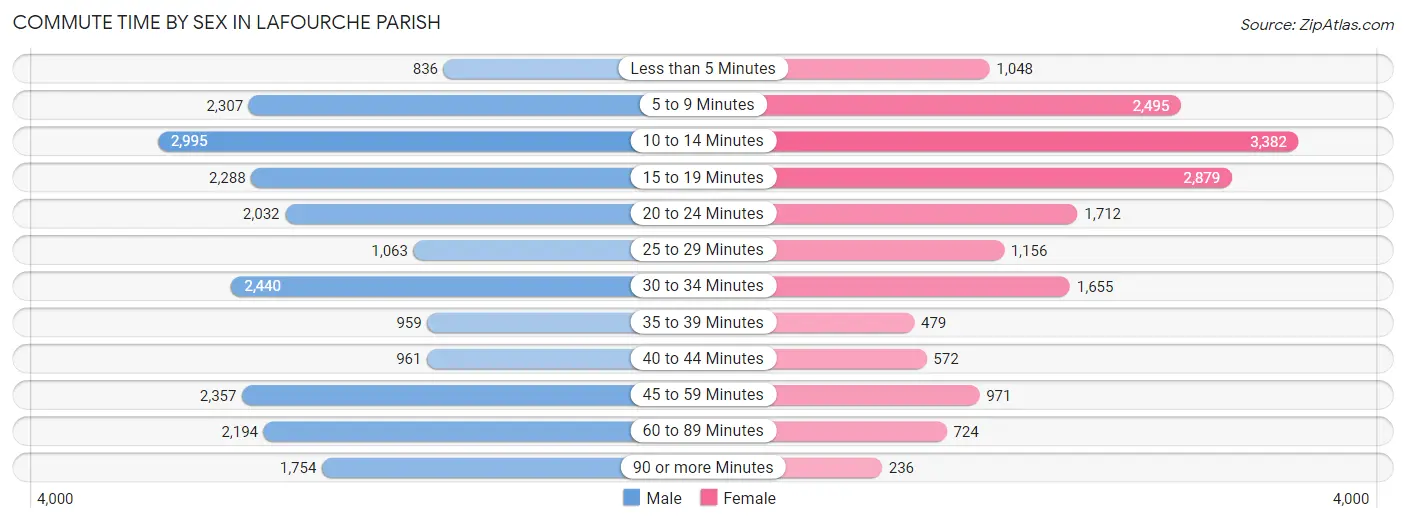
| Commute Time | Male | Female |
| Less than 5 Minutes | 836 (3.8%) | 1,048 (6.0%) |
| 5 to 9 Minutes | 2,307 (10.4%) | 2,495 (14.4%) |
| 10 to 14 Minutes | 2,995 (13.5%) | 3,382 (19.5%) |
| 15 to 19 Minutes | 2,288 (10.3%) | 2,879 (16.6%) |
| 20 to 24 Minutes | 2,032 (9.2%) | 1,712 (9.9%) |
| 25 to 29 Minutes | 1,063 (4.8%) | 1,156 (6.7%) |
| 30 to 34 Minutes | 2,440 (11.0%) | 1,655 (9.6%) |
| 35 to 39 Minutes | 959 (4.3%) | 479 (2.8%) |
| 40 to 44 Minutes | 961 (4.3%) | 572 (3.3%) |
| 45 to 59 Minutes | 2,357 (10.6%) | 971 (5.6%) |
| 60 to 89 Minutes | 2,194 (9.9%) | 724 (4.2%) |
| 90 or more Minutes | 1,754 (7.9%) | 236 (1.4%) |
Time of Departure to Work by Sex in Lafourche Parish
The most frequent times of departure to work in Lafourche Parish are 6:00 AM to 6:29 AM (3,625, 16.3%) for males and 7:00 AM to 7:29 AM (3,203, 18.5%) for females.
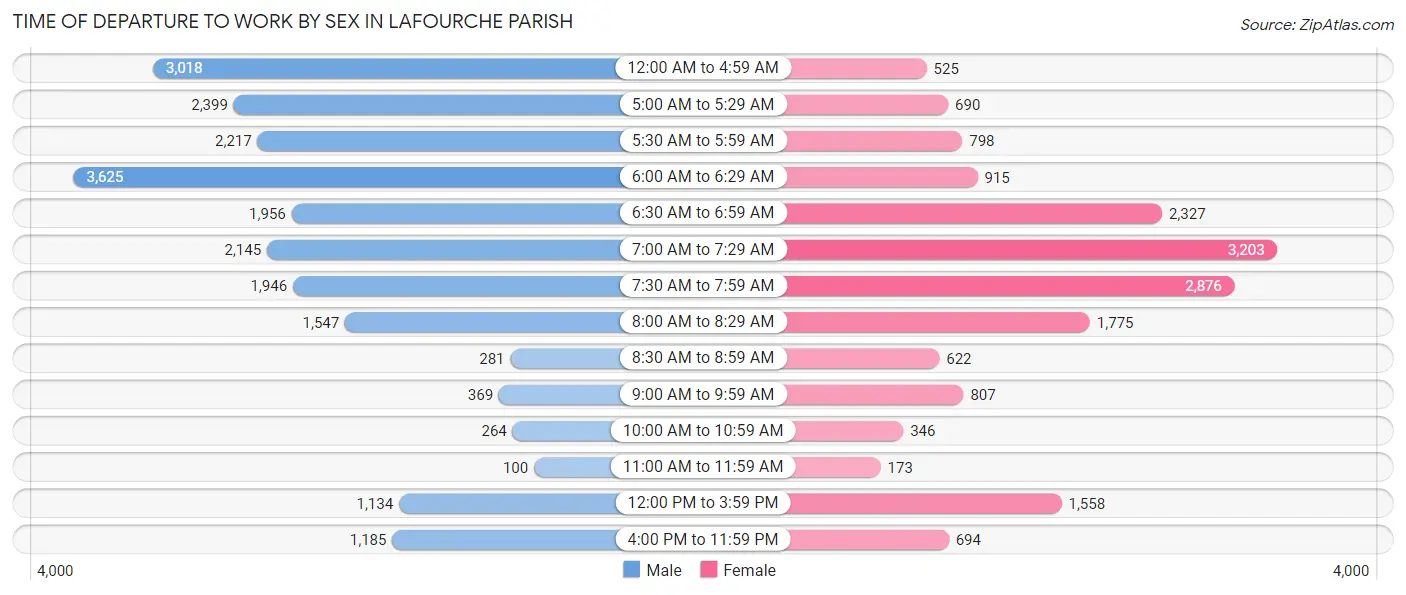
| Time of Departure | Male | Female |
| 12:00 AM to 4:59 AM | 3,018 (13.6%) | 525 (3.0%) |
| 5:00 AM to 5:29 AM | 2,399 (10.8%) | 690 (4.0%) |
| 5:30 AM to 5:59 AM | 2,217 (10.0%) | 798 (4.6%) |
| 6:00 AM to 6:29 AM | 3,625 (16.3%) | 915 (5.3%) |
| 6:30 AM to 6:59 AM | 1,956 (8.8%) | 2,327 (13.4%) |
| 7:00 AM to 7:29 AM | 2,145 (9.7%) | 3,203 (18.5%) |
| 7:30 AM to 7:59 AM | 1,946 (8.8%) | 2,876 (16.6%) |
| 8:00 AM to 8:29 AM | 1,547 (7.0%) | 1,775 (10.2%) |
| 8:30 AM to 8:59 AM | 281 (1.3%) | 622 (3.6%) |
| 9:00 AM to 9:59 AM | 369 (1.7%) | 807 (4.7%) |
| 10:00 AM to 10:59 AM | 264 (1.2%) | 346 (2.0%) |
| 11:00 AM to 11:59 AM | 100 (0.4%) | 173 (1.0%) |
| 12:00 PM to 3:59 PM | 1,134 (5.1%) | 1,558 (9.0%) |
| 4:00 PM to 11:59 PM | 1,185 (5.3%) | 694 (4.0%) |
| Total | 22,186 (100.0%) | 17,309 (100.0%) |
Housing Occupancy in Lafourche Parish
Occupancy by Ownership in Lafourche Parish
Of the total 36,828 dwellings in Lafourche Parish, owner-occupied units account for 28,826 (78.3%), while renter-occupied units make up 8,002 (21.7%).
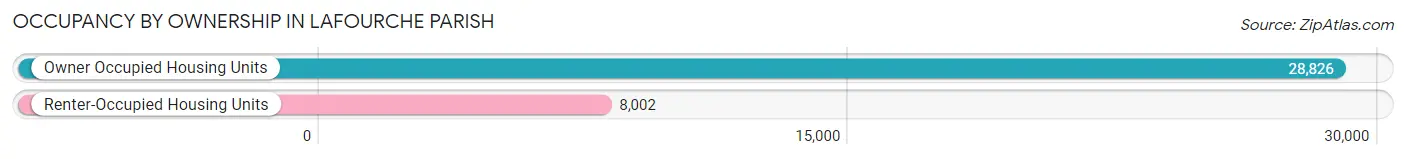
| Occupancy | # Housing Units | % Housing Units |
| Owner Occupied Housing Units | 28,826 | 78.3% |
| Renter-Occupied Housing Units | 8,002 | 21.7% |
| Total Occupied Housing Units | 36,828 | 100.0% |
Occupancy by Household Size in Lafourche Parish
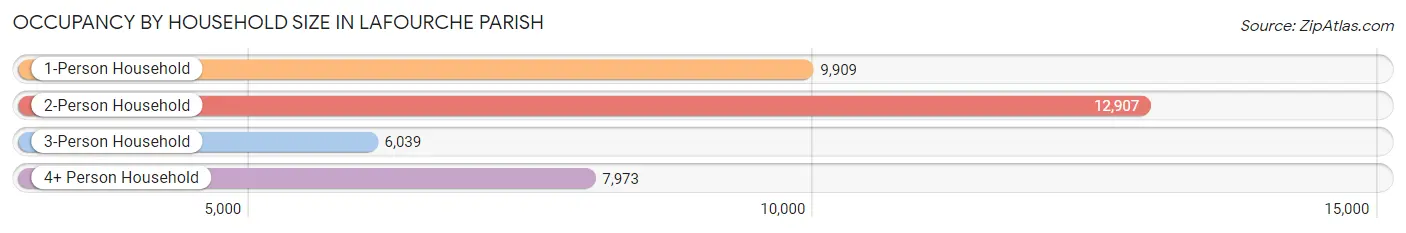
| Household Size | # Housing Units | % Housing Units |
| 1-Person Household | 9,909 | 26.9% |
| 2-Person Household | 12,907 | 35.0% |
| 3-Person Household | 6,039 | 16.4% |
| 4+ Person Household | 7,973 | 21.6% |
| Total Housing Units | 36,828 | 100.0% |
Occupancy by Ownership by Household Size in Lafourche Parish
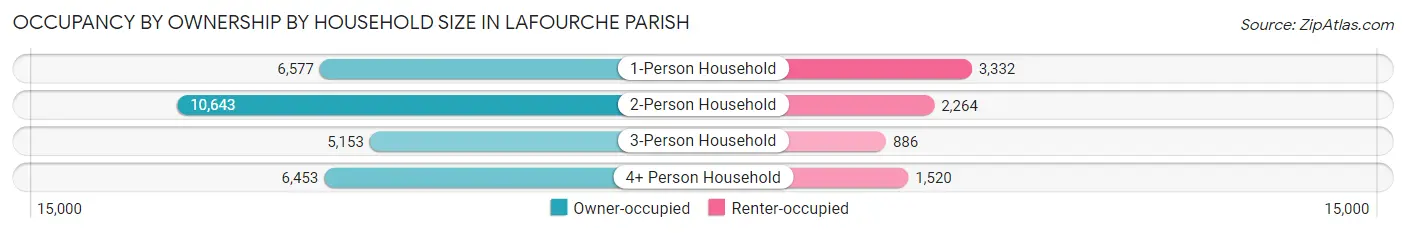
| Household Size | Owner-occupied | Renter-occupied |
| 1-Person Household | 6,577 (66.4%) | 3,332 (33.6%) |
| 2-Person Household | 10,643 (82.5%) | 2,264 (17.5%) |
| 3-Person Household | 5,153 (85.3%) | 886 (14.7%) |
| 4+ Person Household | 6,453 (80.9%) | 1,520 (19.1%) |
| Total Housing Units | 28,826 (78.3%) | 8,002 (21.7%) |
Occupancy by Educational Attainment in Lafourche Parish
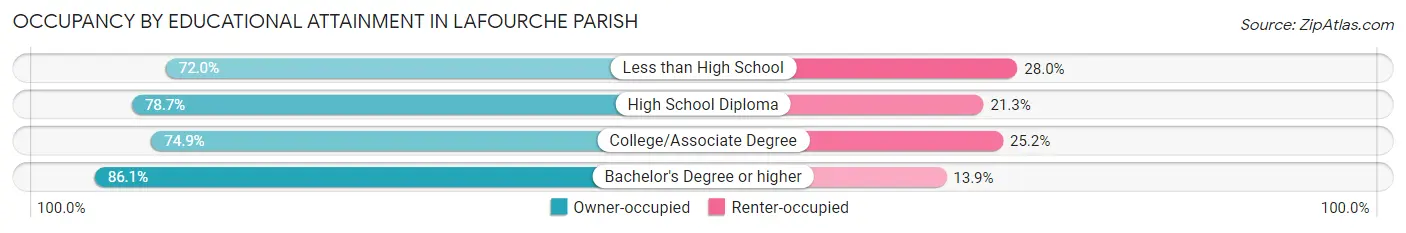
| Household Size | Owner-occupied | Renter-occupied |
| Less than High School | 4,479 (72.0%) | 1,742 (28.0%) |
| High School Diploma | 11,013 (78.7%) | 2,979 (21.3%) |
| College/Associate Degree | 6,451 (74.9%) | 2,168 (25.2%) |
| Bachelor's Degree or higher | 6,883 (86.1%) | 1,113 (13.9%) |
Occupancy by Age of Householder in Lafourche Parish
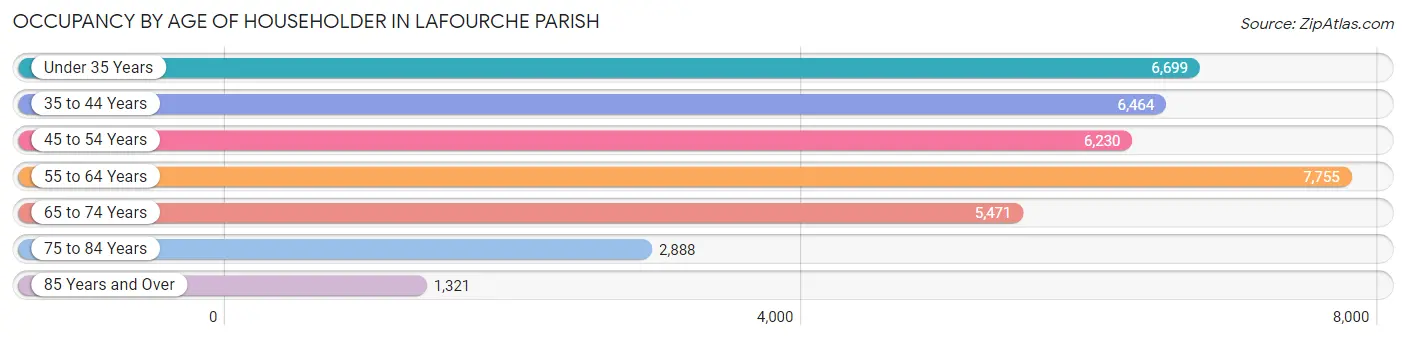
| Age Bracket | # Households | % Households |
| Under 35 Years | 6,699 | 18.2% |
| 35 to 44 Years | 6,464 | 17.5% |
| 45 to 54 Years | 6,230 | 16.9% |
| 55 to 64 Years | 7,755 | 21.1% |
| 65 to 74 Years | 5,471 | 14.9% |
| 75 to 84 Years | 2,888 | 7.8% |
| 85 Years and Over | 1,321 | 3.6% |
| Total | 36,828 | 100.0% |
Housing Finances in Lafourche Parish
Median Income by Occupancy in Lafourche Parish
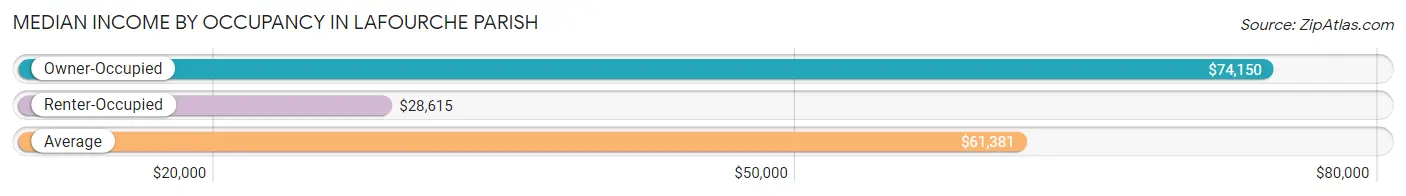
| Occupancy Type | # Households | Median Income |
| Owner-Occupied | 28,826 (78.3%) | $74,150 |
| Renter-Occupied | 8,002 (21.7%) | $28,615 |
| Average | 36,828 (100.0%) | $61,381 |
Occupancy by Householder Income Bracket in Lafourche Parish
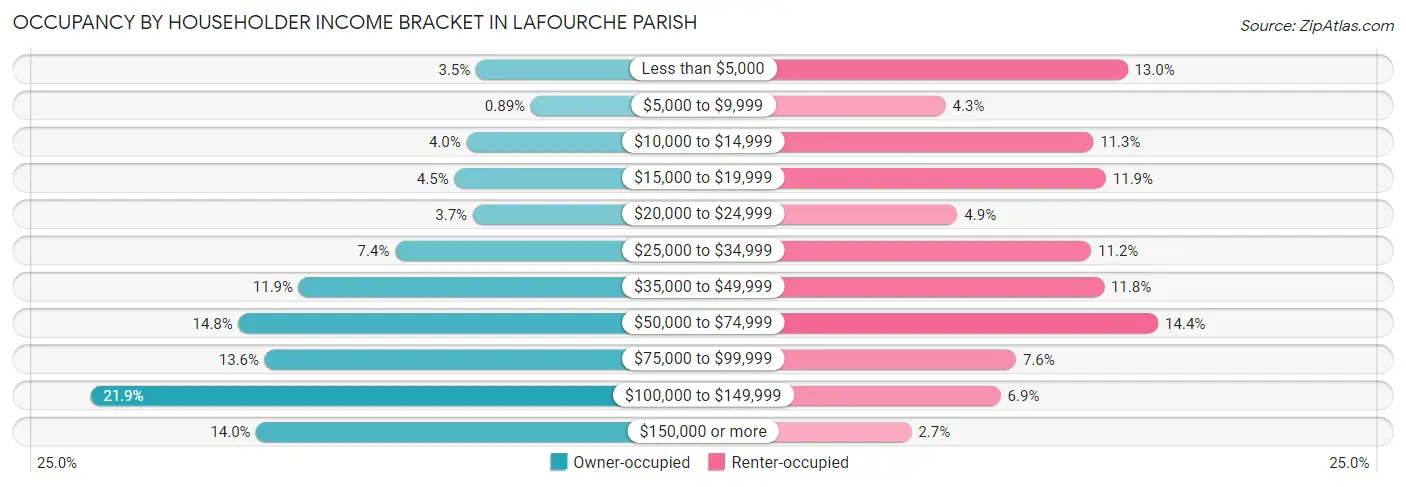
| Income Bracket | Owner-occupied | Renter-occupied |
| Less than $5,000 | 1,008 (3.5%) | 1,036 (13.0%) |
| $5,000 to $9,999 | 256 (0.9%) | 343 (4.3%) |
| $10,000 to $14,999 | 1,138 (4.0%) | 906 (11.3%) |
| $15,000 to $19,999 | 1,305 (4.5%) | 954 (11.9%) |
| $20,000 to $24,999 | 1,053 (3.6%) | 388 (4.9%) |
| $25,000 to $34,999 | 2,118 (7.3%) | 898 (11.2%) |
| $35,000 to $49,999 | 3,441 (11.9%) | 947 (11.8%) |
| $50,000 to $74,999 | 4,269 (14.8%) | 1,153 (14.4%) |
| $75,000 to $99,999 | 3,909 (13.6%) | 611 (7.6%) |
| $100,000 to $149,999 | 6,305 (21.9%) | 553 (6.9%) |
| $150,000 or more | 4,024 (14.0%) | 213 (2.7%) |
| Total | 28,826 (100.0%) | 8,002 (100.0%) |
Monthly Housing Cost Tiers in Lafourche Parish
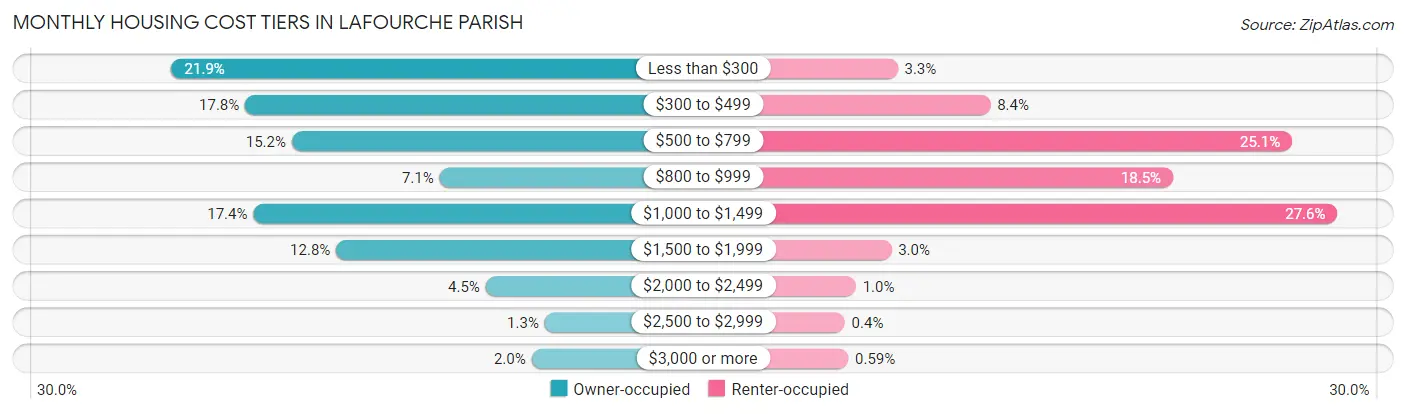
| Monthly Cost | Owner-occupied | Renter-occupied |
| Less than $300 | 6,310 (21.9%) | 266 (3.3%) |
| $300 to $499 | 5,136 (17.8%) | 675 (8.4%) |
| $500 to $799 | 4,394 (15.2%) | 2,009 (25.1%) |
| $800 to $999 | 2,041 (7.1%) | 1,483 (18.5%) |
| $1,000 to $1,499 | 5,007 (17.4%) | 2,209 (27.6%) |
| $1,500 to $1,999 | 3,687 (12.8%) | 238 (3.0%) |
| $2,000 to $2,499 | 1,307 (4.5%) | 81 (1.0%) |
| $2,500 to $2,999 | 367 (1.3%) | 32 (0.4%) |
| $3,000 or more | 577 (2.0%) | 47 (0.6%) |
| Total | 28,826 (100.0%) | 8,002 (100.0%) |
Physical Housing Characteristics in Lafourche Parish
Housing Structures in Lafourche Parish
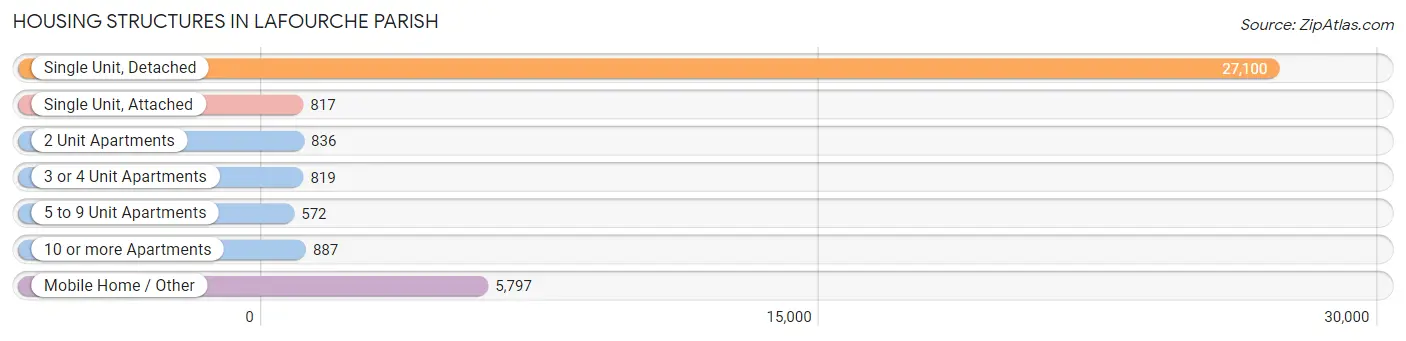
| Structure Type | # Housing Units | % Housing Units |
| Single Unit, Detached | 27,100 | 73.6% |
| Single Unit, Attached | 817 | 2.2% |
| 2 Unit Apartments | 836 | 2.3% |
| 3 or 4 Unit Apartments | 819 | 2.2% |
| 5 to 9 Unit Apartments | 572 | 1.5% |
| 10 or more Apartments | 887 | 2.4% |
| Mobile Home / Other | 5,797 | 15.7% |
| Total | 36,828 | 100.0% |
Housing Structures by Occupancy in Lafourche Parish
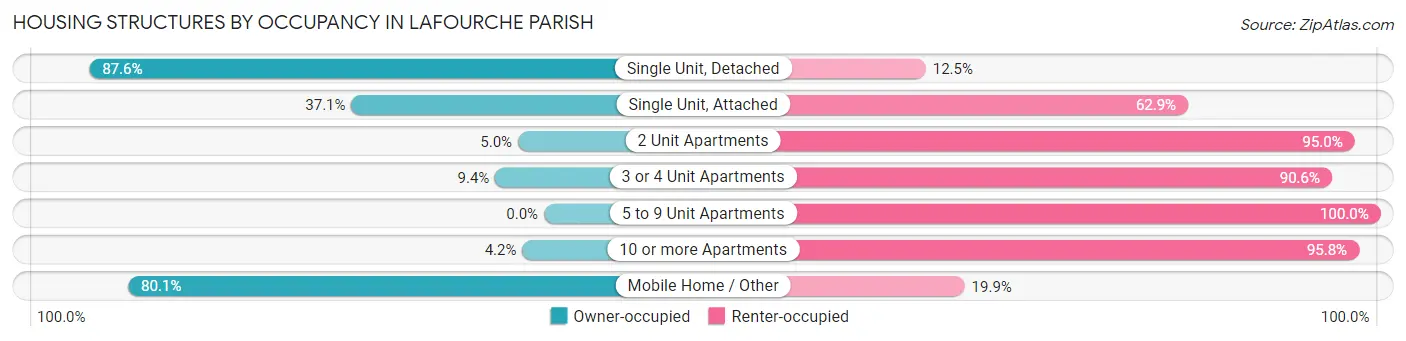
| Structure Type | Owner-occupied | Renter-occupied |
| Single Unit, Detached | 23,725 (87.5%) | 3,375 (12.4%) |
| Single Unit, Attached | 303 (37.1%) | 514 (62.9%) |
| 2 Unit Apartments | 42 (5.0%) | 794 (95.0%) |
| 3 or 4 Unit Apartments | 77 (9.4%) | 742 (90.6%) |
| 5 to 9 Unit Apartments | 0 (0.0%) | 572 (100.0%) |
| 10 or more Apartments | 37 (4.2%) | 850 (95.8%) |
| Mobile Home / Other | 4,642 (80.1%) | 1,155 (19.9%) |
| Total | 28,826 (78.3%) | 8,002 (21.7%) |
Housing Structures by Number of Rooms in Lafourche Parish
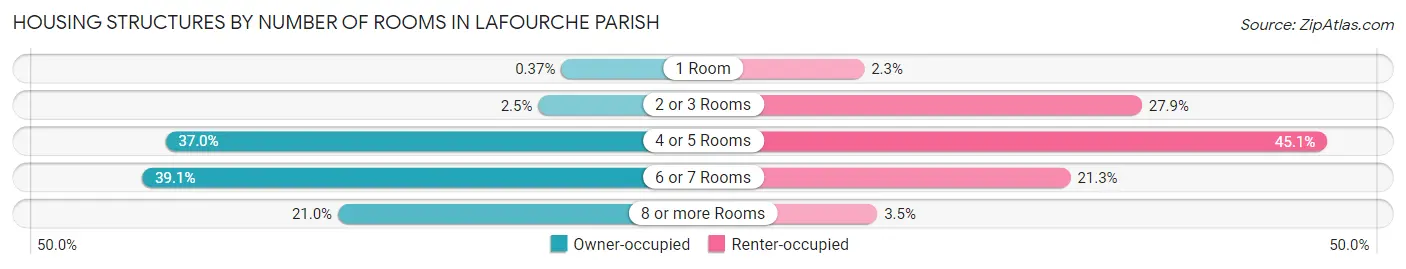
| Number of Rooms | Owner-occupied | Renter-occupied |
| 1 Room | 107 (0.4%) | 180 (2.2%) |
| 2 or 3 Rooms | 719 (2.5%) | 2,234 (27.9%) |
| 4 or 5 Rooms | 10,659 (37.0%) | 3,606 (45.1%) |
| 6 or 7 Rooms | 11,283 (39.1%) | 1,706 (21.3%) |
| 8 or more Rooms | 6,058 (21.0%) | 276 (3.5%) |
| Total | 28,826 (100.0%) | 8,002 (100.0%) |
Housing Structure by Heating Type in Lafourche Parish
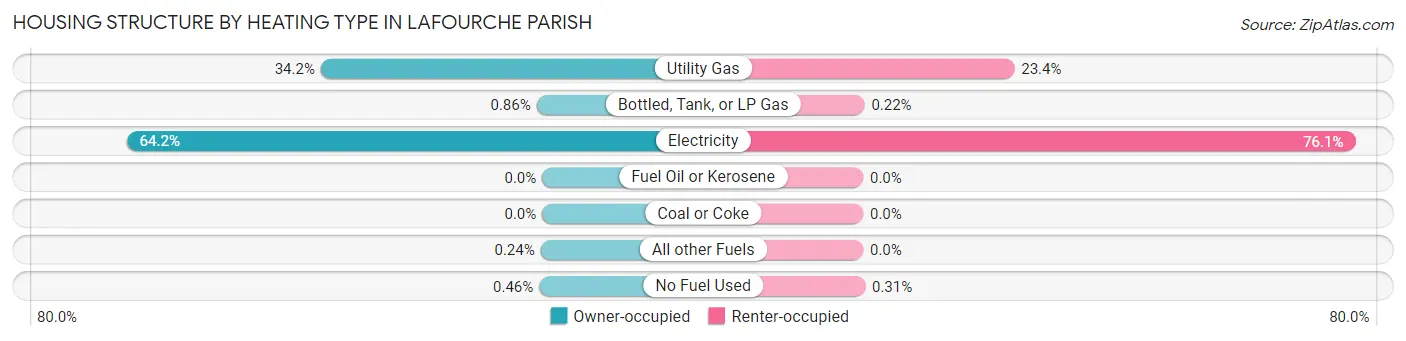
| Heating Type | Owner-occupied | Renter-occupied |
| Utility Gas | 9,863 (34.2%) | 1,871 (23.4%) |
| Bottled, Tank, or LP Gas | 249 (0.9%) | 18 (0.2%) |
| Electricity | 18,511 (64.2%) | 6,088 (76.1%) |
| Fuel Oil or Kerosene | 0 (0.0%) | 0 (0.0%) |
| Coal or Coke | 0 (0.0%) | 0 (0.0%) |
| All other Fuels | 70 (0.2%) | 0 (0.0%) |
| No Fuel Used | 133 (0.5%) | 25 (0.3%) |
| Total | 28,826 (100.0%) | 8,002 (100.0%) |
Household Vehicle Usage in Lafourche Parish
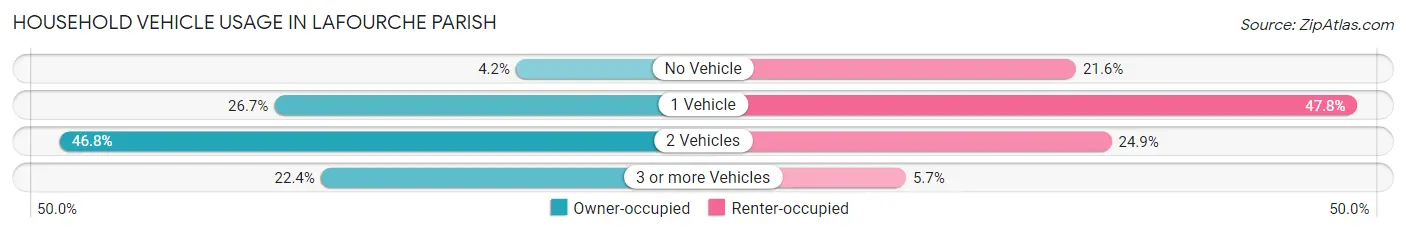
| Vehicles per Household | Owner-occupied | Renter-occupied |
| No Vehicle | 1,196 (4.2%) | 1,727 (21.6%) |
| 1 Vehicle | 7,700 (26.7%) | 3,827 (47.8%) |
| 2 Vehicles | 13,483 (46.8%) | 1,992 (24.9%) |
| 3 or more Vehicles | 6,447 (22.4%) | 456 (5.7%) |
| Total | 28,826 (100.0%) | 8,002 (100.0%) |
Real Estate & Mortgages in Lafourche Parish
Real Estate and Mortgage Overview in Lafourche Parish
| Characteristic | Without Mortgage | With Mortgage |
| Housing Units | 14,951 | 13,875 |
| Median Property Value | $145,400 | $205,100 |
| Median Household Income | $50,988 | $2,683 |
| Monthly Housing Costs | $339 | $567 |
| Real Estate Taxes | $580 | $3,063 |
Property Value by Mortgage Status in Lafourche Parish
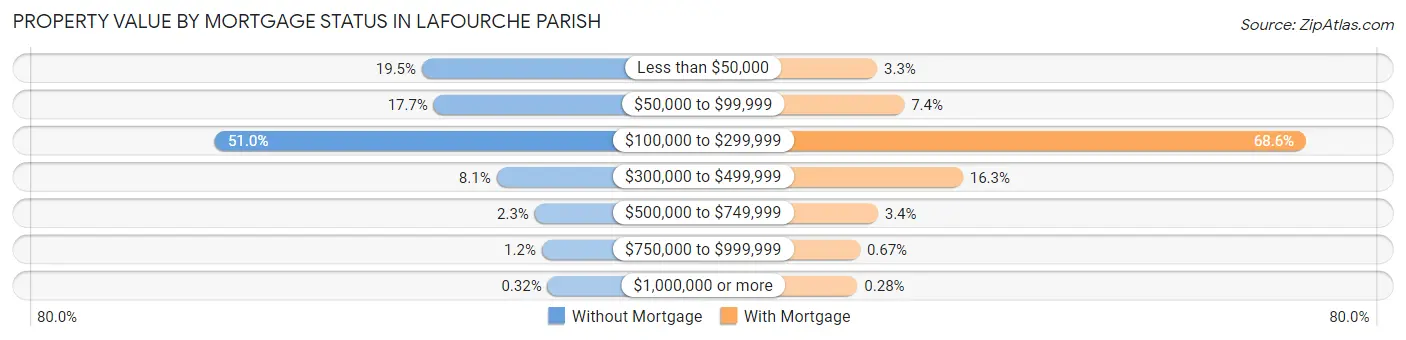
| Property Value | Without Mortgage | With Mortgage |
| Less than $50,000 | 2,911 (19.5%) | 455 (3.3%) |
| $50,000 to $99,999 | 2,641 (17.7%) | 1,029 (7.4%) |
| $100,000 to $299,999 | 7,622 (51.0%) | 9,522 (68.6%) |
| $300,000 to $499,999 | 1,210 (8.1%) | 2,267 (16.3%) |
| $500,000 to $749,999 | 339 (2.3%) | 470 (3.4%) |
| $750,000 to $999,999 | 180 (1.2%) | 93 (0.7%) |
| $1,000,000 or more | 48 (0.3%) | 39 (0.3%) |
| Total | 14,951 (100.0%) | 13,875 (100.0%) |
Household Income by Mortgage Status in Lafourche Parish
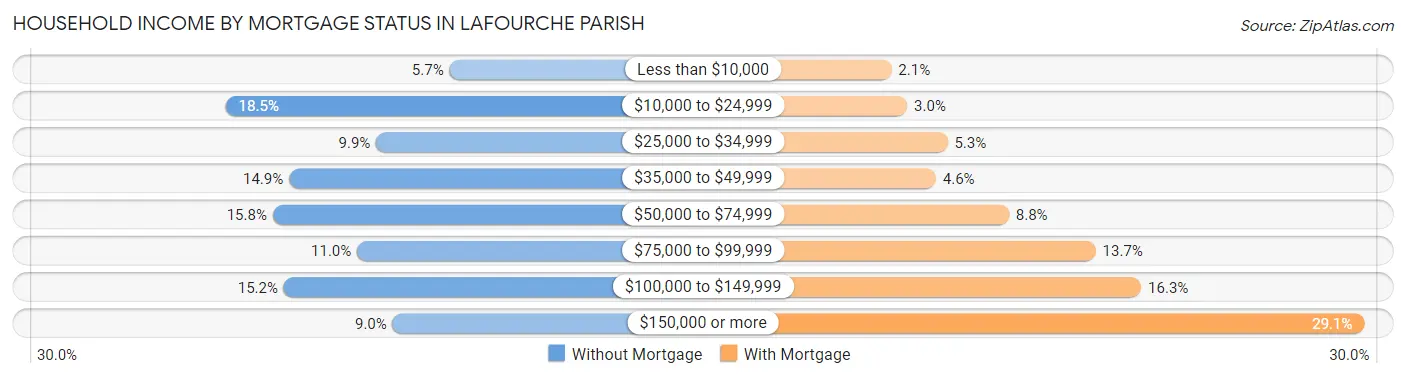
| Household Income | Without Mortgage | With Mortgage |
| Less than $10,000 | 855 (5.7%) | 284 (2.1%) |
| $10,000 to $24,999 | 2,768 (18.5%) | 409 (2.9%) |
| $25,000 to $34,999 | 1,481 (9.9%) | 728 (5.2%) |
| $35,000 to $49,999 | 2,226 (14.9%) | 637 (4.6%) |
| $50,000 to $74,999 | 2,365 (15.8%) | 1,215 (8.8%) |
| $75,000 to $99,999 | 1,644 (11.0%) | 1,904 (13.7%) |
| $100,000 to $149,999 | 2,271 (15.2%) | 2,265 (16.3%) |
| $150,000 or more | 1,341 (9.0%) | 4,034 (29.1%) |
| Total | 14,951 (100.0%) | 13,875 (100.0%) |
Property Value to Household Income Ratio in Lafourche Parish
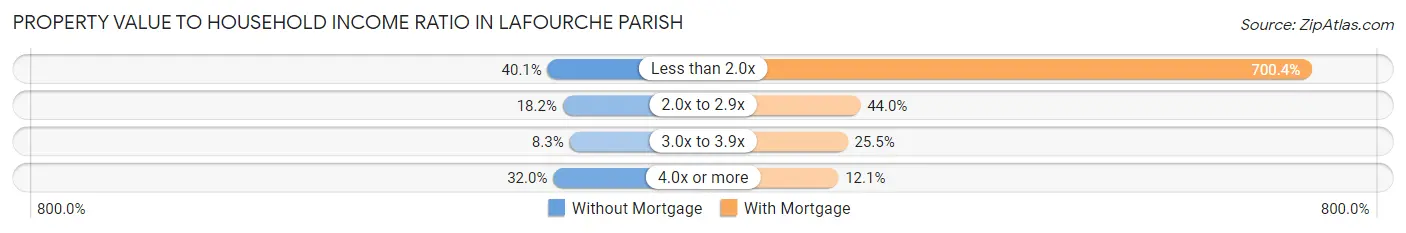
| Value-to-Income Ratio | Without Mortgage | With Mortgage |
| Less than 2.0x | 5,995 (40.1%) | 97,173 (700.3%) |
| 2.0x to 2.9x | 2,714 (18.1%) | 6,106 (44.0%) |
| 3.0x to 3.9x | 1,247 (8.3%) | 3,540 (25.5%) |
| 4.0x or more | 4,778 (32.0%) | 1,679 (12.1%) |
| Total | 14,951 (100.0%) | 13,875 (100.0%) |
Real Estate Taxes by Mortgage Status in Lafourche Parish
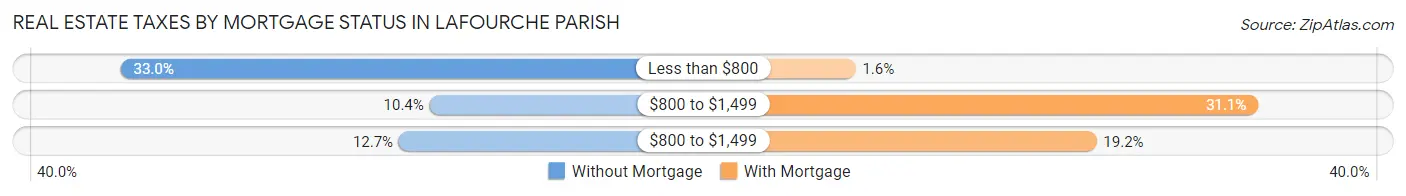
| Property Taxes | Without Mortgage | With Mortgage |
| Less than $800 | 4,932 (33.0%) | 228 (1.6%) |
| $800 to $1,499 | 1,557 (10.4%) | 4,309 (31.1%) |
| $800 to $1,499 | 1,891 (12.7%) | 2,670 (19.2%) |
| Total | 14,951 (100.0%) | 13,875 (100.0%) |
Health & Disability in Lafourche Parish
Health Insurance Coverage by Age in Lafourche Parish
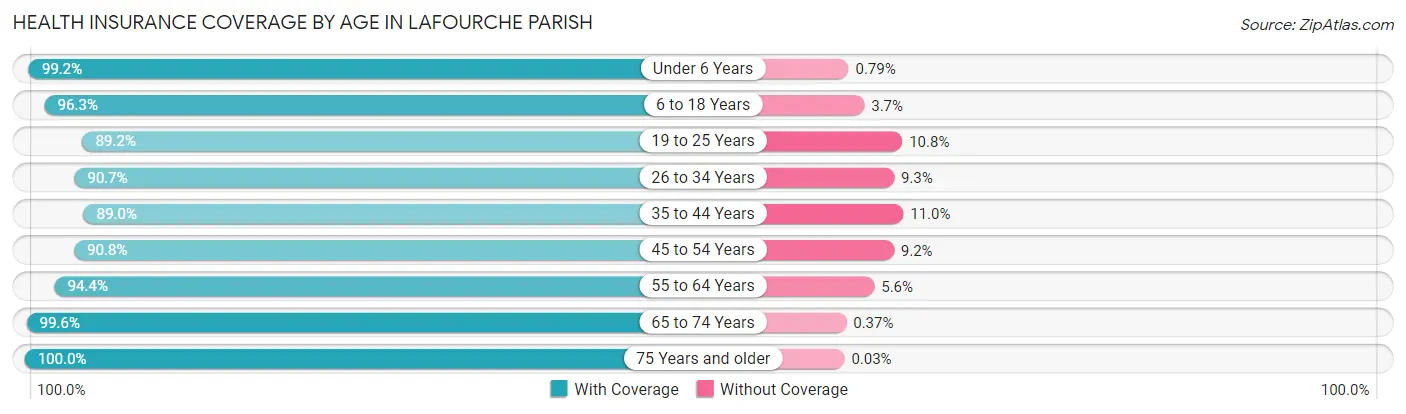
| Age Bracket | With Coverage | Without Coverage |
| Under 6 Years | 7,129 (99.2%) | 57 (0.8%) |
| 6 to 18 Years | 15,622 (96.3%) | 605 (3.7%) |
| 19 to 25 Years | 7,537 (89.2%) | 913 (10.8%) |
| 26 to 34 Years | 10,662 (90.7%) | 1,089 (9.3%) |
| 35 to 44 Years | 11,028 (89.0%) | 1,363 (11.0%) |
| 45 to 54 Years | 10,855 (90.8%) | 1,105 (9.2%) |
| 55 to 64 Years | 12,602 (94.4%) | 746 (5.6%) |
| 65 to 74 Years | 8,918 (99.6%) | 33 (0.4%) |
| 75 Years and older | 6,091 (100.0%) | 2 (0.0%) |
| Total | 90,444 (93.9%) | 5,913 (6.1%) |
Health Insurance Coverage by Citizenship Status in Lafourche Parish
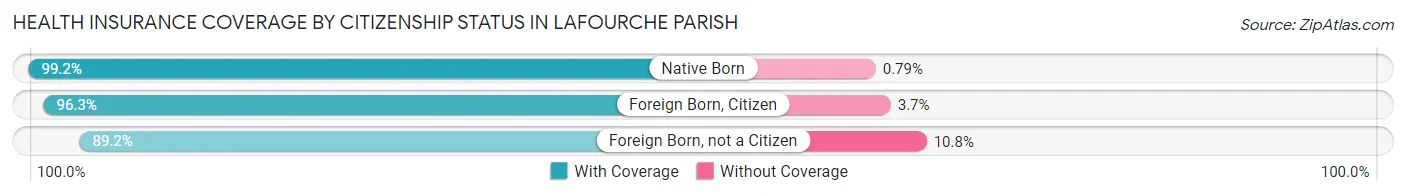
| Citizenship Status | With Coverage | Without Coverage |
| Native Born | 7,129 (99.2%) | 57 (0.8%) |
| Foreign Born, Citizen | 15,622 (96.3%) | 605 (3.7%) |
| Foreign Born, not a Citizen | 7,537 (89.2%) | 913 (10.8%) |
Health Insurance Coverage by Household Income in Lafourche Parish
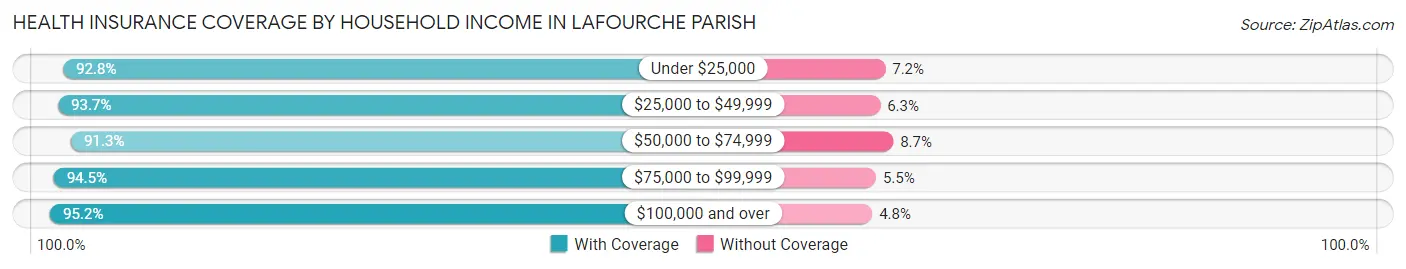
| Household Income | With Coverage | Without Coverage |
| Under $25,000 | 14,468 (92.8%) | 1,125 (7.2%) |
| $25,000 to $49,999 | 15,953 (93.7%) | 1,065 (6.3%) |
| $50,000 to $74,999 | 13,006 (91.3%) | 1,240 (8.7%) |
| $75,000 to $99,999 | 13,002 (94.5%) | 752 (5.5%) |
| $100,000 and over | 32,729 (95.2%) | 1,635 (4.8%) |
Public vs Private Health Insurance Coverage by Age in Lafourche Parish
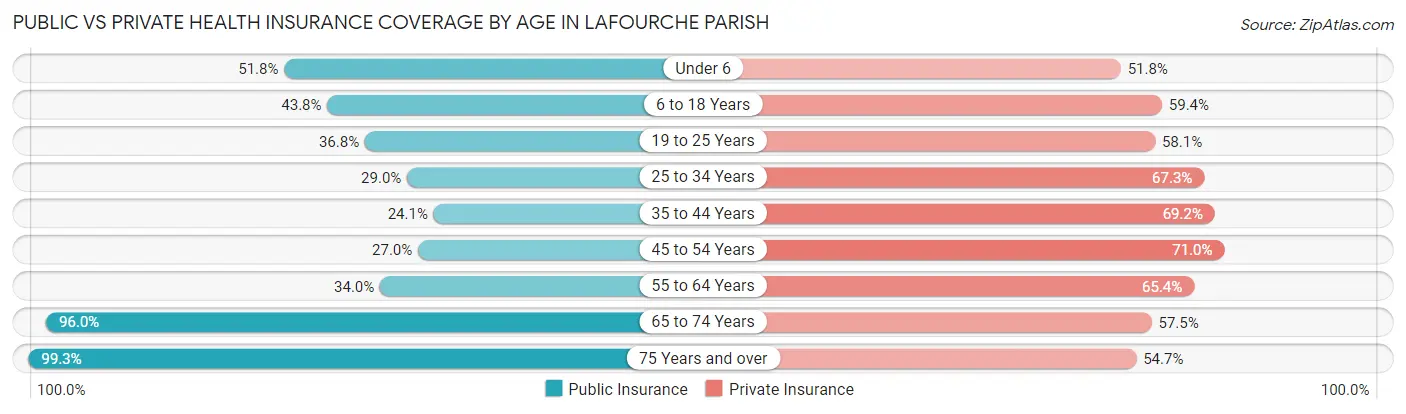
| Age Bracket | Public Insurance | Private Insurance |
| Under 6 | 3,722 (51.8%) | 3,720 (51.8%) |
| 6 to 18 Years | 7,107 (43.8%) | 9,640 (59.4%) |
| 19 to 25 Years | 3,111 (36.8%) | 4,912 (58.1%) |
| 25 to 34 Years | 3,407 (29.0%) | 7,902 (67.2%) |
| 35 to 44 Years | 2,981 (24.1%) | 8,577 (69.2%) |
| 45 to 54 Years | 3,225 (27.0%) | 8,492 (71.0%) |
| 55 to 64 Years | 4,539 (34.0%) | 8,728 (65.4%) |
| 65 to 74 Years | 8,596 (96.0%) | 5,147 (57.5%) |
| 75 Years and over | 6,050 (99.3%) | 3,330 (54.6%) |
| Total | 42,738 (44.4%) | 60,448 (62.7%) |
Disability Status by Sex by Age in Lafourche Parish
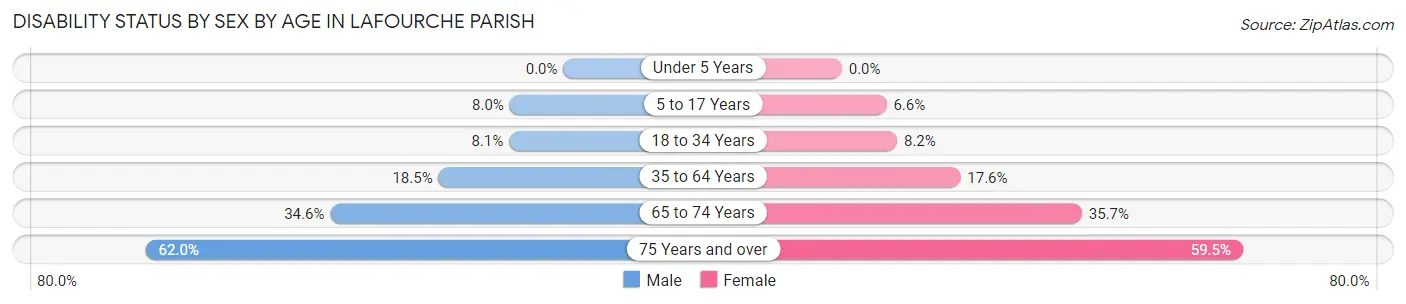
| Age Bracket | Male | Female |
| Under 5 Years | 0 (0.0%) | 0 (0.0%) |
| 5 to 17 Years | 663 (8.0%) | 534 (6.6%) |
| 18 to 34 Years | 874 (8.1%) | 870 (8.2%) |
| 35 to 64 Years | 3,436 (18.5%) | 3,375 (17.6%) |
| 65 to 74 Years | 1,477 (34.6%) | 1,670 (35.6%) |
| 75 Years and over | 1,602 (62.0%) | 2,090 (59.5%) |
Disability Class by Sex by Age in Lafourche Parish
Disability Class: Hearing Difficulty
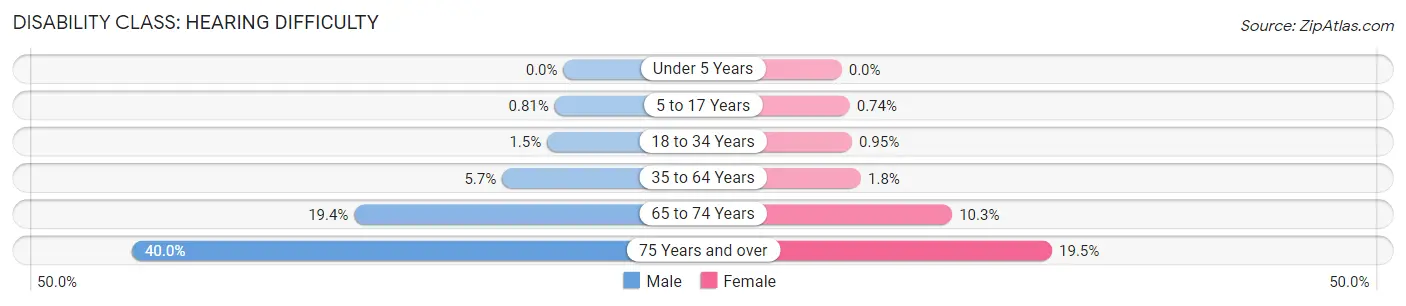
| Age Bracket | Male | Female |
| Under 5 Years | 0 (0.0%) | 0 (0.0%) |
| 5 to 17 Years | 67 (0.8%) | 60 (0.7%) |
| 18 to 34 Years | 164 (1.5%) | 101 (0.9%) |
| 35 to 64 Years | 1,055 (5.7%) | 343 (1.8%) |
| 65 to 74 Years | 828 (19.4%) | 480 (10.2%) |
| 75 Years and over | 1,034 (40.0%) | 685 (19.5%) |
Disability Class: Vision Difficulty
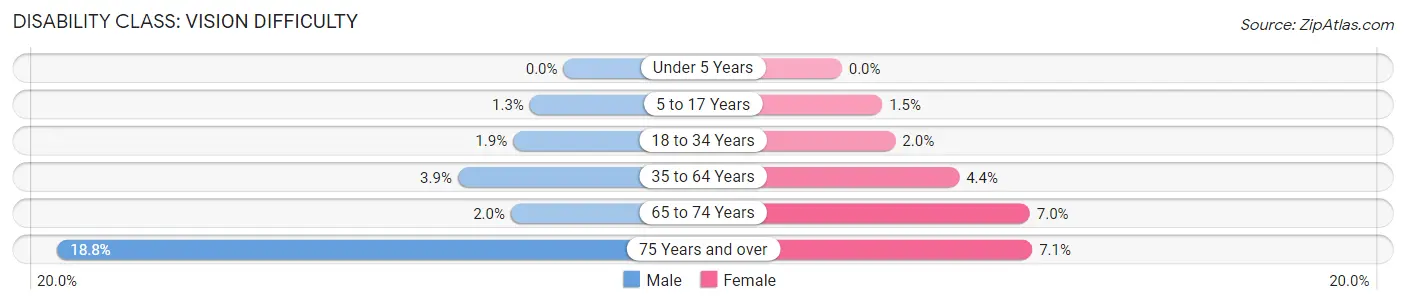
| Age Bracket | Male | Female |
| Under 5 Years | 0 (0.0%) | 0 (0.0%) |
| 5 to 17 Years | 104 (1.3%) | 121 (1.5%) |
| 18 to 34 Years | 203 (1.9%) | 211 (2.0%) |
| 35 to 64 Years | 726 (3.9%) | 835 (4.4%) |
| 65 to 74 Years | 83 (1.9%) | 327 (7.0%) |
| 75 Years and over | 485 (18.8%) | 248 (7.1%) |
Disability Class: Cognitive Difficulty
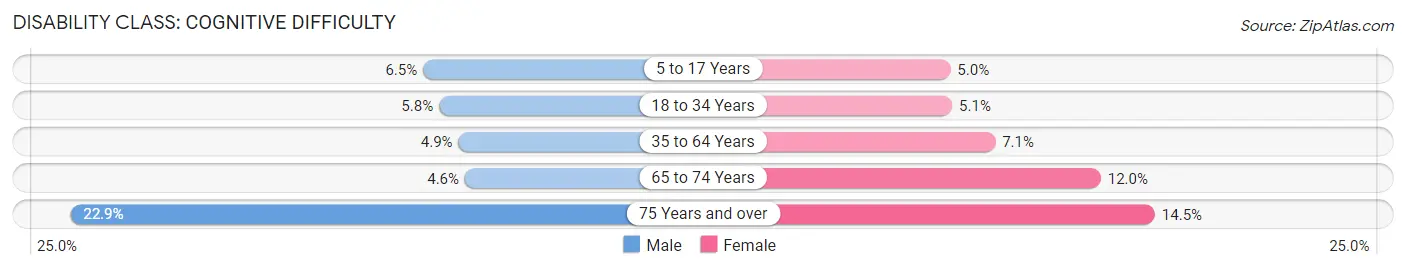
| Age Bracket | Male | Female |
| 5 to 17 Years | 542 (6.5%) | 406 (5.0%) |
| 18 to 34 Years | 626 (5.8%) | 543 (5.1%) |
| 35 to 64 Years | 903 (4.9%) | 1,365 (7.1%) |
| 65 to 74 Years | 195 (4.6%) | 563 (12.0%) |
| 75 Years and over | 591 (22.9%) | 510 (14.5%) |
Disability Class: Ambulatory Difficulty
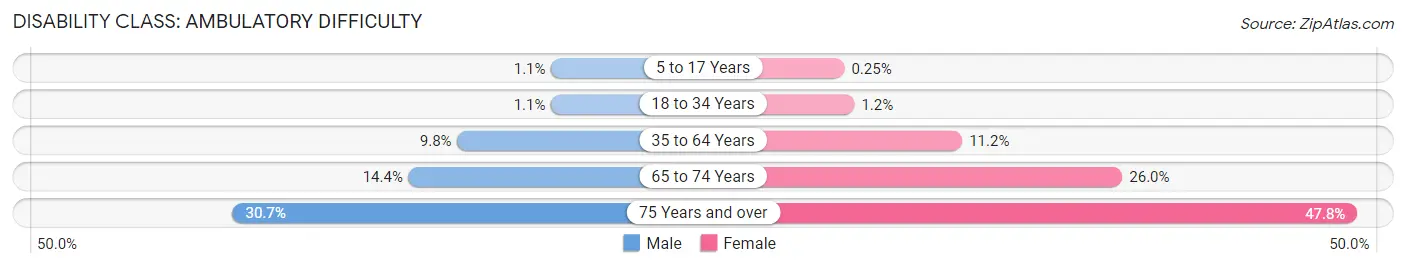
| Age Bracket | Male | Female |
| 5 to 17 Years | 92 (1.1%) | 20 (0.3%) |
| 18 to 34 Years | 122 (1.1%) | 125 (1.2%) |
| 35 to 64 Years | 1,822 (9.8%) | 2,142 (11.2%) |
| 65 to 74 Years | 612 (14.3%) | 1,220 (26.0%) |
| 75 Years and over | 793 (30.7%) | 1,679 (47.8%) |
Disability Class: Self-Care Difficulty
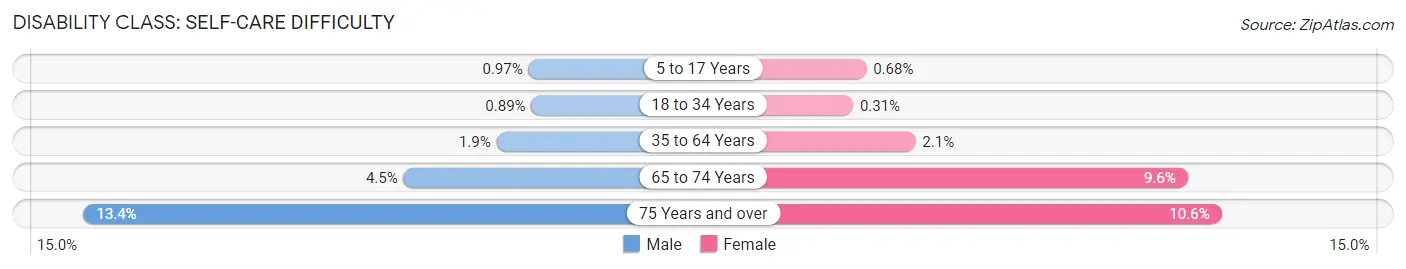
| Age Bracket | Male | Female |
| 5 to 17 Years | 81 (1.0%) | 55 (0.7%) |
| 18 to 34 Years | 96 (0.9%) | 33 (0.3%) |
| 35 to 64 Years | 345 (1.9%) | 393 (2.1%) |
| 65 to 74 Years | 190 (4.4%) | 451 (9.6%) |
| 75 Years and over | 345 (13.4%) | 371 (10.6%) |
Technology Access in Lafourche Parish
Computing Device Access in Lafourche Parish
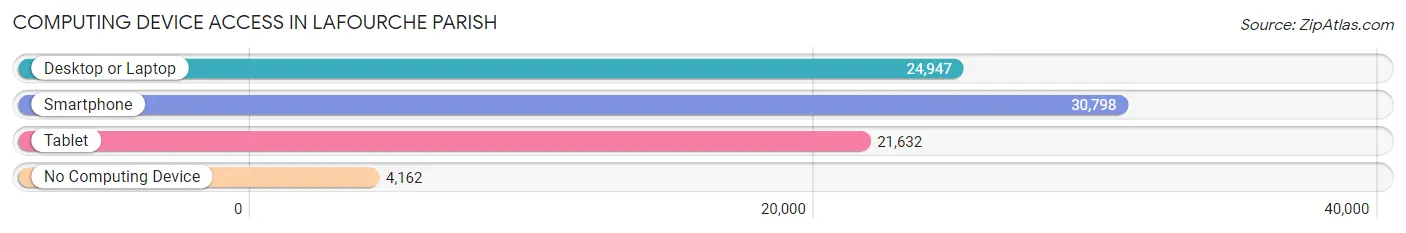
| Device Type | # Households | % Households |
| Desktop or Laptop | 24,947 | 67.7% |
| Smartphone | 30,798 | 83.6% |
| Tablet | 21,632 | 58.7% |
| No Computing Device | 4,162 | 11.3% |
| Total | 36,828 | 100.0% |
Internet Access in Lafourche Parish
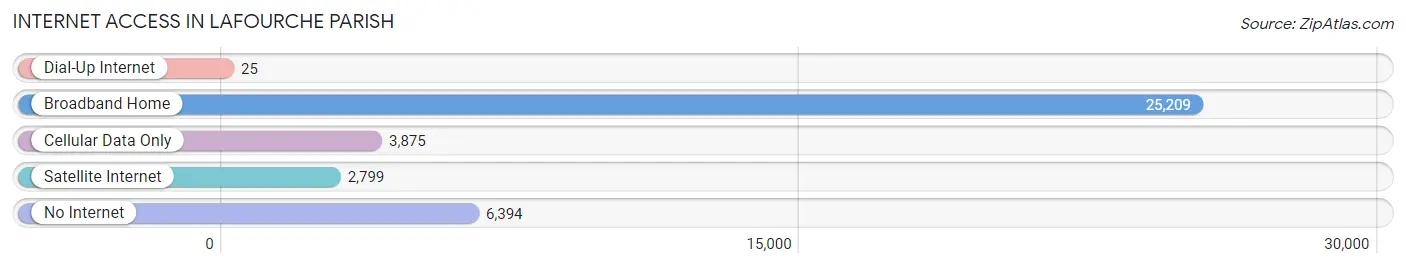
| Internet Type | # Households | % Households |
| Dial-Up Internet | 25 | 0.1% |
| Broadband Home | 25,209 | 68.4% |
| Cellular Data Only | 3,875 | 10.5% |
| Satellite Internet | 2,799 | 7.6% |
| No Internet | 6,394 | 17.4% |
| Total | 36,828 | 100.0% |
Lafourche Parish Summary
Lafourche Parish is located in the southeastern part of Louisiana, and is part of the Houma-Thibodaux Metropolitan Statistical Area. It is bordered by Terrebonne Parish to the west, Assumption Parish to the east, and the Gulf of Mexico to the south. The parish seat is Thibodaux, and the largest city is Houma. As of the 2010 census, the population of Lafourche Parish was 96,318.
History
Lafourche Parish was established in 1807, and is named for the Bayou Lafourche, which runs through the parish. The bayou was named by French explorer Pierre Le Moyne d'Iberville in 1699, and is believed to be derived from the Choctaw word for "long river". The area was originally inhabited by the Chitimacha and Houma Native American tribes.
In the early 19th century, the area was settled by French and Spanish colonists, and the parish was part of the Spanish colonial province of Louisiana. After the Louisiana Purchase in 1803, the area became part of the United States. During the Civil War, the parish was divided between Union and Confederate forces.
Geography
Lafourche Parish is located in the southeastern part of Louisiana, and is part of the Houma-Thibodaux Metropolitan Statistical Area. It is bordered by Terrebonne Parish to the west, Assumption Parish to the east, and the Gulf of Mexico to the south. The parish has a total area of 1,093 square miles, of which 1,072 square miles is land and 21 square miles is water.
The parish is divided into two distinct regions: the Bayou Lafourche region in the north, and the coastal region in the south. The Bayou Lafourche region is characterized by flat, marshy land, while the coastal region is characterized by higher elevations and sandy beaches. The parish is home to several bayous, including Bayou Lafourche, Bayou Terrebonne, Bayou Grand Caillou, and Bayou Black.
Economy
Lafourche Parish has a diversified economy, with industries such as oil and gas, fishing, tourism, and manufacturing. The parish is home to several oil and gas companies, including Chevron, Shell, and ExxonMobil. The fishing industry is also an important part of the local economy, with shrimp, oysters, and crabs being the main catches.
Tourism is also an important part of the local economy, with visitors coming to the area to enjoy the beaches, fishing, and other outdoor activities. The parish is also home to several manufacturing companies, including shipbuilding, food processing, and chemical production.
Demographics
As of the 2010 census, the population of Lafourche Parish was 96,318, with a population density of 89.3 people per square mile. The racial makeup of the parish was 73.3% White, 20.2% African American, 0.5% Native American, 1.2% Asian, 0.1% Pacific Islander, 3.2% from other races, and 1.7% from two or more races. Hispanic or Latino of any race were 6.3% of the population.
The median income for a household in the parish was $41,945, and the median income for a family was $50,945. The per capita income for the parish was $20,945. About 17.2% of families and 20.7% of the population were below the poverty line, including 28.2% of those under age 18 and 13.2% of those age 65 or over.
Common Questions
What is the Total Population of Lafourche Parish?
Total Population of Lafourche Parish is 97,220.
What is the Total Male Population of Lafourche Parish?
Total Male Population of Lafourche Parish is 47,908.
What is the Total Female Population of Lafourche Parish?
Total Female Population of Lafourche Parish is 49,312.
What is the Ratio of Males per 100 Females in Lafourche Parish?
There are 97.15 Males per 100 Females in Lafourche Parish.
What is the Ratio of Females per 100 Males in Lafourche Parish?
There are 102.93 Females per 100 Males in Lafourche Parish.
What is the Median Population Age in Lafourche Parish?
Median Population Age in Lafourche Parish is 38.8 Years.
What is the Average Family Size in Lafourche Parish
Average Family Size in Lafourche Parish is 3.1 People.
What is the Average Household Size in Lafourche Parish
Average Household Size in Lafourche Parish is 2.6 People.
What is Per Capita Income in Lafourche Parish?
Per Capita income in Lafourche Parish is $32,716.
What is the Median Family Income in Lafourche Parish?
Median Family Income in Lafourche Parish is $78,226.
What is the Median Household income in Lafourche Parish?
Median Household Income in Lafourche Parish is $61,381.
What is Income or Wage Gap in Lafourche Parish?
Income or Wage Gap in Lafourche Parish is 45.2%.
Women in Lafourche Parish earn 54.8 cents for every dollar earned by a man.
What is Family Income Deficit in Lafourche Parish?
Family Income Deficit in Lafourche Parish is $11,921.
Families that are below poverty line in Lafourche Parish earn $11,921 less on average than the poverty threshold level.
What is Inequality or Gini Index in Lafourche Parish?
Inequality or Gini Index in Lafourche Parish is 0.48.
How Large is the Labor Force in Lafourche Parish?
There are 44,764 People in the Labor Forcein in Lafourche Parish.
What is the Percentage of People in the Labor Force in Lafourche Parish?
57.7% of People are in the Labor Force in Lafourche Parish.
What is the Unemployment Rate in Lafourche Parish?
Unemployment Rate in Lafourche Parish is 6.5%.