Lafayette Parish, LA
Lafayette Parish Map
Lafayette Parish Overview
243,175
TOTAL POPULATION
119,067
MALE POPULATION
124,108
FEMALE POPULATION
95.94
MALES / 100 FEMALES
104.23
FEMALES / 100 MALES
36.2
MEDIAN AGE
3.1
AVG FAMILY SIZE
2.4
AVG HOUSEHOLD SIZE
$38,161
PER CAPITA INCOME
$86,315
AVG FAMILY INCOME
$66,617
AVG HOUSEHOLD INCOME
39.6%
WAGE / INCOME GAP [ % ]
60.4¢/ $1
WAGE / INCOME GAP [ $ ]
$11,485
FAMILY INCOME DEFICIT
0.50
INEQUALITY / GINI INDEX
124,497
LABOR FORCE [ PEOPLE ]
65.2%
PERCENT IN LABOR FORCE
5.2%
UNEMPLOYMENT RATE
Lafayette Parish Area Codes
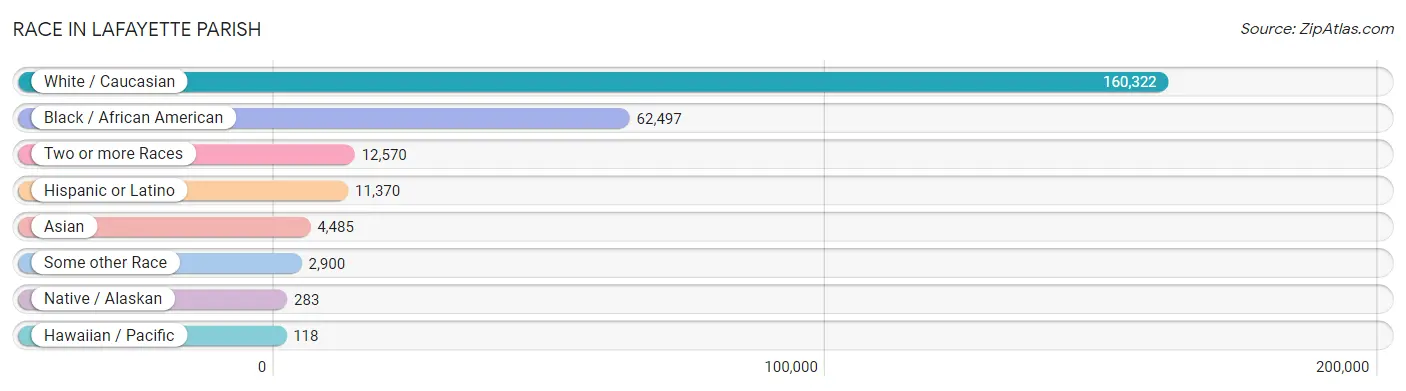
Race in Lafayette Parish
The most populous races in Lafayette Parish are White / Caucasian (160,322 | 65.9%), Black / African American (62,497 | 25.7%), and Two or more Races (12,570 | 5.2%).
| Race | # Population | % Population |
| Asian | 4,485 | 1.8% |
| Black / African American | 62,497 | 25.7% |
| Hawaiian / Pacific | 118 | 0.1% |
| Hispanic or Latino | 11,370 | 4.7% |
| Native / Alaskan | 283 | 0.1% |
| White / Caucasian | 160,322 | 65.9% |
| Two or more Races | 12,570 | 5.2% |
| Some other Race | 2,900 | 1.2% |
| Total | 243,175 | 100.0% |
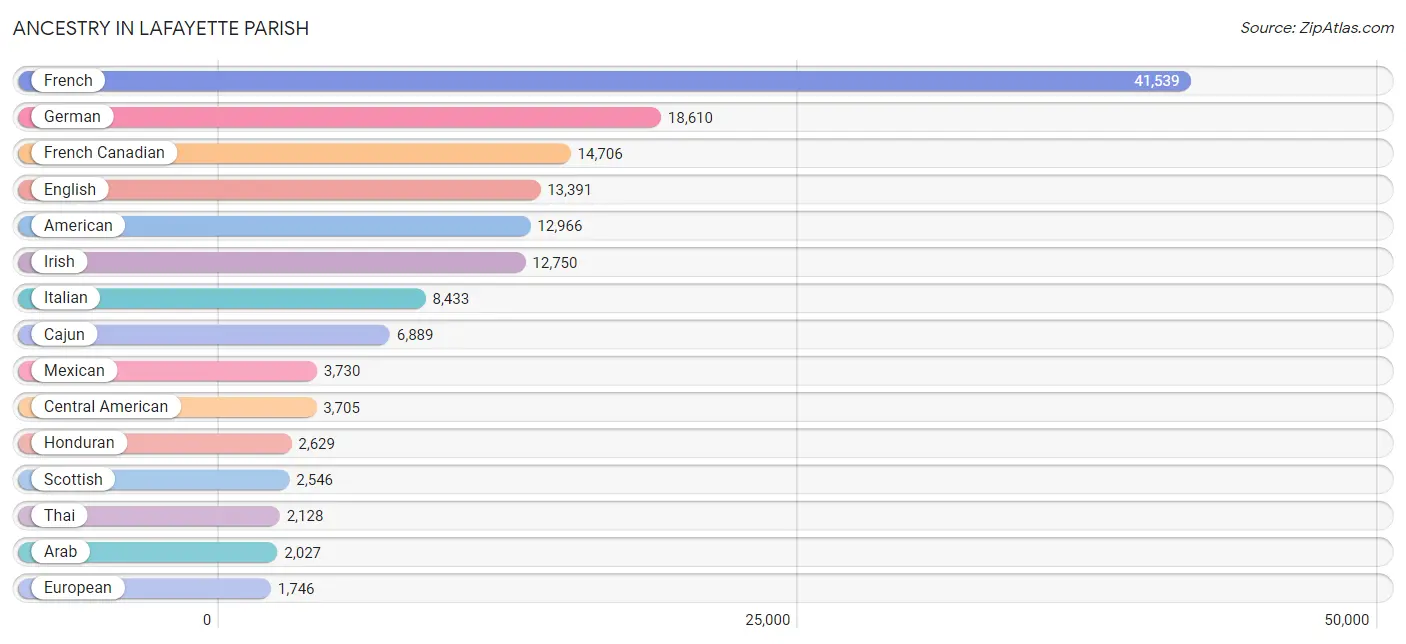
Ancestry in Lafayette Parish
The most populous ancestries reported in Lafayette Parish are French (41,539 | 17.1%), German (18,610 | 7.6%), French Canadian (14,706 | 6.0%), English (13,391 | 5.5%), and American (12,966 | 5.3%), together accounting for 41.6% of all Lafayette Parish residents.
| Ancestry | # Population | % Population |
| African | 634 | 0.3% |
| American | 12,966 | 5.3% |
| Apache | 11 | 0.0% |
| Arab | 2,027 | 0.8% |
| Argentinean | 48 | 0.0% |
| Armenian | 20 | 0.0% |
| Australian | 19 | 0.0% |
| Austrian | 60 | 0.0% |
| Basque | 6 | 0.0% |
| Belgian | 353 | 0.2% |
| Belizean | 1 | 0.0% |
| Bhutanese | 160 | 0.1% |
| Bolivian | 51 | 0.0% |
| Brazilian | 66 | 0.0% |
| British | 763 | 0.3% |
| Bulgarian | 22 | 0.0% |
| Burmese | 348 | 0.1% |
| Cajun | 6,889 | 2.8% |
| Canadian | 369 | 0.2% |
| Celtic | 9 | 0.0% |
| Central American | 3,705 | 1.5% |
| Cherokee | 324 | 0.1% |
| Chickasaw | 4 | 0.0% |
| Chilean | 3 | 0.0% |
| Chinese | 2 | 0.0% |
| Choctaw | 63 | 0.0% |
| Colombian | 77 | 0.0% |
| Costa Rican | 23 | 0.0% |
| Creek | 6 | 0.0% |
| Croatian | 220 | 0.1% |
| Cuban | 471 | 0.2% |
| Czech | 43 | 0.0% |
| Czechoslovakian | 89 | 0.0% |
| Danish | 305 | 0.1% |
| Dominican | 89 | 0.0% |
| Dutch | 1,245 | 0.5% |
| Eastern European | 271 | 0.1% |
| Ecuadorian | 264 | 0.1% |
| Egyptian | 189 | 0.1% |
| English | 13,391 | 5.5% |
| Ethiopian | 124 | 0.1% |
| European | 1,746 | 0.7% |
| Filipino | 14 | 0.0% |
| Finnish | 49 | 0.0% |
| French | 41,539 | 17.1% |
| French American Indian | 13 | 0.0% |
| French Canadian | 14,706 | 6.0% |
| German | 18,610 | 7.6% |
| Greek | 123 | 0.1% |
| Guamanian / Chamorro | 27 | 0.0% |
| Guatemalan | 487 | 0.2% |
| Haitian | 63 | 0.0% |
| Honduran | 2,629 | 1.1% |
| Houma | 92 | 0.0% |
| Hungarian | 205 | 0.1% |
| Indian (Asian) | 737 | 0.3% |
| Indonesian | 17 | 0.0% |
| Iranian | 51 | 0.0% |
| Iraqi | 135 | 0.1% |
| Irish | 12,750 | 5.2% |
| Iroquois | 24 | 0.0% |
| Italian | 8,433 | 3.5% |
| Jamaican | 416 | 0.2% |
| Japanese | 48 | 0.0% |
| Jordanian | 28 | 0.0% |
| Korean | 485 | 0.2% |
| Laotian | 58 | 0.0% |
| Lebanese | 1,175 | 0.5% |
| Lithuanian | 66 | 0.0% |
| Luxembourger | 7 | 0.0% |
| Malaysian | 179 | 0.1% |
| Maltese | 81 | 0.0% |
| Mexican | 3,730 | 1.5% |
| Mongolian | 9 | 0.0% |
| Native Hawaiian | 62 | 0.0% |
| Navajo | 44 | 0.0% |
| Nicaraguan | 275 | 0.1% |
| Nigerian | 158 | 0.1% |
| Northern European | 164 | 0.1% |
| Norwegian | 312 | 0.1% |
| Pakistani | 15 | 0.0% |
| Palestinian | 44 | 0.0% |
| Panamanian | 45 | 0.0% |
| Peruvian | 75 | 0.0% |
| Polish | 1,668 | 0.7% |
| Portuguese | 268 | 0.1% |
| Potawatomi | 6 | 0.0% |
| Pueblo | 12 | 0.0% |
| Puerto Rican | 570 | 0.2% |
| Romanian | 223 | 0.1% |
| Russian | 724 | 0.3% |
| Salvadoran | 246 | 0.1% |
| Samoan | 94 | 0.0% |
| Scandinavian | 260 | 0.1% |
| Scotch-Irish | 1,226 | 0.5% |
| Scottish | 2,546 | 1.1% |
| Serbian | 21 | 0.0% |
| Sioux | 32 | 0.0% |
| Slavic | 1 | 0.0% |
| Slovak | 108 | 0.0% |
| Slovene | 24 | 0.0% |
| South African | 150 | 0.1% |
| South American | 982 | 0.4% |
| South American Indian | 9 | 0.0% |
| Spaniard | 566 | 0.2% |
| Spanish | 817 | 0.3% |
| Spanish American | 79 | 0.0% |
| Sri Lankan | 1,445 | 0.6% |
| Subsaharan African | 1,148 | 0.5% |
| Swedish | 533 | 0.2% |
| Swiss | 43 | 0.0% |
| Syrian | 85 | 0.0% |
| Thai | 2,128 | 0.9% |
| Trinidadian and Tobagonian | 24 | 0.0% |
| Turkish | 19 | 0.0% |
| Ugandan | 1 | 0.0% |
| Ukrainian | 125 | 0.1% |
| Venezuelan | 464 | 0.2% |
| Vietnamese | 27 | 0.0% |
| Welsh | 579 | 0.2% |
| West Indian | 14 | 0.0% |
| Yugoslavian | 103 | 0.0% | View All 122 Rows |
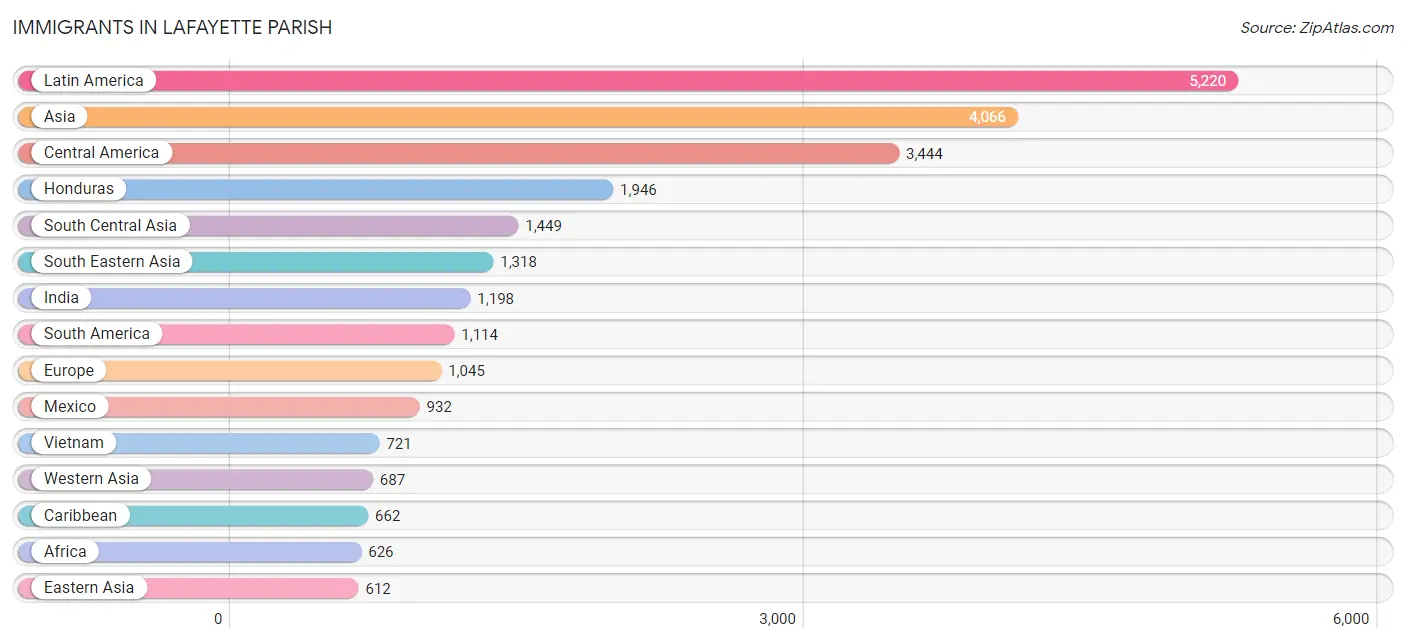
Immigrants in Lafayette Parish
The most numerous immigrant groups reported in Lafayette Parish came from Latin America (5,220 | 2.1%), Asia (4,066 | 1.7%), Central America (3,444 | 1.4%), Honduras (1,946 | 0.8%), and South Central Asia (1,449 | 0.6%), together accounting for 6.6% of all Lafayette Parish residents.
| Immigration Origin | # Population | % Population |
| Africa | 626 | 0.3% |
| Argentina | 19 | 0.0% |
| Asia | 4,066 | 1.7% |
| Australia | 19 | 0.0% |
| Bangladesh | 74 | 0.0% |
| Belarus | 19 | 0.0% |
| Belgium | 44 | 0.0% |
| Belize | 37 | 0.0% |
| Bolivia | 200 | 0.1% |
| Bosnia and Herzegovina | 21 | 0.0% |
| Brazil | 107 | 0.0% |
| Bulgaria | 10 | 0.0% |
| Cambodia | 26 | 0.0% |
| Canada | 168 | 0.1% |
| Caribbean | 662 | 0.3% |
| Central America | 3,444 | 1.4% |
| Chile | 3 | 0.0% |
| China | 463 | 0.2% |
| Colombia | 22 | 0.0% |
| Cuba | 401 | 0.2% |
| Denmark | 55 | 0.0% |
| Dominican Republic | 24 | 0.0% |
| Eastern Africa | 132 | 0.1% |
| Eastern Asia | 612 | 0.3% |
| Eastern Europe | 367 | 0.2% |
| Ecuador | 248 | 0.1% |
| Egypt | 147 | 0.1% |
| El Salvador | 101 | 0.0% |
| England | 52 | 0.0% |
| Ethiopia | 124 | 0.1% |
| Europe | 1,045 | 0.4% |
| France | 46 | 0.0% |
| Germany | 136 | 0.1% |
| Guatemala | 242 | 0.1% |
| Guyana | 11 | 0.0% |
| Haiti | 22 | 0.0% |
| Honduras | 1,946 | 0.8% |
| Hong Kong | 19 | 0.0% |
| India | 1,198 | 0.5% |
| Indonesia | 20 | 0.0% |
| Iran | 46 | 0.0% |
| Iraq | 75 | 0.0% |
| Ireland | 106 | 0.0% |
| Israel | 114 | 0.1% |
| Italy | 6 | 0.0% |
| Jamaica | 178 | 0.1% |
| Japan | 28 | 0.0% |
| Jordan | 183 | 0.1% |
| Korea | 121 | 0.1% |
| Kuwait | 71 | 0.0% |
| Laos | 25 | 0.0% |
| Latin America | 5,220 | 2.1% |
| Lebanon | 84 | 0.0% |
| Malaysia | 12 | 0.0% |
| Mexico | 932 | 0.4% |
| Middle Africa | 16 | 0.0% |
| Nepal | 73 | 0.0% |
| Netherlands | 63 | 0.0% |
| Nicaragua | 110 | 0.1% |
| Nigeria | 188 | 0.1% |
| Northern Africa | 147 | 0.1% |
| Northern Europe | 302 | 0.1% |
| Oceania | 113 | 0.1% |
| Pakistan | 58 | 0.0% |
| Peru | 10 | 0.0% |
| Philippines | 489 | 0.2% |
| Poland | 30 | 0.0% |
| Romania | 154 | 0.1% |
| Russia | 10 | 0.0% |
| South Africa | 90 | 0.0% |
| South America | 1,114 | 0.5% |
| South Central Asia | 1,449 | 0.6% |
| South Eastern Asia | 1,318 | 0.5% |
| Southern Europe | 87 | 0.0% |
| Sweden | 36 | 0.0% |
| Taiwan | 66 | 0.0% |
| Thailand | 8 | 0.0% |
| Trinidad and Tobago | 37 | 0.0% |
| Turkey | 19 | 0.0% |
| Uganda | 1 | 0.0% |
| Ukraine | 95 | 0.0% |
| Venezuela | 457 | 0.2% |
| Vietnam | 721 | 0.3% |
| Western Africa | 208 | 0.1% |
| Western Asia | 687 | 0.3% |
| Western Europe | 289 | 0.1% | View All 86 Rows |
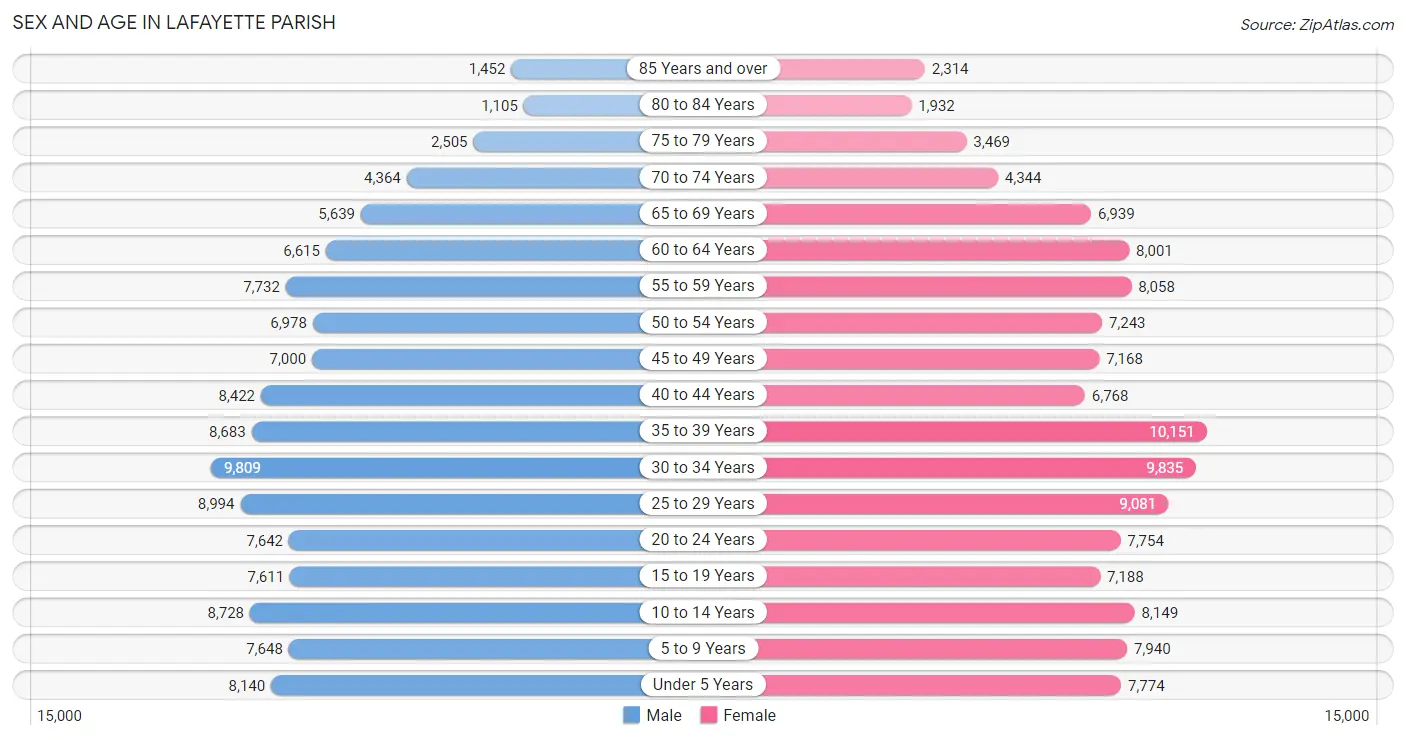
Sex and Age in Lafayette Parish
Sex and Age in Lafayette Parish
The most populous age groups in Lafayette Parish are 30 to 34 Years (9,809 | 8.2%) for men and 35 to 39 Years (10,151 | 8.2%) for women.
| Age Bracket | Male | Female |
| Under 5 Years | 8,140 (6.8%) | 7,774 (6.3%) |
| 5 to 9 Years | 7,648 (6.4%) | 7,940 (6.4%) |
| 10 to 14 Years | 8,728 (7.3%) | 8,149 (6.6%) |
| 15 to 19 Years | 7,611 (6.4%) | 7,188 (5.8%) |
| 20 to 24 Years | 7,642 (6.4%) | 7,754 (6.2%) |
| 25 to 29 Years | 8,994 (7.5%) | 9,081 (7.3%) |
| 30 to 34 Years | 9,809 (8.2%) | 9,835 (7.9%) |
| 35 to 39 Years | 8,683 (7.3%) | 10,151 (8.2%) |
| 40 to 44 Years | 8,422 (7.1%) | 6,768 (5.4%) |
| 45 to 49 Years | 7,000 (5.9%) | 7,168 (5.8%) |
| 50 to 54 Years | 6,978 (5.9%) | 7,243 (5.8%) |
| 55 to 59 Years | 7,732 (6.5%) | 8,058 (6.5%) |
| 60 to 64 Years | 6,615 (5.6%) | 8,001 (6.5%) |
| 65 to 69 Years | 5,639 (4.7%) | 6,939 (5.6%) |
| 70 to 74 Years | 4,364 (3.7%) | 4,344 (3.5%) |
| 75 to 79 Years | 2,505 (2.1%) | 3,469 (2.8%) |
| 80 to 84 Years | 1,105 (0.9%) | 1,932 (1.6%) |
| 85 Years and over | 1,452 (1.2%) | 2,314 (1.9%) |
| Total | 119,067 (100.0%) | 124,108 (100.0%) |
Families and Households in Lafayette Parish
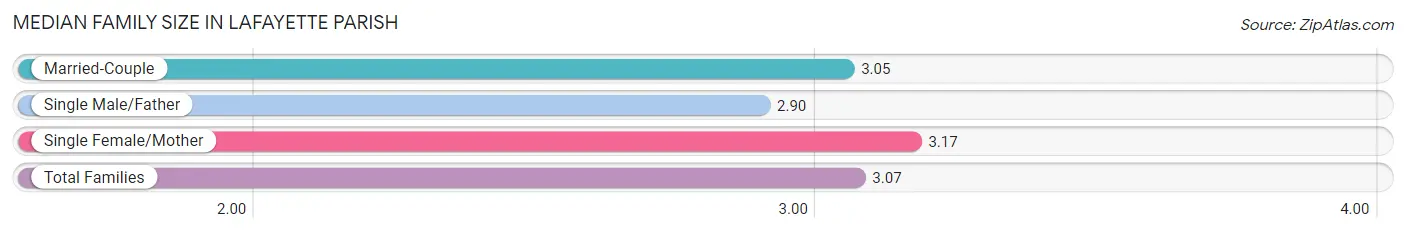
Median Family Size in Lafayette Parish
The median family size in Lafayette Parish is 3.07 persons per family, with single female/mother families (12,489 | 20.3%) accounting for the largest median family size of 3.17 persons per family. On the other hand, single male/father families (3,947 | 6.4%) represent the smallest median family size with 2.90 persons per family.
| Family Type | # Families | Family Size |
| Married-Couple | 45,148 (73.3%) | 3.05 |
| Single Male/Father | 3,947 (6.4%) | 2.90 |
| Single Female/Mother | 12,489 (20.3%) | 3.17 |
| Total Families | 61,584 (100.0%) | 3.07 |
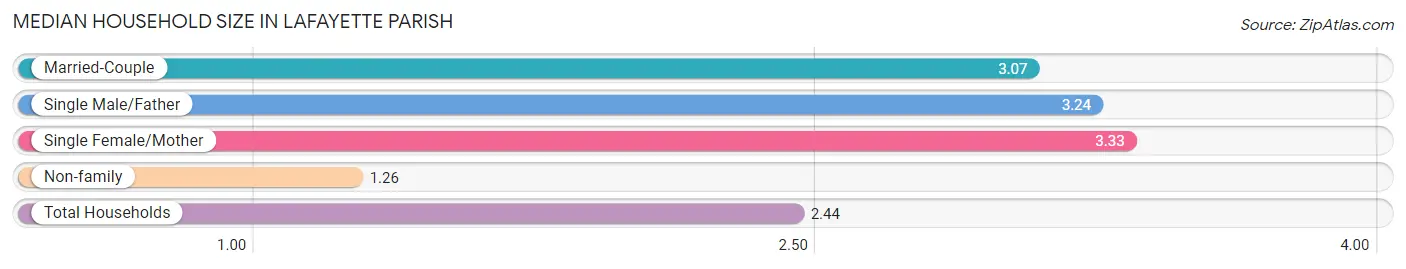
Median Household Size in Lafayette Parish
The median household size in Lafayette Parish is 2.44 persons per household, with single female/mother households (12,489 | 12.8%) accounting for the largest median household size of 3.33 persons per household. non-family households (36,110 | 37.0%) represent the smallest median household size with 1.26 persons per household.
| Household Type | # Households | Household Size |
| Married-Couple | 45,148 (46.2%) | 3.07 |
| Single Male/Father | 3,947 (4.0%) | 3.24 |
| Single Female/Mother | 12,489 (12.8%) | 3.33 |
| Non-family | 36,110 (37.0%) | 1.26 |
| Total Households | 97,694 (100.0%) | 2.44 |
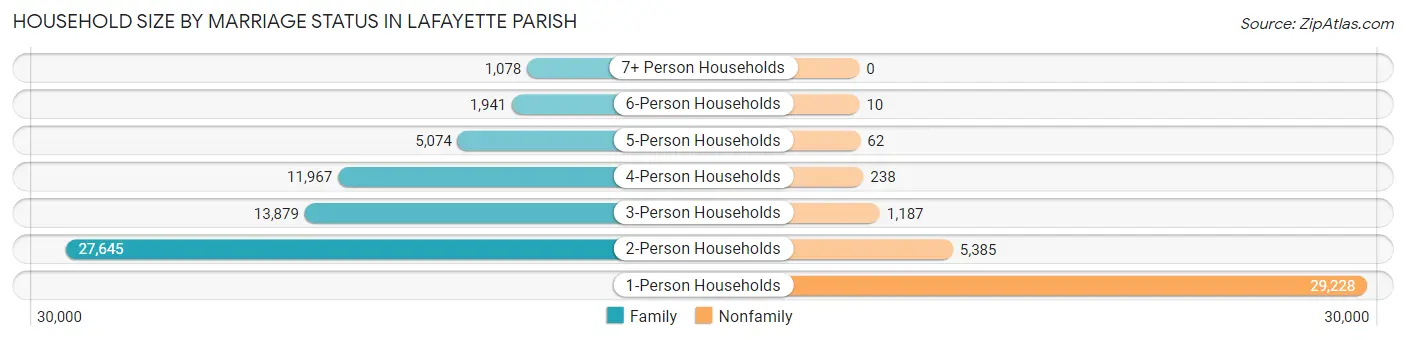
Household Size by Marriage Status in Lafayette Parish
Out of a total of 97,694 households in Lafayette Parish, 61,584 (63.0%) are family households, while 36,110 (37.0%) are nonfamily households. The most numerous type of family households are 2-person households, comprising 27,645, and the most common type of nonfamily households are 1-person households, comprising 29,228.
| Household Size | Family Households | Nonfamily Households |
| 1-Person Households | - | 29,228 (29.9%) |
| 2-Person Households | 27,645 (28.3%) | 5,385 (5.5%) |
| 3-Person Households | 13,879 (14.2%) | 1,187 (1.2%) |
| 4-Person Households | 11,967 (12.2%) | 238 (0.2%) |
| 5-Person Households | 5,074 (5.2%) | 62 (0.1%) |
| 6-Person Households | 1,941 (2.0%) | 10 (0.0%) |
| 7+ Person Households | 1,078 (1.1%) | 0 (0.0%) |
| Total | 61,584 (63.0%) | 36,110 (37.0%) |
Female Fertility in Lafayette Parish
Fertility by Age in Lafayette Parish
Average fertility rate in Lafayette Parish is 56.0 births per 1,000 women. Women in the age bracket of 20 to 34 years have the highest fertility rate with 103.0 births per 1,000 women. Women in the age bracket of 20 to 34 years acount for 82.3% of all women with births.
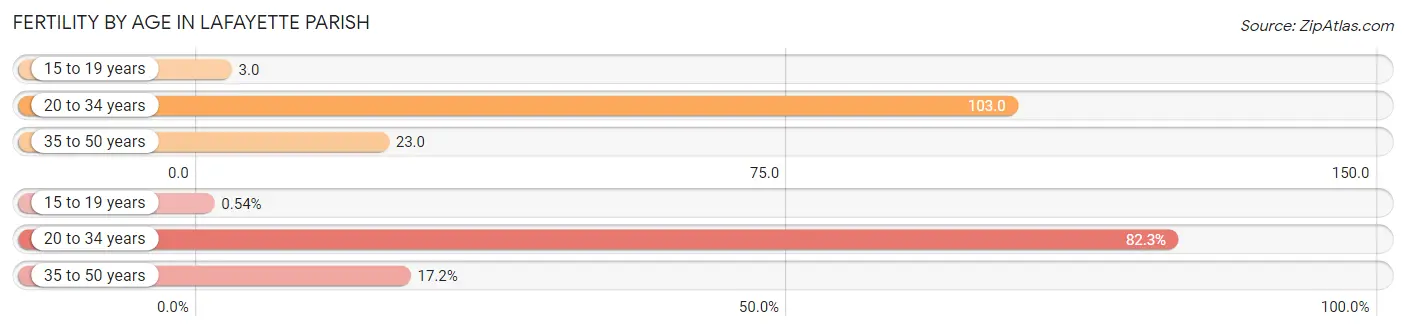
| Age Bracket | Women with Births | Births / 1,000 Women |
| 15 to 19 years | 18 (0.5%) | 3.0 |
| 20 to 34 years | 2,754 (82.3%) | 103.0 |
| 35 to 50 years | 575 (17.2%) | 23.0 |
| Total | 3,347 (100.0%) | 56.0 |
Fertility by Age by Marriage Status in Lafayette Parish
69.8% of women with births (3,347) in Lafayette Parish are married. The highest percentage of unmarried women with births falls into 15 to 19 years age bracket with 100.0% of them unmarried at the time of birth, while the lowest percentage of unmarried women with births belong to 35 to 50 years age bracket with 17.9% of them unmarried.
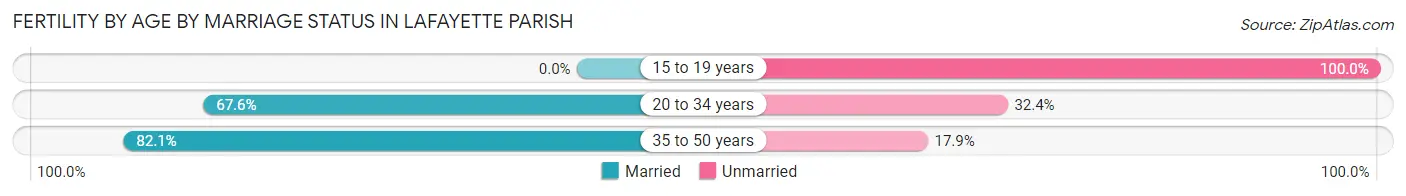
| Age Bracket | Married | Unmarried |
| 15 to 19 years | 0 (0.0%) | 18 (100.0%) |
| 20 to 34 years | 1,862 (67.6%) | 892 (32.4%) |
| 35 to 50 years | 472 (82.1%) | 103 (17.9%) |
| Total | 2,336 (69.8%) | 1,011 (30.2%) |
Fertility by Education in Lafayette Parish
Average fertility rate in Lafayette Parish is 56.0 births per 1,000 women. Women with the education attainment of bachelor's degree have the highest fertility rate of 73.0 births per 1,000 women, while women with the education attainment of less than high school have the lowest fertility at 18.0 births per 1,000 women. Women with the education attainment of college or associate's degree represent 31.4% of all women with births.
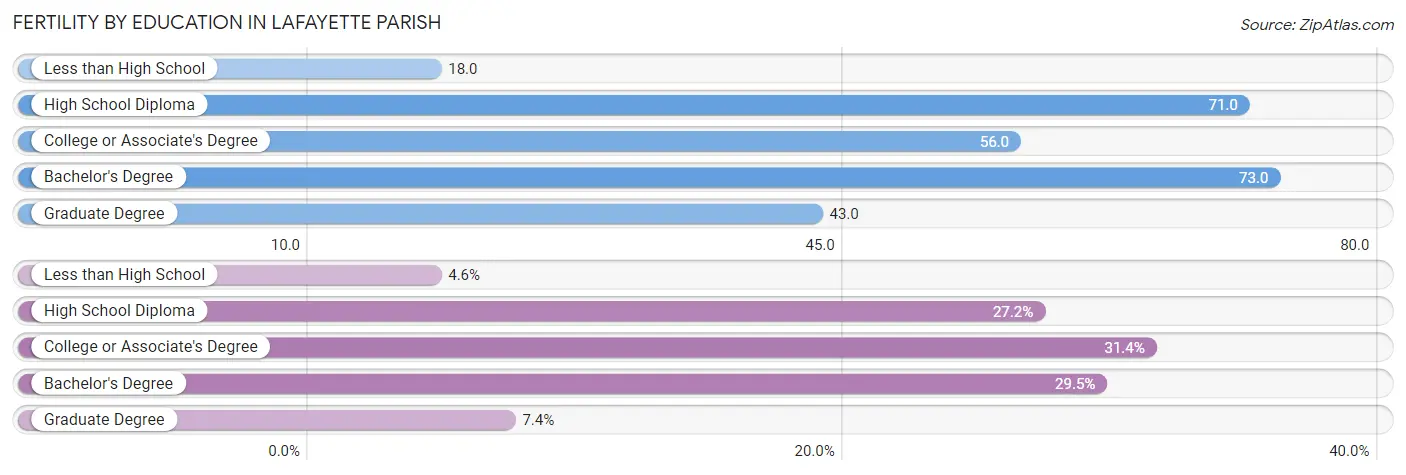
| Educational Attainment | Women with Births | Births / 1,000 Women |
| Less than High School | 153 (4.6%) | 18.0 |
| High School Diploma | 910 (27.2%) | 71.0 |
| College or Associate's Degree | 1,050 (31.4%) | 56.0 |
| Bachelor's Degree | 988 (29.5%) | 73.0 |
| Graduate Degree | 246 (7.3%) | 43.0 |
| Total | 3,347 (100.0%) | 56.0 |
Fertility by Education by Marriage Status in Lafayette Parish
30.2% of women with births in Lafayette Parish are unmarried. Women with the educational attainment of graduate degree are most likely to be married with 100.0% of them married at childbirth, while women with the educational attainment of less than high school are least likely to be married with 91.5% of them unmarried at childbirth.
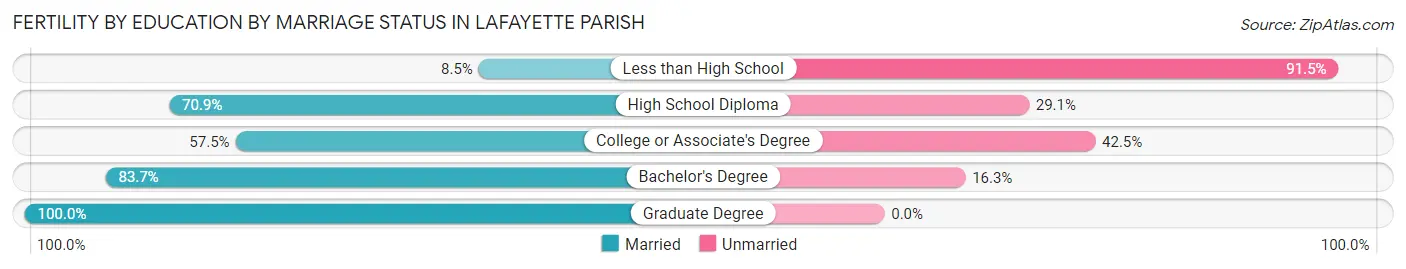
| Educational Attainment | Married | Unmarried |
| Less than High School | 13 (8.5%) | 140 (91.5%) |
| High School Diploma | 645 (70.9%) | 265 (29.1%) |
| College or Associate's Degree | 604 (57.5%) | 446 (42.5%) |
| Bachelor's Degree | 827 (83.7%) | 161 (16.3%) |
| Graduate Degree | 246 (100.0%) | 0 (0.0%) |
| Total | 2,336 (69.8%) | 1,011 (30.2%) |
Income in Lafayette Parish
Income Overview in Lafayette Parish
Per Capita Income in Lafayette Parish is $38,161, while median incomes of families and households are $86,315 and $66,617 respectively.
| Characteristic | Number | Measure |
| Per Capita Income | 243,175 | $38,161 |
| Median Family Income | 61,584 | $86,315 |
| Mean Family Income | 61,584 | $109,454 |
| Median Household Income | 97,694 | $66,617 |
| Mean Household Income | 97,694 | $93,264 |
| Income Deficit | 61,584 | $11,485 |
| Wage / Income Gap (%) | 243,175 | 39.59% |
| Wage / Income Gap ($) | 243,175 | 60.41¢ per $1 |
| Gini / Inequality Index | 243,175 | 0.50 |
Earnings by Sex in Lafayette Parish
Average Earnings in Lafayette Parish are $41,742, $53,962 for men and $32,597 for women, a difference of 39.6%.
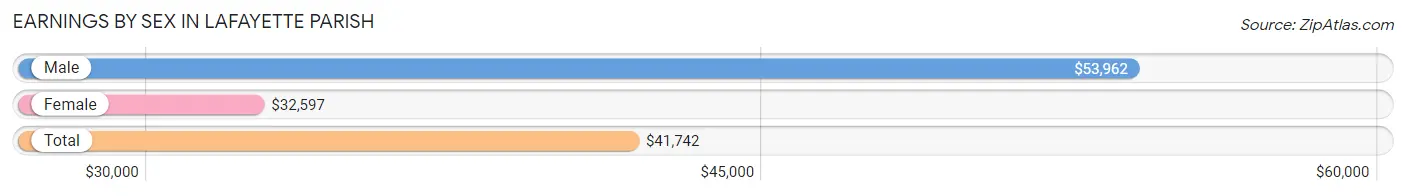
| Sex | Number | Average Earnings |
| Male | 67,399 (52.5%) | $53,962 |
| Female | 60,919 (47.5%) | $32,597 |
| Total | 128,318 (100.0%) | $41,742 |
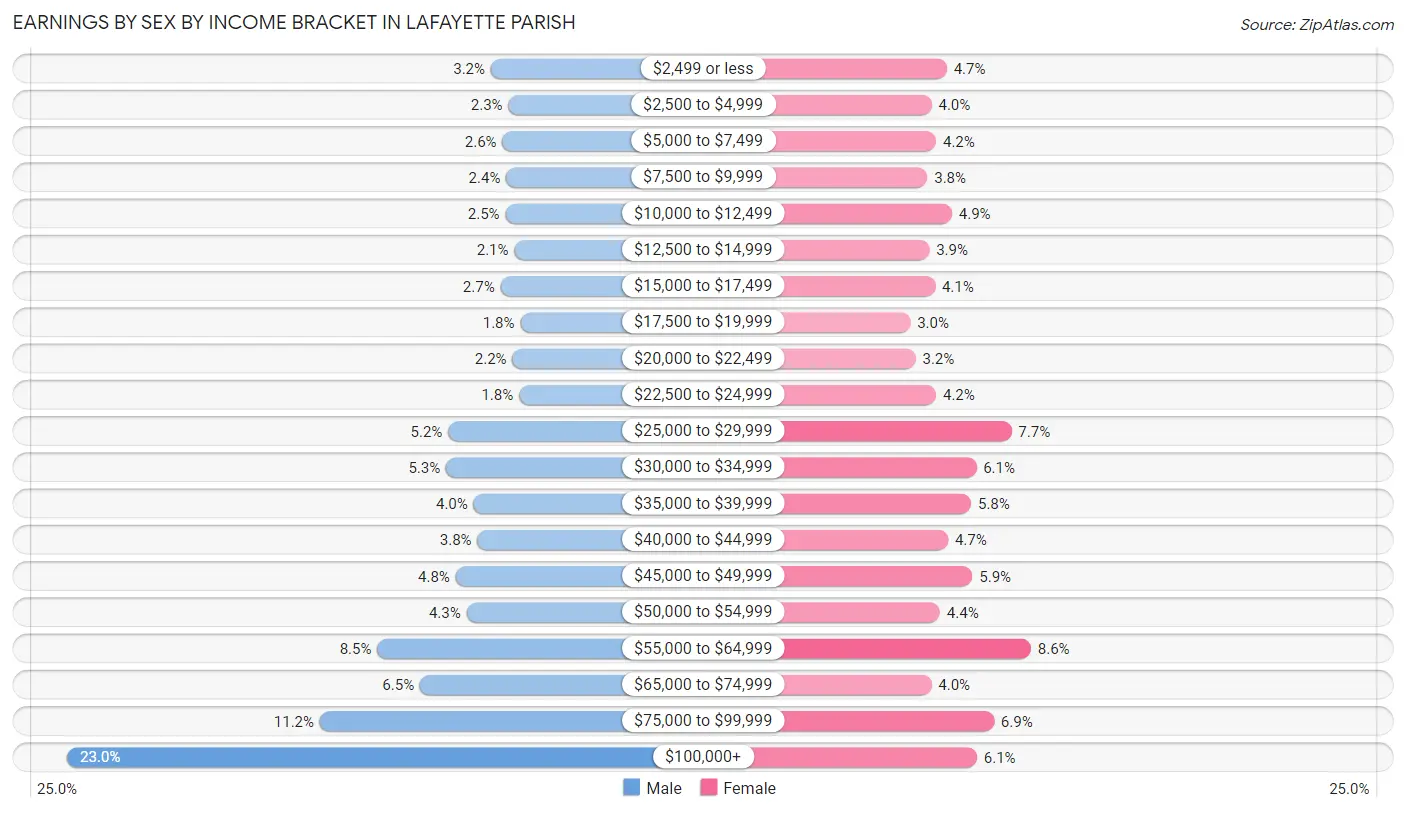
Earnings by Sex by Income Bracket in Lafayette Parish
The most common earnings brackets in Lafayette Parish are $100,000+ for men (15,506 | 23.0%) and $55,000 to $64,999 for women (5,249 | 8.6%).
| Income | Male | Female |
| $2,499 or less | 2,131 (3.2%) | 2,854 (4.7%) |
| $2,500 to $4,999 | 1,575 (2.3%) | 2,418 (4.0%) |
| $5,000 to $7,499 | 1,769 (2.6%) | 2,545 (4.2%) |
| $7,500 to $9,999 | 1,642 (2.4%) | 2,299 (3.8%) |
| $10,000 to $12,499 | 1,670 (2.5%) | 2,998 (4.9%) |
| $12,500 to $14,999 | 1,389 (2.1%) | 2,350 (3.9%) |
| $15,000 to $17,499 | 1,828 (2.7%) | 2,513 (4.1%) |
| $17,500 to $19,999 | 1,203 (1.8%) | 1,811 (3.0%) |
| $20,000 to $22,499 | 1,450 (2.1%) | 1,961 (3.2%) |
| $22,500 to $24,999 | 1,238 (1.8%) | 2,547 (4.2%) |
| $25,000 to $29,999 | 3,481 (5.2%) | 4,694 (7.7%) |
| $30,000 to $34,999 | 3,542 (5.3%) | 3,694 (6.1%) |
| $35,000 to $39,999 | 2,675 (4.0%) | 3,544 (5.8%) |
| $40,000 to $44,999 | 2,554 (3.8%) | 2,889 (4.7%) |
| $45,000 to $49,999 | 3,239 (4.8%) | 3,579 (5.9%) |
| $50,000 to $54,999 | 2,897 (4.3%) | 2,656 (4.4%) |
| $55,000 to $64,999 | 5,713 (8.5%) | 5,249 (8.6%) |
| $65,000 to $74,999 | 4,367 (6.5%) | 2,414 (4.0%) |
| $75,000 to $99,999 | 7,530 (11.2%) | 4,195 (6.9%) |
| $100,000+ | 15,506 (23.0%) | 3,709 (6.1%) |
| Total | 67,399 (100.0%) | 60,919 (100.0%) |
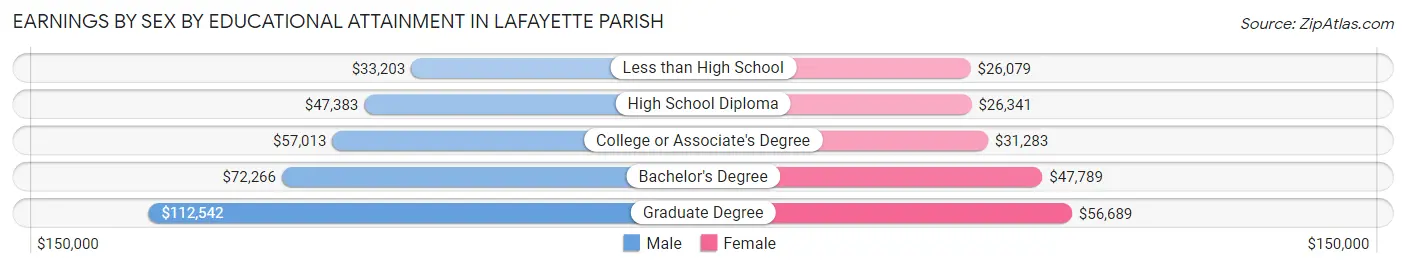
Earnings by Sex by Educational Attainment in Lafayette Parish
Average earnings in Lafayette Parish are $59,428 for men and $36,717 for women, a difference of 38.2%. Men with an educational attainment of graduate degree enjoy the highest average annual earnings of $112,542, while those with less than high school education earn the least with $33,203. Women with an educational attainment of graduate degree earn the most with the average annual earnings of $56,689, while those with less than high school education have the smallest earnings of $26,079.
| Educational Attainment | Male Income | Female Income |
| Less than High School | $33,203 | $26,079 |
| High School Diploma | $47,383 | $26,341 |
| College or Associate's Degree | $57,013 | $31,283 |
| Bachelor's Degree | $72,266 | $47,789 |
| Graduate Degree | $112,542 | $56,689 |
| Total | $59,428 | $36,717 |
Family Income in Lafayette Parish
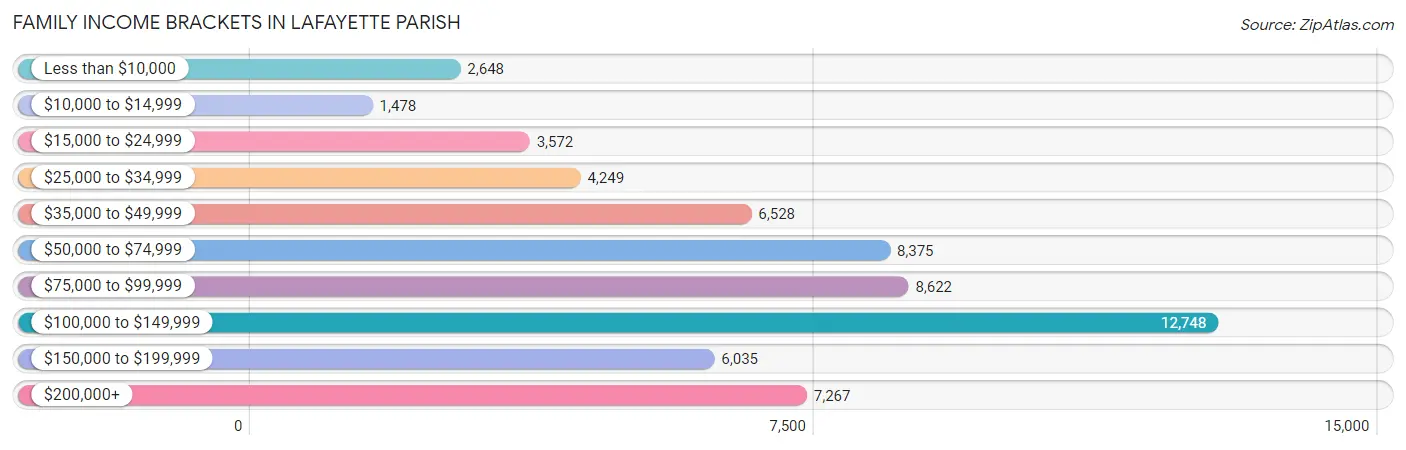
Family Income Brackets in Lafayette Parish
According to the Lafayette Parish family income data, there are 12,748 families falling into the $100,000 to $149,999 income range, which is the most common income bracket and makes up 20.7% of all families. Conversely, the $10,000 to $14,999 income bracket is the least frequent group with only 1,478 families (2.4%) belonging to this category.
| Income Bracket | # Families | % Families |
| Less than $10,000 | 2,648 | 4.3% |
| $10,000 to $14,999 | 1,478 | 2.4% |
| $15,000 to $24,999 | 3,572 | 5.8% |
| $25,000 to $34,999 | 4,249 | 6.9% |
| $35,000 to $49,999 | 6,528 | 10.6% |
| $50,000 to $74,999 | 8,375 | 13.6% |
| $75,000 to $99,999 | 8,622 | 14.0% |
| $100,000 to $149,999 | 12,748 | 20.7% |
| $150,000 to $199,999 | 6,035 | 9.8% |
| $200,000+ | 7,267 | 11.8% |
Family Income by Famaliy Size in Lafayette Parish
4-person families (11,595 | 18.8%) account for the highest median family income in Lafayette Parish with $115,047 per family, while 2-person families (29,177 | 47.4%) have the highest median income of $37,170 per family member.
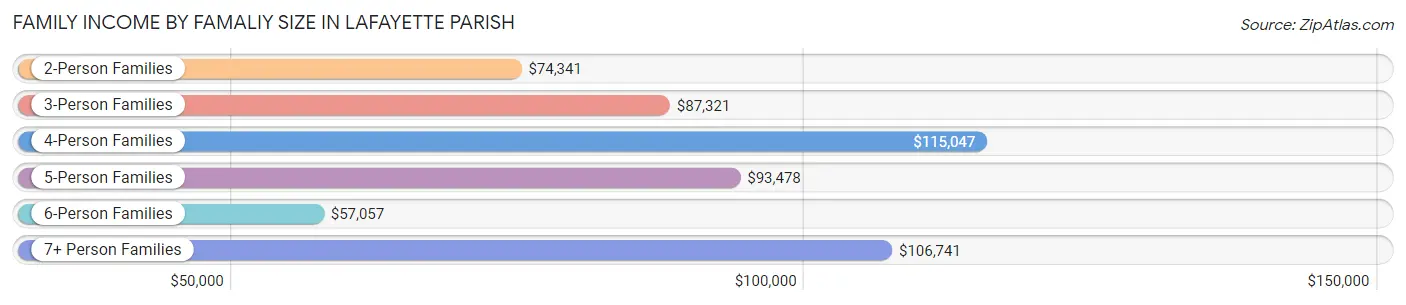
| Income Bracket | # Families | Median Income |
| 2-Person Families | 29,177 (47.4%) | $74,341 |
| 3-Person Families | 13,214 (21.5%) | $87,321 |
| 4-Person Families | 11,595 (18.8%) | $115,047 |
| 5-Person Families | 4,917 (8.0%) | $93,478 |
| 6-Person Families | 1,786 (2.9%) | $57,057 |
| 7+ Person Families | 895 (1.5%) | $106,741 |
| Total | 61,584 (100.0%) | $86,315 |
Family Income by Number of Earners in Lafayette Parish
The median family income in Lafayette Parish is $86,315, with families comprising 3+ earners (4,970) having the highest median family income of $128,111, while families with no earners (8,637) have the lowest median family income of $35,788, accounting for 8.1% and 14.0% of families, respectively.
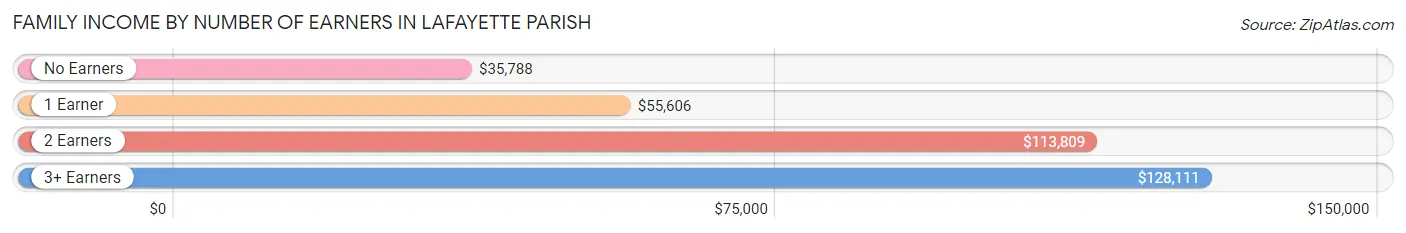
| Number of Earners | # Families | Median Income |
| No Earners | 8,637 (14.0%) | $35,788 |
| 1 Earner | 20,726 (33.7%) | $55,606 |
| 2 Earners | 27,251 (44.3%) | $113,809 |
| 3+ Earners | 4,970 (8.1%) | $128,111 |
| Total | 61,584 (100.0%) | $86,315 |
Household Income in Lafayette Parish
Household Income Brackets in Lafayette Parish
With 15,924 households falling in the category, the $100,000 to $149,999 income range is the most frequent in Lafayette Parish, accounting for 16.3% of all households. In contrast, only 5,080 households (5.2%) fall into the $10,000 to $14,999 income bracket, making it the least populous group.
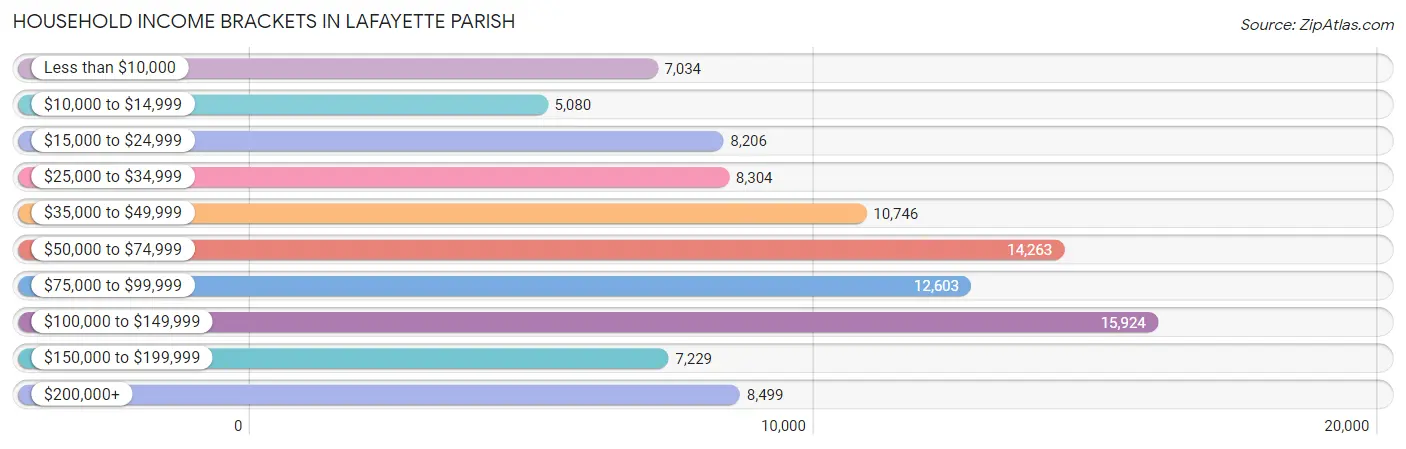
| Income Bracket | # Households | % Households |
| Less than $10,000 | 7,034 | 7.2% |
| $10,000 to $14,999 | 5,080 | 5.2% |
| $15,000 to $24,999 | 8,206 | 8.4% |
| $25,000 to $34,999 | 8,304 | 8.5% |
| $35,000 to $49,999 | 10,746 | 11.0% |
| $50,000 to $74,999 | 14,263 | 14.6% |
| $75,000 to $99,999 | 12,603 | 12.9% |
| $100,000 to $149,999 | 15,924 | 16.3% |
| $150,000 to $199,999 | 7,229 | 7.4% |
| $200,000+ | 8,499 | 8.7% |
Household Income by Householder Age in Lafayette Parish
The median household income in Lafayette Parish is $66,617, with the highest median household income of $78,875 found in the 25 to 44 years age bracket for the primary householder. A total of 38,707 households (39.6%) fall into this category. Meanwhile, the 15 to 24 years age bracket for the primary householder has the lowest median household income of $34,427, with 3,656 households (3.7%) in this group.
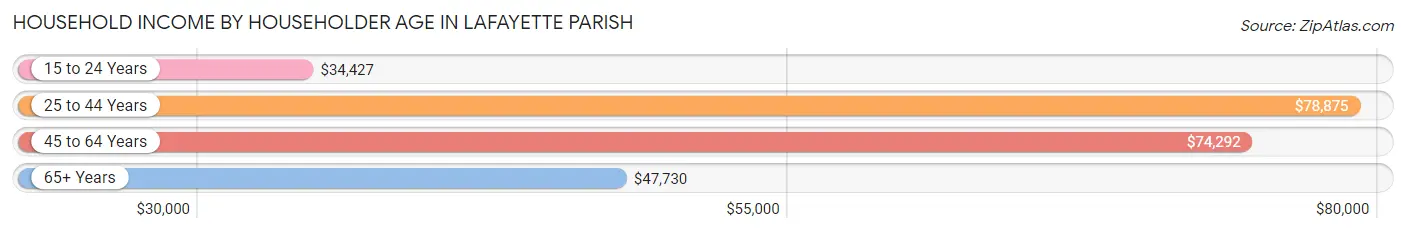
| Income Bracket | # Households | Median Income |
| 15 to 24 Years | 3,656 (3.7%) | $34,427 |
| 25 to 44 Years | 38,707 (39.6%) | $78,875 |
| 45 to 64 Years | 33,576 (34.4%) | $74,292 |
| 65+ Years | 21,755 (22.3%) | $47,730 |
| Total | 97,694 (100.0%) | $66,617 |
Poverty in Lafayette Parish
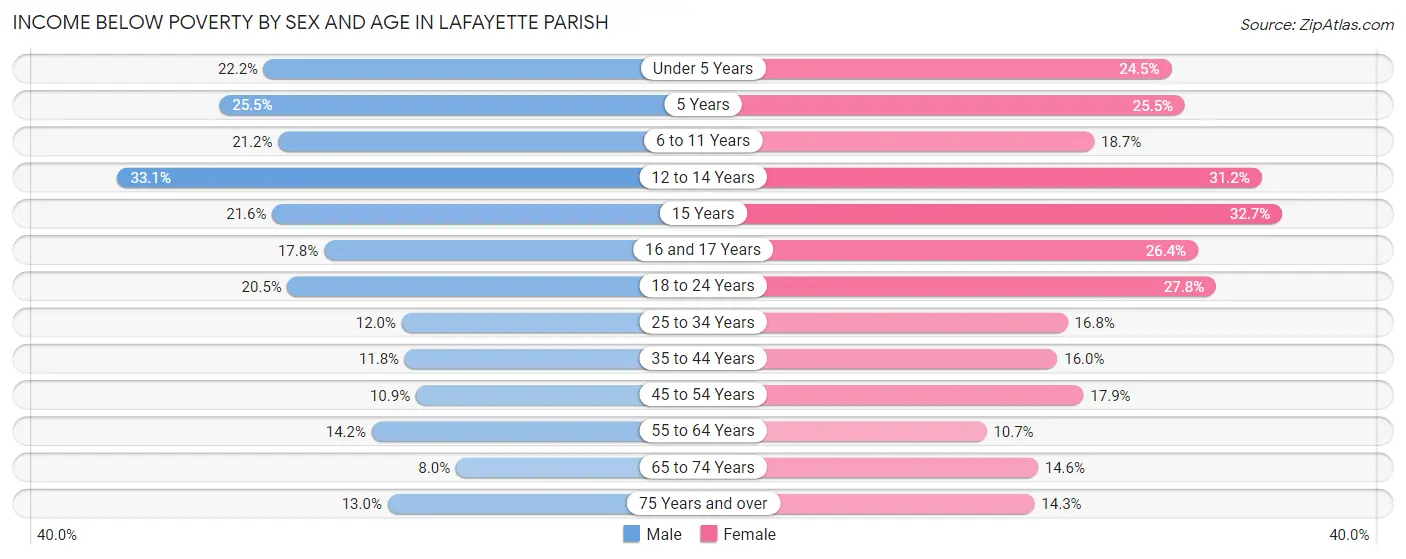
Income Below Poverty by Sex and Age in Lafayette Parish
With 15.3% poverty level for males and 18.3% for females among the residents of Lafayette Parish, 12 to 14 year old males and 15 year old females are the most vulnerable to poverty, with 1,480 males (33.1%) and 662 females (32.7%) in their respective age groups living below the poverty level.
| Age Bracket | Male | Female |
| Under 5 Years | 1,797 (22.2%) | 1,860 (24.5%) |
| 5 Years | 435 (25.5%) | 404 (25.5%) |
| 6 to 11 Years | 2,025 (21.2%) | 1,732 (18.7%) |
| 12 to 14 Years | 1,480 (33.1%) | 1,589 (31.2%) |
| 15 Years | 393 (21.6%) | 662 (32.7%) |
| 16 and 17 Years | 538 (17.8%) | 697 (26.4%) |
| 18 to 24 Years | 1,892 (20.5%) | 2,501 (27.8%) |
| 25 to 34 Years | 2,223 (12.0%) | 3,165 (16.8%) |
| 35 to 44 Years | 1,985 (11.8%) | 2,703 (16.0%) |
| 45 to 54 Years | 1,518 (10.9%) | 2,583 (17.9%) |
| 55 to 64 Years | 2,021 (14.2%) | 1,720 (10.7%) |
| 65 to 74 Years | 786 (8.0%) | 1,623 (14.5%) |
| 75 Years and over | 631 (13.0%) | 1,043 (14.3%) |
| Total | 17,724 (15.3%) | 22,282 (18.3%) |
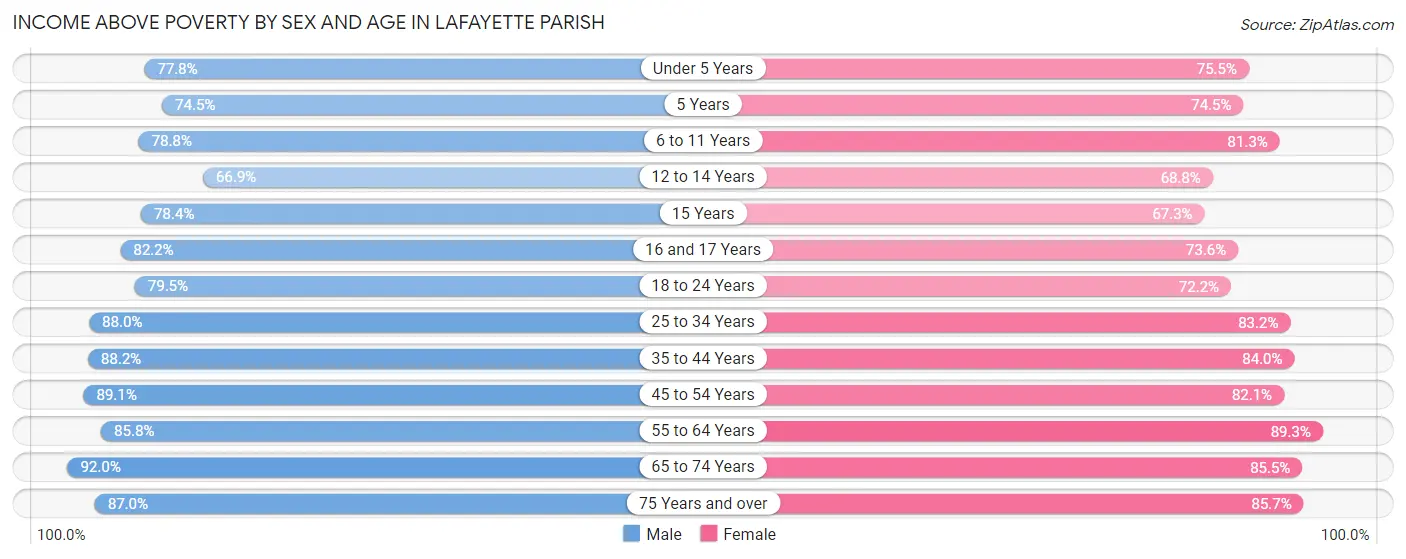
Income Above Poverty by Sex and Age in Lafayette Parish
According to the poverty statistics in Lafayette Parish, males aged 65 to 74 years and females aged 55 to 64 years are the age groups that are most secure financially, with 92.0% of males and 89.3% of females in these age groups living above the poverty line.
| Age Bracket | Male | Female |
| Under 5 Years | 6,287 (77.8%) | 5,744 (75.5%) |
| 5 Years | 1,268 (74.5%) | 1,182 (74.5%) |
| 6 to 11 Years | 7,542 (78.8%) | 7,517 (81.3%) |
| 12 to 14 Years | 2,991 (66.9%) | 3,510 (68.8%) |
| 15 Years | 1,426 (78.4%) | 1,363 (67.3%) |
| 16 and 17 Years | 2,489 (82.2%) | 1,939 (73.6%) |
| 18 to 24 Years | 7,353 (79.5%) | 6,503 (72.2%) |
| 25 to 34 Years | 16,324 (88.0%) | 15,708 (83.2%) |
| 35 to 44 Years | 14,897 (88.2%) | 14,193 (84.0%) |
| 45 to 54 Years | 12,362 (89.1%) | 11,816 (82.1%) |
| 55 to 64 Years | 12,190 (85.8%) | 14,299 (89.3%) |
| 65 to 74 Years | 9,076 (92.0%) | 9,534 (85.5%) |
| 75 Years and over | 4,208 (87.0%) | 6,251 (85.7%) |
| Total | 98,413 (84.7%) | 99,559 (81.7%) |
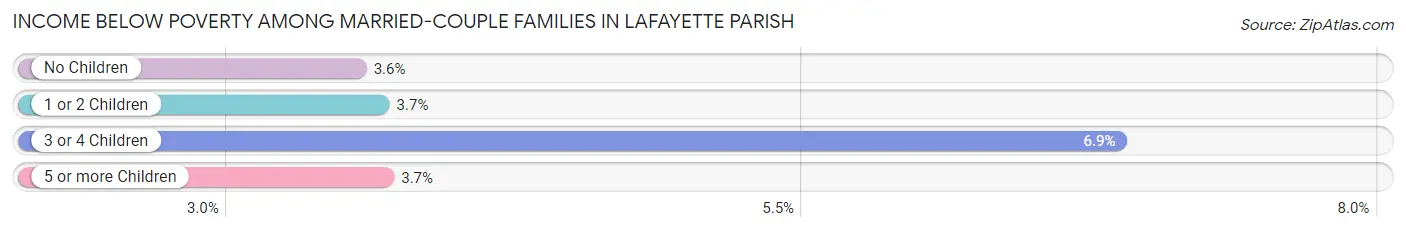
Income Below Poverty Among Married-Couple Families in Lafayette Parish
The poverty statistics for married-couple families in Lafayette Parish show that 3.9% or 1,756 of the total 45,148 families live below the poverty line. Families with 3 or 4 children have the highest poverty rate of 6.9%, comprising of 275 families. On the other hand, families with no children have the lowest poverty rate of 3.6%, which includes 917 families.
| Children | Above Poverty | Below Poverty |
| No Children | 24,833 (96.4%) | 917 (3.6%) |
| 1 or 2 Children | 14,438 (96.3%) | 549 (3.7%) |
| 3 or 4 Children | 3,728 (93.1%) | 275 (6.9%) |
| 5 or more Children | 393 (96.3%) | 15 (3.7%) |
| Total | 43,392 (96.1%) | 1,756 (3.9%) |
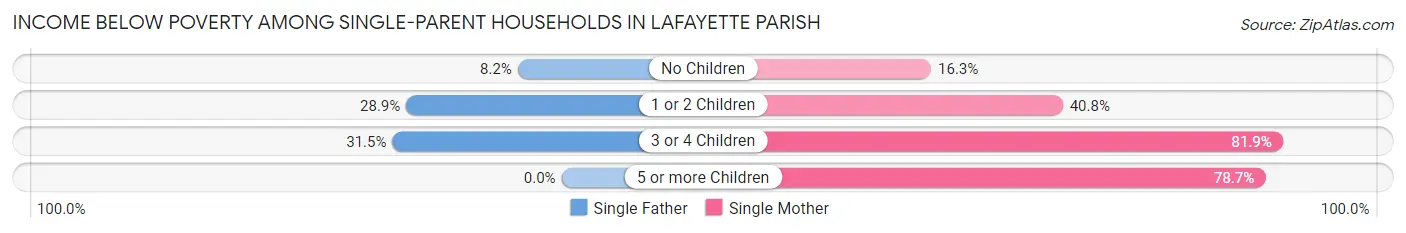
Income Below Poverty Among Single-Parent Households in Lafayette Parish
According to the poverty data in Lafayette Parish, 20.8% or 821 single-father households and 37.6% or 4,699 single-mother households are living below the poverty line. Among single-father households, those with 3 or 4 children have the highest poverty rate, with 161 households (31.5%) experiencing poverty. Likewise, among single-mother households, those with 3 or 4 children have the highest poverty rate, with 1,130 households (81.9%) falling below the poverty line.
| Children | Single Father | Single Mother |
| No Children | 131 (8.2%) | 780 (16.3%) |
| 1 or 2 Children | 529 (28.9%) | 2,354 (40.8%) |
| 3 or 4 Children | 161 (31.5%) | 1,130 (81.9%) |
| 5 or more Children | 0 (0.0%) | 435 (78.7%) |
| Total | 821 (20.8%) | 4,699 (37.6%) |
Income Below Poverty Among Married-Couple vs Single-Parent Households in Lafayette Parish
The poverty data for Lafayette Parish shows that 1,756 of the married-couple family households (3.9%) and 5,520 of the single-parent households (33.6%) are living below the poverty level. Within the married-couple family households, those with 3 or 4 children have the highest poverty rate, with 275 households (6.9%) falling below the poverty line. Among the single-parent households, those with 5 or more children have the highest poverty rate, with 435 household (78.7%) living below poverty.
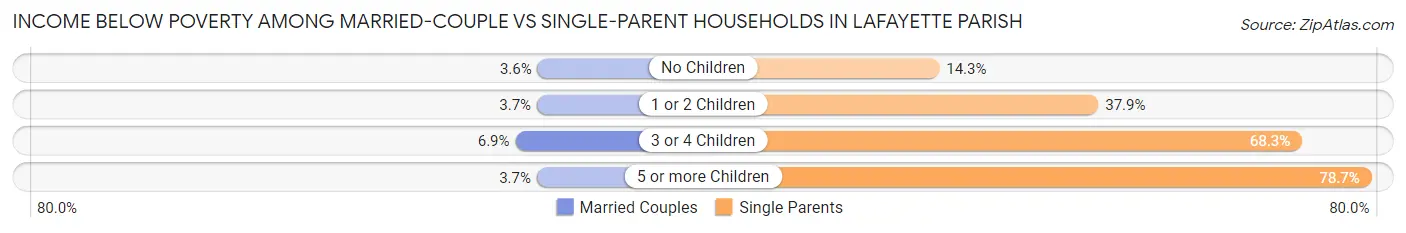
| Children | Married-Couple Families | Single-Parent Households |
| No Children | 917 (3.6%) | 911 (14.2%) |
| 1 or 2 Children | 549 (3.7%) | 2,883 (37.9%) |
| 3 or 4 Children | 275 (6.9%) | 1,291 (68.3%) |
| 5 or more Children | 15 (3.7%) | 435 (78.7%) |
| Total | 1,756 (3.9%) | 5,520 (33.6%) |
Employment Characteristics in Lafayette Parish
Employment by Class of Employer in Lafayette Parish
Among the 116,494 employed individuals in Lafayette Parish, private company employees (79,116 | 67.9%), self-employed (not incorporated) (10,556 | 9.1%), and local government employees (8,289 | 7.1%) make up the most common classes of employment.
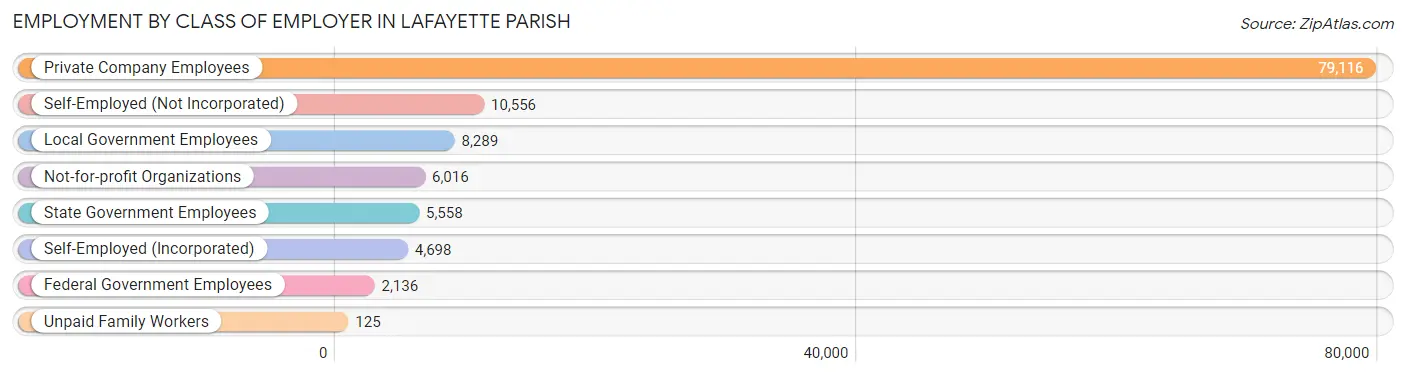
| Employer Class | # Employees | % Employees |
| Private Company Employees | 79,116 | 67.9% |
| Self-Employed (Incorporated) | 4,698 | 4.0% |
| Self-Employed (Not Incorporated) | 10,556 | 9.1% |
| Not-for-profit Organizations | 6,016 | 5.2% |
| Local Government Employees | 8,289 | 7.1% |
| State Government Employees | 5,558 | 4.8% |
| Federal Government Employees | 2,136 | 1.8% |
| Unpaid Family Workers | 125 | 0.1% |
| Total | 116,494 | 100.0% |
Employment Status by Age in Lafayette Parish
According to the labor force statistics for Lafayette Parish, out of the total population over 16 years of age (190,947), 65.2% or 124,497 individuals are in the labor force, with 5.2% or 6,474 of them unemployed. The age group with the highest labor force participation rate is 30 to 34 years, with 85.9% or 16,874 individuals in the labor force. Within the labor force, the 16 to 19 years age range has the highest percentage of unemployed individuals, with 14.3% or 529 of them being unemployed.
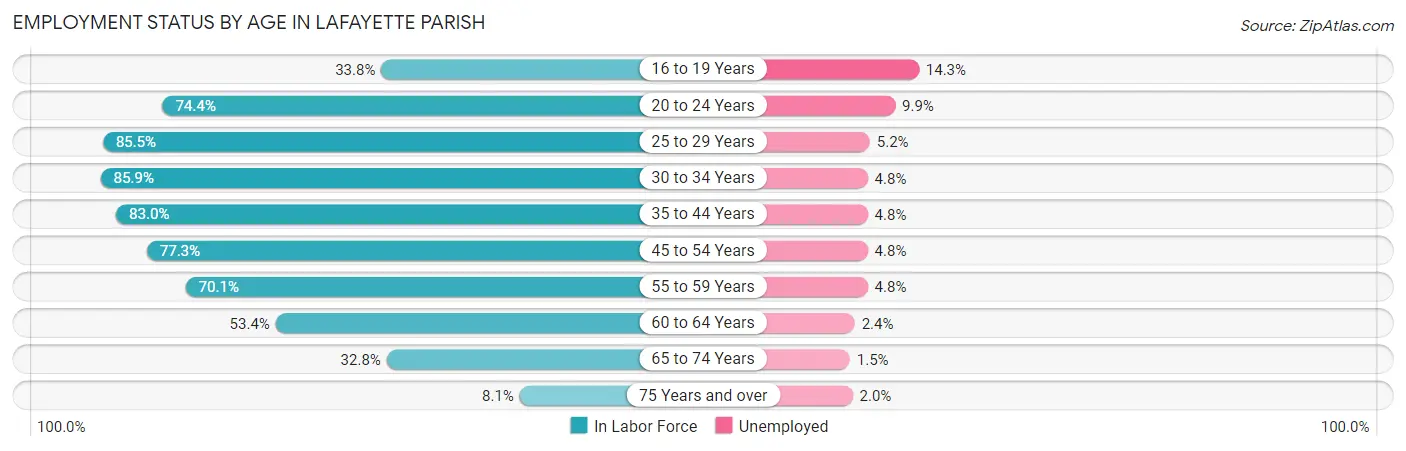
| Age Bracket | In Labor Force | Unemployed |
| 16 to 19 Years | 3,701 (33.8%) | 529 (14.3%) |
| 20 to 24 Years | 11,455 (74.4%) | 1,134 (9.9%) |
| 25 to 29 Years | 15,454 (85.5%) | 804 (5.2%) |
| 30 to 34 Years | 16,874 (85.9%) | 810 (4.8%) |
| 35 to 44 Years | 28,240 (83.0%) | 1,356 (4.8%) |
| 45 to 54 Years | 21,945 (77.3%) | 1,053 (4.8%) |
| 55 to 59 Years | 11,069 (70.1%) | 531 (4.8%) |
| 60 to 64 Years | 7,805 (53.4%) | 187 (2.4%) |
| 65 to 74 Years | 6,982 (32.8%) | 105 (1.5%) |
| 75 Years and over | 1,035 (8.1%) | 21 (2.0%) |
| Total | 124,497 (65.2%) | 6,474 (5.2%) |
Employment Status by Educational Attainment in Lafayette Parish
According to labor force statistics for Lafayette Parish, 77.7% of individuals (101,428) out of the total population between 25 and 64 years of age (130,538) are in the labor force, with 4.7% or 4,767 of them being unemployed. The group with the highest labor force participation rate are those with the educational attainment of bachelor's degree or higher, with 86.7% or 40,815 individuals in the labor force. Within the labor force, individuals with less than high school education have the highest percentage of unemployment, with 8.5% or 602 of them being unemployed.
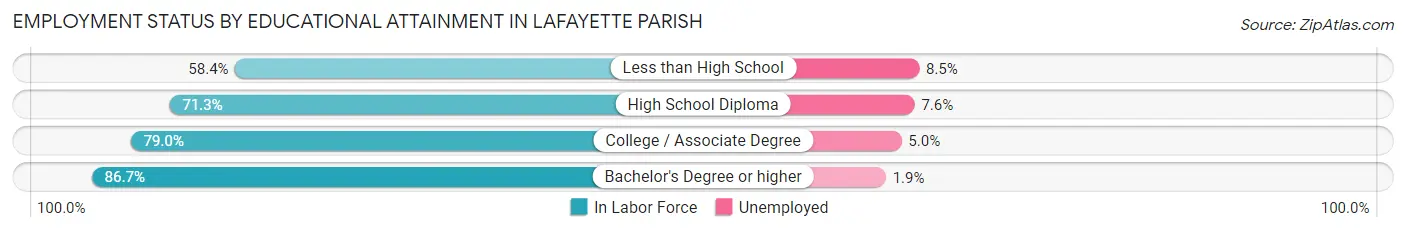
| Educational Attainment | In Labor Force | Unemployed |
| Less than High School | 7,083 (58.4%) | 1,031 (8.5%) |
| High School Diploma | 26,541 (71.3%) | 2,829 (7.6%) |
| College / Associate Degree | 26,945 (79.0%) | 1,705 (5.0%) |
| Bachelor's Degree or higher | 40,815 (86.7%) | 894 (1.9%) |
| Total | 101,428 (77.7%) | 6,135 (4.7%) |
Employment Occupations by Sex in Lafayette Parish
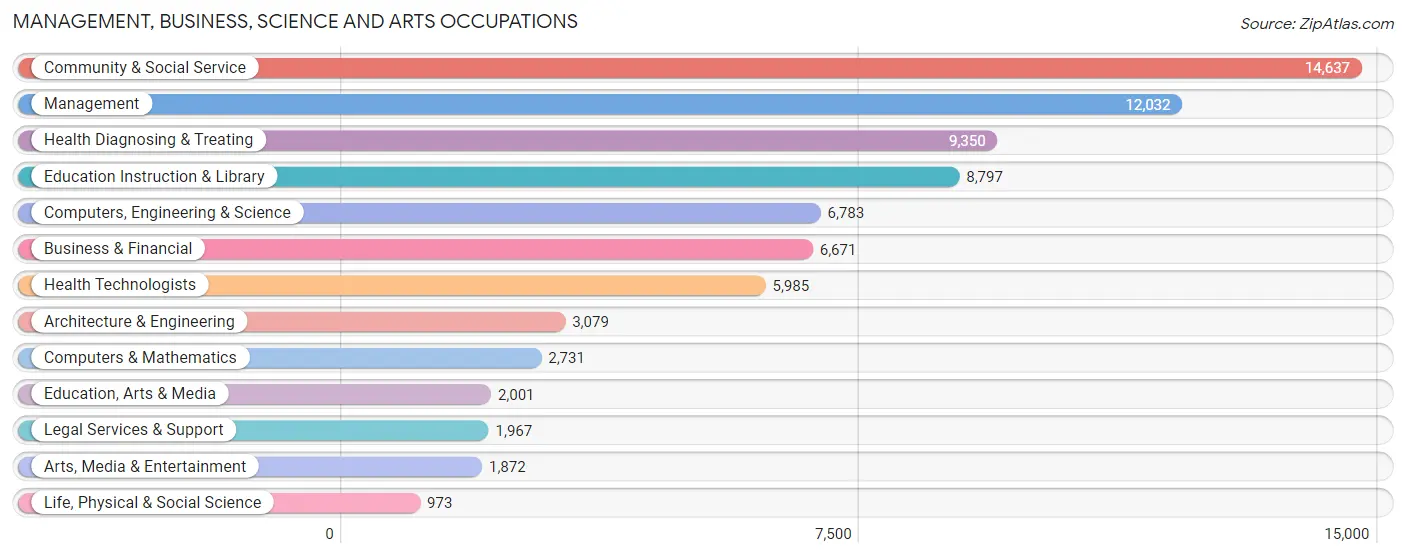
Management, Business, Science and Arts Occupations
The most common Management, Business, Science and Arts occupations in Lafayette Parish are Community & Social Service (14,637 | 12.4%), Management (12,032 | 10.2%), Health Diagnosing & Treating (9,350 | 8.0%), Education Instruction & Library (8,797 | 7.5%), and Computers, Engineering & Science (6,783 | 5.8%).
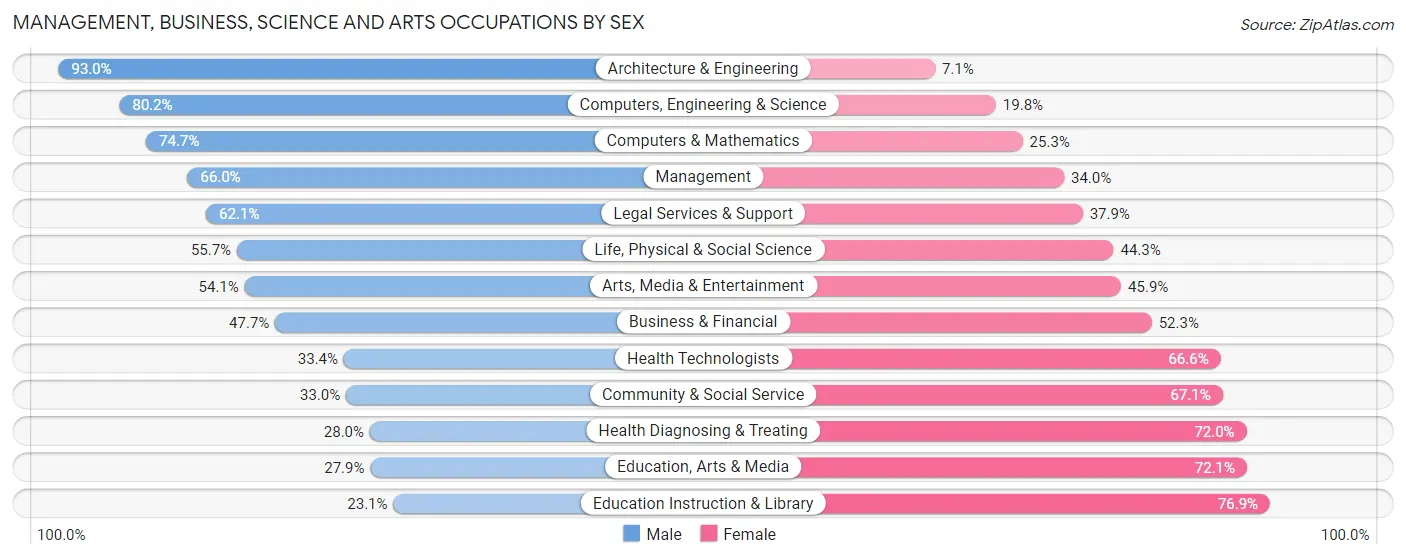
Management, Business, Science and Arts Occupations by Sex
Within the Management, Business, Science and Arts occupations in Lafayette Parish, the most male-oriented occupations are Architecture & Engineering (92.9%), Computers, Engineering & Science (80.2%), and Computers & Mathematics (74.7%), while the most female-oriented occupations are Education Instruction & Library (76.9%), Education, Arts & Media (72.1%), and Health Diagnosing & Treating (72.0%).
| Occupation | Male | Female |
| Management | 7,945 (66.0%) | 4,087 (34.0%) |
| Business & Financial | 3,184 (47.7%) | 3,487 (52.3%) |
| Computers, Engineering & Science | 5,443 (80.2%) | 1,340 (19.8%) |
| Computers & Mathematics | 2,039 (74.7%) | 692 (25.3%) |
| Architecture & Engineering | 2,862 (92.9%) | 217 (7.0%) |
| Life, Physical & Social Science | 542 (55.7%) | 431 (44.3%) |
| Community & Social Service | 4,823 (33.0%) | 9,814 (67.0%) |
| Education, Arts & Media | 558 (27.9%) | 1,443 (72.1%) |
| Legal Services & Support | 1,222 (62.1%) | 745 (37.9%) |
| Education Instruction & Library | 2,030 (23.1%) | 6,767 (76.9%) |
| Arts, Media & Entertainment | 1,013 (54.1%) | 859 (45.9%) |
| Health Diagnosing & Treating | 2,616 (28.0%) | 6,734 (72.0%) |
| Health Technologists | 1,999 (33.4%) | 3,986 (66.6%) |
| Total (Category) | 24,011 (48.5%) | 25,462 (51.5%) |
| Total (Overall) | 61,619 (52.4%) | 56,058 (47.6%) |
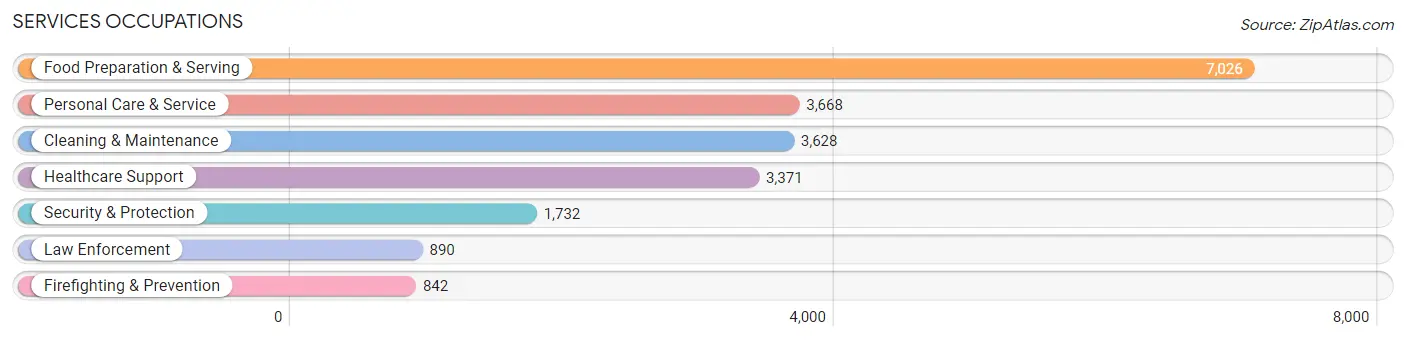
Services Occupations
The most common Services occupations in Lafayette Parish are Food Preparation & Serving (7,026 | 6.0%), Personal Care & Service (3,668 | 3.1%), Cleaning & Maintenance (3,628 | 3.1%), Healthcare Support (3,371 | 2.9%), and Security & Protection (1,732 | 1.5%).
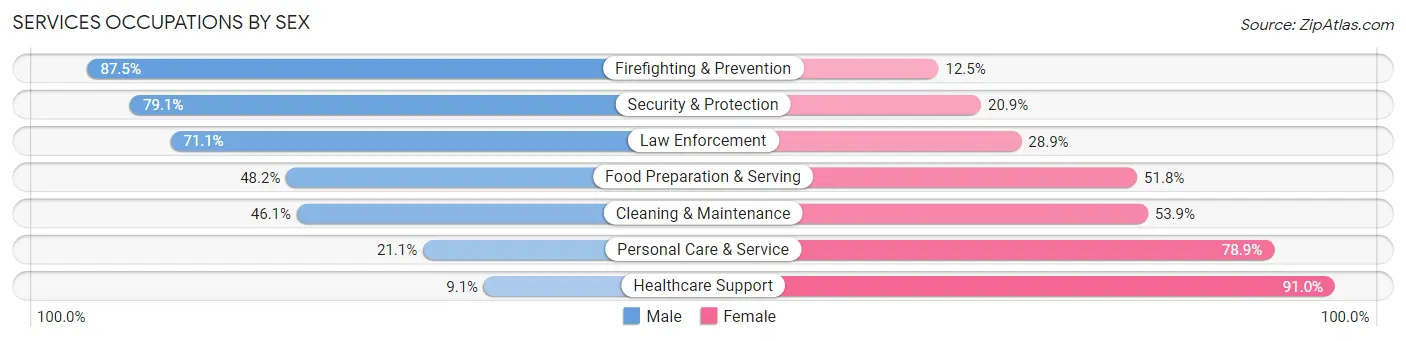
Services Occupations by Sex
Within the Services occupations in Lafayette Parish, the most male-oriented occupations are Firefighting & Prevention (87.5%), Security & Protection (79.1%), and Law Enforcement (71.1%), while the most female-oriented occupations are Healthcare Support (90.9%), Personal Care & Service (78.9%), and Cleaning & Maintenance (53.9%).
| Occupation | Male | Female |
| Healthcare Support | 305 (9.0%) | 3,066 (90.9%) |
| Security & Protection | 1,370 (79.1%) | 362 (20.9%) |
| Firefighting & Prevention | 737 (87.5%) | 105 (12.5%) |
| Law Enforcement | 633 (71.1%) | 257 (28.9%) |
| Food Preparation & Serving | 3,386 (48.2%) | 3,640 (51.8%) |
| Cleaning & Maintenance | 1,672 (46.1%) | 1,956 (53.9%) |
| Personal Care & Service | 774 (21.1%) | 2,894 (78.9%) |
| Total (Category) | 7,507 (38.7%) | 11,918 (61.4%) |
| Total (Overall) | 61,619 (52.4%) | 56,058 (47.6%) |
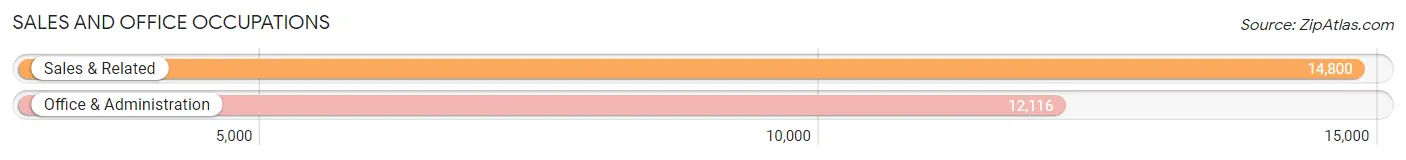
Sales and Office Occupations
The most common Sales and Office occupations in Lafayette Parish are Sales & Related (14,800 | 12.6%), and Office & Administration (12,116 | 10.3%).
Sales and Office Occupations by Sex
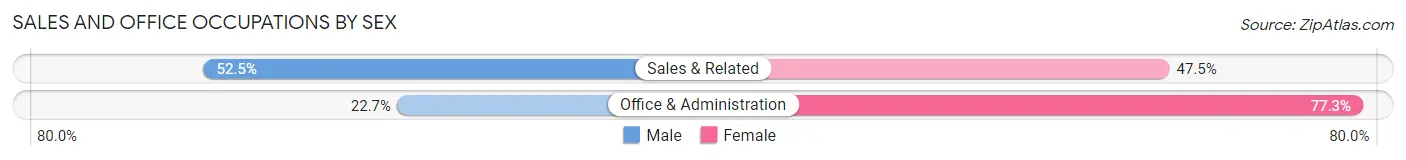
| Occupation | Male | Female |
| Sales & Related | 7,764 (52.5%) | 7,036 (47.5%) |
| Office & Administration | 2,754 (22.7%) | 9,362 (77.3%) |
| Total (Category) | 10,518 (39.1%) | 16,398 (60.9%) |
| Total (Overall) | 61,619 (52.4%) | 56,058 (47.6%) |
Natural Resources, Construction and Maintenance Occupations
The most common Natural Resources, Construction and Maintenance occupations in Lafayette Parish are Construction & Extraction (6,728 | 5.7%), Installation, Maintenance & Repair (2,954 | 2.5%), and Farming, Fishing & Forestry (138 | 0.1%).

Natural Resources, Construction and Maintenance Occupations by Sex
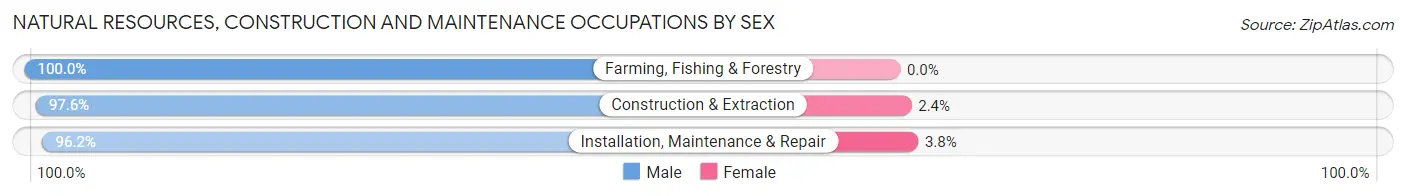
| Occupation | Male | Female |
| Farming, Fishing & Forestry | 138 (100.0%) | 0 (0.0%) |
| Construction & Extraction | 6,569 (97.6%) | 159 (2.4%) |
| Installation, Maintenance & Repair | 2,843 (96.2%) | 111 (3.8%) |
| Total (Category) | 9,550 (97.3%) | 270 (2.8%) |
| Total (Overall) | 61,619 (52.4%) | 56,058 (47.6%) |
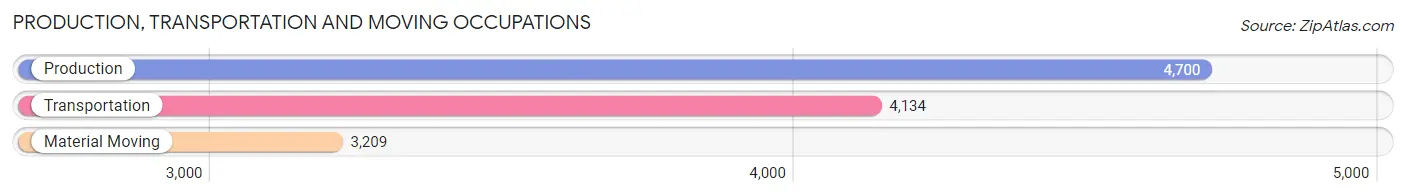
Production, Transportation and Moving Occupations
The most common Production, Transportation and Moving occupations in Lafayette Parish are Production (4,700 | 4.0%), Transportation (4,134 | 3.5%), and Material Moving (3,209 | 2.7%).
Production, Transportation and Moving Occupations by Sex
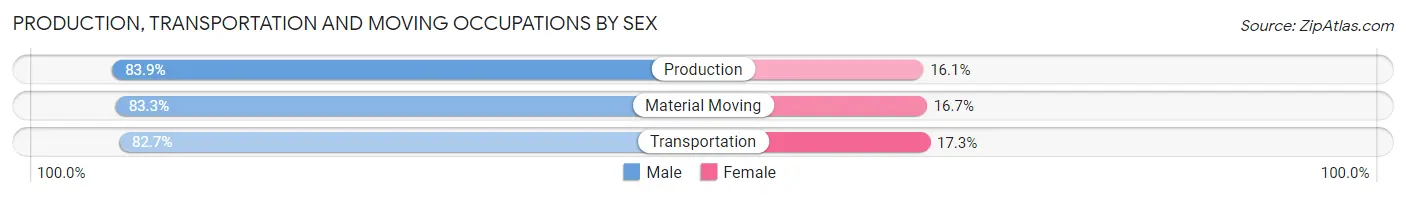
| Occupation | Male | Female |
| Production | 3,944 (83.9%) | 756 (16.1%) |
| Transportation | 3,417 (82.7%) | 717 (17.3%) |
| Material Moving | 2,672 (83.3%) | 537 (16.7%) |
| Total (Category) | 10,033 (83.3%) | 2,010 (16.7%) |
| Total (Overall) | 61,619 (52.4%) | 56,058 (47.6%) |
Employment Industries by Sex in Lafayette Parish
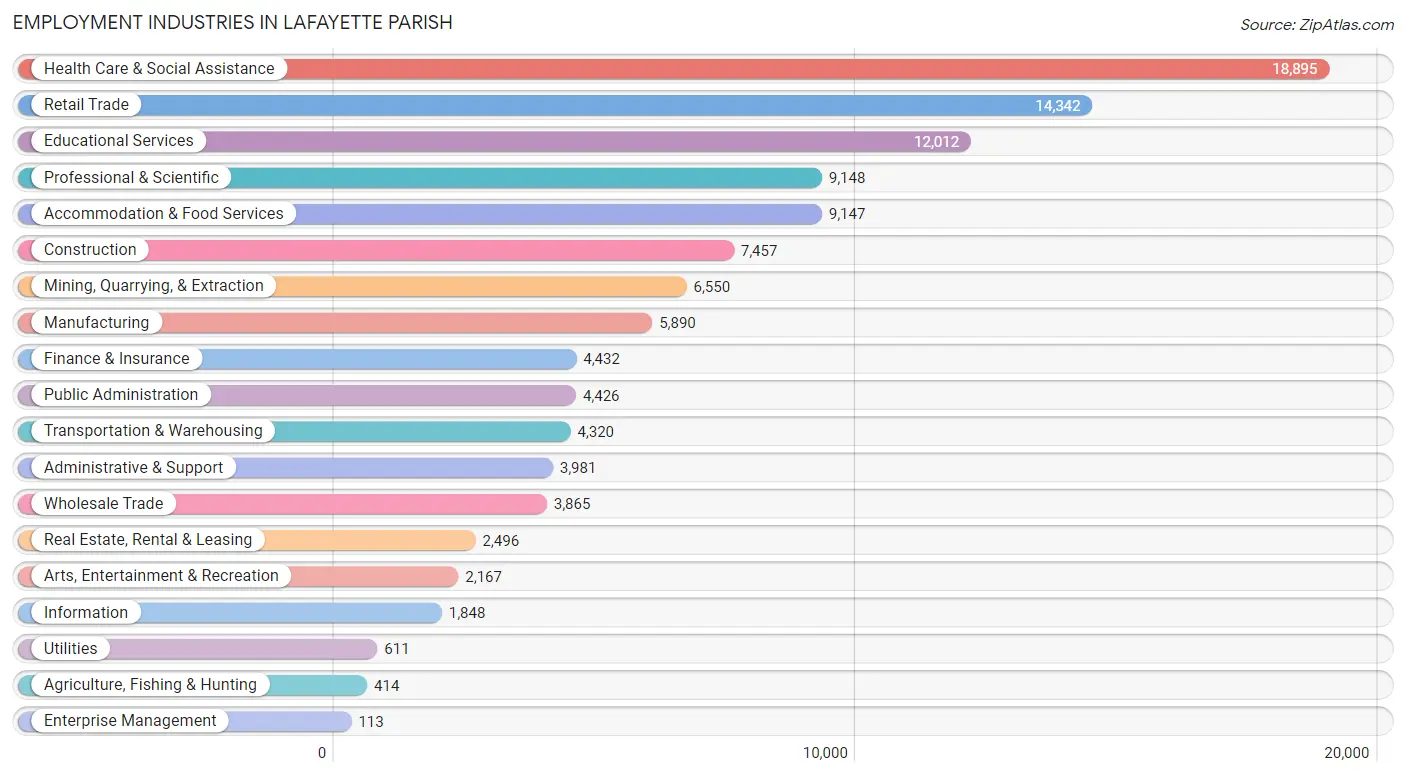
Employment Industries in Lafayette Parish
The major employment industries in Lafayette Parish include Health Care & Social Assistance (18,895 | 16.1%), Retail Trade (14,342 | 12.2%), Educational Services (12,012 | 10.2%), Professional & Scientific (9,148 | 7.8%), and Accommodation & Food Services (9,147 | 7.8%).
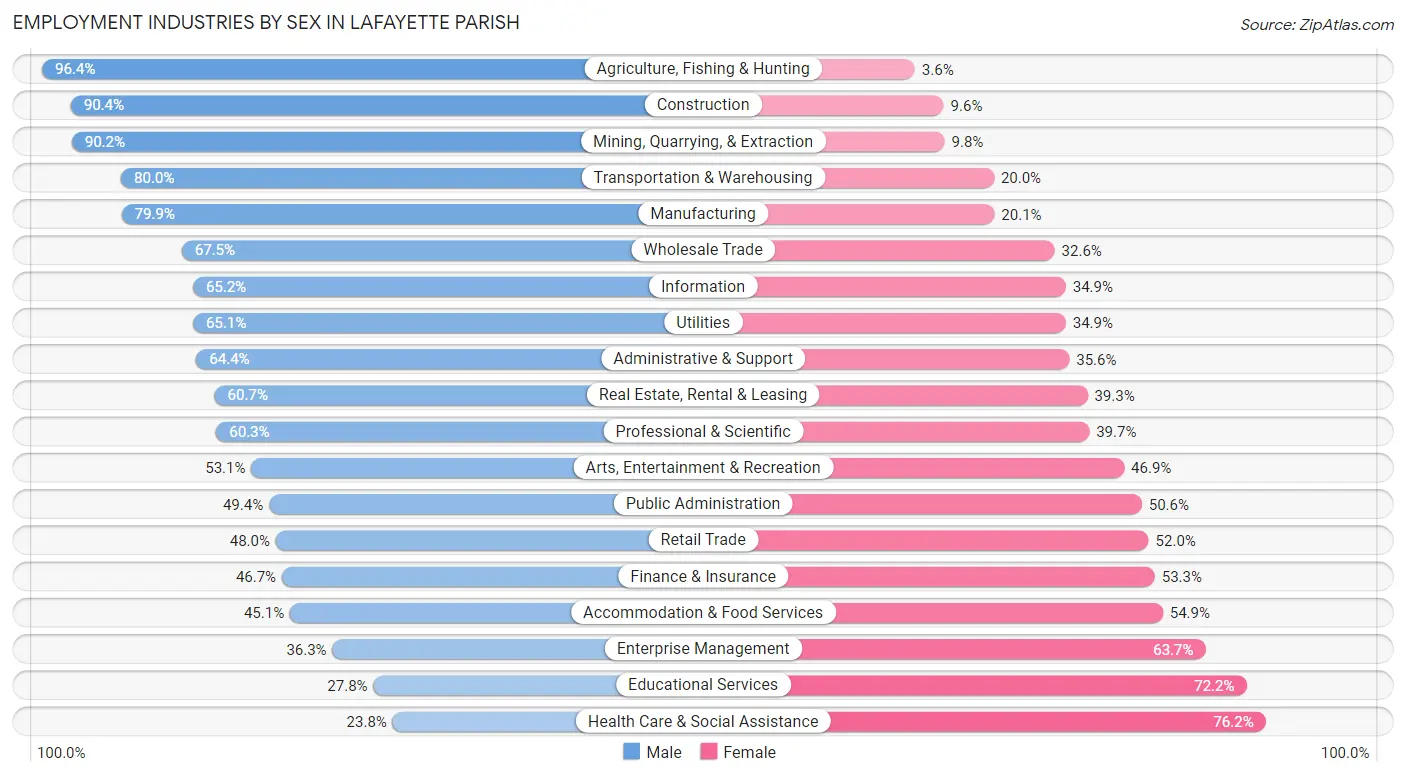
Employment Industries by Sex in Lafayette Parish
The Lafayette Parish industries that see more men than women are Agriculture, Fishing & Hunting (96.4%), Construction (90.4%), and Mining, Quarrying, & Extraction (90.2%), whereas the industries that tend to have a higher number of women are Health Care & Social Assistance (76.2%), Educational Services (72.2%), and Enterprise Management (63.7%).
| Industry | Male | Female |
| Agriculture, Fishing & Hunting | 399 (96.4%) | 15 (3.6%) |
| Mining, Quarrying, & Extraction | 5,910 (90.2%) | 640 (9.8%) |
| Construction | 6,743 (90.4%) | 714 (9.6%) |
| Manufacturing | 4,707 (79.9%) | 1,183 (20.1%) |
| Wholesale Trade | 2,607 (67.4%) | 1,258 (32.6%) |
| Retail Trade | 6,884 (48.0%) | 7,458 (52.0%) |
| Transportation & Warehousing | 3,457 (80.0%) | 863 (20.0%) |
| Utilities | 398 (65.1%) | 213 (34.9%) |
| Information | 1,204 (65.1%) | 644 (34.8%) |
| Finance & Insurance | 2,071 (46.7%) | 2,361 (53.3%) |
| Real Estate, Rental & Leasing | 1,514 (60.7%) | 982 (39.3%) |
| Professional & Scientific | 5,516 (60.3%) | 3,632 (39.7%) |
| Enterprise Management | 41 (36.3%) | 72 (63.7%) |
| Administrative & Support | 2,565 (64.4%) | 1,416 (35.6%) |
| Educational Services | 3,339 (27.8%) | 8,673 (72.2%) |
| Health Care & Social Assistance | 4,500 (23.8%) | 14,395 (76.2%) |
| Arts, Entertainment & Recreation | 1,150 (53.1%) | 1,017 (46.9%) |
| Accommodation & Food Services | 4,123 (45.1%) | 5,024 (54.9%) |
| Public Administration | 2,187 (49.4%) | 2,239 (50.6%) |
| Total | 61,619 (52.4%) | 56,058 (47.6%) |
Education in Lafayette Parish
School Enrollment in Lafayette Parish
The most common levels of schooling among the 61,116 students in Lafayette Parish are middle school (13,240 | 21.7%), college / undergraduate (12,833 | 21.0%), and high school (12,500 | 20.4%).

| School Level | # Students | % Students |
| Nursery / Preschool | 3,651 | 6.0% |
| Kindergarten | 3,213 | 5.3% |
| Elementary School | 12,485 | 20.4% |
| Middle School | 13,240 | 21.7% |
| High School | 12,500 | 20.4% |
| College / Undergraduate | 12,833 | 21.0% |
| Graduate / Professional | 3,194 | 5.2% |
| Total | 61,116 | 100.0% |
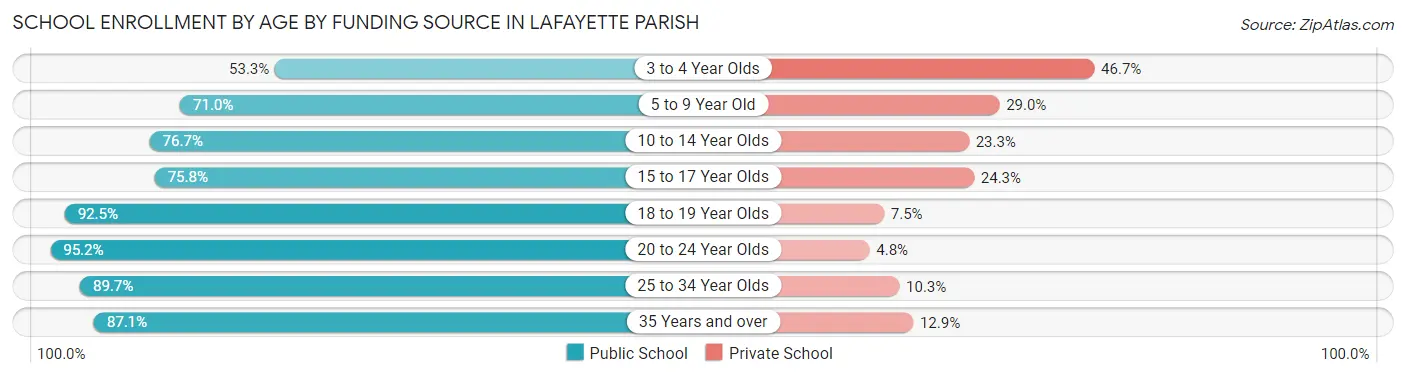
School Enrollment by Age by Funding Source in Lafayette Parish
Out of a total of 61,116 students who are enrolled in schools in Lafayette Parish, 13,079 (21.4%) attend a private institution, while the remaining 48,037 (78.6%) are enrolled in public schools. The age group of 3 to 4 year olds has the highest likelihood of being enrolled in private schools, with 1,286 (46.7% in the age bracket) enrolled. Conversely, the age group of 20 to 24 year olds has the lowest likelihood of being enrolled in a private school, with 6,724 (95.2% in the age bracket) attending a public institution.
| Age Bracket | Public School | Private School |
| 3 to 4 Year Olds | 1,470 (53.3%) | 1,286 (46.7%) |
| 5 to 9 Year Old | 10,645 (71.0%) | 4,342 (29.0%) |
| 10 to 14 Year Olds | 12,721 (76.7%) | 3,863 (23.3%) |
| 15 to 17 Year Olds | 7,024 (75.7%) | 2,248 (24.2%) |
| 18 to 19 Year Olds | 3,845 (92.5%) | 311 (7.5%) |
| 20 to 24 Year Olds | 6,724 (95.2%) | 338 (4.8%) |
| 25 to 34 Year Olds | 3,343 (89.7%) | 385 (10.3%) |
| 35 Years and over | 2,239 (87.1%) | 332 (12.9%) |
| Total | 48,037 (78.6%) | 13,079 (21.4%) |
Educational Attainment by Field of Study in Lafayette Parish
Business (12,907 | 21.5%), education (9,111 | 15.2%), science & technology (8,217 | 13.7%), liberal arts & history (5,386 | 9.0%), and engineering (4,145 | 6.9%) are the most common fields of study among 59,884 individuals in Lafayette Parish who have obtained a bachelor's degree or higher.
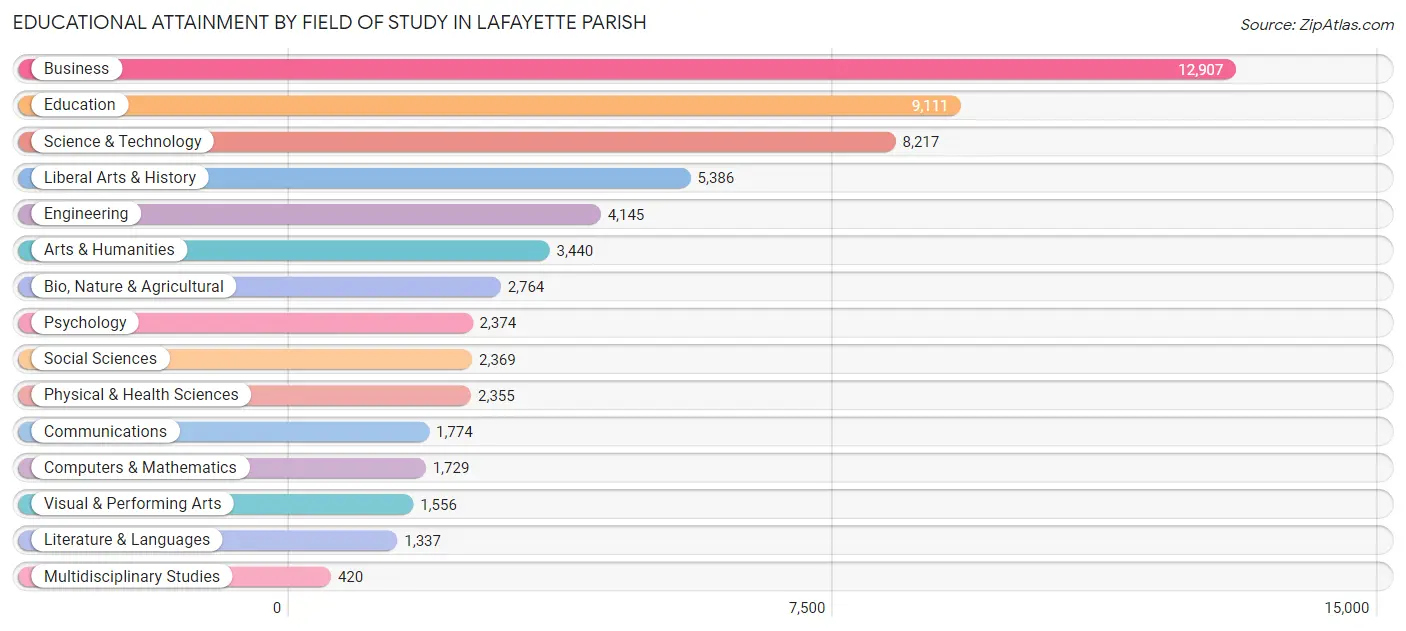
| Field of Study | # Graduates | % Graduates |
| Computers & Mathematics | 1,729 | 2.9% |
| Bio, Nature & Agricultural | 2,764 | 4.6% |
| Physical & Health Sciences | 2,355 | 3.9% |
| Psychology | 2,374 | 4.0% |
| Social Sciences | 2,369 | 4.0% |
| Engineering | 4,145 | 6.9% |
| Multidisciplinary Studies | 420 | 0.7% |
| Science & Technology | 8,217 | 13.7% |
| Business | 12,907 | 21.5% |
| Education | 9,111 | 15.2% |
| Literature & Languages | 1,337 | 2.2% |
| Liberal Arts & History | 5,386 | 9.0% |
| Visual & Performing Arts | 1,556 | 2.6% |
| Communications | 1,774 | 3.0% |
| Arts & Humanities | 3,440 | 5.7% |
| Total | 59,884 | 100.0% |
Transportation & Commute in Lafayette Parish
Vehicle Availability by Sex in Lafayette Parish
The most prevalent vehicle ownership categories in Lafayette Parish are males with 2 vehicles (30,845, accounting for 50.7%) and females with 2 vehicles (26,390, making up 56.7%).
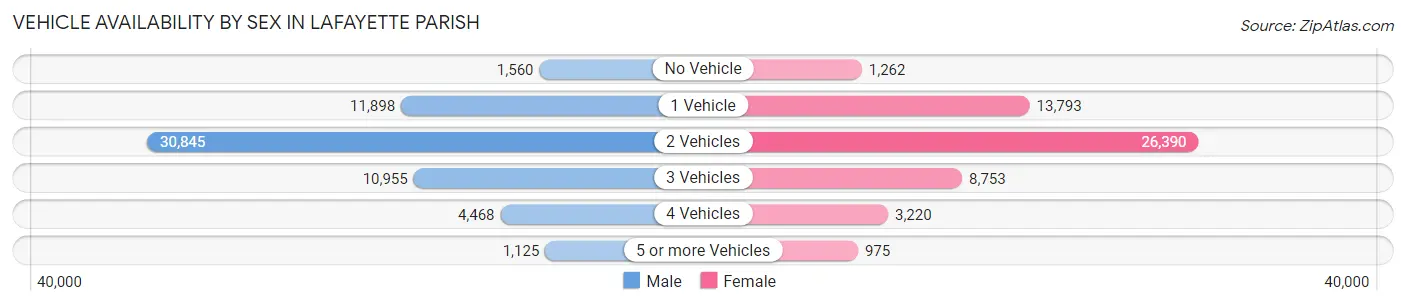
| Vehicles Available | Male | Female |
| No Vehicle | 1,560 (2.6%) | 1,262 (2.3%) |
| 1 Vehicle | 11,898 (19.6%) | 13,793 (25.4%) |
| 2 Vehicles | 30,845 (50.7%) | 26,390 (48.5%) |
| 3 Vehicles | 10,955 (18.0%) | 8,753 (16.1%) |
| 4 Vehicles | 4,468 (7.3%) | 3,220 (5.9%) |
| 5 or more Vehicles | 1,125 (1.8%) | 975 (1.8%) |
| Total | 60,851 (100.0%) | 54,393 (100.0%) |
Commute Time in Lafayette Parish
The most frequently occuring commute durations in Lafayette Parish are 15 to 19 minutes (21,931 commuters, 20.4%), 10 to 14 minutes (19,314 commuters, 18.0%), and 20 to 24 minutes (17,367 commuters, 16.2%).
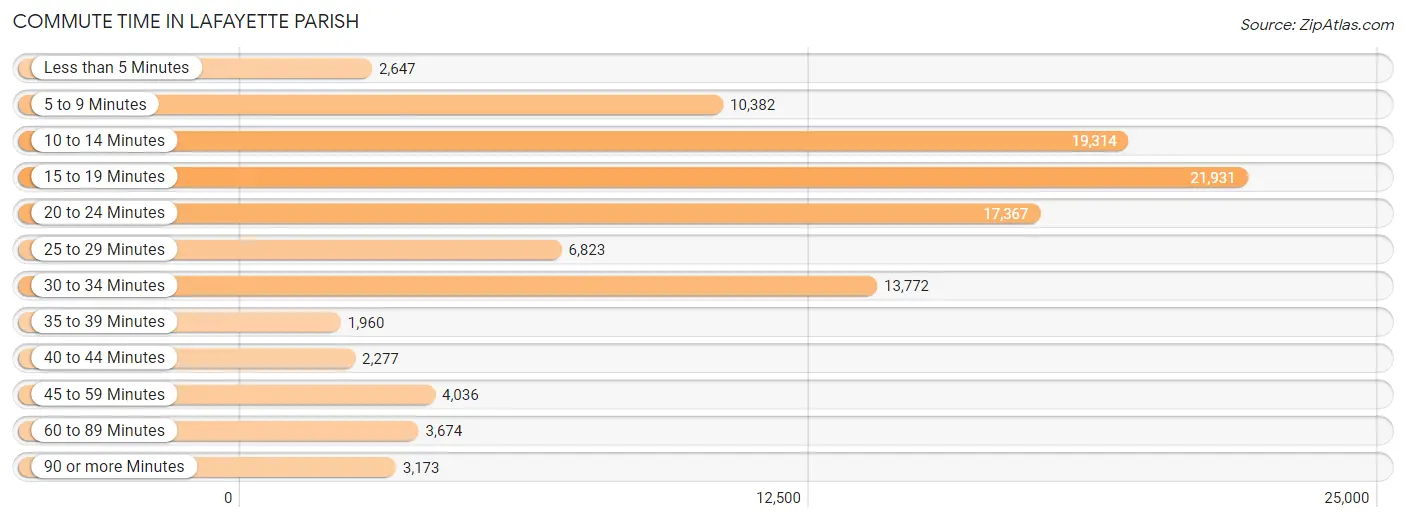
| Commute Time | # Commuters | % Commuters |
| Less than 5 Minutes | 2,647 | 2.5% |
| 5 to 9 Minutes | 10,382 | 9.7% |
| 10 to 14 Minutes | 19,314 | 18.0% |
| 15 to 19 Minutes | 21,931 | 20.4% |
| 20 to 24 Minutes | 17,367 | 16.2% |
| 25 to 29 Minutes | 6,823 | 6.4% |
| 30 to 34 Minutes | 13,772 | 12.8% |
| 35 to 39 Minutes | 1,960 | 1.8% |
| 40 to 44 Minutes | 2,277 | 2.1% |
| 45 to 59 Minutes | 4,036 | 3.8% |
| 60 to 89 Minutes | 3,674 | 3.4% |
| 90 or more Minutes | 3,173 | 3.0% |
Commute Time by Sex in Lafayette Parish
The most common commute times in Lafayette Parish are 15 to 19 minutes (11,606 commuters, 20.3%) for males and 15 to 19 minutes (10,325 commuters, 20.6%) for females.
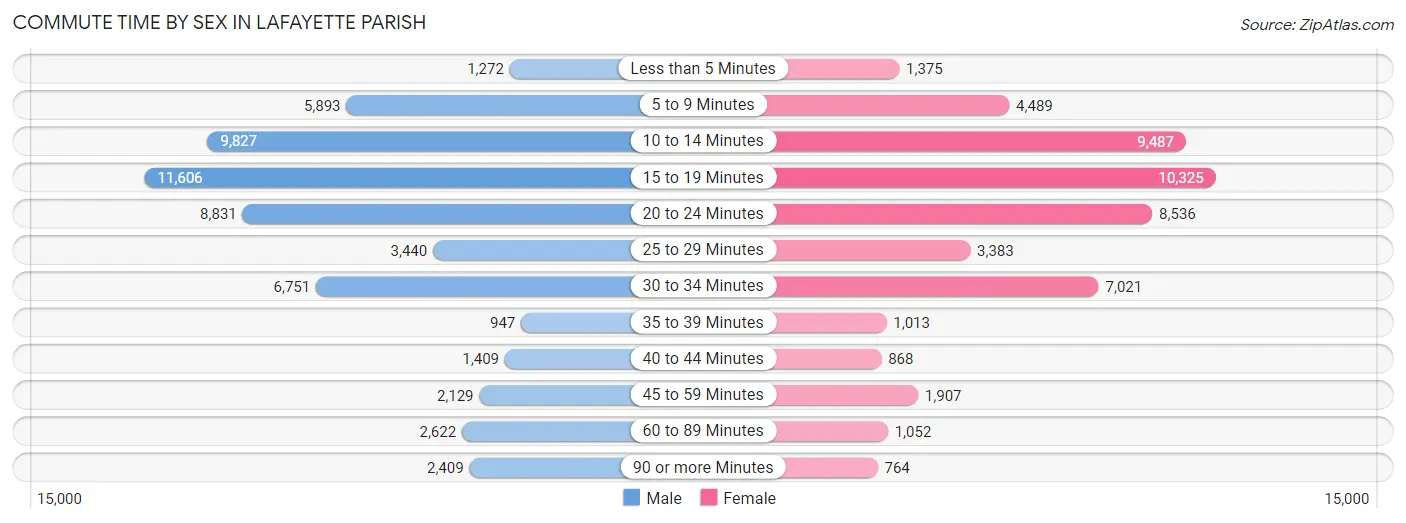
| Commute Time | Male | Female |
| Less than 5 Minutes | 1,272 (2.2%) | 1,375 (2.7%) |
| 5 to 9 Minutes | 5,893 (10.3%) | 4,489 (8.9%) |
| 10 to 14 Minutes | 9,827 (17.2%) | 9,487 (18.9%) |
| 15 to 19 Minutes | 11,606 (20.3%) | 10,325 (20.6%) |
| 20 to 24 Minutes | 8,831 (15.5%) | 8,536 (17.0%) |
| 25 to 29 Minutes | 3,440 (6.0%) | 3,383 (6.7%) |
| 30 to 34 Minutes | 6,751 (11.8%) | 7,021 (14.0%) |
| 35 to 39 Minutes | 947 (1.7%) | 1,013 (2.0%) |
| 40 to 44 Minutes | 1,409 (2.5%) | 868 (1.7%) |
| 45 to 59 Minutes | 2,129 (3.7%) | 1,907 (3.8%) |
| 60 to 89 Minutes | 2,622 (4.6%) | 1,052 (2.1%) |
| 90 or more Minutes | 2,409 (4.2%) | 764 (1.5%) |
Time of Departure to Work by Sex in Lafayette Parish
The most frequent times of departure to work in Lafayette Parish are 7:00 AM to 7:29 AM (11,265, 19.7%) for males and 7:00 AM to 7:29 AM (10,315, 20.5%) for females.
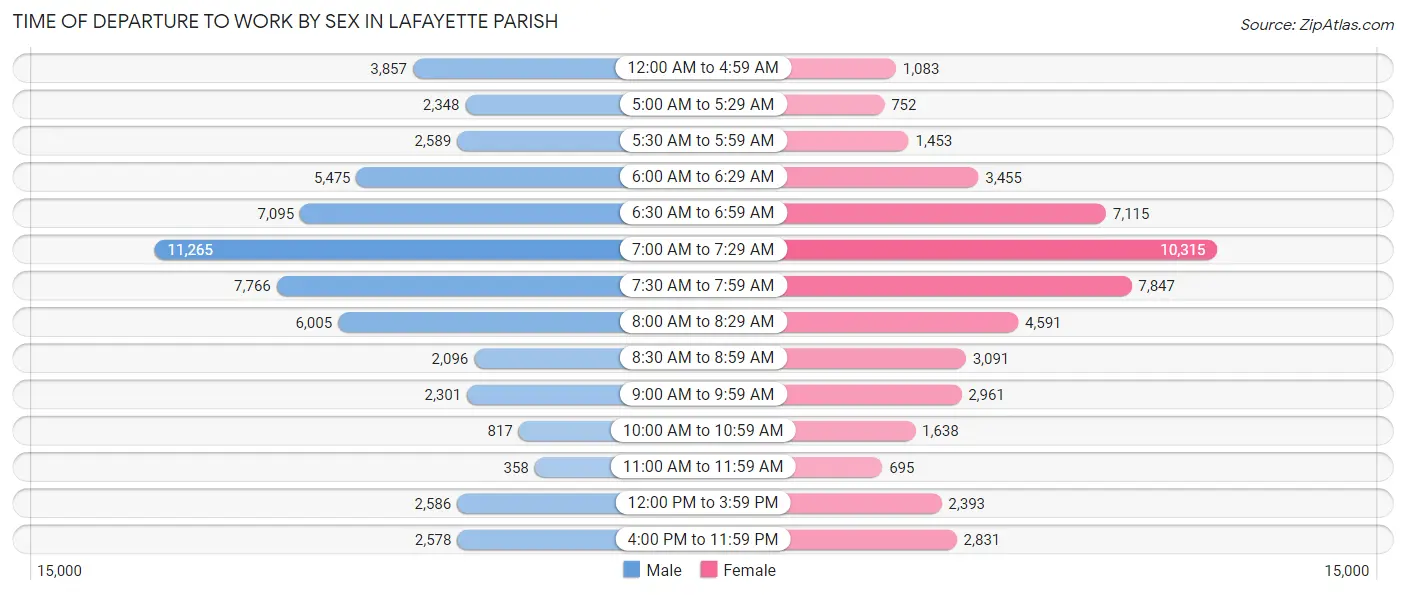
| Time of Departure | Male | Female |
| 12:00 AM to 4:59 AM | 3,857 (6.8%) | 1,083 (2.2%) |
| 5:00 AM to 5:29 AM | 2,348 (4.1%) | 752 (1.5%) |
| 5:30 AM to 5:59 AM | 2,589 (4.5%) | 1,453 (2.9%) |
| 6:00 AM to 6:29 AM | 5,475 (9.6%) | 3,455 (6.9%) |
| 6:30 AM to 6:59 AM | 7,095 (12.4%) | 7,115 (14.2%) |
| 7:00 AM to 7:29 AM | 11,265 (19.7%) | 10,315 (20.5%) |
| 7:30 AM to 7:59 AM | 7,766 (13.6%) | 7,847 (15.6%) |
| 8:00 AM to 8:29 AM | 6,005 (10.5%) | 4,591 (9.1%) |
| 8:30 AM to 8:59 AM | 2,096 (3.7%) | 3,091 (6.1%) |
| 9:00 AM to 9:59 AM | 2,301 (4.0%) | 2,961 (5.9%) |
| 10:00 AM to 10:59 AM | 817 (1.4%) | 1,638 (3.3%) |
| 11:00 AM to 11:59 AM | 358 (0.6%) | 695 (1.4%) |
| 12:00 PM to 3:59 PM | 2,586 (4.5%) | 2,393 (4.8%) |
| 4:00 PM to 11:59 PM | 2,578 (4.5%) | 2,831 (5.6%) |
| Total | 57,136 (100.0%) | 50,220 (100.0%) |
Housing Occupancy in Lafayette Parish
Occupancy by Ownership in Lafayette Parish
Of the total 97,694 dwellings in Lafayette Parish, owner-occupied units account for 64,768 (66.3%), while renter-occupied units make up 32,926 (33.7%).
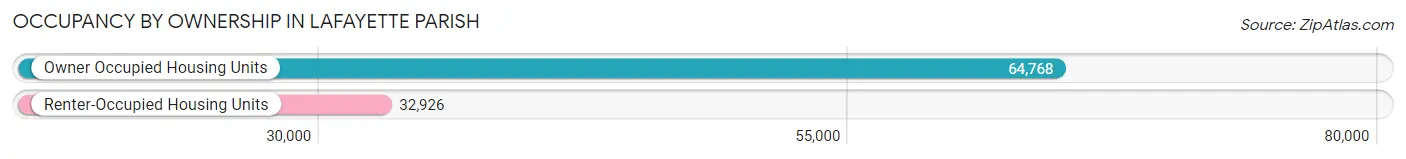
| Occupancy | # Housing Units | % Housing Units |
| Owner Occupied Housing Units | 64,768 | 66.3% |
| Renter-Occupied Housing Units | 32,926 | 33.7% |
| Total Occupied Housing Units | 97,694 | 100.0% |
Occupancy by Household Size in Lafayette Parish
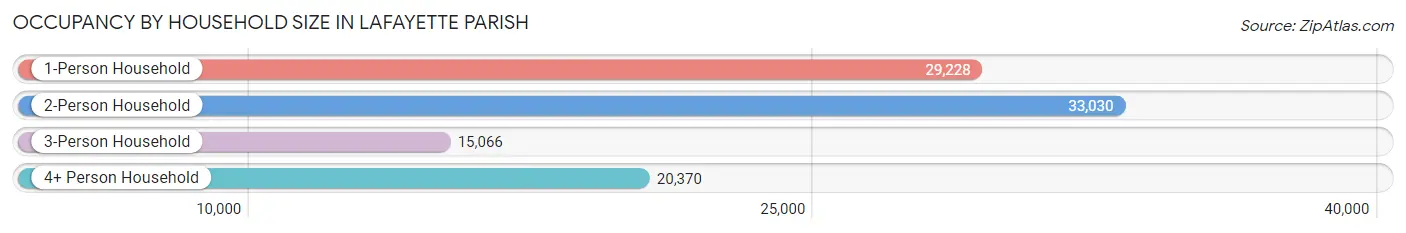
| Household Size | # Housing Units | % Housing Units |
| 1-Person Household | 29,228 | 29.9% |
| 2-Person Household | 33,030 | 33.8% |
| 3-Person Household | 15,066 | 15.4% |
| 4+ Person Household | 20,370 | 20.8% |
| Total Housing Units | 97,694 | 100.0% |
Occupancy by Ownership by Household Size in Lafayette Parish
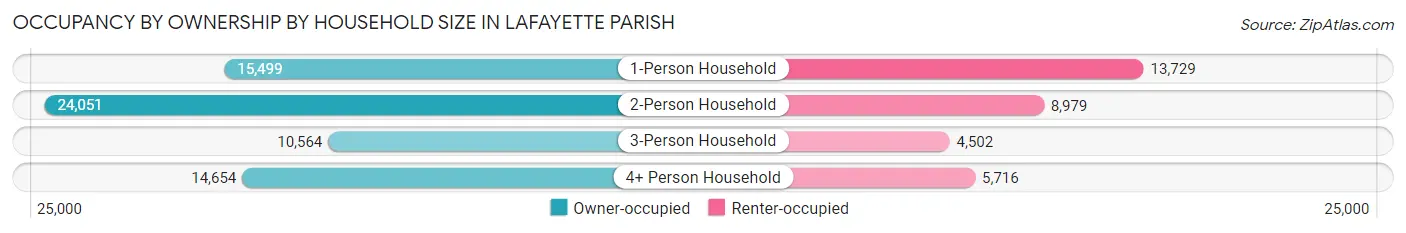
| Household Size | Owner-occupied | Renter-occupied |
| 1-Person Household | 15,499 (53.0%) | 13,729 (47.0%) |
| 2-Person Household | 24,051 (72.8%) | 8,979 (27.2%) |
| 3-Person Household | 10,564 (70.1%) | 4,502 (29.9%) |
| 4+ Person Household | 14,654 (71.9%) | 5,716 (28.1%) |
| Total Housing Units | 64,768 (66.3%) | 32,926 (33.7%) |
Occupancy by Educational Attainment in Lafayette Parish
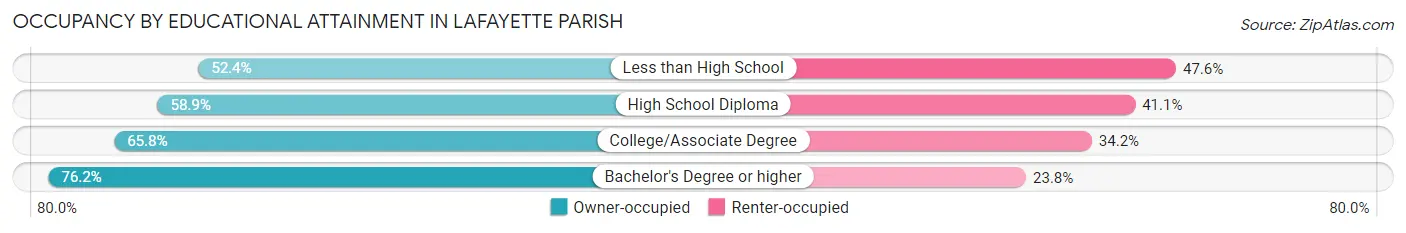
| Household Size | Owner-occupied | Renter-occupied |
| Less than High School | 5,260 (52.4%) | 4,771 (47.6%) |
| High School Diploma | 15,353 (58.9%) | 10,708 (41.1%) |
| College/Associate Degree | 17,638 (65.8%) | 9,176 (34.2%) |
| Bachelor's Degree or higher | 26,517 (76.2%) | 8,271 (23.8%) |
Occupancy by Age of Householder in Lafayette Parish
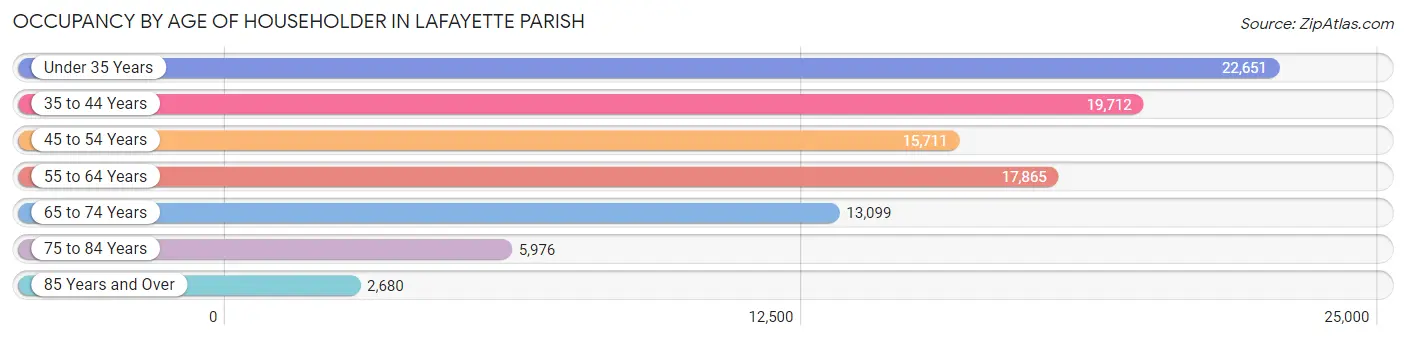
| Age Bracket | # Households | % Households |
| Under 35 Years | 22,651 | 23.2% |
| 35 to 44 Years | 19,712 | 20.2% |
| 45 to 54 Years | 15,711 | 16.1% |
| 55 to 64 Years | 17,865 | 18.3% |
| 65 to 74 Years | 13,099 | 13.4% |
| 75 to 84 Years | 5,976 | 6.1% |
| 85 Years and Over | 2,680 | 2.7% |
| Total | 97,694 | 100.0% |
Housing Finances in Lafayette Parish
Median Income by Occupancy in Lafayette Parish
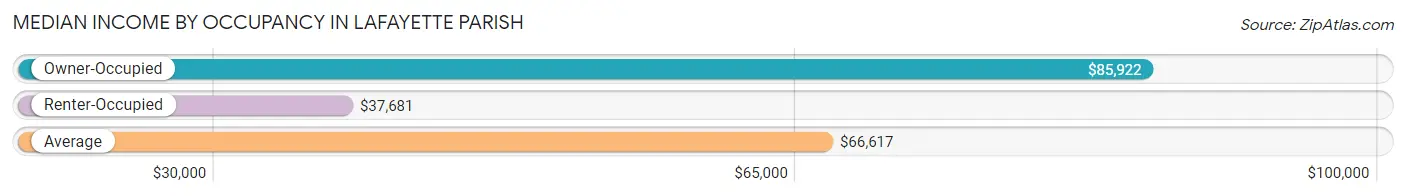
| Occupancy Type | # Households | Median Income |
| Owner-Occupied | 64,768 (66.3%) | $85,922 |
| Renter-Occupied | 32,926 (33.7%) | $37,681 |
| Average | 97,694 (100.0%) | $66,617 |
Occupancy by Householder Income Bracket in Lafayette Parish
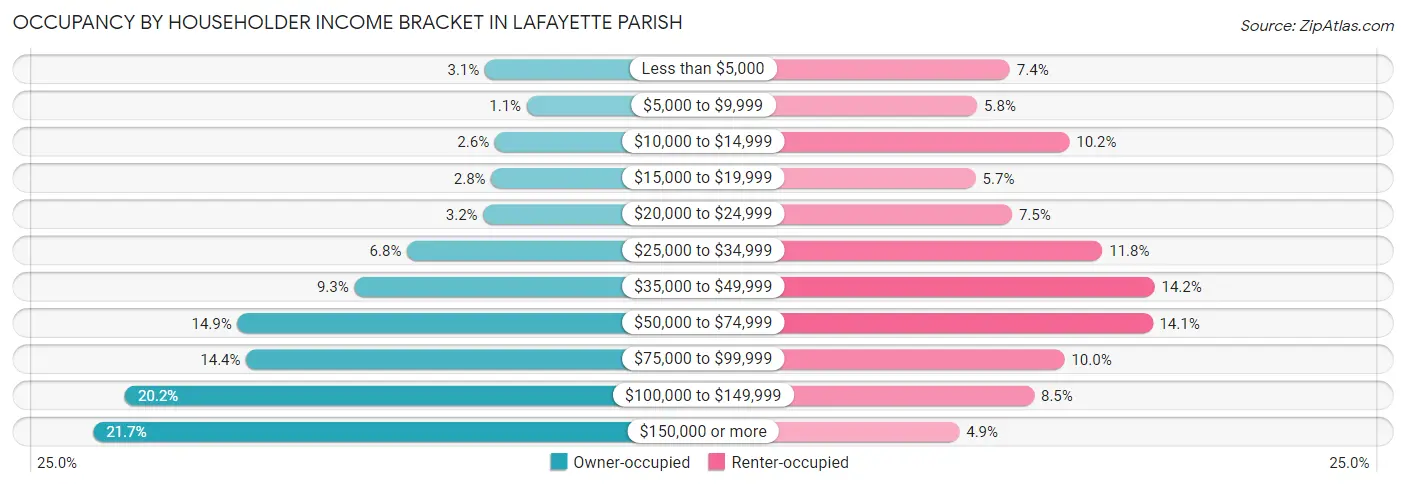
| Income Bracket | Owner-occupied | Renter-occupied |
| Less than $5,000 | 1,990 (3.1%) | 2,420 (7.3%) |
| $5,000 to $9,999 | 698 (1.1%) | 1,906 (5.8%) |
| $10,000 to $14,999 | 1,685 (2.6%) | 3,352 (10.2%) |
| $15,000 to $19,999 | 1,793 (2.8%) | 1,884 (5.7%) |
| $20,000 to $24,999 | 2,039 (3.2%) | 2,452 (7.4%) |
| $25,000 to $34,999 | 4,391 (6.8%) | 3,868 (11.7%) |
| $35,000 to $49,999 | 6,018 (9.3%) | 4,689 (14.2%) |
| $50,000 to $74,999 | 9,627 (14.9%) | 4,655 (14.1%) |
| $75,000 to $99,999 | 9,355 (14.4%) | 3,277 (10.0%) |
| $100,000 to $149,999 | 13,095 (20.2%) | 2,798 (8.5%) |
| $150,000 or more | 14,077 (21.7%) | 1,625 (4.9%) |
| Total | 64,768 (100.0%) | 32,926 (100.0%) |
Monthly Housing Cost Tiers in Lafayette Parish
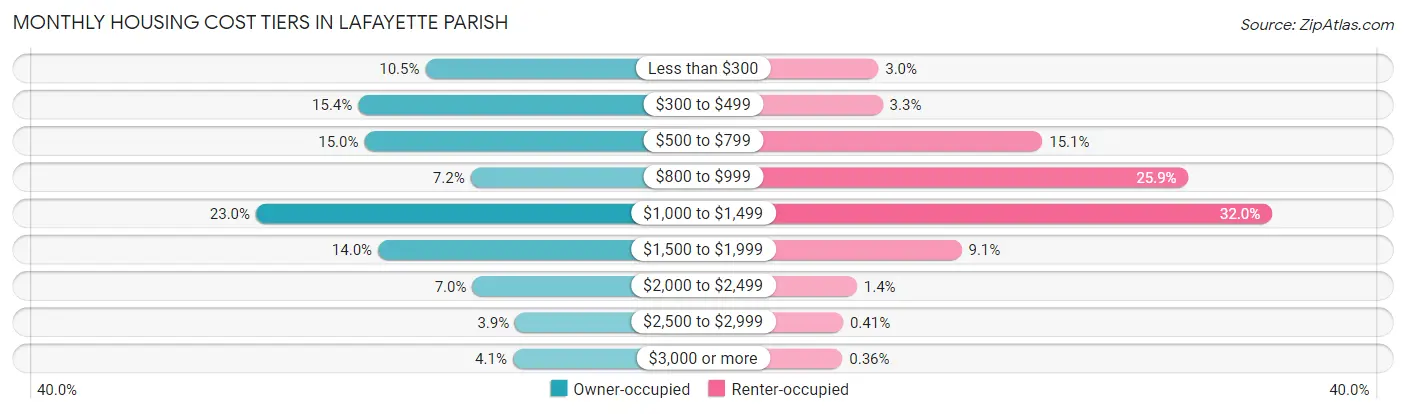
| Monthly Cost | Owner-occupied | Renter-occupied |
| Less than $300 | 6,795 (10.5%) | 991 (3.0%) |
| $300 to $499 | 10,003 (15.4%) | 1,097 (3.3%) |
| $500 to $799 | 9,704 (15.0%) | 4,969 (15.1%) |
| $800 to $999 | 4,637 (7.2%) | 8,511 (25.9%) |
| $1,000 to $1,499 | 14,880 (23.0%) | 10,539 (32.0%) |
| $1,500 to $1,999 | 9,057 (14.0%) | 3,009 (9.1%) |
| $2,000 to $2,499 | 4,552 (7.0%) | 471 (1.4%) |
| $2,500 to $2,999 | 2,516 (3.9%) | 134 (0.4%) |
| $3,000 or more | 2,624 (4.1%) | 117 (0.4%) |
| Total | 64,768 (100.0%) | 32,926 (100.0%) |
Physical Housing Characteristics in Lafayette Parish
Housing Structures in Lafayette Parish
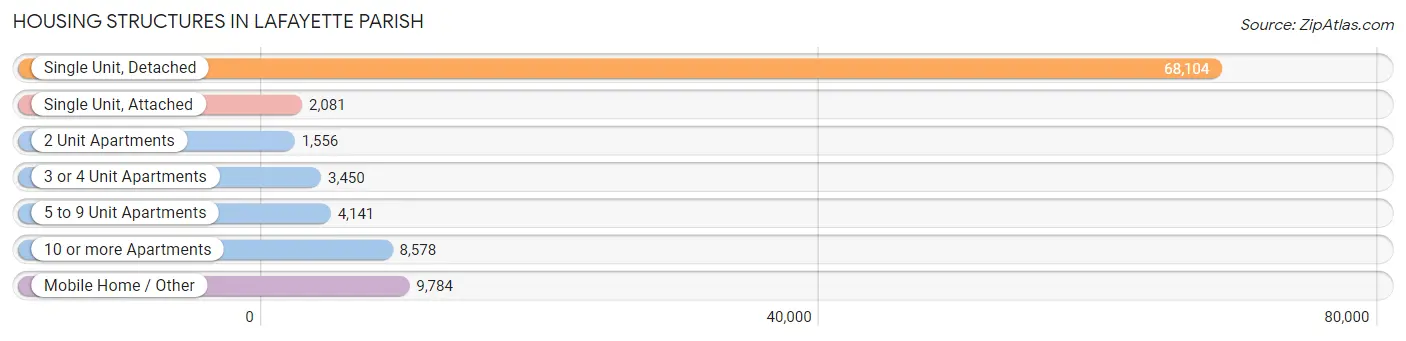
| Structure Type | # Housing Units | % Housing Units |
| Single Unit, Detached | 68,104 | 69.7% |
| Single Unit, Attached | 2,081 | 2.1% |
| 2 Unit Apartments | 1,556 | 1.6% |
| 3 or 4 Unit Apartments | 3,450 | 3.5% |
| 5 to 9 Unit Apartments | 4,141 | 4.2% |
| 10 or more Apartments | 8,578 | 8.8% |
| Mobile Home / Other | 9,784 | 10.0% |
| Total | 97,694 | 100.0% |
Housing Structures by Occupancy in Lafayette Parish
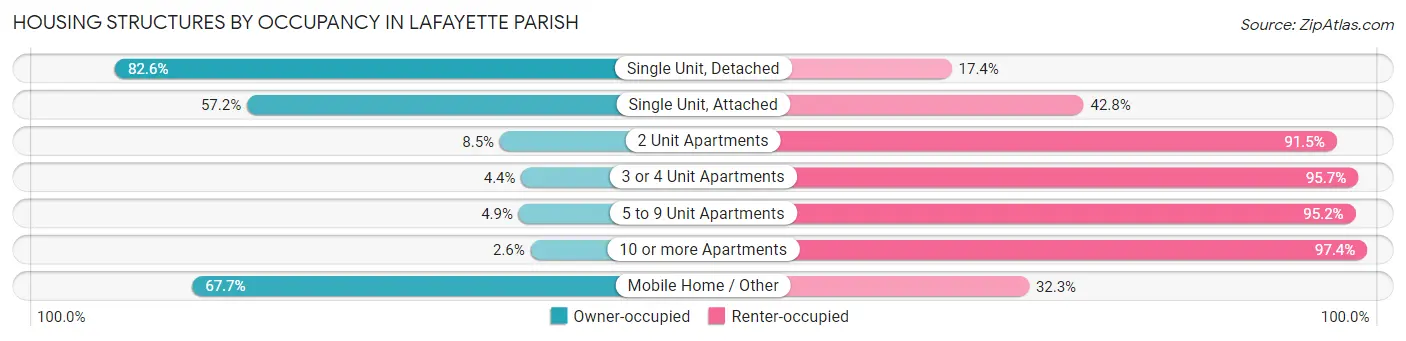
| Structure Type | Owner-occupied | Renter-occupied |
| Single Unit, Detached | 56,249 (82.6%) | 11,855 (17.4%) |
| Single Unit, Attached | 1,190 (57.2%) | 891 (42.8%) |
| 2 Unit Apartments | 132 (8.5%) | 1,424 (91.5%) |
| 3 or 4 Unit Apartments | 150 (4.3%) | 3,300 (95.7%) |
| 5 to 9 Unit Apartments | 201 (4.9%) | 3,940 (95.2%) |
| 10 or more Apartments | 222 (2.6%) | 8,356 (97.4%) |
| Mobile Home / Other | 6,624 (67.7%) | 3,160 (32.3%) |
| Total | 64,768 (66.3%) | 32,926 (33.7%) |
Housing Structures by Number of Rooms in Lafayette Parish
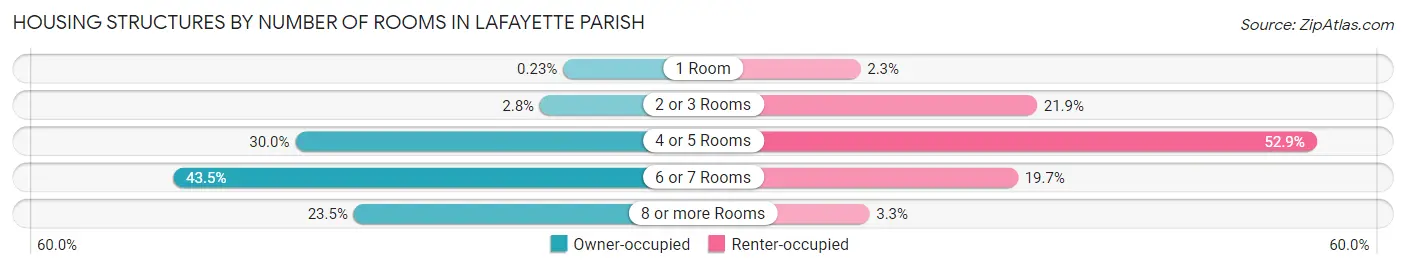
| Number of Rooms | Owner-occupied | Renter-occupied |
| 1 Room | 148 (0.2%) | 745 (2.3%) |
| 2 or 3 Rooms | 1,822 (2.8%) | 7,194 (21.8%) |
| 4 or 5 Rooms | 19,407 (30.0%) | 17,417 (52.9%) |
| 6 or 7 Rooms | 28,190 (43.5%) | 6,495 (19.7%) |
| 8 or more Rooms | 15,201 (23.5%) | 1,075 (3.3%) |
| Total | 64,768 (100.0%) | 32,926 (100.0%) |
Housing Structure by Heating Type in Lafayette Parish
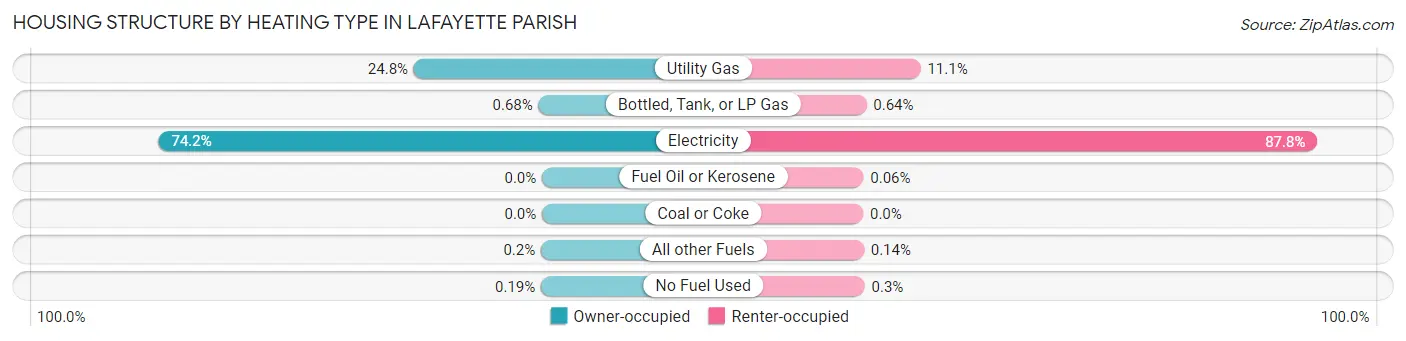
| Heating Type | Owner-occupied | Renter-occupied |
| Utility Gas | 16,043 (24.8%) | 3,655 (11.1%) |
| Bottled, Tank, or LP Gas | 438 (0.7%) | 210 (0.6%) |
| Electricity | 48,031 (74.2%) | 28,897 (87.8%) |
| Fuel Oil or Kerosene | 0 (0.0%) | 20 (0.1%) |
| Coal or Coke | 0 (0.0%) | 0 (0.0%) |
| All other Fuels | 132 (0.2%) | 46 (0.1%) |
| No Fuel Used | 124 (0.2%) | 98 (0.3%) |
| Total | 64,768 (100.0%) | 32,926 (100.0%) |
Household Vehicle Usage in Lafayette Parish
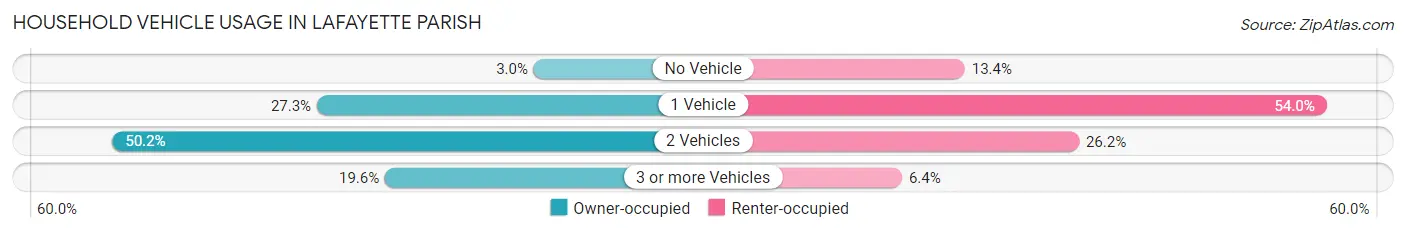
| Vehicles per Household | Owner-occupied | Renter-occupied |
| No Vehicle | 1,917 (3.0%) | 4,422 (13.4%) |
| 1 Vehicle | 17,649 (27.3%) | 17,767 (54.0%) |
| 2 Vehicles | 32,494 (50.2%) | 8,633 (26.2%) |
| 3 or more Vehicles | 12,708 (19.6%) | 2,104 (6.4%) |
| Total | 64,768 (100.0%) | 32,926 (100.0%) |
Real Estate & Mortgages in Lafayette Parish
Real Estate and Mortgage Overview in Lafayette Parish
| Characteristic | Without Mortgage | With Mortgage |
| Housing Units | 27,186 | 37,582 |
| Median Property Value | $187,400 | $236,900 |
| Median Household Income | $60,095 | $10,024 |
| Monthly Housing Costs | $432 | $2,552 |
| Real Estate Taxes | $992 | $2,928 |
Property Value by Mortgage Status in Lafayette Parish
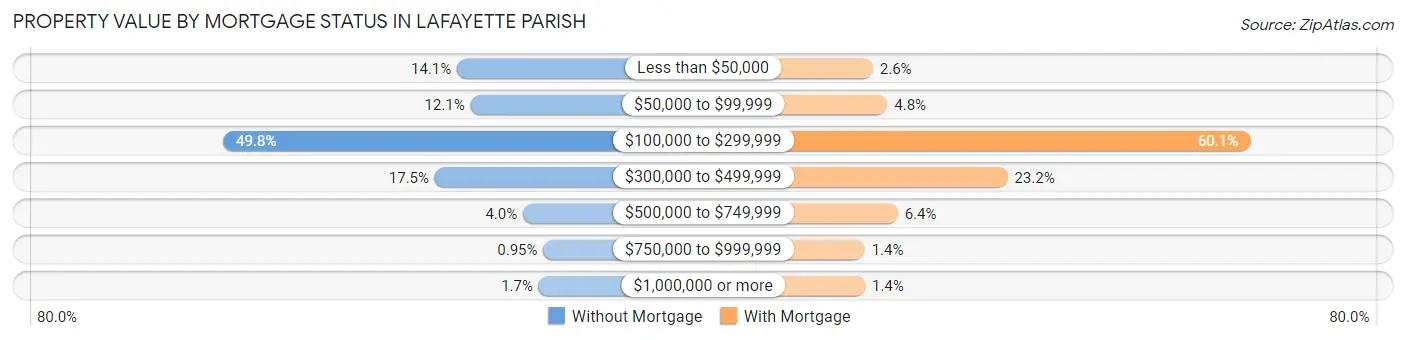
| Property Value | Without Mortgage | With Mortgage |
| Less than $50,000 | 3,831 (14.1%) | 993 (2.6%) |
| $50,000 to $99,999 | 3,275 (12.0%) | 1,820 (4.8%) |
| $100,000 to $299,999 | 13,526 (49.7%) | 22,588 (60.1%) |
| $300,000 to $499,999 | 4,751 (17.5%) | 8,701 (23.2%) |
| $500,000 to $749,999 | 1,098 (4.0%) | 2,412 (6.4%) |
| $750,000 to $999,999 | 257 (0.9%) | 525 (1.4%) |
| $1,000,000 or more | 448 (1.7%) | 543 (1.4%) |
| Total | 27,186 (100.0%) | 37,582 (100.0%) |
Household Income by Mortgage Status in Lafayette Parish
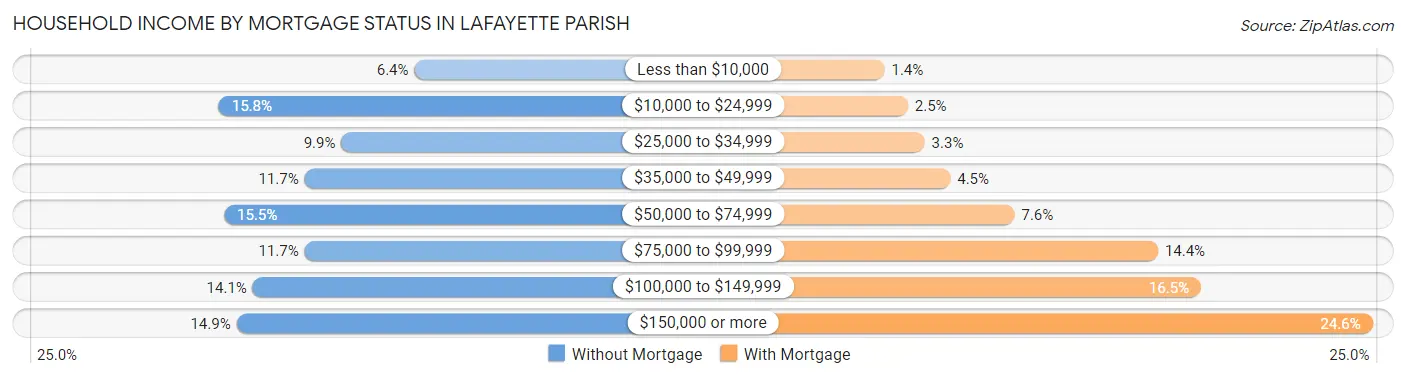
| Household Income | Without Mortgage | With Mortgage |
| Less than $10,000 | 1,751 (6.4%) | 517 (1.4%) |
| $10,000 to $24,999 | 4,282 (15.8%) | 937 (2.5%) |
| $25,000 to $34,999 | 2,697 (9.9%) | 1,235 (3.3%) |
| $35,000 to $49,999 | 3,173 (11.7%) | 1,694 (4.5%) |
| $50,000 to $74,999 | 4,214 (15.5%) | 2,845 (7.6%) |
| $75,000 to $99,999 | 3,172 (11.7%) | 5,413 (14.4%) |
| $100,000 to $149,999 | 3,844 (14.1%) | 6,183 (16.5%) |
| $150,000 or more | 4,053 (14.9%) | 9,251 (24.6%) |
| Total | 27,186 (100.0%) | 37,582 (100.0%) |
Property Value to Household Income Ratio in Lafayette Parish
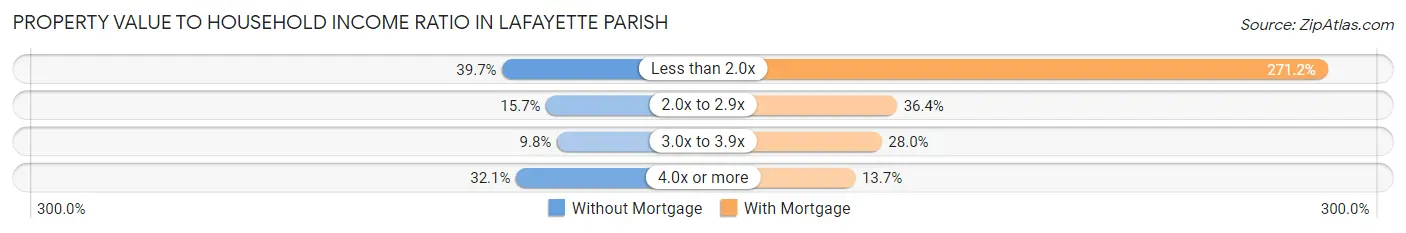
| Value-to-Income Ratio | Without Mortgage | With Mortgage |
| Less than 2.0x | 10,788 (39.7%) | 101,915 (271.2%) |
| 2.0x to 2.9x | 4,267 (15.7%) | 13,676 (36.4%) |
| 3.0x to 3.9x | 2,671 (9.8%) | 10,539 (28.0%) |
| 4.0x or more | 8,724 (32.1%) | 5,135 (13.7%) |
| Total | 27,186 (100.0%) | 37,582 (100.0%) |
Real Estate Taxes by Mortgage Status in Lafayette Parish
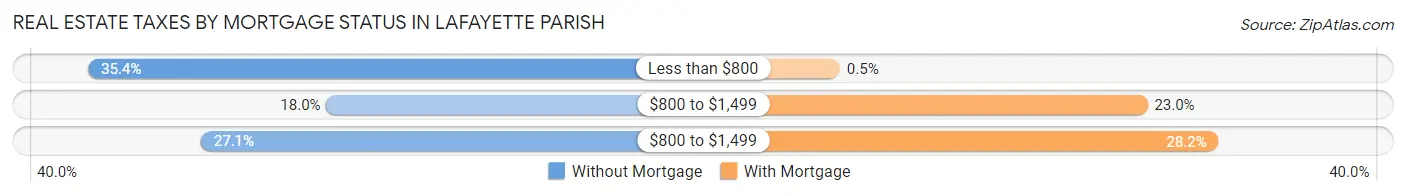
| Property Taxes | Without Mortgage | With Mortgage |
| Less than $800 | 9,613 (35.4%) | 187 (0.5%) |
| $800 to $1,499 | 4,881 (17.9%) | 8,633 (23.0%) |
| $800 to $1,499 | 7,374 (27.1%) | 10,583 (28.2%) |
| Total | 27,186 (100.0%) | 37,582 (100.0%) |
Health & Disability in Lafayette Parish
Health Insurance Coverage by Age in Lafayette Parish
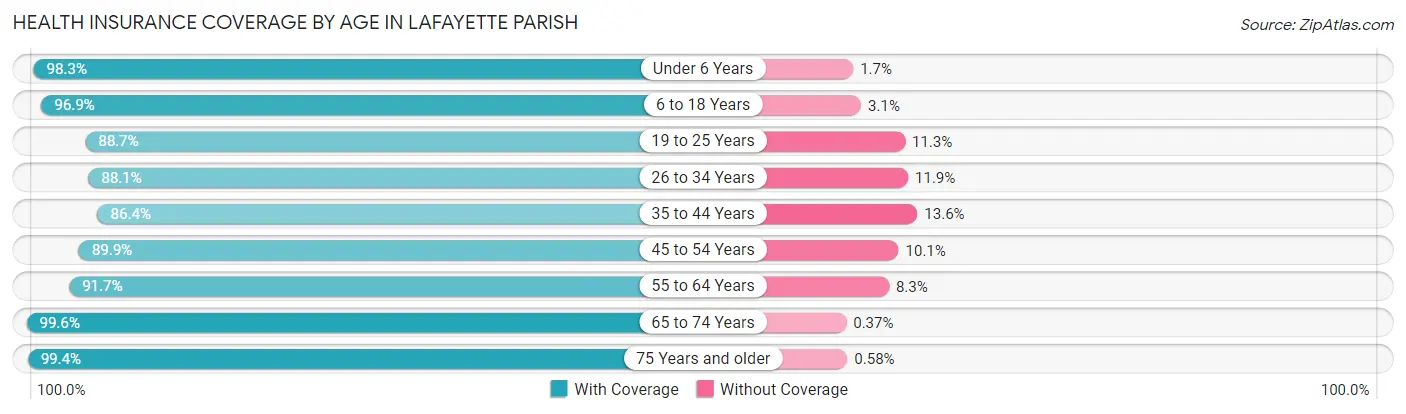
| Age Bracket | With Coverage | Without Coverage |
| Under 6 Years | 18,906 (98.3%) | 322 (1.7%) |
| 6 to 18 Years | 39,729 (96.9%) | 1,287 (3.1%) |
| 19 to 25 Years | 18,996 (88.7%) | 2,424 (11.3%) |
| 26 to 34 Years | 30,021 (88.1%) | 4,054 (11.9%) |
| 35 to 44 Years | 29,019 (86.4%) | 4,578 (13.6%) |
| 45 to 54 Years | 25,413 (89.9%) | 2,866 (10.1%) |
| 55 to 64 Years | 27,702 (91.7%) | 2,516 (8.3%) |
| 65 to 74 Years | 20,941 (99.6%) | 78 (0.4%) |
| 75 Years and older | 12,063 (99.4%) | 70 (0.6%) |
| Total | 222,790 (92.4%) | 18,195 (7.5%) |
Health Insurance Coverage by Citizenship Status in Lafayette Parish
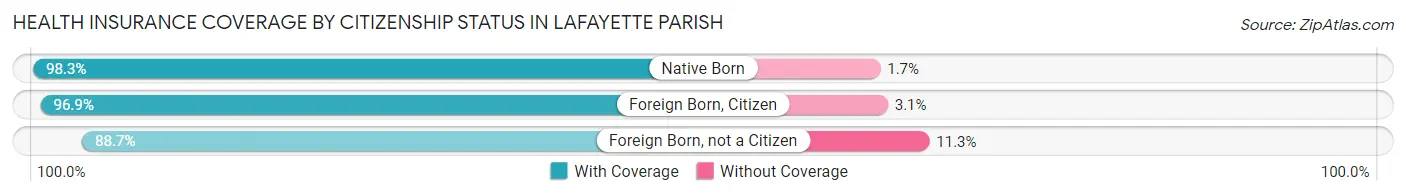
| Citizenship Status | With Coverage | Without Coverage |
| Native Born | 18,906 (98.3%) | 322 (1.7%) |
| Foreign Born, Citizen | 39,729 (96.9%) | 1,287 (3.1%) |
| Foreign Born, not a Citizen | 18,996 (88.7%) | 2,424 (11.3%) |
Health Insurance Coverage by Household Income in Lafayette Parish
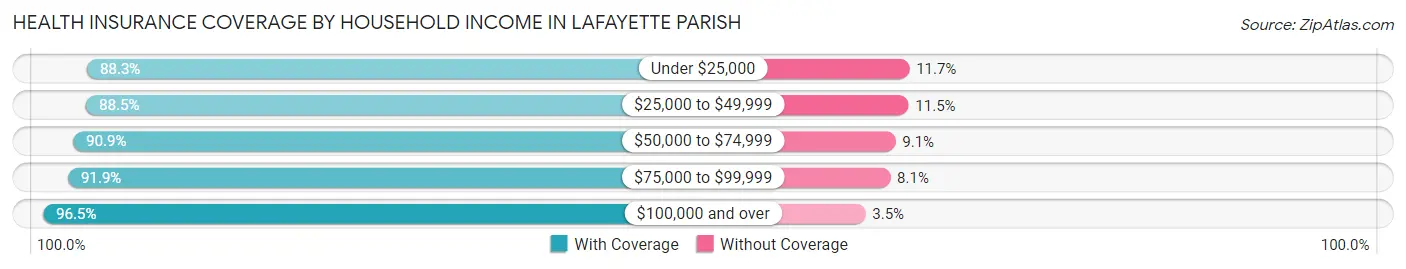
| Household Income | With Coverage | Without Coverage |
| Under $25,000 | 33,294 (88.3%) | 4,407 (11.7%) |
| $25,000 to $49,999 | 35,860 (88.5%) | 4,676 (11.5%) |
| $50,000 to $74,999 | 31,062 (90.9%) | 3,111 (9.1%) |
| $75,000 to $99,999 | 28,797 (91.9%) | 2,546 (8.1%) |
| $100,000 and over | 91,153 (96.5%) | 3,279 (3.5%) |
Public vs Private Health Insurance Coverage by Age in Lafayette Parish
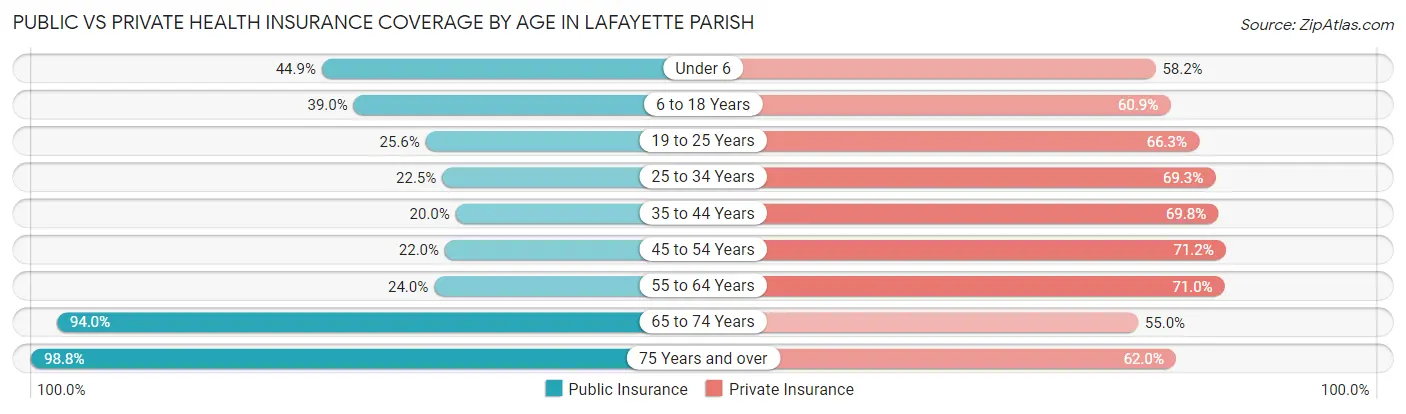
| Age Bracket | Public Insurance | Private Insurance |
| Under 6 | 8,623 (44.9%) | 11,195 (58.2%) |
| 6 to 18 Years | 15,977 (39.0%) | 24,989 (60.9%) |
| 19 to 25 Years | 5,477 (25.6%) | 14,193 (66.3%) |
| 25 to 34 Years | 7,667 (22.5%) | 23,605 (69.3%) |
| 35 to 44 Years | 6,721 (20.0%) | 23,458 (69.8%) |
| 45 to 54 Years | 6,219 (22.0%) | 20,141 (71.2%) |
| 55 to 64 Years | 7,252 (24.0%) | 21,462 (71.0%) |
| 65 to 74 Years | 19,760 (94.0%) | 11,553 (55.0%) |
| 75 Years and over | 11,988 (98.8%) | 7,520 (62.0%) |
| Total | 89,684 (37.2%) | 158,116 (65.6%) |
Disability Status by Sex by Age in Lafayette Parish
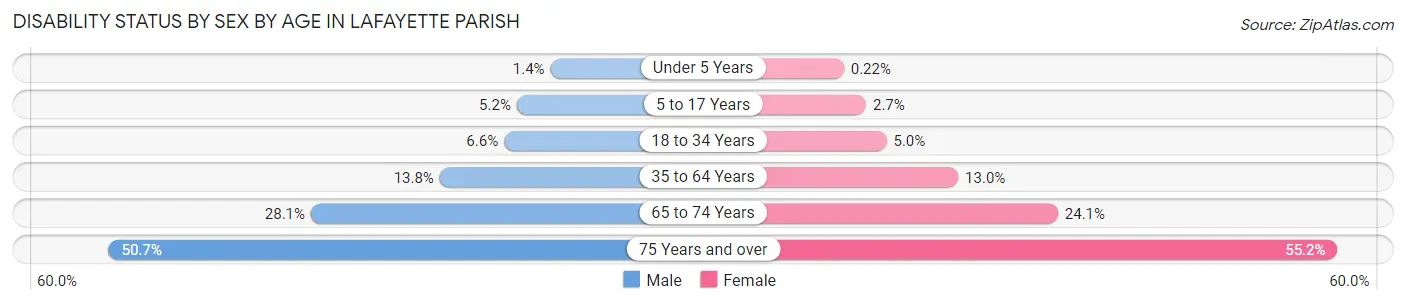
| Age Bracket | Male | Female |
| Under 5 Years | 117 (1.4%) | 17 (0.2%) |
| 5 to 17 Years | 1,101 (5.2%) | 560 (2.7%) |
| 18 to 34 Years | 1,901 (6.6%) | 1,451 (5.0%) |
| 35 to 64 Years | 6,166 (13.8%) | 6,134 (13.0%) |
| 65 to 74 Years | 2,773 (28.1%) | 2,684 (24.1%) |
| 75 Years and over | 2,451 (50.6%) | 4,025 (55.2%) |
Disability Class by Sex by Age in Lafayette Parish
Disability Class: Hearing Difficulty
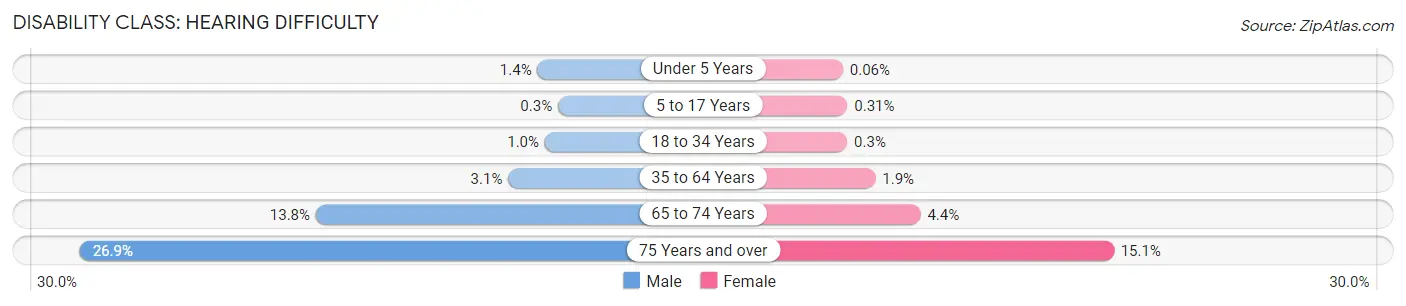
| Age Bracket | Male | Female |
| Under 5 Years | 117 (1.4%) | 5 (0.1%) |
| 5 to 17 Years | 64 (0.3%) | 65 (0.3%) |
| 18 to 34 Years | 295 (1.0%) | 87 (0.3%) |
| 35 to 64 Years | 1,375 (3.1%) | 884 (1.9%) |
| 65 to 74 Years | 1,359 (13.8%) | 489 (4.4%) |
| 75 Years and over | 1,303 (26.9%) | 1,104 (15.1%) |
Disability Class: Vision Difficulty
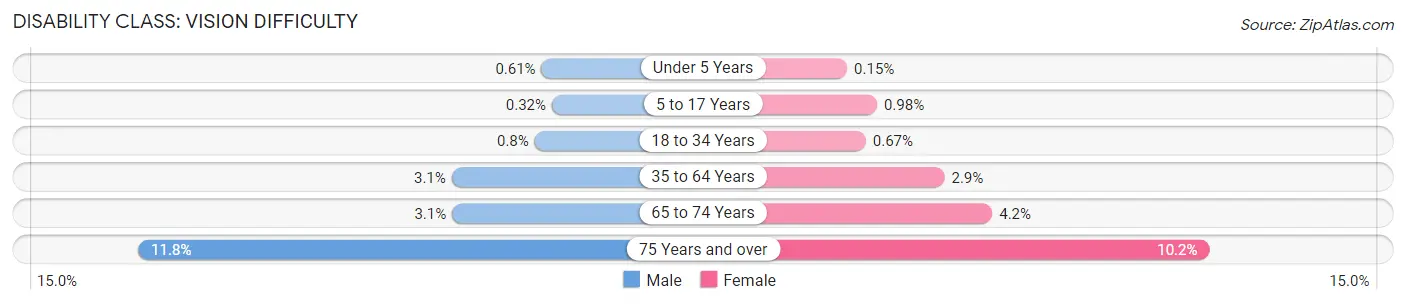
| Age Bracket | Male | Female |
| Under 5 Years | 50 (0.6%) | 12 (0.2%) |
| 5 to 17 Years | 68 (0.3%) | 204 (1.0%) |
| 18 to 34 Years | 229 (0.8%) | 196 (0.7%) |
| 35 to 64 Years | 1,394 (3.1%) | 1,351 (2.9%) |
| 65 to 74 Years | 306 (3.1%) | 467 (4.2%) |
| 75 Years and over | 573 (11.8%) | 746 (10.2%) |
Disability Class: Cognitive Difficulty
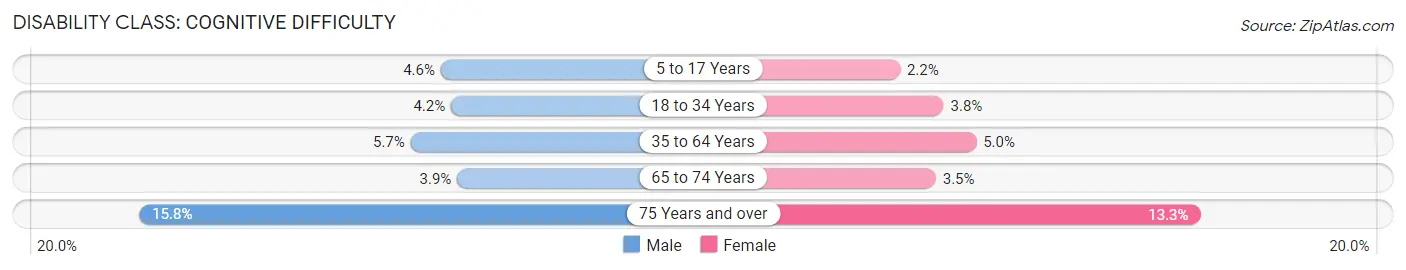
| Age Bracket | Male | Female |
| 5 to 17 Years | 966 (4.5%) | 448 (2.2%) |
| 18 to 34 Years | 1,198 (4.2%) | 1,102 (3.8%) |
| 35 to 64 Years | 2,537 (5.7%) | 2,360 (5.0%) |
| 65 to 74 Years | 389 (3.9%) | 389 (3.5%) |
| 75 Years and over | 762 (15.8%) | 971 (13.3%) |
Disability Class: Ambulatory Difficulty
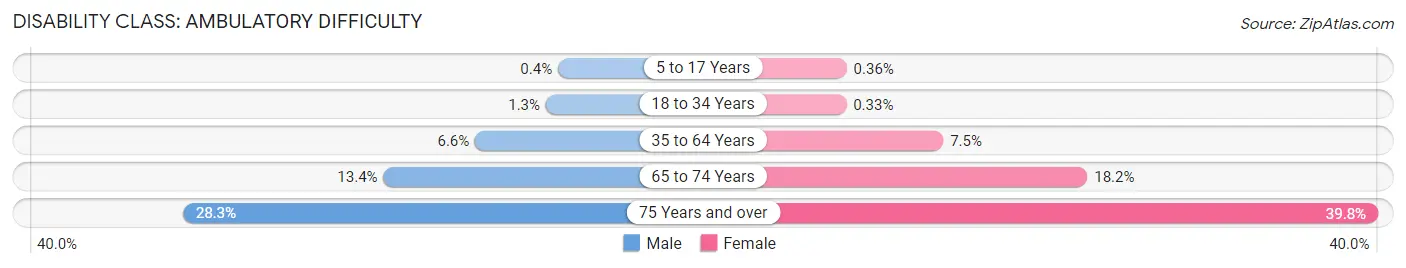
| Age Bracket | Male | Female |
| 5 to 17 Years | 85 (0.4%) | 75 (0.4%) |
| 18 to 34 Years | 375 (1.3%) | 97 (0.3%) |
| 35 to 64 Years | 2,935 (6.6%) | 3,561 (7.5%) |
| 65 to 74 Years | 1,318 (13.4%) | 2,034 (18.2%) |
| 75 Years and over | 1,367 (28.2%) | 2,903 (39.8%) |
Disability Class: Self-Care Difficulty
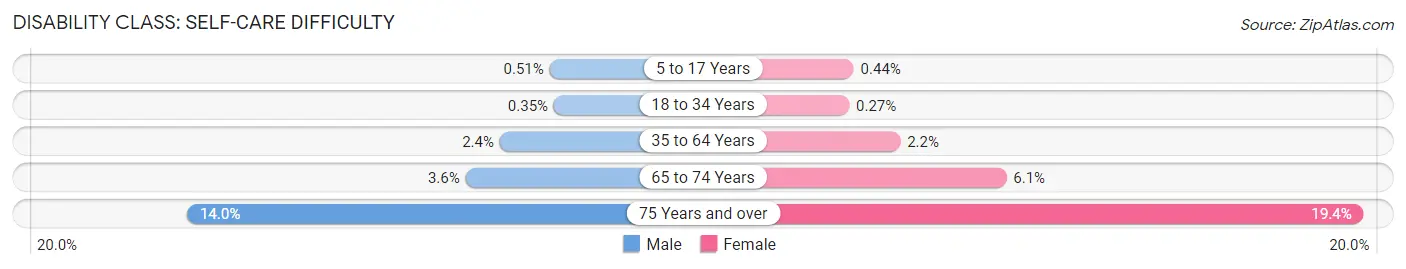
| Age Bracket | Male | Female |
| 5 to 17 Years | 108 (0.5%) | 91 (0.4%) |
| 18 to 34 Years | 102 (0.4%) | 80 (0.3%) |
| 35 to 64 Years | 1,056 (2.4%) | 1,028 (2.2%) |
| 65 to 74 Years | 358 (3.6%) | 682 (6.1%) |
| 75 Years and over | 676 (14.0%) | 1,413 (19.4%) |
Technology Access in Lafayette Parish
Computing Device Access in Lafayette Parish
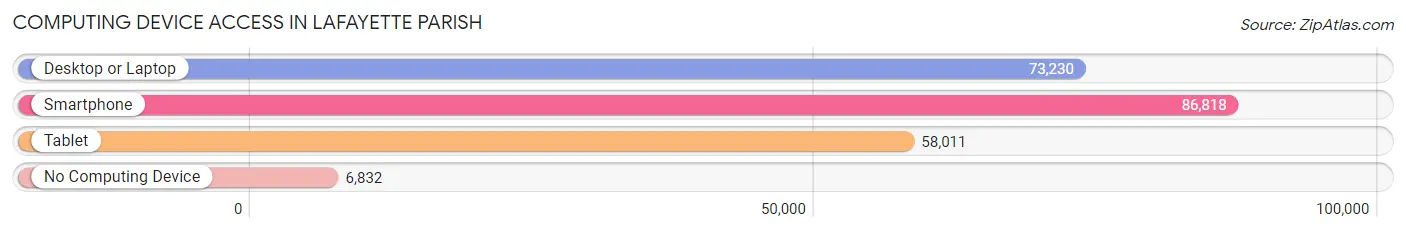
| Device Type | # Households | % Households |
| Desktop or Laptop | 73,230 | 75.0% |
| Smartphone | 86,818 | 88.9% |
| Tablet | 58,011 | 59.4% |
| No Computing Device | 6,832 | 7.0% |
| Total | 97,694 | 100.0% |
Internet Access in Lafayette Parish
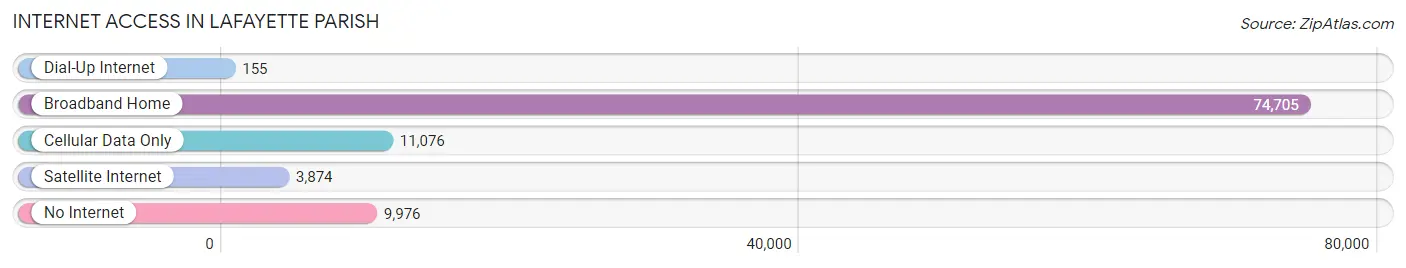
| Internet Type | # Households | % Households |
| Dial-Up Internet | 155 | 0.2% |
| Broadband Home | 74,705 | 76.5% |
| Cellular Data Only | 11,076 | 11.3% |
| Satellite Internet | 3,874 | 4.0% |
| No Internet | 9,976 | 10.2% |
| Total | 97,694 | 100.0% |
Lafayette Parish Summary
Lafayette Parish is located in the south-central region of Louisiana, and is part of the Acadiana region. It is bordered by St. Martin Parish to the east, Vermilion Parish to the south, Iberia Parish to the west, and St. Landry Parish to the north. The parish seat is the city of Lafayette, which is also the fourth-largest city in the state. The parish has a total area of 658 square miles, and a population of 248,157 as of the 2010 census.
History
Lafayette Parish was established in 1823, and was named after the Marquis de Lafayette, a French military hero who fought in the American Revolutionary War. The parish was originally part of St. Martin Parish, but was split off in 1823 due to the growing population in the area. The parish was originally home to the Attakapas Native American tribe, who were later displaced by French settlers in the 1700s. The area was also home to many Acadian settlers, who were French-speaking immigrants from Canada.
Geography
Lafayette Parish is located in the south-central region of Louisiana, and is part of the Acadiana region. It is bordered by St. Martin Parish to the east, Vermilion Parish to the south, Iberia Parish to the west, and St. Landry Parish to the north. The parish has a total area of 658 square miles, and is mostly flat, with some rolling hills in the northern part of the parish. The parish is drained by the Vermilion River, which flows through the center of the parish.
Economy
Lafayette Parish has a diverse economy, with a mix of industries including oil and gas, manufacturing, healthcare, education, and tourism. The oil and gas industry is the largest employer in the parish, with major companies such as Chevron, ExxonMobil, and Halliburton having a presence in the area. The manufacturing sector is also a major employer, with companies such as IBM, Caterpillar, and General Electric having a presence in the parish. The healthcare sector is also a major employer, with the University Medical Center of Lafayette being the largest employer in the parish. The education sector is also a major employer, with the University of Louisiana at Lafayette being the largest employer in the parish. Tourism is also a major industry in the parish, with attractions such as the Acadian Village, the Lafayette Natural History Museum, and the Vermilionville Historic Village.
Demographics
As of the 2010 census, Lafayette Parish had a population of 248,157. The racial makeup of the parish was 68.3% White, 28.2% African American, 0.5% Native American, 1.3% Asian, 0.1% Pacific Islander, 0.7% from other races, and 1.9% from two or more races. Hispanic or Latino of any race were 3.2% of the population. The median income for a household in the parish was $45,844, and the median income for a family was $54,844. The per capita income for the parish was $25,844.
Conclusion
Lafayette Parish is a diverse and vibrant parish located in the south-central region of Louisiana. It has a rich history, and is home to a variety of industries, including oil and gas, manufacturing, healthcare, education, and tourism. The parish has a population of 248,157, and a median household income of $45,844. The parish is a great place to live, work, and visit, and is sure to continue to grow and thrive in the years to come.
Common Questions
What is the Total Population of Lafayette Parish?
Total Population of Lafayette Parish is 243,175.
What is the Total Male Population of Lafayette Parish?
Total Male Population of Lafayette Parish is 119,067.
What is the Total Female Population of Lafayette Parish?
Total Female Population of Lafayette Parish is 124,108.
What is the Ratio of Males per 100 Females in Lafayette Parish?
There are 95.94 Males per 100 Females in Lafayette Parish.
What is the Ratio of Females per 100 Males in Lafayette Parish?
There are 104.23 Females per 100 Males in Lafayette Parish.
What is the Median Population Age in Lafayette Parish?
Median Population Age in Lafayette Parish is 36.2 Years.
What is the Average Family Size in Lafayette Parish
Average Family Size in Lafayette Parish is 3.1 People.
What is the Average Household Size in Lafayette Parish
Average Household Size in Lafayette Parish is 2.4 People.
What is Per Capita Income in Lafayette Parish?
Per Capita income in Lafayette Parish is $38,161.
What is the Median Family Income in Lafayette Parish?
Median Family Income in Lafayette Parish is $86,315.
What is the Median Household income in Lafayette Parish?
Median Household Income in Lafayette Parish is $66,617.
What is Income or Wage Gap in Lafayette Parish?
Income or Wage Gap in Lafayette Parish is 39.6%.
Women in Lafayette Parish earn 60.4 cents for every dollar earned by a man.
What is Family Income Deficit in Lafayette Parish?
Family Income Deficit in Lafayette Parish is $11,485.
Families that are below poverty line in Lafayette Parish earn $11,485 less on average than the poverty threshold level.
What is Inequality or Gini Index in Lafayette Parish?
Inequality or Gini Index in Lafayette Parish is 0.50.
How Large is the Labor Force in Lafayette Parish?
There are 124,497 People in the Labor Forcein in Lafayette Parish.
What is the Percentage of People in the Labor Force in Lafayette Parish?
65.2% of People are in the Labor Force in Lafayette Parish.
What is the Unemployment Rate in Lafayette Parish?
Unemployment Rate in Lafayette Parish is 5.2%.