Jefferson Parish, LA
Jefferson Parish Map
Jefferson Parish Overview
436,171
TOTAL POPULATION
212,244
MALE POPULATION
223,927
FEMALE POPULATION
94.78
MALES / 100 FEMALES
105.50
FEMALES / 100 MALES
39.8
MEDIAN AGE
3.1
AVG FAMILY SIZE
2.5
AVG HOUSEHOLD SIZE
$35,720
PER CAPITA INCOME
$79,749
AVG FAMILY INCOME
$63,257
AVG HOUSEHOLD INCOME
24.4%
WAGE / INCOME GAP [ % ]
75.6¢/ $1
WAGE / INCOME GAP [ $ ]
$10,163
FAMILY INCOME DEFICIT
0.48
INEQUALITY / GINI INDEX
222,617
LABOR FORCE [ PEOPLE ]
63.5%
PERCENT IN LABOR FORCE
6.0%
UNEMPLOYMENT RATE
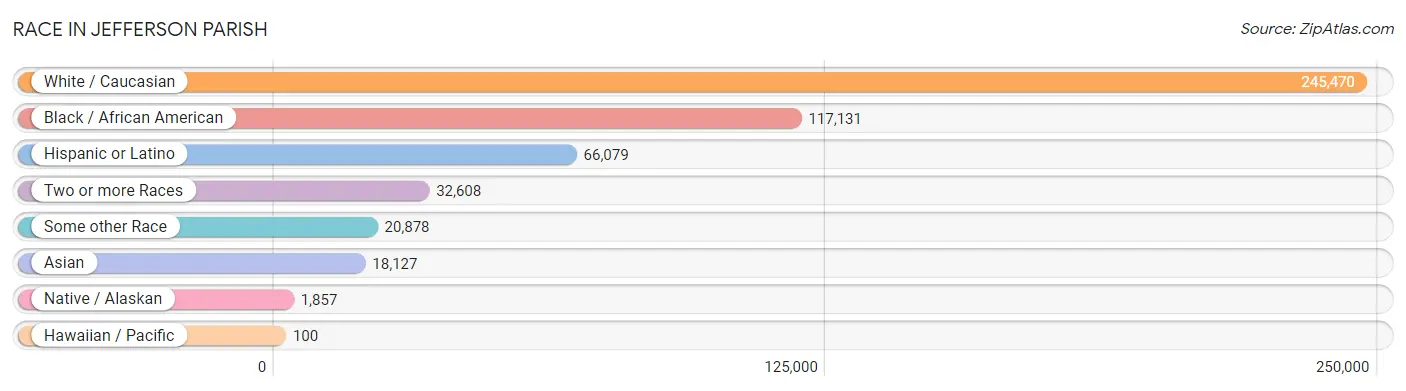
Race in Jefferson Parish
The most populous races in Jefferson Parish are White / Caucasian (245,470 | 56.3%), Black / African American (117,131 | 26.9%), and Hispanic or Latino (66,079 | 15.1%).
| Race | # Population | % Population |
| Asian | 18,127 | 4.2% |
| Black / African American | 117,131 | 26.9% |
| Hawaiian / Pacific | 100 | 0.0% |
| Hispanic or Latino | 66,079 | 15.1% |
| Native / Alaskan | 1,857 | 0.4% |
| White / Caucasian | 245,470 | 56.3% |
| Two or more Races | 32,608 | 7.5% |
| Some other Race | 20,878 | 4.8% |
| Total | 436,171 | 100.0% |
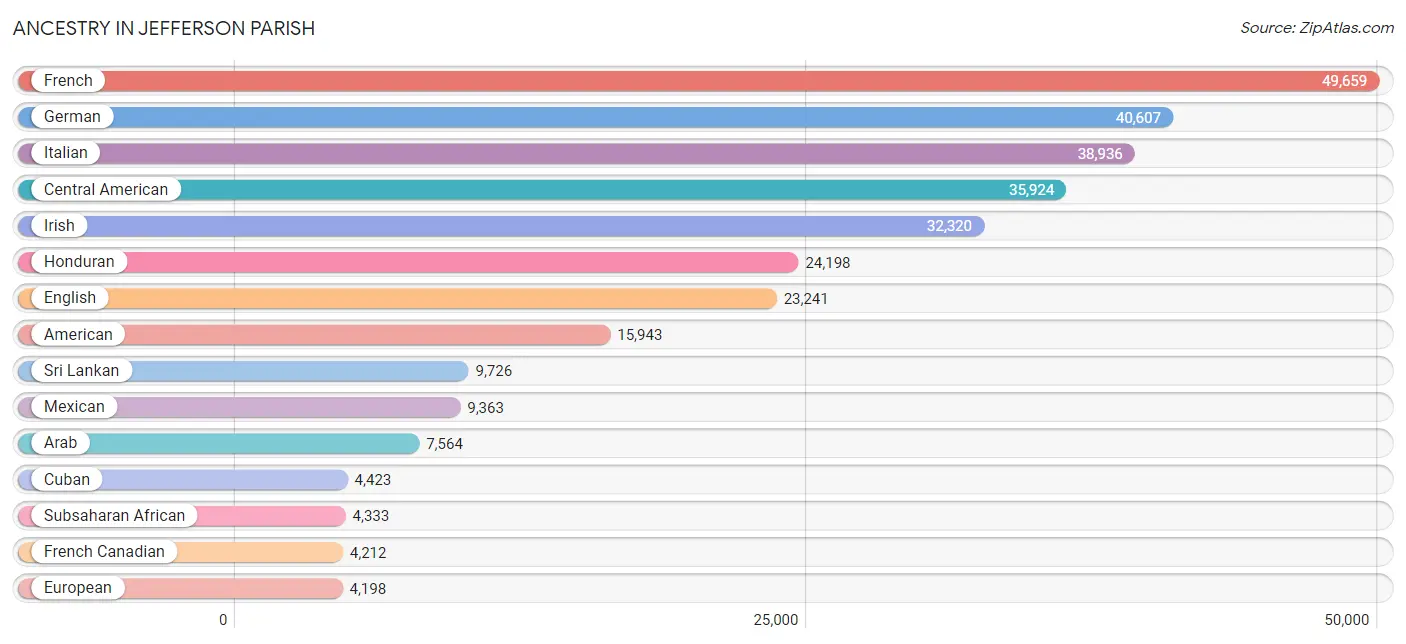
Ancestry in Jefferson Parish
The most populous ancestries reported in Jefferson Parish are French (49,659 | 11.4%), German (40,607 | 9.3%), Italian (38,936 | 8.9%), Central American (35,924 | 8.2%), and Irish (32,320 | 7.4%), together accounting for 45.3% of all Jefferson Parish residents.
| Ancestry | # Population | % Population |
| African | 3,120 | 0.7% |
| Alaska Native | 19 | 0.0% |
| Albanian | 16 | 0.0% |
| Aleut | 23 | 0.0% |
| Alsatian | 22 | 0.0% |
| American | 15,943 | 3.7% |
| Apache | 86 | 0.0% |
| Arab | 7,564 | 1.7% |
| Argentinean | 51 | 0.0% |
| Armenian | 26 | 0.0% |
| Australian | 25 | 0.0% |
| Austrian | 354 | 0.1% |
| Bahamian | 102 | 0.0% |
| Barbadian | 45 | 0.0% |
| Basque | 73 | 0.0% |
| Belgian | 337 | 0.1% |
| Belizean | 566 | 0.1% |
| Bhutanese | 872 | 0.2% |
| Blackfeet | 67 | 0.0% |
| Bolivian | 245 | 0.1% |
| Brazilian | 610 | 0.1% |
| British | 1,571 | 0.4% |
| British West Indian | 111 | 0.0% |
| Bulgarian | 105 | 0.0% |
| Burmese | 489 | 0.1% |
| Cajun | 2,408 | 0.5% |
| Cambodian | 8 | 0.0% |
| Canadian | 192 | 0.0% |
| Cape Verdean | 25 | 0.0% |
| Celtic | 24 | 0.0% |
| Central American | 35,924 | 8.2% |
| Central American Indian | 1,058 | 0.2% |
| Cherokee | 639 | 0.2% |
| Chickasaw | 52 | 0.0% |
| Chilean | 9 | 0.0% |
| Choctaw | 128 | 0.0% |
| Colombian | 562 | 0.1% |
| Comanche | 3 | 0.0% |
| Costa Rican | 343 | 0.1% |
| Cree | 31 | 0.0% |
| Creek | 12 | 0.0% |
| Croatian | 599 | 0.1% |
| Cuban | 4,423 | 1.0% |
| Czech | 451 | 0.1% |
| Czechoslovakian | 150 | 0.0% |
| Danish | 304 | 0.1% |
| Delaware | 85 | 0.0% |
| Dominican | 4,008 | 0.9% |
| Dutch | 1,419 | 0.3% |
| Eastern European | 437 | 0.1% |
| Ecuadorian | 453 | 0.1% |
| Egyptian | 1,214 | 0.3% |
| English | 23,241 | 5.3% |
| Ethiopian | 314 | 0.1% |
| European | 4,198 | 1.0% |
| Fijian | 51 | 0.0% |
| Filipino | 162 | 0.0% |
| Finnish | 22 | 0.0% |
| French | 49,659 | 11.4% |
| French American Indian | 243 | 0.1% |
| French Canadian | 4,212 | 1.0% |
| German | 40,607 | 9.3% |
| Greek | 1,087 | 0.3% |
| Guatemalan | 3,461 | 0.8% |
| Guyanese | 11 | 0.0% |
| Haitian | 1,700 | 0.4% |
| Honduran | 24,198 | 5.6% |
| Hopi | 11 | 0.0% |
| Houma | 622 | 0.1% |
| Hungarian | 323 | 0.1% |
| Indian (Asian) | 3,829 | 0.9% |
| Indonesian | 173 | 0.0% |
| Inupiat | 14 | 0.0% |
| Iranian | 280 | 0.1% |
| Iraqi | 107 | 0.0% |
| Irish | 32,320 | 7.4% |
| Iroquois | 65 | 0.0% |
| Israeli | 223 | 0.1% |
| Italian | 38,936 | 8.9% |
| Jamaican | 262 | 0.1% |
| Japanese | 182 | 0.0% |
| Jordanian | 1,113 | 0.3% |
| Kenyan | 17 | 0.0% |
| Korean | 3,029 | 0.7% |
| Laotian | 233 | 0.1% |
| Lebanese | 910 | 0.2% |
| Lithuanian | 381 | 0.1% |
| Malaysian | 95 | 0.0% |
| Mexican | 9,363 | 2.1% |
| Mexican American Indian | 709 | 0.2% |
| Mongolian | 11 | 0.0% |
| Moroccan | 50 | 0.0% |
| Native Hawaiian | 125 | 0.0% |
| Navajo | 121 | 0.0% |
| New Zealander | 6 | 0.0% |
| Nicaraguan | 4,062 | 0.9% |
| Nigerian | 544 | 0.1% |
| Northern European | 199 | 0.1% |
| Norwegian | 976 | 0.2% |
| Osage | 9 | 0.0% |
| Pakistani | 289 | 0.1% |
| Palestinian | 1,714 | 0.4% |
| Panamanian | 151 | 0.0% |
| Paraguayan | 48 | 0.0% |
| Pennsylvania German | 20 | 0.0% |
| Peruvian | 483 | 0.1% |
| Polish | 1,845 | 0.4% |
| Portuguese | 348 | 0.1% |
| Potawatomi | 18 | 0.0% |
| Puerto Rican | 2,825 | 0.6% |
| Romanian | 465 | 0.1% |
| Russian | 1,283 | 0.3% |
| Salvadoran | 2,295 | 0.5% |
| Samoan | 20 | 0.0% |
| Scandinavian | 605 | 0.1% |
| Scotch-Irish | 1,686 | 0.4% |
| Scottish | 3,261 | 0.7% |
| Senegalese | 58 | 0.0% |
| Serbian | 29 | 0.0% |
| Sioux | 59 | 0.0% |
| Slavic | 56 | 0.0% |
| Slovak | 120 | 0.0% |
| Slovene | 281 | 0.1% |
| Somali | 68 | 0.0% |
| South African | 16 | 0.0% |
| South American | 2,174 | 0.5% |
| South American Indian | 60 | 0.0% |
| Spaniard | 1,303 | 0.3% |
| Spanish | 2,416 | 0.5% |
| Spanish American | 39 | 0.0% |
| Spanish American Indian | 64 | 0.0% |
| Sri Lankan | 9,726 | 2.2% |
| Subsaharan African | 4,333 | 1.0% |
| Sudanese | 31 | 0.0% |
| Swedish | 942 | 0.2% |
| Swiss | 222 | 0.1% |
| Syrian | 159 | 0.0% |
| Thai | 1,547 | 0.4% |
| Trinidadian and Tobagonian | 127 | 0.0% |
| Turkish | 163 | 0.0% |
| Ukrainian | 222 | 0.1% |
| Uruguayan | 9 | 0.0% |
| Venezuelan | 263 | 0.1% |
| Vietnamese | 113 | 0.0% |
| Welsh | 774 | 0.2% |
| West Indian | 255 | 0.1% |
| Yugoslavian | 167 | 0.0% | View All 147 Rows |
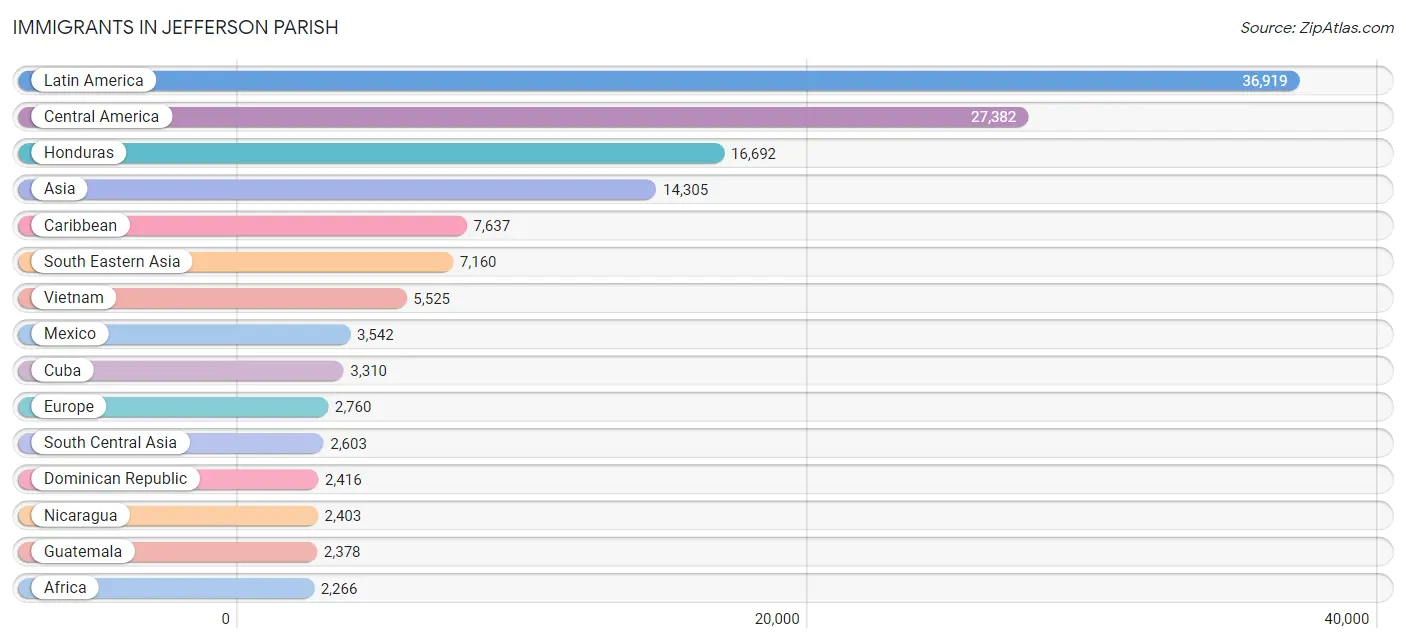
Immigrants in Jefferson Parish
The most numerous immigrant groups reported in Jefferson Parish came from Latin America (36,919 | 8.5%), Central America (27,382 | 6.3%), Honduras (16,692 | 3.8%), Asia (14,305 | 3.3%), and Caribbean (7,637 | 1.8%), together accounting for 23.6% of all Jefferson Parish residents.
| Immigration Origin | # Population | % Population |
| Africa | 2,266 | 0.5% |
| Albania | 17 | 0.0% |
| Argentina | 5 | 0.0% |
| Asia | 14,305 | 3.3% |
| Australia | 2 | 0.0% |
| Austria | 9 | 0.0% |
| Bahamas | 28 | 0.0% |
| Bangladesh | 86 | 0.0% |
| Belarus | 9 | 0.0% |
| Belgium | 25 | 0.0% |
| Belize | 373 | 0.1% |
| Bolivia | 64 | 0.0% |
| Bosnia and Herzegovina | 155 | 0.0% |
| Brazil | 790 | 0.2% |
| Bulgaria | 119 | 0.0% |
| Cambodia | 35 | 0.0% |
| Canada | 282 | 0.1% |
| Caribbean | 7,637 | 1.8% |
| Central America | 27,382 | 6.3% |
| Chile | 5 | 0.0% |
| China | 1,746 | 0.4% |
| Colombia | 295 | 0.1% |
| Congo | 19 | 0.0% |
| Costa Rica | 184 | 0.0% |
| Croatia | 25 | 0.0% |
| Cuba | 3,310 | 0.8% |
| Dominica | 91 | 0.0% |
| Dominican Republic | 2,416 | 0.5% |
| Eastern Africa | 325 | 0.1% |
| Eastern Asia | 2,168 | 0.5% |
| Eastern Europe | 1,100 | 0.3% |
| Ecuador | 262 | 0.1% |
| Egypt | 914 | 0.2% |
| El Salvador | 1,117 | 0.3% |
| England | 157 | 0.0% |
| Ethiopia | 240 | 0.1% |
| Europe | 2,760 | 0.6% |
| France | 268 | 0.1% |
| Germany | 180 | 0.0% |
| Greece | 154 | 0.0% |
| Guatemala | 2,378 | 0.5% |
| Guyana | 14 | 0.0% |
| Haiti | 1,387 | 0.3% |
| Honduras | 16,692 | 3.8% |
| Hong Kong | 55 | 0.0% |
| Hungary | 28 | 0.0% |
| India | 759 | 0.2% |
| Indonesia | 122 | 0.0% |
| Iran | 260 | 0.1% |
| Iraq | 154 | 0.0% |
| Ireland | 33 | 0.0% |
| Israel | 221 | 0.1% |
| Italy | 210 | 0.1% |
| Jamaica | 153 | 0.0% |
| Japan | 172 | 0.0% |
| Jordan | 687 | 0.2% |
| Kazakhstan | 9 | 0.0% |
| Kenya | 17 | 0.0% |
| Korea | 250 | 0.1% |
| Kuwait | 285 | 0.1% |
| Laos | 74 | 0.0% |
| Latin America | 36,919 | 8.5% |
| Latvia | 17 | 0.0% |
| Lebanon | 228 | 0.1% |
| Lithuania | 11 | 0.0% |
| Malaysia | 27 | 0.0% |
| Mexico | 3,542 | 0.8% |
| Middle Africa | 19 | 0.0% |
| Moldova | 267 | 0.1% |
| Morocco | 76 | 0.0% |
| Nepal | 262 | 0.1% |
| Netherlands | 171 | 0.0% |
| Nicaragua | 2,403 | 0.5% |
| Nigeria | 227 | 0.1% |
| Northern Africa | 1,361 | 0.3% |
| Northern Europe | 528 | 0.1% |
| Norway | 28 | 0.0% |
| Oceania | 13 | 0.0% |
| Pakistan | 1,142 | 0.3% |
| Panama | 101 | 0.0% |
| Peru | 289 | 0.1% |
| Philippines | 999 | 0.2% |
| Poland | 42 | 0.0% |
| Romania | 25 | 0.0% |
| Russia | 299 | 0.1% |
| Saudi Arabia | 31 | 0.0% |
| Scotland | 8 | 0.0% |
| Senegal | 31 | 0.0% |
| Singapore | 12 | 0.0% |
| Somalia | 9 | 0.0% |
| South Africa | 5 | 0.0% |
| South America | 1,900 | 0.4% |
| South Central Asia | 2,603 | 0.6% |
| South Eastern Asia | 7,160 | 1.6% |
| Southern Europe | 469 | 0.1% |
| Spain | 105 | 0.0% |
| Sri Lanka | 50 | 0.0% |
| Switzerland | 10 | 0.0% |
| Syria | 109 | 0.0% |
| Taiwan | 299 | 0.1% |
| Thailand | 135 | 0.0% |
| Trinidad and Tobago | 107 | 0.0% |
| Turkey | 112 | 0.0% |
| Ukraine | 74 | 0.0% |
| Uruguay | 9 | 0.0% |
| Venezuela | 119 | 0.0% |
| Vietnam | 5,525 | 1.3% |
| Western Africa | 480 | 0.1% |
| Western Asia | 1,872 | 0.4% |
| Western Europe | 663 | 0.2% | View All 110 Rows |
Sex and Age in Jefferson Parish
Sex and Age in Jefferson Parish
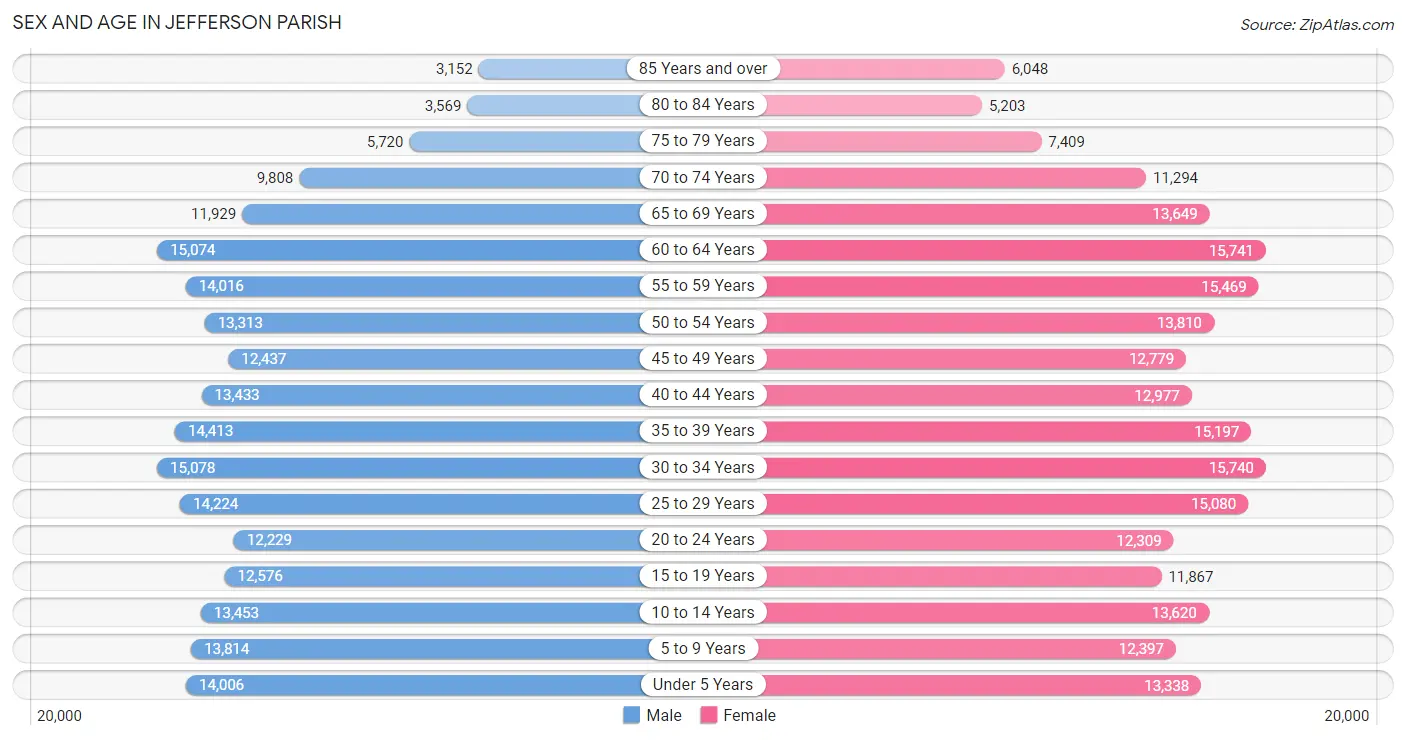
The most populous age groups in Jefferson Parish are 30 to 34 Years (15,078 | 7.1%) for men and 60 to 64 Years (15,741 | 7.0%) for women.
| Age Bracket | Male | Female |
| Under 5 Years | 14,006 (6.6%) | 13,338 (6.0%) |
| 5 to 9 Years | 13,814 (6.5%) | 12,397 (5.5%) |
| 10 to 14 Years | 13,453 (6.3%) | 13,620 (6.1%) |
| 15 to 19 Years | 12,576 (5.9%) | 11,867 (5.3%) |
| 20 to 24 Years | 12,229 (5.8%) | 12,309 (5.5%) |
| 25 to 29 Years | 14,224 (6.7%) | 15,080 (6.7%) |
| 30 to 34 Years | 15,078 (7.1%) | 15,740 (7.0%) |
| 35 to 39 Years | 14,413 (6.8%) | 15,197 (6.8%) |
| 40 to 44 Years | 13,433 (6.3%) | 12,977 (5.8%) |
| 45 to 49 Years | 12,437 (5.9%) | 12,779 (5.7%) |
| 50 to 54 Years | 13,313 (6.3%) | 13,810 (6.2%) |
| 55 to 59 Years | 14,016 (6.6%) | 15,469 (6.9%) |
| 60 to 64 Years | 15,074 (7.1%) | 15,741 (7.0%) |
| 65 to 69 Years | 11,929 (5.6%) | 13,649 (6.1%) |
| 70 to 74 Years | 9,808 (4.6%) | 11,294 (5.0%) |
| 75 to 79 Years | 5,720 (2.7%) | 7,409 (3.3%) |
| 80 to 84 Years | 3,569 (1.7%) | 5,203 (2.3%) |
| 85 Years and over | 3,152 (1.5%) | 6,048 (2.7%) |
| Total | 212,244 (100.0%) | 223,927 (100.0%) |
Families and Households in Jefferson Parish
Median Family Size in Jefferson Parish
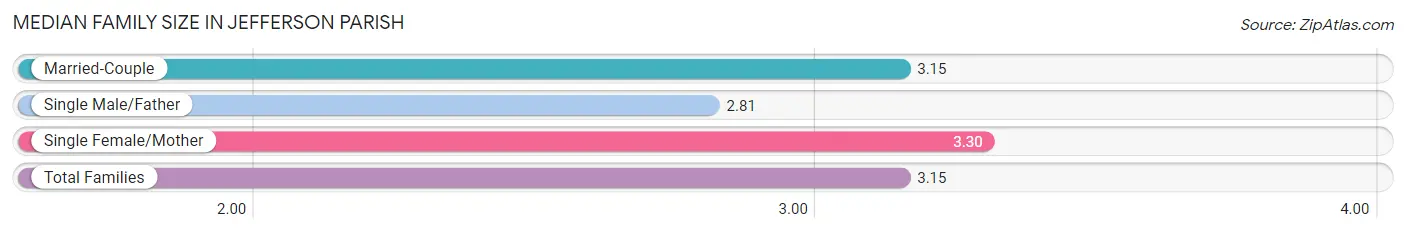
The median family size in Jefferson Parish is 3.15 persons per family, with single female/mother families (27,536 | 25.4%) accounting for the largest median family size of 3.3 persons per family. On the other hand, single male/father families (10,066 | 9.3%) represent the smallest median family size with 2.81 persons per family.
| Family Type | # Families | Family Size |
| Married-Couple | 70,843 (65.3%) | 3.15 |
| Single Male/Father | 10,066 (9.3%) | 2.81 |
| Single Female/Mother | 27,536 (25.4%) | 3.30 |
| Total Families | 108,445 (100.0%) | 3.15 |
Median Household Size in Jefferson Parish
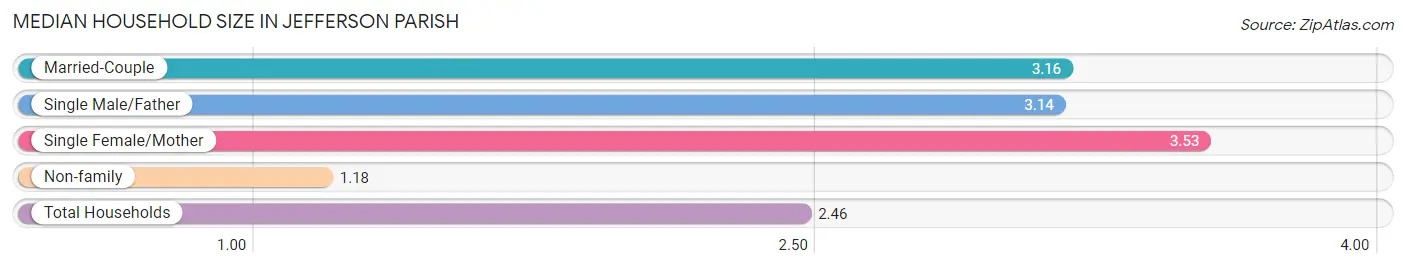
The median household size in Jefferson Parish is 2.46 persons per household, with single female/mother households (27,536 | 15.6%) accounting for the largest median household size of 3.53 persons per household. non-family households (67,720 | 38.4%) represent the smallest median household size with 1.18 persons per household.
| Household Type | # Households | Household Size |
| Married-Couple | 70,843 (40.2%) | 3.16 |
| Single Male/Father | 10,066 (5.7%) | 3.14 |
| Single Female/Mother | 27,536 (15.6%) | 3.53 |
| Non-family | 67,720 (38.4%) | 1.18 |
| Total Households | 176,165 (100.0%) | 2.46 |
Household Size by Marriage Status in Jefferson Parish
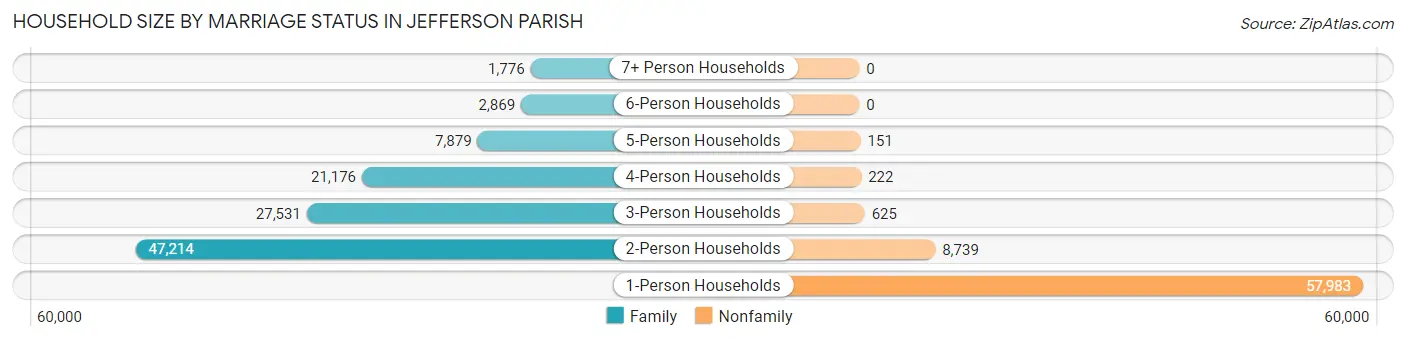
Out of a total of 176,165 households in Jefferson Parish, 108,445 (61.6%) are family households, while 67,720 (38.4%) are nonfamily households. The most numerous type of family households are 2-person households, comprising 47,214, and the most common type of nonfamily households are 1-person households, comprising 57,983.
| Household Size | Family Households | Nonfamily Households |
| 1-Person Households | - | 57,983 (32.9%) |
| 2-Person Households | 47,214 (26.8%) | 8,739 (5.0%) |
| 3-Person Households | 27,531 (15.6%) | 625 (0.4%) |
| 4-Person Households | 21,176 (12.0%) | 222 (0.1%) |
| 5-Person Households | 7,879 (4.5%) | 151 (0.1%) |
| 6-Person Households | 2,869 (1.6%) | 0 (0.0%) |
| 7+ Person Households | 1,776 (1.0%) | 0 (0.0%) |
| Total | 108,445 (61.6%) | 67,720 (38.4%) |
Female Fertility in Jefferson Parish
Fertility by Age in Jefferson Parish
Average fertility rate in Jefferson Parish is 67.0 births per 1,000 women. Women in the age bracket of 20 to 34 years have the highest fertility rate with 111.0 births per 1,000 women. Women in the age bracket of 20 to 34 years acount for 72.2% of all women with births.
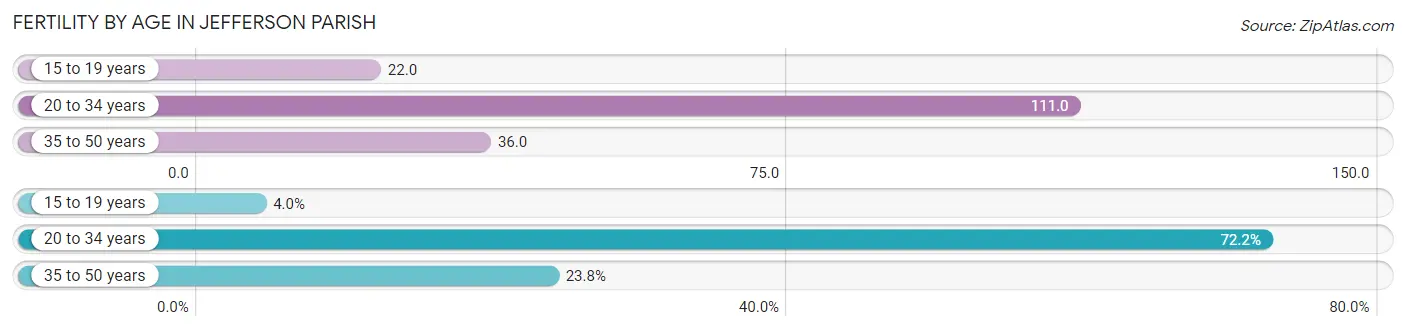
| Age Bracket | Women with Births | Births / 1,000 Women |
| 15 to 19 years | 262 (4.0%) | 22.0 |
| 20 to 34 years | 4,786 (72.2%) | 111.0 |
| 35 to 50 years | 1,577 (23.8%) | 36.0 |
| Total | 6,625 (100.0%) | 67.0 |
Fertility by Age by Marriage Status in Jefferson Parish
52.8% of women with births (6,625) in Jefferson Parish are married. The highest percentage of unmarried women with births falls into 15 to 19 years age bracket with 74.4% of them unmarried at the time of birth, while the lowest percentage of unmarried women with births belong to 35 to 50 years age bracket with 35.6% of them unmarried.
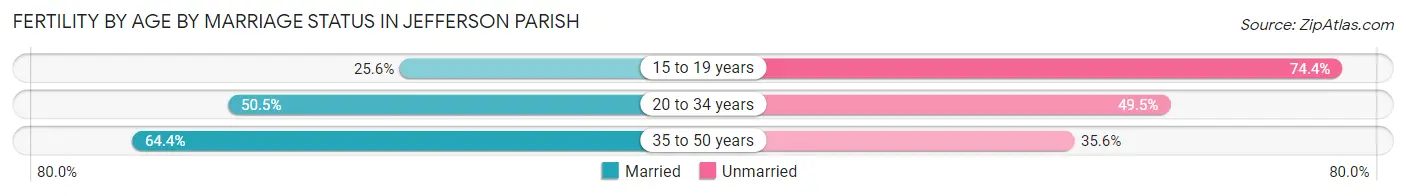
| Age Bracket | Married | Unmarried |
| 15 to 19 years | 67 (25.6%) | 195 (74.4%) |
| 20 to 34 years | 2,417 (50.5%) | 2,369 (49.5%) |
| 35 to 50 years | 1,016 (64.4%) | 561 (35.6%) |
| Total | 3,498 (52.8%) | 3,127 (47.2%) |
Fertility by Education in Jefferson Parish
Average fertility rate in Jefferson Parish is 67.0 births per 1,000 women. Women with the education attainment of high school diploma have the highest fertility rate of 91.0 births per 1,000 women, while women with the education attainment of bachelor's degree have the lowest fertility at 51.0 births per 1,000 women. Women with the education attainment of college or associate's degree represent 30.1% of all women with births.
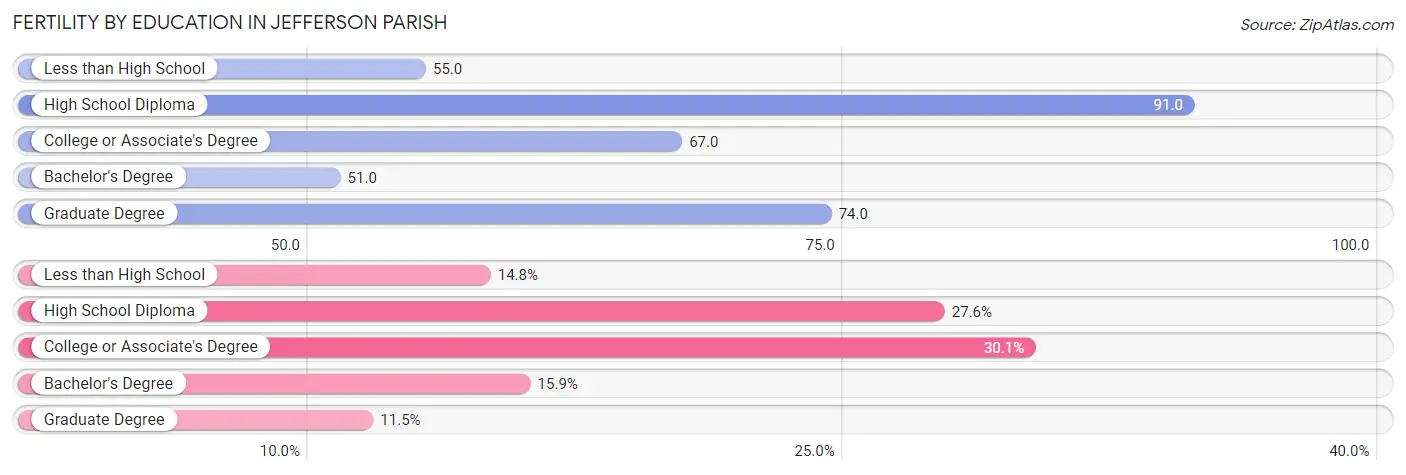
| Educational Attainment | Women with Births | Births / 1,000 Women |
| Less than High School | 982 (14.8%) | 55.0 |
| High School Diploma | 1,827 (27.6%) | 91.0 |
| College or Associate's Degree | 1,997 (30.1%) | 67.0 |
| Bachelor's Degree | 1,056 (15.9%) | 51.0 |
| Graduate Degree | 763 (11.5%) | 74.0 |
| Total | 6,625 (100.0%) | 67.0 |
Fertility by Education by Marriage Status in Jefferson Parish
47.2% of women with births in Jefferson Parish are unmarried. Women with the educational attainment of bachelor's degree are most likely to be married with 81.0% of them married at childbirth, while women with the educational attainment of less than high school are least likely to be married with 66.4% of them unmarried at childbirth.
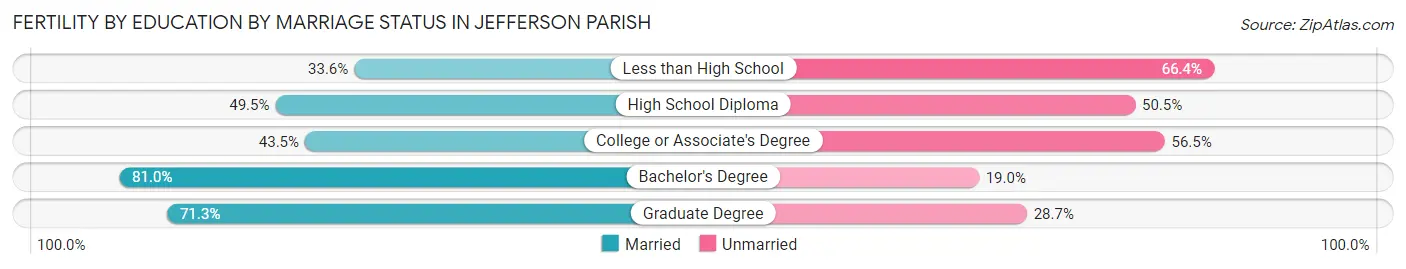
| Educational Attainment | Married | Unmarried |
| Less than High School | 330 (33.6%) | 652 (66.4%) |
| High School Diploma | 904 (49.5%) | 923 (50.5%) |
| College or Associate's Degree | 869 (43.5%) | 1,128 (56.5%) |
| Bachelor's Degree | 855 (81.0%) | 201 (19.0%) |
| Graduate Degree | 544 (71.3%) | 219 (28.7%) |
| Total | 3,498 (52.8%) | 3,127 (47.2%) |
Income in Jefferson Parish
Income Overview in Jefferson Parish
Per Capita Income in Jefferson Parish is $35,720, while median incomes of families and households are $79,749 and $63,257 respectively.
| Characteristic | Number | Measure |
| Per Capita Income | 436,171 | $35,720 |
| Median Family Income | 108,445 | $79,749 |
| Mean Family Income | 108,445 | $105,802 |
| Median Household Income | 176,165 | $63,257 |
| Mean Household Income | 176,165 | $87,728 |
| Income Deficit | 108,445 | $10,163 |
| Wage / Income Gap (%) | 436,171 | 24.38% |
| Wage / Income Gap ($) | 436,171 | 75.62¢ per $1 |
| Gini / Inequality Index | 436,171 | 0.48 |
Earnings by Sex in Jefferson Parish
Average Earnings in Jefferson Parish are $39,031, $45,133 for men and $34,131 for women, a difference of 24.4%.
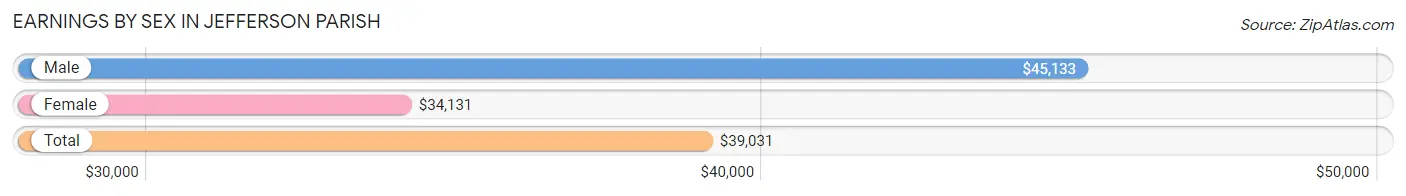
| Sex | Number | Average Earnings |
| Male | 118,145 (51.4%) | $45,133 |
| Female | 111,685 (48.6%) | $34,131 |
| Total | 229,830 (100.0%) | $39,031 |
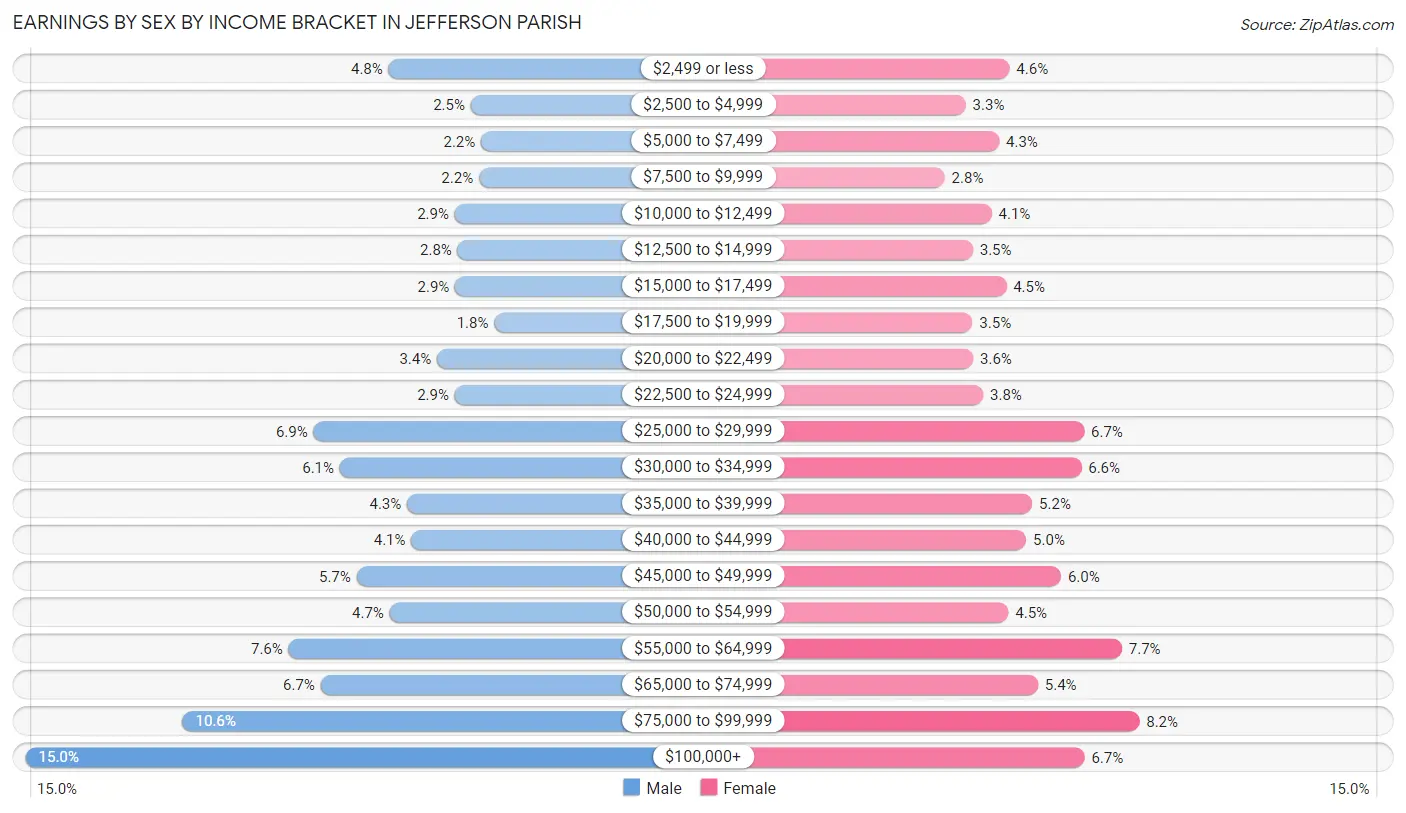
Earnings by Sex by Income Bracket in Jefferson Parish
The most common earnings brackets in Jefferson Parish are $100,000+ for men (17,683 | 15.0%) and $75,000 to $99,999 for women (9,182 | 8.2%).
| Income | Male | Female |
| $2,499 or less | 5,635 (4.8%) | 5,106 (4.6%) |
| $2,500 to $4,999 | 2,911 (2.5%) | 3,726 (3.3%) |
| $5,000 to $7,499 | 2,568 (2.2%) | 4,779 (4.3%) |
| $7,500 to $9,999 | 2,635 (2.2%) | 3,074 (2.8%) |
| $10,000 to $12,499 | 3,443 (2.9%) | 4,544 (4.1%) |
| $12,500 to $14,999 | 3,341 (2.8%) | 3,949 (3.5%) |
| $15,000 to $17,499 | 3,422 (2.9%) | 5,003 (4.5%) |
| $17,500 to $19,999 | 2,132 (1.8%) | 3,946 (3.5%) |
| $20,000 to $22,499 | 4,023 (3.4%) | 3,965 (3.5%) |
| $22,500 to $24,999 | 3,438 (2.9%) | 4,273 (3.8%) |
| $25,000 to $29,999 | 8,128 (6.9%) | 7,449 (6.7%) |
| $30,000 to $34,999 | 7,252 (6.1%) | 7,361 (6.6%) |
| $35,000 to $39,999 | 5,016 (4.3%) | 5,821 (5.2%) |
| $40,000 to $44,999 | 4,885 (4.1%) | 5,625 (5.0%) |
| $45,000 to $49,999 | 6,703 (5.7%) | 6,722 (6.0%) |
| $50,000 to $54,999 | 5,605 (4.7%) | 5,067 (4.5%) |
| $55,000 to $64,999 | 8,960 (7.6%) | 8,636 (7.7%) |
| $65,000 to $74,999 | 7,889 (6.7%) | 5,995 (5.4%) |
| $75,000 to $99,999 | 12,476 (10.6%) | 9,182 (8.2%) |
| $100,000+ | 17,683 (15.0%) | 7,462 (6.7%) |
| Total | 118,145 (100.0%) | 111,685 (100.0%) |
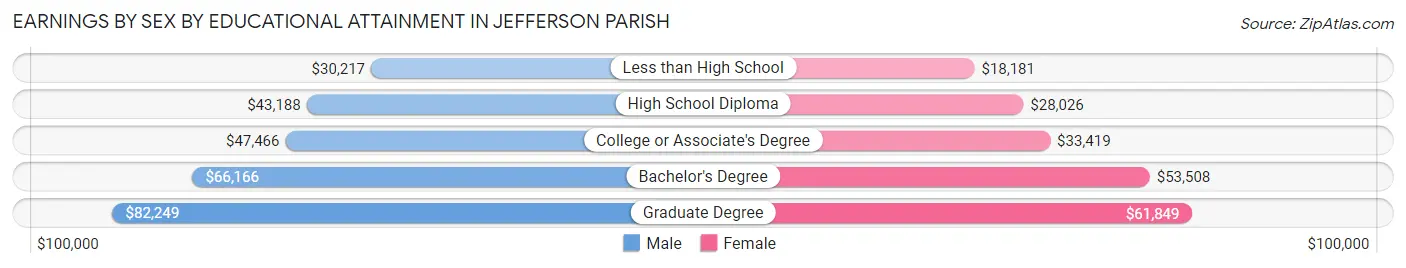
Earnings by Sex by Educational Attainment in Jefferson Parish
Average earnings in Jefferson Parish are $48,886 for men and $38,271 for women, a difference of 21.7%. Men with an educational attainment of graduate degree enjoy the highest average annual earnings of $82,249, while those with less than high school education earn the least with $30,217. Women with an educational attainment of graduate degree earn the most with the average annual earnings of $61,849, while those with less than high school education have the smallest earnings of $18,181.
| Educational Attainment | Male Income | Female Income |
| Less than High School | $30,217 | $18,181 |
| High School Diploma | $43,188 | $28,026 |
| College or Associate's Degree | $47,466 | $33,419 |
| Bachelor's Degree | $66,166 | $53,508 |
| Graduate Degree | $82,249 | $61,849 |
| Total | $48,886 | $38,271 |
Family Income in Jefferson Parish
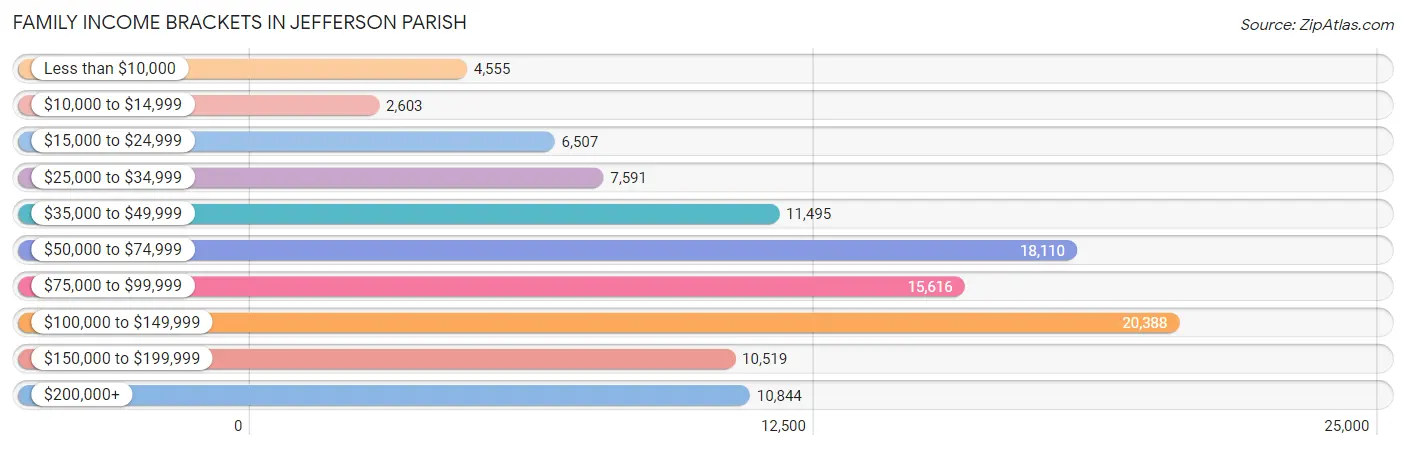
Family Income Brackets in Jefferson Parish
According to the Jefferson Parish family income data, there are 20,388 families falling into the $100,000 to $149,999 income range, which is the most common income bracket and makes up 18.8% of all families. Conversely, the $10,000 to $14,999 income bracket is the least frequent group with only 2,603 families (2.4%) belonging to this category.
| Income Bracket | # Families | % Families |
| Less than $10,000 | 4,555 | 4.2% |
| $10,000 to $14,999 | 2,603 | 2.4% |
| $15,000 to $24,999 | 6,507 | 6.0% |
| $25,000 to $34,999 | 7,591 | 7.0% |
| $35,000 to $49,999 | 11,495 | 10.6% |
| $50,000 to $74,999 | 18,110 | 16.7% |
| $75,000 to $99,999 | 15,616 | 14.4% |
| $100,000 to $149,999 | 20,388 | 18.8% |
| $150,000 to $199,999 | 10,519 | 9.7% |
| $200,000+ | 10,844 | 10.0% |
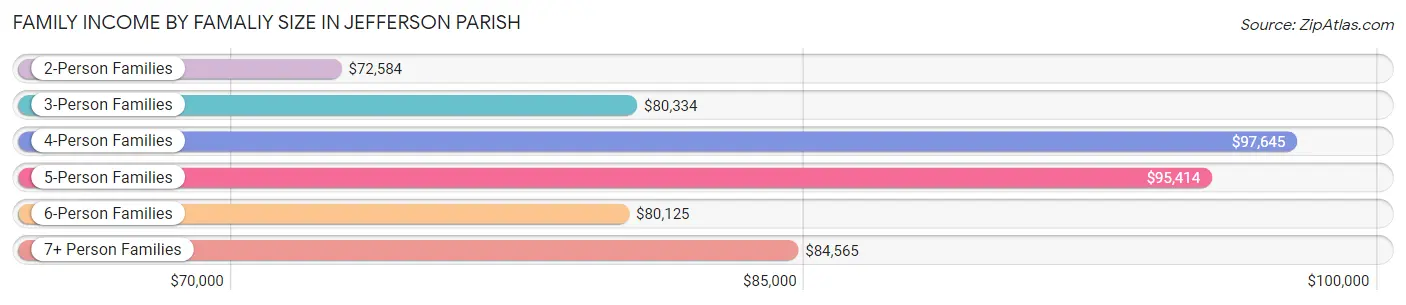
Family Income by Famaliy Size in Jefferson Parish
4-person families (19,662 | 18.1%) account for the highest median family income in Jefferson Parish with $97,645 per family, while 2-person families (51,635 | 47.6%) have the highest median income of $36,292 per family member.
| Income Bracket | # Families | Median Income |
| 2-Person Families | 51,635 (47.6%) | $72,584 |
| 3-Person Families | 26,213 (24.2%) | $80,334 |
| 4-Person Families | 19,662 (18.1%) | $97,645 |
| 5-Person Families | 6,851 (6.3%) | $95,414 |
| 6-Person Families | 2,629 (2.4%) | $80,125 |
| 7+ Person Families | 1,455 (1.3%) | $84,565 |
| Total | 108,445 (100.0%) | $79,749 |
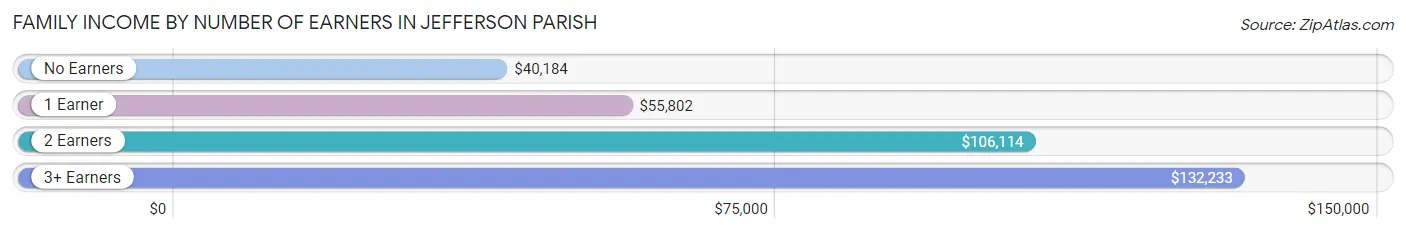
Family Income by Number of Earners in Jefferson Parish
The median family income in Jefferson Parish is $79,749, with families comprising 3+ earners (11,162) having the highest median family income of $132,233, while families with no earners (15,339) have the lowest median family income of $40,184, accounting for 10.3% and 14.1% of families, respectively.
| Number of Earners | # Families | Median Income |
| No Earners | 15,339 (14.1%) | $40,184 |
| 1 Earner | 38,521 (35.5%) | $55,802 |
| 2 Earners | 43,423 (40.0%) | $106,114 |
| 3+ Earners | 11,162 (10.3%) | $132,233 |
| Total | 108,445 (100.0%) | $79,749 |
Household Income in Jefferson Parish
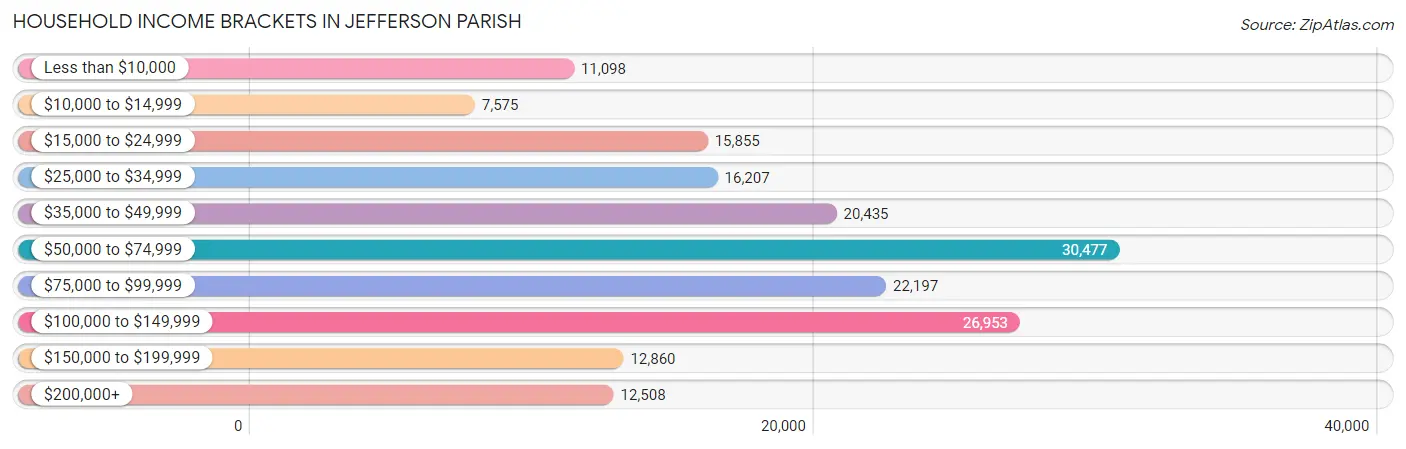
Household Income Brackets in Jefferson Parish
With 30,477 households falling in the category, the $50,000 to $74,999 income range is the most frequent in Jefferson Parish, accounting for 17.3% of all households. In contrast, only 7,575 households (4.3%) fall into the $10,000 to $14,999 income bracket, making it the least populous group.
| Income Bracket | # Households | % Households |
| Less than $10,000 | 11,098 | 6.3% |
| $10,000 to $14,999 | 7,575 | 4.3% |
| $15,000 to $24,999 | 15,855 | 9.0% |
| $25,000 to $34,999 | 16,207 | 9.2% |
| $35,000 to $49,999 | 20,435 | 11.6% |
| $50,000 to $74,999 | 30,477 | 17.3% |
| $75,000 to $99,999 | 22,197 | 12.6% |
| $100,000 to $149,999 | 26,953 | 15.3% |
| $150,000 to $199,999 | 12,860 | 7.3% |
| $200,000+ | 12,508 | 7.1% |
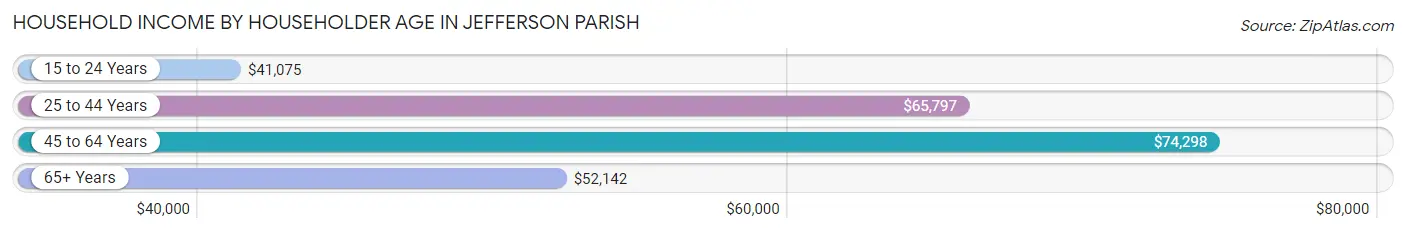
Household Income by Householder Age in Jefferson Parish
The median household income in Jefferson Parish is $63,257, with the highest median household income of $74,298 found in the 45 to 64 years age bracket for the primary householder. A total of 65,064 households (36.9%) fall into this category. Meanwhile, the 15 to 24 years age bracket for the primary householder has the lowest median household income of $41,075, with 4,892 households (2.8%) in this group.
| Income Bracket | # Households | Median Income |
| 15 to 24 Years | 4,892 (2.8%) | $41,075 |
| 25 to 44 Years | 55,603 (31.6%) | $65,797 |
| 45 to 64 Years | 65,064 (36.9%) | $74,298 |
| 65+ Years | 50,606 (28.7%) | $52,142 |
| Total | 176,165 (100.0%) | $63,257 |
Poverty in Jefferson Parish
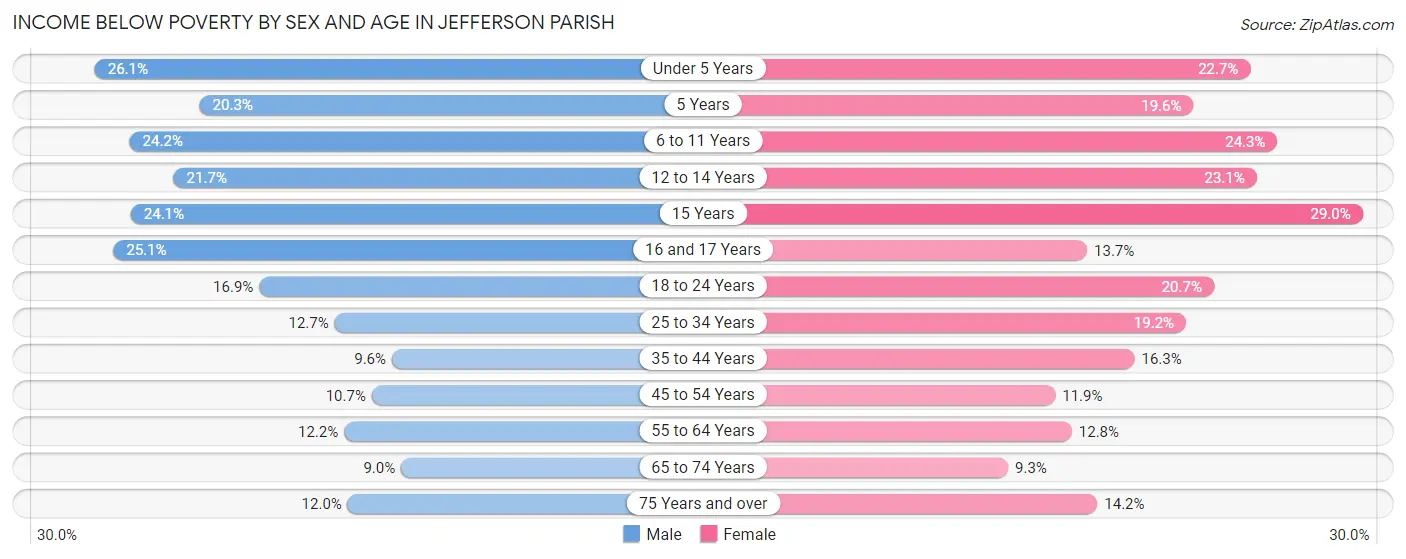
Income Below Poverty by Sex and Age in Jefferson Parish
With 14.5% poverty level for males and 16.4% for females among the residents of Jefferson Parish, under 5 year old males and 15 year old females are the most vulnerable to poverty, with 3,629 males (26.1%) and 758 females (29.0%) in their respective age groups living below the poverty level.
| Age Bracket | Male | Female |
| Under 5 Years | 3,629 (26.1%) | 3,019 (22.7%) |
| 5 Years | 521 (20.3%) | 396 (19.6%) |
| 6 to 11 Years | 3,664 (24.1%) | 3,819 (24.2%) |
| 12 to 14 Years | 2,002 (21.7%) | 1,783 (23.1%) |
| 15 Years | 564 (24.1%) | 758 (29.0%) |
| 16 and 17 Years | 1,373 (25.1%) | 697 (13.7%) |
| 18 to 24 Years | 2,816 (16.9%) | 3,400 (20.7%) |
| 25 to 34 Years | 3,701 (12.7%) | 5,891 (19.2%) |
| 35 to 44 Years | 2,637 (9.6%) | 4,583 (16.3%) |
| 45 to 54 Years | 2,741 (10.7%) | 3,161 (11.9%) |
| 55 to 64 Years | 3,525 (12.2%) | 3,988 (12.8%) |
| 65 to 74 Years | 1,947 (9.0%) | 2,287 (9.3%) |
| 75 Years and over | 1,466 (12.0%) | 2,583 (14.2%) |
| Total | 30,586 (14.5%) | 36,365 (16.4%) |
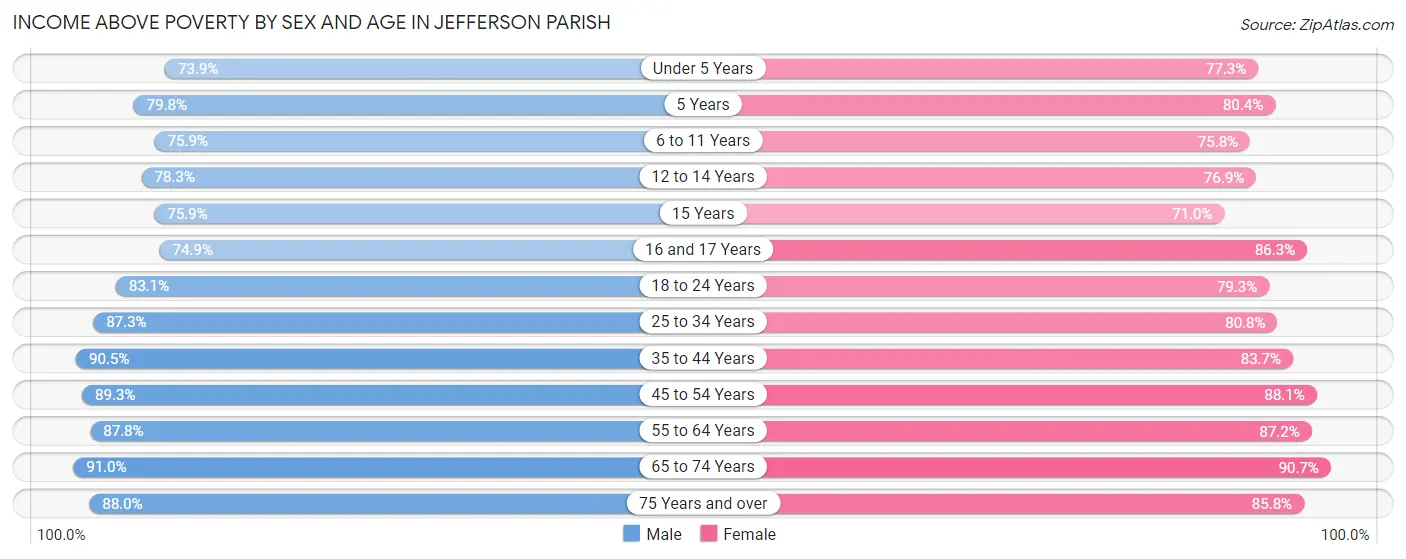
Income Above Poverty by Sex and Age in Jefferson Parish
According to the poverty statistics in Jefferson Parish, males aged 65 to 74 years and females aged 65 to 74 years are the age groups that are most secure financially, with 91.0% of males and 90.7% of females in these age groups living above the poverty line.
| Age Bracket | Male | Female |
| Under 5 Years | 10,282 (73.9%) | 10,258 (77.3%) |
| 5 Years | 2,052 (79.7%) | 1,628 (80.4%) |
| 6 to 11 Years | 11,507 (75.8%) | 11,927 (75.7%) |
| 12 to 14 Years | 7,222 (78.3%) | 5,934 (76.9%) |
| 15 Years | 1,778 (75.9%) | 1,856 (71.0%) |
| 16 and 17 Years | 4,105 (74.9%) | 4,407 (86.3%) |
| 18 to 24 Years | 13,804 (83.1%) | 13,014 (79.3%) |
| 25 to 34 Years | 25,352 (87.3%) | 24,856 (80.8%) |
| 35 to 44 Years | 24,977 (90.4%) | 23,533 (83.7%) |
| 45 to 54 Years | 22,948 (89.3%) | 23,428 (88.1%) |
| 55 to 64 Years | 25,342 (87.8%) | 27,134 (87.2%) |
| 65 to 74 Years | 19,589 (91.0%) | 22,398 (90.7%) |
| 75 Years and over | 10,736 (88.0%) | 15,573 (85.8%) |
| Total | 179,694 (85.5%) | 185,946 (83.6%) |
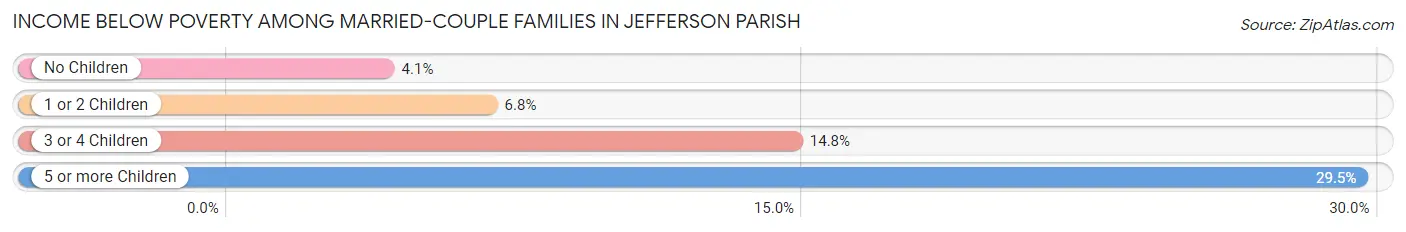
Income Below Poverty Among Married-Couple Families in Jefferson Parish
The poverty statistics for married-couple families in Jefferson Parish show that 5.7% or 4,039 of the total 70,843 families live below the poverty line. Families with 5 or more children have the highest poverty rate of 29.5%, comprising of 103 families. On the other hand, families with no children have the lowest poverty rate of 4.1%, which includes 1,767 families.
| Children | Above Poverty | Below Poverty |
| No Children | 41,388 (95.9%) | 1,767 (4.1%) |
| 1 or 2 Children | 21,806 (93.2%) | 1,587 (6.8%) |
| 3 or 4 Children | 3,364 (85.3%) | 582 (14.7%) |
| 5 or more Children | 246 (70.5%) | 103 (29.5%) |
| Total | 66,804 (94.3%) | 4,039 (5.7%) |
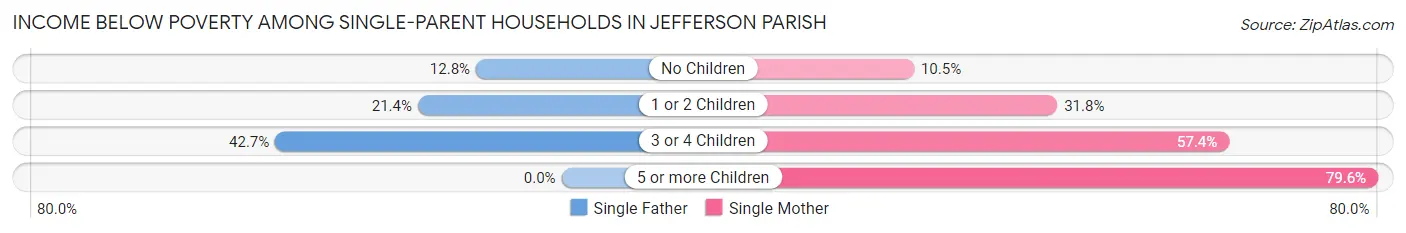
Income Below Poverty Among Single-Parent Households in Jefferson Parish
According to the poverty data in Jefferson Parish, 18.7% or 1,878 single-father households and 26.5% or 7,295 single-mother households are living below the poverty line. Among single-father households, those with 3 or 4 children have the highest poverty rate, with 288 households (42.7%) experiencing poverty. Likewise, among single-mother households, those with 5 or more children have the highest poverty rate, with 164 households (79.6%) falling below the poverty line.
| Children | Single Father | Single Mother |
| No Children | 591 (12.8%) | 1,112 (10.5%) |
| 1 or 2 Children | 999 (21.4%) | 4,453 (31.8%) |
| 3 or 4 Children | 288 (42.7%) | 1,566 (57.4%) |
| 5 or more Children | 0 (0.0%) | 164 (79.6%) |
| Total | 1,878 (18.7%) | 7,295 (26.5%) |
Income Below Poverty Among Married-Couple vs Single-Parent Households in Jefferson Parish
The poverty data for Jefferson Parish shows that 4,039 of the married-couple family households (5.7%) and 9,173 of the single-parent households (24.4%) are living below the poverty level. Within the married-couple family households, those with 5 or more children have the highest poverty rate, with 103 households (29.5%) falling below the poverty line. Among the single-parent households, those with 5 or more children have the highest poverty rate, with 164 household (55.4%) living below poverty.
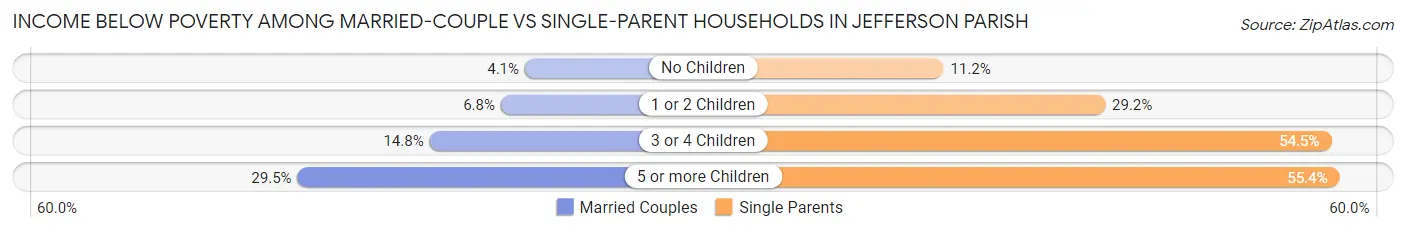
| Children | Married-Couple Families | Single-Parent Households |
| No Children | 1,767 (4.1%) | 1,703 (11.2%) |
| 1 or 2 Children | 1,587 (6.8%) | 5,452 (29.2%) |
| 3 or 4 Children | 582 (14.7%) | 1,854 (54.5%) |
| 5 or more Children | 103 (29.5%) | 164 (55.4%) |
| Total | 4,039 (5.7%) | 9,173 (24.4%) |
Employment Characteristics in Jefferson Parish
Employment by Class of Employer in Jefferson Parish
Among the 204,156 employed individuals in Jefferson Parish, private company employees (138,049 | 67.6%), not-for-profit organizations (16,091 | 7.9%), and self-employed (not incorporated) (14,710 | 7.2%) make up the most common classes of employment.
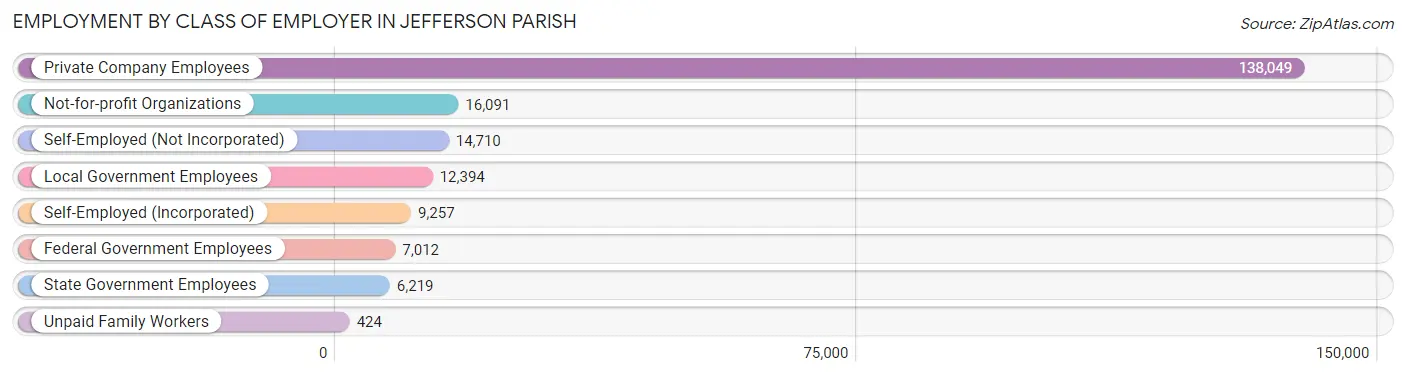
| Employer Class | # Employees | % Employees |
| Private Company Employees | 138,049 | 67.6% |
| Self-Employed (Incorporated) | 9,257 | 4.5% |
| Self-Employed (Not Incorporated) | 14,710 | 7.2% |
| Not-for-profit Organizations | 16,091 | 7.9% |
| Local Government Employees | 12,394 | 6.1% |
| State Government Employees | 6,219 | 3.0% |
| Federal Government Employees | 7,012 | 3.4% |
| Unpaid Family Workers | 424 | 0.2% |
| Total | 204,156 | 100.0% |
Employment Status by Age in Jefferson Parish
According to the labor force statistics for Jefferson Parish, out of the total population over 16 years of age (350,578), 63.5% or 222,617 individuals are in the labor force, with 6.0% or 13,357 of them unemployed. The age group with the highest labor force participation rate is 35 to 44 years, with 84.9% or 47,561 individuals in the labor force. Within the labor force, the 16 to 19 years age range has the highest percentage of unemployed individuals, with 20.6% or 1,312 of them being unemployed.
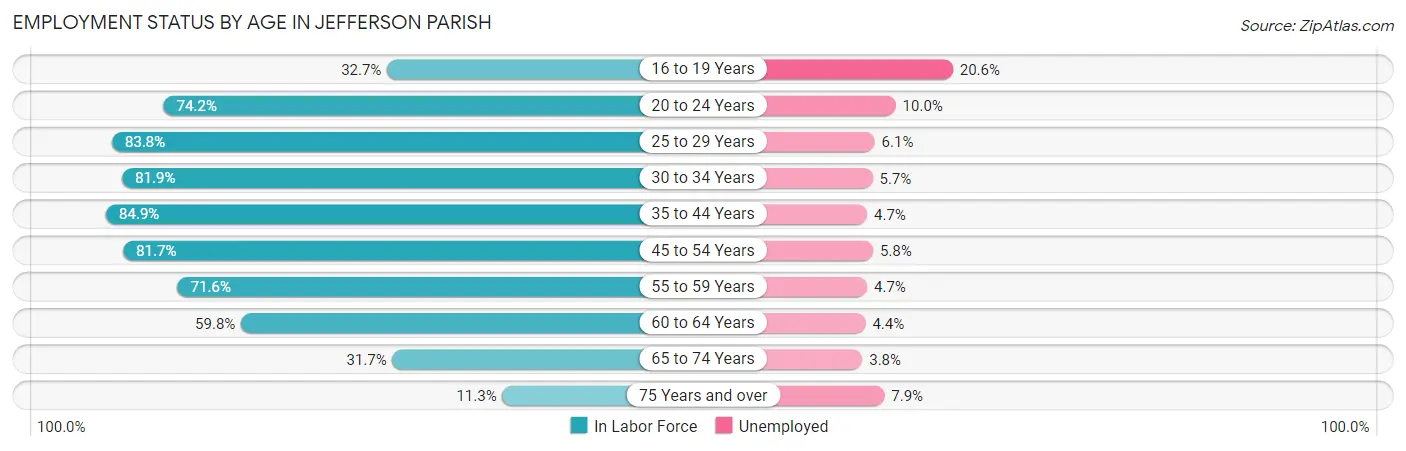
| Age Bracket | In Labor Force | Unemployed |
| 16 to 19 Years | 6,369 (32.7%) | 1,312 (20.6%) |
| 20 to 24 Years | 18,207 (74.2%) | 1,821 (10.0%) |
| 25 to 29 Years | 24,557 (83.8%) | 1,498 (6.1%) |
| 30 to 34 Years | 25,240 (81.9%) | 1,439 (5.7%) |
| 35 to 44 Years | 47,561 (84.9%) | 2,235 (4.7%) |
| 45 to 54 Years | 42,761 (81.7%) | 2,480 (5.8%) |
| 55 to 59 Years | 21,111 (71.6%) | 992 (4.7%) |
| 60 to 64 Years | 18,427 (59.8%) | 811 (4.4%) |
| 65 to 74 Years | 14,798 (31.7%) | 562 (3.8%) |
| 75 Years and over | 3,514 (11.3%) | 278 (7.9%) |
| Total | 222,617 (63.5%) | 13,357 (6.0%) |
Employment Status by Educational Attainment in Jefferson Parish
According to labor force statistics for Jefferson Parish, 78.5% of individuals (179,593) out of the total population between 25 and 64 years of age (228,781) are in the labor force, with 5.2% or 9,339 of them being unemployed. The group with the highest labor force participation rate are those with the educational attainment of bachelor's degree or higher, with 88.1% or 63,099 individuals in the labor force. Within the labor force, individuals with less than high school education have the highest percentage of unemployment, with 9.1% or 1,521 of them being unemployed.
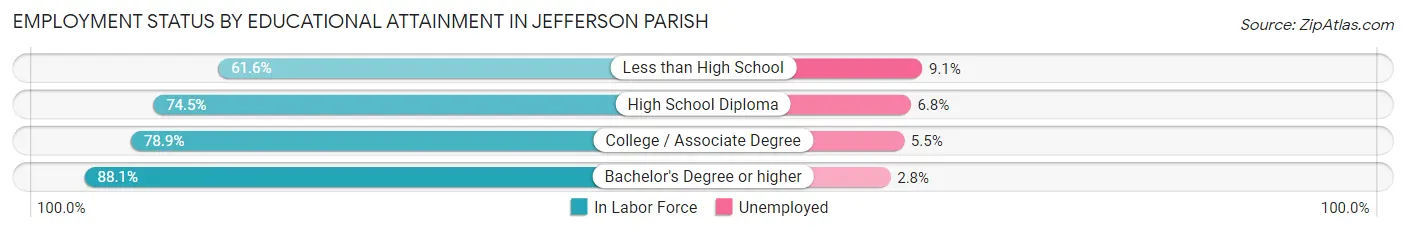
| Educational Attainment | In Labor Force | Unemployed |
| Less than High School | 16,719 (61.6%) | 2,470 (9.1%) |
| High School Diploma | 45,908 (74.5%) | 4,190 (6.8%) |
| College / Associate Degree | 53,964 (78.9%) | 3,762 (5.5%) |
| Bachelor's Degree or higher | 63,099 (88.1%) | 2,005 (2.8%) |
| Total | 179,593 (78.5%) | 11,897 (5.2%) |
Employment Occupations by Sex in Jefferson Parish
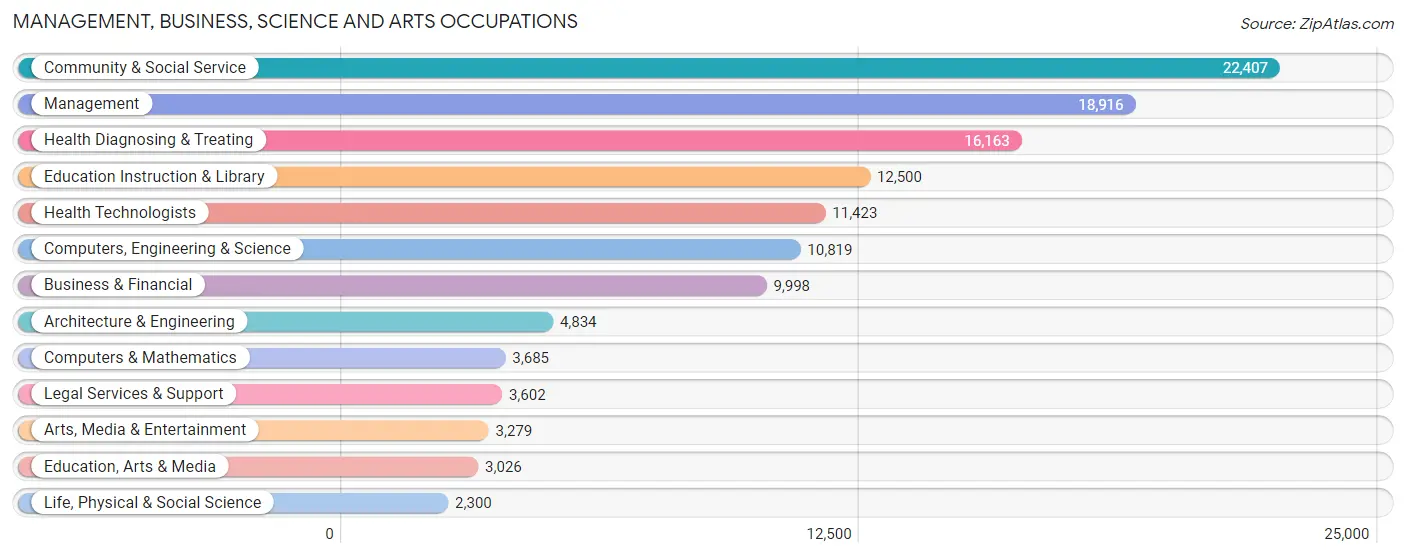
Management, Business, Science and Arts Occupations
The most common Management, Business, Science and Arts occupations in Jefferson Parish are Community & Social Service (22,407 | 10.8%), Management (18,916 | 9.1%), Health Diagnosing & Treating (16,163 | 7.8%), Education Instruction & Library (12,500 | 6.0%), and Health Technologists (11,423 | 5.5%).
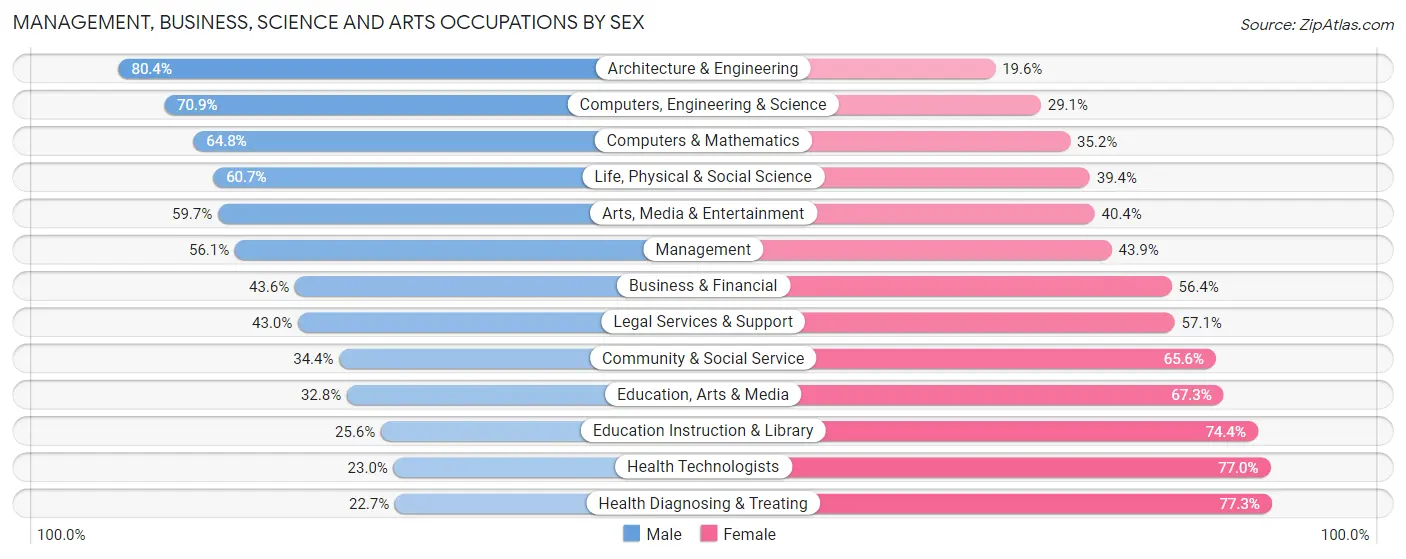
Management, Business, Science and Arts Occupations by Sex
Within the Management, Business, Science and Arts occupations in Jefferson Parish, the most male-oriented occupations are Architecture & Engineering (80.4%), Computers, Engineering & Science (70.9%), and Computers & Mathematics (64.8%), while the most female-oriented occupations are Health Diagnosing & Treating (77.3%), Health Technologists (77.0%), and Education Instruction & Library (74.4%).
| Occupation | Male | Female |
| Management | 10,611 (56.1%) | 8,305 (43.9%) |
| Business & Financial | 4,357 (43.6%) | 5,641 (56.4%) |
| Computers, Engineering & Science | 7,668 (70.9%) | 3,151 (29.1%) |
| Computers & Mathematics | 2,387 (64.8%) | 1,298 (35.2%) |
| Architecture & Engineering | 3,886 (80.4%) | 948 (19.6%) |
| Life, Physical & Social Science | 1,395 (60.7%) | 905 (39.4%) |
| Community & Social Service | 7,698 (34.4%) | 14,709 (65.6%) |
| Education, Arts & Media | 991 (32.8%) | 2,035 (67.2%) |
| Legal Services & Support | 1,547 (42.9%) | 2,055 (57.1%) |
| Education Instruction & Library | 3,204 (25.6%) | 9,296 (74.4%) |
| Arts, Media & Entertainment | 1,956 (59.7%) | 1,323 (40.4%) |
| Health Diagnosing & Treating | 3,672 (22.7%) | 12,491 (77.3%) |
| Health Technologists | 2,629 (23.0%) | 8,794 (77.0%) |
| Total (Category) | 34,006 (43.4%) | 44,297 (56.6%) |
| Total (Overall) | 106,442 (51.1%) | 101,636 (48.8%) |
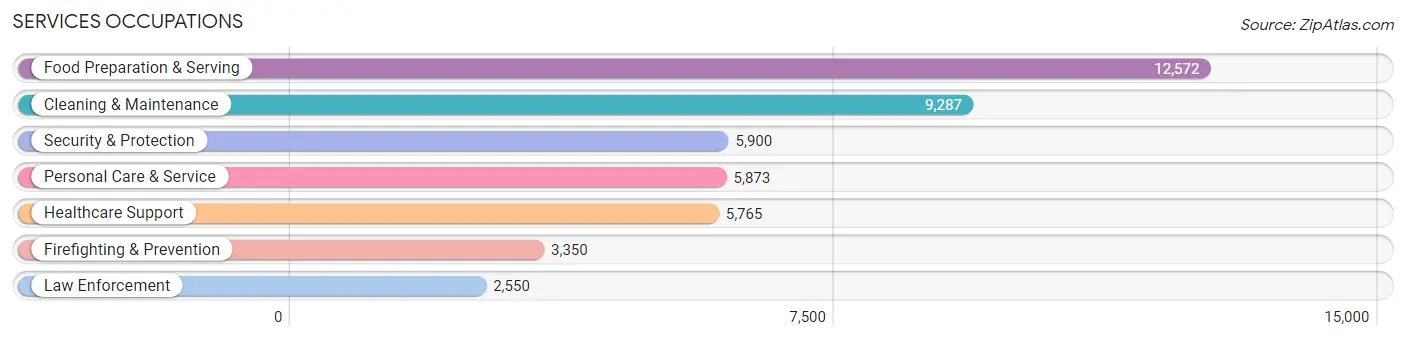
Services Occupations
The most common Services occupations in Jefferson Parish are Food Preparation & Serving (12,572 | 6.0%), Cleaning & Maintenance (9,287 | 4.5%), Security & Protection (5,900 | 2.8%), Personal Care & Service (5,873 | 2.8%), and Healthcare Support (5,765 | 2.8%).
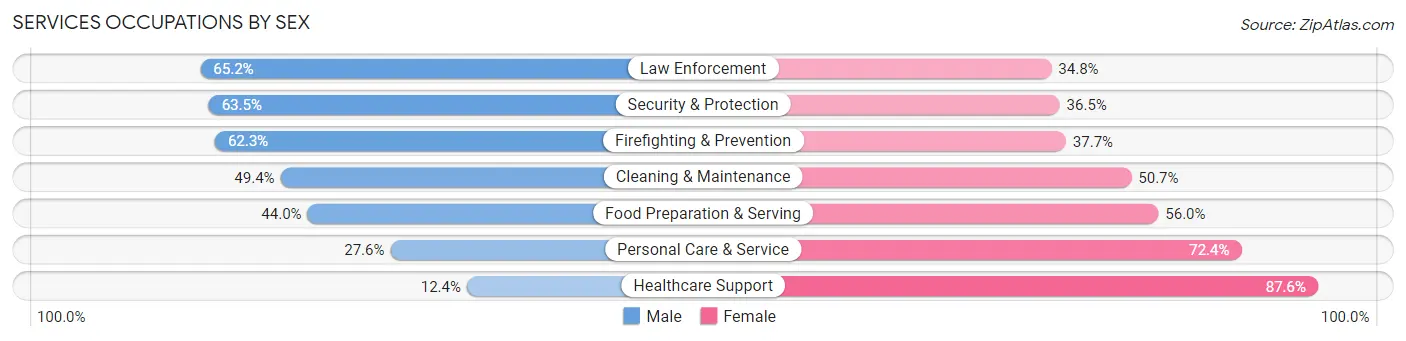
Services Occupations by Sex
Within the Services occupations in Jefferson Parish, the most male-oriented occupations are Law Enforcement (65.2%), Security & Protection (63.5%), and Firefighting & Prevention (62.3%), while the most female-oriented occupations are Healthcare Support (87.6%), Personal Care & Service (72.4%), and Food Preparation & Serving (56.0%).
| Occupation | Male | Female |
| Healthcare Support | 717 (12.4%) | 5,048 (87.6%) |
| Security & Protection | 3,749 (63.5%) | 2,151 (36.5%) |
| Firefighting & Prevention | 2,087 (62.3%) | 1,263 (37.7%) |
| Law Enforcement | 1,662 (65.2%) | 888 (34.8%) |
| Food Preparation & Serving | 5,532 (44.0%) | 7,040 (56.0%) |
| Cleaning & Maintenance | 4,583 (49.3%) | 4,704 (50.6%) |
| Personal Care & Service | 1,620 (27.6%) | 4,253 (72.4%) |
| Total (Category) | 16,201 (41.1%) | 23,196 (58.9%) |
| Total (Overall) | 106,442 (51.1%) | 101,636 (48.8%) |
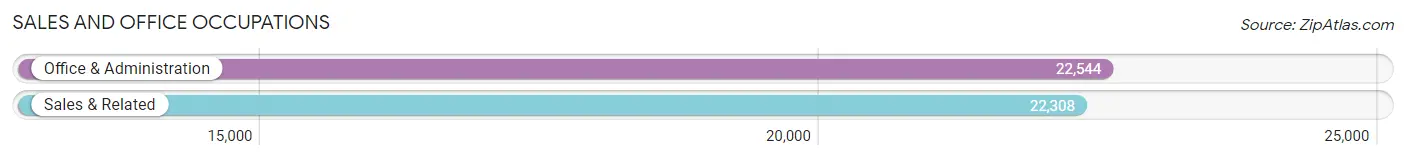
Sales and Office Occupations
The most common Sales and Office occupations in Jefferson Parish are Office & Administration (22,544 | 10.8%), and Sales & Related (22,308 | 10.7%).
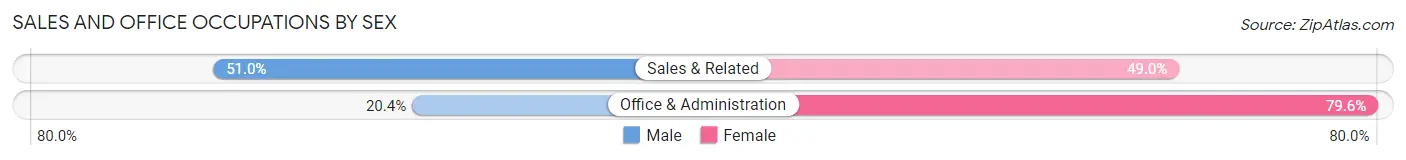
Sales and Office Occupations by Sex
| Occupation | Male | Female |
| Sales & Related | 11,372 (51.0%) | 10,936 (49.0%) |
| Office & Administration | 4,600 (20.4%) | 17,944 (79.6%) |
| Total (Category) | 15,972 (35.6%) | 28,880 (64.4%) |
| Total (Overall) | 106,442 (51.1%) | 101,636 (48.8%) |
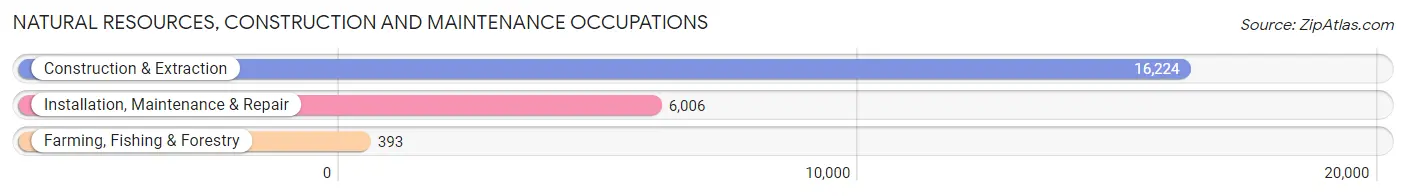
Natural Resources, Construction and Maintenance Occupations
The most common Natural Resources, Construction and Maintenance occupations in Jefferson Parish are Construction & Extraction (16,224 | 7.8%), Installation, Maintenance & Repair (6,006 | 2.9%), and Farming, Fishing & Forestry (393 | 0.2%).
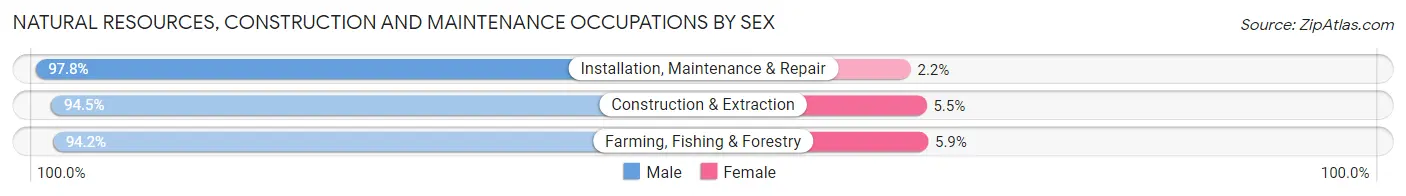
Natural Resources, Construction and Maintenance Occupations by Sex
| Occupation | Male | Female |
| Farming, Fishing & Forestry | 370 (94.2%) | 23 (5.9%) |
| Construction & Extraction | 15,328 (94.5%) | 896 (5.5%) |
| Installation, Maintenance & Repair | 5,873 (97.8%) | 133 (2.2%) |
| Total (Category) | 21,571 (95.4%) | 1,052 (4.6%) |
| Total (Overall) | 106,442 (51.1%) | 101,636 (48.8%) |
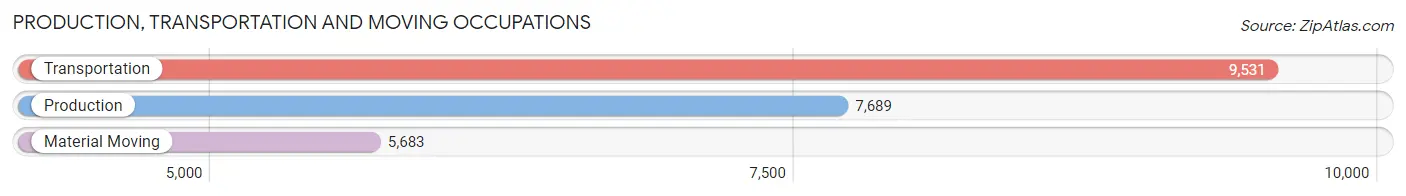
Production, Transportation and Moving Occupations
The most common Production, Transportation and Moving occupations in Jefferson Parish are Transportation (9,531 | 4.6%), Production (7,689 | 3.7%), and Material Moving (5,683 | 2.7%).
Production, Transportation and Moving Occupations by Sex
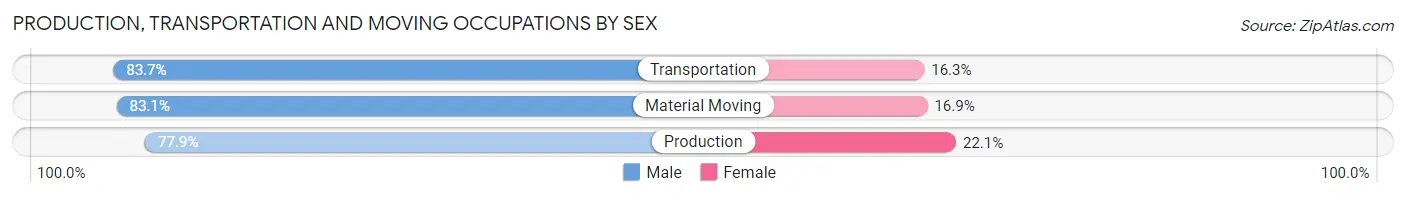
| Occupation | Male | Female |
| Production | 5,989 (77.9%) | 1,700 (22.1%) |
| Transportation | 7,979 (83.7%) | 1,552 (16.3%) |
| Material Moving | 4,724 (83.1%) | 959 (16.9%) |
| Total (Category) | 18,692 (81.6%) | 4,211 (18.4%) |
| Total (Overall) | 106,442 (51.1%) | 101,636 (48.8%) |
Employment Industries by Sex in Jefferson Parish
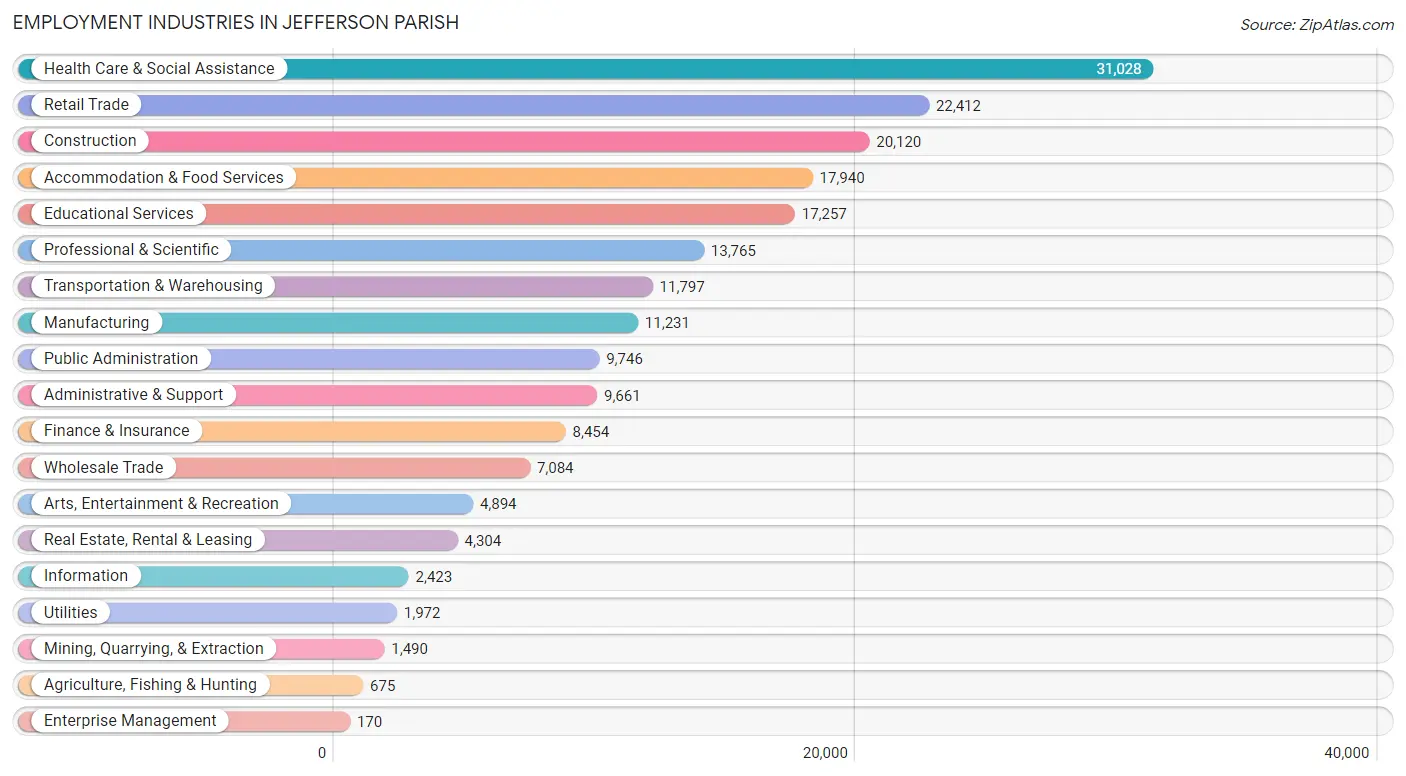
Employment Industries in Jefferson Parish
The major employment industries in Jefferson Parish include Health Care & Social Assistance (31,028 | 14.9%), Retail Trade (22,412 | 10.8%), Construction (20,120 | 9.7%), Accommodation & Food Services (17,940 | 8.6%), and Educational Services (17,257 | 8.3%).
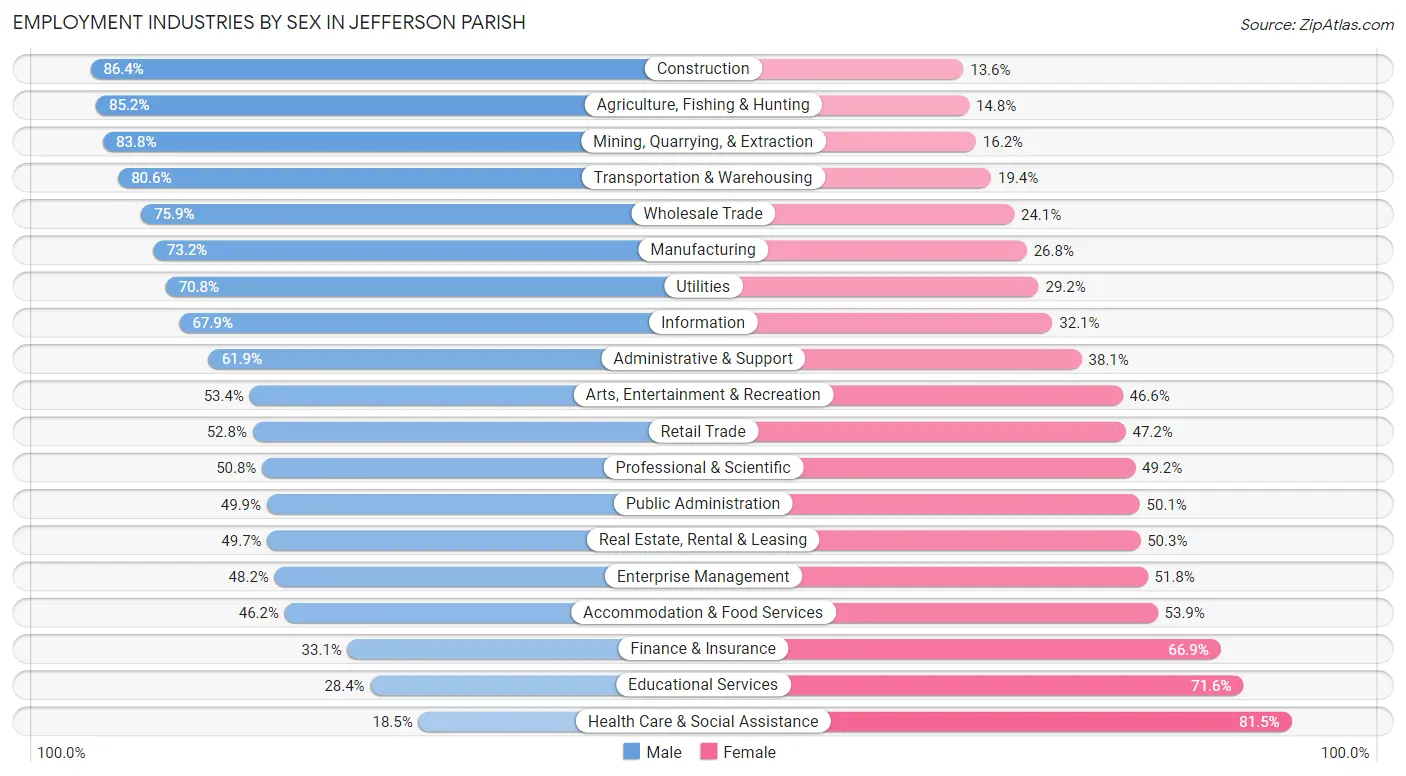
Employment Industries by Sex in Jefferson Parish
The Jefferson Parish industries that see more men than women are Construction (86.4%), Agriculture, Fishing & Hunting (85.2%), and Mining, Quarrying, & Extraction (83.8%), whereas the industries that tend to have a higher number of women are Health Care & Social Assistance (81.5%), Educational Services (71.6%), and Finance & Insurance (66.9%).
| Industry | Male | Female |
| Agriculture, Fishing & Hunting | 575 (85.2%) | 100 (14.8%) |
| Mining, Quarrying, & Extraction | 1,248 (83.8%) | 242 (16.2%) |
| Construction | 17,376 (86.4%) | 2,744 (13.6%) |
| Manufacturing | 8,224 (73.2%) | 3,007 (26.8%) |
| Wholesale Trade | 5,374 (75.9%) | 1,710 (24.1%) |
| Retail Trade | 11,830 (52.8%) | 10,582 (47.2%) |
| Transportation & Warehousing | 9,510 (80.6%) | 2,287 (19.4%) |
| Utilities | 1,396 (70.8%) | 576 (29.2%) |
| Information | 1,646 (67.9%) | 777 (32.1%) |
| Finance & Insurance | 2,801 (33.1%) | 5,653 (66.9%) |
| Real Estate, Rental & Leasing | 2,141 (49.7%) | 2,163 (50.3%) |
| Professional & Scientific | 6,996 (50.8%) | 6,769 (49.2%) |
| Enterprise Management | 82 (48.2%) | 88 (51.8%) |
| Administrative & Support | 5,978 (61.9%) | 3,683 (38.1%) |
| Educational Services | 4,905 (28.4%) | 12,352 (71.6%) |
| Health Care & Social Assistance | 5,729 (18.5%) | 25,299 (81.5%) |
| Arts, Entertainment & Recreation | 2,614 (53.4%) | 2,280 (46.6%) |
| Accommodation & Food Services | 8,280 (46.2%) | 9,660 (53.8%) |
| Public Administration | 4,859 (49.9%) | 4,887 (50.1%) |
| Total | 106,442 (51.1%) | 101,636 (48.8%) |
Education in Jefferson Parish
School Enrollment in Jefferson Parish
The most common levels of schooling among the 98,286 students in Jefferson Parish are middle school (21,485 | 21.9%), high school (21,453 | 21.8%), and elementary school (21,355 | 21.7%).
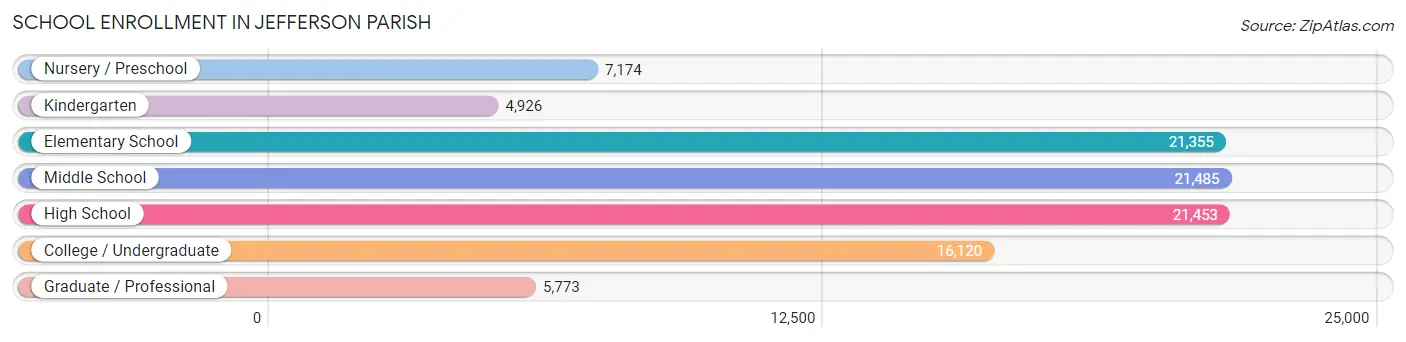
| School Level | # Students | % Students |
| Nursery / Preschool | 7,174 | 7.3% |
| Kindergarten | 4,926 | 5.0% |
| Elementary School | 21,355 | 21.7% |
| Middle School | 21,485 | 21.9% |
| High School | 21,453 | 21.8% |
| College / Undergraduate | 16,120 | 16.4% |
| Graduate / Professional | 5,773 | 5.9% |
| Total | 98,286 | 100.0% |
School Enrollment by Age by Funding Source in Jefferson Parish
Out of a total of 98,286 students who are enrolled in schools in Jefferson Parish, 30,862 (31.4%) attend a private institution, while the remaining 67,424 (68.6%) are enrolled in public schools. The age group of 3 to 4 year olds has the highest likelihood of being enrolled in private schools, with 2,564 (42.4% in the age bracket) enrolled. Conversely, the age group of 20 to 24 year olds has the lowest likelihood of being enrolled in a private school, with 5,709 (74.4% in the age bracket) attending a public institution.
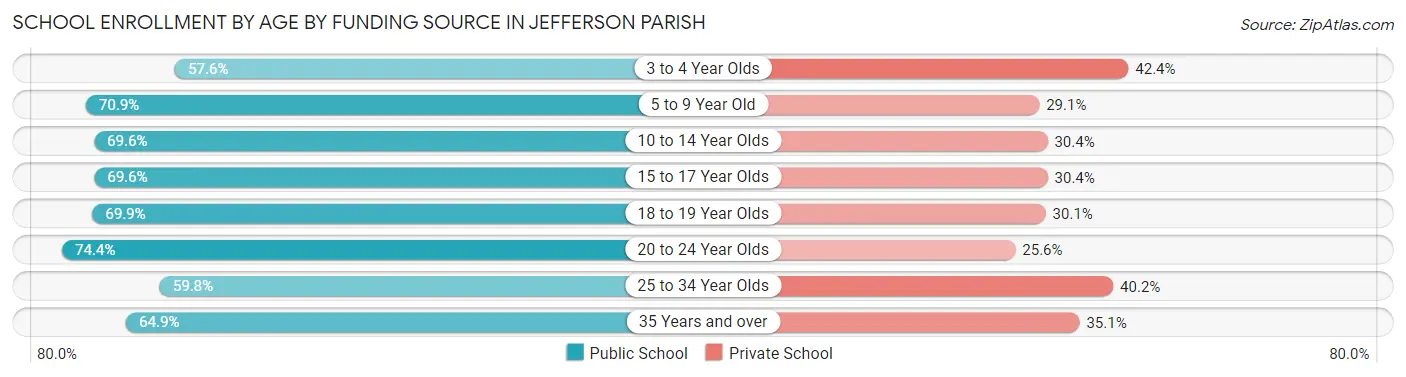
| Age Bracket | Public School | Private School |
| 3 to 4 Year Olds | 3,481 (57.6%) | 2,564 (42.4%) |
| 5 to 9 Year Old | 17,800 (70.9%) | 7,320 (29.1%) |
| 10 to 14 Year Olds | 18,241 (69.6%) | 7,955 (30.4%) |
| 15 to 17 Year Olds | 10,478 (69.6%) | 4,574 (30.4%) |
| 18 to 19 Year Olds | 4,036 (69.9%) | 1,738 (30.1%) |
| 20 to 24 Year Olds | 5,709 (74.4%) | 1,962 (25.6%) |
| 25 to 34 Year Olds | 4,167 (59.8%) | 2,797 (40.2%) |
| 35 Years and over | 3,544 (64.9%) | 1,920 (35.1%) |
| Total | 67,424 (68.6%) | 30,862 (31.4%) |
Educational Attainment by Field of Study in Jefferson Parish
Business (22,157 | 22.9%), science & technology (10,935 | 11.3%), education (10,888 | 11.3%), engineering (7,329 | 7.6%), and liberal arts & history (6,046 | 6.2%) are the most common fields of study among 96,722 individuals in Jefferson Parish who have obtained a bachelor's degree or higher.
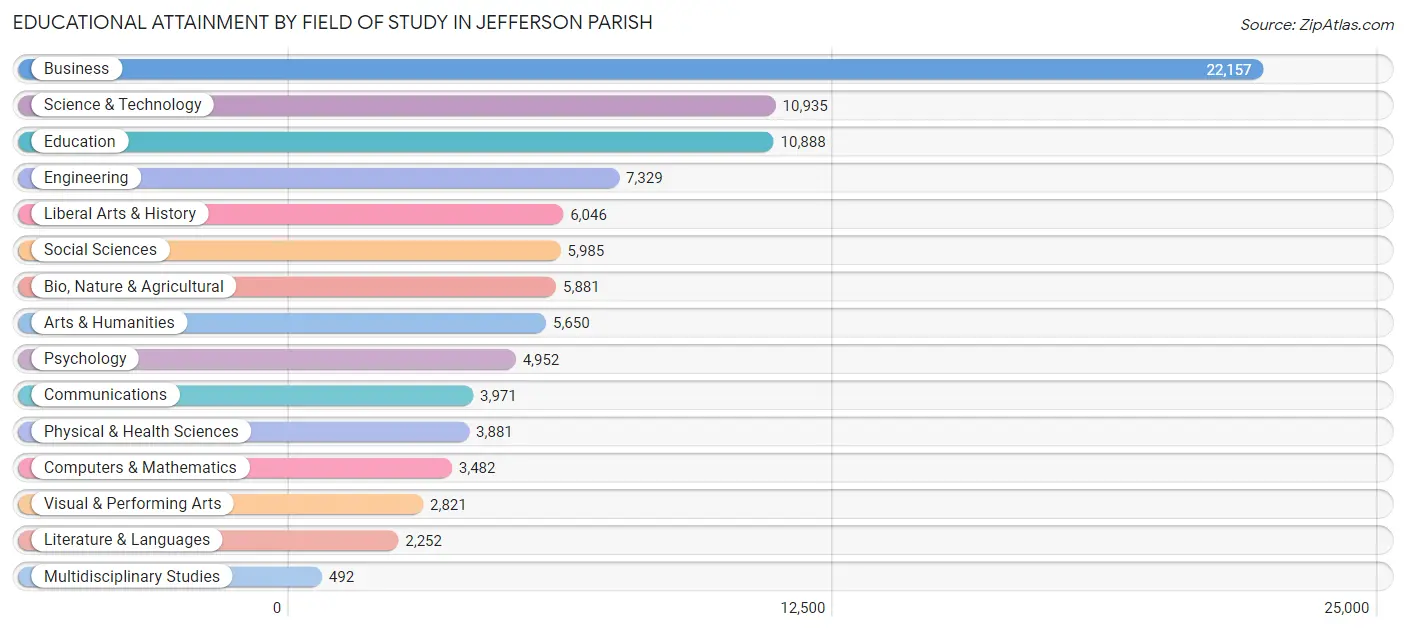
| Field of Study | # Graduates | % Graduates |
| Computers & Mathematics | 3,482 | 3.6% |
| Bio, Nature & Agricultural | 5,881 | 6.1% |
| Physical & Health Sciences | 3,881 | 4.0% |
| Psychology | 4,952 | 5.1% |
| Social Sciences | 5,985 | 6.2% |
| Engineering | 7,329 | 7.6% |
| Multidisciplinary Studies | 492 | 0.5% |
| Science & Technology | 10,935 | 11.3% |
| Business | 22,157 | 22.9% |
| Education | 10,888 | 11.3% |
| Literature & Languages | 2,252 | 2.3% |
| Liberal Arts & History | 6,046 | 6.2% |
| Visual & Performing Arts | 2,821 | 2.9% |
| Communications | 3,971 | 4.1% |
| Arts & Humanities | 5,650 | 5.8% |
| Total | 96,722 | 100.0% |
Transportation & Commute in Jefferson Parish
Vehicle Availability by Sex in Jefferson Parish
The most prevalent vehicle ownership categories in Jefferson Parish are males with 2 vehicles (48,279, accounting for 45.9%) and females with 2 vehicles (41,370, making up 48.9%).
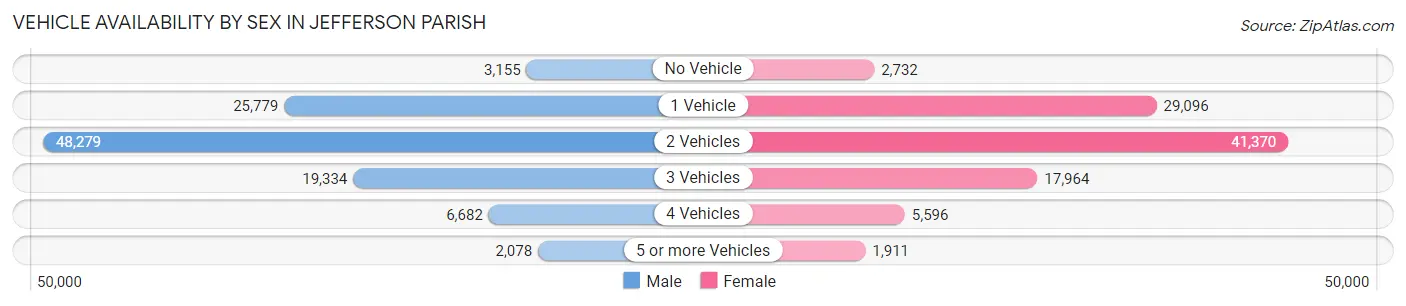
| Vehicles Available | Male | Female |
| No Vehicle | 3,155 (3.0%) | 2,732 (2.8%) |
| 1 Vehicle | 25,779 (24.5%) | 29,096 (29.5%) |
| 2 Vehicles | 48,279 (45.9%) | 41,370 (41.9%) |
| 3 Vehicles | 19,334 (18.4%) | 17,964 (18.2%) |
| 4 Vehicles | 6,682 (6.4%) | 5,596 (5.7%) |
| 5 or more Vehicles | 2,078 (2.0%) | 1,911 (1.9%) |
| Total | 105,307 (100.0%) | 98,669 (100.0%) |
Commute Time in Jefferson Parish
The most frequently occuring commute durations in Jefferson Parish are 15 to 19 minutes (36,708 commuters, 19.2%), 20 to 24 minutes (33,716 commuters, 17.6%), and 30 to 34 minutes (32,824 commuters, 17.2%).
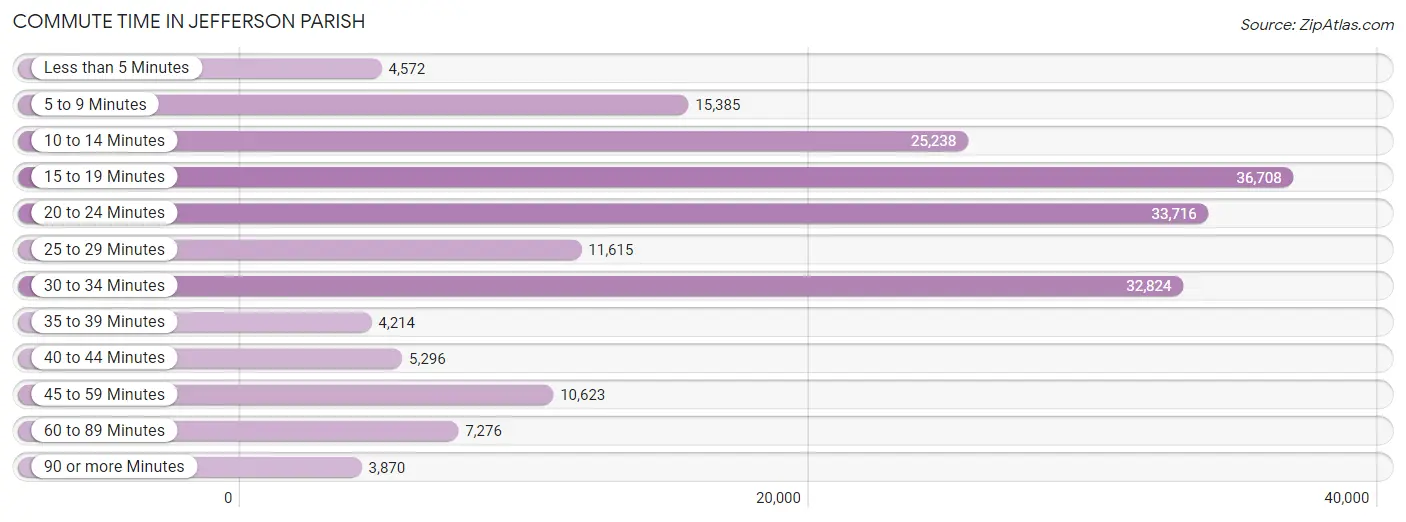
| Commute Time | # Commuters | % Commuters |
| Less than 5 Minutes | 4,572 | 2.4% |
| 5 to 9 Minutes | 15,385 | 8.0% |
| 10 to 14 Minutes | 25,238 | 13.2% |
| 15 to 19 Minutes | 36,708 | 19.2% |
| 20 to 24 Minutes | 33,716 | 17.6% |
| 25 to 29 Minutes | 11,615 | 6.1% |
| 30 to 34 Minutes | 32,824 | 17.2% |
| 35 to 39 Minutes | 4,214 | 2.2% |
| 40 to 44 Minutes | 5,296 | 2.8% |
| 45 to 59 Minutes | 10,623 | 5.6% |
| 60 to 89 Minutes | 7,276 | 3.8% |
| 90 or more Minutes | 3,870 | 2.0% |
Commute Time by Sex in Jefferson Parish
The most common commute times in Jefferson Parish are 30 to 34 minutes (18,696 commuters, 18.7%) for males and 15 to 19 minutes (19,178 commuters, 20.9%) for females.
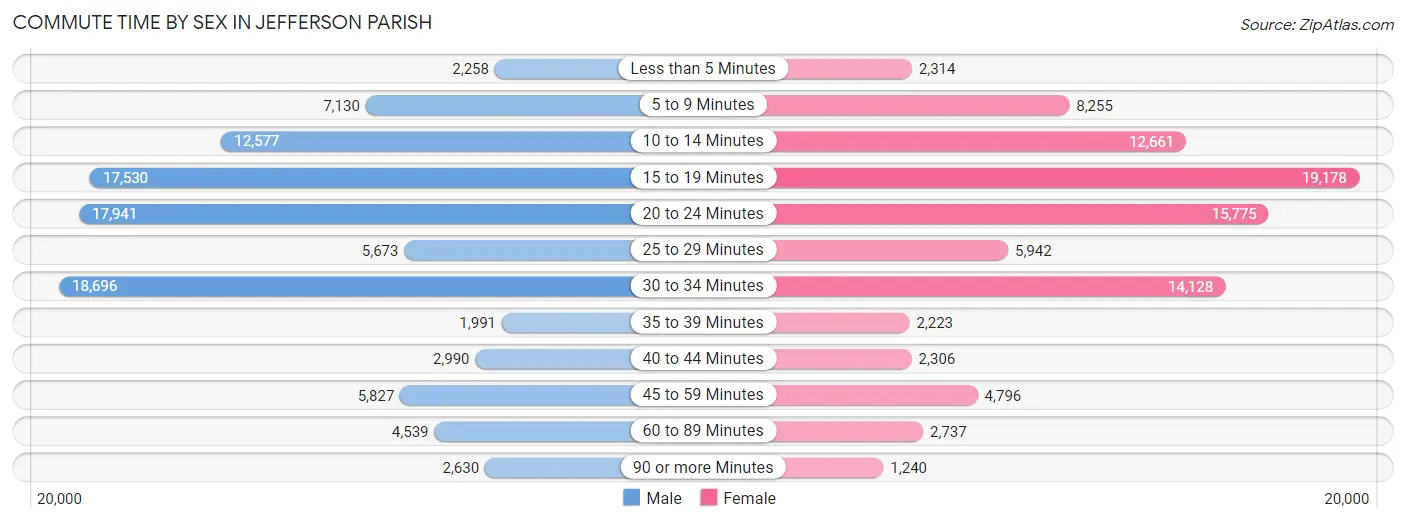
| Commute Time | Male | Female |
| Less than 5 Minutes | 2,258 (2.3%) | 2,314 (2.5%) |
| 5 to 9 Minutes | 7,130 (7.1%) | 8,255 (9.0%) |
| 10 to 14 Minutes | 12,577 (12.6%) | 12,661 (13.8%) |
| 15 to 19 Minutes | 17,530 (17.6%) | 19,178 (20.9%) |
| 20 to 24 Minutes | 17,941 (18.0%) | 15,775 (17.2%) |
| 25 to 29 Minutes | 5,673 (5.7%) | 5,942 (6.5%) |
| 30 to 34 Minutes | 18,696 (18.7%) | 14,128 (15.4%) |
| 35 to 39 Minutes | 1,991 (2.0%) | 2,223 (2.4%) |
| 40 to 44 Minutes | 2,990 (3.0%) | 2,306 (2.5%) |
| 45 to 59 Minutes | 5,827 (5.8%) | 4,796 (5.2%) |
| 60 to 89 Minutes | 4,539 (4.5%) | 2,737 (3.0%) |
| 90 or more Minutes | 2,630 (2.6%) | 1,240 (1.3%) |
Time of Departure to Work by Sex in Jefferson Parish
The most frequent times of departure to work in Jefferson Parish are 7:00 AM to 7:29 AM (13,256, 13.3%) for males and 7:00 AM to 7:29 AM (15,150, 16.6%) for females.
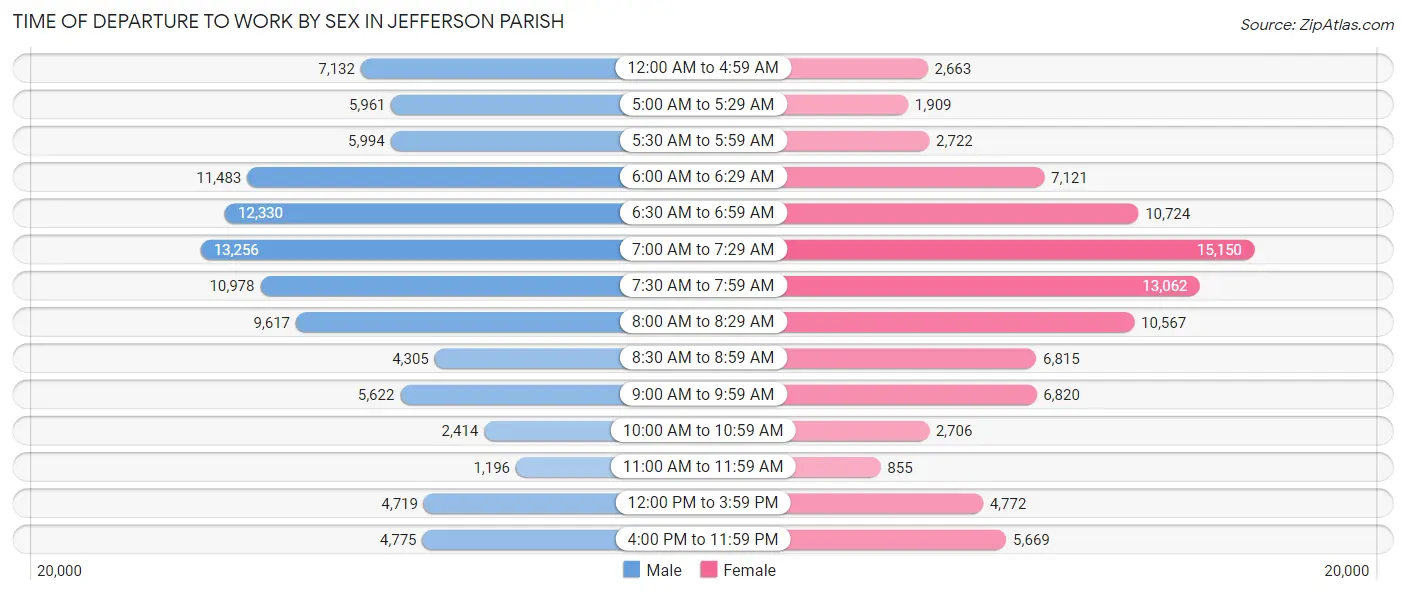
| Time of Departure | Male | Female |
| 12:00 AM to 4:59 AM | 7,132 (7.1%) | 2,663 (2.9%) |
| 5:00 AM to 5:29 AM | 5,961 (6.0%) | 1,909 (2.1%) |
| 5:30 AM to 5:59 AM | 5,994 (6.0%) | 2,722 (3.0%) |
| 6:00 AM to 6:29 AM | 11,483 (11.5%) | 7,121 (7.8%) |
| 6:30 AM to 6:59 AM | 12,330 (12.4%) | 10,724 (11.7%) |
| 7:00 AM to 7:29 AM | 13,256 (13.3%) | 15,150 (16.6%) |
| 7:30 AM to 7:59 AM | 10,978 (11.0%) | 13,062 (14.3%) |
| 8:00 AM to 8:29 AM | 9,617 (9.6%) | 10,567 (11.5%) |
| 8:30 AM to 8:59 AM | 4,305 (4.3%) | 6,815 (7.4%) |
| 9:00 AM to 9:59 AM | 5,622 (5.6%) | 6,820 (7.4%) |
| 10:00 AM to 10:59 AM | 2,414 (2.4%) | 2,706 (3.0%) |
| 11:00 AM to 11:59 AM | 1,196 (1.2%) | 855 (0.9%) |
| 12:00 PM to 3:59 PM | 4,719 (4.7%) | 4,772 (5.2%) |
| 4:00 PM to 11:59 PM | 4,775 (4.8%) | 5,669 (6.2%) |
| Total | 99,782 (100.0%) | 91,555 (100.0%) |
Housing Occupancy in Jefferson Parish
Occupancy by Ownership in Jefferson Parish
Of the total 176,165 dwellings in Jefferson Parish, owner-occupied units account for 110,430 (62.7%), while renter-occupied units make up 65,735 (37.3%).
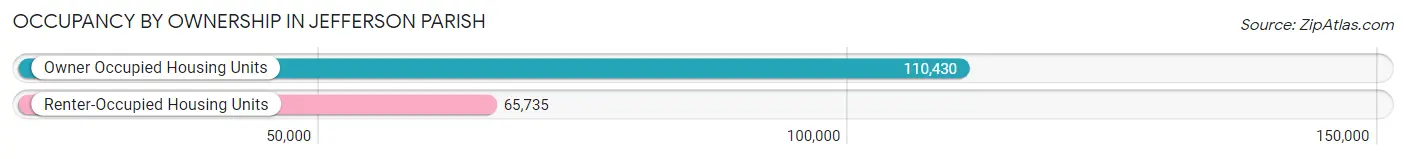
| Occupancy | # Housing Units | % Housing Units |
| Owner Occupied Housing Units | 110,430 | 62.7% |
| Renter-Occupied Housing Units | 65,735 | 37.3% |
| Total Occupied Housing Units | 176,165 | 100.0% |
Occupancy by Household Size in Jefferson Parish
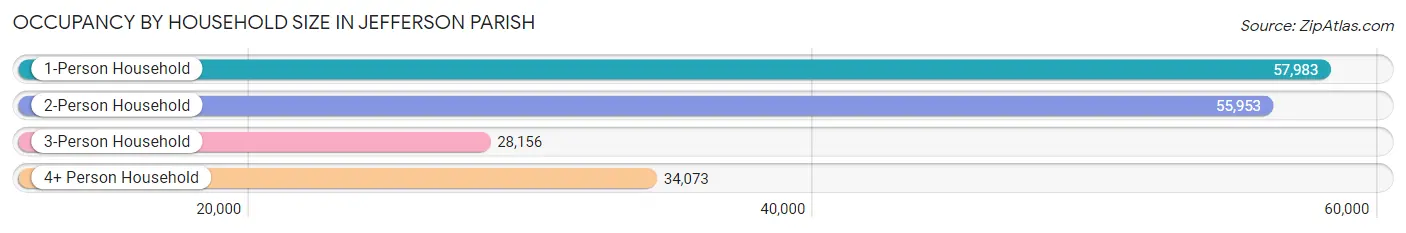
| Household Size | # Housing Units | % Housing Units |
| 1-Person Household | 57,983 | 32.9% |
| 2-Person Household | 55,953 | 31.8% |
| 3-Person Household | 28,156 | 16.0% |
| 4+ Person Household | 34,073 | 19.3% |
| Total Housing Units | 176,165 | 100.0% |
Occupancy by Ownership by Household Size in Jefferson Parish
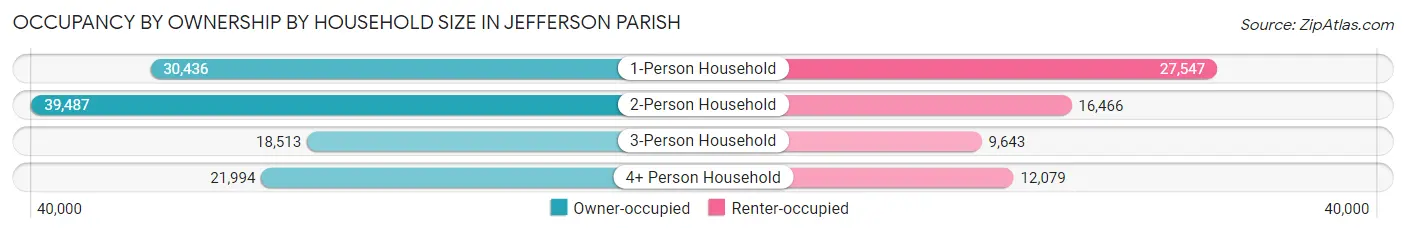
| Household Size | Owner-occupied | Renter-occupied |
| 1-Person Household | 30,436 (52.5%) | 27,547 (47.5%) |
| 2-Person Household | 39,487 (70.6%) | 16,466 (29.4%) |
| 3-Person Household | 18,513 (65.7%) | 9,643 (34.3%) |
| 4+ Person Household | 21,994 (64.5%) | 12,079 (35.4%) |
| Total Housing Units | 110,430 (62.7%) | 65,735 (37.3%) |
Occupancy by Educational Attainment in Jefferson Parish
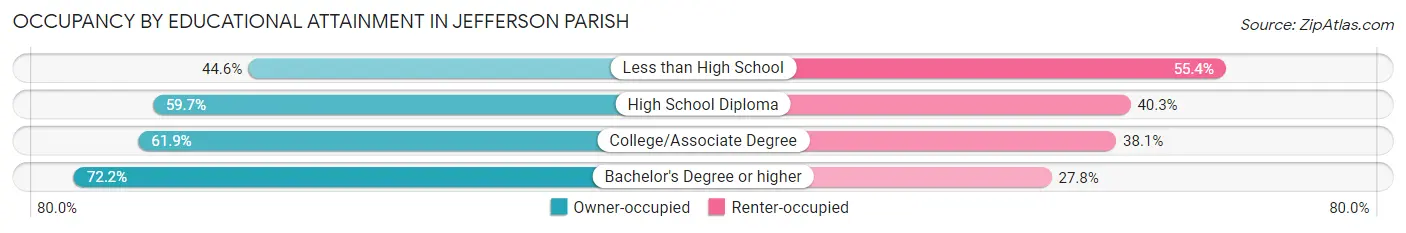
| Household Size | Owner-occupied | Renter-occupied |
| Less than High School | 8,665 (44.6%) | 10,780 (55.4%) |
| High School Diploma | 27,657 (59.7%) | 18,694 (40.3%) |
| College/Associate Degree | 33,610 (61.9%) | 20,653 (38.1%) |
| Bachelor's Degree or higher | 40,498 (72.2%) | 15,608 (27.8%) |
Occupancy by Age of Householder in Jefferson Parish
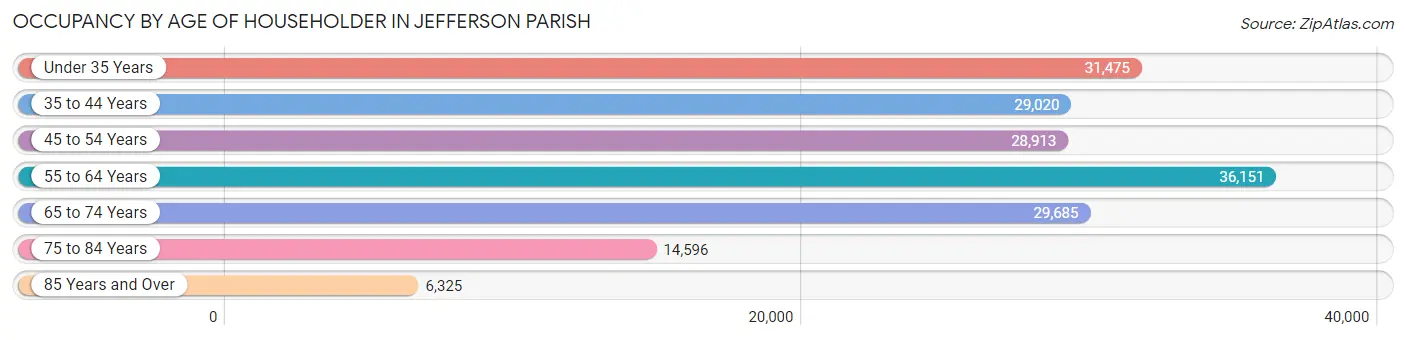
| Age Bracket | # Households | % Households |
| Under 35 Years | 31,475 | 17.9% |
| 35 to 44 Years | 29,020 | 16.5% |
| 45 to 54 Years | 28,913 | 16.4% |
| 55 to 64 Years | 36,151 | 20.5% |
| 65 to 74 Years | 29,685 | 16.9% |
| 75 to 84 Years | 14,596 | 8.3% |
| 85 Years and Over | 6,325 | 3.6% |
| Total | 176,165 | 100.0% |
Housing Finances in Jefferson Parish
Median Income by Occupancy in Jefferson Parish
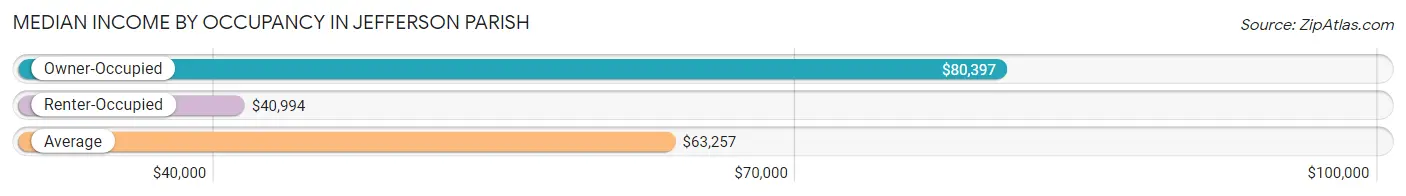
| Occupancy Type | # Households | Median Income |
| Owner-Occupied | 110,430 (62.7%) | $80,397 |
| Renter-Occupied | 65,735 (37.3%) | $40,994 |
| Average | 176,165 (100.0%) | $63,257 |
Occupancy by Householder Income Bracket in Jefferson Parish
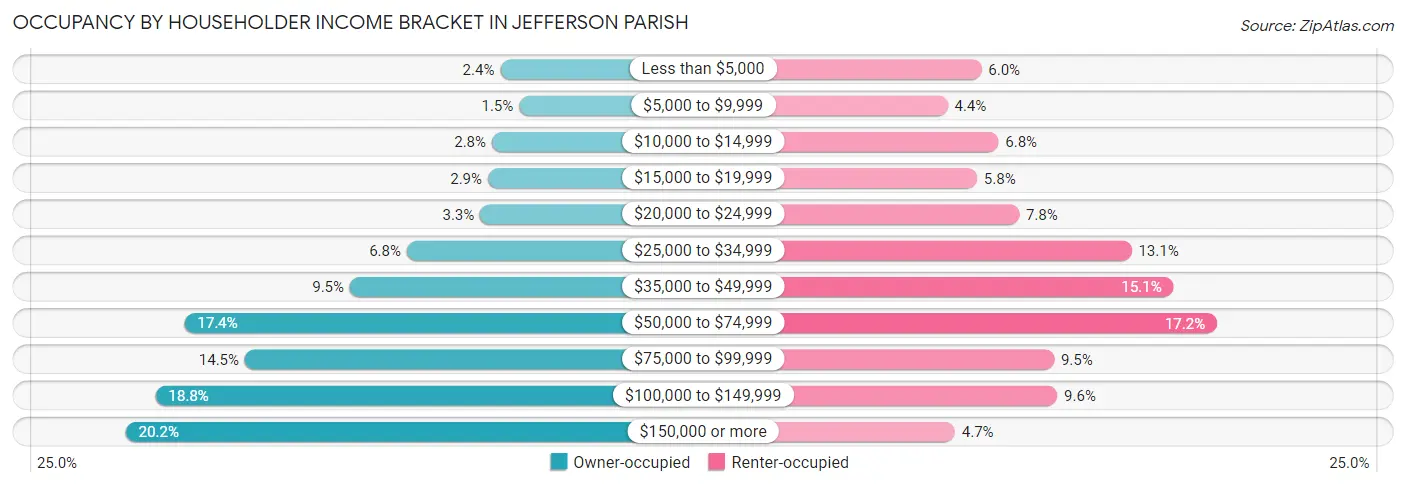
| Income Bracket | Owner-occupied | Renter-occupied |
| Less than $5,000 | 2,597 (2.4%) | 3,935 (6.0%) |
| $5,000 to $9,999 | 1,602 (1.5%) | 2,880 (4.4%) |
| $10,000 to $14,999 | 3,040 (2.8%) | 4,472 (6.8%) |
| $15,000 to $19,999 | 3,252 (2.9%) | 3,797 (5.8%) |
| $20,000 to $24,999 | 3,659 (3.3%) | 5,114 (7.8%) |
| $25,000 to $34,999 | 7,512 (6.8%) | 8,639 (13.1%) |
| $35,000 to $49,999 | 10,500 (9.5%) | 9,949 (15.1%) |
| $50,000 to $74,999 | 19,207 (17.4%) | 11,314 (17.2%) |
| $75,000 to $99,999 | 16,028 (14.5%) | 6,214 (9.5%) |
| $100,000 to $149,999 | 20,732 (18.8%) | 6,309 (9.6%) |
| $150,000 or more | 22,301 (20.2%) | 3,112 (4.7%) |
| Total | 110,430 (100.0%) | 65,735 (100.0%) |
Monthly Housing Cost Tiers in Jefferson Parish
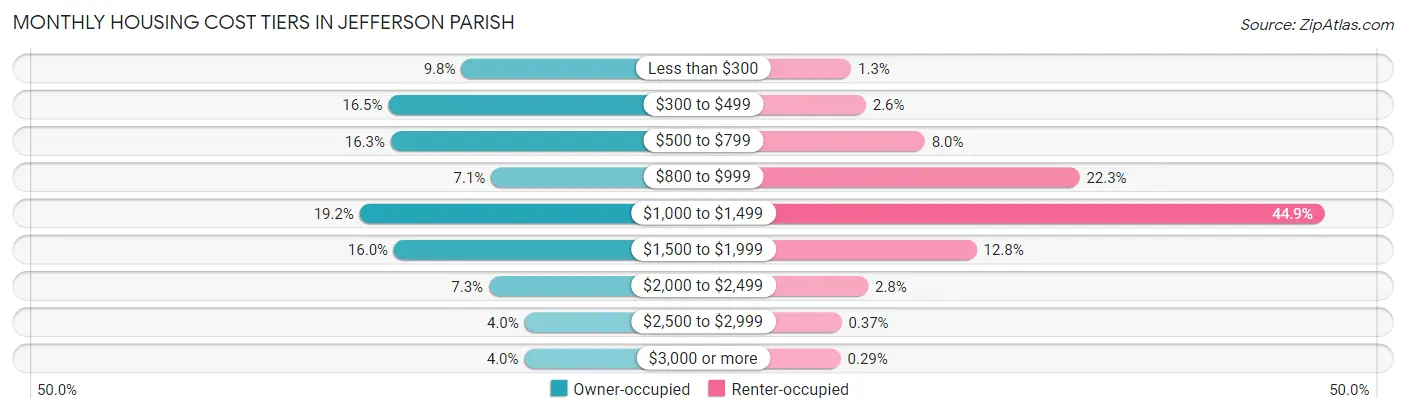
| Monthly Cost | Owner-occupied | Renter-occupied |
| Less than $300 | 10,821 (9.8%) | 830 (1.3%) |
| $300 to $499 | 18,243 (16.5%) | 1,713 (2.6%) |
| $500 to $799 | 17,975 (16.3%) | 5,287 (8.0%) |
| $800 to $999 | 7,782 (7.0%) | 14,647 (22.3%) |
| $1,000 to $1,499 | 21,144 (19.2%) | 29,485 (44.9%) |
| $1,500 to $1,999 | 17,665 (16.0%) | 8,422 (12.8%) |
| $2,000 to $2,499 | 8,008 (7.2%) | 1,851 (2.8%) |
| $2,500 to $2,999 | 4,381 (4.0%) | 243 (0.4%) |
| $3,000 or more | 4,411 (4.0%) | 189 (0.3%) |
| Total | 110,430 (100.0%) | 65,735 (100.0%) |
Physical Housing Characteristics in Jefferson Parish
Housing Structures in Jefferson Parish
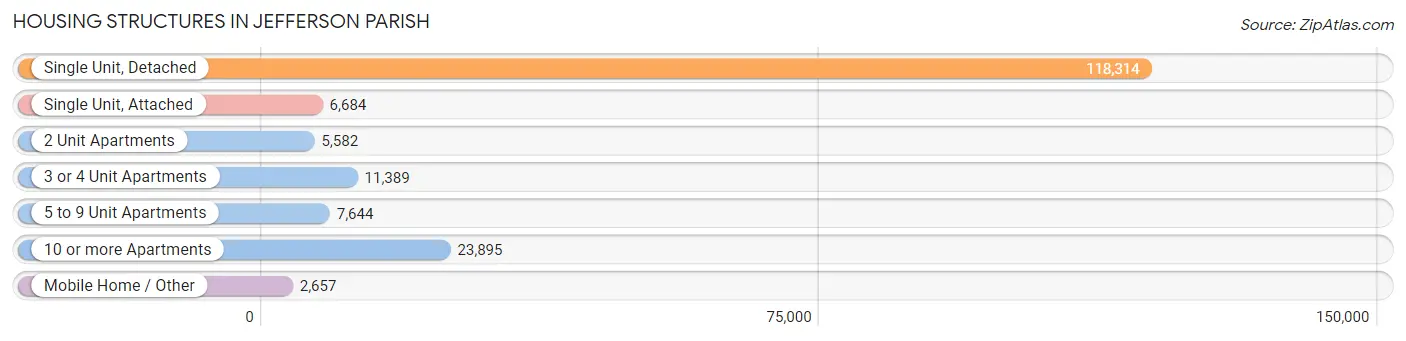
| Structure Type | # Housing Units | % Housing Units |
| Single Unit, Detached | 118,314 | 67.2% |
| Single Unit, Attached | 6,684 | 3.8% |
| 2 Unit Apartments | 5,582 | 3.2% |
| 3 or 4 Unit Apartments | 11,389 | 6.5% |
| 5 to 9 Unit Apartments | 7,644 | 4.3% |
| 10 or more Apartments | 23,895 | 13.6% |
| Mobile Home / Other | 2,657 | 1.5% |
| Total | 176,165 | 100.0% |
Housing Structures by Occupancy in Jefferson Parish
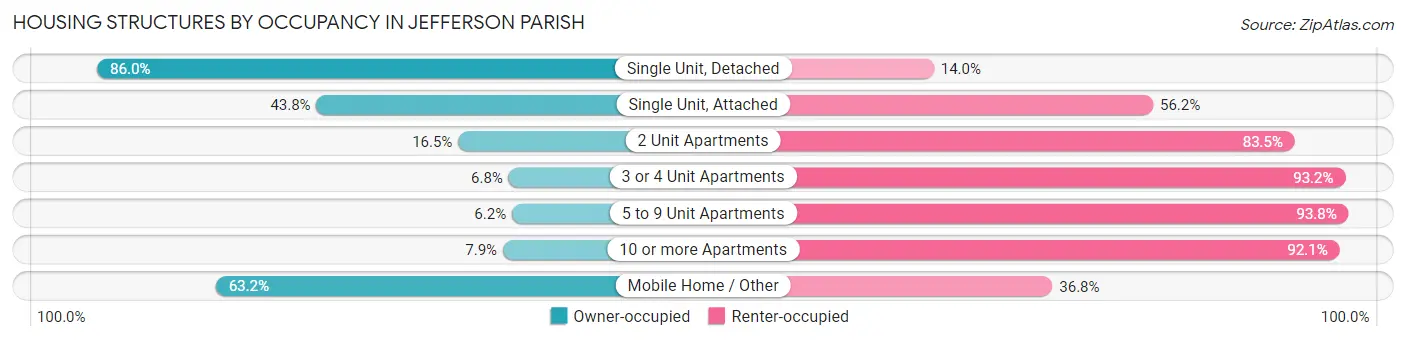
| Structure Type | Owner-occupied | Renter-occupied |
| Single Unit, Detached | 101,768 (86.0%) | 16,546 (14.0%) |
| Single Unit, Attached | 2,928 (43.8%) | 3,756 (56.2%) |
| 2 Unit Apartments | 922 (16.5%) | 4,660 (83.5%) |
| 3 or 4 Unit Apartments | 774 (6.8%) | 10,615 (93.2%) |
| 5 to 9 Unit Apartments | 471 (6.2%) | 7,173 (93.8%) |
| 10 or more Apartments | 1,888 (7.9%) | 22,007 (92.1%) |
| Mobile Home / Other | 1,679 (63.2%) | 978 (36.8%) |
| Total | 110,430 (62.7%) | 65,735 (37.3%) |
Housing Structures by Number of Rooms in Jefferson Parish
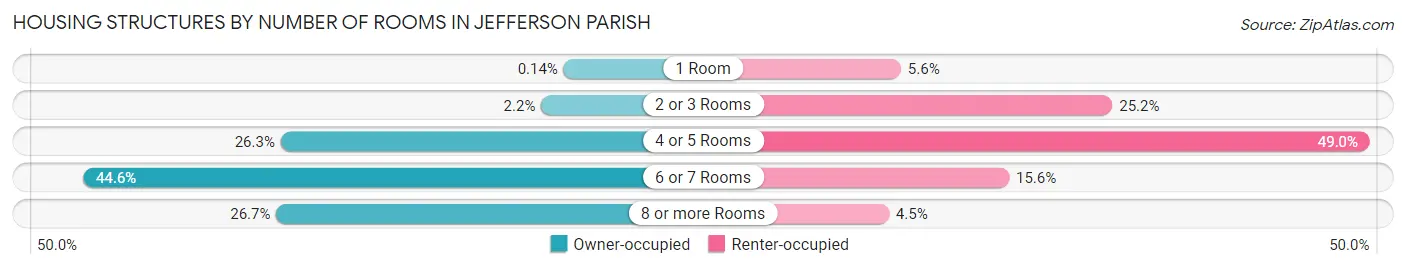
| Number of Rooms | Owner-occupied | Renter-occupied |
| 1 Room | 159 (0.1%) | 3,706 (5.6%) |
| 2 or 3 Rooms | 2,456 (2.2%) | 16,559 (25.2%) |
| 4 or 5 Rooms | 29,056 (26.3%) | 32,215 (49.0%) |
| 6 or 7 Rooms | 49,254 (44.6%) | 10,280 (15.6%) |
| 8 or more Rooms | 29,505 (26.7%) | 2,975 (4.5%) |
| Total | 110,430 (100.0%) | 65,735 (100.0%) |
Housing Structure by Heating Type in Jefferson Parish
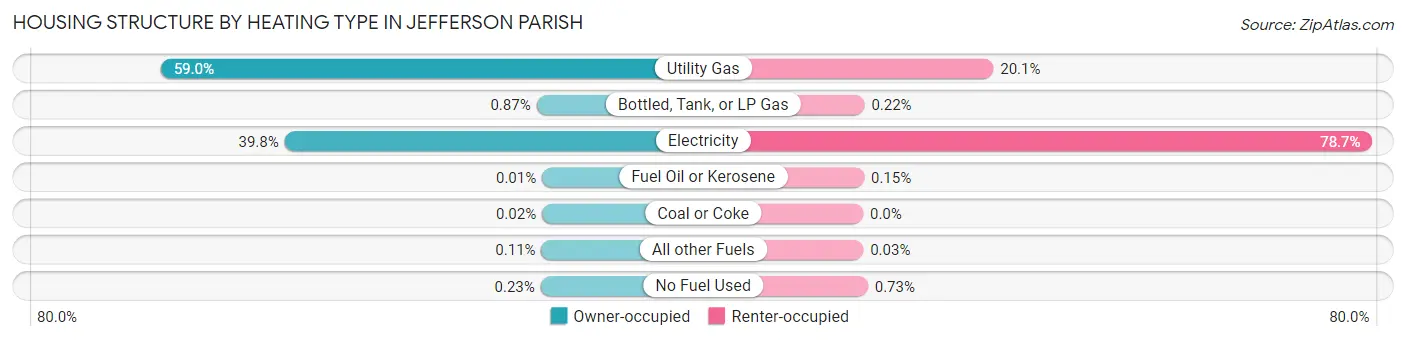
| Heating Type | Owner-occupied | Renter-occupied |
| Utility Gas | 65,102 (59.0%) | 13,240 (20.1%) |
| Bottled, Tank, or LP Gas | 963 (0.9%) | 146 (0.2%) |
| Electricity | 43,960 (39.8%) | 51,749 (78.7%) |
| Fuel Oil or Kerosene | 16 (0.0%) | 98 (0.2%) |
| Coal or Coke | 21 (0.0%) | 0 (0.0%) |
| All other Fuels | 119 (0.1%) | 21 (0.0%) |
| No Fuel Used | 249 (0.2%) | 481 (0.7%) |
| Total | 110,430 (100.0%) | 65,735 (100.0%) |
Household Vehicle Usage in Jefferson Parish
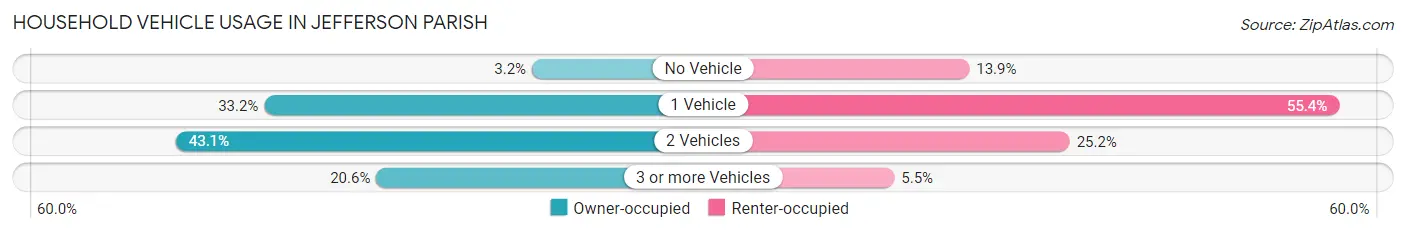
| Vehicles per Household | Owner-occupied | Renter-occupied |
| No Vehicle | 3,506 (3.2%) | 9,157 (13.9%) |
| 1 Vehicle | 36,624 (33.2%) | 36,384 (55.3%) |
| 2 Vehicles | 47,542 (43.0%) | 16,553 (25.2%) |
| 3 or more Vehicles | 22,758 (20.6%) | 3,641 (5.5%) |
| Total | 110,430 (100.0%) | 65,735 (100.0%) |
Real Estate & Mortgages in Jefferson Parish
Real Estate and Mortgage Overview in Jefferson Parish
| Characteristic | Without Mortgage | With Mortgage |
| Housing Units | 52,188 | 58,242 |
| Median Property Value | $218,200 | $242,800 |
| Median Household Income | $65,078 | $14,185 |
| Monthly Housing Costs | $472 | $4,306 |
| Real Estate Taxes | $898 | $3,857 |
Property Value by Mortgage Status in Jefferson Parish
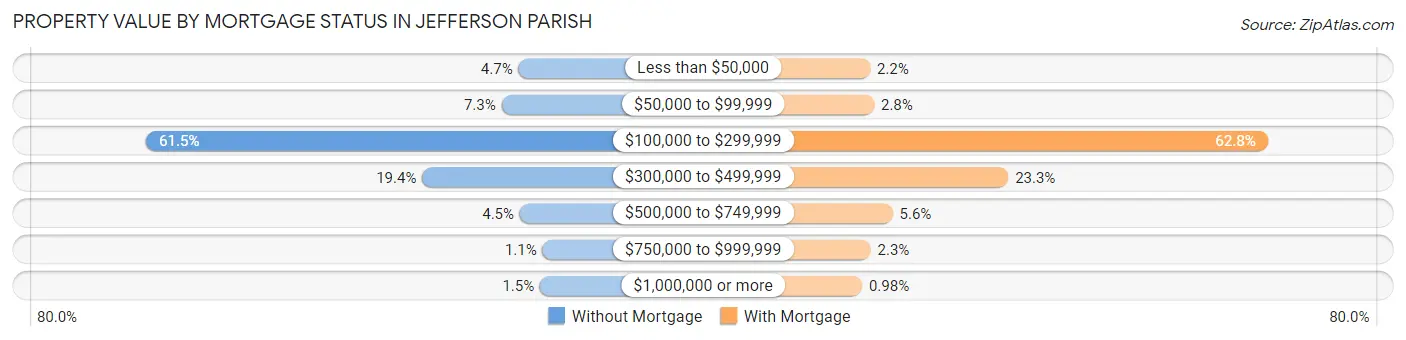
| Property Value | Without Mortgage | With Mortgage |
| Less than $50,000 | 2,473 (4.7%) | 1,280 (2.2%) |
| $50,000 to $99,999 | 3,822 (7.3%) | 1,644 (2.8%) |
| $100,000 to $299,999 | 32,087 (61.5%) | 36,573 (62.8%) |
| $300,000 to $499,999 | 10,131 (19.4%) | 13,550 (23.3%) |
| $500,000 to $749,999 | 2,362 (4.5%) | 3,287 (5.6%) |
| $750,000 to $999,999 | 556 (1.1%) | 1,339 (2.3%) |
| $1,000,000 or more | 757 (1.5%) | 569 (1.0%) |
| Total | 52,188 (100.0%) | 58,242 (100.0%) |
Household Income by Mortgage Status in Jefferson Parish
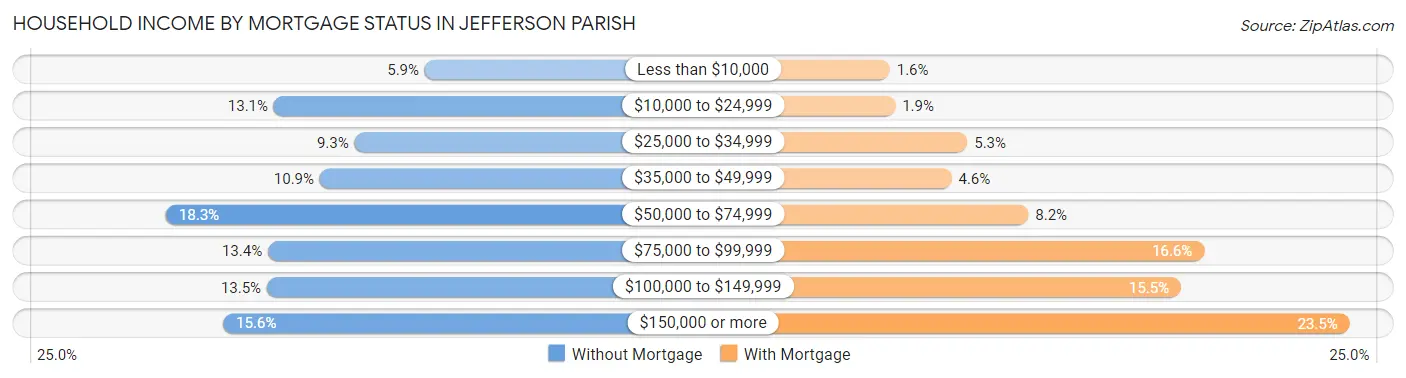
| Household Income | Without Mortgage | With Mortgage |
| Less than $10,000 | 3,101 (5.9%) | 947 (1.6%) |
| $10,000 to $24,999 | 6,851 (13.1%) | 1,098 (1.9%) |
| $25,000 to $34,999 | 4,848 (9.3%) | 3,100 (5.3%) |
| $35,000 to $49,999 | 5,707 (10.9%) | 2,664 (4.6%) |
| $50,000 to $74,999 | 9,537 (18.3%) | 4,793 (8.2%) |
| $75,000 to $99,999 | 7,001 (13.4%) | 9,670 (16.6%) |
| $100,000 to $149,999 | 7,027 (13.5%) | 9,027 (15.5%) |
| $150,000 or more | 8,116 (15.5%) | 13,705 (23.5%) |
| Total | 52,188 (100.0%) | 58,242 (100.0%) |
Property Value to Household Income Ratio in Jefferson Parish
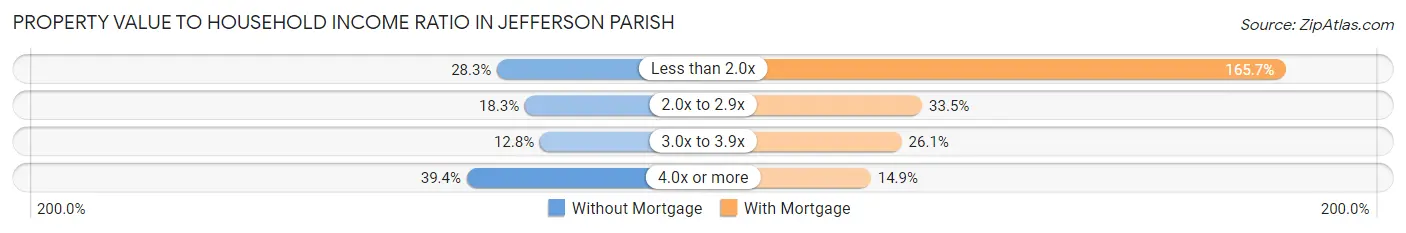
| Value-to-Income Ratio | Without Mortgage | With Mortgage |
| Less than 2.0x | 14,789 (28.3%) | 96,479 (165.7%) |
| 2.0x to 2.9x | 9,526 (18.2%) | 19,514 (33.5%) |
| 3.0x to 3.9x | 6,678 (12.8%) | 15,180 (26.1%) |
| 4.0x or more | 20,550 (39.4%) | 8,656 (14.9%) |
| Total | 52,188 (100.0%) | 58,242 (100.0%) |
Real Estate Taxes by Mortgage Status in Jefferson Parish
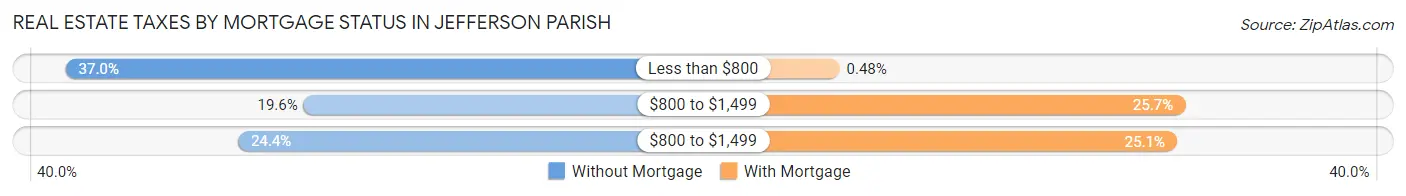
| Property Taxes | Without Mortgage | With Mortgage |
| Less than $800 | 19,308 (37.0%) | 279 (0.5%) |
| $800 to $1,499 | 10,237 (19.6%) | 14,981 (25.7%) |
| $800 to $1,499 | 12,737 (24.4%) | 14,630 (25.1%) |
| Total | 52,188 (100.0%) | 58,242 (100.0%) |
Health & Disability in Jefferson Parish
Health Insurance Coverage by Age in Jefferson Parish
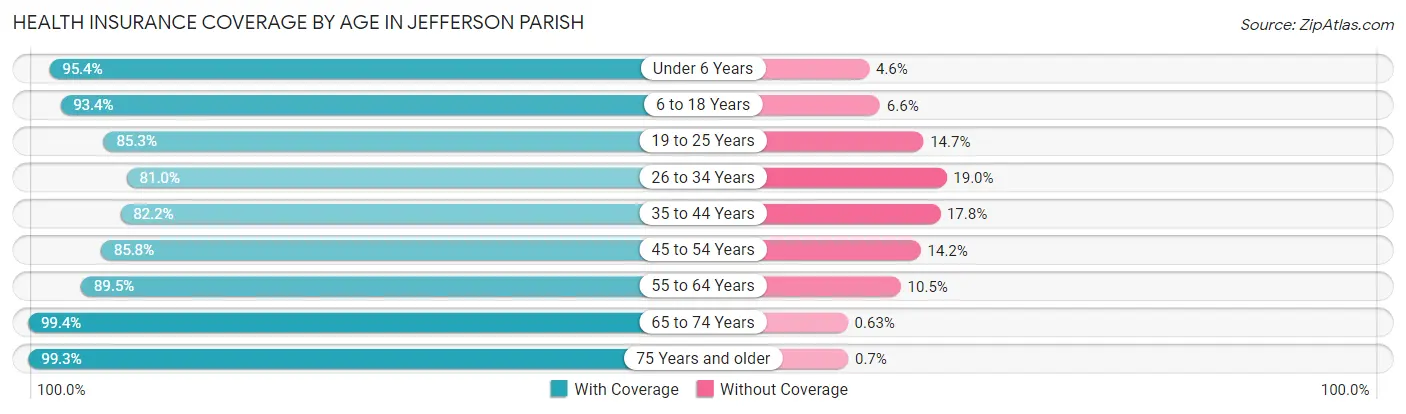
| Age Bracket | With Coverage | Without Coverage |
| Under 6 Years | 30,579 (95.4%) | 1,479 (4.6%) |
| 6 to 18 Years | 64,265 (93.4%) | 4,573 (6.6%) |
| 19 to 25 Years | 28,079 (85.3%) | 4,847 (14.7%) |
| 26 to 34 Years | 44,193 (81.0%) | 10,384 (19.0%) |
| 35 to 44 Years | 45,445 (82.2%) | 9,868 (17.8%) |
| 45 to 54 Years | 44,691 (85.8%) | 7,416 (14.2%) |
| 55 to 64 Years | 53,678 (89.5%) | 6,307 (10.5%) |
| 65 to 74 Years | 45,928 (99.4%) | 293 (0.6%) |
| 75 Years and older | 30,147 (99.3%) | 211 (0.7%) |
| Total | 387,005 (89.5%) | 45,378 (10.5%) |
Health Insurance Coverage by Citizenship Status in Jefferson Parish
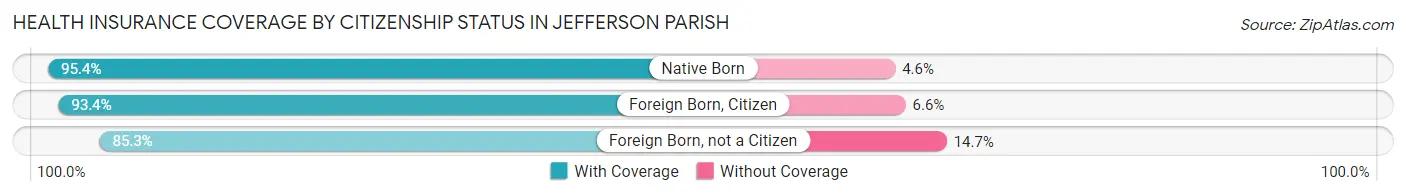
| Citizenship Status | With Coverage | Without Coverage |
| Native Born | 30,579 (95.4%) | 1,479 (4.6%) |
| Foreign Born, Citizen | 64,265 (93.4%) | 4,573 (6.6%) |
| Foreign Born, not a Citizen | 28,079 (85.3%) | 4,847 (14.7%) |
Health Insurance Coverage by Household Income in Jefferson Parish
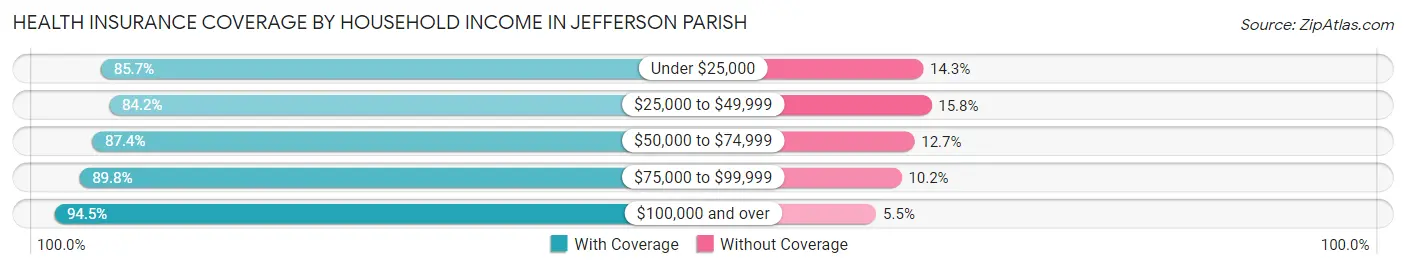
| Household Income | With Coverage | Without Coverage |
| Under $25,000 | 52,734 (85.7%) | 8,783 (14.3%) |
| $25,000 to $49,999 | 66,611 (84.2%) | 12,525 (15.8%) |
| $50,000 to $74,999 | 64,499 (87.4%) | 9,338 (12.7%) |
| $75,000 to $99,999 | 52,050 (89.8%) | 5,936 (10.2%) |
| $100,000 and over | 150,486 (94.5%) | 8,757 (5.5%) |
Public vs Private Health Insurance Coverage by Age in Jefferson Parish
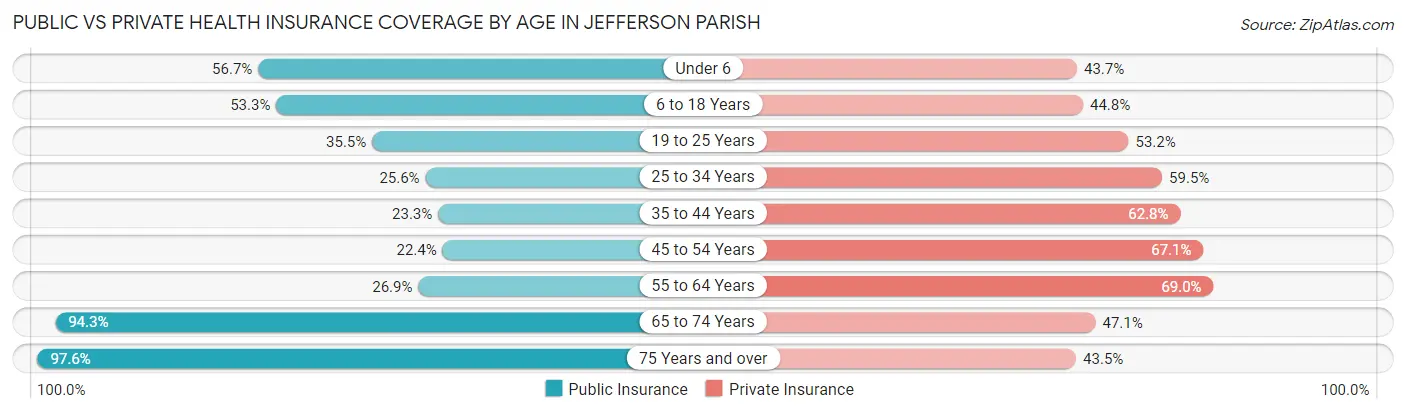
| Age Bracket | Public Insurance | Private Insurance |
| Under 6 | 18,160 (56.7%) | 13,996 (43.7%) |
| 6 to 18 Years | 36,683 (53.3%) | 30,827 (44.8%) |
| 19 to 25 Years | 11,688 (35.5%) | 17,527 (53.2%) |
| 25 to 34 Years | 13,973 (25.6%) | 32,449 (59.5%) |
| 35 to 44 Years | 12,863 (23.3%) | 34,757 (62.8%) |
| 45 to 54 Years | 11,680 (22.4%) | 34,968 (67.1%) |
| 55 to 64 Years | 16,155 (26.9%) | 41,376 (69.0%) |
| 65 to 74 Years | 43,590 (94.3%) | 21,768 (47.1%) |
| 75 Years and over | 29,631 (97.6%) | 13,205 (43.5%) |
| Total | 194,423 (45.0%) | 240,873 (55.7%) |
Disability Status by Sex by Age in Jefferson Parish
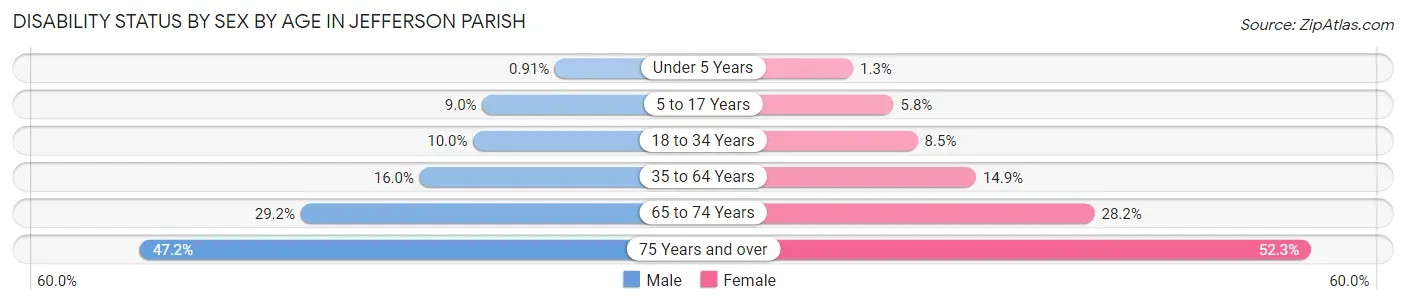
| Age Bracket | Male | Female |
| Under 5 Years | 128 (0.9%) | 168 (1.3%) |
| 5 to 17 Years | 3,160 (9.0%) | 1,945 (5.8%) |
| 18 to 34 Years | 4,534 (10.0%) | 3,976 (8.5%) |
| 35 to 64 Years | 13,075 (16.0%) | 12,798 (14.9%) |
| 65 to 74 Years | 6,298 (29.2%) | 6,950 (28.1%) |
| 75 Years and over | 5,754 (47.2%) | 9,488 (52.3%) |
Disability Class by Sex by Age in Jefferson Parish
Disability Class: Hearing Difficulty
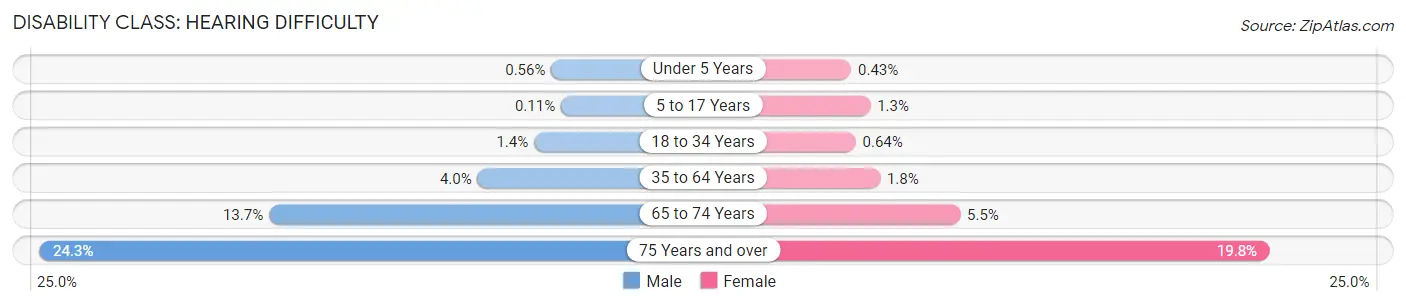
| Age Bracket | Male | Female |
| Under 5 Years | 78 (0.6%) | 57 (0.4%) |
| 5 to 17 Years | 39 (0.1%) | 444 (1.3%) |
| 18 to 34 Years | 613 (1.4%) | 302 (0.6%) |
| 35 to 64 Years | 3,254 (4.0%) | 1,512 (1.8%) |
| 65 to 74 Years | 2,941 (13.7%) | 1,356 (5.5%) |
| 75 Years and over | 2,963 (24.3%) | 3,598 (19.8%) |
Disability Class: Vision Difficulty
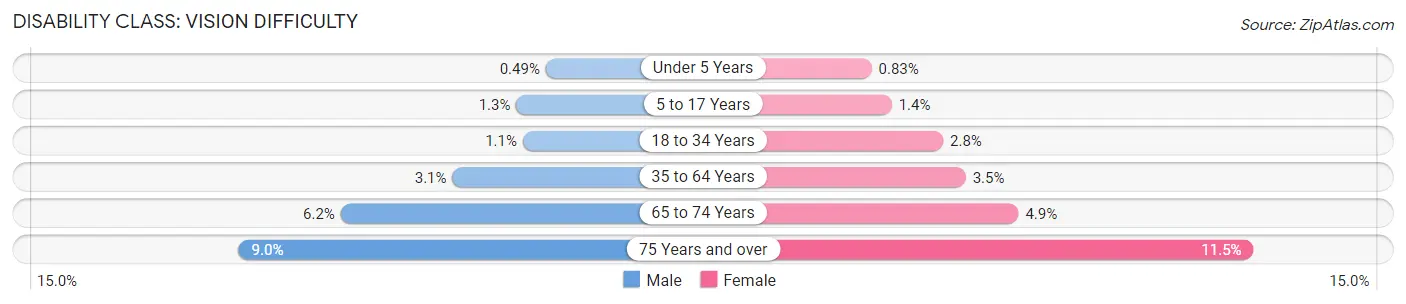
| Age Bracket | Male | Female |
| Under 5 Years | 69 (0.5%) | 111 (0.8%) |
| 5 to 17 Years | 459 (1.3%) | 469 (1.4%) |
| 18 to 34 Years | 511 (1.1%) | 1,329 (2.8%) |
| 35 to 64 Years | 2,526 (3.1%) | 2,951 (3.5%) |
| 65 to 74 Years | 1,336 (6.2%) | 1,214 (4.9%) |
| 75 Years and over | 1,103 (9.0%) | 2,080 (11.5%) |
Disability Class: Cognitive Difficulty
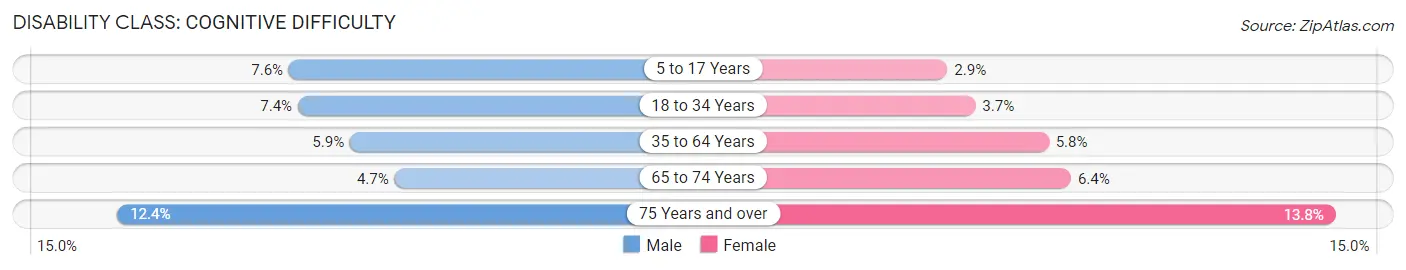
| Age Bracket | Male | Female |
| 5 to 17 Years | 2,681 (7.6%) | 991 (2.9%) |
| 18 to 34 Years | 3,337 (7.4%) | 1,751 (3.7%) |
| 35 to 64 Years | 4,859 (5.9%) | 4,930 (5.8%) |
| 65 to 74 Years | 1,013 (4.7%) | 1,575 (6.4%) |
| 75 Years and over | 1,515 (12.4%) | 2,497 (13.8%) |
Disability Class: Ambulatory Difficulty
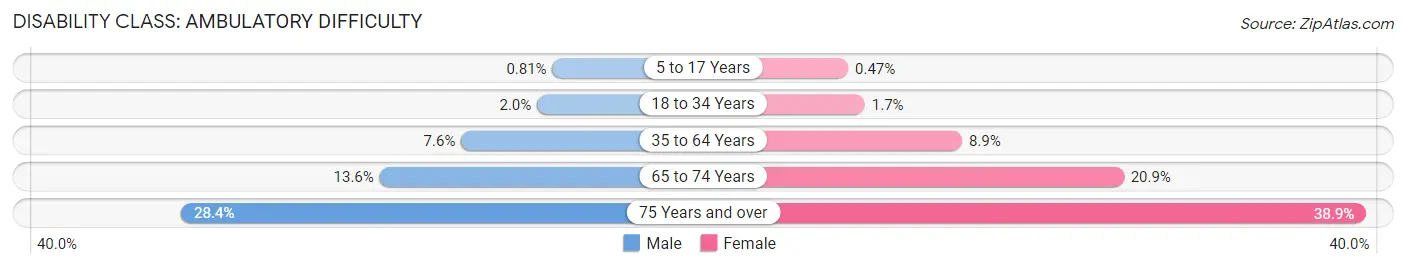
| Age Bracket | Male | Female |
| 5 to 17 Years | 283 (0.8%) | 157 (0.5%) |
| 18 to 34 Years | 879 (1.9%) | 804 (1.7%) |
| 35 to 64 Years | 6,198 (7.6%) | 7,636 (8.9%) |
| 65 to 74 Years | 2,937 (13.6%) | 5,166 (20.9%) |
| 75 Years and over | 3,463 (28.4%) | 7,069 (38.9%) |
Disability Class: Self-Care Difficulty
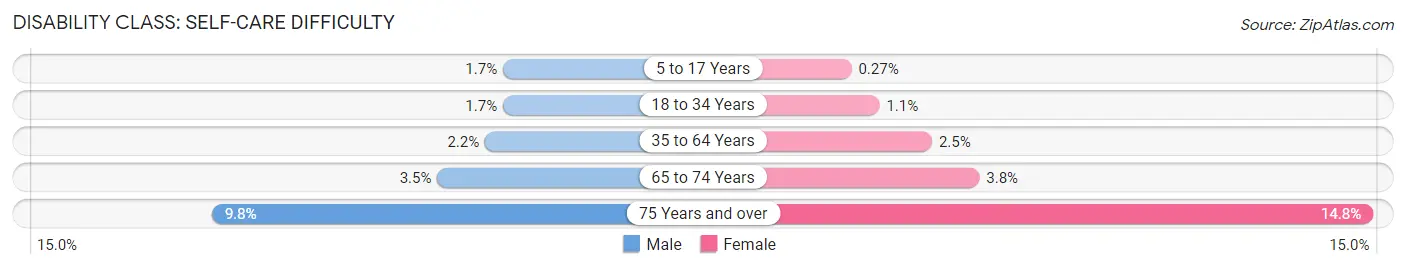
| Age Bracket | Male | Female |
| 5 to 17 Years | 589 (1.7%) | 92 (0.3%) |
| 18 to 34 Years | 757 (1.7%) | 494 (1.1%) |
| 35 to 64 Years | 1,786 (2.2%) | 2,147 (2.5%) |
| 65 to 74 Years | 756 (3.5%) | 945 (3.8%) |
| 75 Years and over | 1,194 (9.8%) | 2,685 (14.8%) |
Technology Access in Jefferson Parish
Computing Device Access in Jefferson Parish
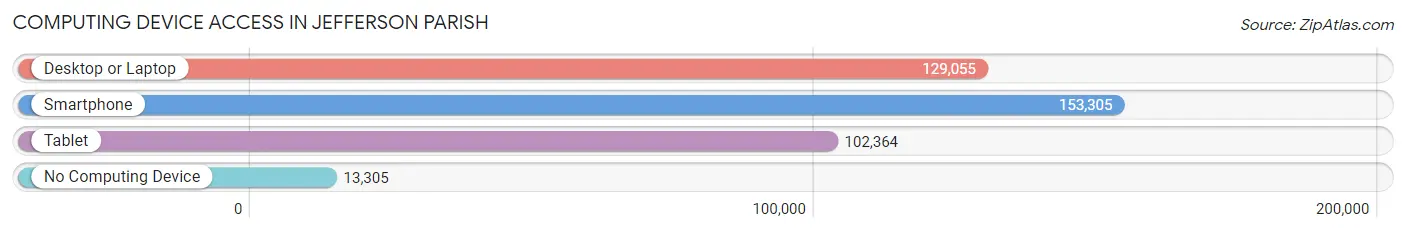
| Device Type | # Households | % Households |
| Desktop or Laptop | 129,055 | 73.3% |
| Smartphone | 153,305 | 87.0% |
| Tablet | 102,364 | 58.1% |
| No Computing Device | 13,305 | 7.5% |
| Total | 176,165 | 100.0% |
Internet Access in Jefferson Parish
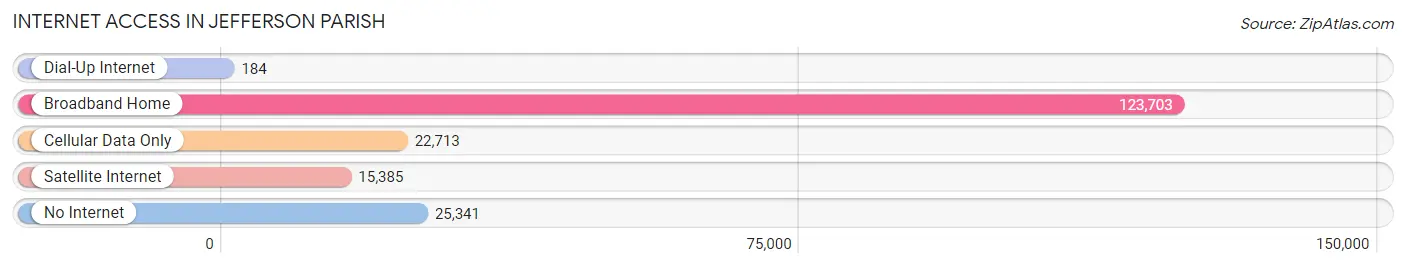
| Internet Type | # Households | % Households |
| Dial-Up Internet | 184 | 0.1% |
| Broadband Home | 123,703 | 70.2% |
| Cellular Data Only | 22,713 | 12.9% |
| Satellite Internet | 15,385 | 8.7% |
| No Internet | 25,341 | 14.4% |
| Total | 176,165 | 100.0% |
Jefferson Parish Summary
Jefferson Parish, Louisiana is a vibrant and diverse community located in the Greater New Orleans metropolitan area. It is the second most populous parish in Louisiana, with a population of 437,186 as of the 2010 census. The parish is bordered by Orleans Parish to the east, St. Charles Parish to the west, St. John the Baptist Parish to the north, and Plaquemines Parish to the south.
Geography
Jefferson Parish is located in southeastern Louisiana, along the Mississippi River Delta. It is situated between Lake Pontchartrain to the north and the Gulf of Mexico to the south. The parish is divided into two distinct regions: the East Bank and the West Bank. The East Bank is located on the east side of the Mississippi River and is home to the majority of the parish’s population. The West Bank is located on the west side of the river and is largely rural.
The parish is home to a variety of landscapes, from the wetlands of the Mississippi River Delta to the rolling hills of the West Bank. The parish is also home to several bodies of water, including Lake Pontchartrain, the Rigolets, and the Intracoastal Waterway.
History
Jefferson Parish was established in 1825, when the Louisiana Legislature divided Orleans Parish into two parishes. The parish was named after Thomas Jefferson, the third President of the United States.
In the 19th century, Jefferson Parish was largely rural and agricultural. The parish was home to a variety of crops, including sugar cane, cotton, and rice. The parish also had a thriving fishing industry, with oysters, shrimp, and crabs being harvested from the waters of Lake Pontchartrain and the Mississippi River.
In the 20th century, Jefferson Parish experienced rapid growth and development. The parish became a popular destination for tourists, with the opening of the Pontchartrain Beach amusement park in the 1930s. The parish also became a major industrial center, with the opening of the Avondale Shipyard in the 1940s.
Economy
Jefferson Parish has a diverse economy, with a variety of industries providing employment opportunities. The largest employers in the parish are the Avondale Shipyard, the Port of New Orleans, and the Louisiana State University Health Sciences Center.
The parish is also home to a number of major corporations, including Entergy, Ochsner Health System, and the Louisiana Department of Transportation and Development.
The parish is also home to a thriving tourism industry, with visitors coming to the area to enjoy the beaches, restaurants, and attractions of the Greater New Orleans area.
Demographics
As of the 2010 census, Jefferson Parish had a population of 437,186. The population is racially diverse, with the largest racial group being White (63.3%), followed by African American (30.2%), Hispanic (3.7%), and Asian (2.2%).
The median household income in the parish is $50,845, and the median age is 38.7 years. The parish is home to a variety of religious denominations, with the largest being Catholic (44.3%), followed by Baptist (17.2%), and Methodist (7.2%).
Conclusion
Jefferson Parish is a vibrant and diverse community located in the Greater New Orleans metropolitan area. It is home to a variety of landscapes, from the wetlands of the Mississippi River Delta to the rolling hills of the West Bank. The parish has a diverse economy, with a variety of industries providing employment opportunities. The population is racially diverse, with the largest racial group being White. Jefferson Parish is a great place to live, work, and play.
Common Questions
What is the Total Population of Jefferson Parish?
Total Population of Jefferson Parish is 436,171.
What is the Total Male Population of Jefferson Parish?
Total Male Population of Jefferson Parish is 212,244.
What is the Total Female Population of Jefferson Parish?
Total Female Population of Jefferson Parish is 223,927.
What is the Ratio of Males per 100 Females in Jefferson Parish?
There are 94.78 Males per 100 Females in Jefferson Parish.
What is the Ratio of Females per 100 Males in Jefferson Parish?
There are 105.50 Females per 100 Males in Jefferson Parish.
What is the Median Population Age in Jefferson Parish?
Median Population Age in Jefferson Parish is 39.8 Years.
What is the Average Family Size in Jefferson Parish
Average Family Size in Jefferson Parish is 3.1 People.
What is the Average Household Size in Jefferson Parish
Average Household Size in Jefferson Parish is 2.5 People.
What is Per Capita Income in Jefferson Parish?
Per Capita income in Jefferson Parish is $35,720.
What is the Median Family Income in Jefferson Parish?
Median Family Income in Jefferson Parish is $79,749.
What is the Median Household income in Jefferson Parish?
Median Household Income in Jefferson Parish is $63,257.
What is Income or Wage Gap in Jefferson Parish?
Income or Wage Gap in Jefferson Parish is 24.4%.
Women in Jefferson Parish earn 75.6 cents for every dollar earned by a man.
What is Family Income Deficit in Jefferson Parish?
Family Income Deficit in Jefferson Parish is $10,163.
Families that are below poverty line in Jefferson Parish earn $10,163 less on average than the poverty threshold level.
What is Inequality or Gini Index in Jefferson Parish?
Inequality or Gini Index in Jefferson Parish is 0.48.
How Large is the Labor Force in Jefferson Parish?
There are 222,617 People in the Labor Forcein in Jefferson Parish.
What is the Percentage of People in the Labor Force in Jefferson Parish?
63.5% of People are in the Labor Force in Jefferson Parish.
What is the Unemployment Rate in Jefferson Parish?
Unemployment Rate in Jefferson Parish is 6.0%.