Jackson Parish, LA
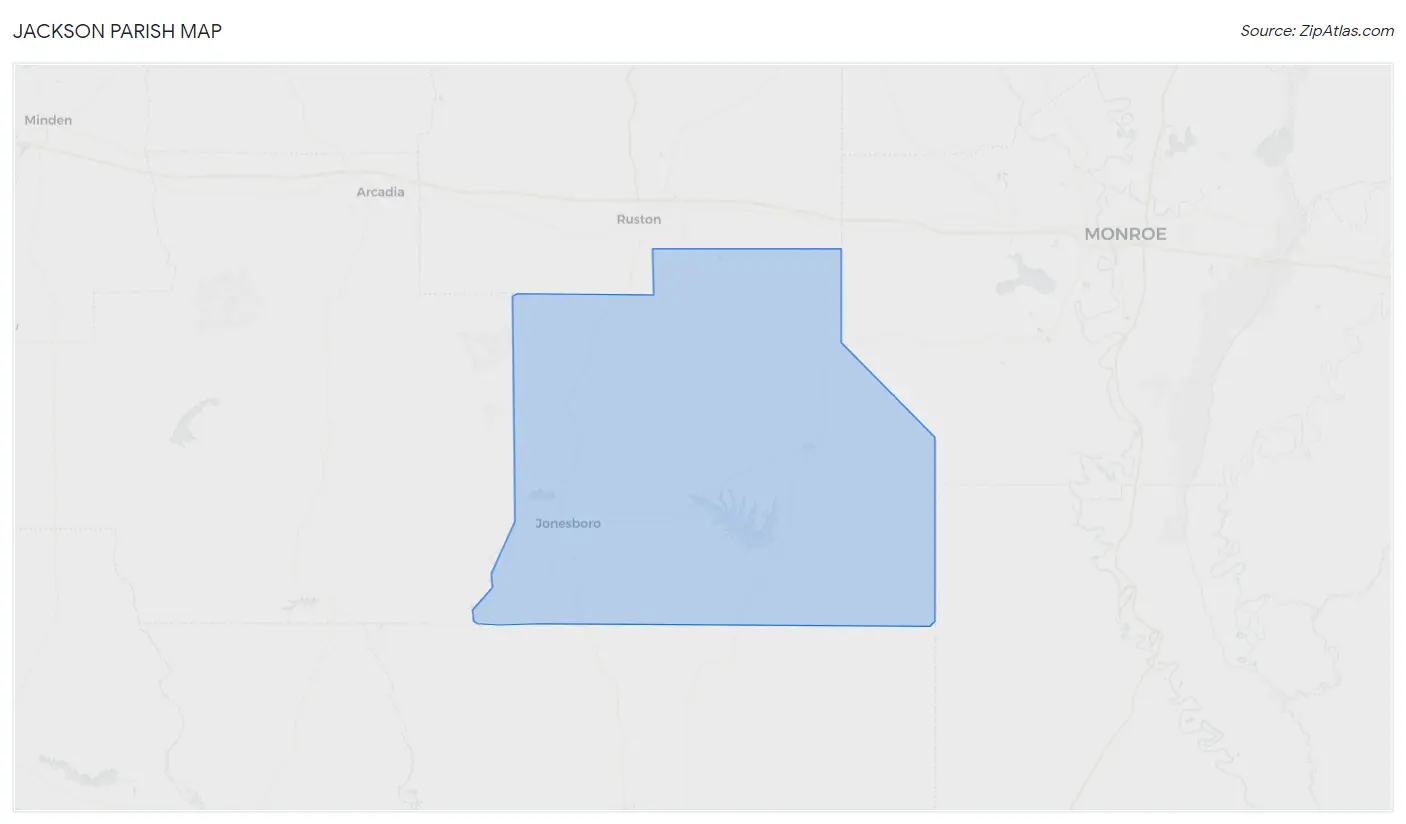
Jackson Parish Map
Jackson Parish Overview
15,093
TOTAL POPULATION
7,624
MALE POPULATION
7,469
FEMALE POPULATION
102.08
MALES / 100 FEMALES
97.97
FEMALES / 100 MALES
41.4
MEDIAN AGE
3.3
AVG FAMILY SIZE
2.6
AVG HOUSEHOLD SIZE
$22,804
PER CAPITA INCOME
$52,285
AVG FAMILY INCOME
$40,406
AVG HOUSEHOLD INCOME
42.3%
WAGE / INCOME GAP [ % ]
57.7¢/ $1
WAGE / INCOME GAP [ $ ]
$10,649
FAMILY INCOME DEFICIT
0.46
INEQUALITY / GINI INDEX
5,187
LABOR FORCE [ PEOPLE ]
42.6%
PERCENT IN LABOR FORCE
4.9%
UNEMPLOYMENT RATE
Jackson Parish Area Codes
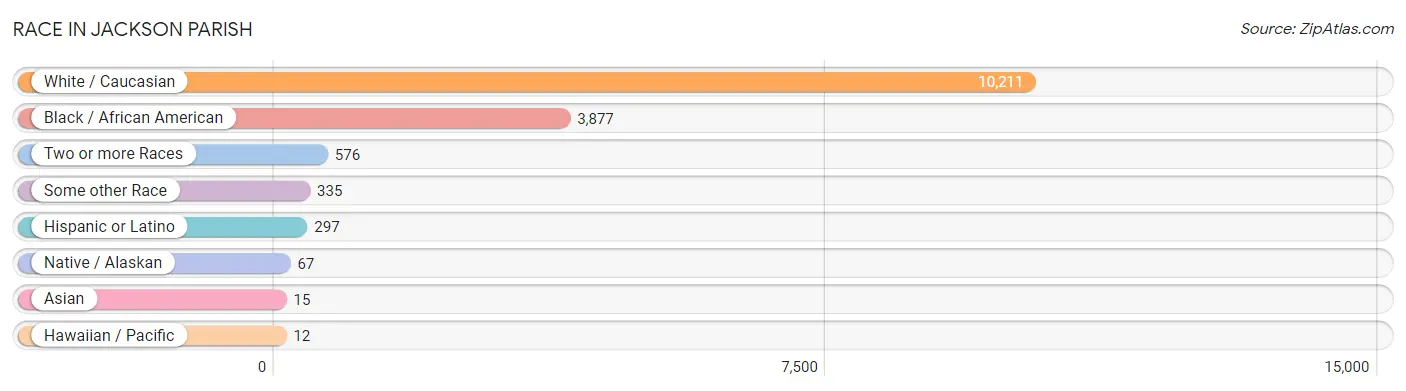
Race in Jackson Parish
The most populous races in Jackson Parish are White / Caucasian (10,211 | 67.6%), Black / African American (3,877 | 25.7%), and Two or more Races (576 | 3.8%).
| Race | # Population | % Population |
| Asian | 15 | 0.1% |
| Black / African American | 3,877 | 25.7% |
| Hawaiian / Pacific | 12 | 0.1% |
| Hispanic or Latino | 297 | 2.0% |
| Native / Alaskan | 67 | 0.4% |
| White / Caucasian | 10,211 | 67.6% |
| Two or more Races | 576 | 3.8% |
| Some other Race | 335 | 2.2% |
| Total | 15,093 | 100.0% |
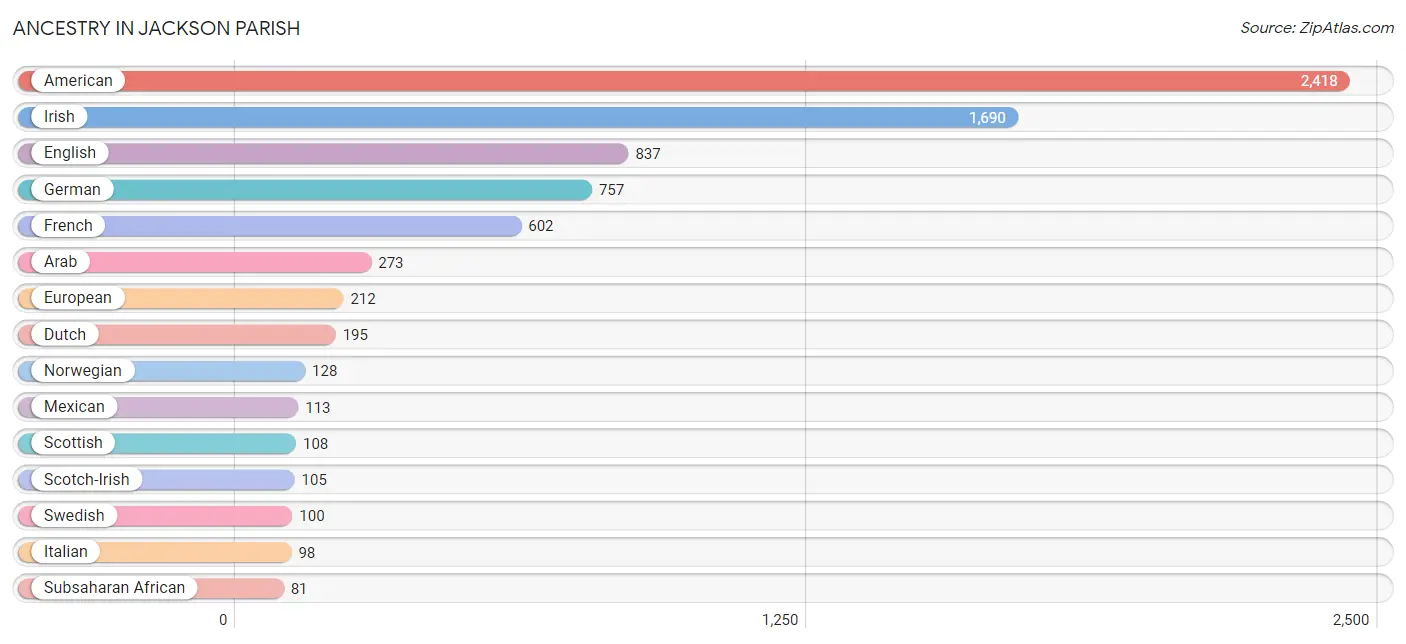
Ancestry in Jackson Parish
The most populous ancestries reported in Jackson Parish are American (2,418 | 16.0%), Irish (1,690 | 11.2%), English (837 | 5.6%), German (757 | 5.0%), and French (602 | 4.0%), together accounting for 41.8% of all Jackson Parish residents.
| Ancestry | # Population | % Population |
| African | 73 | 0.5% |
| American | 2,418 | 16.0% |
| Apache | 3 | 0.0% |
| Arab | 273 | 1.8% |
| Belgian | 5 | 0.0% |
| British | 57 | 0.4% |
| Canadian | 13 | 0.1% |
| Central American | 25 | 0.2% |
| Cherokee | 8 | 0.1% |
| Choctaw | 41 | 0.3% |
| Colombian | 9 | 0.1% |
| Cuban | 1 | 0.0% |
| Danish | 19 | 0.1% |
| Dominican | 11 | 0.1% |
| Dutch | 195 | 1.3% |
| Ecuadorian | 9 | 0.1% |
| English | 837 | 5.6% |
| Ethiopian | 8 | 0.1% |
| European | 212 | 1.4% |
| French | 602 | 4.0% |
| French Canadian | 28 | 0.2% |
| German | 757 | 5.0% |
| Greek | 23 | 0.2% |
| Honduran | 16 | 0.1% |
| Hungarian | 3 | 0.0% |
| Indian (Asian) | 1 | 0.0% |
| Inupiat | 5 | 0.0% |
| Irish | 1,690 | 11.2% |
| Italian | 98 | 0.6% |
| Korean | 9 | 0.1% |
| Mexican | 113 | 0.7% |
| Native Hawaiian | 25 | 0.2% |
| Nicaraguan | 9 | 0.1% |
| Norwegian | 128 | 0.9% |
| Osage | 2 | 0.0% |
| Palestinian | 11 | 0.1% |
| Puerto Rican | 52 | 0.3% |
| Samoan | 4 | 0.0% |
| Scandinavian | 26 | 0.2% |
| Scotch-Irish | 105 | 0.7% |
| Scottish | 108 | 0.7% |
| Sioux | 8 | 0.1% |
| South American | 18 | 0.1% |
| Spaniard | 35 | 0.2% |
| Spanish | 24 | 0.2% |
| Sri Lankan | 5 | 0.0% |
| Subsaharan African | 81 | 0.5% |
| Swedish | 100 | 0.7% |
| Syrian | 10 | 0.1% |
| Turkish | 34 | 0.2% |
| Welsh | 34 | 0.2% |
| West Indian | 9 | 0.1% |
| Yugoslavian | 4 | 0.0% | View All 53 Rows |
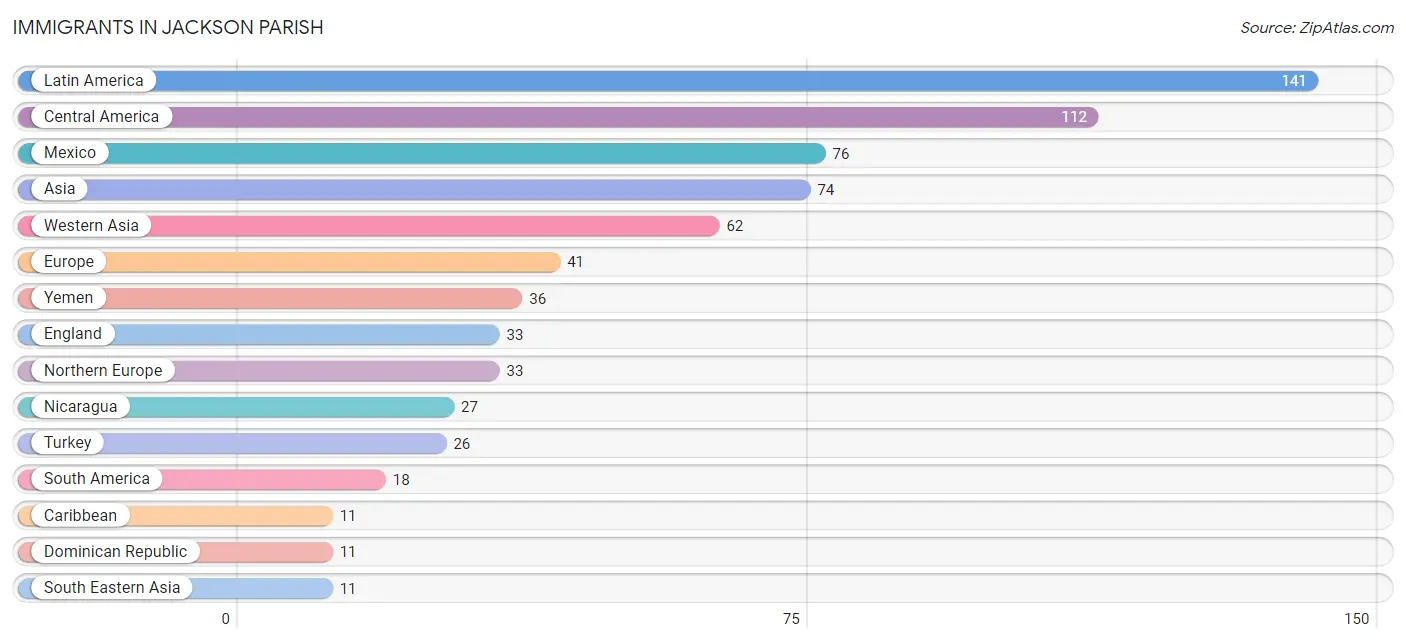
Immigrants in Jackson Parish
The most numerous immigrant groups reported in Jackson Parish came from Latin America (141 | 0.9%), Central America (112 | 0.7%), Mexico (76 | 0.5%), Asia (74 | 0.5%), and Western Asia (62 | 0.4%), together accounting for 3.1% of all Jackson Parish residents.
| Immigration Origin | # Population | % Population |
| Africa | 8 | 0.1% |
| Asia | 74 | 0.5% |
| Belize | 9 | 0.1% |
| Caribbean | 11 | 0.1% |
| Central America | 112 | 0.7% |
| China | 1 | 0.0% |
| Colombia | 9 | 0.1% |
| Dominican Republic | 11 | 0.1% |
| Eastern Africa | 8 | 0.1% |
| Eastern Asia | 1 | 0.0% |
| Ecuador | 9 | 0.1% |
| England | 33 | 0.2% |
| Eritrea | 8 | 0.1% |
| Europe | 41 | 0.3% |
| Germany | 8 | 0.1% |
| Latin America | 141 | 0.9% |
| Mexico | 76 | 0.5% |
| Nicaragua | 27 | 0.2% |
| Northern Europe | 33 | 0.2% |
| Philippines | 8 | 0.1% |
| South America | 18 | 0.1% |
| South Eastern Asia | 11 | 0.1% |
| Turkey | 26 | 0.2% |
| Vietnam | 3 | 0.0% |
| Western Asia | 62 | 0.4% |
| Western Europe | 8 | 0.1% |
| Yemen | 36 | 0.2% | View All 27 Rows |
Sex and Age in Jackson Parish
Sex and Age in Jackson Parish
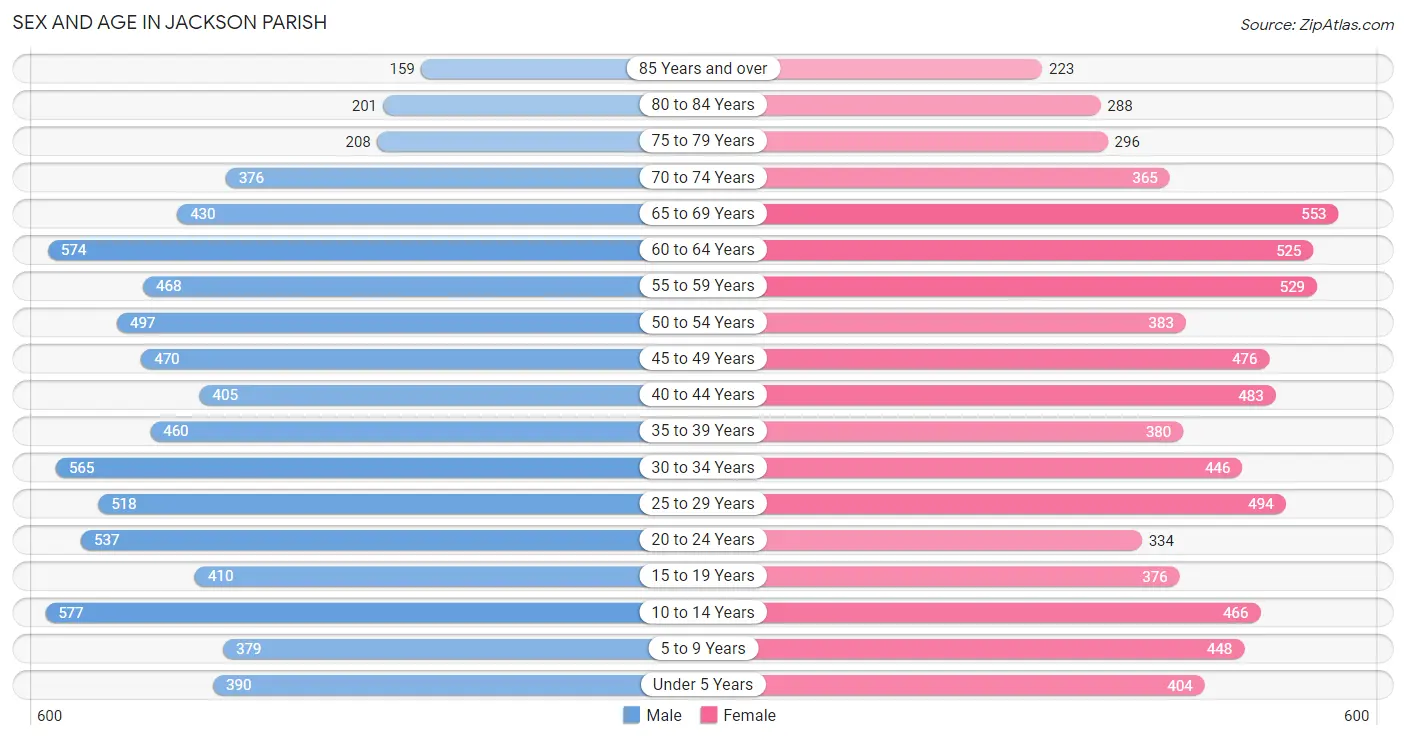
The most populous age groups in Jackson Parish are 10 to 14 Years (577 | 7.6%) for men and 65 to 69 Years (553 | 7.4%) for women.
| Age Bracket | Male | Female |
| Under 5 Years | 390 (5.1%) | 404 (5.4%) |
| 5 to 9 Years | 379 (5.0%) | 448 (6.0%) |
| 10 to 14 Years | 577 (7.6%) | 466 (6.2%) |
| 15 to 19 Years | 410 (5.4%) | 376 (5.0%) |
| 20 to 24 Years | 537 (7.0%) | 334 (4.5%) |
| 25 to 29 Years | 518 (6.8%) | 494 (6.6%) |
| 30 to 34 Years | 565 (7.4%) | 446 (6.0%) |
| 35 to 39 Years | 460 (6.0%) | 380 (5.1%) |
| 40 to 44 Years | 405 (5.3%) | 483 (6.5%) |
| 45 to 49 Years | 470 (6.2%) | 476 (6.4%) |
| 50 to 54 Years | 497 (6.5%) | 383 (5.1%) |
| 55 to 59 Years | 468 (6.1%) | 529 (7.1%) |
| 60 to 64 Years | 574 (7.5%) | 525 (7.0%) |
| 65 to 69 Years | 430 (5.6%) | 553 (7.4%) |
| 70 to 74 Years | 376 (4.9%) | 365 (4.9%) |
| 75 to 79 Years | 208 (2.7%) | 296 (4.0%) |
| 80 to 84 Years | 201 (2.6%) | 288 (3.9%) |
| 85 Years and over | 159 (2.1%) | 223 (3.0%) |
| Total | 7,624 (100.0%) | 7,469 (100.0%) |
Families and Households in Jackson Parish
Median Family Size in Jackson Parish
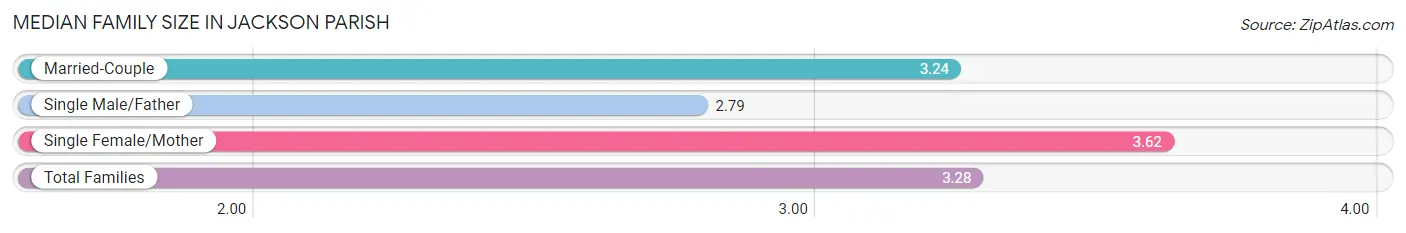
The median family size in Jackson Parish is 3.28 persons per family, with single female/mother families (839 | 23.4%) accounting for the largest median family size of 3.62 persons per family. On the other hand, single male/father families (382 | 10.6%) represent the smallest median family size with 2.79 persons per family.
| Family Type | # Families | Family Size |
| Married-Couple | 2,370 (66.0%) | 3.24 |
| Single Male/Father | 382 (10.6%) | 2.79 |
| Single Female/Mother | 839 (23.4%) | 3.62 |
| Total Families | 3,591 (100.0%) | 3.28 |
Median Household Size in Jackson Parish
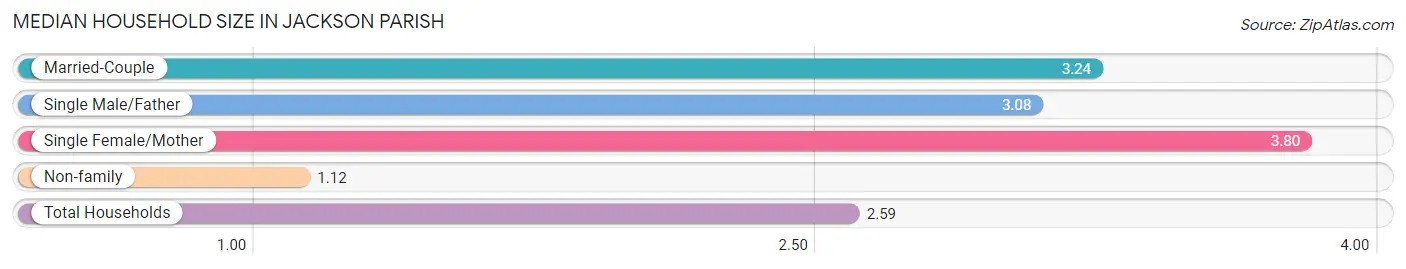
The median household size in Jackson Parish is 2.59 persons per household, with single female/mother households (839 | 15.4%) accounting for the largest median household size of 3.8 persons per household. non-family households (1,870 | 34.2%) represent the smallest median household size with 1.12 persons per household.
| Household Type | # Households | Household Size |
| Married-Couple | 2,370 (43.4%) | 3.24 |
| Single Male/Father | 382 (7.0%) | 3.08 |
| Single Female/Mother | 839 (15.4%) | 3.80 |
| Non-family | 1,870 (34.2%) | 1.12 |
| Total Households | 5,461 (100.0%) | 2.59 |
Household Size by Marriage Status in Jackson Parish
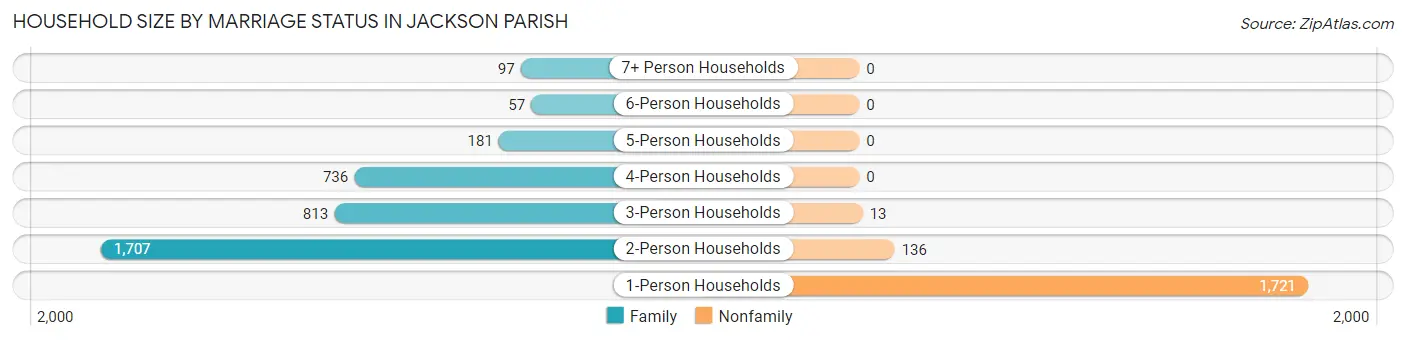
Out of a total of 5,461 households in Jackson Parish, 3,591 (65.8%) are family households, while 1,870 (34.2%) are nonfamily households. The most numerous type of family households are 2-person households, comprising 1,707, and the most common type of nonfamily households are 1-person households, comprising 1,721.
| Household Size | Family Households | Nonfamily Households |
| 1-Person Households | - | 1,721 (31.5%) |
| 2-Person Households | 1,707 (31.3%) | 136 (2.5%) |
| 3-Person Households | 813 (14.9%) | 13 (0.2%) |
| 4-Person Households | 736 (13.5%) | 0 (0.0%) |
| 5-Person Households | 181 (3.3%) | 0 (0.0%) |
| 6-Person Households | 57 (1.0%) | 0 (0.0%) |
| 7+ Person Households | 97 (1.8%) | 0 (0.0%) |
| Total | 3,591 (65.8%) | 1,870 (34.2%) |
Female Fertility in Jackson Parish
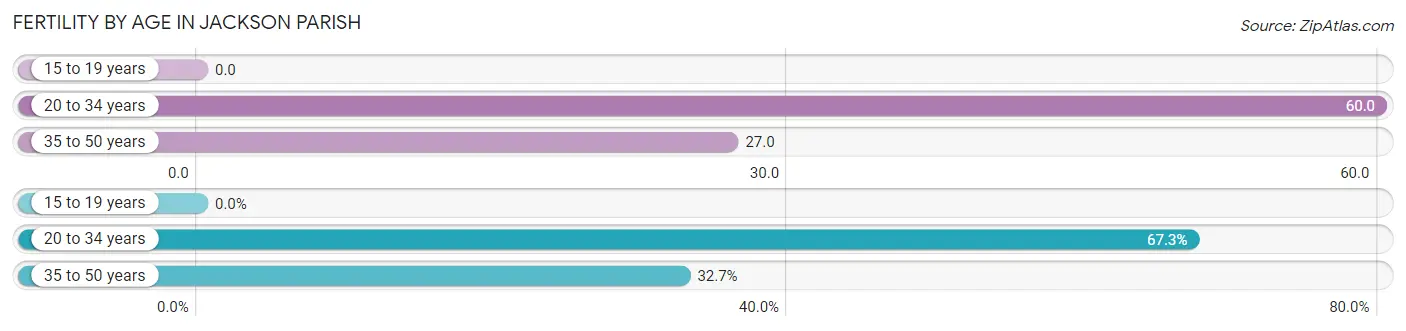
Fertility by Age in Jackson Parish
Average fertility rate in Jackson Parish is 37.0 births per 1,000 women. Women in the age bracket of 20 to 34 years have the highest fertility rate with 60.0 births per 1,000 women. Women in the age bracket of 20 to 34 years acount for 67.3% of all women with births.
| Age Bracket | Women with Births | Births / 1,000 Women |
| 15 to 19 years | 0 (0.0%) | 0.0 |
| 20 to 34 years | 76 (67.3%) | 60.0 |
| 35 to 50 years | 37 (32.7%) | 27.0 |
| Total | 113 (100.0%) | 37.0 |
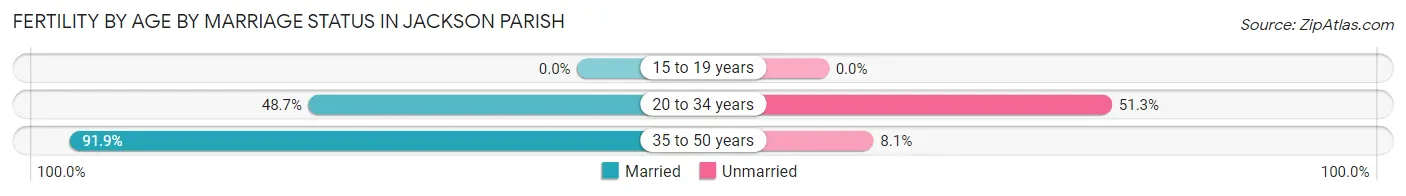
Fertility by Age by Marriage Status in Jackson Parish
62.8% of women with births (113) in Jackson Parish are married. The highest percentage of unmarried women with births falls into 20 to 34 years age bracket with 51.3% of them unmarried at the time of birth, while the lowest percentage of unmarried women with births belong to 35 to 50 years age bracket with 8.1% of them unmarried.
| Age Bracket | Married | Unmarried |
| 15 to 19 years | 0 (0.0%) | 0 (0.0%) |
| 20 to 34 years | 37 (48.7%) | 39 (51.3%) |
| 35 to 50 years | 34 (91.9%) | 3 (8.1%) |
| Total | 71 (62.8%) | 42 (37.2%) |
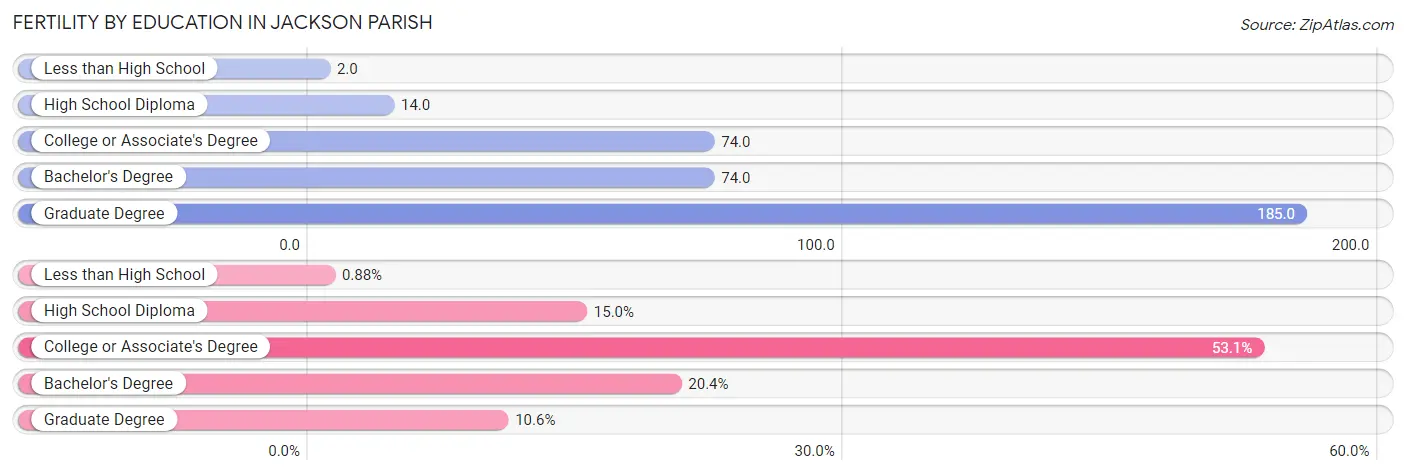
Fertility by Education in Jackson Parish
Average fertility rate in Jackson Parish is 37.0 births per 1,000 women. Women with the education attainment of graduate degree have the highest fertility rate of 185.0 births per 1,000 women, while women with the education attainment of less than high school have the lowest fertility at 2.0 births per 1,000 women. Women with the education attainment of college or associate's degree represent 53.1% of all women with births.
| Educational Attainment | Women with Births | Births / 1,000 Women |
| Less than High School | 1 (0.9%) | 2.0 |
| High School Diploma | 17 (15.0%) | 14.0 |
| College or Associate's Degree | 60 (53.1%) | 74.0 |
| Bachelor's Degree | 23 (20.3%) | 74.0 |
| Graduate Degree | 12 (10.6%) | 185.0 |
| Total | 113 (100.0%) | 37.0 |
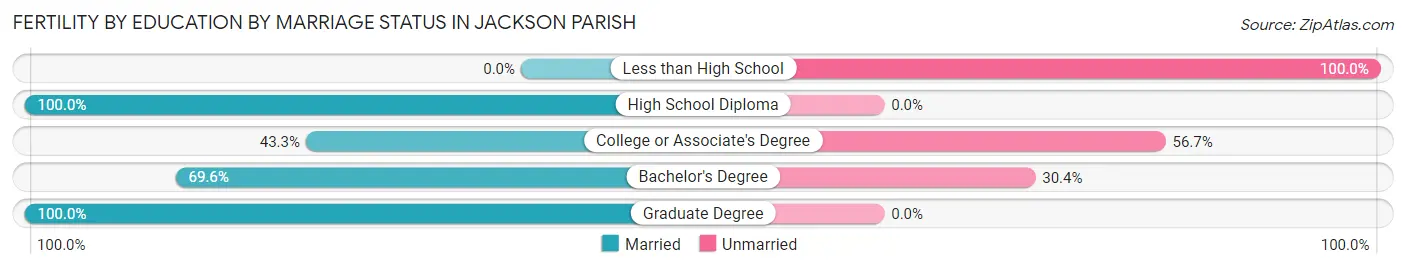
Fertility by Education by Marriage Status in Jackson Parish
37.2% of women with births in Jackson Parish are unmarried. Women with the educational attainment of high school diploma are most likely to be married with 100.0% of them married at childbirth, while women with the educational attainment of less than high school are least likely to be married with 100.0% of them unmarried at childbirth.
| Educational Attainment | Married | Unmarried |
| Less than High School | 0 (0.0%) | 1 (100.0%) |
| High School Diploma | 17 (100.0%) | 0 (0.0%) |
| College or Associate's Degree | 26 (43.3%) | 34 (56.7%) |
| Bachelor's Degree | 16 (69.6%) | 7 (30.4%) |
| Graduate Degree | 12 (100.0%) | 0 (0.0%) |
| Total | 71 (62.8%) | 42 (37.2%) |
Income in Jackson Parish
Income Overview in Jackson Parish
Per Capita Income in Jackson Parish is $22,804, while median incomes of families and households are $52,285 and $40,406 respectively.
| Characteristic | Number | Measure |
| Per Capita Income | 15,093 | $22,804 |
| Median Family Income | 3,591 | $52,285 |
| Mean Family Income | 3,591 | $67,138 |
| Median Household Income | 5,461 | $40,406 |
| Mean Household Income | 5,461 | $57,124 |
| Income Deficit | 3,591 | $10,649 |
| Wage / Income Gap (%) | 15,093 | 42.34% |
| Wage / Income Gap ($) | 15,093 | 57.66¢ per $1 |
| Gini / Inequality Index | 15,093 | 0.46 |
Earnings by Sex in Jackson Parish
Average Earnings in Jackson Parish are $29,197, $36,791 for men and $21,215 for women, a difference of 42.3%.
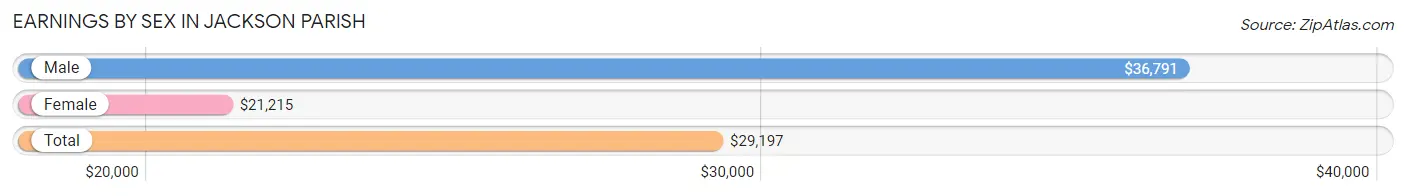
| Sex | Number | Average Earnings |
| Male | 3,050 (55.3%) | $36,791 |
| Female | 2,467 (44.7%) | $21,215 |
| Total | 5,517 (100.0%) | $29,197 |
Earnings by Sex by Income Bracket in Jackson Parish
The most common earnings brackets in Jackson Parish are $100,000+ for men (354 | 11.6%) and $12,500 to $14,999 for women (294 | 11.9%).
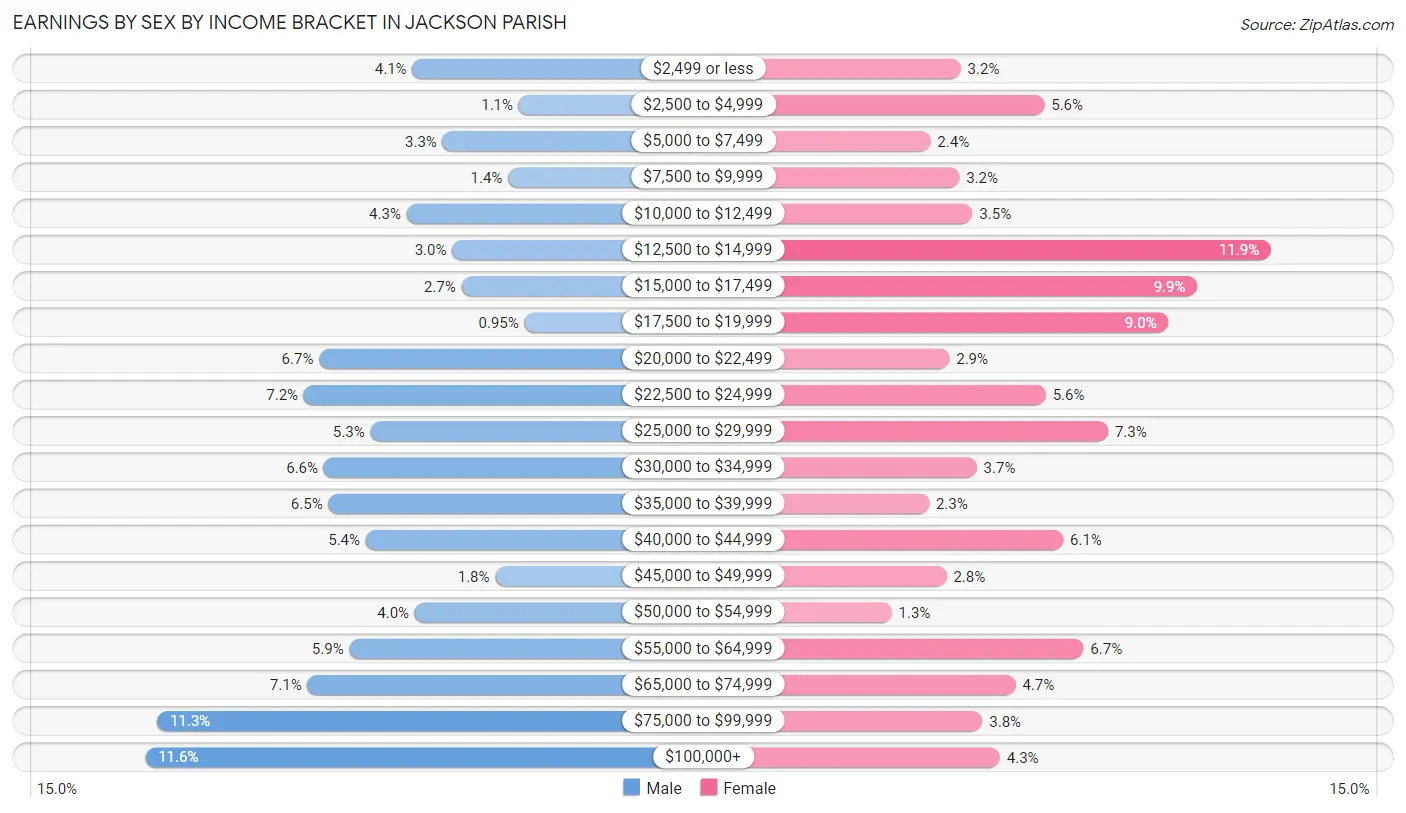
| Income | Male | Female |
| $2,499 or less | 125 (4.1%) | 79 (3.2%) |
| $2,500 to $4,999 | 34 (1.1%) | 137 (5.6%) |
| $5,000 to $7,499 | 99 (3.3%) | 58 (2.4%) |
| $7,500 to $9,999 | 43 (1.4%) | 78 (3.2%) |
| $10,000 to $12,499 | 130 (4.3%) | 87 (3.5%) |
| $12,500 to $14,999 | 91 (3.0%) | 294 (11.9%) |
| $15,000 to $17,499 | 83 (2.7%) | 243 (9.9%) |
| $17,500 to $19,999 | 29 (0.9%) | 223 (9.0%) |
| $20,000 to $22,499 | 205 (6.7%) | 71 (2.9%) |
| $22,500 to $24,999 | 218 (7.1%) | 138 (5.6%) |
| $25,000 to $29,999 | 161 (5.3%) | 181 (7.3%) |
| $30,000 to $34,999 | 201 (6.6%) | 90 (3.6%) |
| $35,000 to $39,999 | 197 (6.5%) | 57 (2.3%) |
| $40,000 to $44,999 | 165 (5.4%) | 150 (6.1%) |
| $45,000 to $49,999 | 54 (1.8%) | 69 (2.8%) |
| $50,000 to $54,999 | 123 (4.0%) | 31 (1.3%) |
| $55,000 to $64,999 | 179 (5.9%) | 164 (6.7%) |
| $65,000 to $74,999 | 215 (7.0%) | 117 (4.7%) |
| $75,000 to $99,999 | 344 (11.3%) | 94 (3.8%) |
| $100,000+ | 354 (11.6%) | 106 (4.3%) |
| Total | 3,050 (100.0%) | 2,467 (100.0%) |
Earnings by Sex by Educational Attainment in Jackson Parish
Average earnings in Jackson Parish are $40,072 for men and $23,714 for women, a difference of 40.8%. Men with an educational attainment of bachelor's degree enjoy the highest average annual earnings of $56,645, while those with less than high school education earn the least with $26,250. Women with an educational attainment of graduate degree earn the most with the average annual earnings of $55,625, while those with less than high school education have the smallest earnings of $14,513.
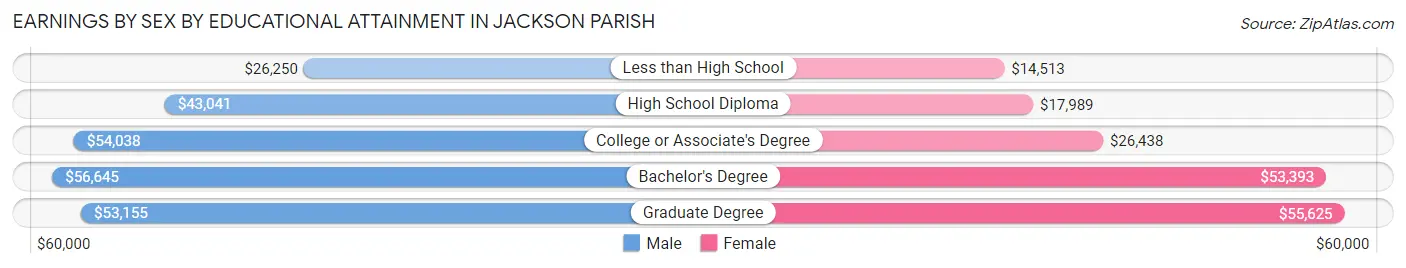
| Educational Attainment | Male Income | Female Income |
| Less than High School | $26,250 | $14,513 |
| High School Diploma | $43,041 | $17,989 |
| College or Associate's Degree | $54,038 | $26,438 |
| Bachelor's Degree | $56,645 | $53,393 |
| Graduate Degree | $53,155 | $55,625 |
| Total | $40,072 | $23,714 |
Family Income in Jackson Parish
Family Income Brackets in Jackson Parish
According to the Jackson Parish family income data, there are 693 families falling into the $50,000 to $74,999 income range, which is the most common income bracket and makes up 19.3% of all families. Conversely, the $200,000+ income bracket is the least frequent group with only 111 families (3.1%) belonging to this category.
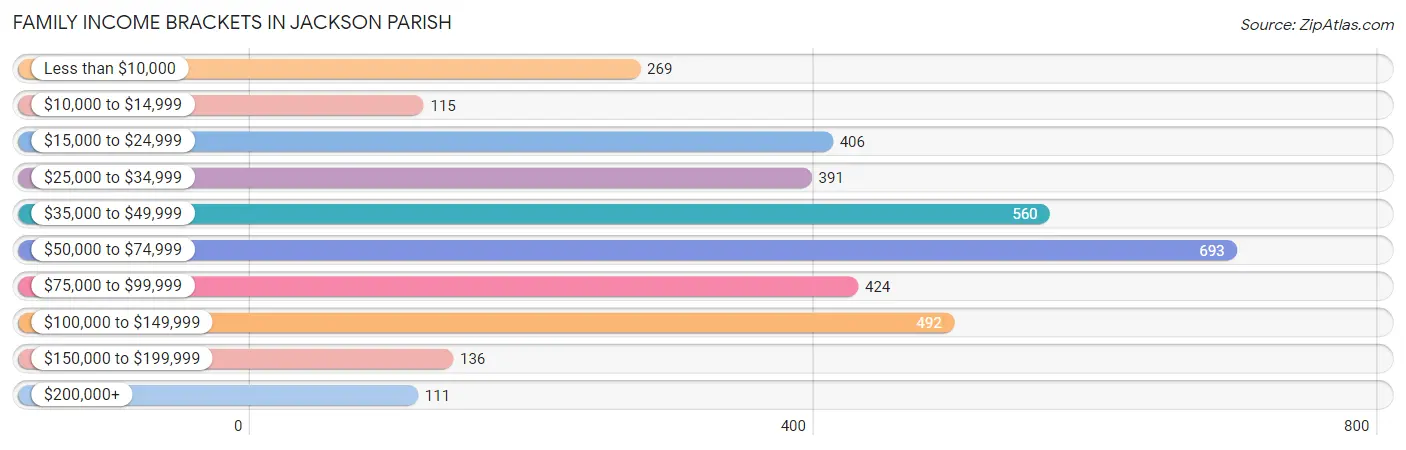
| Income Bracket | # Families | % Families |
| Less than $10,000 | 269 | 7.5% |
| $10,000 to $14,999 | 115 | 3.2% |
| $15,000 to $24,999 | 406 | 11.3% |
| $25,000 to $34,999 | 391 | 10.9% |
| $35,000 to $49,999 | 560 | 15.6% |
| $50,000 to $74,999 | 693 | 19.3% |
| $75,000 to $99,999 | 424 | 11.8% |
| $100,000 to $149,999 | 492 | 13.7% |
| $150,000 to $199,999 | 136 | 3.8% |
| $200,000+ | 111 | 3.1% |
Family Income by Famaliy Size in Jackson Parish
6-person families (59 | 1.6%) account for the highest median family income in Jackson Parish with $71,550 per family, while 2-person families (1,768 | 49.2%) have the highest median income of $28,711 per family member.
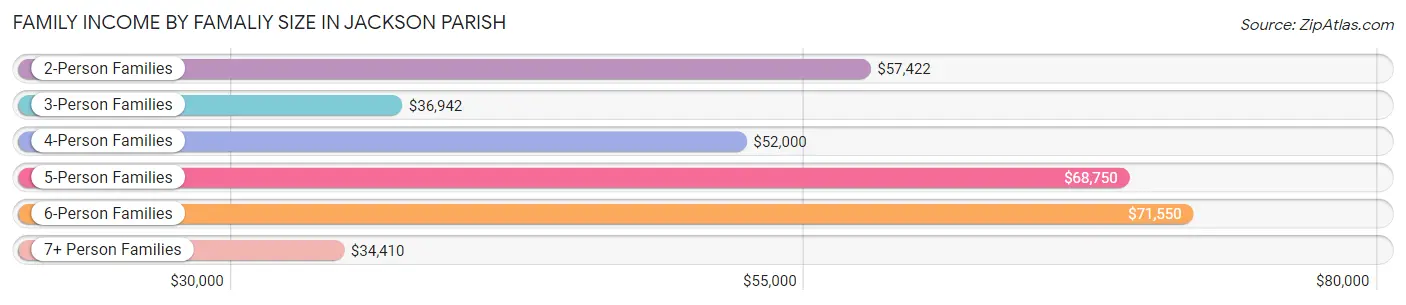
| Income Bracket | # Families | Median Income |
| 2-Person Families | 1,768 (49.2%) | $57,422 |
| 3-Person Families | 1,008 (28.1%) | $36,942 |
| 4-Person Families | 496 (13.8%) | $52,000 |
| 5-Person Families | 165 (4.6%) | $68,750 |
| 6-Person Families | 59 (1.6%) | $71,550 |
| 7+ Person Families | 95 (2.6%) | $34,410 |
| Total | 3,591 (100.0%) | $52,285 |
Family Income by Number of Earners in Jackson Parish
The median family income in Jackson Parish is $52,285, with families comprising 3+ earners (151) having the highest median family income of $98,839, while families with no earners (874) have the lowest median family income of $28,730, accounting for 4.2% and 24.3% of families, respectively.
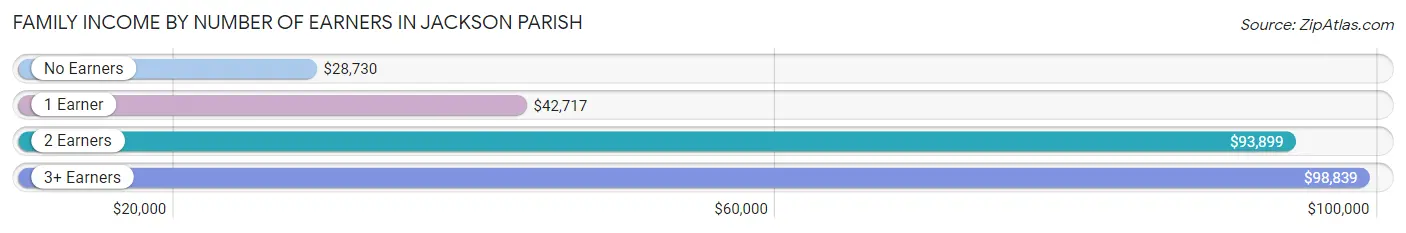
| Number of Earners | # Families | Median Income |
| No Earners | 874 (24.3%) | $28,730 |
| 1 Earner | 1,583 (44.1%) | $42,717 |
| 2 Earners | 983 (27.4%) | $93,899 |
| 3+ Earners | 151 (4.2%) | $98,839 |
| Total | 3,591 (100.0%) | $52,285 |
Household Income in Jackson Parish
Household Income Brackets in Jackson Parish
With 939 households falling in the category, the $35,000 to $49,999 income range is the most frequent in Jackson Parish, accounting for 17.2% of all households. In contrast, only 126 households (2.3%) fall into the $200,000+ income bracket, making it the least populous group.
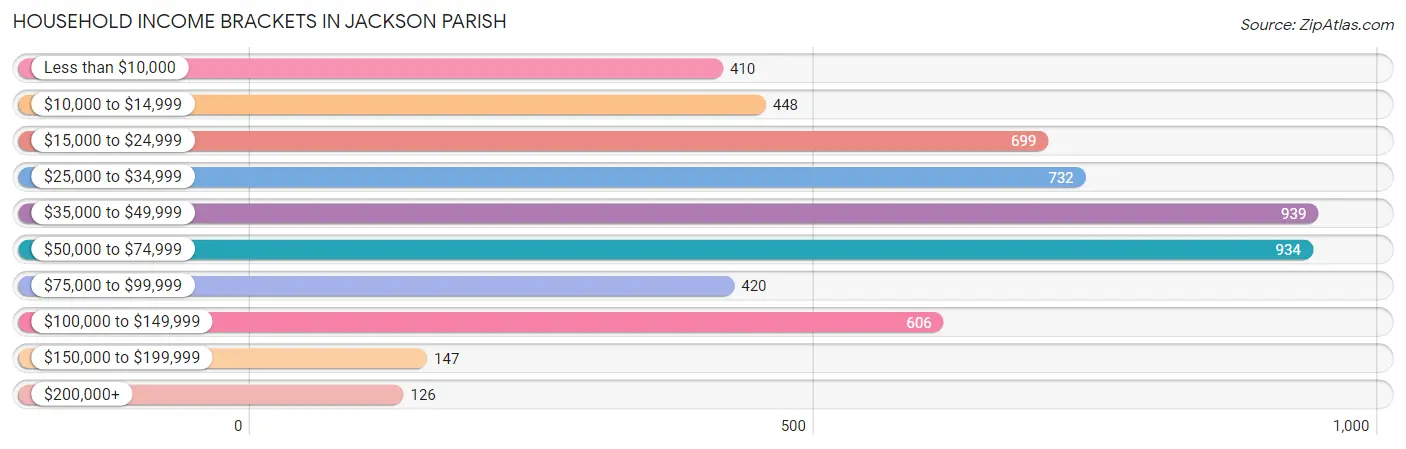
| Income Bracket | # Households | % Households |
| Less than $10,000 | 410 | 7.5% |
| $10,000 to $14,999 | 448 | 8.2% |
| $15,000 to $24,999 | 699 | 12.8% |
| $25,000 to $34,999 | 732 | 13.4% |
| $35,000 to $49,999 | 939 | 17.2% |
| $50,000 to $74,999 | 934 | 17.1% |
| $75,000 to $99,999 | 420 | 7.7% |
| $100,000 to $149,999 | 606 | 11.1% |
| $150,000 to $199,999 | 147 | 2.7% |
| $200,000+ | 126 | 2.3% |
Household Income by Householder Age in Jackson Parish
The median household income in Jackson Parish is $40,406, with the highest median household income of $53,727 found in the 45 to 64 years age bracket for the primary householder. A total of 1,991 households (36.5%) fall into this category. Meanwhile, the 15 to 24 years age bracket for the primary householder has the lowest median household income of $20,577, with 114 households (2.1%) in this group.
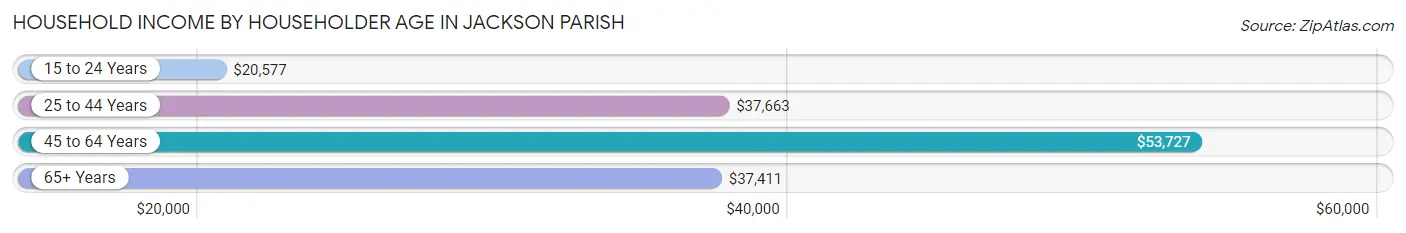
| Income Bracket | # Households | Median Income |
| 15 to 24 Years | 114 (2.1%) | $20,577 |
| 25 to 44 Years | 1,411 (25.8%) | $37,663 |
| 45 to 64 Years | 1,991 (36.5%) | $53,727 |
| 65+ Years | 1,945 (35.6%) | $37,411 |
| Total | 5,461 (100.0%) | $40,406 |
Poverty in Jackson Parish
Income Below Poverty by Sex and Age in Jackson Parish
With 23.4% poverty level for males and 28.8% for females among the residents of Jackson Parish, under 5 year old males and 5 year old females are the most vulnerable to poverty, with 242 males (62.1%) and 115 females (83.9%) in their respective age groups living below the poverty level.
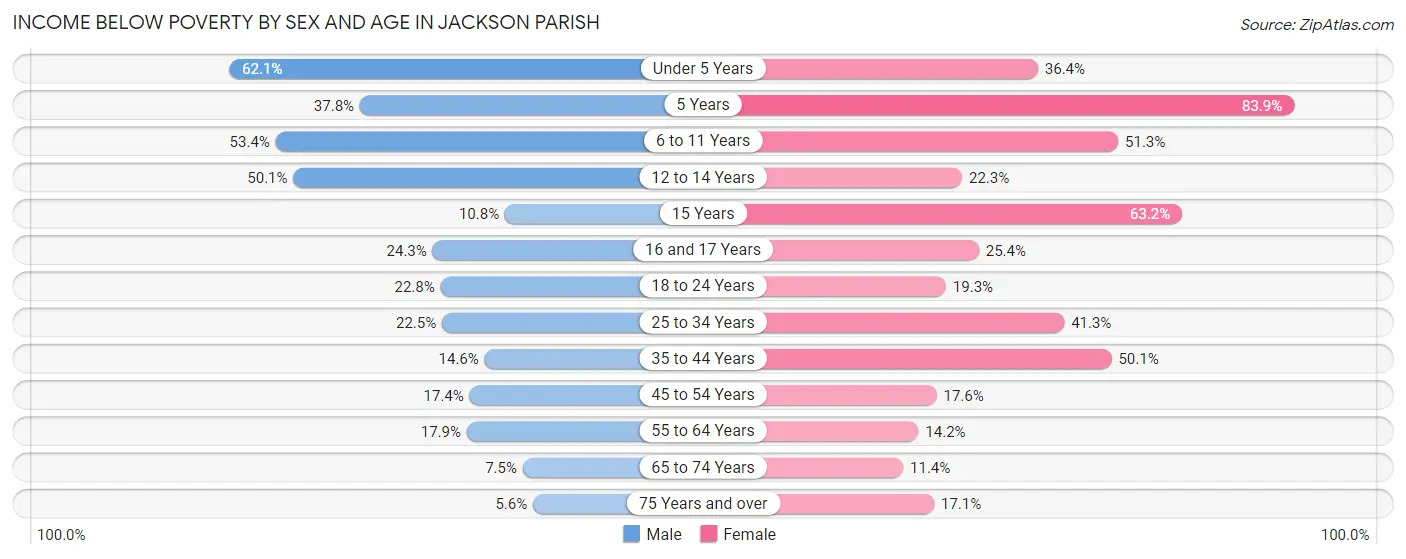
| Age Bracket | Male | Female |
| Under 5 Years | 242 (62.1%) | 147 (36.4%) |
| 5 Years | 37 (37.8%) | 115 (83.9%) |
| 6 to 11 Years | 212 (53.4%) | 278 (51.3%) |
| 12 to 14 Years | 231 (50.1%) | 52 (22.3%) |
| 15 Years | 17 (10.8%) | 60 (63.2%) |
| 16 and 17 Years | 25 (24.3%) | 59 (25.4%) |
| 18 to 24 Years | 137 (22.8%) | 74 (19.3%) |
| 25 to 34 Years | 188 (22.5%) | 374 (41.3%) |
| 35 to 44 Years | 90 (14.6%) | 421 (50.1%) |
| 45 to 54 Years | 154 (17.4%) | 151 (17.6%) |
| 55 to 64 Years | 178 (17.9%) | 148 (14.2%) |
| 65 to 74 Years | 56 (7.5%) | 102 (11.4%) |
| 75 Years and over | 31 (5.6%) | 127 (17.1%) |
| Total | 1,598 (23.4%) | 2,108 (28.8%) |
Income Above Poverty by Sex and Age in Jackson Parish
According to the poverty statistics in Jackson Parish, males aged 75 years and over and females aged 65 to 74 years are the age groups that are most secure financially, with 94.4% of males and 88.6% of females in these age groups living above the poverty line.
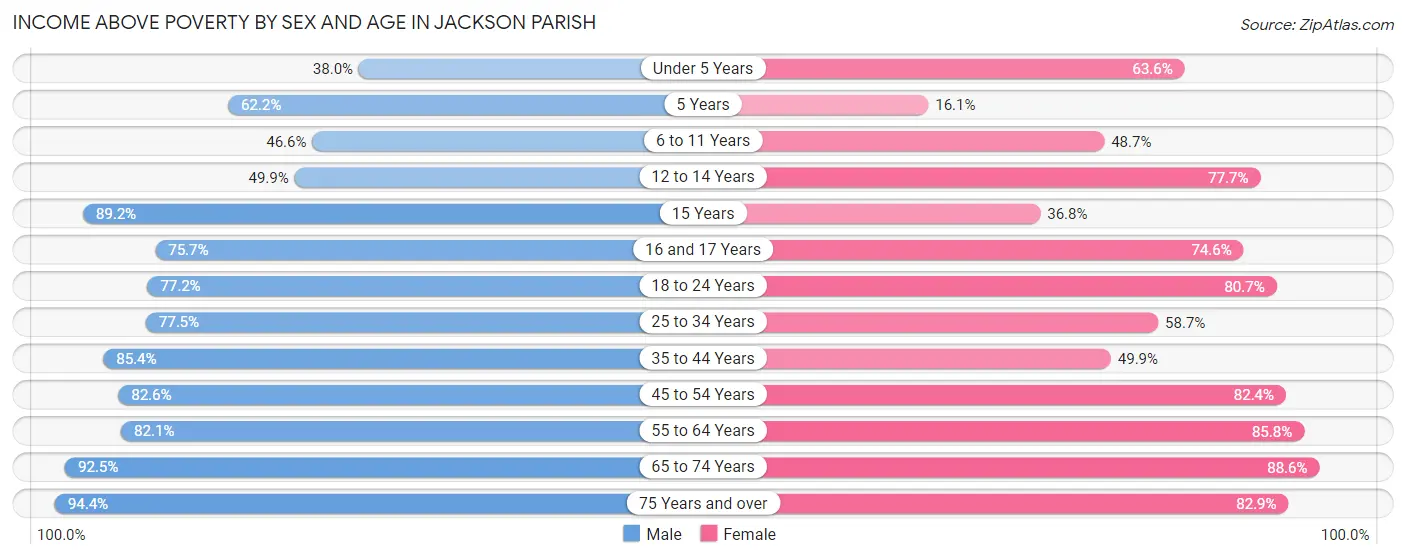
| Age Bracket | Male | Female |
| Under 5 Years | 148 (38.0%) | 257 (63.6%) |
| 5 Years | 61 (62.2%) | 22 (16.1%) |
| 6 to 11 Years | 185 (46.6%) | 264 (48.7%) |
| 12 to 14 Years | 230 (49.9%) | 181 (77.7%) |
| 15 Years | 140 (89.2%) | 35 (36.8%) |
| 16 and 17 Years | 78 (75.7%) | 173 (74.6%) |
| 18 to 24 Years | 464 (77.2%) | 309 (80.7%) |
| 25 to 34 Years | 647 (77.5%) | 532 (58.7%) |
| 35 to 44 Years | 526 (85.4%) | 420 (49.9%) |
| 45 to 54 Years | 731 (82.6%) | 708 (82.4%) |
| 55 to 64 Years | 815 (82.1%) | 893 (85.8%) |
| 65 to 74 Years | 689 (92.5%) | 794 (88.6%) |
| 75 Years and over | 520 (94.4%) | 615 (82.9%) |
| Total | 5,234 (76.6%) | 5,203 (71.2%) |
Income Below Poverty Among Married-Couple Families in Jackson Parish
The poverty statistics for married-couple families in Jackson Parish show that 13.4% or 318 of the total 2,370 families live below the poverty line. Families with 5 or more children have the highest poverty rate of 83.1%, comprising of 59 families. On the other hand, families with 3 or 4 children have the lowest poverty rate of 0.6%, which includes 1 families.
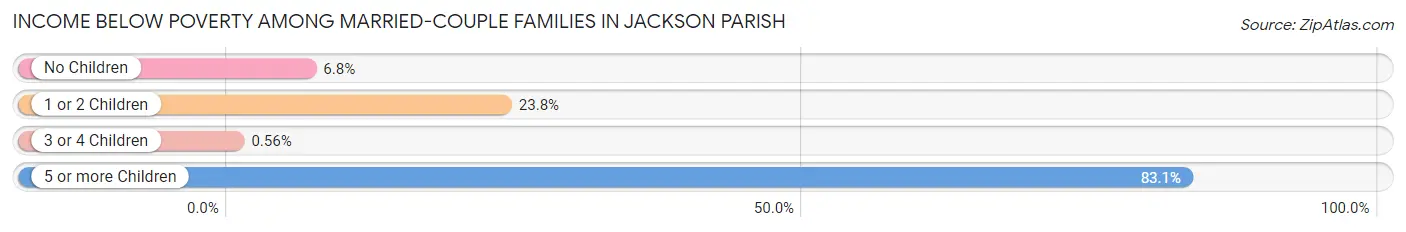
| Children | Above Poverty | Below Poverty |
| No Children | 1,353 (93.2%) | 99 (6.8%) |
| 1 or 2 Children | 508 (76.2%) | 159 (23.8%) |
| 3 or 4 Children | 179 (99.4%) | 1 (0.6%) |
| 5 or more Children | 12 (16.9%) | 59 (83.1%) |
| Total | 2,052 (86.6%) | 318 (13.4%) |
Income Below Poverty Among Single-Parent Households in Jackson Parish
According to the poverty data in Jackson Parish, 10.2% or 39 single-father households and 50.7% or 425 single-mother households are living below the poverty line. Among single-father households, those with 1 or 2 children have the highest poverty rate, with 30 households (15.5%) experiencing poverty. Likewise, among single-mother households, those with 3 or 4 children have the highest poverty rate, with 44 households (91.7%) falling below the poverty line.
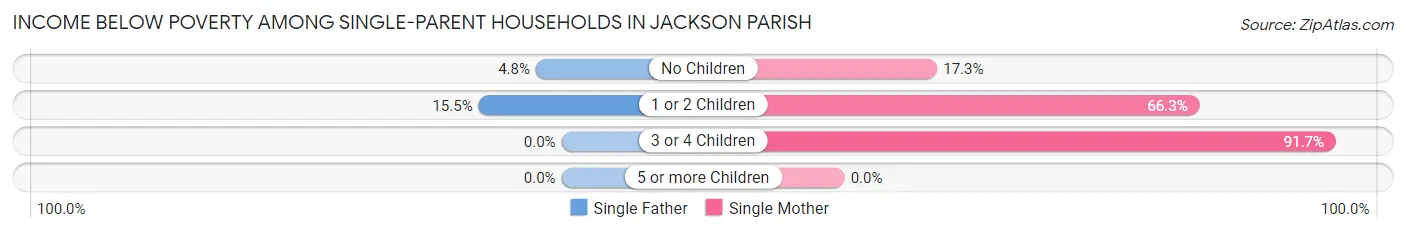
| Children | Single Father | Single Mother |
| No Children | 9 (4.8%) | 49 (17.2%) |
| 1 or 2 Children | 30 (15.5%) | 332 (66.3%) |
| 3 or 4 Children | 0 (0.0%) | 44 (91.7%) |
| 5 or more Children | 0 (0.0%) | 0 (0.0%) |
| Total | 39 (10.2%) | 425 (50.7%) |
Income Below Poverty Among Married-Couple vs Single-Parent Households in Jackson Parish
The poverty data for Jackson Parish shows that 318 of the married-couple family households (13.4%) and 464 of the single-parent households (38.0%) are living below the poverty level. Within the married-couple family households, those with 5 or more children have the highest poverty rate, with 59 households (83.1%) falling below the poverty line. Among the single-parent households, those with 3 or 4 children have the highest poverty rate, with 44 household (91.7%) living below poverty.
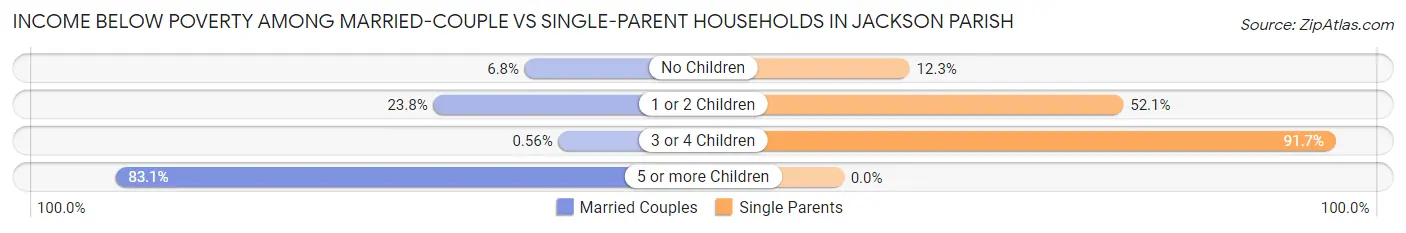
| Children | Married-Couple Families | Single-Parent Households |
| No Children | 99 (6.8%) | 58 (12.3%) |
| 1 or 2 Children | 159 (23.8%) | 362 (52.1%) |
| 3 or 4 Children | 1 (0.6%) | 44 (91.7%) |
| 5 or more Children | 59 (83.1%) | 0 (0.0%) |
| Total | 318 (13.4%) | 464 (38.0%) |
Employment Characteristics in Jackson Parish
Employment by Class of Employer in Jackson Parish
Among the 4,867 employed individuals in Jackson Parish, private company employees (3,171 | 65.1%), local government employees (584 | 12.0%), and state government employees (374 | 7.7%) make up the most common classes of employment.
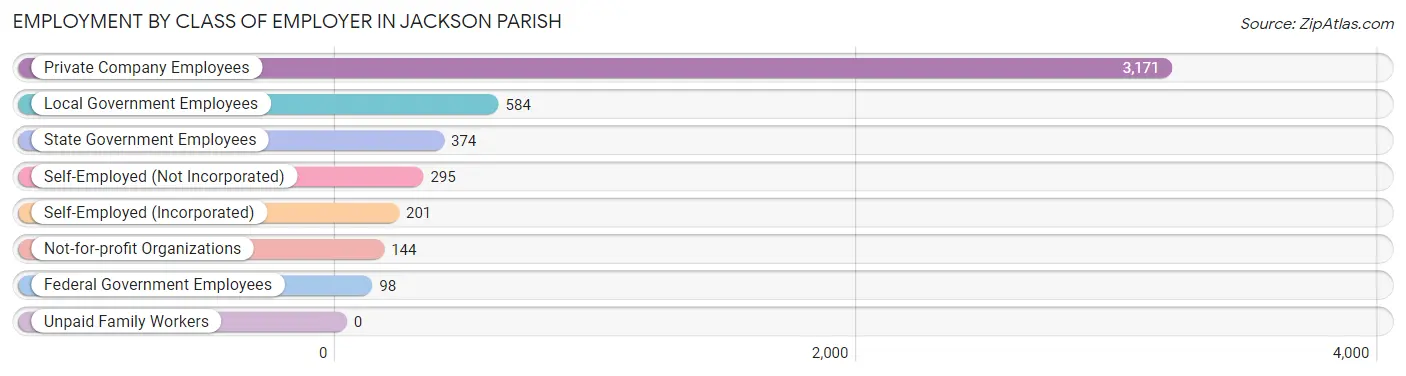
| Employer Class | # Employees | % Employees |
| Private Company Employees | 3,171 | 65.1% |
| Self-Employed (Incorporated) | 201 | 4.1% |
| Self-Employed (Not Incorporated) | 295 | 6.1% |
| Not-for-profit Organizations | 144 | 3.0% |
| Local Government Employees | 584 | 12.0% |
| State Government Employees | 374 | 7.7% |
| Federal Government Employees | 98 | 2.0% |
| Unpaid Family Workers | 0 | 0.0% |
| Total | 4,867 | 100.0% |
Employment Status by Age in Jackson Parish
According to the labor force statistics for Jackson Parish, out of the total population over 16 years of age (12,177), 42.6% or 5,187 individuals are in the labor force, with 4.9% or 254 of them unemployed. The age group with the highest labor force participation rate is 45 to 54 years, with 64.3% or 1,174 individuals in the labor force. Within the labor force, the 16 to 19 years age range has the highest percentage of unemployed individuals, with 33.7% or 30 of them being unemployed.
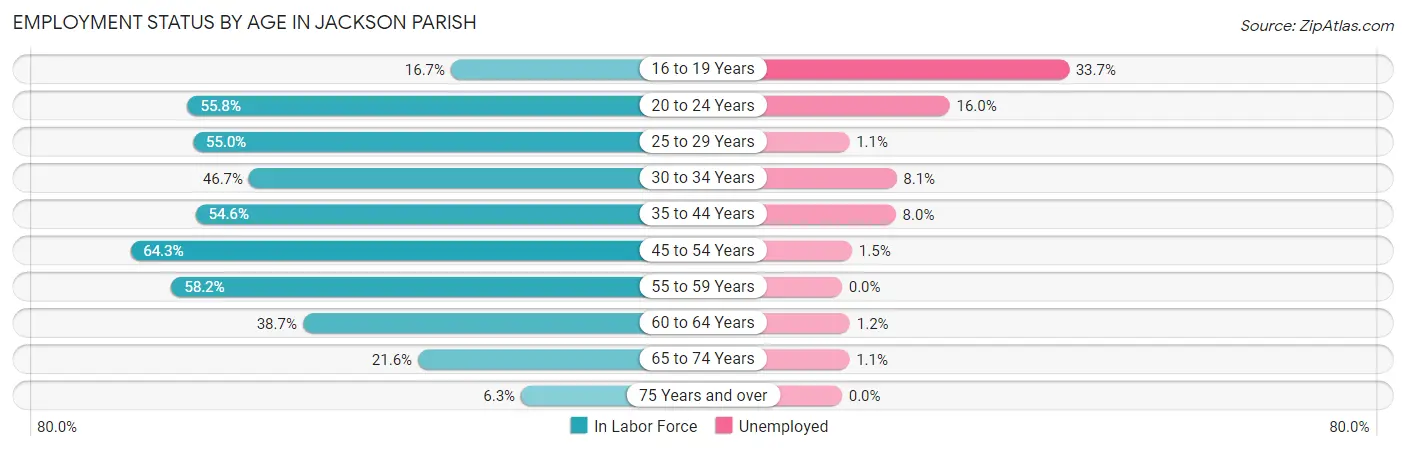
| Age Bracket | In Labor Force | Unemployed |
| 16 to 19 Years | 89 (16.7%) | 30 (33.7%) |
| 20 to 24 Years | 486 (55.8%) | 78 (16.0%) |
| 25 to 29 Years | 557 (55.0%) | 6 (1.1%) |
| 30 to 34 Years | 472 (46.7%) | 38 (8.1%) |
| 35 to 44 Years | 943 (54.6%) | 75 (8.0%) |
| 45 to 54 Years | 1,174 (64.3%) | 18 (1.5%) |
| 55 to 59 Years | 580 (58.2%) | 0 (0.0%) |
| 60 to 64 Years | 425 (38.7%) | 5 (1.2%) |
| 65 to 74 Years | 372 (21.6%) | 4 (1.1%) |
| 75 Years and over | 87 (6.3%) | 0 (0.0%) |
| Total | 5,187 (42.6%) | 254 (4.9%) |
Employment Status by Educational Attainment in Jackson Parish
According to labor force statistics for Jackson Parish, 54.1% of individuals (4,151) out of the total population between 25 and 64 years of age (7,673) are in the labor force, with 3.4% or 141 of them being unemployed. The group with the highest labor force participation rate are those with the educational attainment of bachelor's degree or higher, with 70.9% or 647 individuals in the labor force. Within the labor force, individuals with less than high school education have the highest percentage of unemployment, with 5.9% or 29 of them being unemployed.
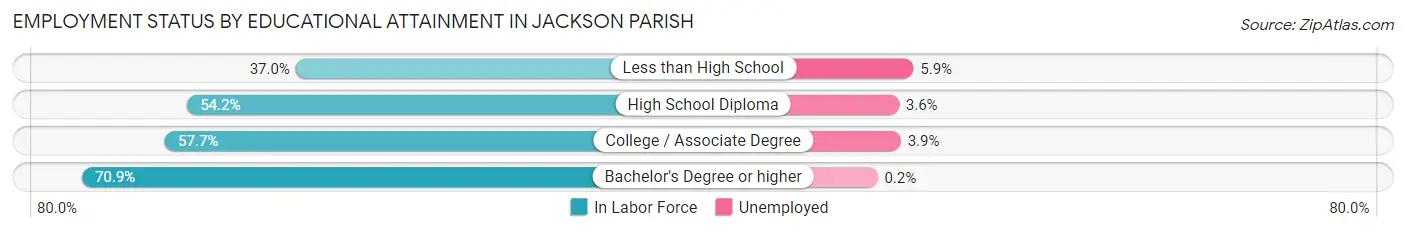
| Educational Attainment | In Labor Force | Unemployed |
| Less than High School | 491 (37.0%) | 78 (5.9%) |
| High School Diploma | 1,876 (54.2%) | 125 (3.6%) |
| College / Associate Degree | 1,138 (57.7%) | 77 (3.9%) |
| Bachelor's Degree or higher | 647 (70.9%) | 2 (0.2%) |
| Total | 4,151 (54.1%) | 261 (3.4%) |
Employment Occupations by Sex in Jackson Parish
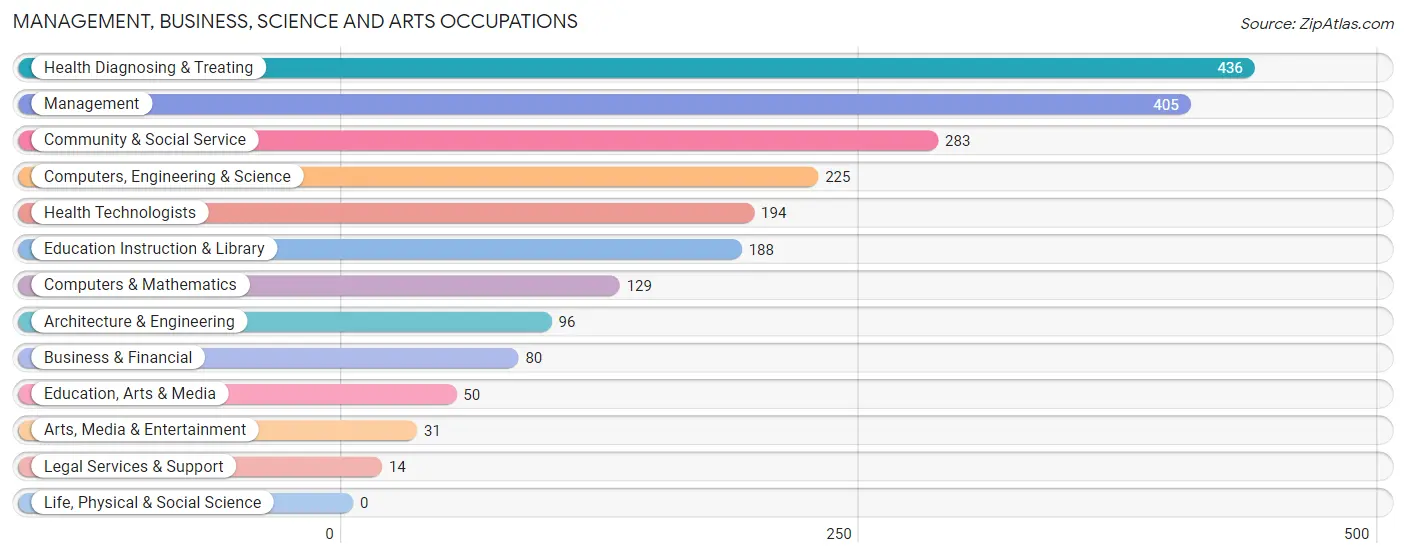
Management, Business, Science and Arts Occupations
The most common Management, Business, Science and Arts occupations in Jackson Parish are Health Diagnosing & Treating (436 | 8.8%), Management (405 | 8.2%), Community & Social Service (283 | 5.7%), Computers, Engineering & Science (225 | 4.6%), and Health Technologists (194 | 3.9%).
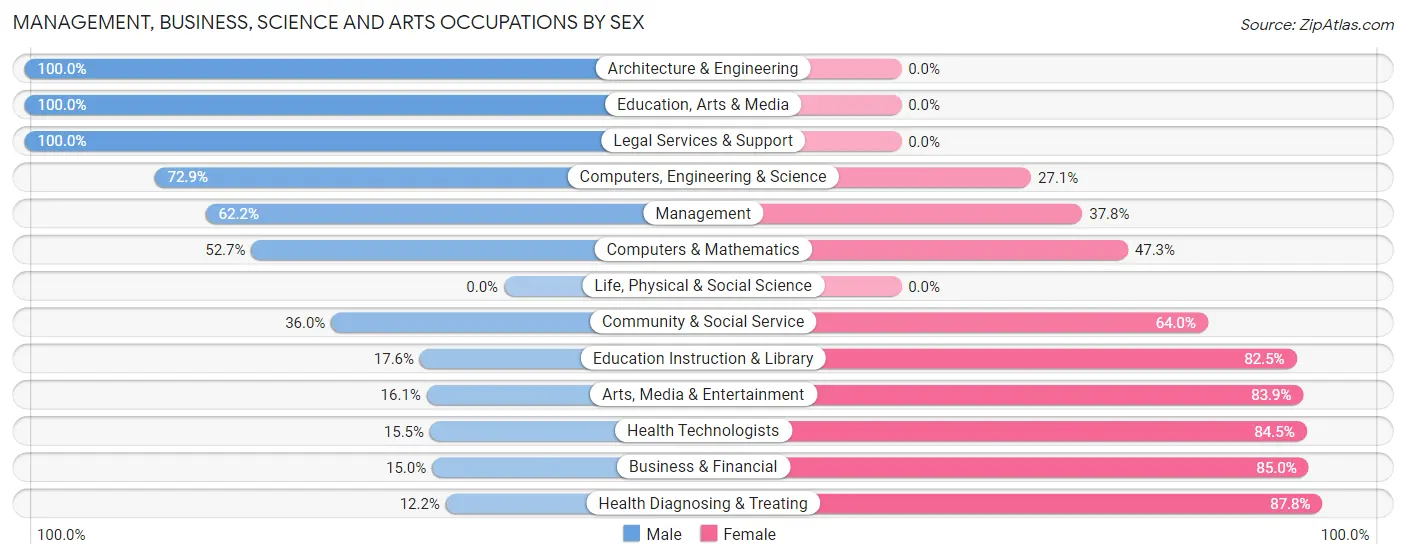
Management, Business, Science and Arts Occupations by Sex
Within the Management, Business, Science and Arts occupations in Jackson Parish, the most male-oriented occupations are Architecture & Engineering (100.0%), Education, Arts & Media (100.0%), and Legal Services & Support (100.0%), while the most female-oriented occupations are Health Diagnosing & Treating (87.8%), Business & Financial (85.0%), and Health Technologists (84.5%).
| Occupation | Male | Female |
| Management | 252 (62.2%) | 153 (37.8%) |
| Business & Financial | 12 (15.0%) | 68 (85.0%) |
| Computers, Engineering & Science | 164 (72.9%) | 61 (27.1%) |
| Computers & Mathematics | 68 (52.7%) | 61 (47.3%) |
| Architecture & Engineering | 96 (100.0%) | 0 (0.0%) |
| Life, Physical & Social Science | 0 (0.0%) | 0 (0.0%) |
| Community & Social Service | 102 (36.0%) | 181 (64.0%) |
| Education, Arts & Media | 50 (100.0%) | 0 (0.0%) |
| Legal Services & Support | 14 (100.0%) | 0 (0.0%) |
| Education Instruction & Library | 33 (17.5%) | 155 (82.5%) |
| Arts, Media & Entertainment | 5 (16.1%) | 26 (83.9%) |
| Health Diagnosing & Treating | 53 (12.2%) | 383 (87.8%) |
| Health Technologists | 30 (15.5%) | 164 (84.5%) |
| Total (Category) | 583 (40.8%) | 846 (59.2%) |
| Total (Overall) | 2,715 (55.1%) | 2,216 (44.9%) |
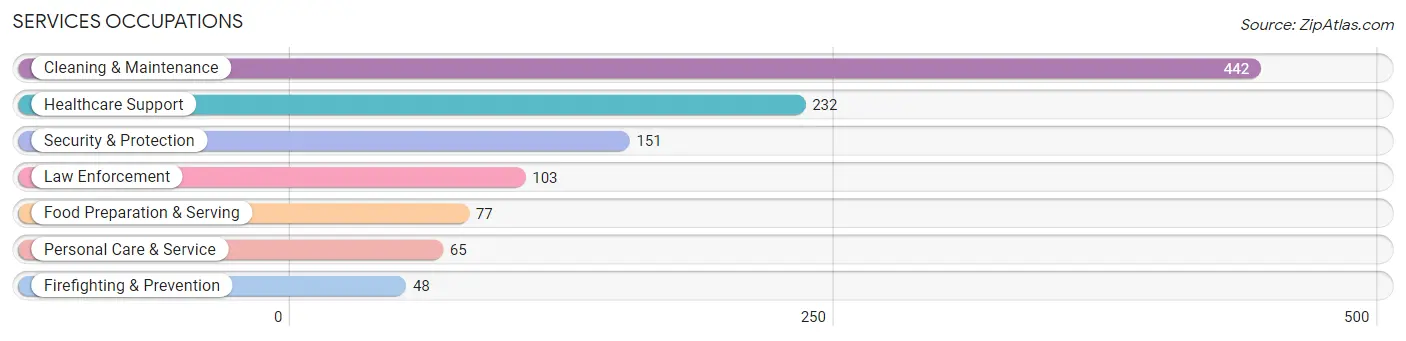
Services Occupations
The most common Services occupations in Jackson Parish are Cleaning & Maintenance (442 | 9.0%), Healthcare Support (232 | 4.7%), Security & Protection (151 | 3.1%), Law Enforcement (103 | 2.1%), and Food Preparation & Serving (77 | 1.6%).
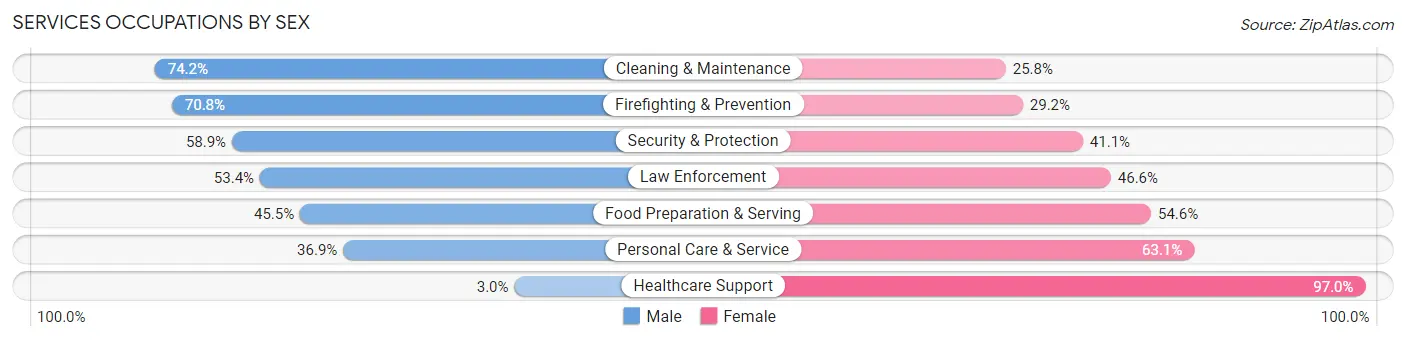
Services Occupations by Sex
Within the Services occupations in Jackson Parish, the most male-oriented occupations are Cleaning & Maintenance (74.2%), Firefighting & Prevention (70.8%), and Security & Protection (58.9%), while the most female-oriented occupations are Healthcare Support (97.0%), Personal Care & Service (63.1%), and Food Preparation & Serving (54.5%).
| Occupation | Male | Female |
| Healthcare Support | 7 (3.0%) | 225 (97.0%) |
| Security & Protection | 89 (58.9%) | 62 (41.1%) |
| Firefighting & Prevention | 34 (70.8%) | 14 (29.2%) |
| Law Enforcement | 55 (53.4%) | 48 (46.6%) |
| Food Preparation & Serving | 35 (45.5%) | 42 (54.5%) |
| Cleaning & Maintenance | 328 (74.2%) | 114 (25.8%) |
| Personal Care & Service | 24 (36.9%) | 41 (63.1%) |
| Total (Category) | 483 (49.9%) | 484 (50.0%) |
| Total (Overall) | 2,715 (55.1%) | 2,216 (44.9%) |
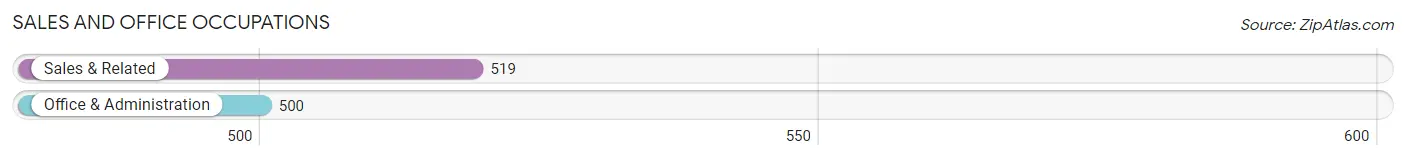
Sales and Office Occupations
The most common Sales and Office occupations in Jackson Parish are Sales & Related (519 | 10.5%), and Office & Administration (500 | 10.1%).
Sales and Office Occupations by Sex

| Occupation | Male | Female |
| Sales & Related | 237 (45.7%) | 282 (54.3%) |
| Office & Administration | 69 (13.8%) | 431 (86.2%) |
| Total (Category) | 306 (30.0%) | 713 (70.0%) |
| Total (Overall) | 2,715 (55.1%) | 2,216 (44.9%) |
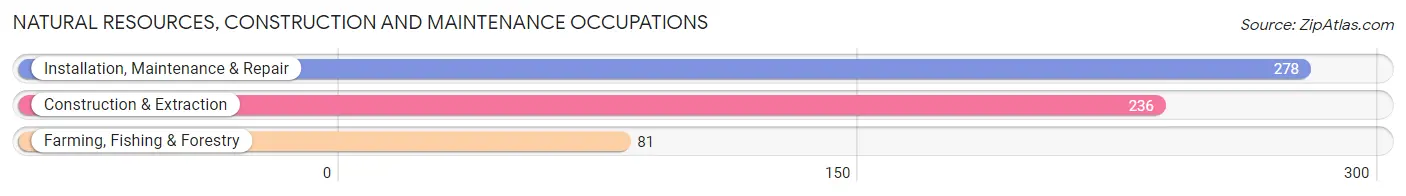
Natural Resources, Construction and Maintenance Occupations
The most common Natural Resources, Construction and Maintenance occupations in Jackson Parish are Installation, Maintenance & Repair (278 | 5.6%), Construction & Extraction (236 | 4.8%), and Farming, Fishing & Forestry (81 | 1.6%).
Natural Resources, Construction and Maintenance Occupations by Sex
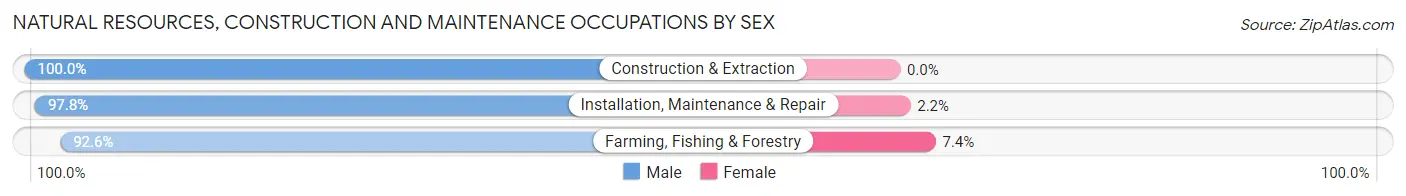
| Occupation | Male | Female |
| Farming, Fishing & Forestry | 75 (92.6%) | 6 (7.4%) |
| Construction & Extraction | 236 (100.0%) | 0 (0.0%) |
| Installation, Maintenance & Repair | 272 (97.8%) | 6 (2.2%) |
| Total (Category) | 583 (98.0%) | 12 (2.0%) |
| Total (Overall) | 2,715 (55.1%) | 2,216 (44.9%) |
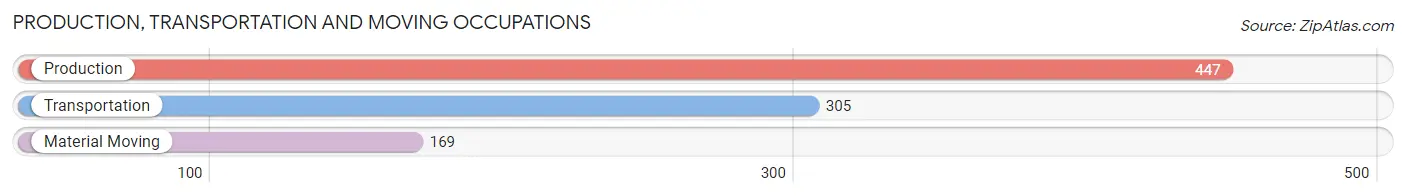
Production, Transportation and Moving Occupations
The most common Production, Transportation and Moving occupations in Jackson Parish are Production (447 | 9.1%), Transportation (305 | 6.2%), and Material Moving (169 | 3.4%).
Production, Transportation and Moving Occupations by Sex
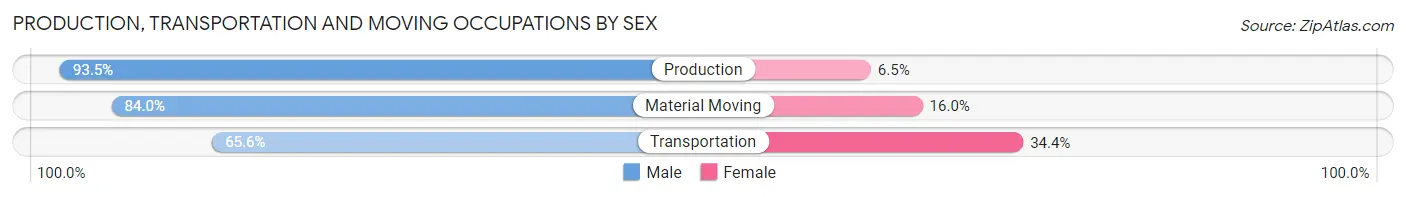
| Occupation | Male | Female |
| Production | 418 (93.5%) | 29 (6.5%) |
| Transportation | 200 (65.6%) | 105 (34.4%) |
| Material Moving | 142 (84.0%) | 27 (16.0%) |
| Total (Category) | 760 (82.5%) | 161 (17.5%) |
| Total (Overall) | 2,715 (55.1%) | 2,216 (44.9%) |
Employment Industries by Sex in Jackson Parish
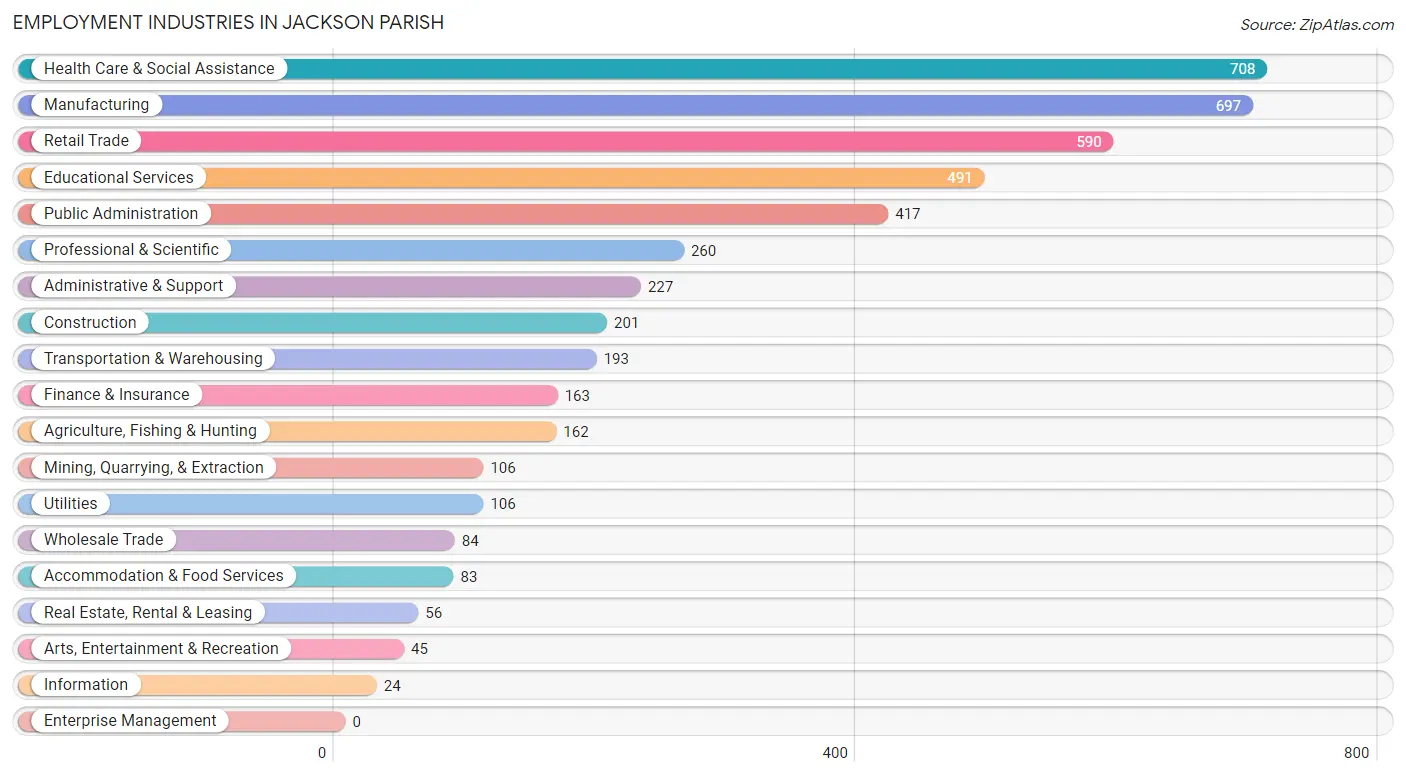
Employment Industries in Jackson Parish
The major employment industries in Jackson Parish include Health Care & Social Assistance (708 | 14.4%), Manufacturing (697 | 14.1%), Retail Trade (590 | 12.0%), Educational Services (491 | 10.0%), and Public Administration (417 | 8.5%).
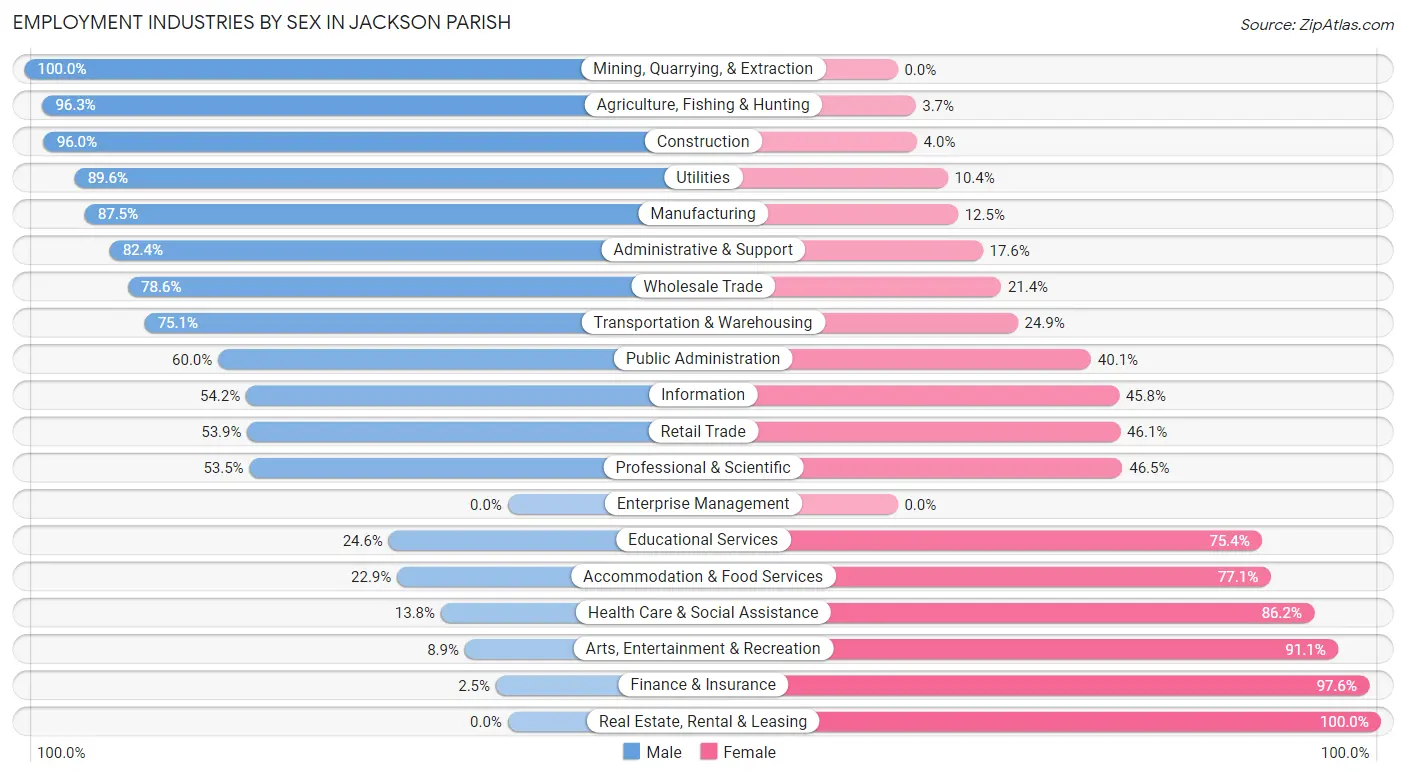
Employment Industries by Sex in Jackson Parish
The Jackson Parish industries that see more men than women are Mining, Quarrying, & Extraction (100.0%), Agriculture, Fishing & Hunting (96.3%), and Construction (96.0%), whereas the industries that tend to have a higher number of women are Real Estate, Rental & Leasing (100.0%), Finance & Insurance (97.6%), and Arts, Entertainment & Recreation (91.1%).
| Industry | Male | Female |
| Agriculture, Fishing & Hunting | 156 (96.3%) | 6 (3.7%) |
| Mining, Quarrying, & Extraction | 106 (100.0%) | 0 (0.0%) |
| Construction | 193 (96.0%) | 8 (4.0%) |
| Manufacturing | 610 (87.5%) | 87 (12.5%) |
| Wholesale Trade | 66 (78.6%) | 18 (21.4%) |
| Retail Trade | 318 (53.9%) | 272 (46.1%) |
| Transportation & Warehousing | 145 (75.1%) | 48 (24.9%) |
| Utilities | 95 (89.6%) | 11 (10.4%) |
| Information | 13 (54.2%) | 11 (45.8%) |
| Finance & Insurance | 4 (2.5%) | 159 (97.6%) |
| Real Estate, Rental & Leasing | 0 (0.0%) | 56 (100.0%) |
| Professional & Scientific | 139 (53.5%) | 121 (46.5%) |
| Enterprise Management | 0 (0.0%) | 0 (0.0%) |
| Administrative & Support | 187 (82.4%) | 40 (17.6%) |
| Educational Services | 121 (24.6%) | 370 (75.4%) |
| Health Care & Social Assistance | 98 (13.8%) | 610 (86.2%) |
| Arts, Entertainment & Recreation | 4 (8.9%) | 41 (91.1%) |
| Accommodation & Food Services | 19 (22.9%) | 64 (77.1%) |
| Public Administration | 250 (60.0%) | 167 (40.1%) |
| Total | 2,715 (55.1%) | 2,216 (44.9%) |
Education in Jackson Parish
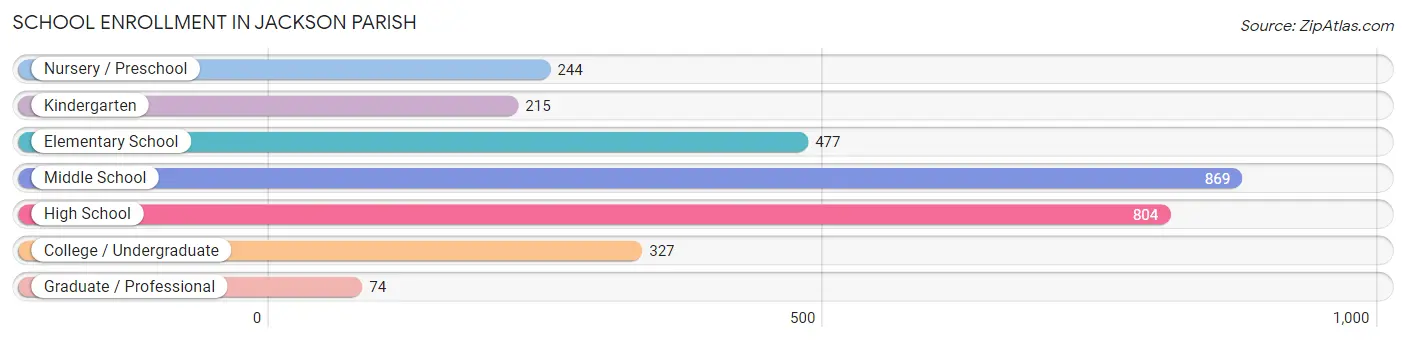
School Enrollment in Jackson Parish
The most common levels of schooling among the 3,010 students in Jackson Parish are middle school (869 | 28.9%), high school (804 | 26.7%), and elementary school (477 | 15.9%).
| School Level | # Students | % Students |
| Nursery / Preschool | 244 | 8.1% |
| Kindergarten | 215 | 7.1% |
| Elementary School | 477 | 15.9% |
| Middle School | 869 | 28.9% |
| High School | 804 | 26.7% |
| College / Undergraduate | 327 | 10.9% |
| Graduate / Professional | 74 | 2.5% |
| Total | 3,010 | 100.0% |
School Enrollment by Age by Funding Source in Jackson Parish
Out of a total of 3,010 students who are enrolled in schools in Jackson Parish, 427 (14.2%) attend a private institution, while the remaining 2,583 (85.8%) are enrolled in public schools. The age group of 35 years and over has the highest likelihood of being enrolled in private schools, with 42 (42.9% in the age bracket) enrolled. Conversely, the age group of 18 to 19 year olds has the lowest likelihood of being enrolled in a private school, with 117 (95.9% in the age bracket) attending a public institution.
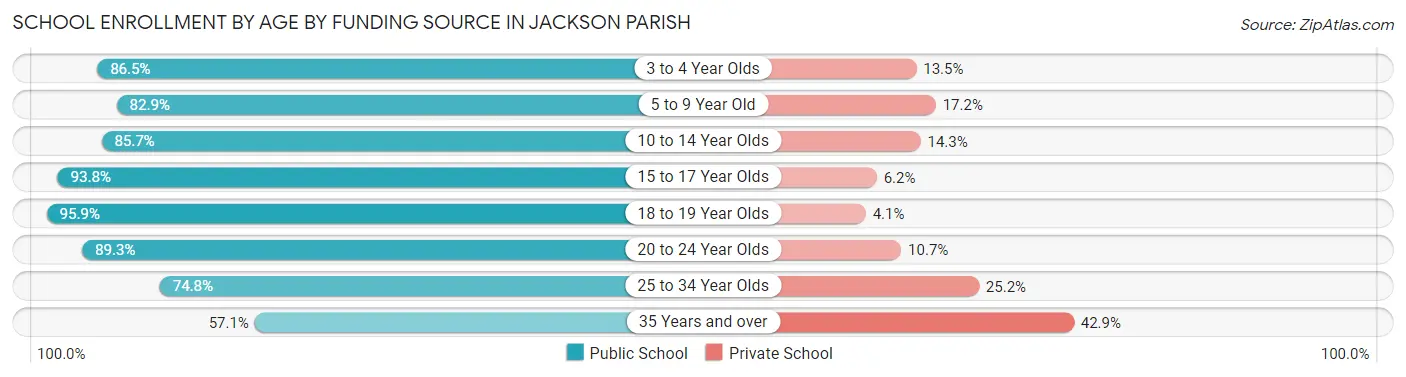
| Age Bracket | Public School | Private School |
| 3 to 4 Year Olds | 179 (86.5%) | 28 (13.5%) |
| 5 to 9 Year Old | 604 (82.9%) | 125 (17.2%) |
| 10 to 14 Year Olds | 832 (85.7%) | 139 (14.3%) |
| 15 to 17 Year Olds | 548 (93.8%) | 36 (6.2%) |
| 18 to 19 Year Olds | 117 (95.9%) | 5 (4.1%) |
| 20 to 24 Year Olds | 150 (89.3%) | 18 (10.7%) |
| 25 to 34 Year Olds | 98 (74.8%) | 33 (25.2%) |
| 35 Years and over | 56 (57.1%) | 42 (42.9%) |
| Total | 2,583 (85.8%) | 427 (14.2%) |
Educational Attainment by Field of Study in Jackson Parish
Business (249 | 17.0%), education (241 | 16.5%), science & technology (230 | 15.7%), computers & mathematics (136 | 9.3%), and bio, nature & agricultural (134 | 9.1%) are the most common fields of study among 1,464 individuals in Jackson Parish who have obtained a bachelor's degree or higher.
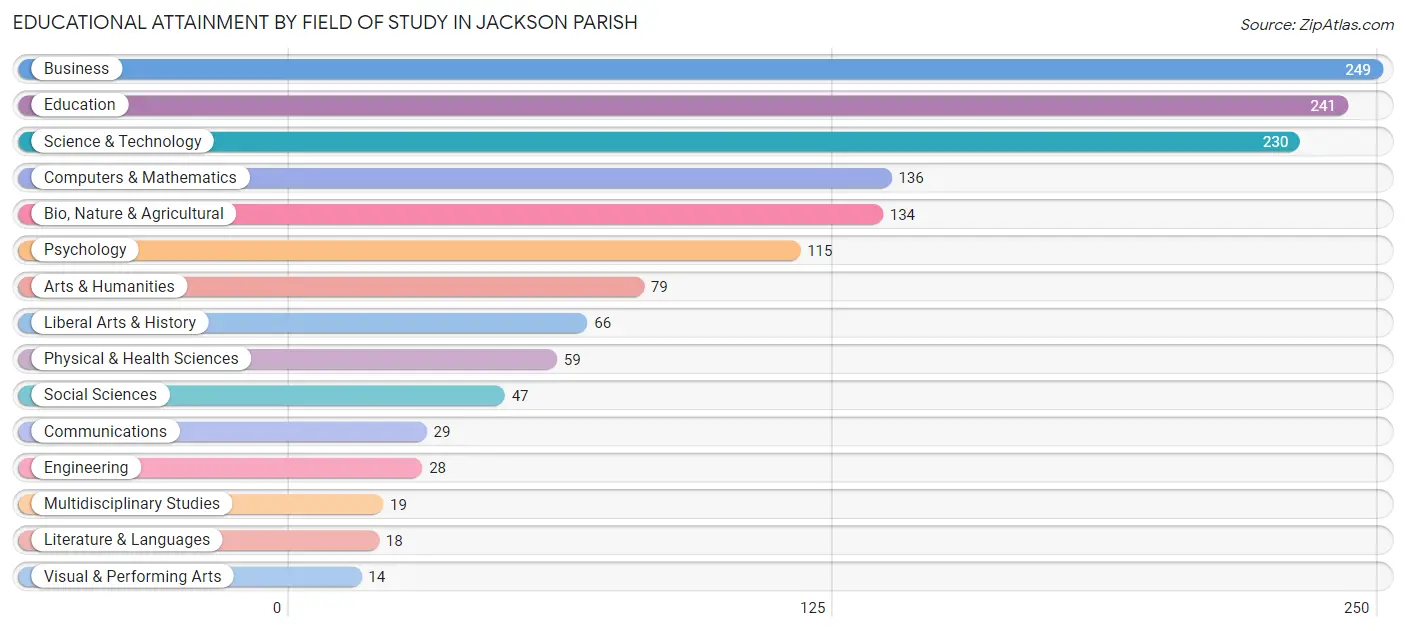
| Field of Study | # Graduates | % Graduates |
| Computers & Mathematics | 136 | 9.3% |
| Bio, Nature & Agricultural | 134 | 9.1% |
| Physical & Health Sciences | 59 | 4.0% |
| Psychology | 115 | 7.9% |
| Social Sciences | 47 | 3.2% |
| Engineering | 28 | 1.9% |
| Multidisciplinary Studies | 19 | 1.3% |
| Science & Technology | 230 | 15.7% |
| Business | 249 | 17.0% |
| Education | 241 | 16.5% |
| Literature & Languages | 18 | 1.2% |
| Liberal Arts & History | 66 | 4.5% |
| Visual & Performing Arts | 14 | 1.0% |
| Communications | 29 | 2.0% |
| Arts & Humanities | 79 | 5.4% |
| Total | 1,464 | 100.0% |
Transportation & Commute in Jackson Parish
Vehicle Availability by Sex in Jackson Parish
The most prevalent vehicle ownership categories in Jackson Parish are males with 2 vehicles (1,069, accounting for 39.9%) and females with 2 vehicles (598, making up 49.0%).
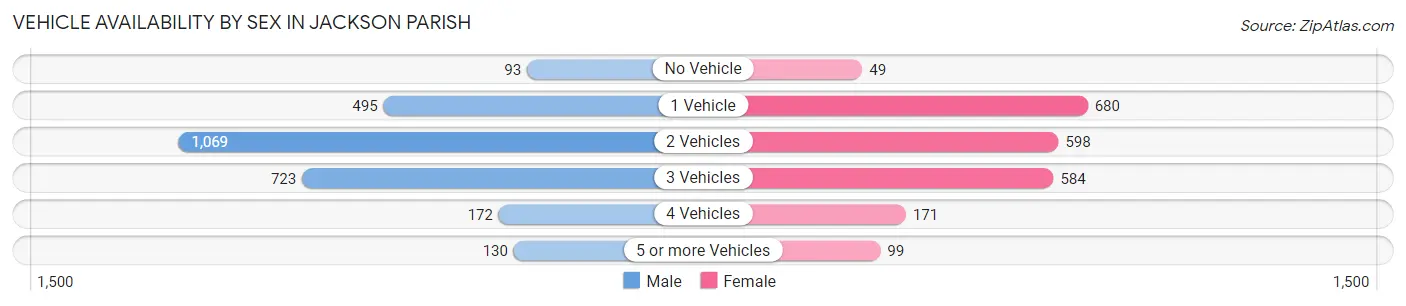
| Vehicles Available | Male | Female |
| No Vehicle | 93 (3.5%) | 49 (2.2%) |
| 1 Vehicle | 495 (18.5%) | 680 (31.2%) |
| 2 Vehicles | 1,069 (39.9%) | 598 (27.4%) |
| 3 Vehicles | 723 (27.0%) | 584 (26.8%) |
| 4 Vehicles | 172 (6.4%) | 171 (7.8%) |
| 5 or more Vehicles | 130 (4.9%) | 99 (4.5%) |
| Total | 2,682 (100.0%) | 2,181 (100.0%) |
Commute Time in Jackson Parish
The most frequently occuring commute durations in Jackson Parish are 10 to 14 minutes (693 commuters, 14.9%), 15 to 19 minutes (672 commuters, 14.4%), and 30 to 34 minutes (561 commuters, 12.1%).
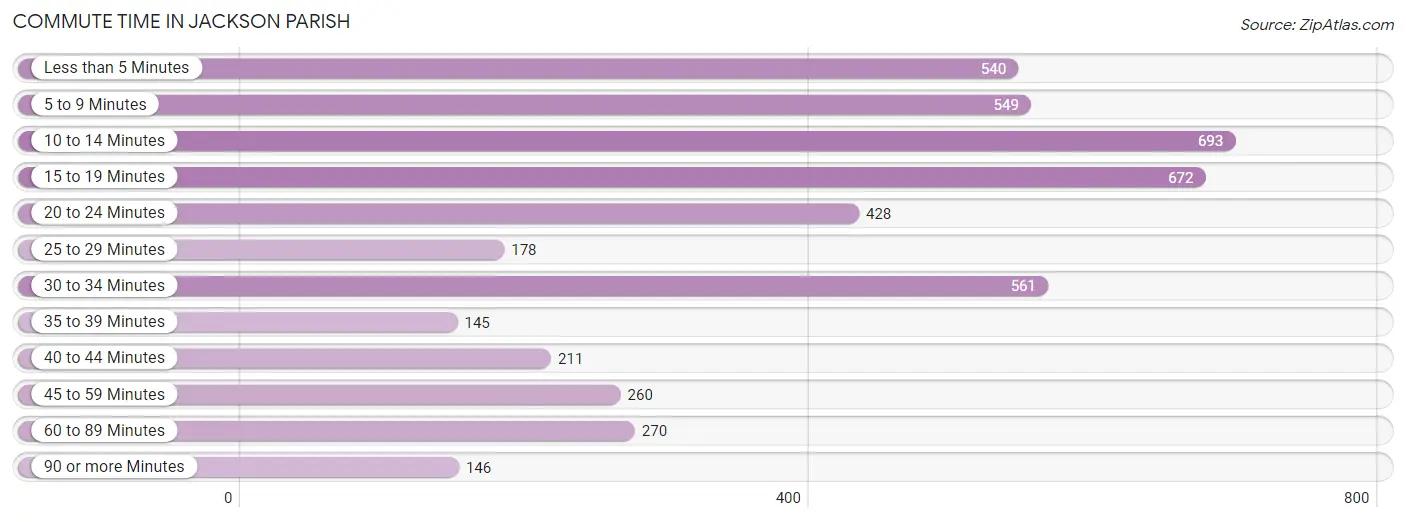
| Commute Time | # Commuters | % Commuters |
| Less than 5 Minutes | 540 | 11.6% |
| 5 to 9 Minutes | 549 | 11.8% |
| 10 to 14 Minutes | 693 | 14.9% |
| 15 to 19 Minutes | 672 | 14.4% |
| 20 to 24 Minutes | 428 | 9.2% |
| 25 to 29 Minutes | 178 | 3.8% |
| 30 to 34 Minutes | 561 | 12.1% |
| 35 to 39 Minutes | 145 | 3.1% |
| 40 to 44 Minutes | 211 | 4.5% |
| 45 to 59 Minutes | 260 | 5.6% |
| 60 to 89 Minutes | 270 | 5.8% |
| 90 or more Minutes | 146 | 3.1% |
Commute Time by Sex in Jackson Parish
The most common commute times in Jackson Parish are 15 to 19 minutes (358 commuters, 13.7%) for males and 10 to 14 minutes (337 commuters, 16.5%) for females.
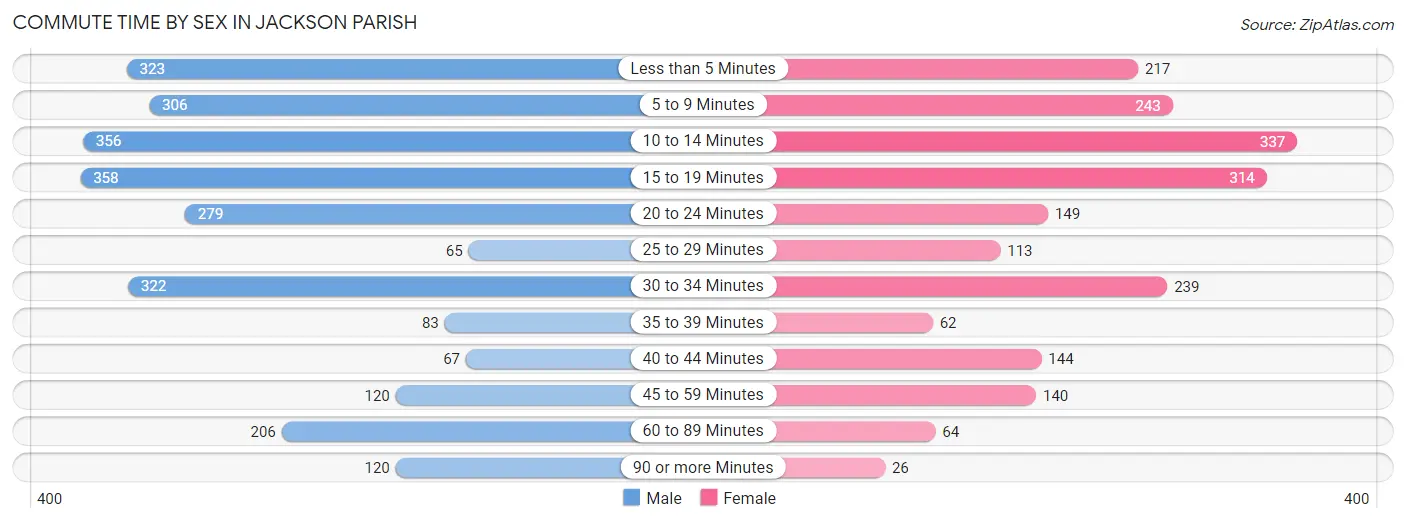
| Commute Time | Male | Female |
| Less than 5 Minutes | 323 (12.4%) | 217 (10.6%) |
| 5 to 9 Minutes | 306 (11.7%) | 243 (11.9%) |
| 10 to 14 Minutes | 356 (13.7%) | 337 (16.5%) |
| 15 to 19 Minutes | 358 (13.7%) | 314 (15.3%) |
| 20 to 24 Minutes | 279 (10.7%) | 149 (7.3%) |
| 25 to 29 Minutes | 65 (2.5%) | 113 (5.5%) |
| 30 to 34 Minutes | 322 (12.4%) | 239 (11.7%) |
| 35 to 39 Minutes | 83 (3.2%) | 62 (3.0%) |
| 40 to 44 Minutes | 67 (2.6%) | 144 (7.0%) |
| 45 to 59 Minutes | 120 (4.6%) | 140 (6.8%) |
| 60 to 89 Minutes | 206 (7.9%) | 64 (3.1%) |
| 90 or more Minutes | 120 (4.6%) | 26 (1.3%) |
Time of Departure to Work by Sex in Jackson Parish
The most frequent times of departure to work in Jackson Parish are 7:00 AM to 7:29 AM (522, 20.0%) for males and 6:00 AM to 6:29 AM (295, 14.4%) for females.
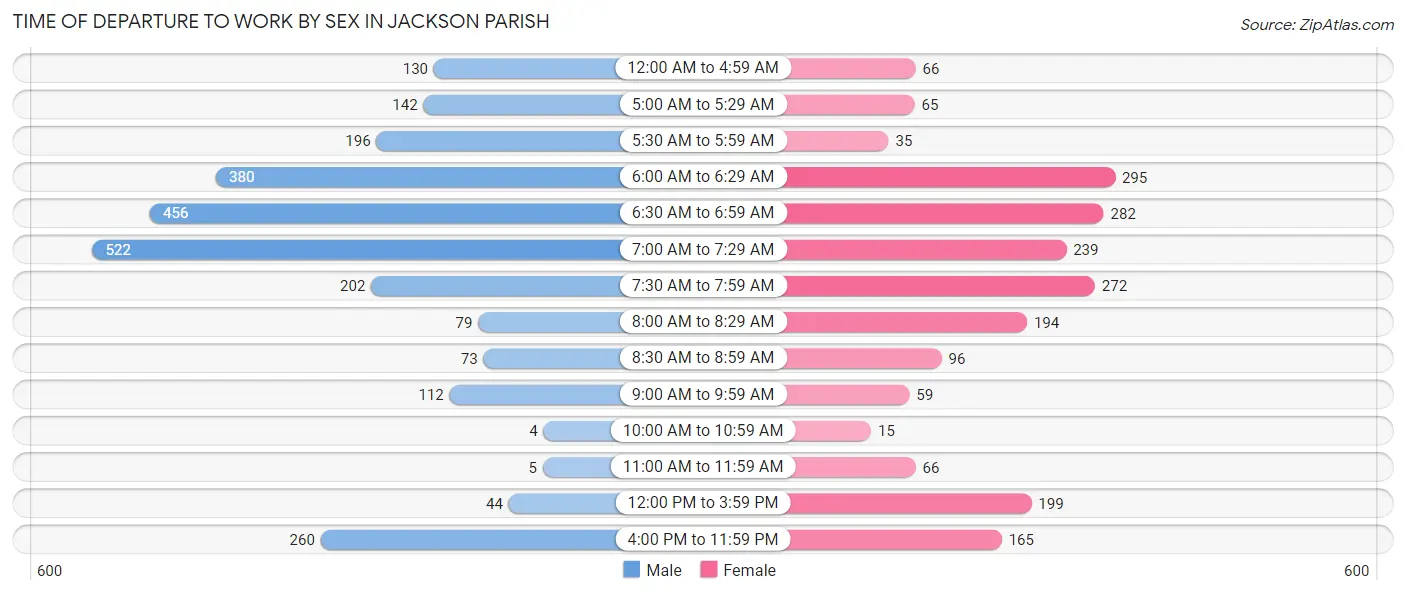
| Time of Departure | Male | Female |
| 12:00 AM to 4:59 AM | 130 (5.0%) | 66 (3.2%) |
| 5:00 AM to 5:29 AM | 142 (5.4%) | 65 (3.2%) |
| 5:30 AM to 5:59 AM | 196 (7.5%) | 35 (1.7%) |
| 6:00 AM to 6:29 AM | 380 (14.6%) | 295 (14.4%) |
| 6:30 AM to 6:59 AM | 456 (17.5%) | 282 (13.8%) |
| 7:00 AM to 7:29 AM | 522 (20.0%) | 239 (11.7%) |
| 7:30 AM to 7:59 AM | 202 (7.7%) | 272 (13.3%) |
| 8:00 AM to 8:29 AM | 79 (3.0%) | 194 (9.5%) |
| 8:30 AM to 8:59 AM | 73 (2.8%) | 96 (4.7%) |
| 9:00 AM to 9:59 AM | 112 (4.3%) | 59 (2.9%) |
| 10:00 AM to 10:59 AM | 4 (0.2%) | 15 (0.7%) |
| 11:00 AM to 11:59 AM | 5 (0.2%) | 66 (3.2%) |
| 12:00 PM to 3:59 PM | 44 (1.7%) | 199 (9.7%) |
| 4:00 PM to 11:59 PM | 260 (10.0%) | 165 (8.1%) |
| Total | 2,605 (100.0%) | 2,048 (100.0%) |
Housing Occupancy in Jackson Parish
Occupancy by Ownership in Jackson Parish
Of the total 5,461 dwellings in Jackson Parish, owner-occupied units account for 3,743 (68.5%), while renter-occupied units make up 1,718 (31.5%).
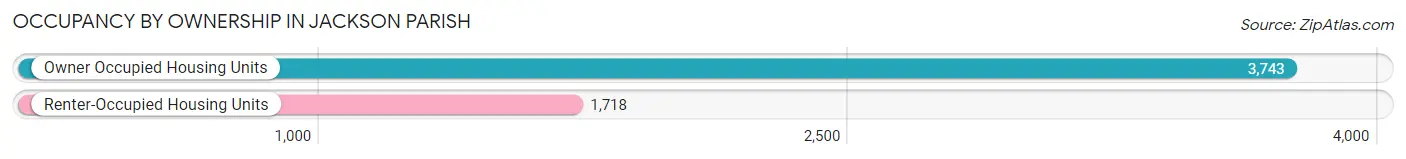
| Occupancy | # Housing Units | % Housing Units |
| Owner Occupied Housing Units | 3,743 | 68.5% |
| Renter-Occupied Housing Units | 1,718 | 31.5% |
| Total Occupied Housing Units | 5,461 | 100.0% |
Occupancy by Household Size in Jackson Parish
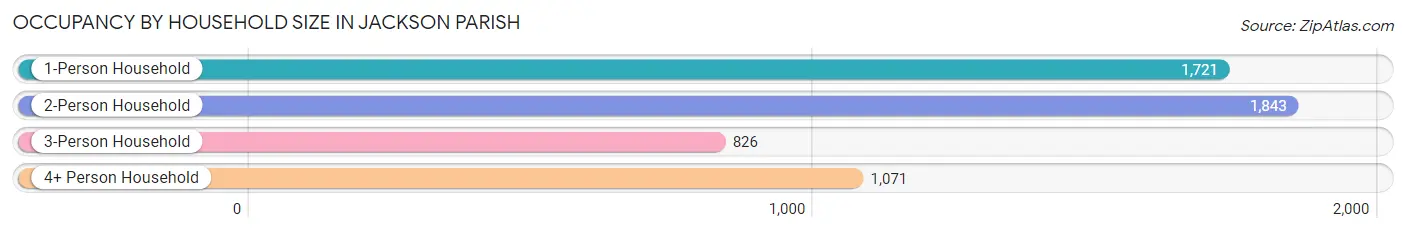
| Household Size | # Housing Units | % Housing Units |
| 1-Person Household | 1,721 | 31.5% |
| 2-Person Household | 1,843 | 33.8% |
| 3-Person Household | 826 | 15.1% |
| 4+ Person Household | 1,071 | 19.6% |
| Total Housing Units | 5,461 | 100.0% |
Occupancy by Ownership by Household Size in Jackson Parish
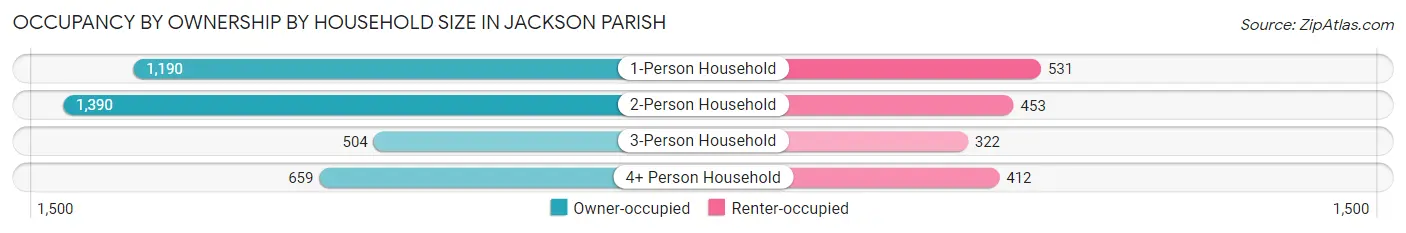
| Household Size | Owner-occupied | Renter-occupied |
| 1-Person Household | 1,190 (69.2%) | 531 (30.8%) |
| 2-Person Household | 1,390 (75.4%) | 453 (24.6%) |
| 3-Person Household | 504 (61.0%) | 322 (39.0%) |
| 4+ Person Household | 659 (61.5%) | 412 (38.5%) |
| Total Housing Units | 3,743 (68.5%) | 1,718 (31.5%) |
Occupancy by Educational Attainment in Jackson Parish
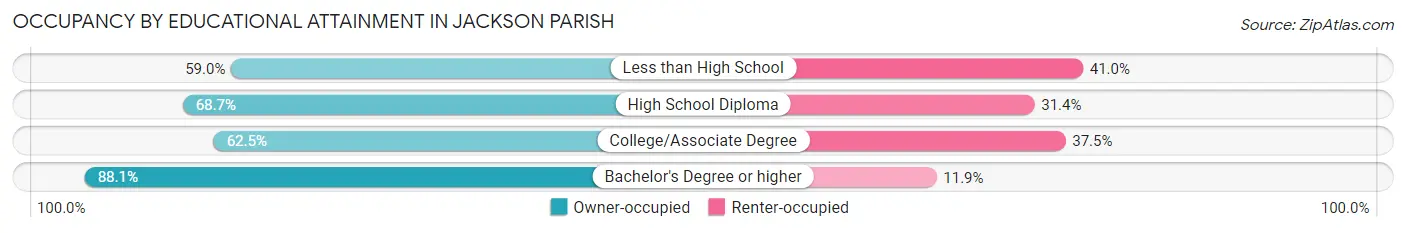
| Household Size | Owner-occupied | Renter-occupied |
| Less than High School | 428 (59.0%) | 297 (41.0%) |
| High School Diploma | 1,572 (68.6%) | 718 (31.4%) |
| College/Associate Degree | 1,005 (62.5%) | 603 (37.5%) |
| Bachelor's Degree or higher | 738 (88.1%) | 100 (11.9%) |
Occupancy by Age of Householder in Jackson Parish
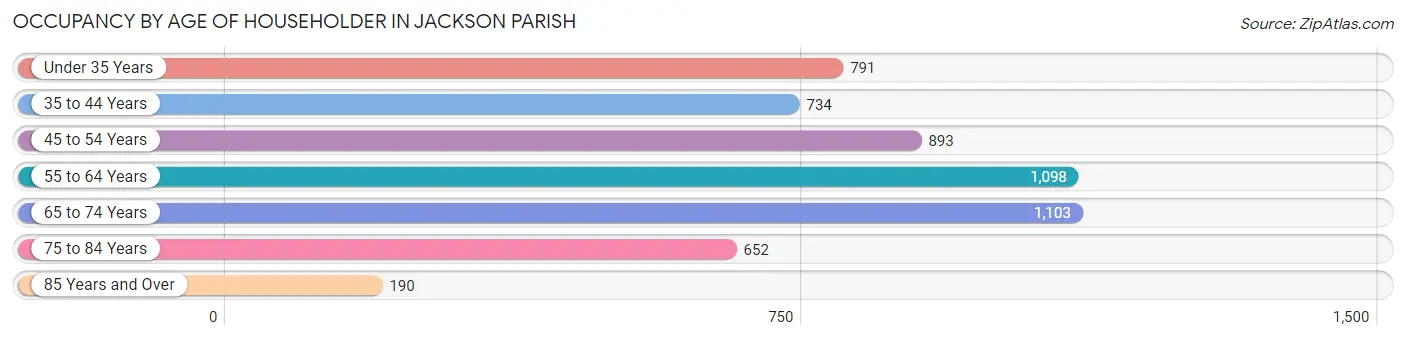
| Age Bracket | # Households | % Households |
| Under 35 Years | 791 | 14.5% |
| 35 to 44 Years | 734 | 13.4% |
| 45 to 54 Years | 893 | 16.4% |
| 55 to 64 Years | 1,098 | 20.1% |
| 65 to 74 Years | 1,103 | 20.2% |
| 75 to 84 Years | 652 | 11.9% |
| 85 Years and Over | 190 | 3.5% |
| Total | 5,461 | 100.0% |
Housing Finances in Jackson Parish
Median Income by Occupancy in Jackson Parish
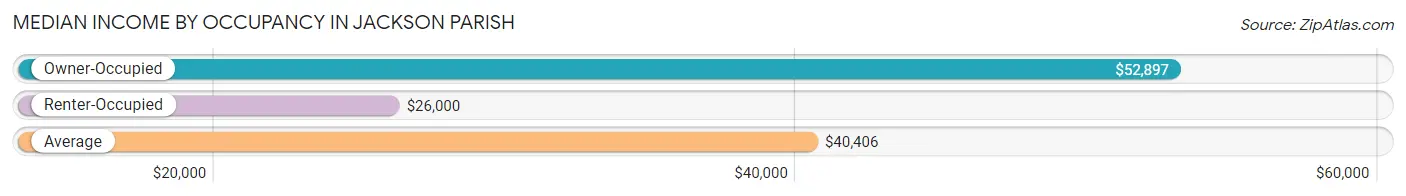
| Occupancy Type | # Households | Median Income |
| Owner-Occupied | 3,743 (68.5%) | $52,897 |
| Renter-Occupied | 1,718 (31.5%) | $26,000 |
| Average | 5,461 (100.0%) | $40,406 |
Occupancy by Householder Income Bracket in Jackson Parish
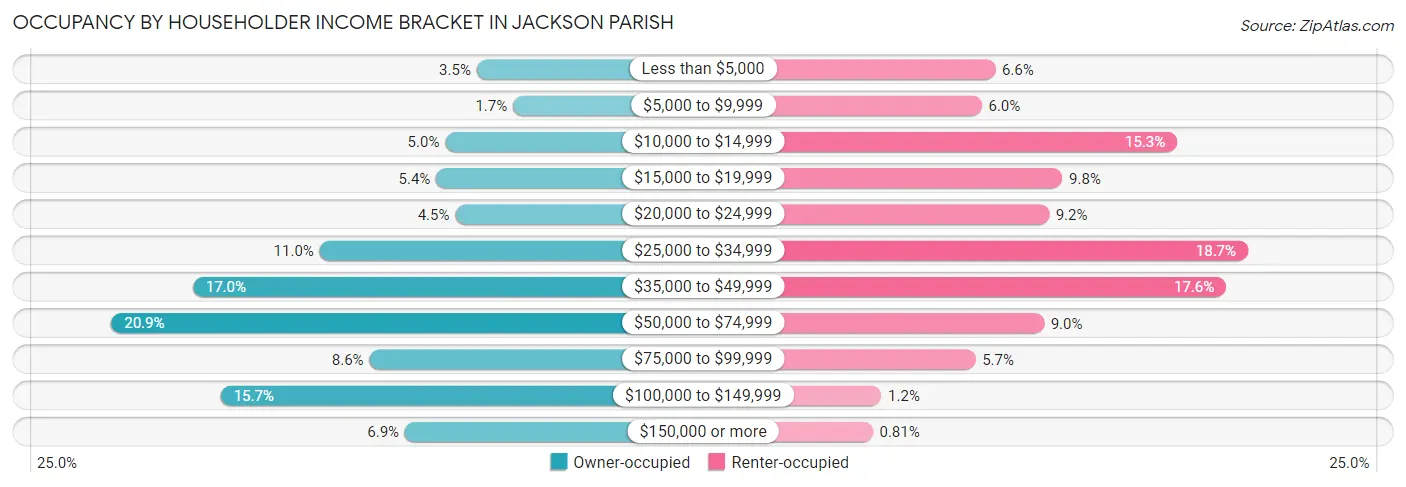
| Income Bracket | Owner-occupied | Renter-occupied |
| Less than $5,000 | 130 (3.5%) | 114 (6.6%) |
| $5,000 to $9,999 | 65 (1.7%) | 103 (6.0%) |
| $10,000 to $14,999 | 186 (5.0%) | 263 (15.3%) |
| $15,000 to $19,999 | 202 (5.4%) | 169 (9.8%) |
| $20,000 to $24,999 | 168 (4.5%) | 158 (9.2%) |
| $25,000 to $34,999 | 410 (11.0%) | 321 (18.7%) |
| $35,000 to $49,999 | 636 (17.0%) | 303 (17.6%) |
| $50,000 to $74,999 | 781 (20.9%) | 154 (9.0%) |
| $75,000 to $99,999 | 321 (8.6%) | 98 (5.7%) |
| $100,000 to $149,999 | 586 (15.7%) | 21 (1.2%) |
| $150,000 or more | 258 (6.9%) | 14 (0.8%) |
| Total | 3,743 (100.0%) | 1,718 (100.0%) |
Monthly Housing Cost Tiers in Jackson Parish
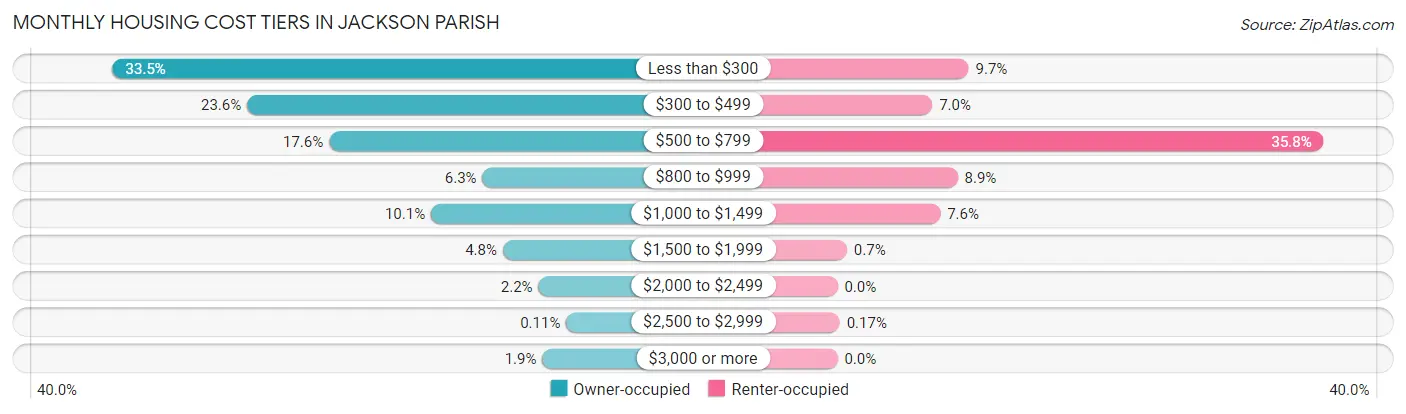
| Monthly Cost | Owner-occupied | Renter-occupied |
| Less than $300 | 1,255 (33.5%) | 166 (9.7%) |
| $300 to $499 | 884 (23.6%) | 120 (7.0%) |
| $500 to $799 | 658 (17.6%) | 615 (35.8%) |
| $800 to $999 | 235 (6.3%) | 152 (8.8%) |
| $1,000 to $1,499 | 377 (10.1%) | 130 (7.6%) |
| $1,500 to $1,999 | 179 (4.8%) | 12 (0.7%) |
| $2,000 to $2,499 | 81 (2.2%) | 0 (0.0%) |
| $2,500 to $2,999 | 4 (0.1%) | 3 (0.2%) |
| $3,000 or more | 70 (1.9%) | 0 (0.0%) |
| Total | 3,743 (100.0%) | 1,718 (100.0%) |
Physical Housing Characteristics in Jackson Parish
Housing Structures in Jackson Parish
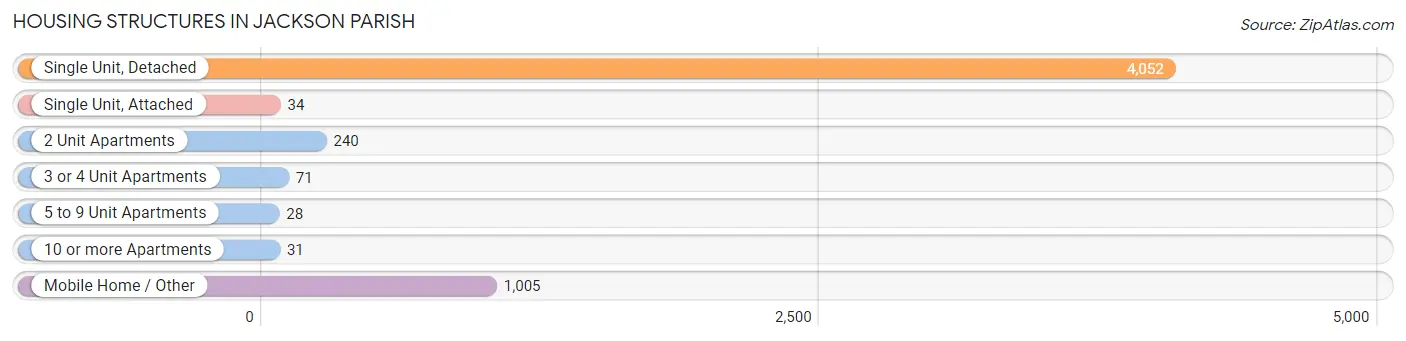
| Structure Type | # Housing Units | % Housing Units |
| Single Unit, Detached | 4,052 | 74.2% |
| Single Unit, Attached | 34 | 0.6% |
| 2 Unit Apartments | 240 | 4.4% |
| 3 or 4 Unit Apartments | 71 | 1.3% |
| 5 to 9 Unit Apartments | 28 | 0.5% |
| 10 or more Apartments | 31 | 0.6% |
| Mobile Home / Other | 1,005 | 18.4% |
| Total | 5,461 | 100.0% |
Housing Structures by Occupancy in Jackson Parish
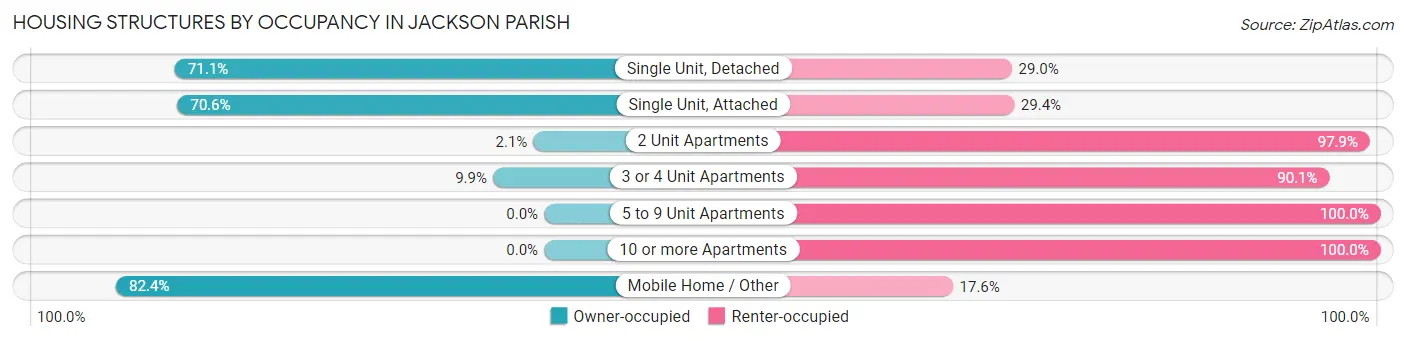
| Structure Type | Owner-occupied | Renter-occupied |
| Single Unit, Detached | 2,879 (71.1%) | 1,173 (28.9%) |
| Single Unit, Attached | 24 (70.6%) | 10 (29.4%) |
| 2 Unit Apartments | 5 (2.1%) | 235 (97.9%) |
| 3 or 4 Unit Apartments | 7 (9.9%) | 64 (90.1%) |
| 5 to 9 Unit Apartments | 0 (0.0%) | 28 (100.0%) |
| 10 or more Apartments | 0 (0.0%) | 31 (100.0%) |
| Mobile Home / Other | 828 (82.4%) | 177 (17.6%) |
| Total | 3,743 (68.5%) | 1,718 (31.5%) |
Housing Structures by Number of Rooms in Jackson Parish
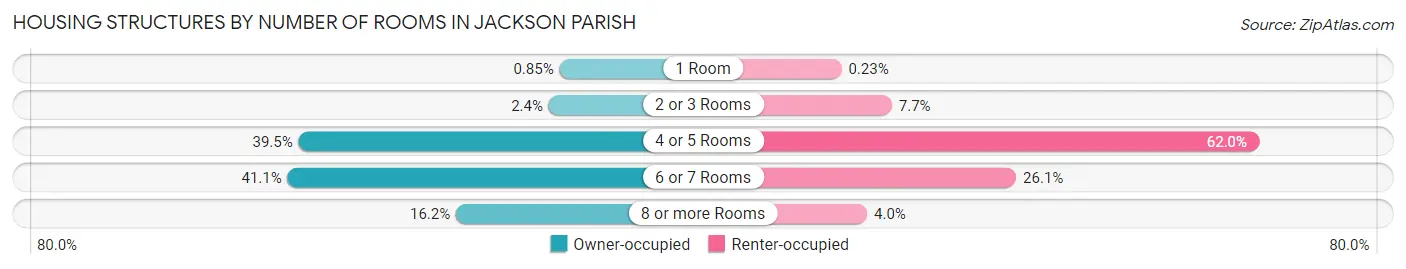
| Number of Rooms | Owner-occupied | Renter-occupied |
| 1 Room | 32 (0.9%) | 4 (0.2%) |
| 2 or 3 Rooms | 91 (2.4%) | 132 (7.7%) |
| 4 or 5 Rooms | 1,477 (39.5%) | 1,065 (62.0%) |
| 6 or 7 Rooms | 1,538 (41.1%) | 448 (26.1%) |
| 8 or more Rooms | 605 (16.2%) | 69 (4.0%) |
| Total | 3,743 (100.0%) | 1,718 (100.0%) |
Housing Structure by Heating Type in Jackson Parish
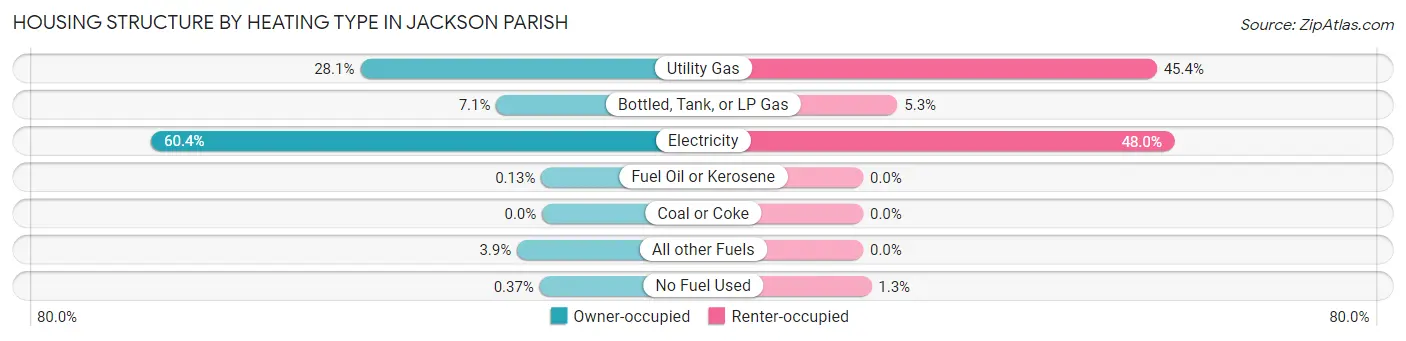
| Heating Type | Owner-occupied | Renter-occupied |
| Utility Gas | 1,052 (28.1%) | 780 (45.4%) |
| Bottled, Tank, or LP Gas | 265 (7.1%) | 91 (5.3%) |
| Electricity | 2,262 (60.4%) | 825 (48.0%) |
| Fuel Oil or Kerosene | 5 (0.1%) | 0 (0.0%) |
| Coal or Coke | 0 (0.0%) | 0 (0.0%) |
| All other Fuels | 145 (3.9%) | 0 (0.0%) |
| No Fuel Used | 14 (0.4%) | 22 (1.3%) |
| Total | 3,743 (100.0%) | 1,718 (100.0%) |
Household Vehicle Usage in Jackson Parish
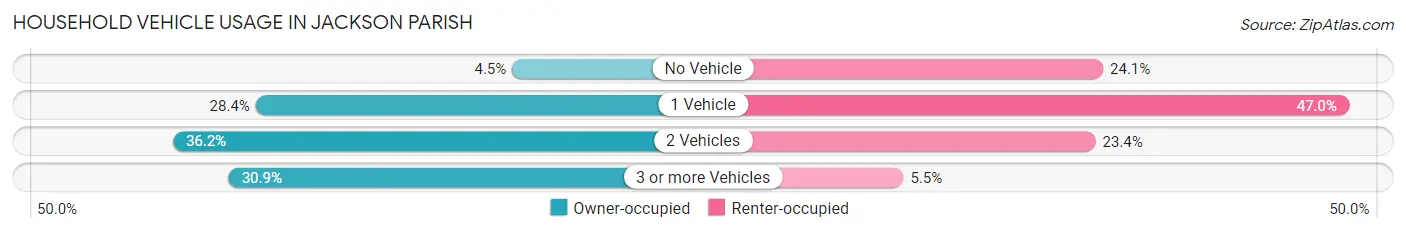
| Vehicles per Household | Owner-occupied | Renter-occupied |
| No Vehicle | 168 (4.5%) | 414 (24.1%) |
| 1 Vehicle | 1,064 (28.4%) | 808 (47.0%) |
| 2 Vehicles | 1,353 (36.1%) | 402 (23.4%) |
| 3 or more Vehicles | 1,158 (30.9%) | 94 (5.5%) |
| Total | 3,743 (100.0%) | 1,718 (100.0%) |
Real Estate & Mortgages in Jackson Parish
Real Estate and Mortgage Overview in Jackson Parish
| Characteristic | Without Mortgage | With Mortgage |
| Housing Units | 2,551 | 1,192 |
| Median Property Value | $89,900 | $160,800 |
| Median Household Income | $44,341 | $150 |
| Monthly Housing Costs | $302 | $60 |
| Real Estate Taxes | $330 | $301 |
Property Value by Mortgage Status in Jackson Parish
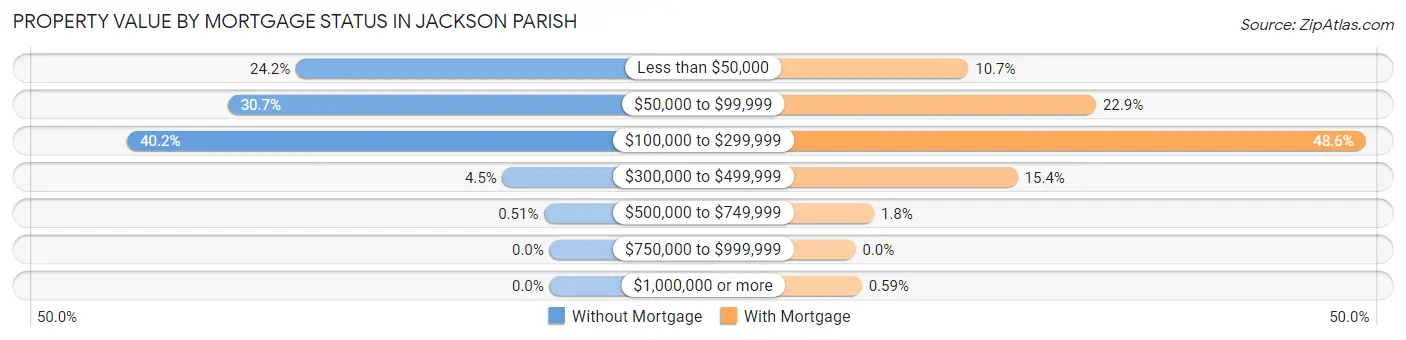
| Property Value | Without Mortgage | With Mortgage |
| Less than $50,000 | 616 (24.1%) | 128 (10.7%) |
| $50,000 to $99,999 | 782 (30.6%) | 273 (22.9%) |
| $100,000 to $299,999 | 1,026 (40.2%) | 579 (48.6%) |
| $300,000 to $499,999 | 114 (4.5%) | 184 (15.4%) |
| $500,000 to $749,999 | 13 (0.5%) | 21 (1.8%) |
| $750,000 to $999,999 | 0 (0.0%) | 0 (0.0%) |
| $1,000,000 or more | 0 (0.0%) | 7 (0.6%) |
| Total | 2,551 (100.0%) | 1,192 (100.0%) |
Household Income by Mortgage Status in Jackson Parish
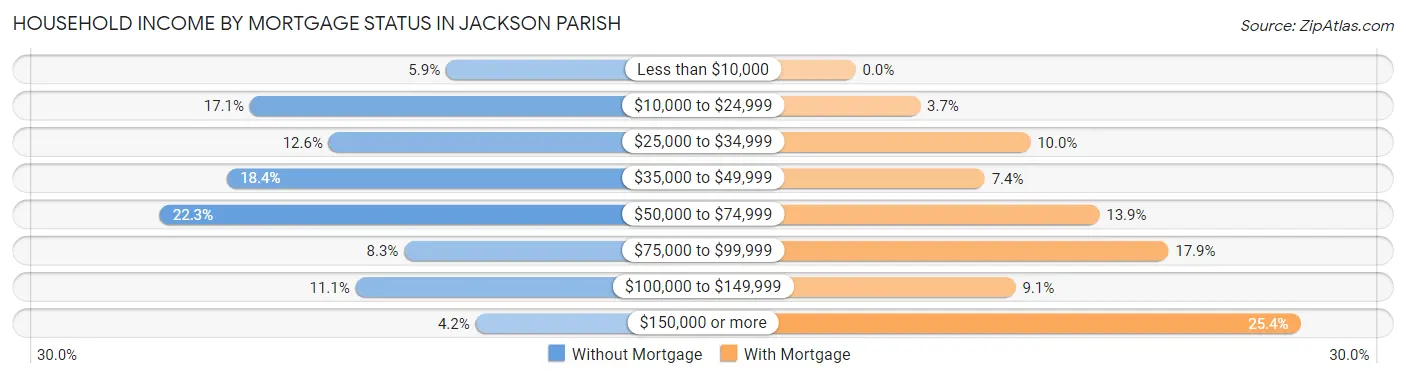
| Household Income | Without Mortgage | With Mortgage |
| Less than $10,000 | 151 (5.9%) | 0 (0.0%) |
| $10,000 to $24,999 | 437 (17.1%) | 44 (3.7%) |
| $25,000 to $34,999 | 322 (12.6%) | 119 (10.0%) |
| $35,000 to $49,999 | 470 (18.4%) | 88 (7.4%) |
| $50,000 to $74,999 | 568 (22.3%) | 166 (13.9%) |
| $75,000 to $99,999 | 212 (8.3%) | 213 (17.9%) |
| $100,000 to $149,999 | 283 (11.1%) | 109 (9.1%) |
| $150,000 or more | 108 (4.2%) | 303 (25.4%) |
| Total | 2,551 (100.0%) | 1,192 (100.0%) |
Property Value to Household Income Ratio in Jackson Parish
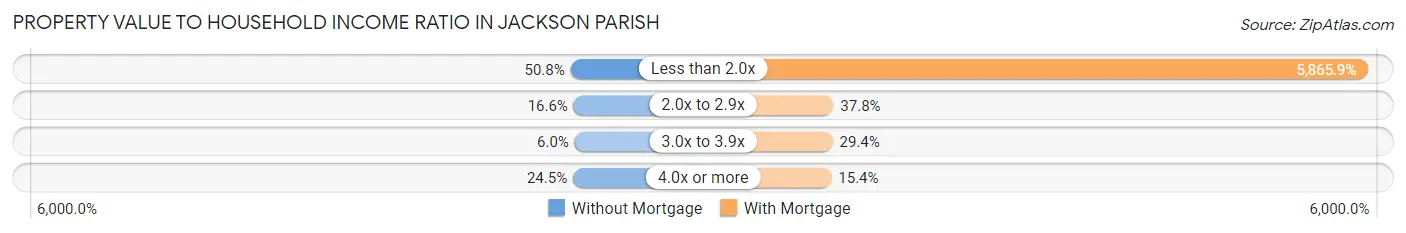
| Value-to-Income Ratio | Without Mortgage | With Mortgage |
| Less than 2.0x | 1,297 (50.8%) | 69,922 (5,865.9%) |
| 2.0x to 2.9x | 424 (16.6%) | 451 (37.8%) |
| 3.0x to 3.9x | 153 (6.0%) | 350 (29.4%) |
| 4.0x or more | 624 (24.5%) | 183 (15.3%) |
| Total | 2,551 (100.0%) | 1,192 (100.0%) |
Real Estate Taxes by Mortgage Status in Jackson Parish
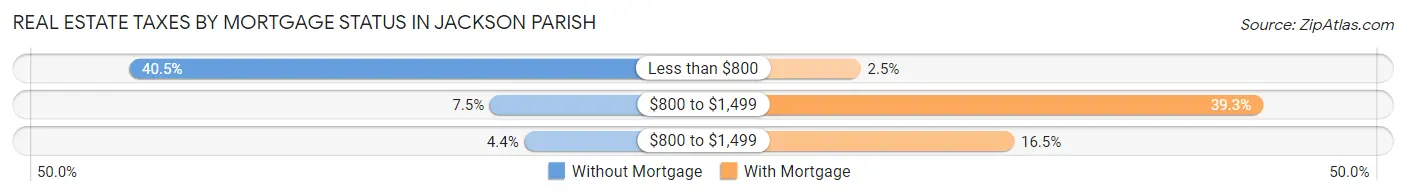
| Property Taxes | Without Mortgage | With Mortgage |
| Less than $800 | 1,032 (40.5%) | 30 (2.5%) |
| $800 to $1,499 | 191 (7.5%) | 468 (39.3%) |
| $800 to $1,499 | 111 (4.3%) | 197 (16.5%) |
| Total | 2,551 (100.0%) | 1,192 (100.0%) |
Health & Disability in Jackson Parish
Health Insurance Coverage by Age in Jackson Parish
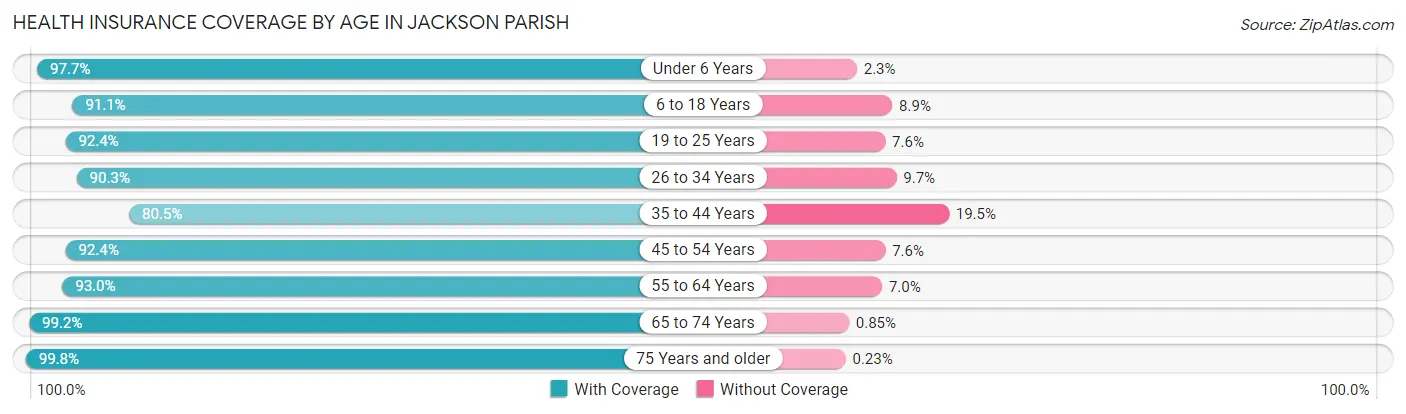
| Age Bracket | With Coverage | Without Coverage |
| Under 6 Years | 1,007 (97.7%) | 24 (2.3%) |
| 6 to 18 Years | 2,161 (91.1%) | 212 (8.9%) |
| 19 to 25 Years | 921 (92.4%) | 76 (7.6%) |
| 26 to 34 Years | 1,422 (90.3%) | 153 (9.7%) |
| 35 to 44 Years | 1,173 (80.5%) | 284 (19.5%) |
| 45 to 54 Years | 1,611 (92.4%) | 133 (7.6%) |
| 55 to 64 Years | 1,891 (93.0%) | 143 (7.0%) |
| 65 to 74 Years | 1,627 (99.2%) | 14 (0.9%) |
| 75 Years and older | 1,290 (99.8%) | 3 (0.2%) |
| Total | 13,103 (92.6%) | 1,042 (7.4%) |
Health Insurance Coverage by Citizenship Status in Jackson Parish
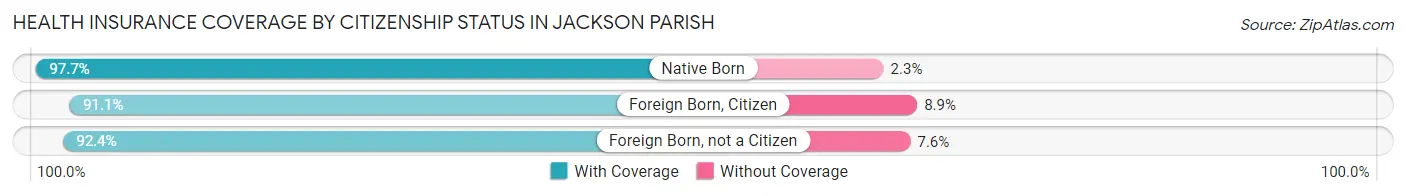
| Citizenship Status | With Coverage | Without Coverage |
| Native Born | 1,007 (97.7%) | 24 (2.3%) |
| Foreign Born, Citizen | 2,161 (91.1%) | 212 (8.9%) |
| Foreign Born, not a Citizen | 921 (92.4%) | 76 (7.6%) |
Health Insurance Coverage by Household Income in Jackson Parish
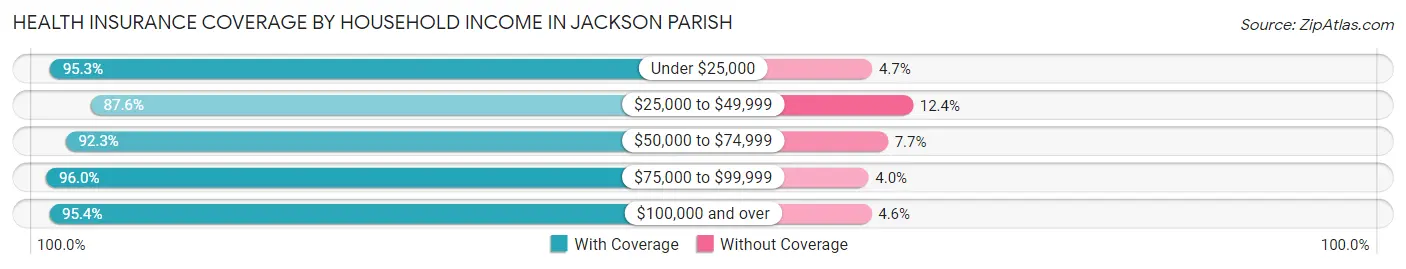
| Household Income | With Coverage | Without Coverage |
| Under $25,000 | 3,130 (95.3%) | 155 (4.7%) |
| $25,000 to $49,999 | 3,464 (87.6%) | 489 (12.4%) |
| $50,000 to $74,999 | 2,460 (92.3%) | 204 (7.7%) |
| $75,000 to $99,999 | 1,212 (96.0%) | 51 (4.0%) |
| $100,000 and over | 2,824 (95.4%) | 136 (4.6%) |
Public vs Private Health Insurance Coverage by Age in Jackson Parish
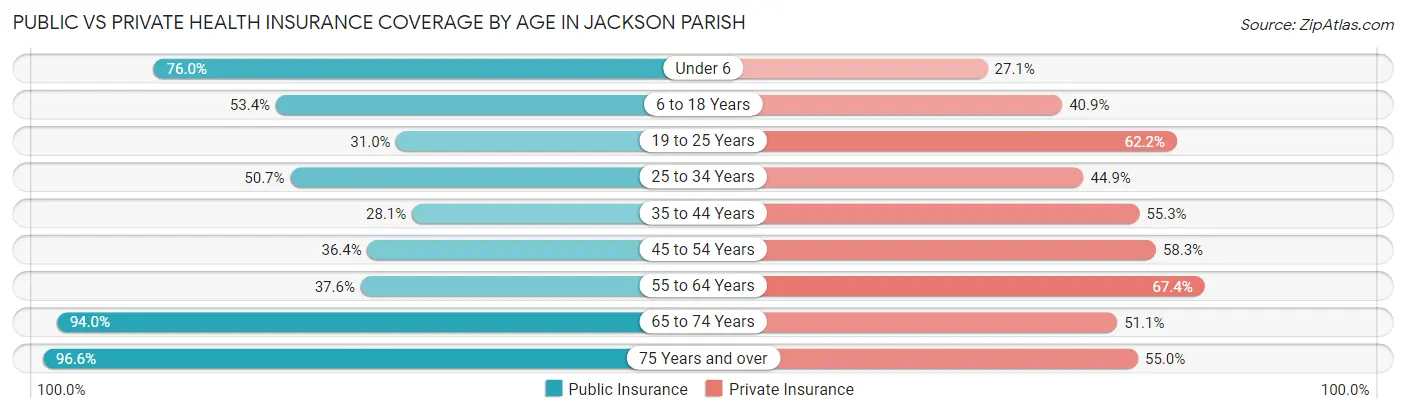
| Age Bracket | Public Insurance | Private Insurance |
| Under 6 | 784 (76.0%) | 279 (27.1%) |
| 6 to 18 Years | 1,266 (53.3%) | 971 (40.9%) |
| 19 to 25 Years | 309 (31.0%) | 620 (62.2%) |
| 25 to 34 Years | 798 (50.7%) | 707 (44.9%) |
| 35 to 44 Years | 409 (28.1%) | 805 (55.2%) |
| 45 to 54 Years | 634 (36.3%) | 1,017 (58.3%) |
| 55 to 64 Years | 765 (37.6%) | 1,370 (67.3%) |
| 65 to 74 Years | 1,543 (94.0%) | 839 (51.1%) |
| 75 Years and over | 1,249 (96.6%) | 711 (55.0%) |
| Total | 7,757 (54.8%) | 7,319 (51.7%) |
Disability Status by Sex by Age in Jackson Parish
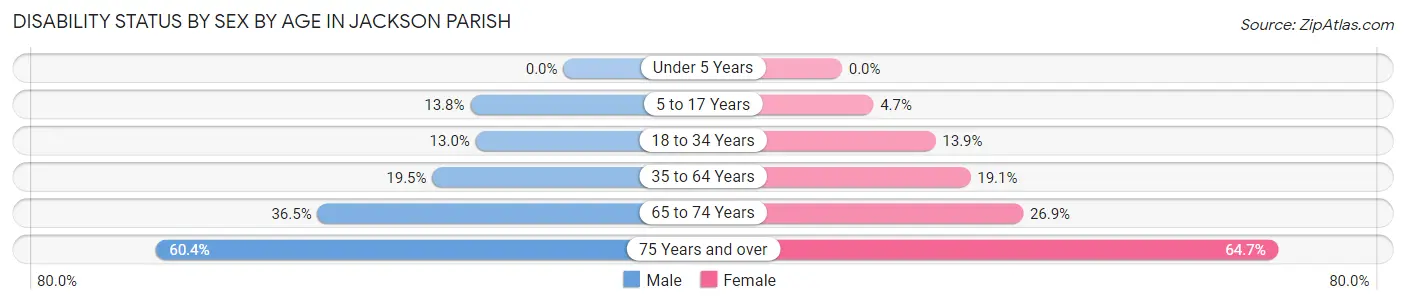
| Age Bracket | Male | Female |
| Under 5 Years | 0 (0.0%) | 0 (0.0%) |
| 5 to 17 Years | 168 (13.8%) | 58 (4.7%) |
| 18 to 34 Years | 187 (13.0%) | 179 (13.9%) |
| 35 to 64 Years | 485 (19.5%) | 523 (19.1%) |
| 65 to 74 Years | 272 (36.5%) | 241 (26.9%) |
| 75 Years and over | 333 (60.4%) | 480 (64.7%) |
Disability Class by Sex by Age in Jackson Parish
Disability Class: Hearing Difficulty
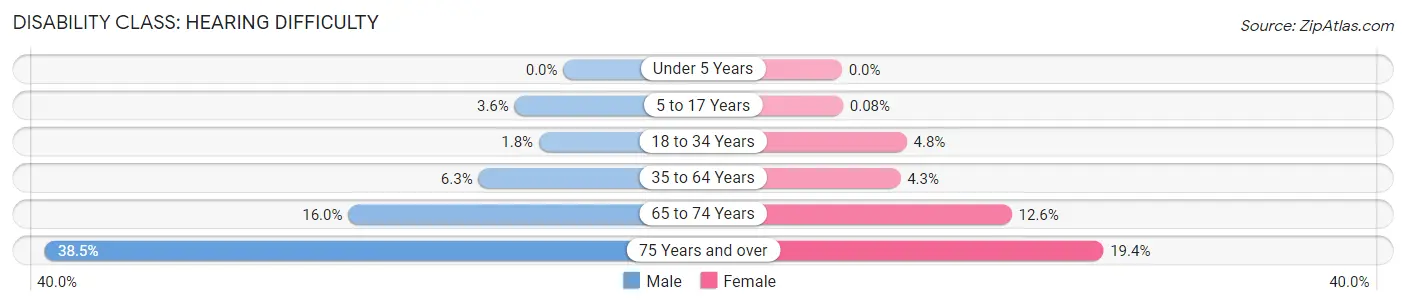
| Age Bracket | Male | Female |
| Under 5 Years | 0 (0.0%) | 0 (0.0%) |
| 5 to 17 Years | 44 (3.6%) | 1 (0.1%) |
| 18 to 34 Years | 26 (1.8%) | 62 (4.8%) |
| 35 to 64 Years | 157 (6.3%) | 119 (4.3%) |
| 65 to 74 Years | 119 (16.0%) | 113 (12.6%) |
| 75 Years and over | 212 (38.5%) | 144 (19.4%) |
Disability Class: Vision Difficulty
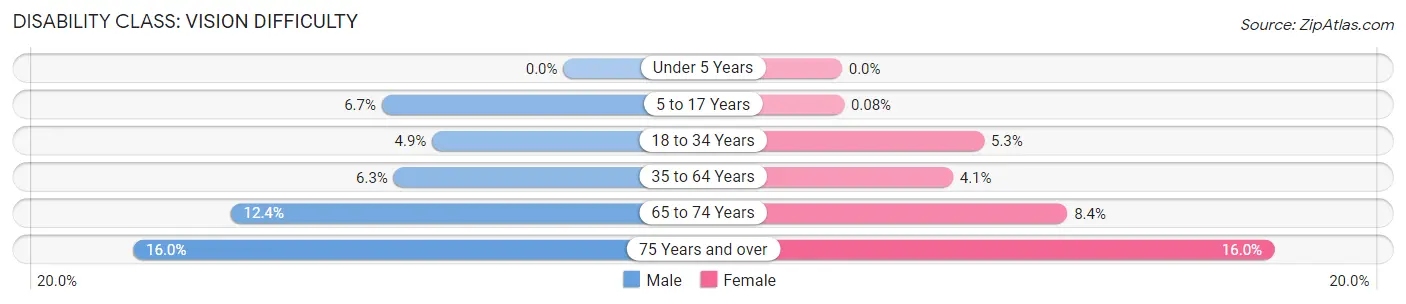
| Age Bracket | Male | Female |
| Under 5 Years | 0 (0.0%) | 0 (0.0%) |
| 5 to 17 Years | 82 (6.7%) | 1 (0.1%) |
| 18 to 34 Years | 70 (4.9%) | 68 (5.3%) |
| 35 to 64 Years | 157 (6.3%) | 113 (4.1%) |
| 65 to 74 Years | 92 (12.3%) | 75 (8.4%) |
| 75 Years and over | 88 (16.0%) | 119 (16.0%) |
Disability Class: Cognitive Difficulty
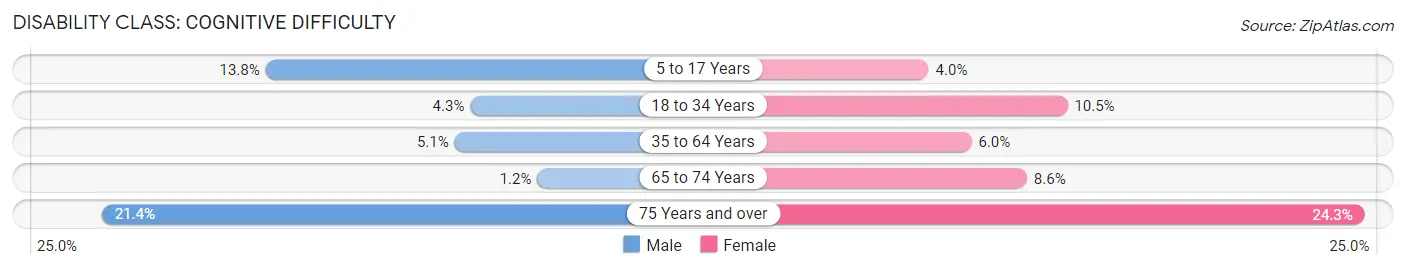
| Age Bracket | Male | Female |
| 5 to 17 Years | 168 (13.8%) | 50 (4.0%) |
| 18 to 34 Years | 62 (4.3%) | 135 (10.5%) |
| 35 to 64 Years | 126 (5.1%) | 165 (6.0%) |
| 65 to 74 Years | 9 (1.2%) | 77 (8.6%) |
| 75 Years and over | 118 (21.4%) | 180 (24.3%) |
Disability Class: Ambulatory Difficulty
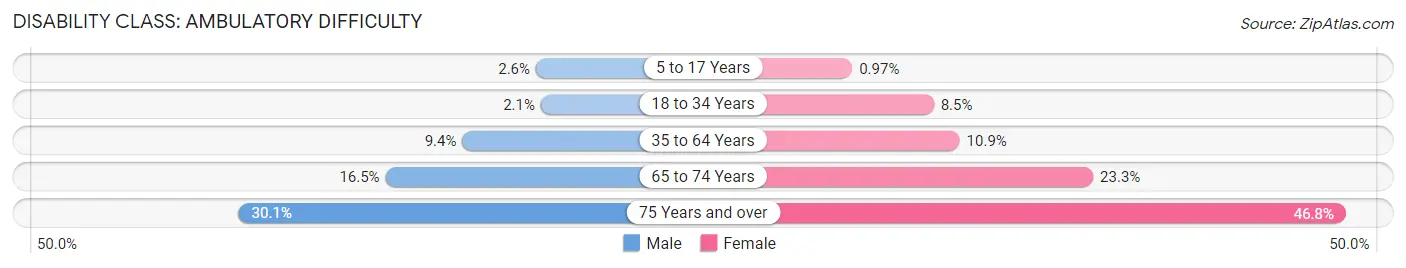
| Age Bracket | Male | Female |
| 5 to 17 Years | 31 (2.5%) | 12 (1.0%) |
| 18 to 34 Years | 30 (2.1%) | 110 (8.5%) |
| 35 to 64 Years | 234 (9.4%) | 300 (10.9%) |
| 65 to 74 Years | 123 (16.5%) | 209 (23.3%) |
| 75 Years and over | 166 (30.1%) | 347 (46.8%) |
Disability Class: Self-Care Difficulty
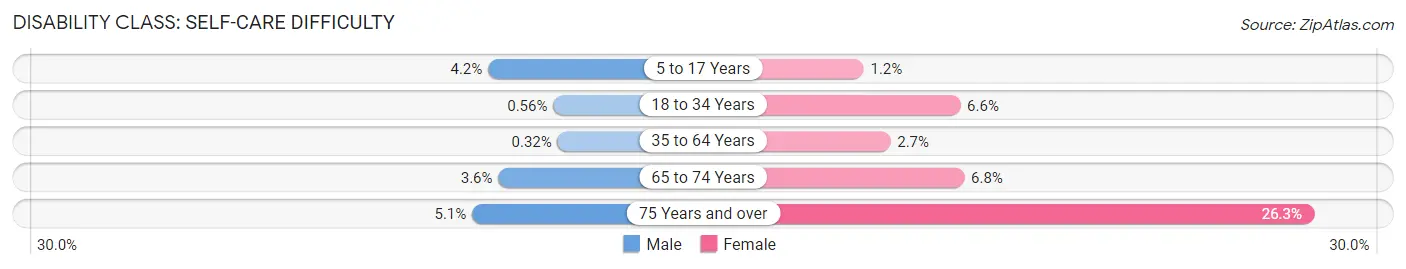
| Age Bracket | Male | Female |
| 5 to 17 Years | 51 (4.2%) | 15 (1.2%) |
| 18 to 34 Years | 8 (0.6%) | 85 (6.6%) |
| 35 to 64 Years | 8 (0.3%) | 74 (2.7%) |
| 65 to 74 Years | 27 (3.6%) | 61 (6.8%) |
| 75 Years and over | 28 (5.1%) | 195 (26.3%) |
Technology Access in Jackson Parish
Computing Device Access in Jackson Parish
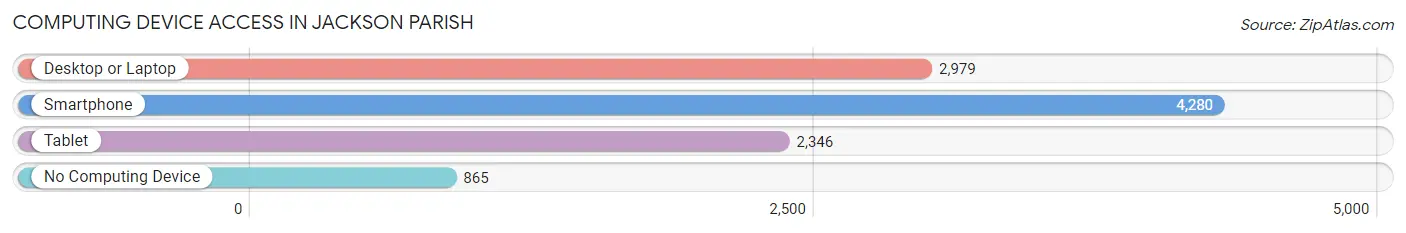
| Device Type | # Households | % Households |
| Desktop or Laptop | 2,979 | 54.5% |
| Smartphone | 4,280 | 78.4% |
| Tablet | 2,346 | 43.0% |
| No Computing Device | 865 | 15.8% |
| Total | 5,461 | 100.0% |
Internet Access in Jackson Parish
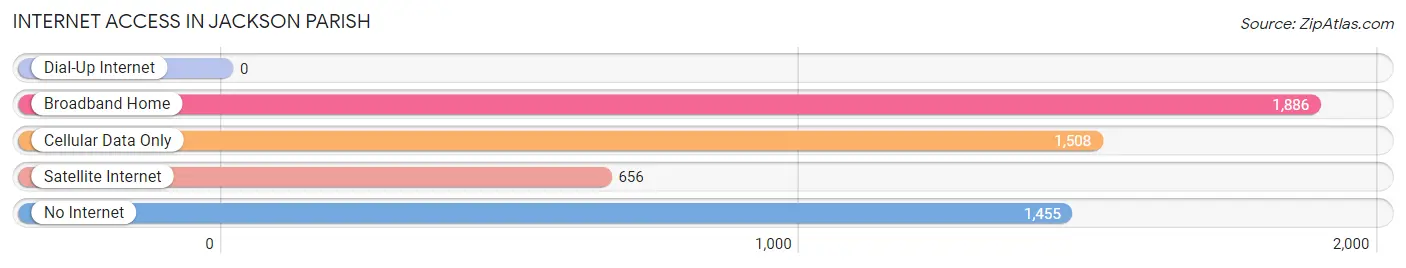
| Internet Type | # Households | % Households |
| Dial-Up Internet | 0 | 0.0% |
| Broadband Home | 1,886 | 34.5% |
| Cellular Data Only | 1,508 | 27.6% |
| Satellite Internet | 656 | 12.0% |
| No Internet | 1,455 | 26.6% |
| Total | 5,461 | 100.0% |
Jackson Parish Summary
History
Jackson Parish is located in the northern part of Louisiana and is bordered by the states of Arkansas and Mississippi. The parish was created in 1845 and named after President Andrew Jackson. The parish was originally part of the larger Claiborne Parish, which was divided into Jackson and Bienville Parishes in 1845.
The first settlers in the area were Native Americans, who lived in the area for thousands of years before the arrival of Europeans. The first Europeans to settle in the area were French and Spanish explorers, who arrived in the late 17th century. The area was part of the French colony of Louisiana until 1803, when it was sold to the United States as part of the Louisiana Purchase.
The parish was largely rural until the early 20th century, when the timber industry began to boom. The timber industry brought jobs and economic growth to the area, and the population began to grow rapidly. The parish was also home to several large cotton plantations, which were worked by African-American slaves.
After the Civil War, the parish was largely agricultural, with cotton and timber being the main crops. The timber industry continued to be a major source of income for the parish until the late 20th century, when the industry began to decline.
Geography
Jackson Parish is located in the northern part of Louisiana and is bordered by the states of Arkansas and Mississippi. The parish covers an area of 576 square miles and is home to a population of 16,845 people, as of the 2010 census.
The parish is mostly rural, with the majority of the population living in small towns and villages. The largest town in the parish is Jonesboro, which is home to 4,719 people. Other towns in the parish include Quitman, Hodge, and Chatham.
The parish is located in the East Gulf Coastal Plain region of Louisiana and is mostly flat, with some rolling hills in the northern part of the parish. The parish is drained by the Ouachita River and its tributaries, which flow through the parish from north to south.
Economy
The economy of Jackson Parish is largely based on agriculture and timber. The parish is home to several large timber companies, which harvest timber from the forests in the parish. The timber industry is the largest employer in the parish, providing jobs for over 1,000 people.
The parish is also home to several large cotton plantations, which produce cotton for the textile industry. The parish is also home to several small manufacturing companies, which produce a variety of products, including furniture, clothing, and food products.
The parish is also home to several small businesses, including restaurants, retail stores, and service providers. The parish is also home to several tourist attractions, including the Jackson Parish Museum and the Jackson Parish Historical Society.
Demographics
As of the 2010 census, the population of Jackson Parish was 16,845 people. The population is mostly white, with African-Americans making up the largest minority group. The median household income in the parish is $37,845, and the median age is 38.7 years.
The parish is home to several religious denominations, including Baptist, Methodist, and Catholic. The parish is also home to several public schools, including Jonesboro High School and Quitman High School.
Common Questions
What is the Total Population of Jackson Parish?
Total Population of Jackson Parish is 15,093.
What is the Total Male Population of Jackson Parish?
Total Male Population of Jackson Parish is 7,624.
What is the Total Female Population of Jackson Parish?
Total Female Population of Jackson Parish is 7,469.
What is the Ratio of Males per 100 Females in Jackson Parish?
There are 102.08 Males per 100 Females in Jackson Parish.
What is the Ratio of Females per 100 Males in Jackson Parish?
There are 97.97 Females per 100 Males in Jackson Parish.
What is the Median Population Age in Jackson Parish?
Median Population Age in Jackson Parish is 41.4 Years.
What is the Average Family Size in Jackson Parish
Average Family Size in Jackson Parish is 3.3 People.
What is the Average Household Size in Jackson Parish
Average Household Size in Jackson Parish is 2.6 People.
What is Per Capita Income in Jackson Parish?
Per Capita income in Jackson Parish is $22,804.
What is the Median Family Income in Jackson Parish?
Median Family Income in Jackson Parish is $52,285.
What is the Median Household income in Jackson Parish?
Median Household Income in Jackson Parish is $40,406.
What is Income or Wage Gap in Jackson Parish?
Income or Wage Gap in Jackson Parish is 42.3%.
Women in Jackson Parish earn 57.7 cents for every dollar earned by a man.
What is Family Income Deficit in Jackson Parish?
Family Income Deficit in Jackson Parish is $10,649.
Families that are below poverty line in Jackson Parish earn $10,649 less on average than the poverty threshold level.
What is Inequality or Gini Index in Jackson Parish?
Inequality or Gini Index in Jackson Parish is 0.46.
How Large is the Labor Force in Jackson Parish?
There are 5,187 People in the Labor Forcein in Jackson Parish.
What is the Percentage of People in the Labor Force in Jackson Parish?
42.6% of People are in the Labor Force in Jackson Parish.
What is the Unemployment Rate in Jackson Parish?
Unemployment Rate in Jackson Parish is 4.9%.