Iberia Parish, LA
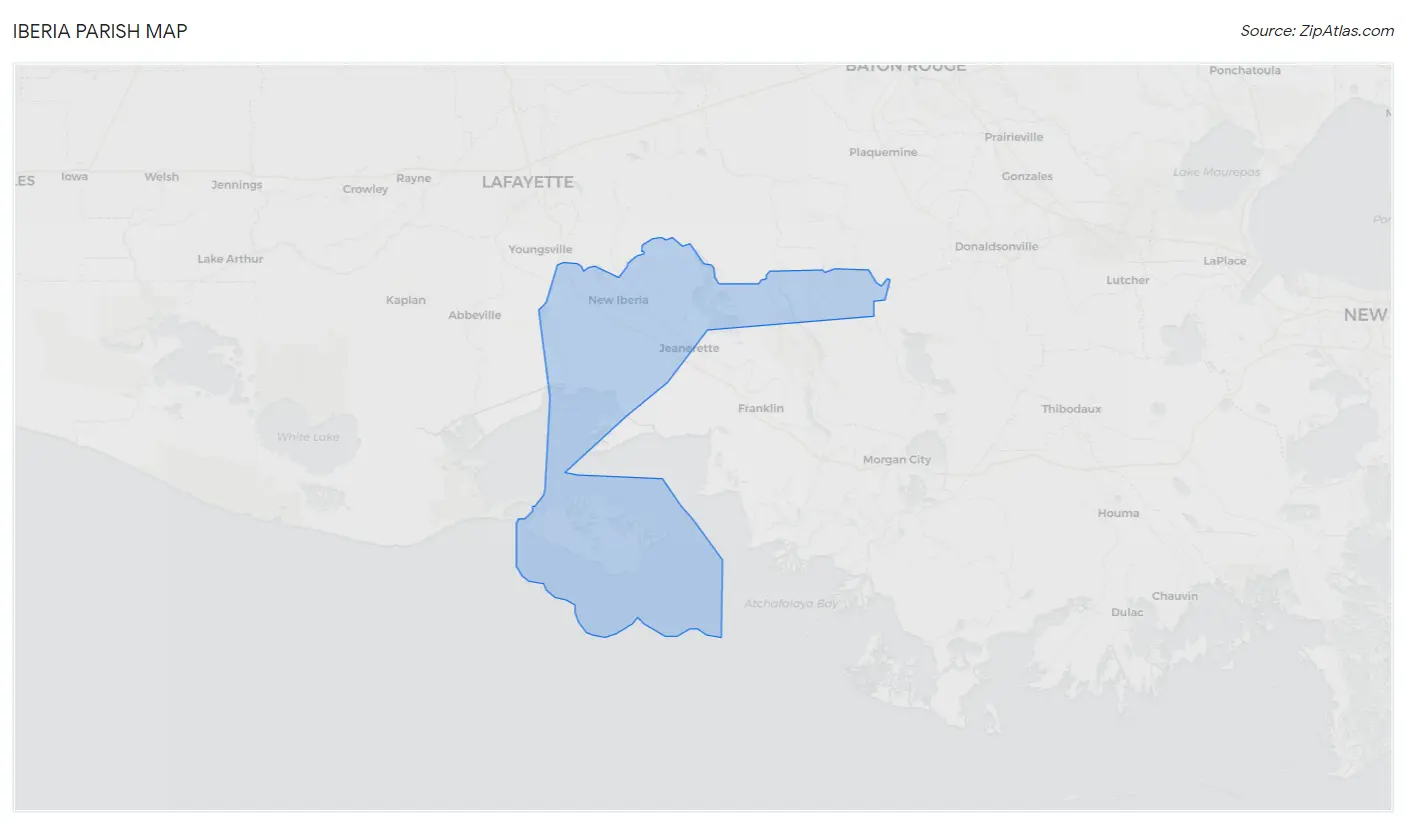
Iberia Parish Map
Iberia Parish Overview
69,958
TOTAL POPULATION
34,540
MALE POPULATION
35,418
FEMALE POPULATION
97.52
MALES / 100 FEMALES
102.54
FEMALES / 100 MALES
37.4
MEDIAN AGE
3.0
AVG FAMILY SIZE
2.6
AVG HOUSEHOLD SIZE
$28,315
PER CAPITA INCOME
$63,180
AVG FAMILY INCOME
$55,190
AVG HOUSEHOLD INCOME
46.3%
WAGE / INCOME GAP [ % ]
53.7¢/ $1
WAGE / INCOME GAP [ $ ]
$13,255
FAMILY INCOME DEFICIT
0.47
INEQUALITY / GINI INDEX
31,326
LABOR FORCE [ PEOPLE ]
58.0%
PERCENT IN LABOR FORCE
6.3%
UNEMPLOYMENT RATE
Iberia Parish Area Codes
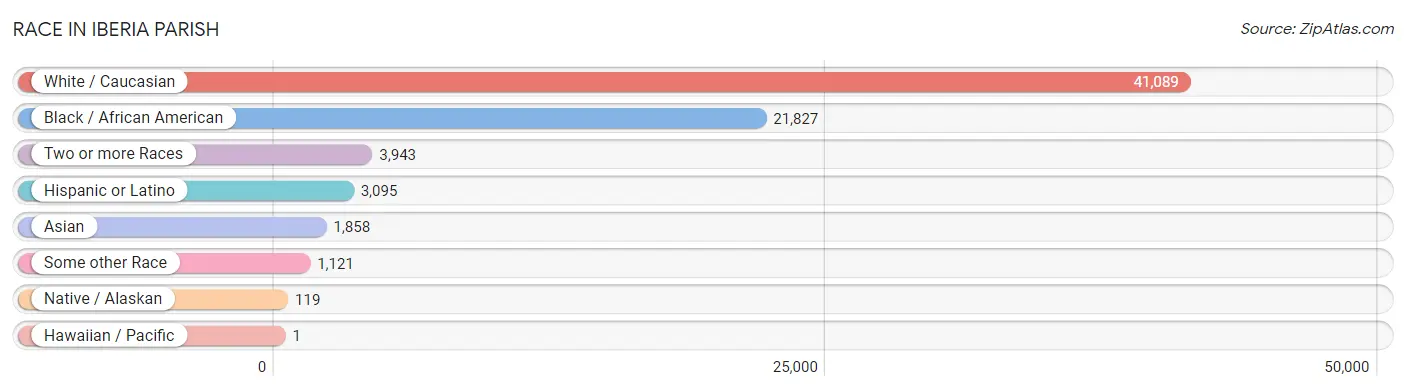
Race in Iberia Parish
The most populous races in Iberia Parish are White / Caucasian (41,089 | 58.7%), Black / African American (21,827 | 31.2%), and Two or more Races (3,943 | 5.6%).
| Race | # Population | % Population |
| Asian | 1,858 | 2.7% |
| Black / African American | 21,827 | 31.2% |
| Hawaiian / Pacific | 1 | 0.0% |
| Hispanic or Latino | 3,095 | 4.4% |
| Native / Alaskan | 119 | 0.2% |
| White / Caucasian | 41,089 | 58.7% |
| Two or more Races | 3,943 | 5.6% |
| Some other Race | 1,121 | 1.6% |
| Total | 69,958 | 100.0% |
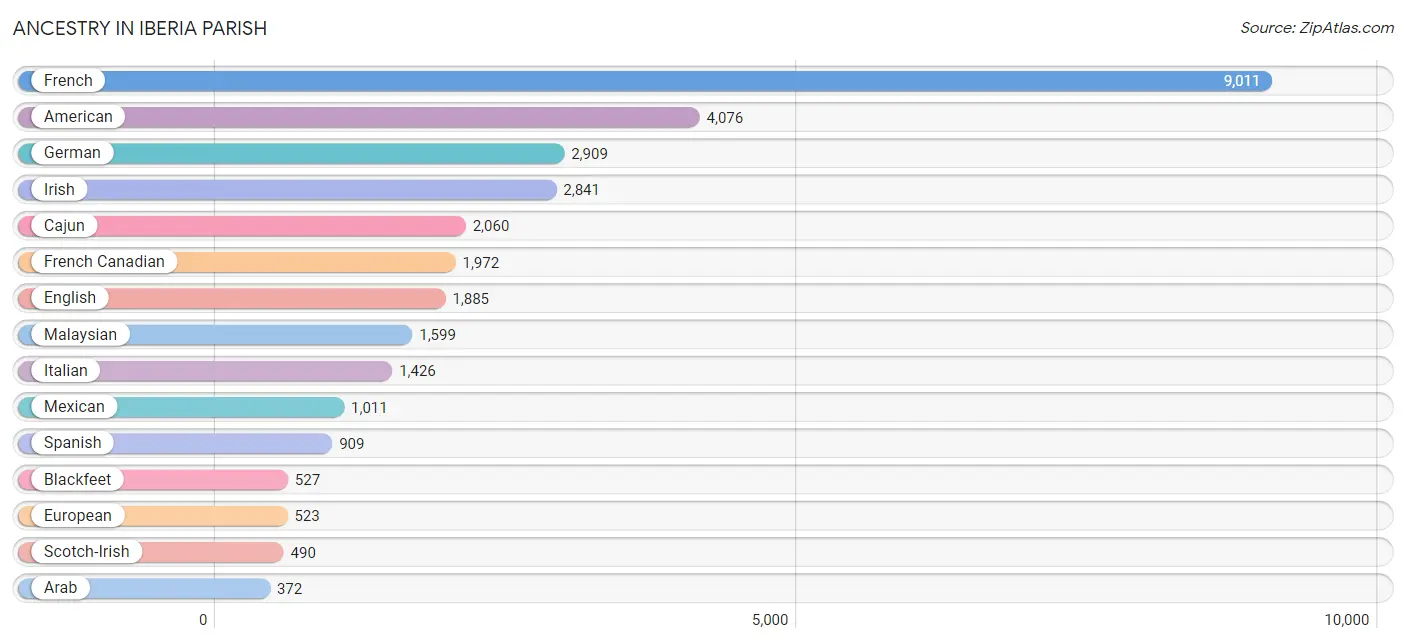
Ancestry in Iberia Parish
The most populous ancestries reported in Iberia Parish are French (9,011 | 12.9%), American (4,076 | 5.8%), German (2,909 | 4.2%), Irish (2,841 | 4.1%), and Cajun (2,060 | 2.9%), together accounting for 29.9% of all Iberia Parish residents.
| Ancestry | # Population | % Population |
| African | 303 | 0.4% |
| American | 4,076 | 5.8% |
| Arab | 372 | 0.5% |
| Austrian | 10 | 0.0% |
| Belgian | 1 | 0.0% |
| Belizean | 52 | 0.1% |
| Bhutanese | 1 | 0.0% |
| Blackfeet | 527 | 0.7% |
| British | 173 | 0.3% |
| Burmese | 11 | 0.0% |
| Cajun | 2,060 | 2.9% |
| Canadian | 161 | 0.2% |
| Central American | 227 | 0.3% |
| Central American Indian | 31 | 0.0% |
| Cherokee | 54 | 0.1% |
| Choctaw | 64 | 0.1% |
| Colombian | 17 | 0.0% |
| Croatian | 16 | 0.0% |
| Cuban | 58 | 0.1% |
| Czech | 96 | 0.1% |
| Dutch | 68 | 0.1% |
| English | 1,885 | 2.7% |
| European | 523 | 0.7% |
| French | 9,011 | 12.9% |
| French American Indian | 1 | 0.0% |
| French Canadian | 1,972 | 2.8% |
| German | 2,909 | 4.2% |
| Greek | 10 | 0.0% |
| Honduran | 115 | 0.2% |
| Houma | 6 | 0.0% |
| Hungarian | 9 | 0.0% |
| Indian (Asian) | 137 | 0.2% |
| Irish | 2,841 | 4.1% |
| Italian | 1,426 | 2.0% |
| Korean | 84 | 0.1% |
| Lebanese | 148 | 0.2% |
| Malaysian | 1,599 | 2.3% |
| Mexican | 1,011 | 1.5% |
| Mexican American Indian | 88 | 0.1% |
| Moroccan | 224 | 0.3% |
| Norwegian | 49 | 0.1% |
| Panamanian | 33 | 0.1% |
| Polish | 259 | 0.4% |
| Portuguese | 6 | 0.0% |
| Puerto Rican | 307 | 0.4% |
| Romanian | 127 | 0.2% |
| Russian | 11 | 0.0% |
| Salvadoran | 79 | 0.1% |
| Scandinavian | 55 | 0.1% |
| Scotch-Irish | 490 | 0.7% |
| Scottish | 273 | 0.4% |
| Seminole | 25 | 0.0% |
| Slovene | 2 | 0.0% |
| South American | 76 | 0.1% |
| Spaniard | 68 | 0.1% |
| Spanish | 909 | 1.3% |
| Spanish American | 39 | 0.1% |
| Sri Lankan | 162 | 0.2% |
| Subsaharan African | 336 | 0.5% |
| Swedish | 316 | 0.4% |
| Swiss | 60 | 0.1% |
| Thai | 8 | 0.0% |
| Ukrainian | 14 | 0.0% |
| Venezuelan | 59 | 0.1% |
| Welsh | 15 | 0.0% | View All 65 Rows |
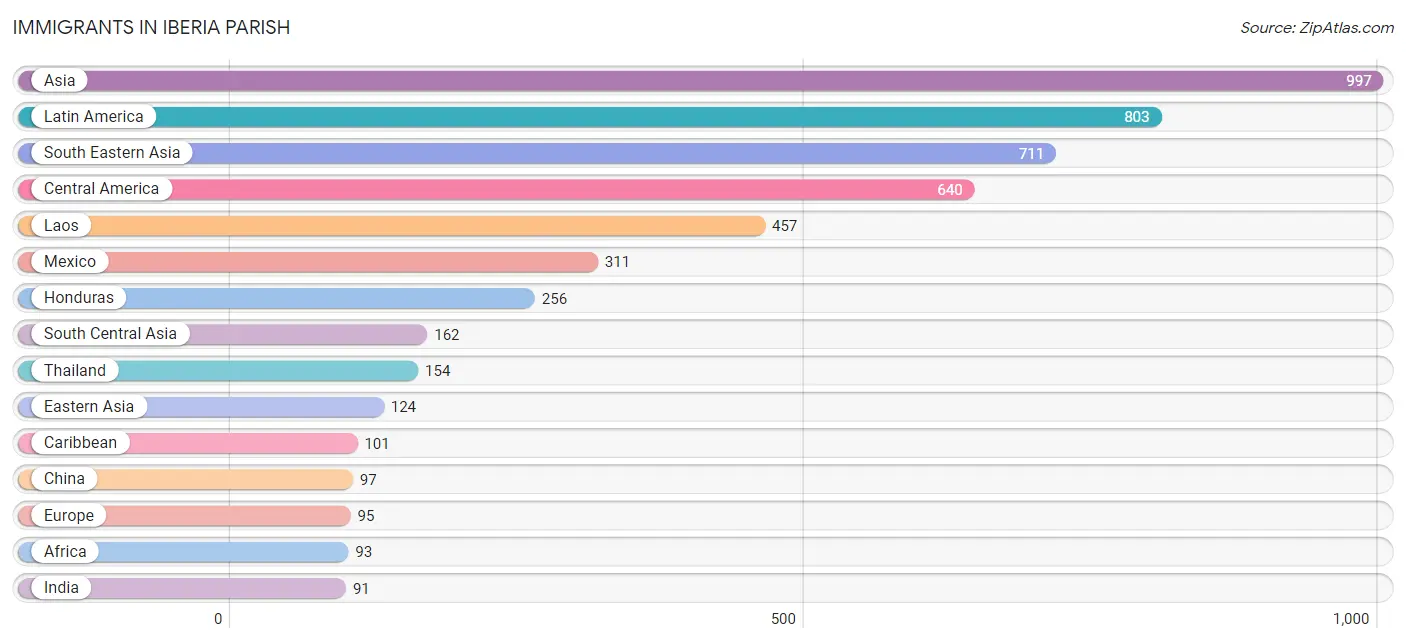
Immigrants in Iberia Parish
The most numerous immigrant groups reported in Iberia Parish came from Asia (997 | 1.4%), Latin America (803 | 1.1%), South Eastern Asia (711 | 1.0%), Central America (640 | 0.9%), and Laos (457 | 0.6%), together accounting for 5.2% of all Iberia Parish residents.
| Immigration Origin | # Population | % Population |
| Africa | 93 | 0.1% |
| Asia | 997 | 1.4% |
| Belize | 52 | 0.1% |
| Canada | 79 | 0.1% |
| Caribbean | 101 | 0.1% |
| Central America | 640 | 0.9% |
| China | 97 | 0.1% |
| Colombia | 17 | 0.0% |
| Cuba | 51 | 0.1% |
| Eastern Asia | 124 | 0.2% |
| El Salvador | 20 | 0.0% |
| England | 25 | 0.0% |
| Europe | 95 | 0.1% |
| France | 10 | 0.0% |
| Germany | 26 | 0.0% |
| Ghana | 14 | 0.0% |
| Honduras | 256 | 0.4% |
| India | 91 | 0.1% |
| Japan | 22 | 0.0% |
| Korea | 5 | 0.0% |
| Laos | 457 | 0.6% |
| Latin America | 803 | 1.1% |
| Mexico | 311 | 0.4% |
| Morocco | 79 | 0.1% |
| Northern Africa | 79 | 0.1% |
| Northern Europe | 59 | 0.1% |
| Pakistan | 71 | 0.1% |
| Panama | 1 | 0.0% |
| Philippines | 24 | 0.0% |
| South America | 62 | 0.1% |
| South Central Asia | 162 | 0.2% |
| South Eastern Asia | 711 | 1.0% |
| Thailand | 154 | 0.2% |
| Trinidad and Tobago | 50 | 0.1% |
| Venezuela | 45 | 0.1% |
| Vietnam | 76 | 0.1% |
| Western Africa | 14 | 0.0% |
| Western Europe | 36 | 0.1% | View All 38 Rows |
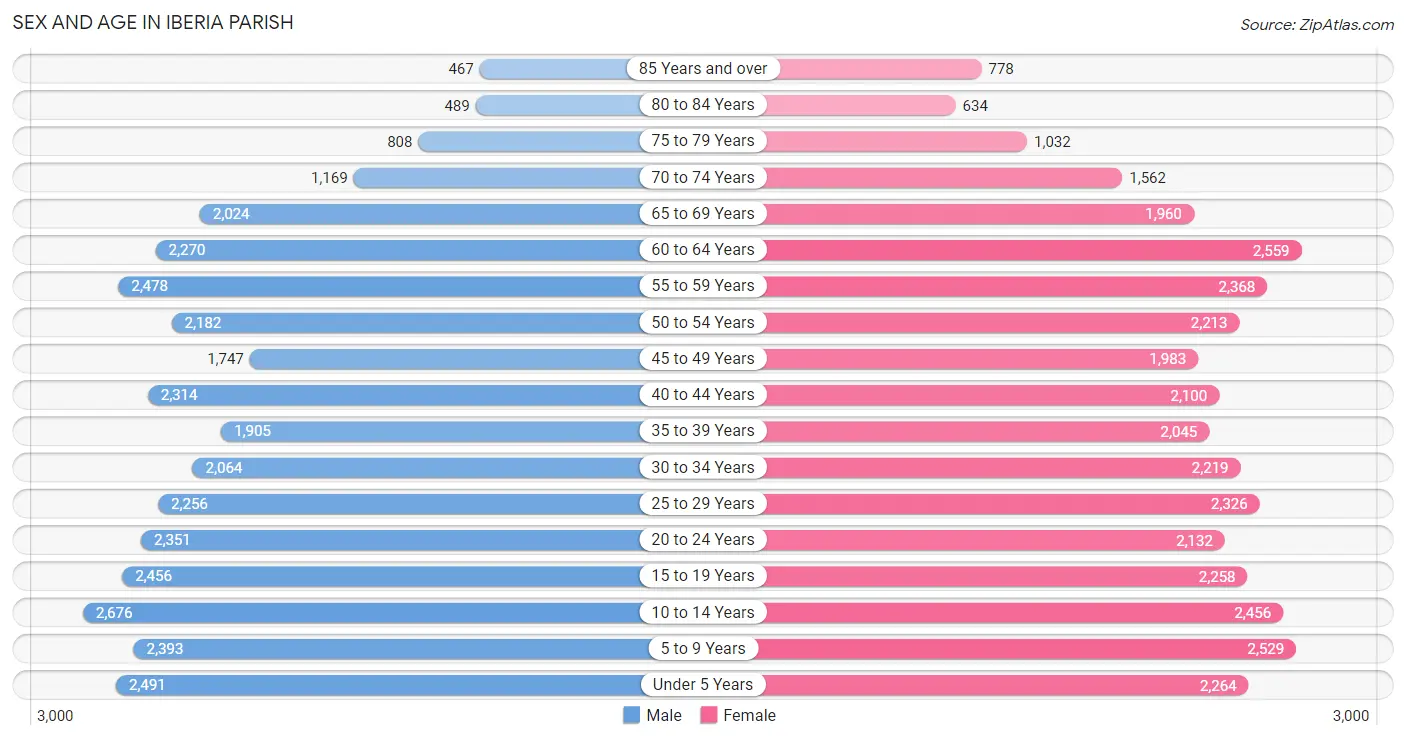
Sex and Age in Iberia Parish
Sex and Age in Iberia Parish
The most populous age groups in Iberia Parish are 10 to 14 Years (2,676 | 7.7%) for men and 60 to 64 Years (2,559 | 7.2%) for women.
| Age Bracket | Male | Female |
| Under 5 Years | 2,491 (7.2%) | 2,264 (6.4%) |
| 5 to 9 Years | 2,393 (6.9%) | 2,529 (7.1%) |
| 10 to 14 Years | 2,676 (7.7%) | 2,456 (6.9%) |
| 15 to 19 Years | 2,456 (7.1%) | 2,258 (6.4%) |
| 20 to 24 Years | 2,351 (6.8%) | 2,132 (6.0%) |
| 25 to 29 Years | 2,256 (6.5%) | 2,326 (6.6%) |
| 30 to 34 Years | 2,064 (6.0%) | 2,219 (6.3%) |
| 35 to 39 Years | 1,905 (5.5%) | 2,045 (5.8%) |
| 40 to 44 Years | 2,314 (6.7%) | 2,100 (5.9%) |
| 45 to 49 Years | 1,747 (5.1%) | 1,983 (5.6%) |
| 50 to 54 Years | 2,182 (6.3%) | 2,213 (6.2%) |
| 55 to 59 Years | 2,478 (7.2%) | 2,368 (6.7%) |
| 60 to 64 Years | 2,270 (6.6%) | 2,559 (7.2%) |
| 65 to 69 Years | 2,024 (5.9%) | 1,960 (5.5%) |
| 70 to 74 Years | 1,169 (3.4%) | 1,562 (4.4%) |
| 75 to 79 Years | 808 (2.3%) | 1,032 (2.9%) |
| 80 to 84 Years | 489 (1.4%) | 634 (1.8%) |
| 85 Years and over | 467 (1.3%) | 778 (2.2%) |
| Total | 34,540 (100.0%) | 35,418 (100.0%) |
Families and Households in Iberia Parish
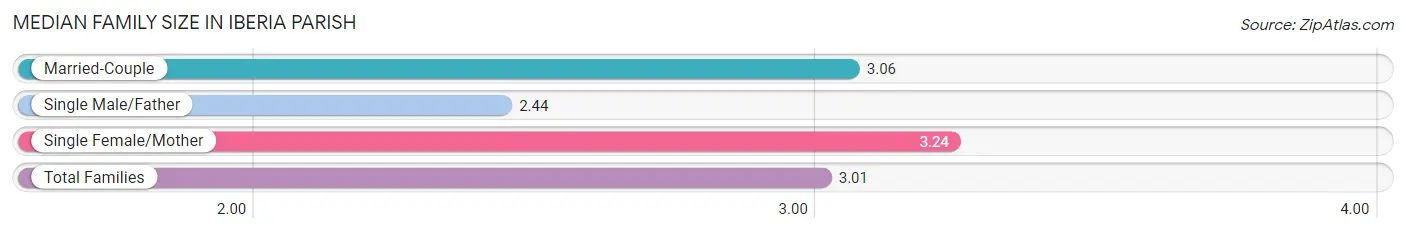
Median Family Size in Iberia Parish
The median family size in Iberia Parish is 3.01 persons per family, with single female/mother families (4,177 | 22.0%) accounting for the largest median family size of 3.24 persons per family. On the other hand, single male/father families (2,655 | 14.0%) represent the smallest median family size with 2.44 persons per family.
| Family Type | # Families | Family Size |
| Married-Couple | 12,160 (64.0%) | 3.06 |
| Single Male/Father | 2,655 (14.0%) | 2.44 |
| Single Female/Mother | 4,177 (22.0%) | 3.24 |
| Total Families | 18,992 (100.0%) | 3.01 |
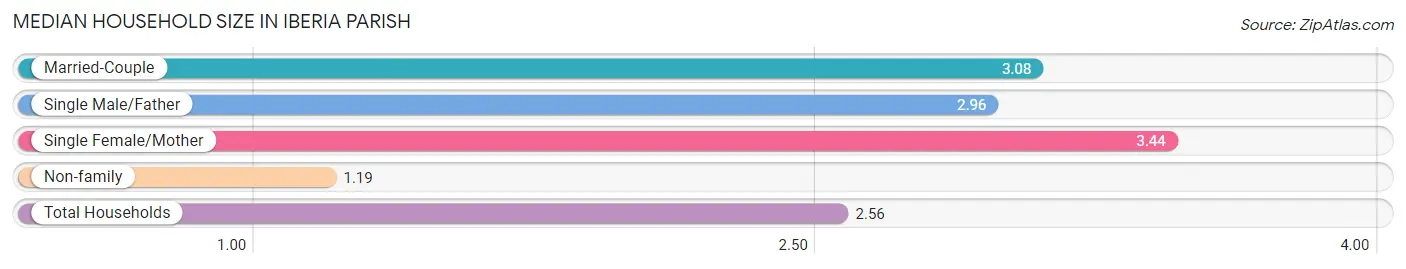
Median Household Size in Iberia Parish
The median household size in Iberia Parish is 2.56 persons per household, with single female/mother households (4,177 | 15.5%) accounting for the largest median household size of 3.44 persons per household. non-family households (7,962 | 29.5%) represent the smallest median household size with 1.19 persons per household.
| Household Type | # Households | Household Size |
| Married-Couple | 12,160 (45.1%) | 3.08 |
| Single Male/Father | 2,655 (9.9%) | 2.96 |
| Single Female/Mother | 4,177 (15.5%) | 3.44 |
| Non-family | 7,962 (29.5%) | 1.19 |
| Total Households | 26,954 (100.0%) | 2.56 |
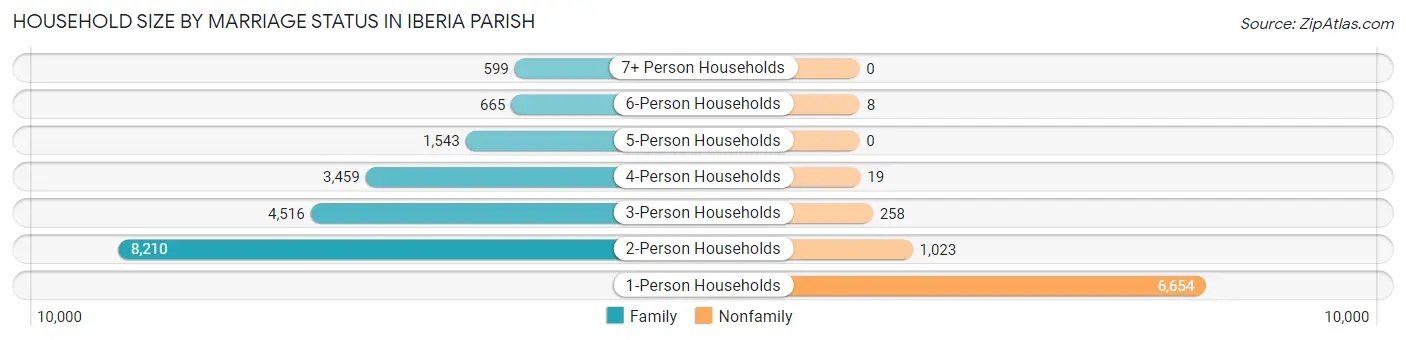
Household Size by Marriage Status in Iberia Parish
Out of a total of 26,954 households in Iberia Parish, 18,992 (70.5%) are family households, while 7,962 (29.5%) are nonfamily households. The most numerous type of family households are 2-person households, comprising 8,210, and the most common type of nonfamily households are 1-person households, comprising 6,654.
| Household Size | Family Households | Nonfamily Households |
| 1-Person Households | - | 6,654 (24.7%) |
| 2-Person Households | 8,210 (30.5%) | 1,023 (3.8%) |
| 3-Person Households | 4,516 (16.8%) | 258 (1.0%) |
| 4-Person Households | 3,459 (12.8%) | 19 (0.1%) |
| 5-Person Households | 1,543 (5.7%) | 0 (0.0%) |
| 6-Person Households | 665 (2.5%) | 8 (0.0%) |
| 7+ Person Households | 599 (2.2%) | 0 (0.0%) |
| Total | 18,992 (70.5%) | 7,962 (29.5%) |
Female Fertility in Iberia Parish
Fertility by Age in Iberia Parish
Average fertility rate in Iberia Parish is 78.0 births per 1,000 women. Women in the age bracket of 20 to 34 years have the highest fertility rate with 174.0 births per 1,000 women. Women in the age bracket of 20 to 34 years acount for 97.5% of all women with births.
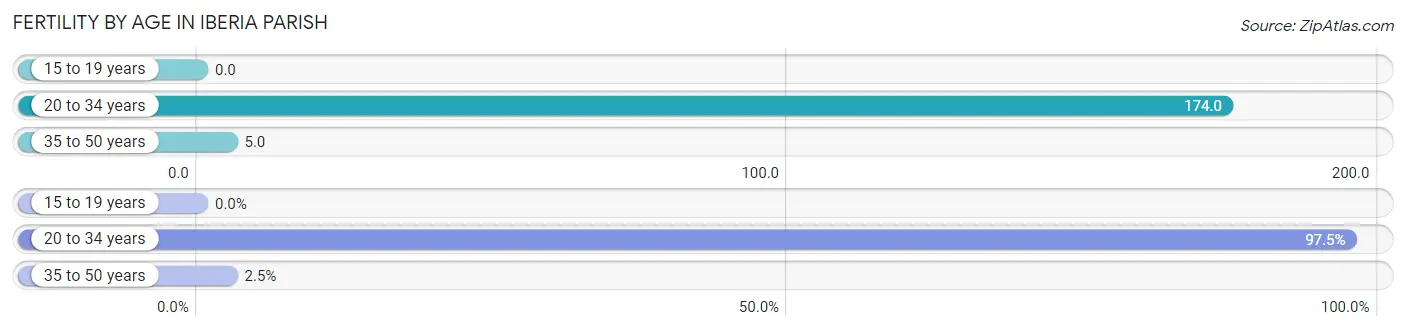
| Age Bracket | Women with Births | Births / 1,000 Women |
| 15 to 19 years | 0 (0.0%) | 0.0 |
| 20 to 34 years | 1,164 (97.5%) | 174.0 |
| 35 to 50 years | 30 (2.5%) | 5.0 |
| Total | 1,194 (100.0%) | 78.0 |
Fertility by Age by Marriage Status in Iberia Parish
40.0% of women with births (1,194) in Iberia Parish are married. The highest percentage of unmarried women with births falls into 20 to 34 years age bracket with 61.1% of them unmarried at the time of birth, while the lowest percentage of unmarried women with births belong to 35 to 50 years age bracket with 16.7% of them unmarried.
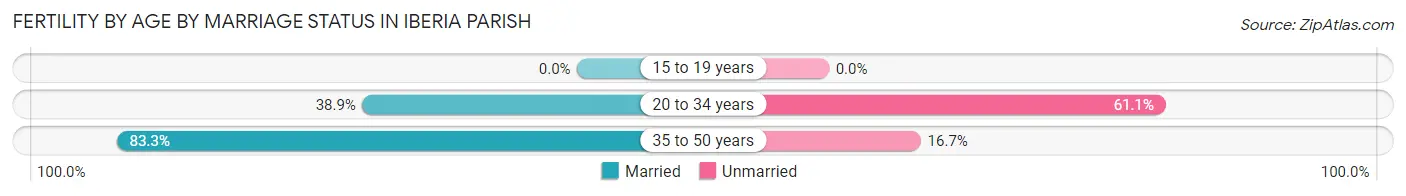
| Age Bracket | Married | Unmarried |
| 15 to 19 years | 0 (0.0%) | 0 (0.0%) |
| 20 to 34 years | 453 (38.9%) | 711 (61.1%) |
| 35 to 50 years | 25 (83.3%) | 5 (16.7%) |
| Total | 478 (40.0%) | 716 (60.0%) |
Fertility by Education in Iberia Parish
Average fertility rate in Iberia Parish is 78.0 births per 1,000 women. Women with the education attainment of high school diploma have the highest fertility rate of 112.0 births per 1,000 women, while women with the education attainment of less than high school have the lowest fertility at 22.0 births per 1,000 women. Women with the education attainment of high school diploma represent 47.8% of all women with births.
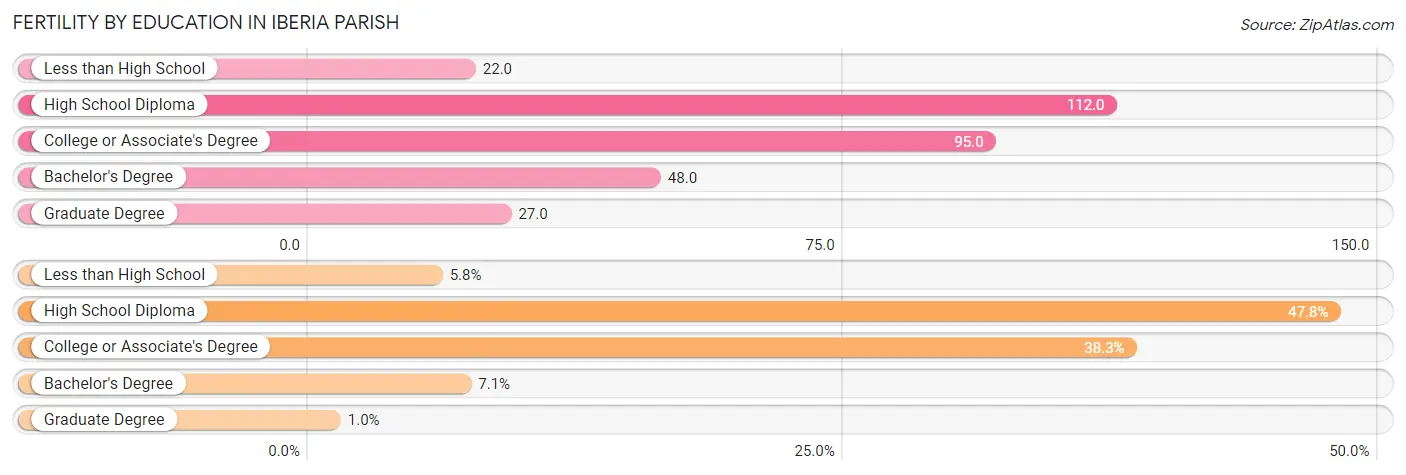
| Educational Attainment | Women with Births | Births / 1,000 Women |
| Less than High School | 69 (5.8%) | 22.0 |
| High School Diploma | 571 (47.8%) | 112.0 |
| College or Associate's Degree | 457 (38.3%) | 95.0 |
| Bachelor's Degree | 85 (7.1%) | 48.0 |
| Graduate Degree | 12 (1.0%) | 27.0 |
| Total | 1,194 (100.0%) | 78.0 |
Fertility by Education by Marriage Status in Iberia Parish
60.0% of women with births in Iberia Parish are unmarried. Women with the educational attainment of graduate degree are most likely to be married with 100.0% of them married at childbirth, while women with the educational attainment of less than high school are least likely to be married with 100.0% of them unmarried at childbirth.
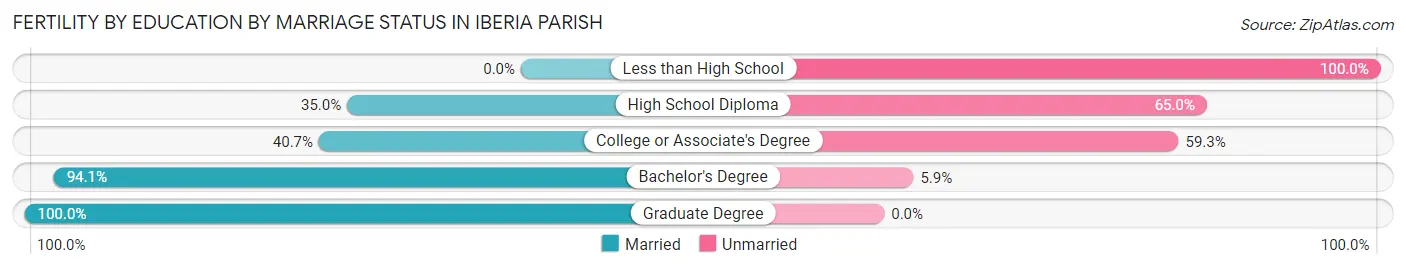
| Educational Attainment | Married | Unmarried |
| Less than High School | 0 (0.0%) | 69 (100.0%) |
| High School Diploma | 200 (35.0%) | 371 (65.0%) |
| College or Associate's Degree | 186 (40.7%) | 271 (59.3%) |
| Bachelor's Degree | 80 (94.1%) | 5 (5.9%) |
| Graduate Degree | 12 (100.0%) | 0 (0.0%) |
| Total | 478 (40.0%) | 716 (60.0%) |
Income in Iberia Parish
Income Overview in Iberia Parish
Per Capita Income in Iberia Parish is $28,315, while median incomes of families and households are $63,180 and $55,190 respectively.
| Characteristic | Number | Measure |
| Per Capita Income | 69,958 | $28,315 |
| Median Family Income | 18,992 | $63,180 |
| Mean Family Income | 18,992 | $78,158 |
| Median Household Income | 26,954 | $55,190 |
| Mean Household Income | 26,954 | $72,619 |
| Income Deficit | 18,992 | $13,255 |
| Wage / Income Gap (%) | 69,958 | 46.31% |
| Wage / Income Gap ($) | 69,958 | 53.69¢ per $1 |
| Gini / Inequality Index | 69,958 | 0.47 |
Earnings by Sex in Iberia Parish
Average Earnings in Iberia Parish are $35,313, $46,379 for men and $24,900 for women, a difference of 46.3%.
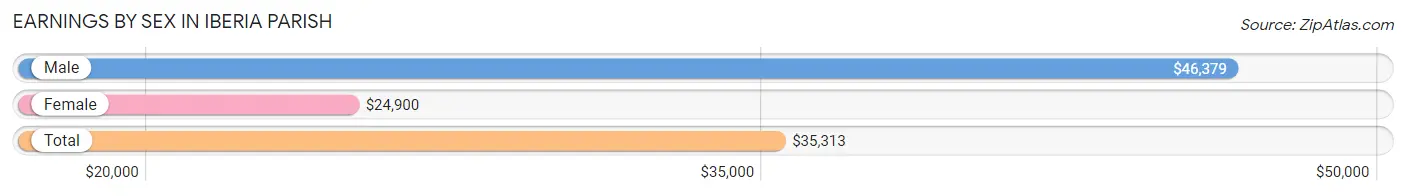
| Sex | Number | Average Earnings |
| Male | 17,220 (53.7%) | $46,379 |
| Female | 14,818 (46.3%) | $24,900 |
| Total | 32,038 (100.0%) | $35,313 |
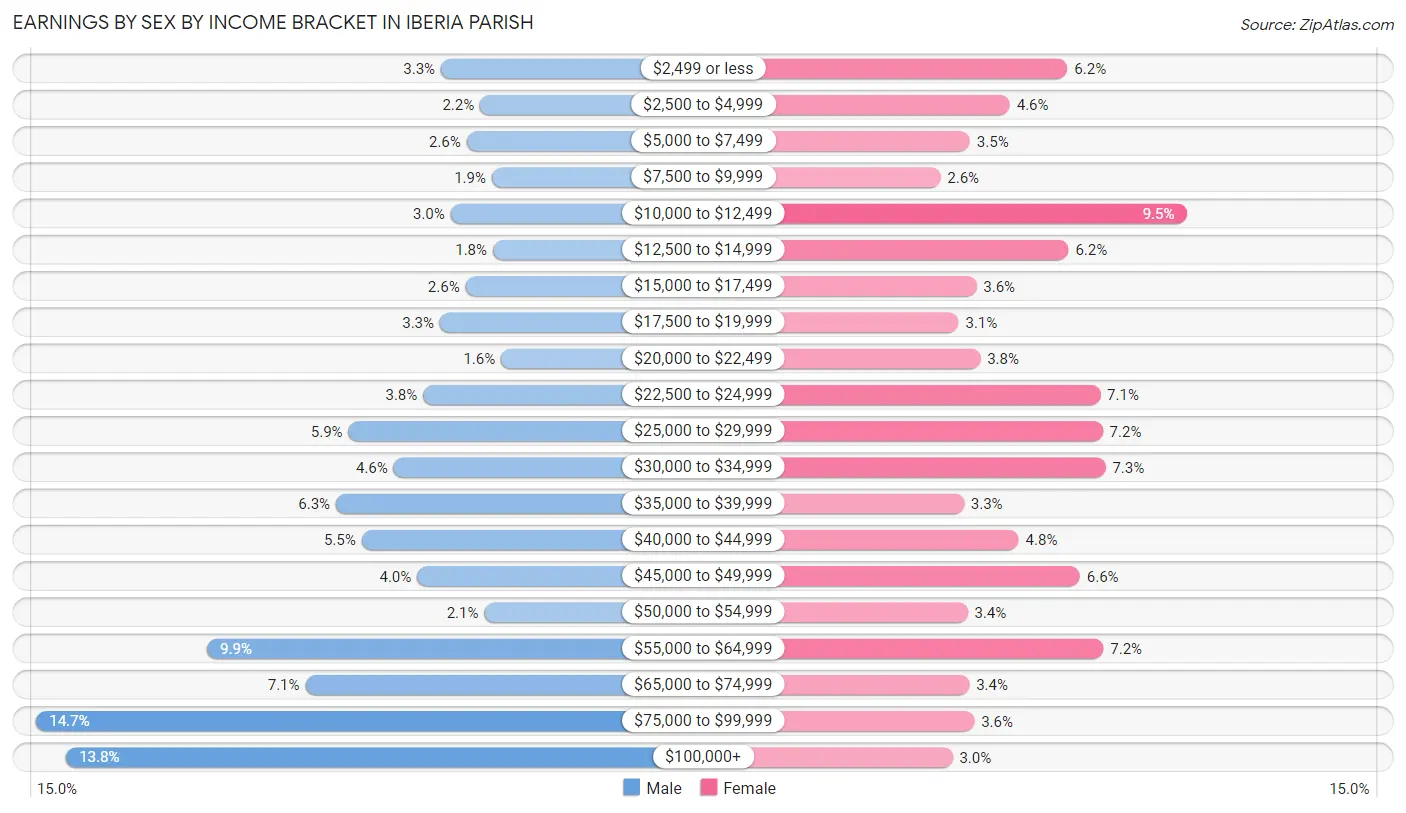
Earnings by Sex by Income Bracket in Iberia Parish
The most common earnings brackets in Iberia Parish are $75,000 to $99,999 for men (2,526 | 14.7%) and $10,000 to $12,499 for women (1,413 | 9.5%).
| Income | Male | Female |
| $2,499 or less | 568 (3.3%) | 919 (6.2%) |
| $2,500 to $4,999 | 378 (2.2%) | 679 (4.6%) |
| $5,000 to $7,499 | 445 (2.6%) | 512 (3.5%) |
| $7,500 to $9,999 | 322 (1.9%) | 389 (2.6%) |
| $10,000 to $12,499 | 522 (3.0%) | 1,413 (9.5%) |
| $12,500 to $14,999 | 316 (1.8%) | 923 (6.2%) |
| $15,000 to $17,499 | 449 (2.6%) | 540 (3.6%) |
| $17,500 to $19,999 | 573 (3.3%) | 466 (3.1%) |
| $20,000 to $22,499 | 278 (1.6%) | 555 (3.7%) |
| $22,500 to $24,999 | 655 (3.8%) | 1,055 (7.1%) |
| $25,000 to $29,999 | 1,016 (5.9%) | 1,066 (7.2%) |
| $30,000 to $34,999 | 797 (4.6%) | 1,077 (7.3%) |
| $35,000 to $39,999 | 1,076 (6.2%) | 487 (3.3%) |
| $40,000 to $44,999 | 953 (5.5%) | 715 (4.8%) |
| $45,000 to $49,999 | 683 (4.0%) | 970 (6.6%) |
| $50,000 to $54,999 | 358 (2.1%) | 502 (3.4%) |
| $55,000 to $64,999 | 1,699 (9.9%) | 1,069 (7.2%) |
| $65,000 to $74,999 | 1,224 (7.1%) | 510 (3.4%) |
| $75,000 to $99,999 | 2,526 (14.7%) | 531 (3.6%) |
| $100,000+ | 2,382 (13.8%) | 440 (3.0%) |
| Total | 17,220 (100.0%) | 14,818 (100.0%) |
Earnings by Sex by Educational Attainment in Iberia Parish
Average earnings in Iberia Parish are $55,622 for men and $28,451 for women, a difference of 48.8%. Men with an educational attainment of graduate degree enjoy the highest average annual earnings of $69,125, while those with less than high school education earn the least with $36,170. Women with an educational attainment of graduate degree earn the most with the average annual earnings of $52,146, while those with less than high school education have the smallest earnings of $17,383.
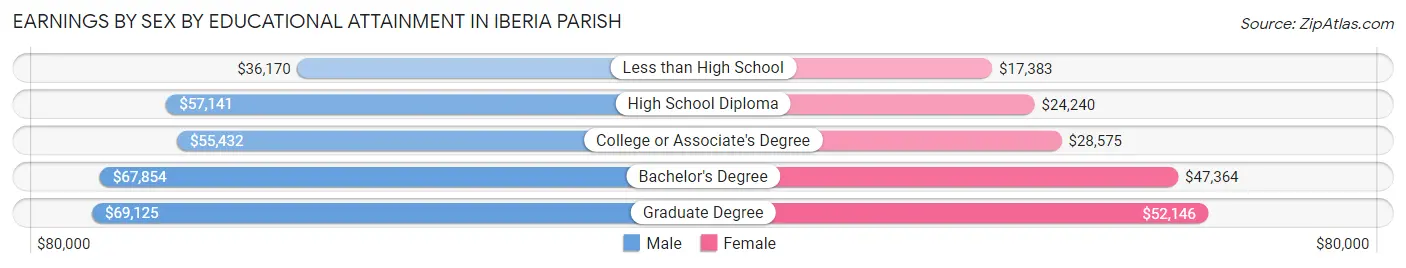
| Educational Attainment | Male Income | Female Income |
| Less than High School | $36,170 | $17,383 |
| High School Diploma | $57,141 | $24,240 |
| College or Associate's Degree | $55,432 | $28,575 |
| Bachelor's Degree | $67,854 | $47,364 |
| Graduate Degree | $69,125 | $52,146 |
| Total | $55,622 | $28,451 |
Family Income in Iberia Parish
Family Income Brackets in Iberia Parish
According to the Iberia Parish family income data, there are 3,552 families falling into the $50,000 to $74,999 income range, which is the most common income bracket and makes up 18.7% of all families. Conversely, the $200,000+ income bracket is the least frequent group with only 646 families (3.4%) belonging to this category.
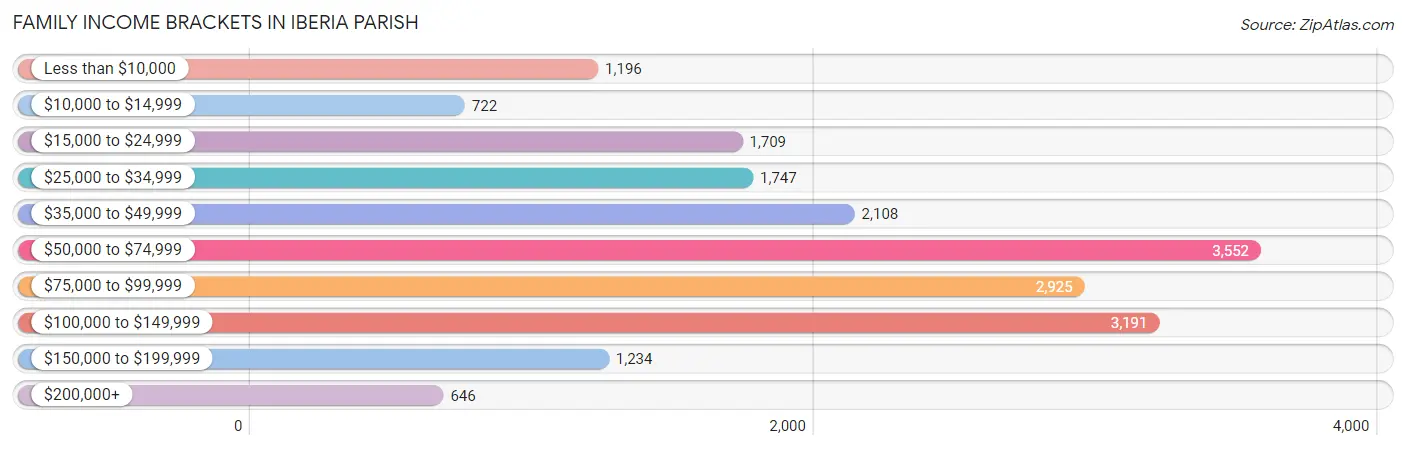
| Income Bracket | # Families | % Families |
| Less than $10,000 | 1,196 | 6.3% |
| $10,000 to $14,999 | 722 | 3.8% |
| $15,000 to $24,999 | 1,709 | 9.0% |
| $25,000 to $34,999 | 1,747 | 9.2% |
| $35,000 to $49,999 | 2,108 | 11.1% |
| $50,000 to $74,999 | 3,552 | 18.7% |
| $75,000 to $99,999 | 2,925 | 15.4% |
| $100,000 to $149,999 | 3,191 | 16.8% |
| $150,000 to $199,999 | 1,234 | 6.5% |
| $200,000+ | 646 | 3.4% |
Family Income by Famaliy Size in Iberia Parish
4-person families (3,240 | 17.1%) account for the highest median family income in Iberia Parish with $80,909 per family, while 2-person families (9,443 | 49.7%) have the highest median income of $28,638 per family member.
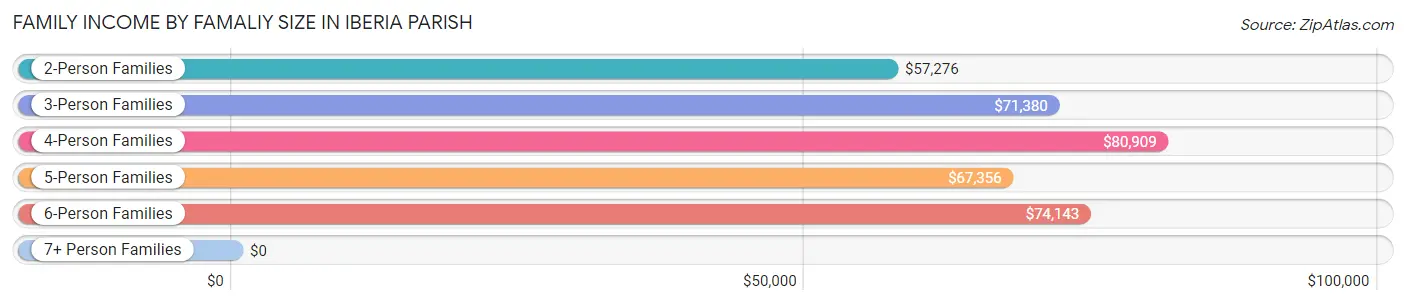
| Income Bracket | # Families | Median Income |
| 2-Person Families | 9,443 (49.7%) | $57,276 |
| 3-Person Families | 3,813 (20.1%) | $71,380 |
| 4-Person Families | 3,240 (17.1%) | $80,909 |
| 5-Person Families | 1,351 (7.1%) | $67,356 |
| 6-Person Families | 710 (3.7%) | $74,143 |
| 7+ Person Families | 435 (2.3%) | $0 |
| Total | 18,992 (100.0%) | $63,180 |
Family Income by Number of Earners in Iberia Parish
The median family income in Iberia Parish is $63,180, with families comprising 3+ earners (1,467) having the highest median family income of $117,713, while families with no earners (3,426) have the lowest median family income of $29,052, accounting for 7.7% and 18.0% of families, respectively.
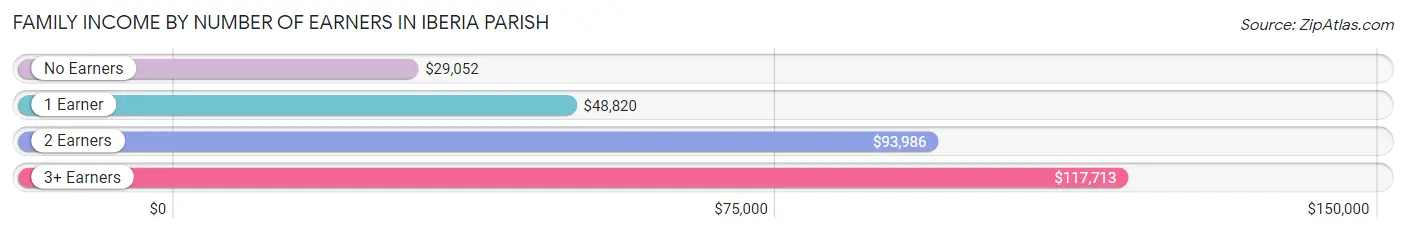
| Number of Earners | # Families | Median Income |
| No Earners | 3,426 (18.0%) | $29,052 |
| 1 Earner | 7,754 (40.8%) | $48,820 |
| 2 Earners | 6,345 (33.4%) | $93,986 |
| 3+ Earners | 1,467 (7.7%) | $117,713 |
| Total | 18,992 (100.0%) | $63,180 |
Household Income in Iberia Parish
Household Income Brackets in Iberia Parish
With 4,960 households falling in the category, the $50,000 to $74,999 income range is the most frequent in Iberia Parish, accounting for 18.4% of all households. In contrast, only 836 households (3.1%) fall into the $200,000+ income bracket, making it the least populous group.
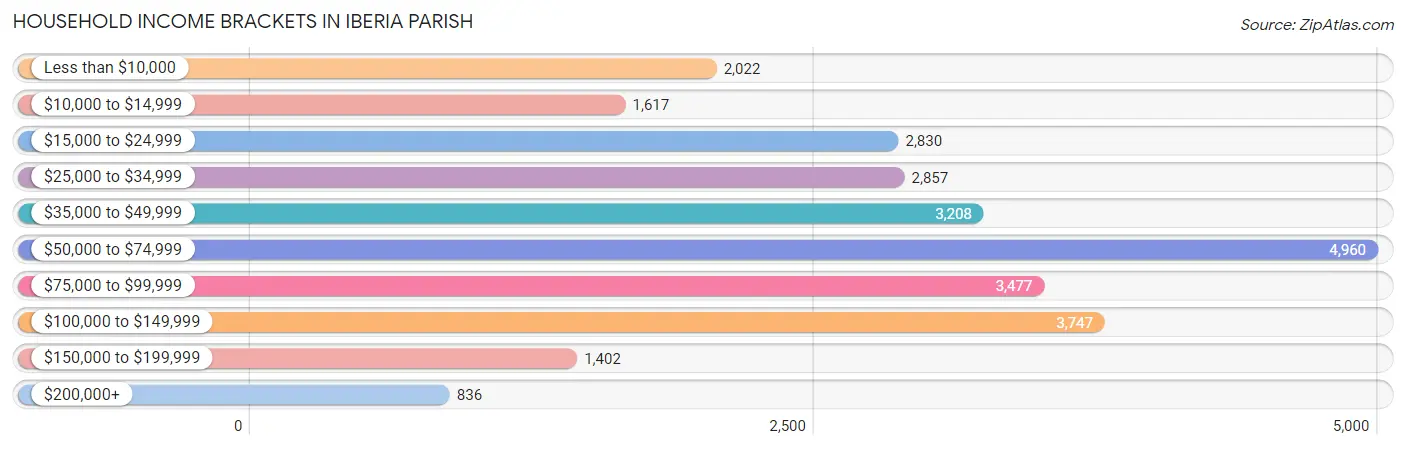
| Income Bracket | # Households | % Households |
| Less than $10,000 | 2,022 | 7.5% |
| $10,000 to $14,999 | 1,617 | 6.0% |
| $15,000 to $24,999 | 2,830 | 10.5% |
| $25,000 to $34,999 | 2,857 | 10.6% |
| $35,000 to $49,999 | 3,208 | 11.9% |
| $50,000 to $74,999 | 4,960 | 18.4% |
| $75,000 to $99,999 | 3,477 | 12.9% |
| $100,000 to $149,999 | 3,747 | 13.9% |
| $150,000 to $199,999 | 1,402 | 5.2% |
| $200,000+ | 836 | 3.1% |
Household Income by Householder Age in Iberia Parish
The median household income in Iberia Parish is $55,190, with the highest median household income of $68,274 found in the 45 to 64 years age bracket for the primary householder. A total of 9,963 households (37.0%) fall into this category. Meanwhile, the 65+ years age bracket for the primary householder has the lowest median household income of $39,488, with 7,275 households (27.0%) in this group.
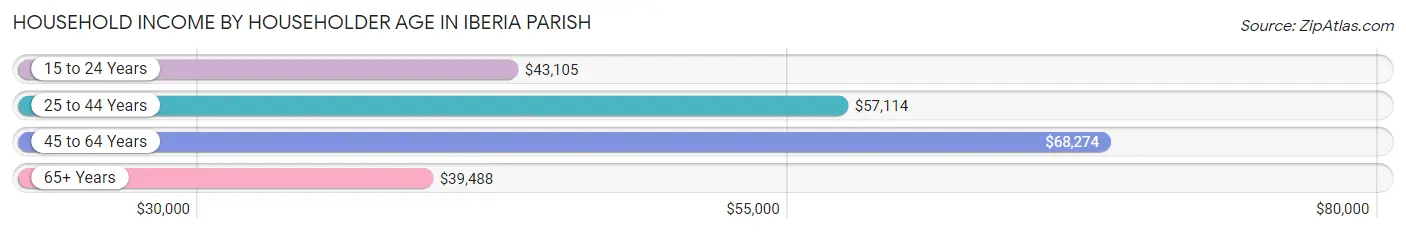
| Income Bracket | # Households | Median Income |
| 15 to 24 Years | 1,153 (4.3%) | $43,105 |
| 25 to 44 Years | 8,563 (31.8%) | $57,114 |
| 45 to 64 Years | 9,963 (37.0%) | $68,274 |
| 65+ Years | 7,275 (27.0%) | $39,488 |
| Total | 26,954 (100.0%) | $55,190 |
Poverty in Iberia Parish
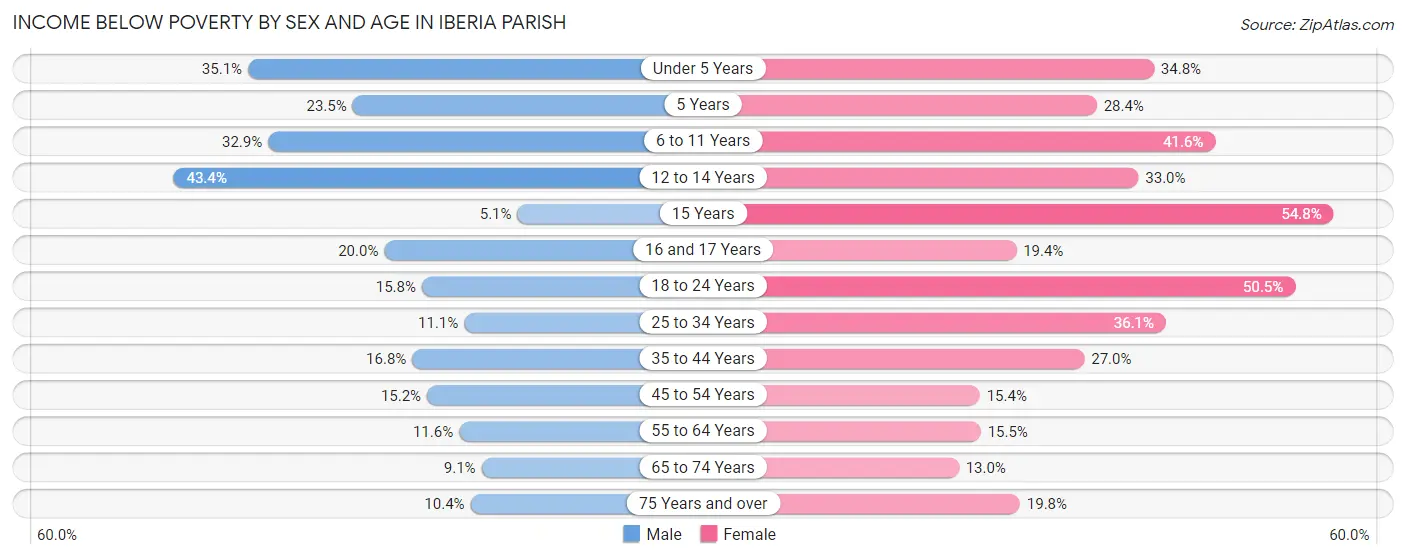
Income Below Poverty by Sex and Age in Iberia Parish
With 18.1% poverty level for males and 27.9% for females among the residents of Iberia Parish, 12 to 14 year old males and 15 year old females are the most vulnerable to poverty, with 804 males (43.4%) and 420 females (54.8%) in their respective age groups living below the poverty level.
| Age Bracket | Male | Female |
| Under 5 Years | 875 (35.1%) | 787 (34.8%) |
| 5 Years | 154 (23.5%) | 111 (28.4%) |
| 6 to 11 Years | 821 (32.9%) | 1,405 (41.6%) |
| 12 to 14 Years | 804 (43.4%) | 367 (33.0%) |
| 15 Years | 19 (5.1%) | 420 (54.8%) |
| 16 and 17 Years | 237 (20.0%) | 121 (19.4%) |
| 18 to 24 Years | 503 (15.8%) | 1,514 (50.5%) |
| 25 to 34 Years | 465 (11.1%) | 1,634 (36.1%) |
| 35 to 44 Years | 690 (16.8%) | 1,110 (27.0%) |
| 45 to 54 Years | 588 (15.2%) | 642 (15.4%) |
| 55 to 64 Years | 545 (11.6%) | 756 (15.5%) |
| 65 to 74 Years | 287 (9.1%) | 457 (13.0%) |
| 75 Years and over | 176 (10.3%) | 465 (19.8%) |
| Total | 6,164 (18.1%) | 9,789 (27.9%) |
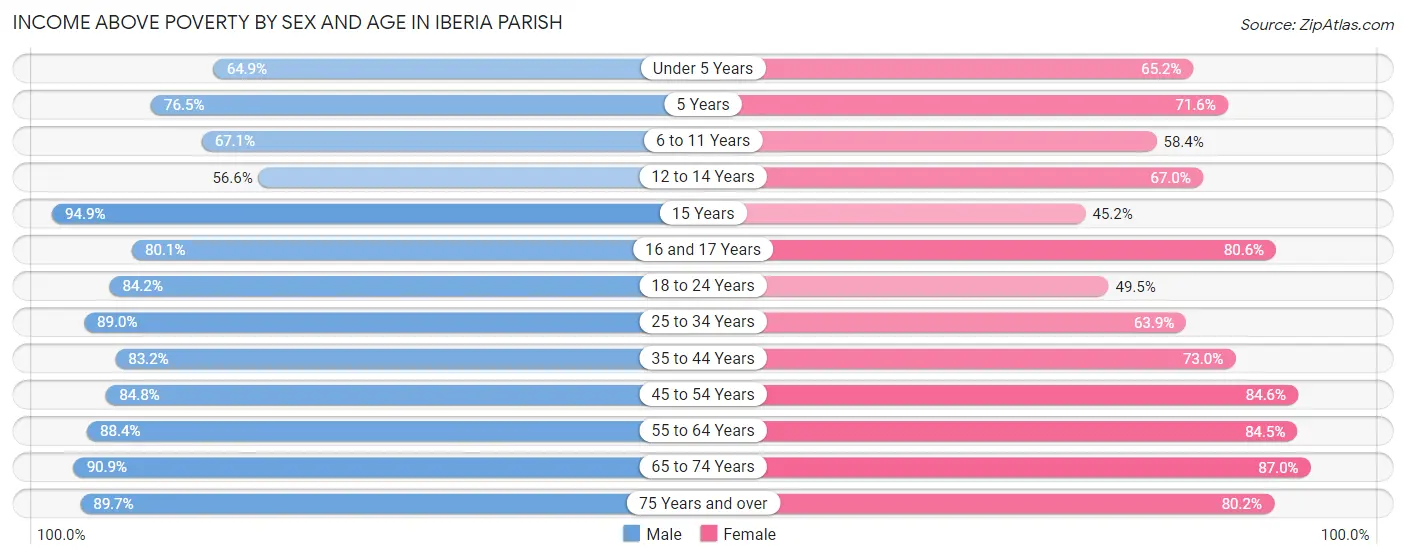
Income Above Poverty by Sex and Age in Iberia Parish
According to the poverty statistics in Iberia Parish, males aged 15 years and females aged 65 to 74 years are the age groups that are most secure financially, with 94.9% of males and 87.0% of females in these age groups living above the poverty line.
| Age Bracket | Male | Female |
| Under 5 Years | 1,616 (64.9%) | 1,477 (65.2%) |
| 5 Years | 502 (76.5%) | 280 (71.6%) |
| 6 to 11 Years | 1,675 (67.1%) | 1,974 (58.4%) |
| 12 to 14 Years | 1,048 (56.6%) | 744 (67.0%) |
| 15 Years | 352 (94.9%) | 347 (45.2%) |
| 16 and 17 Years | 951 (80.0%) | 502 (80.6%) |
| 18 to 24 Years | 2,687 (84.2%) | 1,485 (49.5%) |
| 25 to 34 Years | 3,742 (88.9%) | 2,893 (63.9%) |
| 35 to 44 Years | 3,408 (83.2%) | 2,999 (73.0%) |
| 45 to 54 Years | 3,284 (84.8%) | 3,537 (84.6%) |
| 55 to 64 Years | 4,144 (88.4%) | 4,131 (84.5%) |
| 65 to 74 Years | 2,861 (90.9%) | 3,052 (87.0%) |
| 75 Years and over | 1,525 (89.6%) | 1,880 (80.2%) |
| Total | 27,795 (81.9%) | 25,301 (72.1%) |
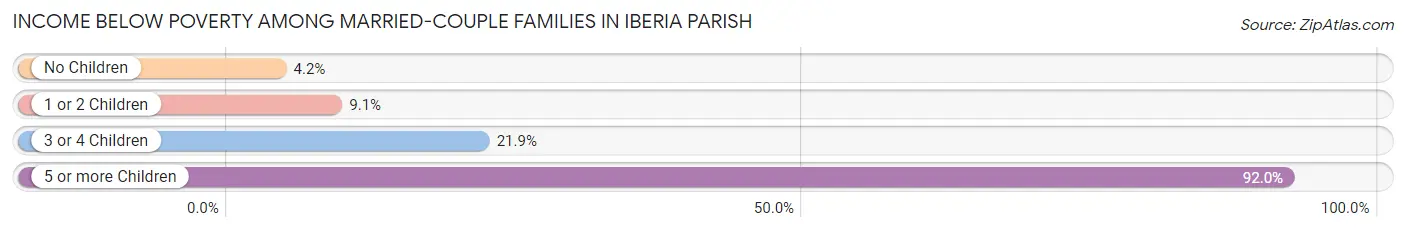
Income Below Poverty Among Married-Couple Families in Iberia Parish
The poverty statistics for married-couple families in Iberia Parish show that 8.1% or 979 of the total 12,160 families live below the poverty line. Families with 5 or more children have the highest poverty rate of 92.0%, comprising of 115 families. On the other hand, families with no children have the lowest poverty rate of 4.2%, which includes 323 families.
| Children | Above Poverty | Below Poverty |
| No Children | 7,321 (95.8%) | 323 (4.2%) |
| 1 or 2 Children | 2,984 (90.9%) | 298 (9.1%) |
| 3 or 4 Children | 866 (78.1%) | 243 (21.9%) |
| 5 or more Children | 10 (8.0%) | 115 (92.0%) |
| Total | 11,181 (91.9%) | 979 (8.1%) |
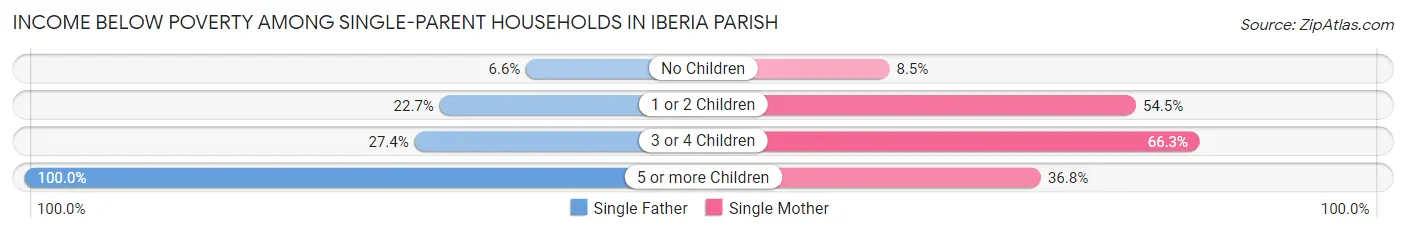
Income Below Poverty Among Single-Parent Households in Iberia Parish
According to the poverty data in Iberia Parish, 19.2% or 509 single-father households and 42.8% or 1,787 single-mother households are living below the poverty line. Among single-father households, those with 5 or more children have the highest poverty rate, with 43 households (100.0%) experiencing poverty. Likewise, among single-mother households, those with 3 or 4 children have the highest poverty rate, with 546 households (66.3%) falling below the poverty line.
| Children | Single Father | Single Mother |
| No Children | 57 (6.6%) | 105 (8.5%) |
| 1 or 2 Children | 334 (22.7%) | 1,093 (54.5%) |
| 3 or 4 Children | 75 (27.4%) | 546 (66.3%) |
| 5 or more Children | 43 (100.0%) | 43 (36.7%) |
| Total | 509 (19.2%) | 1,787 (42.8%) |
Income Below Poverty Among Married-Couple vs Single-Parent Households in Iberia Parish
The poverty data for Iberia Parish shows that 979 of the married-couple family households (8.1%) and 2,296 of the single-parent households (33.6%) are living below the poverty level. Within the married-couple family households, those with 5 or more children have the highest poverty rate, with 115 households (92.0%) falling below the poverty line. Among the single-parent households, those with 3 or 4 children have the highest poverty rate, with 621 household (56.6%) living below poverty.
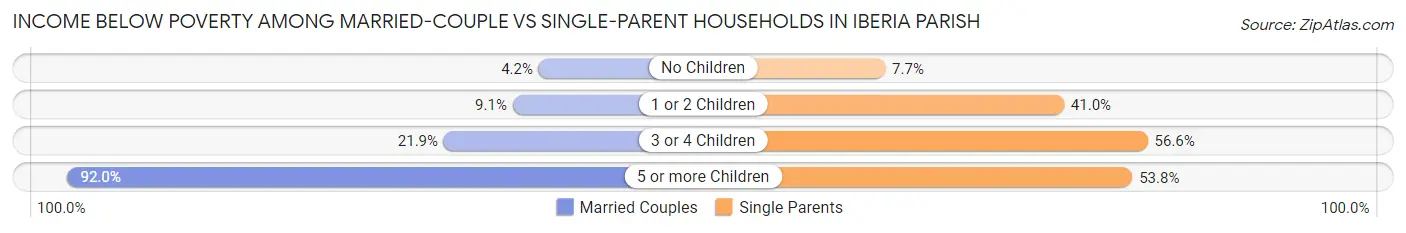
| Children | Married-Couple Families | Single-Parent Households |
| No Children | 323 (4.2%) | 162 (7.7%) |
| 1 or 2 Children | 298 (9.1%) | 1,427 (41.0%) |
| 3 or 4 Children | 243 (21.9%) | 621 (56.6%) |
| 5 or more Children | 115 (92.0%) | 86 (53.7%) |
| Total | 979 (8.1%) | 2,296 (33.6%) |
Employment Characteristics in Iberia Parish
Employment by Class of Employer in Iberia Parish
Among the 28,561 employed individuals in Iberia Parish, private company employees (21,200 | 74.2%), local government employees (2,184 | 7.6%), and self-employed (not incorporated) (2,100 | 7.3%) make up the most common classes of employment.
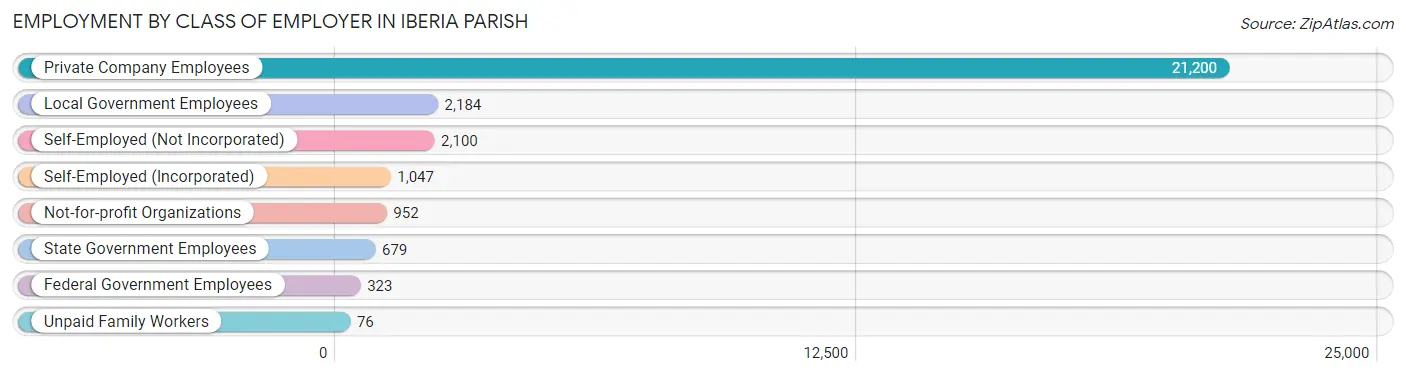
| Employer Class | # Employees | % Employees |
| Private Company Employees | 21,200 | 74.2% |
| Self-Employed (Incorporated) | 1,047 | 3.7% |
| Self-Employed (Not Incorporated) | 2,100 | 7.3% |
| Not-for-profit Organizations | 952 | 3.3% |
| Local Government Employees | 2,184 | 7.6% |
| State Government Employees | 679 | 2.4% |
| Federal Government Employees | 323 | 1.1% |
| Unpaid Family Workers | 76 | 0.3% |
| Total | 28,561 | 100.0% |
Employment Status by Age in Iberia Parish
According to the labor force statistics for Iberia Parish, out of the total population over 16 years of age (54,011), 58.0% or 31,326 individuals are in the labor force, with 6.3% or 1,974 of them unemployed. The age group with the highest labor force participation rate is 25 to 29 years, with 79.1% or 3,624 individuals in the labor force. Within the labor force, the 75 years and over age range has the highest percentage of unemployed individuals, with 25.3% or 56 of them being unemployed.
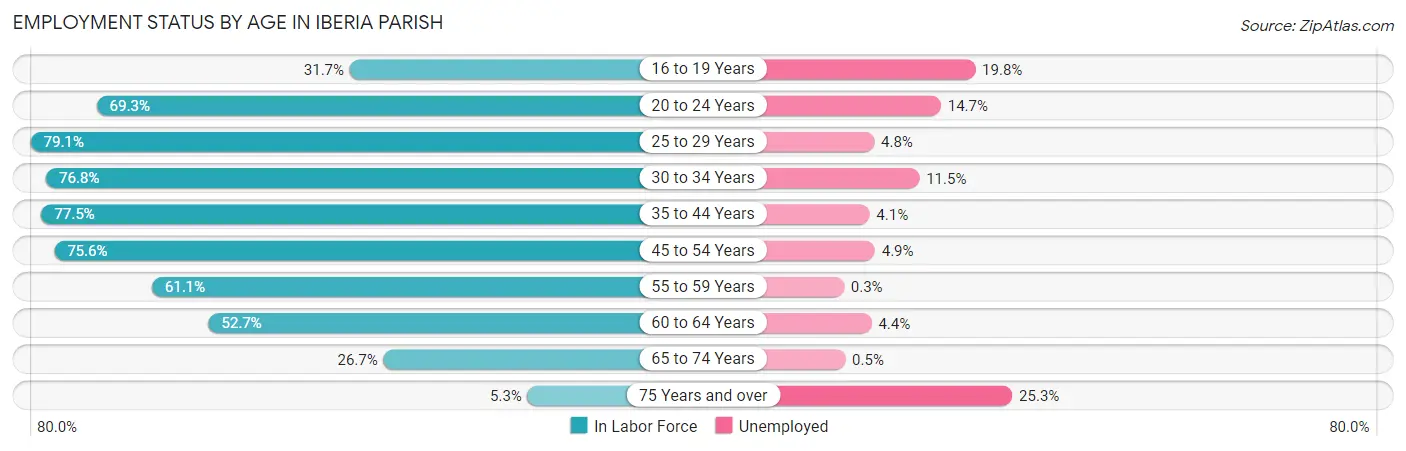
| Age Bracket | In Labor Force | Unemployed |
| 16 to 19 Years | 1,134 (31.7%) | 225 (19.8%) |
| 20 to 24 Years | 3,107 (69.3%) | 457 (14.7%) |
| 25 to 29 Years | 3,624 (79.1%) | 174 (4.8%) |
| 30 to 34 Years | 3,289 (76.8%) | 378 (11.5%) |
| 35 to 44 Years | 6,482 (77.5%) | 266 (4.1%) |
| 45 to 54 Years | 6,142 (75.6%) | 301 (4.9%) |
| 55 to 59 Years | 2,961 (61.1%) | 9 (0.3%) |
| 60 to 64 Years | 2,545 (52.7%) | 112 (4.4%) |
| 65 to 74 Years | 1,793 (26.7%) | 9 (0.5%) |
| 75 Years and over | 223 (5.3%) | 56 (25.3%) |
| Total | 31,326 (58.0%) | 1,974 (6.3%) |
Employment Status by Educational Attainment in Iberia Parish
According to labor force statistics for Iberia Parish, 71.5% of individuals (25,046) out of the total population between 25 and 64 years of age (35,029) are in the labor force, with 5.0% or 1,252 of them being unemployed. The group with the highest labor force participation rate are those with the educational attainment of bachelor's degree or higher, with 88.2% or 4,474 individuals in the labor force. Within the labor force, individuals with less than high school education have the highest percentage of unemployment, with 8.8% or 296 of them being unemployed.
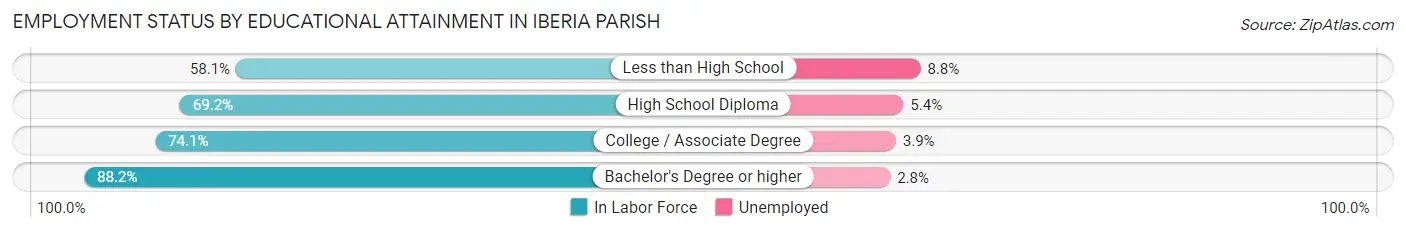
| Educational Attainment | In Labor Force | Unemployed |
| Less than High School | 3,358 (58.1%) | 509 (8.8%) |
| High School Diploma | 9,872 (69.2%) | 770 (5.4%) |
| College / Associate Degree | 7,345 (74.1%) | 387 (3.9%) |
| Bachelor's Degree or higher | 4,474 (88.2%) | 142 (2.8%) |
| Total | 25,046 (71.5%) | 1,751 (5.0%) |
Employment Occupations by Sex in Iberia Parish
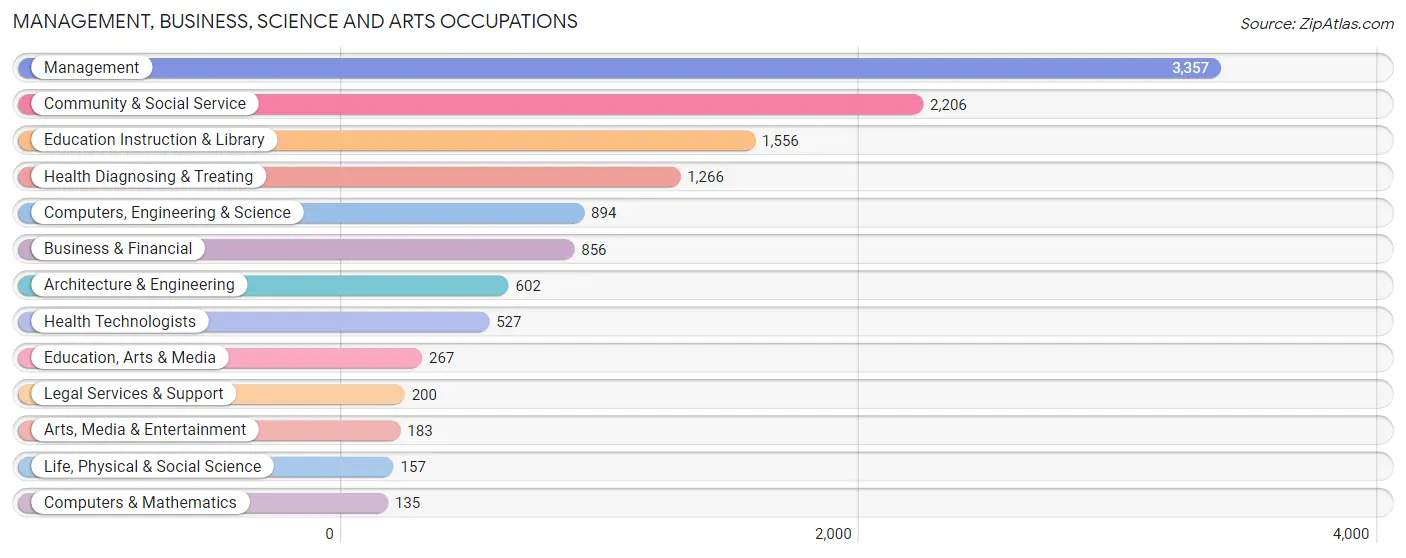
Management, Business, Science and Arts Occupations
The most common Management, Business, Science and Arts occupations in Iberia Parish are Management (3,357 | 11.5%), Community & Social Service (2,206 | 7.5%), Education Instruction & Library (1,556 | 5.3%), Health Diagnosing & Treating (1,266 | 4.3%), and Computers, Engineering & Science (894 | 3.0%).
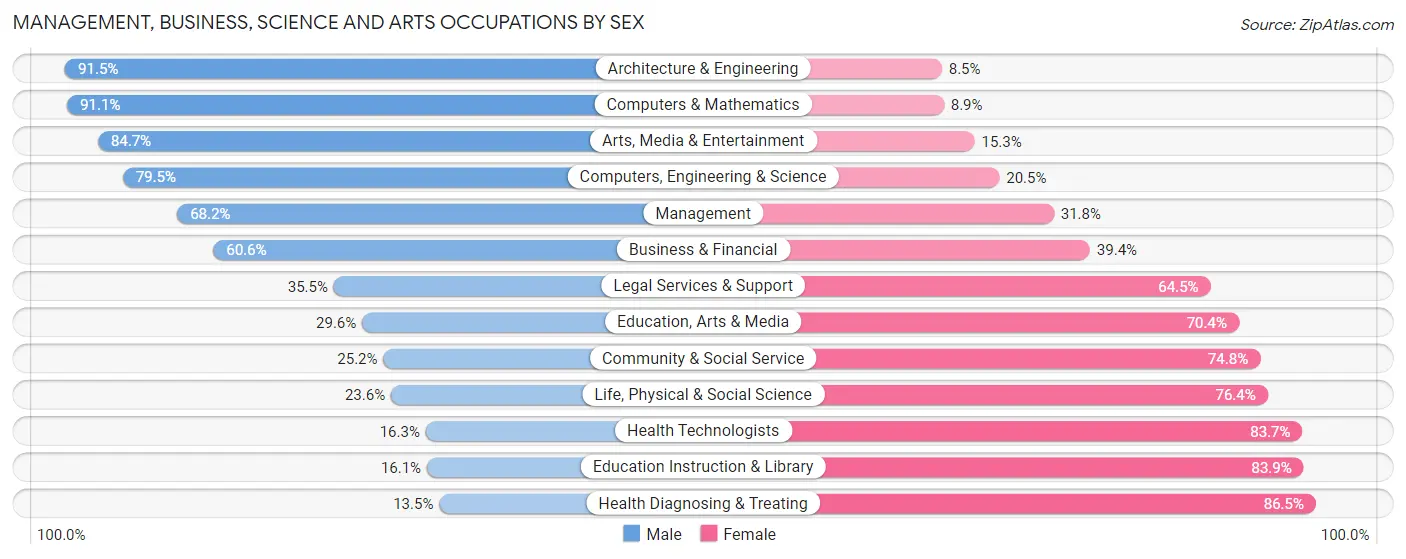
Management, Business, Science and Arts Occupations by Sex
Within the Management, Business, Science and Arts occupations in Iberia Parish, the most male-oriented occupations are Architecture & Engineering (91.5%), Computers & Mathematics (91.1%), and Arts, Media & Entertainment (84.7%), while the most female-oriented occupations are Health Diagnosing & Treating (86.5%), Education Instruction & Library (83.9%), and Health Technologists (83.7%).
| Occupation | Male | Female |
| Management | 2,288 (68.2%) | 1,069 (31.8%) |
| Business & Financial | 519 (60.6%) | 337 (39.4%) |
| Computers, Engineering & Science | 711 (79.5%) | 183 (20.5%) |
| Computers & Mathematics | 123 (91.1%) | 12 (8.9%) |
| Architecture & Engineering | 551 (91.5%) | 51 (8.5%) |
| Life, Physical & Social Science | 37 (23.6%) | 120 (76.4%) |
| Community & Social Service | 555 (25.2%) | 1,651 (74.8%) |
| Education, Arts & Media | 79 (29.6%) | 188 (70.4%) |
| Legal Services & Support | 71 (35.5%) | 129 (64.5%) |
| Education Instruction & Library | 250 (16.1%) | 1,306 (83.9%) |
| Arts, Media & Entertainment | 155 (84.7%) | 28 (15.3%) |
| Health Diagnosing & Treating | 171 (13.5%) | 1,095 (86.5%) |
| Health Technologists | 86 (16.3%) | 441 (83.7%) |
| Total (Category) | 4,244 (49.5%) | 4,335 (50.5%) |
| Total (Overall) | 15,751 (53.7%) | 13,565 (46.3%) |
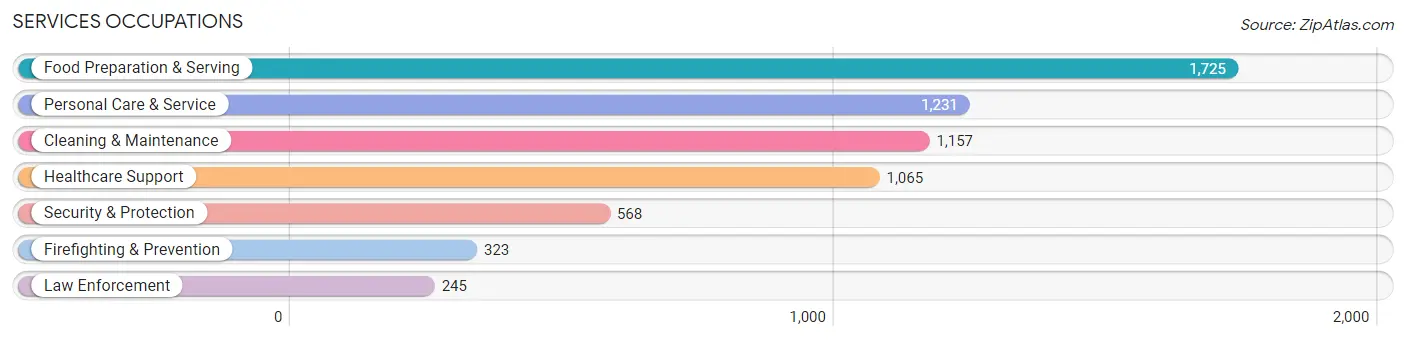
Services Occupations
The most common Services occupations in Iberia Parish are Food Preparation & Serving (1,725 | 5.9%), Personal Care & Service (1,231 | 4.2%), Cleaning & Maintenance (1,157 | 4.0%), Healthcare Support (1,065 | 3.6%), and Security & Protection (568 | 1.9%).
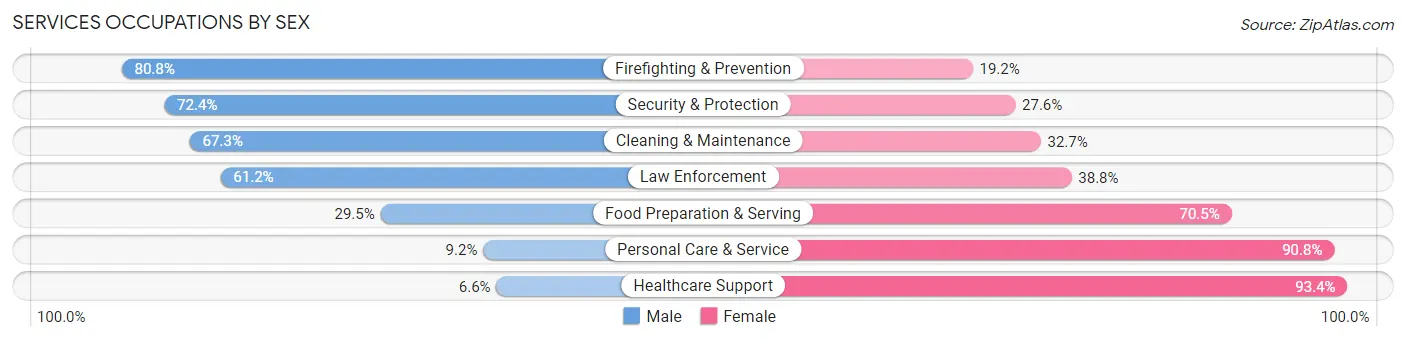
Services Occupations by Sex
Within the Services occupations in Iberia Parish, the most male-oriented occupations are Firefighting & Prevention (80.8%), Security & Protection (72.4%), and Cleaning & Maintenance (67.3%), while the most female-oriented occupations are Healthcare Support (93.4%), Personal Care & Service (90.8%), and Food Preparation & Serving (70.5%).
| Occupation | Male | Female |
| Healthcare Support | 70 (6.6%) | 995 (93.4%) |
| Security & Protection | 411 (72.4%) | 157 (27.6%) |
| Firefighting & Prevention | 261 (80.8%) | 62 (19.2%) |
| Law Enforcement | 150 (61.2%) | 95 (38.8%) |
| Food Preparation & Serving | 509 (29.5%) | 1,216 (70.5%) |
| Cleaning & Maintenance | 779 (67.3%) | 378 (32.7%) |
| Personal Care & Service | 113 (9.2%) | 1,118 (90.8%) |
| Total (Category) | 1,882 (32.8%) | 3,864 (67.2%) |
| Total (Overall) | 15,751 (53.7%) | 13,565 (46.3%) |
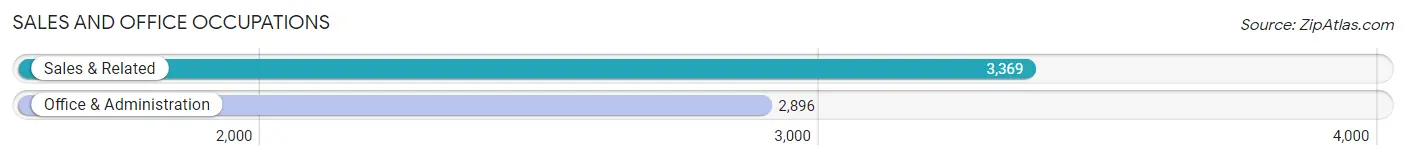
Sales and Office Occupations
The most common Sales and Office occupations in Iberia Parish are Sales & Related (3,369 | 11.5%), and Office & Administration (2,896 | 9.9%).
Sales and Office Occupations by Sex
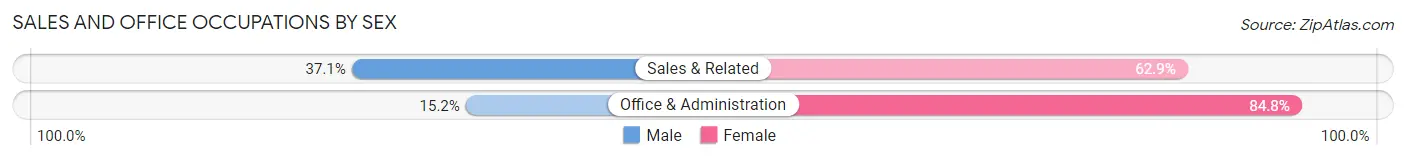
| Occupation | Male | Female |
| Sales & Related | 1,251 (37.1%) | 2,118 (62.9%) |
| Office & Administration | 440 (15.2%) | 2,456 (84.8%) |
| Total (Category) | 1,691 (27.0%) | 4,574 (73.0%) |
| Total (Overall) | 15,751 (53.7%) | 13,565 (46.3%) |
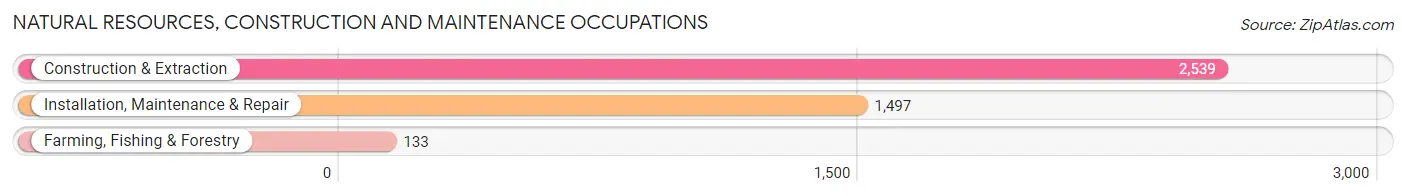
Natural Resources, Construction and Maintenance Occupations
The most common Natural Resources, Construction and Maintenance occupations in Iberia Parish are Construction & Extraction (2,539 | 8.7%), Installation, Maintenance & Repair (1,497 | 5.1%), and Farming, Fishing & Forestry (133 | 0.4%).
Natural Resources, Construction and Maintenance Occupations by Sex
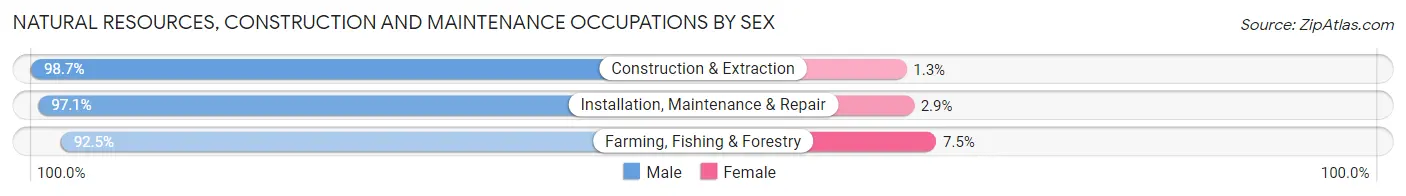
| Occupation | Male | Female |
| Farming, Fishing & Forestry | 123 (92.5%) | 10 (7.5%) |
| Construction & Extraction | 2,505 (98.7%) | 34 (1.3%) |
| Installation, Maintenance & Repair | 1,454 (97.1%) | 43 (2.9%) |
| Total (Category) | 4,082 (97.9%) | 87 (2.1%) |
| Total (Overall) | 15,751 (53.7%) | 13,565 (46.3%) |
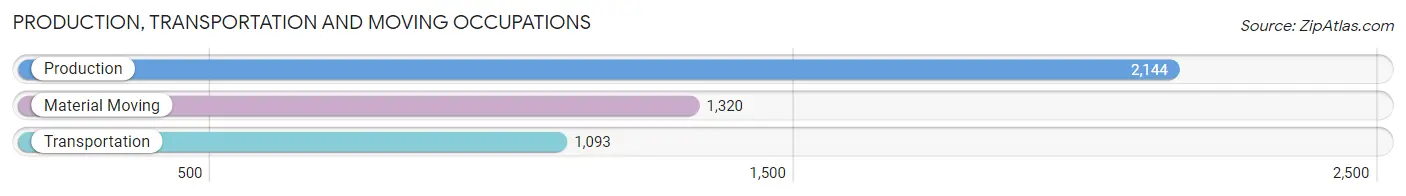
Production, Transportation and Moving Occupations
The most common Production, Transportation and Moving occupations in Iberia Parish are Production (2,144 | 7.3%), Material Moving (1,320 | 4.5%), and Transportation (1,093 | 3.7%).
Production, Transportation and Moving Occupations by Sex
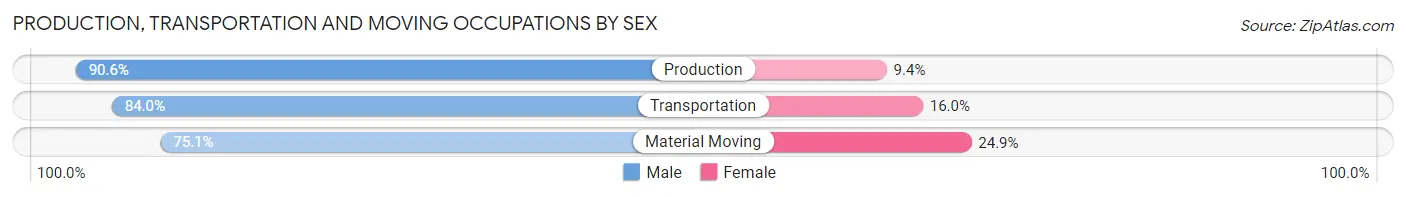
| Occupation | Male | Female |
| Production | 1,943 (90.6%) | 201 (9.4%) |
| Transportation | 918 (84.0%) | 175 (16.0%) |
| Material Moving | 991 (75.1%) | 329 (24.9%) |
| Total (Category) | 3,852 (84.5%) | 705 (15.5%) |
| Total (Overall) | 15,751 (53.7%) | 13,565 (46.3%) |
Employment Industries by Sex in Iberia Parish
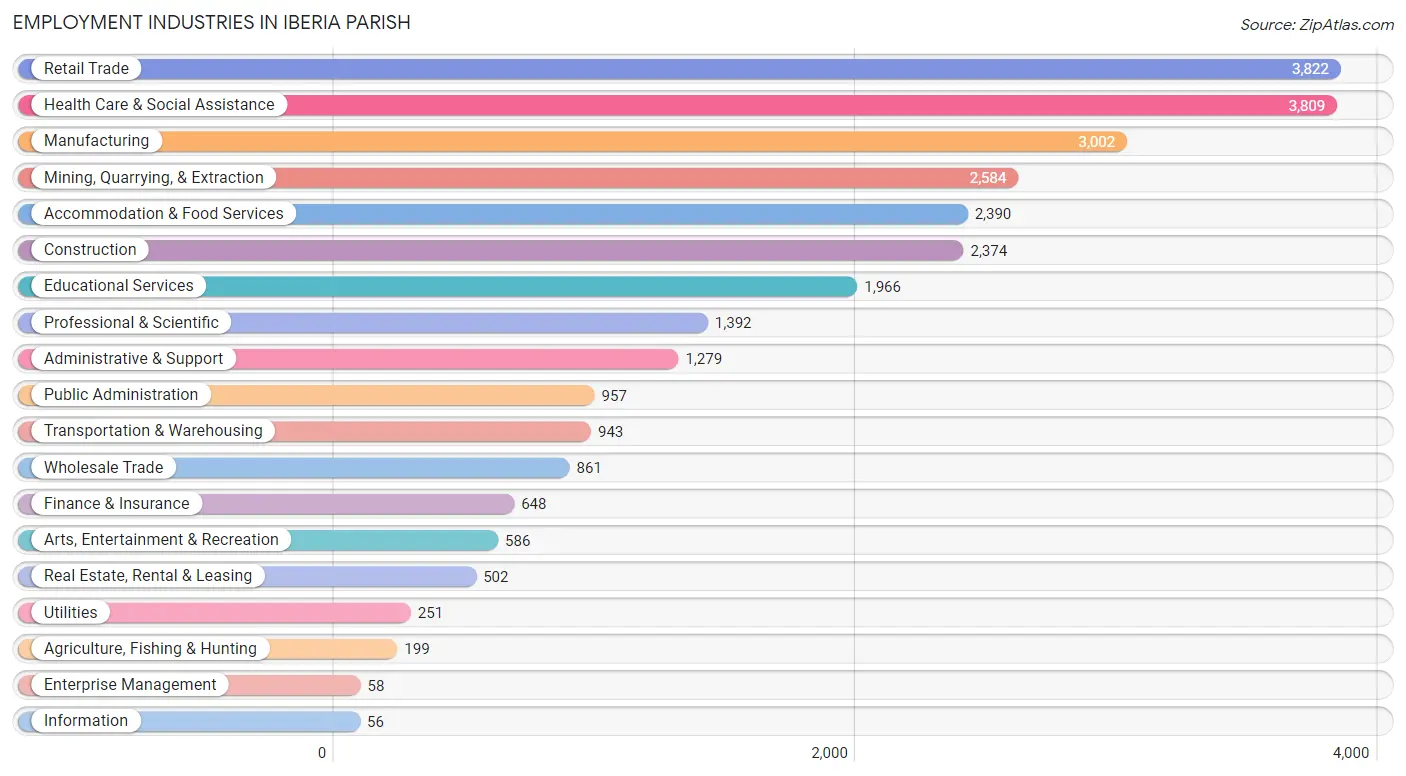
Employment Industries in Iberia Parish
The major employment industries in Iberia Parish include Retail Trade (3,822 | 13.0%), Health Care & Social Assistance (3,809 | 13.0%), Manufacturing (3,002 | 10.2%), Mining, Quarrying, & Extraction (2,584 | 8.8%), and Accommodation & Food Services (2,390 | 8.2%).
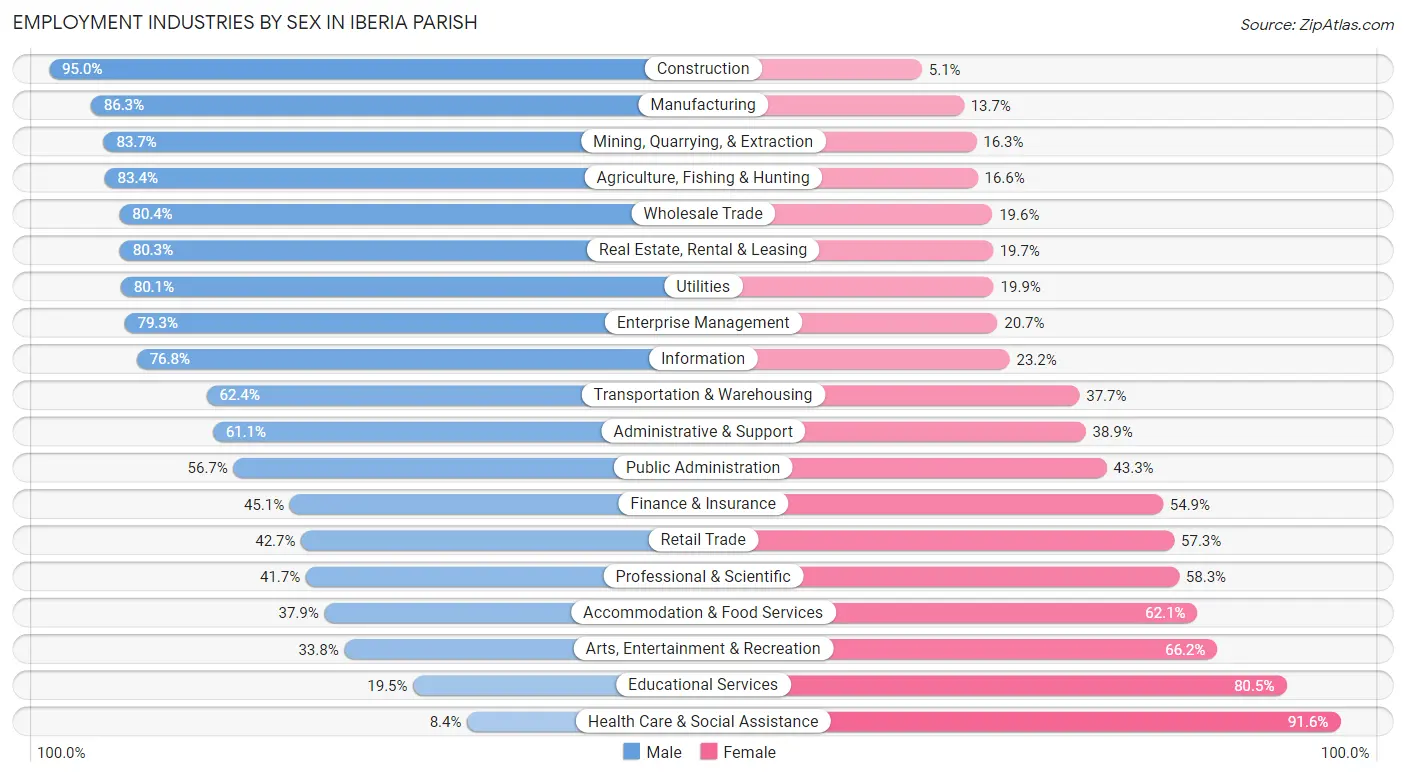
Employment Industries by Sex in Iberia Parish
The Iberia Parish industries that see more men than women are Construction (95.0%), Manufacturing (86.3%), and Mining, Quarrying, & Extraction (83.7%), whereas the industries that tend to have a higher number of women are Health Care & Social Assistance (91.6%), Educational Services (80.5%), and Arts, Entertainment & Recreation (66.2%).
| Industry | Male | Female |
| Agriculture, Fishing & Hunting | 166 (83.4%) | 33 (16.6%) |
| Mining, Quarrying, & Extraction | 2,162 (83.7%) | 422 (16.3%) |
| Construction | 2,254 (95.0%) | 120 (5.1%) |
| Manufacturing | 2,590 (86.3%) | 412 (13.7%) |
| Wholesale Trade | 692 (80.4%) | 169 (19.6%) |
| Retail Trade | 1,633 (42.7%) | 2,189 (57.3%) |
| Transportation & Warehousing | 588 (62.4%) | 355 (37.7%) |
| Utilities | 201 (80.1%) | 50 (19.9%) |
| Information | 43 (76.8%) | 13 (23.2%) |
| Finance & Insurance | 292 (45.1%) | 356 (54.9%) |
| Real Estate, Rental & Leasing | 403 (80.3%) | 99 (19.7%) |
| Professional & Scientific | 581 (41.7%) | 811 (58.3%) |
| Enterprise Management | 46 (79.3%) | 12 (20.7%) |
| Administrative & Support | 781 (61.1%) | 498 (38.9%) |
| Educational Services | 384 (19.5%) | 1,582 (80.5%) |
| Health Care & Social Assistance | 319 (8.4%) | 3,490 (91.6%) |
| Arts, Entertainment & Recreation | 198 (33.8%) | 388 (66.2%) |
| Accommodation & Food Services | 906 (37.9%) | 1,484 (62.1%) |
| Public Administration | 543 (56.7%) | 414 (43.3%) |
| Total | 15,751 (53.7%) | 13,565 (46.3%) |
Education in Iberia Parish
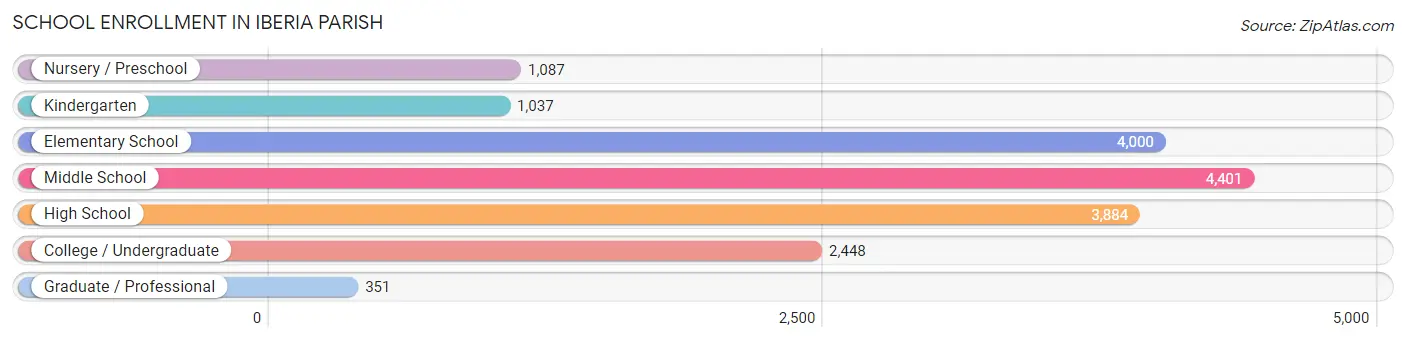
School Enrollment in Iberia Parish
The most common levels of schooling among the 17,208 students in Iberia Parish are middle school (4,401 | 25.6%), elementary school (4,000 | 23.3%), and high school (3,884 | 22.6%).
| School Level | # Students | % Students |
| Nursery / Preschool | 1,087 | 6.3% |
| Kindergarten | 1,037 | 6.0% |
| Elementary School | 4,000 | 23.3% |
| Middle School | 4,401 | 25.6% |
| High School | 3,884 | 22.6% |
| College / Undergraduate | 2,448 | 14.2% |
| Graduate / Professional | 351 | 2.0% |
| Total | 17,208 | 100.0% |
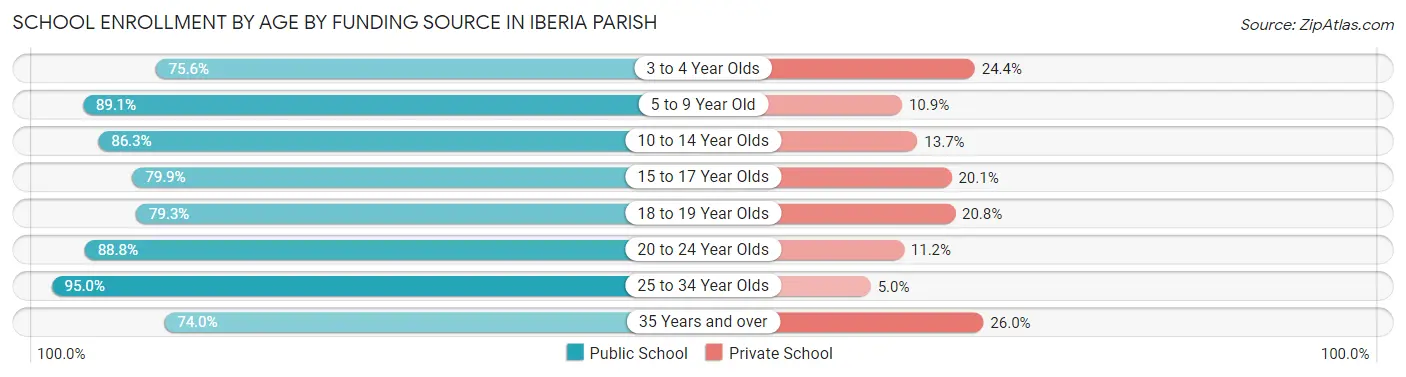
School Enrollment by Age by Funding Source in Iberia Parish
Out of a total of 17,208 students who are enrolled in schools in Iberia Parish, 2,598 (15.1%) attend a private institution, while the remaining 14,610 (84.9%) are enrolled in public schools. The age group of 35 years and over has the highest likelihood of being enrolled in private schools, with 234 (26.0% in the age bracket) enrolled. Conversely, the age group of 25 to 34 year olds has the lowest likelihood of being enrolled in a private school, with 735 (95.0% in the age bracket) attending a public institution.
| Age Bracket | Public School | Private School |
| 3 to 4 Year Olds | 616 (75.6%) | 199 (24.4%) |
| 5 to 9 Year Old | 4,260 (89.1%) | 519 (10.9%) |
| 10 to 14 Year Olds | 4,215 (86.3%) | 671 (13.7%) |
| 15 to 17 Year Olds | 2,328 (79.9%) | 585 (20.1%) |
| 18 to 19 Year Olds | 955 (79.2%) | 250 (20.7%) |
| 20 to 24 Year Olds | 832 (88.8%) | 105 (11.2%) |
| 25 to 34 Year Olds | 735 (95.0%) | 39 (5.0%) |
| 35 Years and over | 665 (74.0%) | 234 (26.0%) |
| Total | 14,610 (84.9%) | 2,598 (15.1%) |
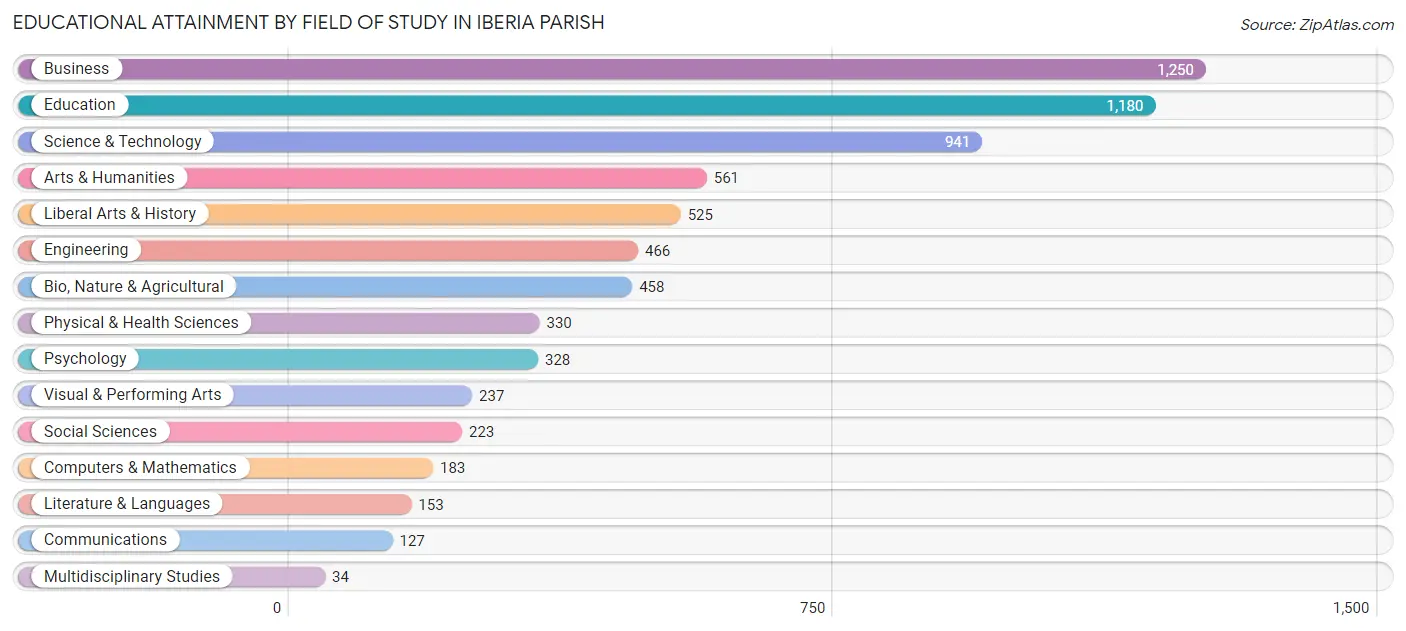
Educational Attainment by Field of Study in Iberia Parish
Business (1,250 | 17.9%), education (1,180 | 16.9%), science & technology (941 | 13.5%), arts & humanities (561 | 8.0%), and liberal arts & history (525 | 7.5%) are the most common fields of study among 6,996 individuals in Iberia Parish who have obtained a bachelor's degree or higher.
| Field of Study | # Graduates | % Graduates |
| Computers & Mathematics | 183 | 2.6% |
| Bio, Nature & Agricultural | 458 | 6.6% |
| Physical & Health Sciences | 330 | 4.7% |
| Psychology | 328 | 4.7% |
| Social Sciences | 223 | 3.2% |
| Engineering | 466 | 6.7% |
| Multidisciplinary Studies | 34 | 0.5% |
| Science & Technology | 941 | 13.5% |
| Business | 1,250 | 17.9% |
| Education | 1,180 | 16.9% |
| Literature & Languages | 153 | 2.2% |
| Liberal Arts & History | 525 | 7.5% |
| Visual & Performing Arts | 237 | 3.4% |
| Communications | 127 | 1.8% |
| Arts & Humanities | 561 | 8.0% |
| Total | 6,996 | 100.0% |
Transportation & Commute in Iberia Parish
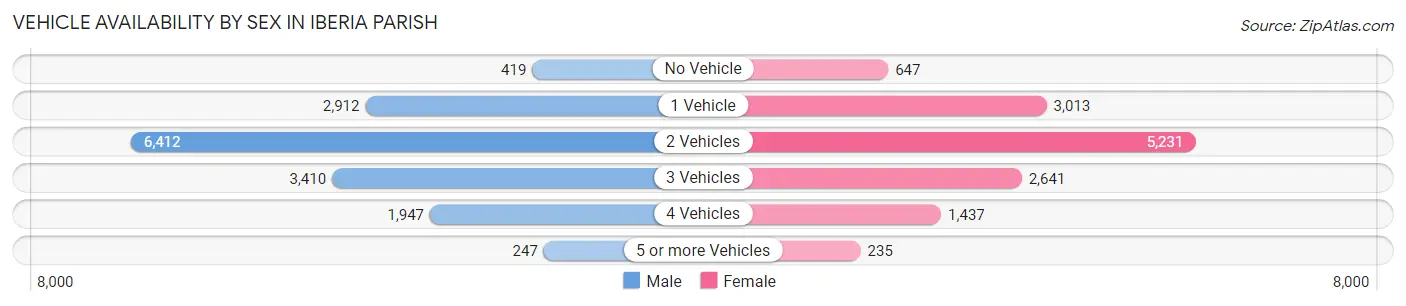
Vehicle Availability by Sex in Iberia Parish
The most prevalent vehicle ownership categories in Iberia Parish are males with 2 vehicles (6,412, accounting for 41.8%) and females with 2 vehicles (5,231, making up 48.6%).
| Vehicles Available | Male | Female |
| No Vehicle | 419 (2.7%) | 647 (4.9%) |
| 1 Vehicle | 2,912 (19.0%) | 3,013 (22.8%) |
| 2 Vehicles | 6,412 (41.8%) | 5,231 (39.6%) |
| 3 Vehicles | 3,410 (22.2%) | 2,641 (20.0%) |
| 4 Vehicles | 1,947 (12.7%) | 1,437 (10.9%) |
| 5 or more Vehicles | 247 (1.6%) | 235 (1.8%) |
| Total | 15,347 (100.0%) | 13,204 (100.0%) |
Commute Time in Iberia Parish
The most frequently occuring commute durations in Iberia Parish are 10 to 14 minutes (4,787 commuters, 17.8%), 15 to 19 minutes (4,319 commuters, 16.1%), and 20 to 24 minutes (3,943 commuters, 14.7%).
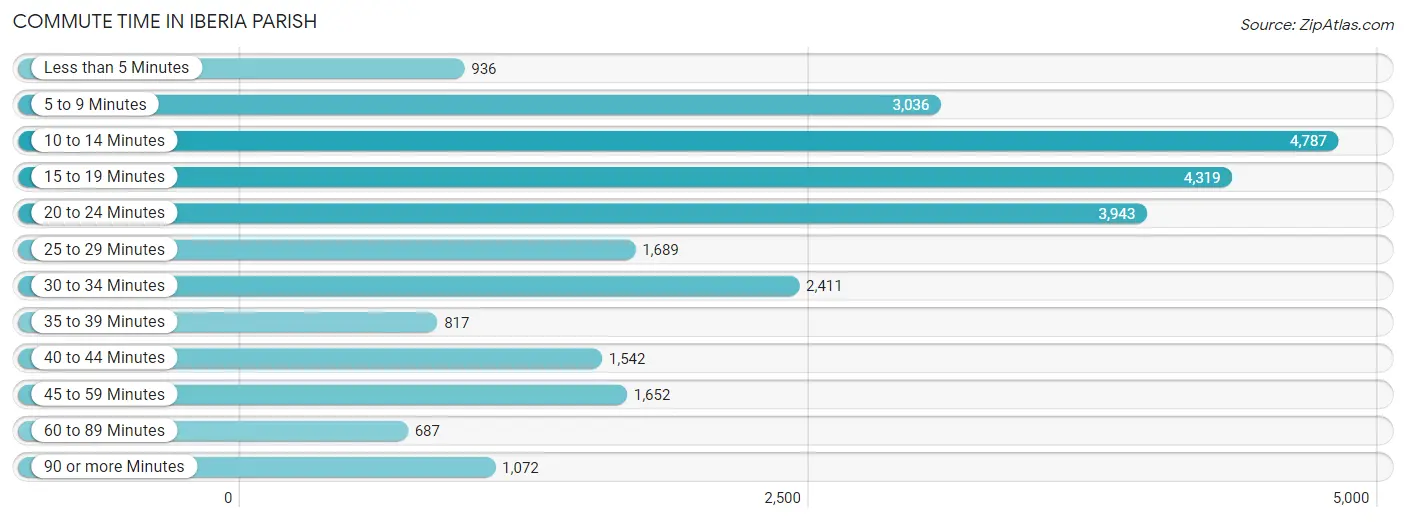
| Commute Time | # Commuters | % Commuters |
| Less than 5 Minutes | 936 | 3.5% |
| 5 to 9 Minutes | 3,036 | 11.3% |
| 10 to 14 Minutes | 4,787 | 17.8% |
| 15 to 19 Minutes | 4,319 | 16.1% |
| 20 to 24 Minutes | 3,943 | 14.7% |
| 25 to 29 Minutes | 1,689 | 6.3% |
| 30 to 34 Minutes | 2,411 | 9.0% |
| 35 to 39 Minutes | 817 | 3.0% |
| 40 to 44 Minutes | 1,542 | 5.7% |
| 45 to 59 Minutes | 1,652 | 6.1% |
| 60 to 89 Minutes | 687 | 2.5% |
| 90 or more Minutes | 1,072 | 4.0% |
Commute Time by Sex in Iberia Parish
The most common commute times in Iberia Parish are 15 to 19 minutes (2,348 commuters, 16.7%) for males and 10 to 14 minutes (2,981 commuters, 23.3%) for females.
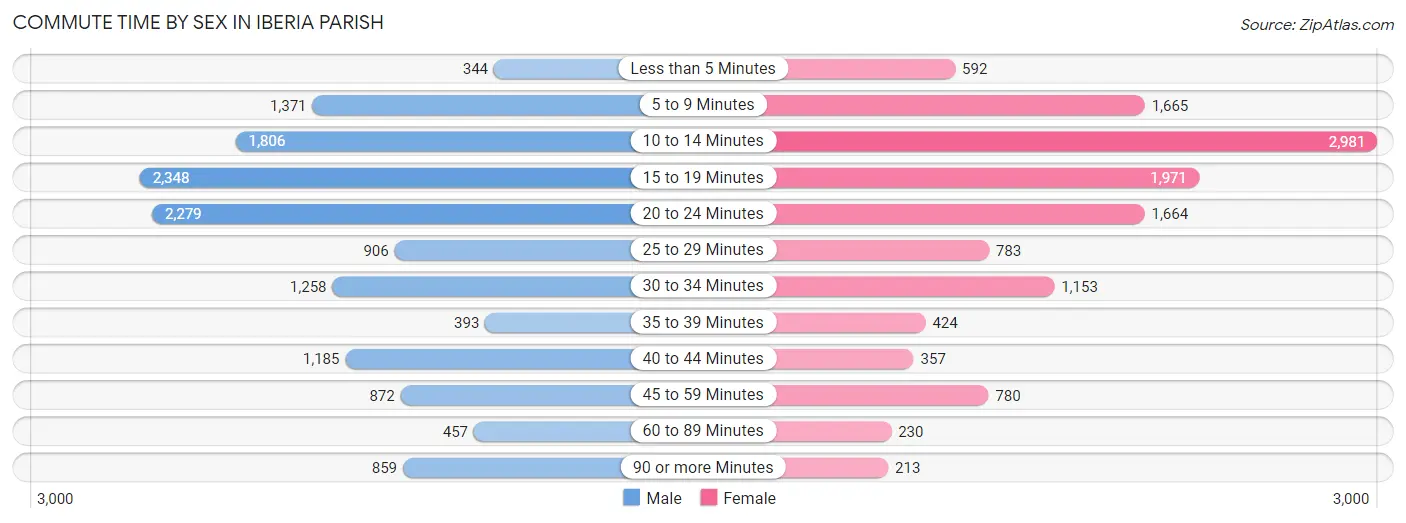
| Commute Time | Male | Female |
| Less than 5 Minutes | 344 (2.4%) | 592 (4.6%) |
| 5 to 9 Minutes | 1,371 (9.7%) | 1,665 (13.0%) |
| 10 to 14 Minutes | 1,806 (12.8%) | 2,981 (23.3%) |
| 15 to 19 Minutes | 2,348 (16.7%) | 1,971 (15.4%) |
| 20 to 24 Minutes | 2,279 (16.2%) | 1,664 (13.0%) |
| 25 to 29 Minutes | 906 (6.4%) | 783 (6.1%) |
| 30 to 34 Minutes | 1,258 (8.9%) | 1,153 (9.0%) |
| 35 to 39 Minutes | 393 (2.8%) | 424 (3.3%) |
| 40 to 44 Minutes | 1,185 (8.4%) | 357 (2.8%) |
| 45 to 59 Minutes | 872 (6.2%) | 780 (6.1%) |
| 60 to 89 Minutes | 457 (3.3%) | 230 (1.8%) |
| 90 or more Minutes | 859 (6.1%) | 213 (1.7%) |
Time of Departure to Work by Sex in Iberia Parish
The most frequent times of departure to work in Iberia Parish are 7:00 AM to 7:29 AM (2,686, 19.1%) for males and 7:00 AM to 7:29 AM (2,562, 20.0%) for females.
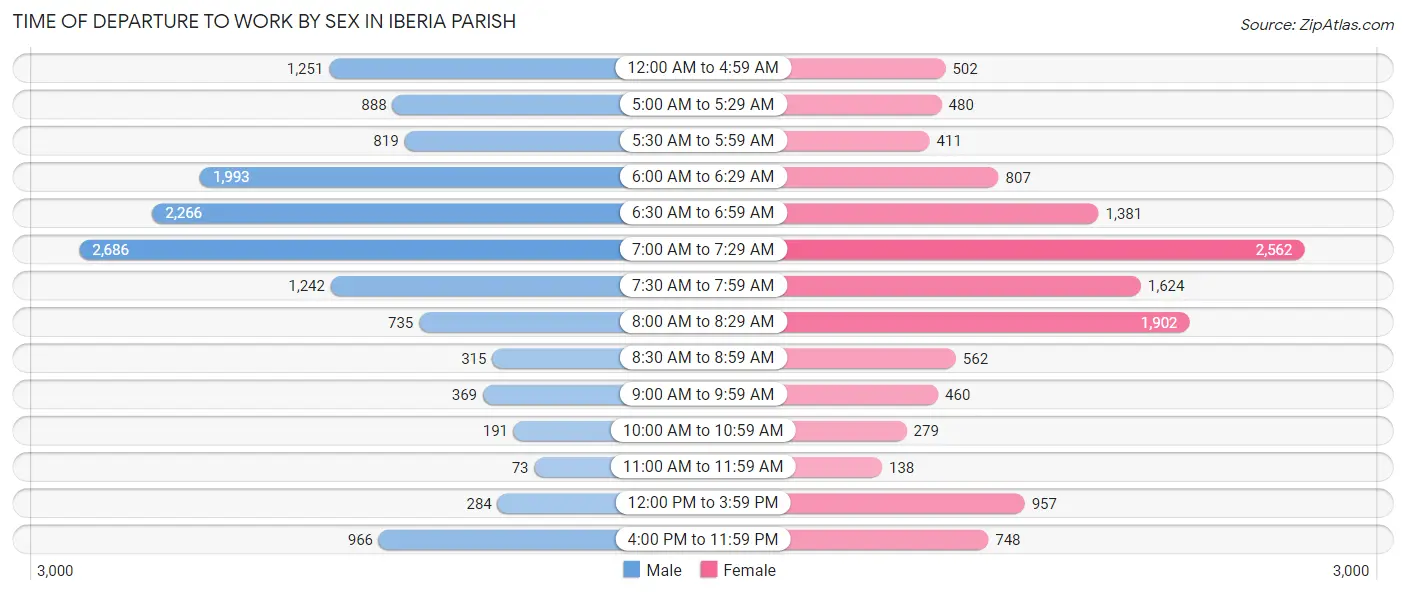
| Time of Departure | Male | Female |
| 12:00 AM to 4:59 AM | 1,251 (8.9%) | 502 (3.9%) |
| 5:00 AM to 5:29 AM | 888 (6.3%) | 480 (3.7%) |
| 5:30 AM to 5:59 AM | 819 (5.8%) | 411 (3.2%) |
| 6:00 AM to 6:29 AM | 1,993 (14.2%) | 807 (6.3%) |
| 6:30 AM to 6:59 AM | 2,266 (16.1%) | 1,381 (10.8%) |
| 7:00 AM to 7:29 AM | 2,686 (19.1%) | 2,562 (20.0%) |
| 7:30 AM to 7:59 AM | 1,242 (8.8%) | 1,624 (12.7%) |
| 8:00 AM to 8:29 AM | 735 (5.2%) | 1,902 (14.8%) |
| 8:30 AM to 8:59 AM | 315 (2.2%) | 562 (4.4%) |
| 9:00 AM to 9:59 AM | 369 (2.6%) | 460 (3.6%) |
| 10:00 AM to 10:59 AM | 191 (1.4%) | 279 (2.2%) |
| 11:00 AM to 11:59 AM | 73 (0.5%) | 138 (1.1%) |
| 12:00 PM to 3:59 PM | 284 (2.0%) | 957 (7.5%) |
| 4:00 PM to 11:59 PM | 966 (6.9%) | 748 (5.8%) |
| Total | 14,078 (100.0%) | 12,813 (100.0%) |
Housing Occupancy in Iberia Parish
Occupancy by Ownership in Iberia Parish
Of the total 26,954 dwellings in Iberia Parish, owner-occupied units account for 18,474 (68.5%), while renter-occupied units make up 8,480 (31.5%).
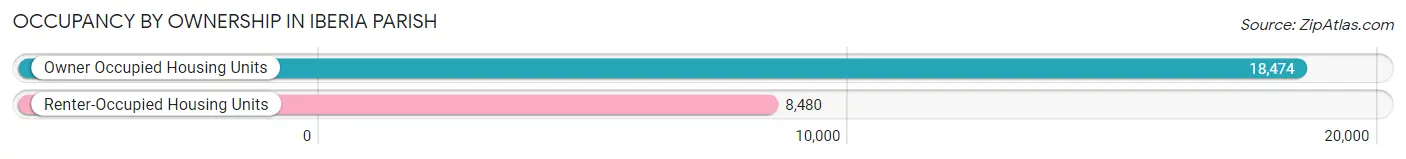
| Occupancy | # Housing Units | % Housing Units |
| Owner Occupied Housing Units | 18,474 | 68.5% |
| Renter-Occupied Housing Units | 8,480 | 31.5% |
| Total Occupied Housing Units | 26,954 | 100.0% |
Occupancy by Household Size in Iberia Parish
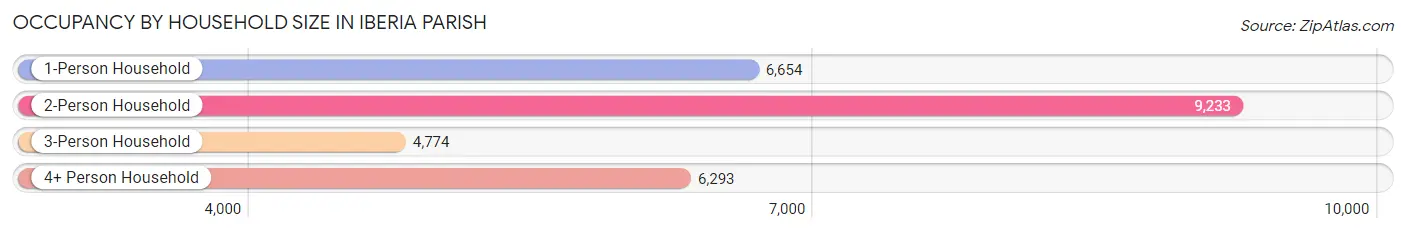
| Household Size | # Housing Units | % Housing Units |
| 1-Person Household | 6,654 | 24.7% |
| 2-Person Household | 9,233 | 34.3% |
| 3-Person Household | 4,774 | 17.7% |
| 4+ Person Household | 6,293 | 23.4% |
| Total Housing Units | 26,954 | 100.0% |
Occupancy by Ownership by Household Size in Iberia Parish
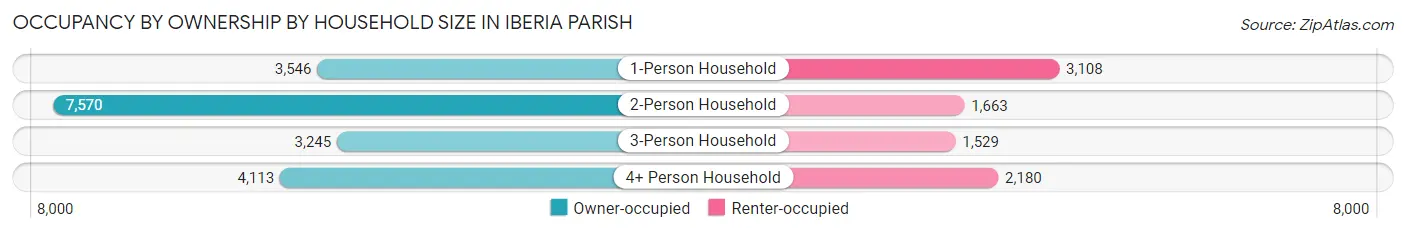
| Household Size | Owner-occupied | Renter-occupied |
| 1-Person Household | 3,546 (53.3%) | 3,108 (46.7%) |
| 2-Person Household | 7,570 (82.0%) | 1,663 (18.0%) |
| 3-Person Household | 3,245 (68.0%) | 1,529 (32.0%) |
| 4+ Person Household | 4,113 (65.4%) | 2,180 (34.6%) |
| Total Housing Units | 18,474 (68.5%) | 8,480 (31.5%) |
Occupancy by Educational Attainment in Iberia Parish
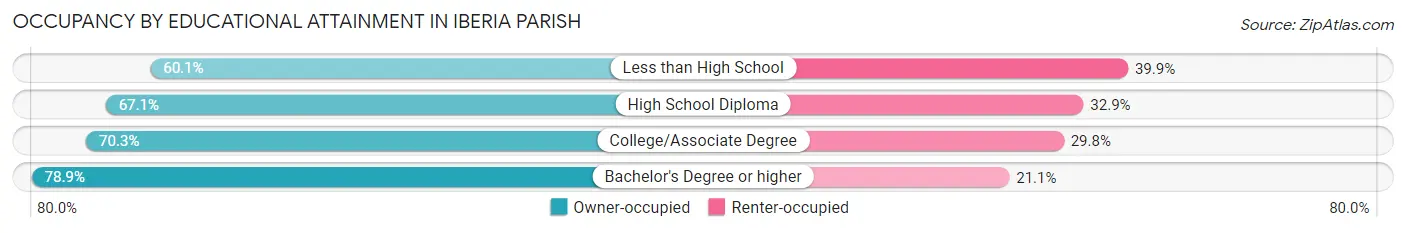
| Household Size | Owner-occupied | Renter-occupied |
| Less than High School | 2,629 (60.1%) | 1,748 (39.9%) |
| High School Diploma | 7,688 (67.1%) | 3,764 (32.9%) |
| College/Associate Degree | 5,035 (70.3%) | 2,132 (29.7%) |
| Bachelor's Degree or higher | 3,122 (78.9%) | 836 (21.1%) |
Occupancy by Age of Householder in Iberia Parish
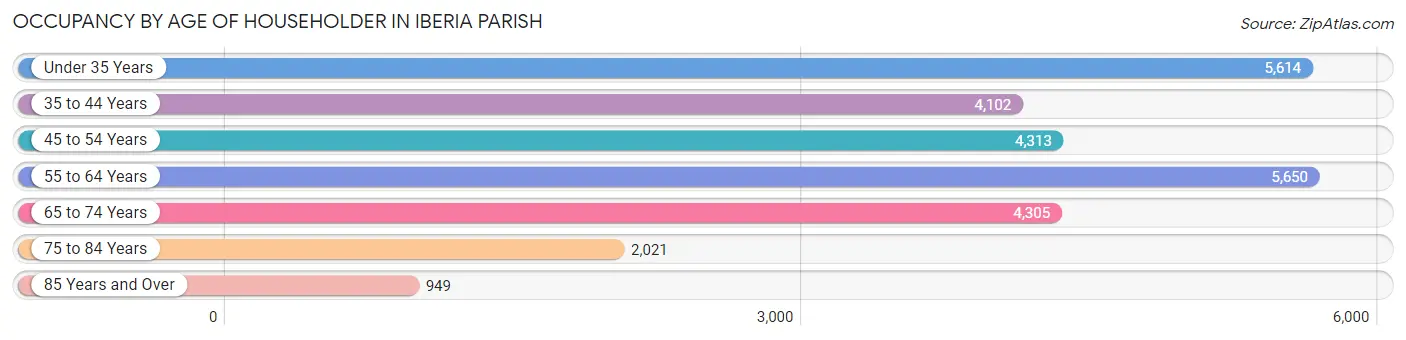
| Age Bracket | # Households | % Households |
| Under 35 Years | 5,614 | 20.8% |
| 35 to 44 Years | 4,102 | 15.2% |
| 45 to 54 Years | 4,313 | 16.0% |
| 55 to 64 Years | 5,650 | 21.0% |
| 65 to 74 Years | 4,305 | 16.0% |
| 75 to 84 Years | 2,021 | 7.5% |
| 85 Years and Over | 949 | 3.5% |
| Total | 26,954 | 100.0% |
Housing Finances in Iberia Parish
Median Income by Occupancy in Iberia Parish
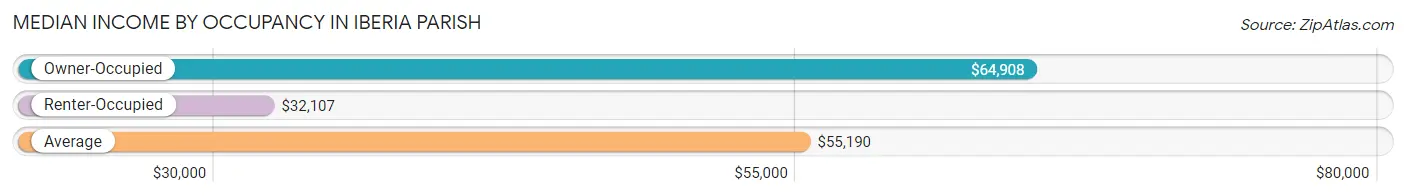
| Occupancy Type | # Households | Median Income |
| Owner-Occupied | 18,474 (68.5%) | $64,908 |
| Renter-Occupied | 8,480 (31.5%) | $32,107 |
| Average | 26,954 (100.0%) | $55,190 |
Occupancy by Householder Income Bracket in Iberia Parish
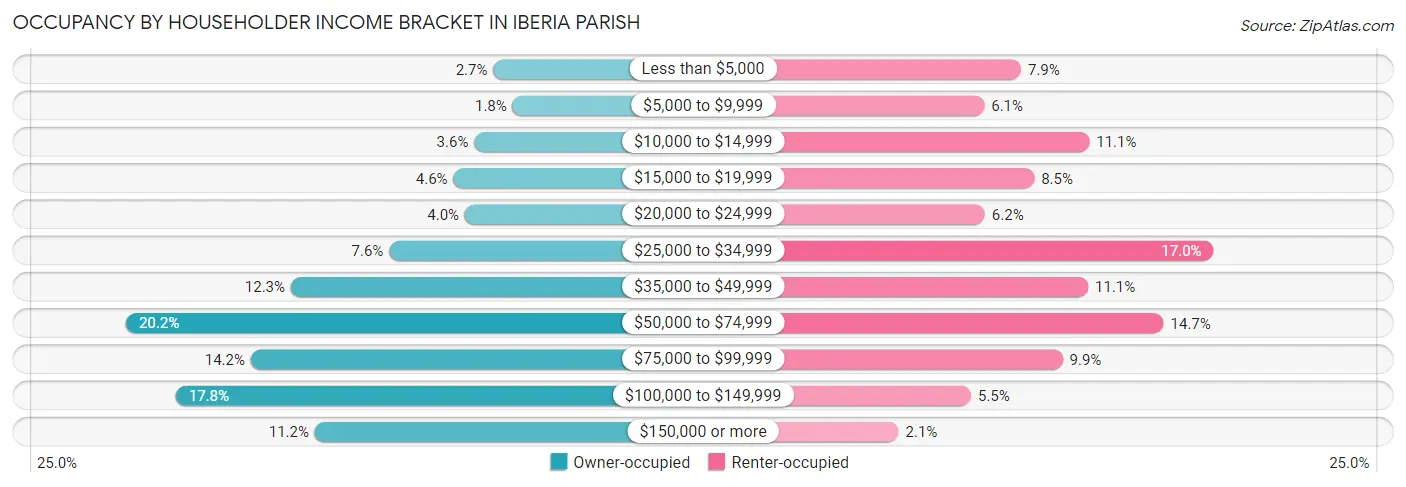
| Income Bracket | Owner-occupied | Renter-occupied |
| Less than $5,000 | 496 (2.7%) | 668 (7.9%) |
| $5,000 to $9,999 | 325 (1.8%) | 520 (6.1%) |
| $10,000 to $14,999 | 664 (3.6%) | 944 (11.1%) |
| $15,000 to $19,999 | 847 (4.6%) | 722 (8.5%) |
| $20,000 to $24,999 | 744 (4.0%) | 522 (6.2%) |
| $25,000 to $34,999 | 1,412 (7.6%) | 1,445 (17.0%) |
| $35,000 to $49,999 | 2,276 (12.3%) | 939 (11.1%) |
| $50,000 to $74,999 | 3,727 (20.2%) | 1,244 (14.7%) |
| $75,000 to $99,999 | 2,629 (14.2%) | 836 (9.9%) |
| $100,000 to $149,999 | 3,289 (17.8%) | 466 (5.5%) |
| $150,000 or more | 2,065 (11.2%) | 174 (2.1%) |
| Total | 18,474 (100.0%) | 8,480 (100.0%) |
Monthly Housing Cost Tiers in Iberia Parish
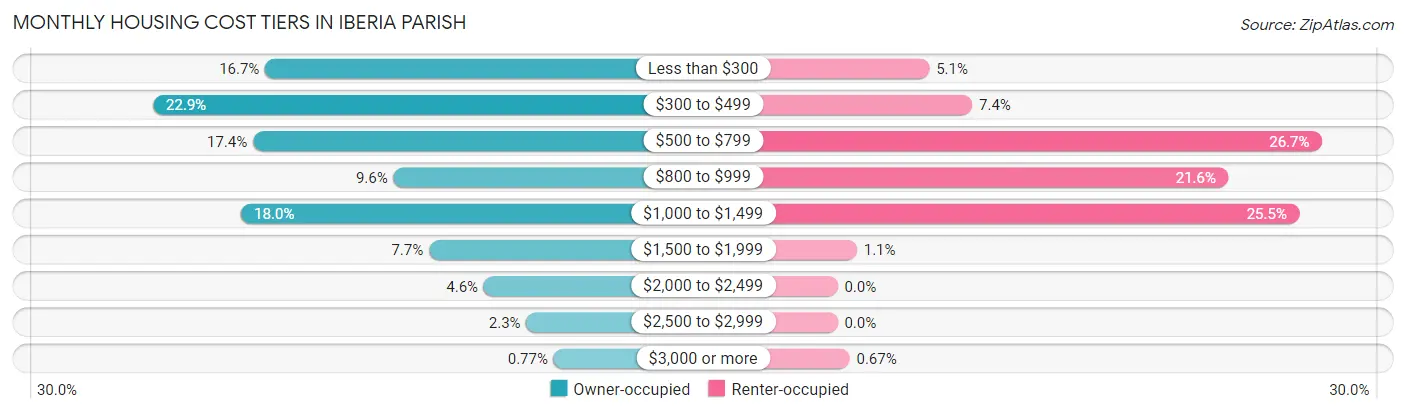
| Monthly Cost | Owner-occupied | Renter-occupied |
| Less than $300 | 3,087 (16.7%) | 430 (5.1%) |
| $300 to $499 | 4,232 (22.9%) | 631 (7.4%) |
| $500 to $799 | 3,210 (17.4%) | 2,267 (26.7%) |
| $800 to $999 | 1,778 (9.6%) | 1,828 (21.6%) |
| $1,000 to $1,499 | 3,332 (18.0%) | 2,161 (25.5%) |
| $1,500 to $1,999 | 1,415 (7.7%) | 91 (1.1%) |
| $2,000 to $2,499 | 856 (4.6%) | 0 (0.0%) |
| $2,500 to $2,999 | 422 (2.3%) | 0 (0.0%) |
| $3,000 or more | 142 (0.8%) | 57 (0.7%) |
| Total | 18,474 (100.0%) | 8,480 (100.0%) |
Physical Housing Characteristics in Iberia Parish
Housing Structures in Iberia Parish
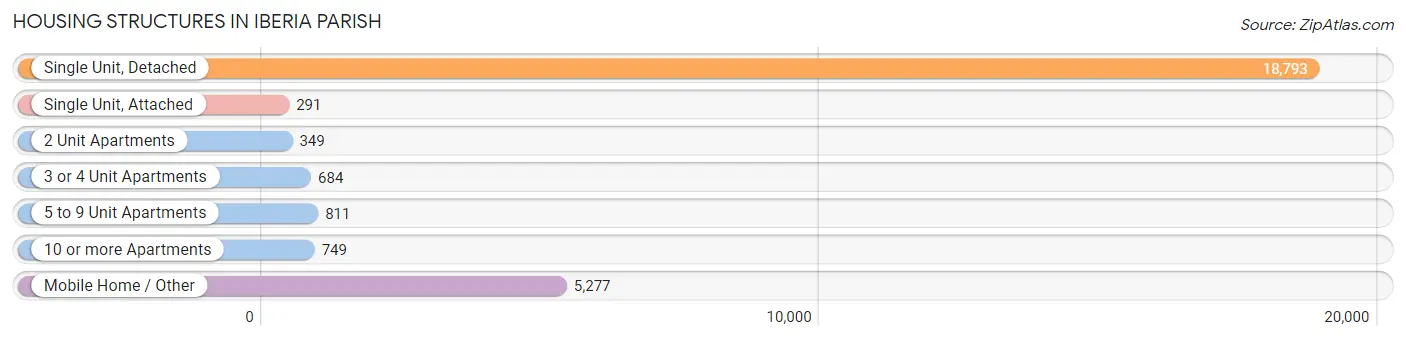
| Structure Type | # Housing Units | % Housing Units |
| Single Unit, Detached | 18,793 | 69.7% |
| Single Unit, Attached | 291 | 1.1% |
| 2 Unit Apartments | 349 | 1.3% |
| 3 or 4 Unit Apartments | 684 | 2.5% |
| 5 to 9 Unit Apartments | 811 | 3.0% |
| 10 or more Apartments | 749 | 2.8% |
| Mobile Home / Other | 5,277 | 19.6% |
| Total | 26,954 | 100.0% |
Housing Structures by Occupancy in Iberia Parish
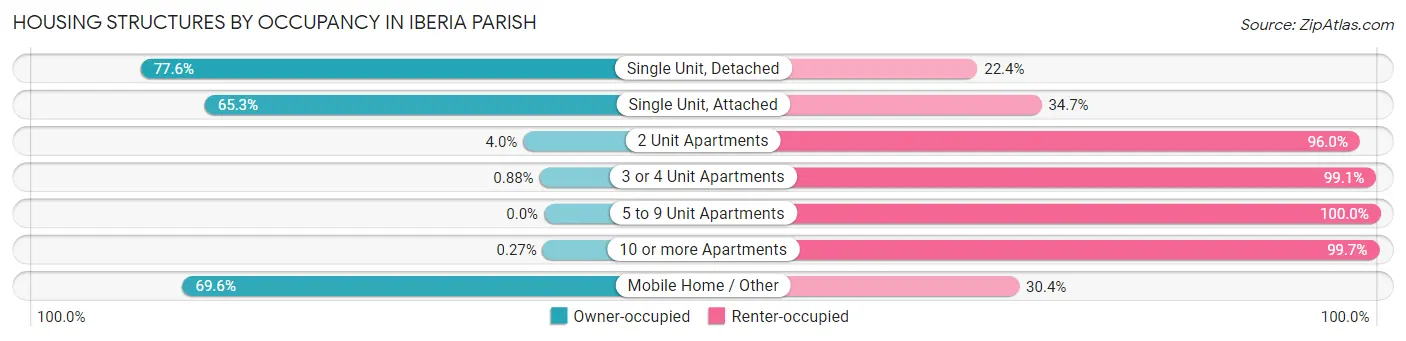
| Structure Type | Owner-occupied | Renter-occupied |
| Single Unit, Detached | 14,590 (77.6%) | 4,203 (22.4%) |
| Single Unit, Attached | 190 (65.3%) | 101 (34.7%) |
| 2 Unit Apartments | 14 (4.0%) | 335 (96.0%) |
| 3 or 4 Unit Apartments | 6 (0.9%) | 678 (99.1%) |
| 5 to 9 Unit Apartments | 0 (0.0%) | 811 (100.0%) |
| 10 or more Apartments | 2 (0.3%) | 747 (99.7%) |
| Mobile Home / Other | 3,672 (69.6%) | 1,605 (30.4%) |
| Total | 18,474 (68.5%) | 8,480 (31.5%) |
Housing Structures by Number of Rooms in Iberia Parish
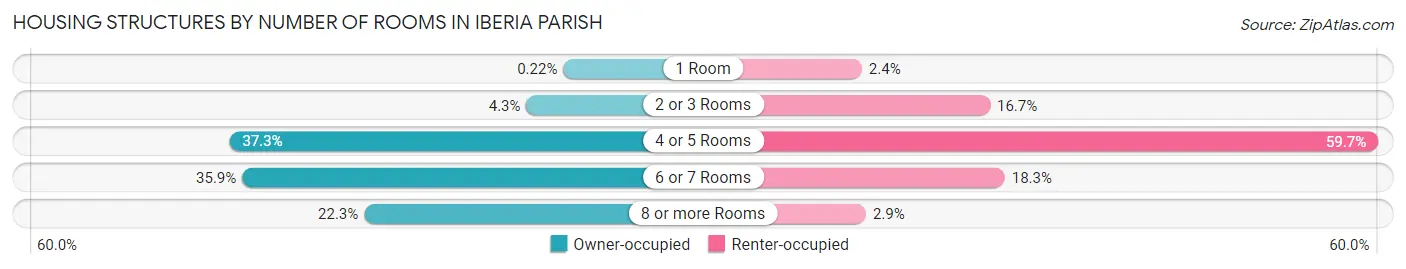
| Number of Rooms | Owner-occupied | Renter-occupied |
| 1 Room | 40 (0.2%) | 207 (2.4%) |
| 2 or 3 Rooms | 797 (4.3%) | 1,413 (16.7%) |
| 4 or 5 Rooms | 6,888 (37.3%) | 5,063 (59.7%) |
| 6 or 7 Rooms | 6,625 (35.9%) | 1,552 (18.3%) |
| 8 or more Rooms | 4,124 (22.3%) | 245 (2.9%) |
| Total | 18,474 (100.0%) | 8,480 (100.0%) |
Housing Structure by Heating Type in Iberia Parish

| Heating Type | Owner-occupied | Renter-occupied |
| Utility Gas | 6,571 (35.6%) | 1,906 (22.5%) |
| Bottled, Tank, or LP Gas | 204 (1.1%) | 131 (1.5%) |
| Electricity | 11,560 (62.6%) | 6,367 (75.1%) |
| Fuel Oil or Kerosene | 10 (0.1%) | 0 (0.0%) |
| Coal or Coke | 0 (0.0%) | 0 (0.0%) |
| All other Fuels | 11 (0.1%) | 46 (0.5%) |
| No Fuel Used | 118 (0.6%) | 30 (0.4%) |
| Total | 18,474 (100.0%) | 8,480 (100.0%) |
Household Vehicle Usage in Iberia Parish
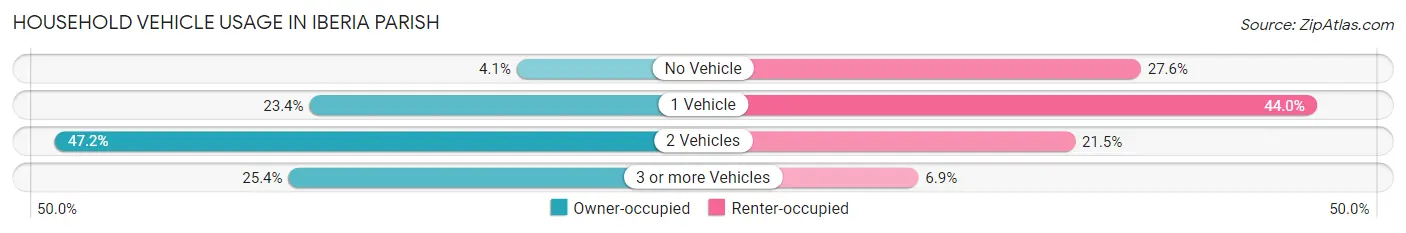
| Vehicles per Household | Owner-occupied | Renter-occupied |
| No Vehicle | 750 (4.1%) | 2,342 (27.6%) |
| 1 Vehicle | 4,326 (23.4%) | 3,734 (44.0%) |
| 2 Vehicles | 8,710 (47.1%) | 1,822 (21.5%) |
| 3 or more Vehicles | 4,688 (25.4%) | 582 (6.9%) |
| Total | 18,474 (100.0%) | 8,480 (100.0%) |
Real Estate & Mortgages in Iberia Parish
Real Estate and Mortgage Overview in Iberia Parish
| Characteristic | Without Mortgage | With Mortgage |
| Housing Units | 10,018 | 8,456 |
| Median Property Value | $113,700 | $177,400 |
| Median Household Income | $49,600 | $1,383 |
| Monthly Housing Costs | $384 | $140 |
| Real Estate Taxes | $410 | $1,479 |
Property Value by Mortgage Status in Iberia Parish
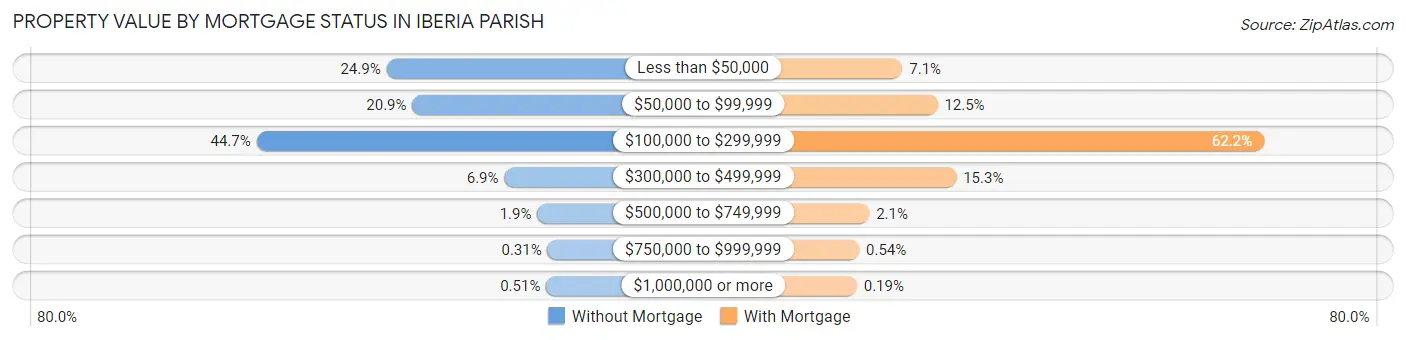
| Property Value | Without Mortgage | With Mortgage |
| Less than $50,000 | 2,490 (24.9%) | 603 (7.1%) |
| $50,000 to $99,999 | 2,095 (20.9%) | 1,055 (12.5%) |
| $100,000 to $299,999 | 4,473 (44.7%) | 5,263 (62.2%) |
| $300,000 to $499,999 | 690 (6.9%) | 1,297 (15.3%) |
| $500,000 to $749,999 | 188 (1.9%) | 176 (2.1%) |
| $750,000 to $999,999 | 31 (0.3%) | 46 (0.5%) |
| $1,000,000 or more | 51 (0.5%) | 16 (0.2%) |
| Total | 10,018 (100.0%) | 8,456 (100.0%) |
Household Income by Mortgage Status in Iberia Parish
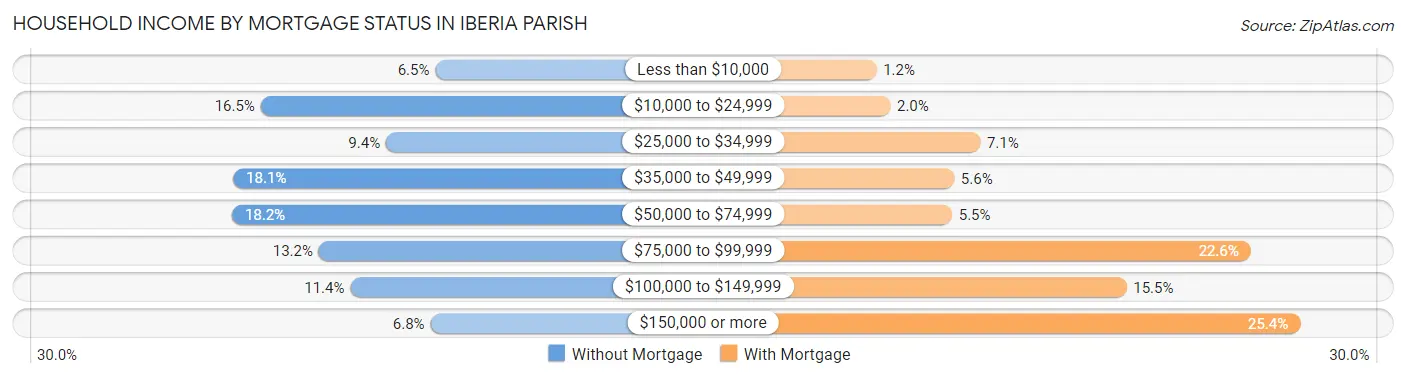
| Household Income | Without Mortgage | With Mortgage |
| Less than $10,000 | 654 (6.5%) | 100 (1.2%) |
| $10,000 to $24,999 | 1,654 (16.5%) | 167 (2.0%) |
| $25,000 to $34,999 | 937 (9.3%) | 601 (7.1%) |
| $35,000 to $49,999 | 1,811 (18.1%) | 475 (5.6%) |
| $50,000 to $74,999 | 1,818 (18.1%) | 465 (5.5%) |
| $75,000 to $99,999 | 1,321 (13.2%) | 1,909 (22.6%) |
| $100,000 to $149,999 | 1,141 (11.4%) | 1,308 (15.5%) |
| $150,000 or more | 682 (6.8%) | 2,148 (25.4%) |
| Total | 10,018 (100.0%) | 8,456 (100.0%) |
Property Value to Household Income Ratio in Iberia Parish
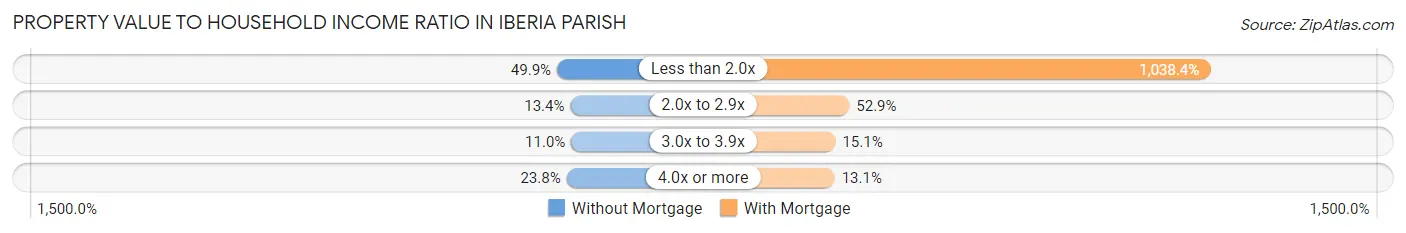
| Value-to-Income Ratio | Without Mortgage | With Mortgage |
| Less than 2.0x | 5,001 (49.9%) | 87,804 (1,038.4%) |
| 2.0x to 2.9x | 1,344 (13.4%) | 4,477 (52.9%) |
| 3.0x to 3.9x | 1,104 (11.0%) | 1,279 (15.1%) |
| 4.0x or more | 2,385 (23.8%) | 1,104 (13.1%) |
| Total | 10,018 (100.0%) | 8,456 (100.0%) |
Real Estate Taxes by Mortgage Status in Iberia Parish
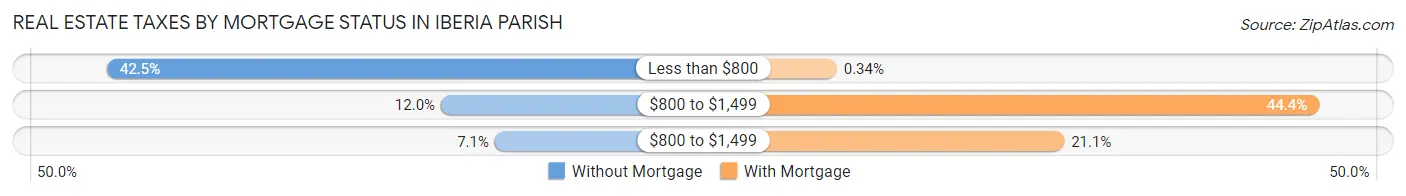
| Property Taxes | Without Mortgage | With Mortgage |
| Less than $800 | 4,257 (42.5%) | 29 (0.3%) |
| $800 to $1,499 | 1,200 (12.0%) | 3,753 (44.4%) |
| $800 to $1,499 | 707 (7.1%) | 1,785 (21.1%) |
| Total | 10,018 (100.0%) | 8,456 (100.0%) |
Health & Disability in Iberia Parish
Health Insurance Coverage by Age in Iberia Parish
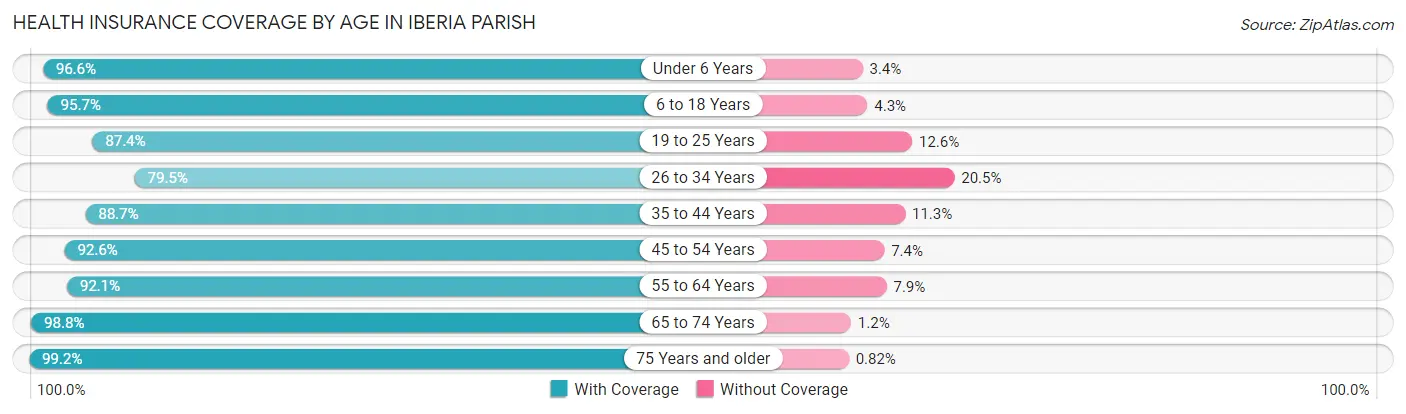
| Age Bracket | With Coverage | Without Coverage |
| Under 6 Years | 5,605 (96.6%) | 197 (3.4%) |
| 6 to 18 Years | 12,339 (95.7%) | 554 (4.3%) |
| 19 to 25 Years | 5,317 (87.4%) | 769 (12.6%) |
| 26 to 34 Years | 6,279 (79.5%) | 1,621 (20.5%) |
| 35 to 44 Years | 7,278 (88.7%) | 929 (11.3%) |
| 45 to 54 Years | 7,452 (92.6%) | 599 (7.4%) |
| 55 to 64 Years | 8,821 (92.1%) | 755 (7.9%) |
| 65 to 74 Years | 6,575 (98.8%) | 82 (1.2%) |
| 75 Years and older | 4,013 (99.2%) | 33 (0.8%) |
| Total | 63,679 (92.0%) | 5,539 (8.0%) |
Health Insurance Coverage by Citizenship Status in Iberia Parish
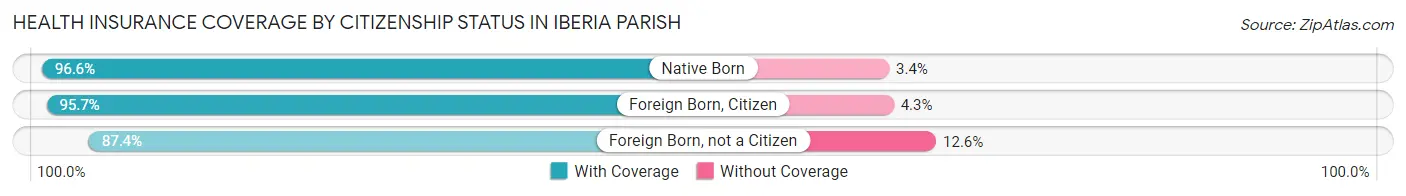
| Citizenship Status | With Coverage | Without Coverage |
| Native Born | 5,605 (96.6%) | 197 (3.4%) |
| Foreign Born, Citizen | 12,339 (95.7%) | 554 (4.3%) |
| Foreign Born, not a Citizen | 5,317 (87.4%) | 769 (12.6%) |
Health Insurance Coverage by Household Income in Iberia Parish
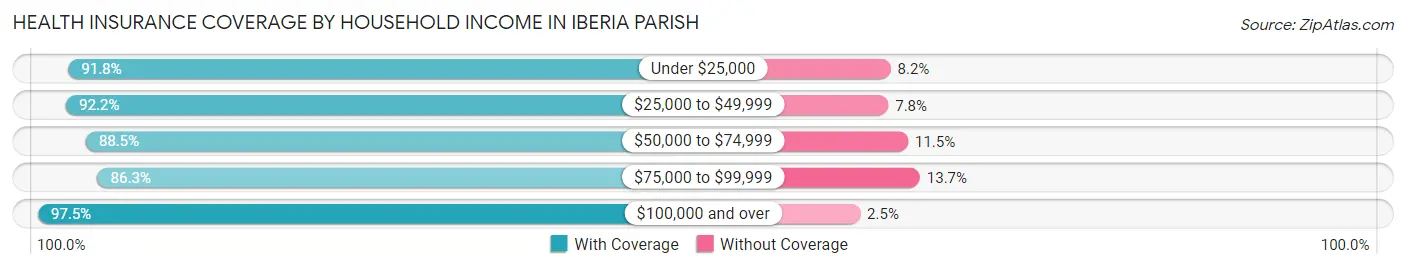
| Household Income | With Coverage | Without Coverage |
| Under $25,000 | 12,628 (91.8%) | 1,129 (8.2%) |
| $25,000 to $49,999 | 12,413 (92.2%) | 1,046 (7.8%) |
| $50,000 to $74,999 | 11,876 (88.5%) | 1,539 (11.5%) |
| $75,000 to $99,999 | 8,573 (86.3%) | 1,360 (13.7%) |
| $100,000 and over | 18,108 (97.5%) | 464 (2.5%) |
Public vs Private Health Insurance Coverage by Age in Iberia Parish
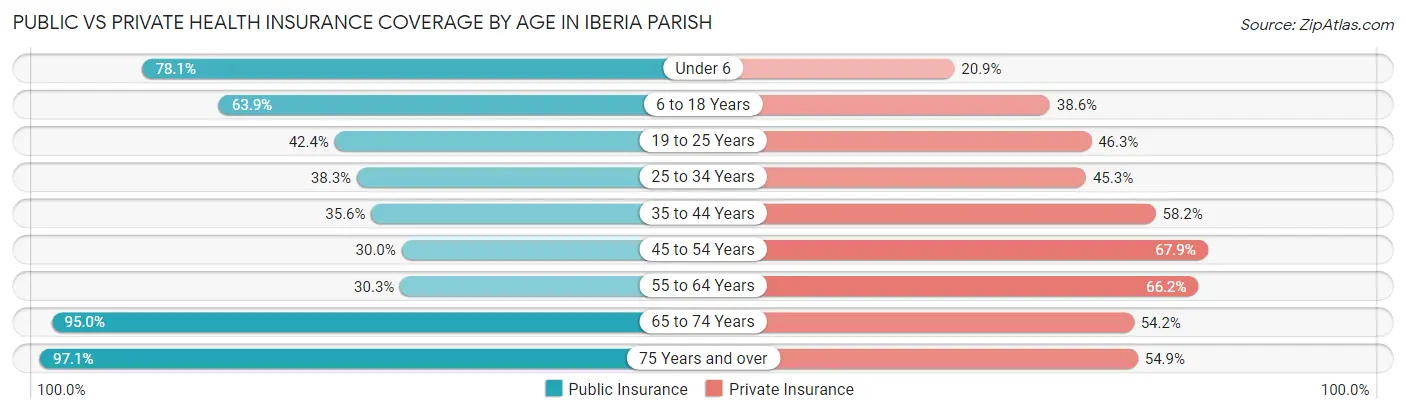
| Age Bracket | Public Insurance | Private Insurance |
| Under 6 | 4,532 (78.1%) | 1,212 (20.9%) |
| 6 to 18 Years | 8,243 (63.9%) | 4,981 (38.6%) |
| 19 to 25 Years | 2,583 (42.4%) | 2,817 (46.3%) |
| 25 to 34 Years | 3,027 (38.3%) | 3,580 (45.3%) |
| 35 to 44 Years | 2,925 (35.6%) | 4,779 (58.2%) |
| 45 to 54 Years | 2,417 (30.0%) | 5,465 (67.9%) |
| 55 to 64 Years | 2,901 (30.3%) | 6,337 (66.2%) |
| 65 to 74 Years | 6,323 (95.0%) | 3,607 (54.2%) |
| 75 Years and over | 3,930 (97.1%) | 2,223 (54.9%) |
| Total | 36,881 (53.3%) | 35,001 (50.6%) |
Disability Status by Sex by Age in Iberia Parish
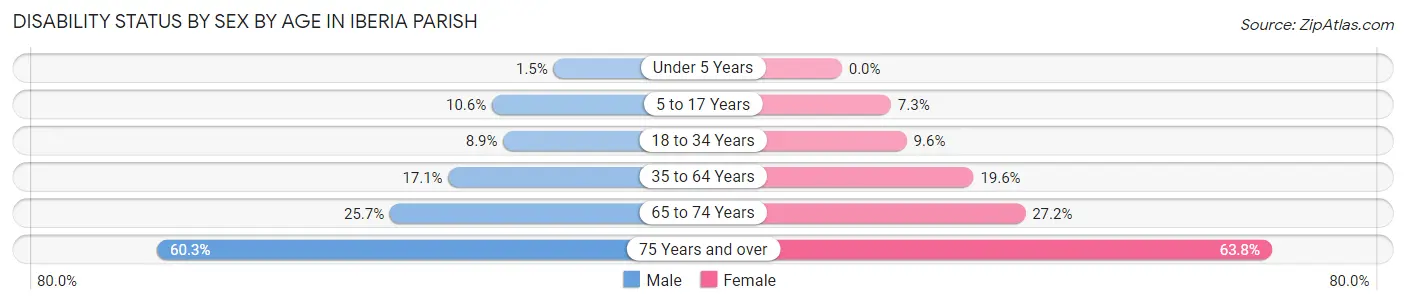
| Age Bracket | Male | Female |
| Under 5 Years | 36 (1.5%) | 0 (0.0%) |
| 5 to 17 Years | 702 (10.6%) | 465 (7.3%) |
| 18 to 34 Years | 659 (8.9%) | 725 (9.6%) |
| 35 to 64 Years | 2,159 (17.1%) | 2,576 (19.6%) |
| 65 to 74 Years | 810 (25.7%) | 956 (27.2%) |
| 75 Years and over | 1,026 (60.3%) | 1,497 (63.8%) |
Disability Class by Sex by Age in Iberia Parish
Disability Class: Hearing Difficulty
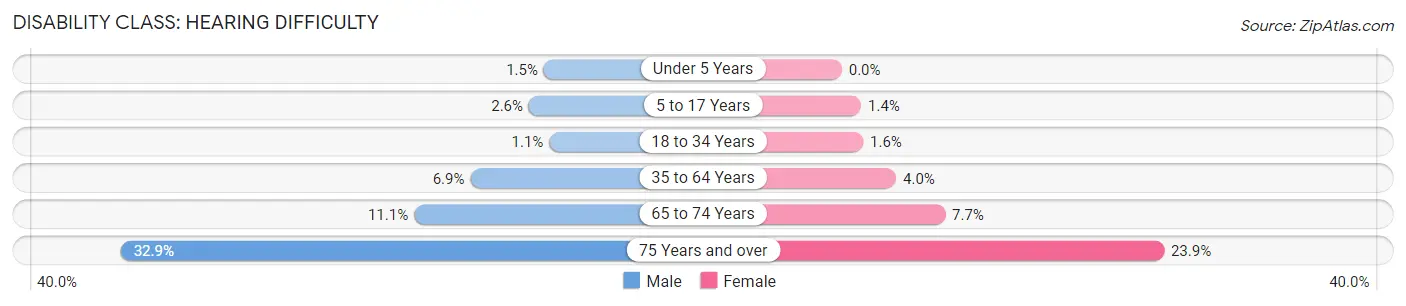
| Age Bracket | Male | Female |
| Under 5 Years | 36 (1.5%) | 0 (0.0%) |
| 5 to 17 Years | 170 (2.6%) | 91 (1.4%) |
| 18 to 34 Years | 78 (1.1%) | 119 (1.6%) |
| 35 to 64 Years | 875 (6.9%) | 531 (4.0%) |
| 65 to 74 Years | 349 (11.1%) | 269 (7.7%) |
| 75 Years and over | 559 (32.9%) | 561 (23.9%) |
Disability Class: Vision Difficulty
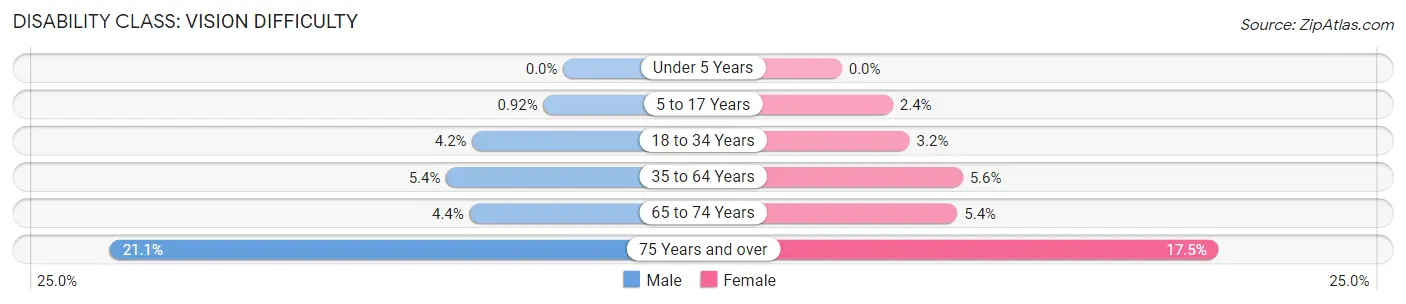
| Age Bracket | Male | Female |
| Under 5 Years | 0 (0.0%) | 0 (0.0%) |
| 5 to 17 Years | 61 (0.9%) | 151 (2.4%) |
| 18 to 34 Years | 312 (4.2%) | 237 (3.2%) |
| 35 to 64 Years | 688 (5.4%) | 739 (5.6%) |
| 65 to 74 Years | 137 (4.3%) | 188 (5.4%) |
| 75 Years and over | 358 (21.0%) | 410 (17.5%) |
Disability Class: Cognitive Difficulty
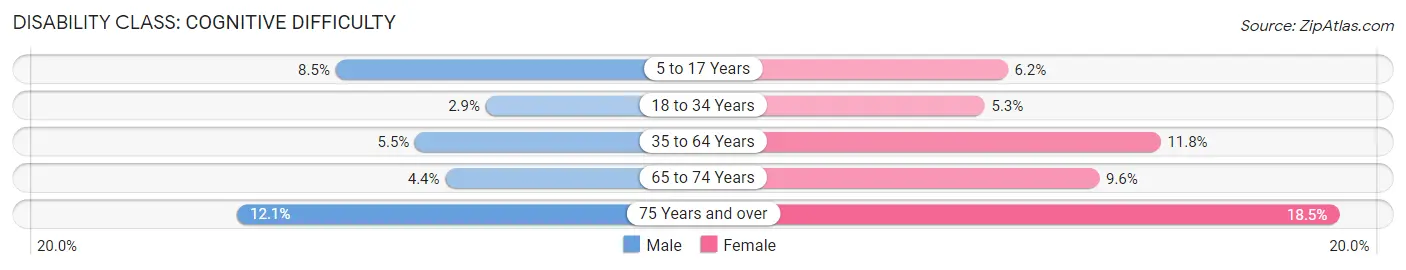
| Age Bracket | Male | Female |
| 5 to 17 Years | 560 (8.5%) | 392 (6.1%) |
| 18 to 34 Years | 213 (2.9%) | 399 (5.3%) |
| 35 to 64 Years | 696 (5.5%) | 1,558 (11.8%) |
| 65 to 74 Years | 138 (4.4%) | 335 (9.6%) |
| 75 Years and over | 206 (12.1%) | 433 (18.5%) |
Disability Class: Ambulatory Difficulty
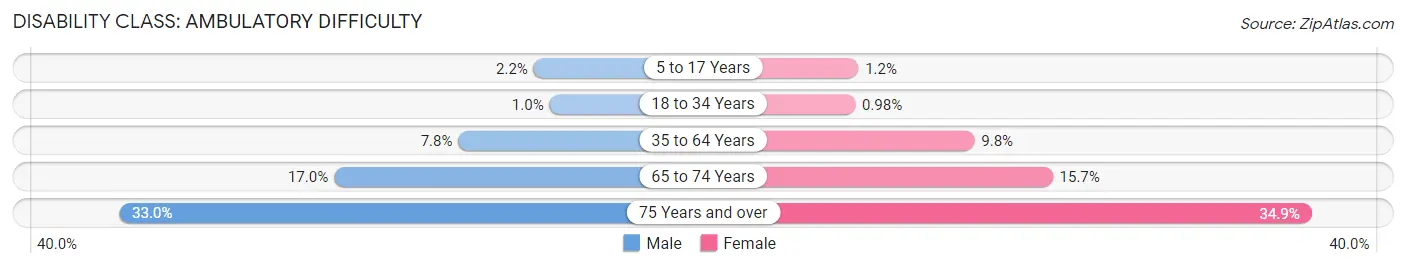
| Age Bracket | Male | Female |
| 5 to 17 Years | 146 (2.2%) | 78 (1.2%) |
| 18 to 34 Years | 76 (1.0%) | 74 (1.0%) |
| 35 to 64 Years | 987 (7.8%) | 1,296 (9.8%) |
| 65 to 74 Years | 536 (17.0%) | 549 (15.7%) |
| 75 Years and over | 561 (33.0%) | 818 (34.9%) |
Disability Class: Self-Care Difficulty
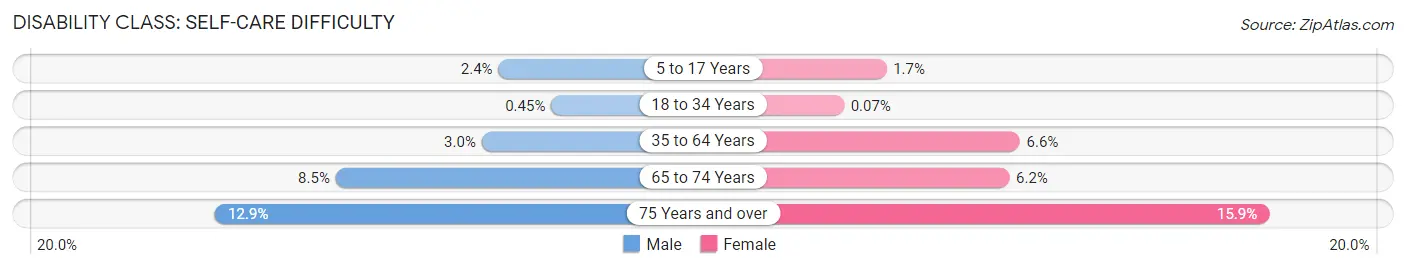
| Age Bracket | Male | Female |
| 5 to 17 Years | 160 (2.4%) | 105 (1.7%) |
| 18 to 34 Years | 33 (0.4%) | 5 (0.1%) |
| 35 to 64 Years | 383 (3.0%) | 869 (6.6%) |
| 65 to 74 Years | 266 (8.5%) | 218 (6.2%) |
| 75 Years and over | 220 (12.9%) | 372 (15.9%) |
Technology Access in Iberia Parish
Computing Device Access in Iberia Parish
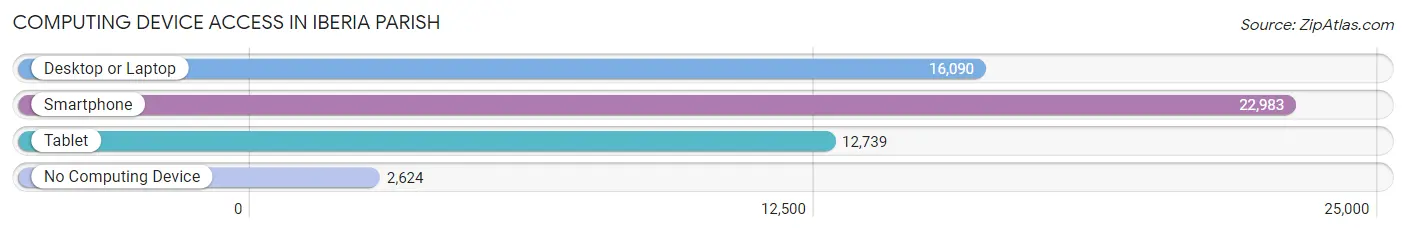
| Device Type | # Households | % Households |
| Desktop or Laptop | 16,090 | 59.7% |
| Smartphone | 22,983 | 85.3% |
| Tablet | 12,739 | 47.3% |
| No Computing Device | 2,624 | 9.7% |
| Total | 26,954 | 100.0% |
Internet Access in Iberia Parish
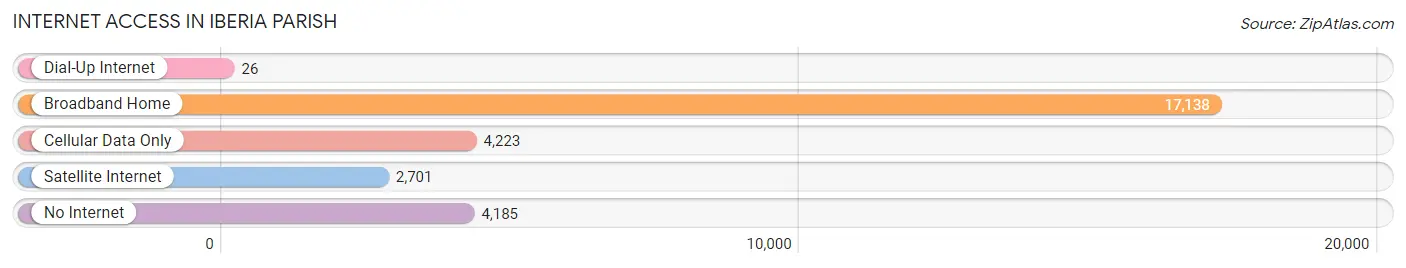
| Internet Type | # Households | % Households |
| Dial-Up Internet | 26 | 0.1% |
| Broadband Home | 17,138 | 63.6% |
| Cellular Data Only | 4,223 | 15.7% |
| Satellite Internet | 2,701 | 10.0% |
| No Internet | 4,185 | 15.5% |
| Total | 26,954 | 100.0% |
Iberia Parish Summary
Iberia Parish is located in the south-central region of Louisiana, and is part of the Acadiana region. It is bordered by St. Martin Parish to the north, St. Mary Parish to the east, Vermilion Parish to the south, and Lafayette Parish to the west. The parish seat is New Iberia, and the parish has a total area of 690 square miles.
History
Iberia Parish was established in 1868, and is named after the Iberian Peninsula in Europe. The area was originally inhabited by the Chitimacha Native American tribe, and was later settled by French and Spanish colonists. The parish was part of the Attakapas District, which was established in 1764. The district was later divided into St. Martin and St. Mary parishes in 1811.
In the early 19th century, the area was settled by German and Irish immigrants, and the parish was officially established in 1868. The parish was originally part of St. Martin Parish, but was split off due to its large population.
Geography
Iberia Parish is located in the south-central region of Louisiana, and is part of the Acadiana region. It is bordered by St. Martin Parish to the north, St. Mary Parish to the east, Vermilion Parish to the south, and Lafayette Parish to the west. The parish seat is New Iberia, and the parish has a total area of 690 square miles.
The terrain of Iberia Parish is mostly flat, with some rolling hills in the northern part of the parish. The parish is located in the coastal plain region of Louisiana, and is home to several bayous, including Bayou Teche, Bayou Petite Anse, and Bayou Carlin. The parish is also home to several lakes, including Lake Peigneur, Lake Fausse Pointe, and Lake End.
Economy
Iberia Parish has a diverse economy, with a mix of agriculture, manufacturing, and service industries. The largest employers in the parish are the Iberia Medical Center, Iberia Parish School Board, and Iberia Parish Government.
Agriculture is an important part of the economy, with sugarcane, rice, and soybeans being the main crops. The parish is also home to several seafood processing plants, and is a major producer of crawfish.
Manufacturing is also an important part of the economy, with several large companies located in the parish. These include the Iberia Industrial Park, which is home to several manufacturing companies, and the Iberia Industrial Complex, which is home to several oil and gas companies.
Demographics
As of the 2010 census, Iberia Parish had a population of 73,240. The population is made up of a mix of races, with the largest group being White (63.3%), followed by African American (30.2%), Hispanic (3.7%), and Asian (1.7%). The median household income in the parish is $41,945, and the median age is 37.
The parish is home to several large cities, including New Iberia (population 30,617), Jeanerette (population 6,945), and Delcambre (population 2,231). The parish is also home to several small towns, including Loreauville (population 1,093), Lydia (population 890), and Avery Island (population 745).
Common Questions
What is the Total Population of Iberia Parish?
Total Population of Iberia Parish is 69,958.
What is the Total Male Population of Iberia Parish?
Total Male Population of Iberia Parish is 34,540.
What is the Total Female Population of Iberia Parish?
Total Female Population of Iberia Parish is 35,418.
What is the Ratio of Males per 100 Females in Iberia Parish?
There are 97.52 Males per 100 Females in Iberia Parish.
What is the Ratio of Females per 100 Males in Iberia Parish?
There are 102.54 Females per 100 Males in Iberia Parish.
What is the Median Population Age in Iberia Parish?
Median Population Age in Iberia Parish is 37.4 Years.
What is the Average Family Size in Iberia Parish
Average Family Size in Iberia Parish is 3.0 People.
What is the Average Household Size in Iberia Parish
Average Household Size in Iberia Parish is 2.6 People.
What is Per Capita Income in Iberia Parish?
Per Capita income in Iberia Parish is $28,315.
What is the Median Family Income in Iberia Parish?
Median Family Income in Iberia Parish is $63,180.
What is the Median Household income in Iberia Parish?
Median Household Income in Iberia Parish is $55,190.
What is Income or Wage Gap in Iberia Parish?
Income or Wage Gap in Iberia Parish is 46.3%.
Women in Iberia Parish earn 53.7 cents for every dollar earned by a man.
What is Family Income Deficit in Iberia Parish?
Family Income Deficit in Iberia Parish is $13,255.
Families that are below poverty line in Iberia Parish earn $13,255 less on average than the poverty threshold level.
What is Inequality or Gini Index in Iberia Parish?
Inequality or Gini Index in Iberia Parish is 0.47.
How Large is the Labor Force in Iberia Parish?
There are 31,326 People in the Labor Forcein in Iberia Parish.
What is the Percentage of People in the Labor Force in Iberia Parish?
58.0% of People are in the Labor Force in Iberia Parish.
What is the Unemployment Rate in Iberia Parish?
Unemployment Rate in Iberia Parish is 6.3%.