Grant Parish, LA
Grant Parish Map
Grant Parish Overview
22,185
TOTAL POPULATION
12,556
MALE POPULATION
9,629
FEMALE POPULATION
130.40
MALES / 100 FEMALES
76.69
FEMALES / 100 MALES
37.9
MEDIAN AGE
3.5
AVG FAMILY SIZE
2.9
AVG HOUSEHOLD SIZE
$25,077
PER CAPITA INCOME
$65,681
AVG FAMILY INCOME
$57,362
AVG HOUSEHOLD INCOME
31.2%
WAGE / INCOME GAP [ % ]
68.8¢/ $1
WAGE / INCOME GAP [ $ ]
0.43
INEQUALITY / GINI INDEX
8,150
LABOR FORCE [ PEOPLE ]
44.9%
PERCENT IN LABOR FORCE
4.0%
UNEMPLOYMENT RATE
Grant Parish Area Codes
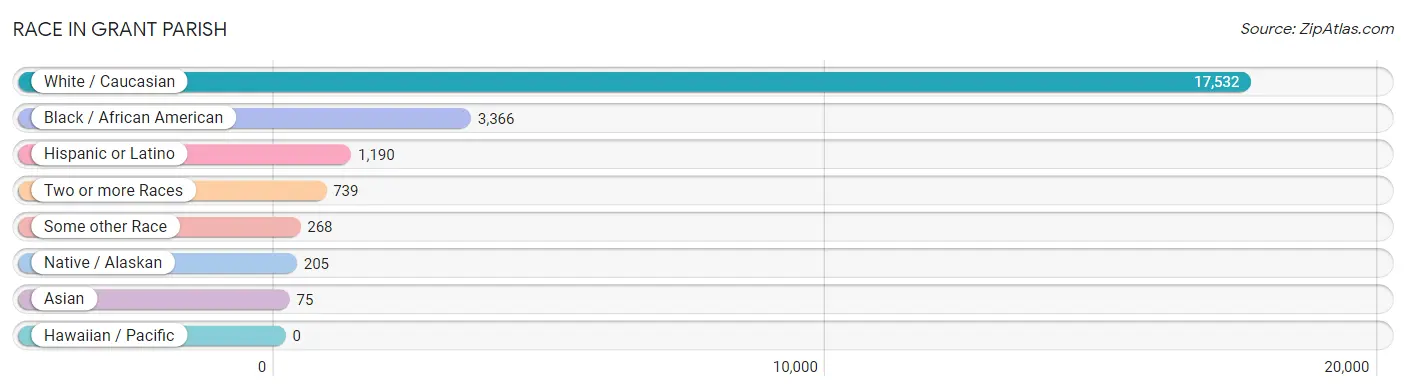
Race in Grant Parish
The most populous races in Grant Parish are White / Caucasian (17,532 | 79.0%), Black / African American (3,366 | 15.2%), and Hispanic or Latino (1,190 | 5.4%).
| Race | # Population | % Population |
| Asian | 75 | 0.3% |
| Black / African American | 3,366 | 15.2% |
| Hawaiian / Pacific | 0 | 0.0% |
| Hispanic or Latino | 1,190 | 5.4% |
| Native / Alaskan | 205 | 0.9% |
| White / Caucasian | 17,532 | 79.0% |
| Two or more Races | 739 | 3.3% |
| Some other Race | 268 | 1.2% |
| Total | 22,185 | 100.0% |
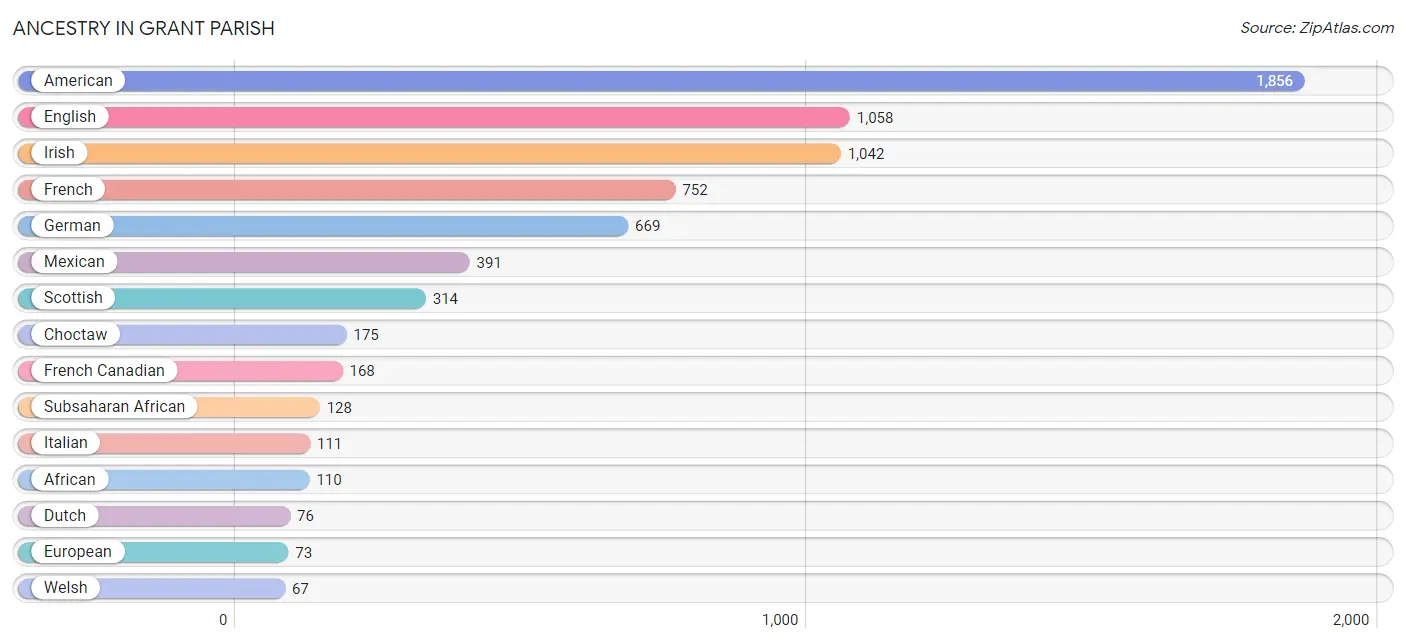
Ancestry in Grant Parish
The most populous ancestries reported in Grant Parish are American (1,856 | 8.4%), English (1,058 | 4.8%), Irish (1,042 | 4.7%), French (752 | 3.4%), and German (669 | 3.0%), together accounting for 24.2% of all Grant Parish residents.
| Ancestry | # Population | % Population |
| African | 110 | 0.5% |
| American | 1,856 | 8.4% |
| Arab | 10 | 0.1% |
| Bangladeshi | 1 | 0.0% |
| Belgian | 16 | 0.1% |
| Bhutanese | 12 | 0.1% |
| Blackfeet | 26 | 0.1% |
| British | 27 | 0.1% |
| Burmese | 1 | 0.0% |
| Cajun | 50 | 0.2% |
| Canadian | 9 | 0.0% |
| Central American | 51 | 0.2% |
| Cherokee | 12 | 0.1% |
| Choctaw | 175 | 0.8% |
| Cuban | 12 | 0.1% |
| Czech | 16 | 0.1% |
| Czechoslovakian | 8 | 0.0% |
| Dutch | 76 | 0.3% |
| Eastern European | 9 | 0.0% |
| Egyptian | 9 | 0.0% |
| English | 1,058 | 4.8% |
| European | 73 | 0.3% |
| Finnish | 28 | 0.1% |
| French | 752 | 3.4% |
| French American Indian | 1 | 0.0% |
| French Canadian | 168 | 0.8% |
| German | 669 | 3.0% |
| Guatemalan | 23 | 0.1% |
| Haitian | 9 | 0.0% |
| Indian (Asian) | 37 | 0.2% |
| Irish | 1,042 | 4.7% |
| Iroquois | 12 | 0.1% |
| Italian | 111 | 0.5% |
| Jamaican | 17 | 0.1% |
| Korean | 60 | 0.3% |
| Mexican | 391 | 1.8% |
| Nicaraguan | 20 | 0.1% |
| Nigerian | 15 | 0.1% |
| Northern European | 19 | 0.1% |
| Polish | 20 | 0.1% |
| Portuguese | 10 | 0.1% |
| Puerto Rican | 44 | 0.2% |
| Russian | 5 | 0.0% |
| Salvadoran | 8 | 0.0% |
| Scandinavian | 7 | 0.0% |
| Scotch-Irish | 59 | 0.3% |
| Scottish | 314 | 1.4% |
| South African | 3 | 0.0% |
| Spaniard | 2 | 0.0% |
| Spanish | 8 | 0.0% |
| Sri Lankan | 14 | 0.1% |
| Subsaharan African | 128 | 0.6% |
| Swedish | 32 | 0.1% |
| Turkish | 4 | 0.0% |
| Welsh | 67 | 0.3% |
| West Indian | 8 | 0.0% | View All 56 Rows |
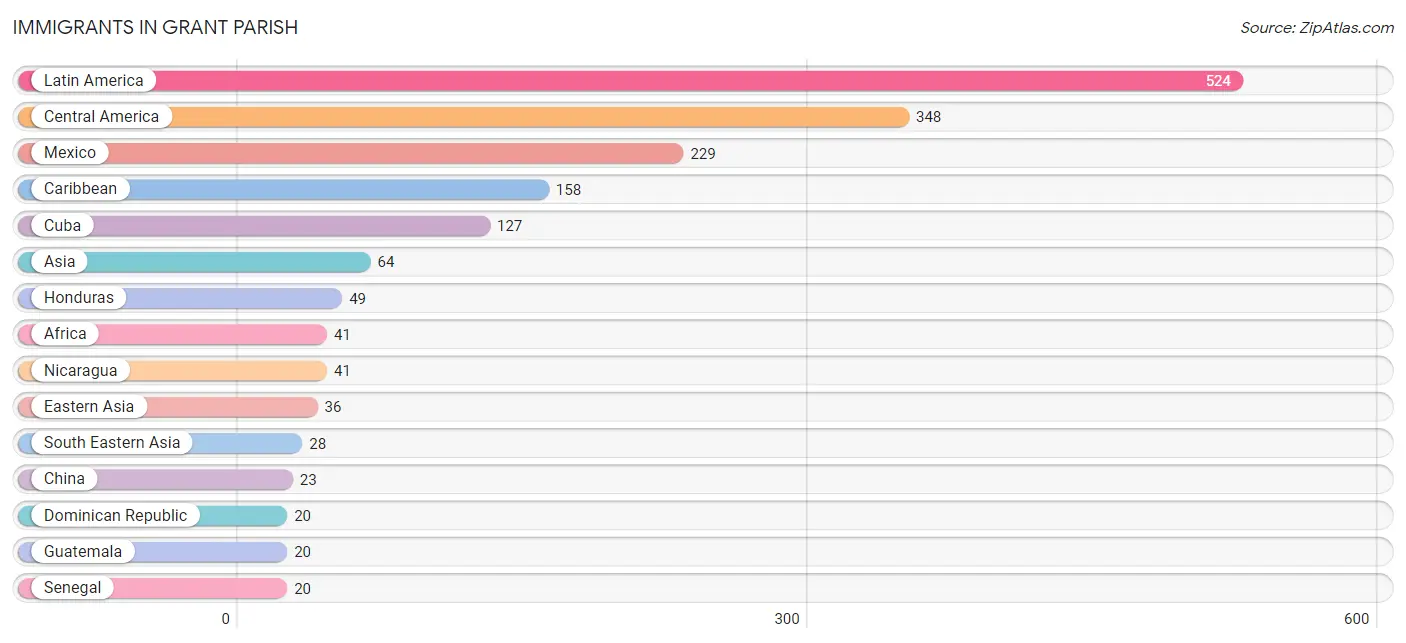
Immigrants in Grant Parish
The most numerous immigrant groups reported in Grant Parish came from Latin America (524 | 2.4%), Central America (348 | 1.6%), Mexico (229 | 1.0%), Caribbean (158 | 0.7%), and Cuba (127 | 0.6%), together accounting for 6.2% of all Grant Parish residents.
| Immigration Origin | # Population | % Population |
| Africa | 41 | 0.2% |
| Asia | 64 | 0.3% |
| Australia | 8 | 0.0% |
| Cameroon | 9 | 0.0% |
| Canada | 9 | 0.0% |
| Caribbean | 158 | 0.7% |
| Central America | 348 | 1.6% |
| China | 23 | 0.1% |
| Colombia | 9 | 0.0% |
| Cuba | 127 | 0.6% |
| Dominican Republic | 20 | 0.1% |
| Eastern Africa | 9 | 0.0% |
| Eastern Asia | 36 | 0.2% |
| El Salvador | 9 | 0.0% |
| Europe | 4 | 0.0% |
| Germany | 4 | 0.0% |
| Guatemala | 20 | 0.1% |
| Honduras | 49 | 0.2% |
| Jamaica | 9 | 0.0% |
| Korea | 13 | 0.1% |
| Latin America | 524 | 2.4% |
| Mexico | 229 | 1.0% |
| Middle Africa | 9 | 0.0% |
| Nicaragua | 41 | 0.2% |
| Oceania | 8 | 0.0% |
| Philippines | 10 | 0.1% |
| Senegal | 20 | 0.1% |
| South Africa | 3 | 0.0% |
| South America | 18 | 0.1% |
| South Eastern Asia | 28 | 0.1% |
| Venezuela | 9 | 0.0% |
| Vietnam | 18 | 0.1% |
| Western Africa | 20 | 0.1% |
| Western Europe | 4 | 0.0% |
| Zimbabwe | 9 | 0.0% | View All 35 Rows |
Sex and Age in Grant Parish
Sex and Age in Grant Parish
The most populous age groups in Grant Parish are 30 to 34 Years (1,257 | 10.0%) for men and 10 to 14 Years (768 | 8.0%) for women.
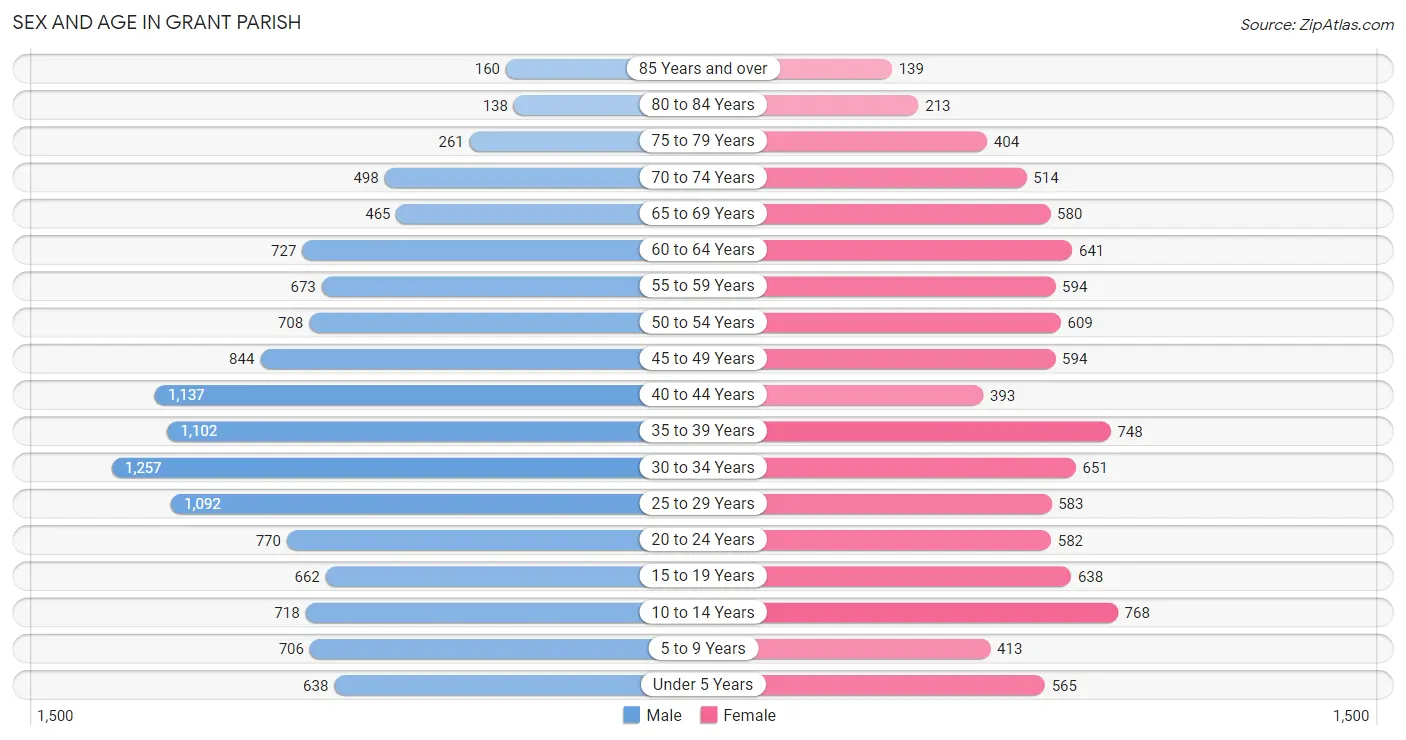
| Age Bracket | Male | Female |
| Under 5 Years | 638 (5.1%) | 565 (5.9%) |
| 5 to 9 Years | 706 (5.6%) | 413 (4.3%) |
| 10 to 14 Years | 718 (5.7%) | 768 (8.0%) |
| 15 to 19 Years | 662 (5.3%) | 638 (6.6%) |
| 20 to 24 Years | 770 (6.1%) | 582 (6.0%) |
| 25 to 29 Years | 1,092 (8.7%) | 583 (6.0%) |
| 30 to 34 Years | 1,257 (10.0%) | 651 (6.8%) |
| 35 to 39 Years | 1,102 (8.8%) | 748 (7.8%) |
| 40 to 44 Years | 1,137 (9.1%) | 393 (4.1%) |
| 45 to 49 Years | 844 (6.7%) | 594 (6.2%) |
| 50 to 54 Years | 708 (5.6%) | 609 (6.3%) |
| 55 to 59 Years | 673 (5.4%) | 594 (6.2%) |
| 60 to 64 Years | 727 (5.8%) | 641 (6.7%) |
| 65 to 69 Years | 465 (3.7%) | 580 (6.0%) |
| 70 to 74 Years | 498 (4.0%) | 514 (5.3%) |
| 75 to 79 Years | 261 (2.1%) | 404 (4.2%) |
| 80 to 84 Years | 138 (1.1%) | 213 (2.2%) |
| 85 Years and over | 160 (1.3%) | 139 (1.4%) |
| Total | 12,556 (100.0%) | 9,629 (100.0%) |
Families and Households in Grant Parish
Median Family Size in Grant Parish
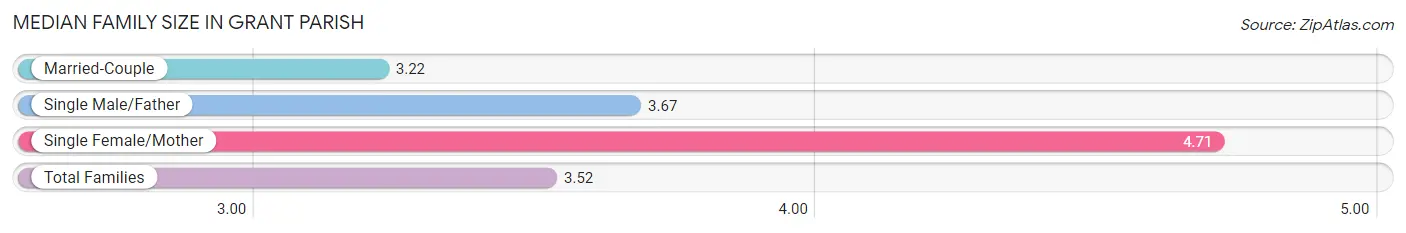
The median family size in Grant Parish is 3.52 persons per family, with single female/mother families (832 | 18.2%) accounting for the largest median family size of 4.71 persons per family. On the other hand, married-couple families (3,487 | 76.1%) represent the smallest median family size with 3.22 persons per family.
| Family Type | # Families | Family Size |
| Married-Couple | 3,487 (76.1%) | 3.22 |
| Single Male/Father | 263 (5.7%) | 3.67 |
| Single Female/Mother | 832 (18.2%) | 4.71 |
| Total Families | 4,582 (100.0%) | 3.52 |
Median Household Size in Grant Parish
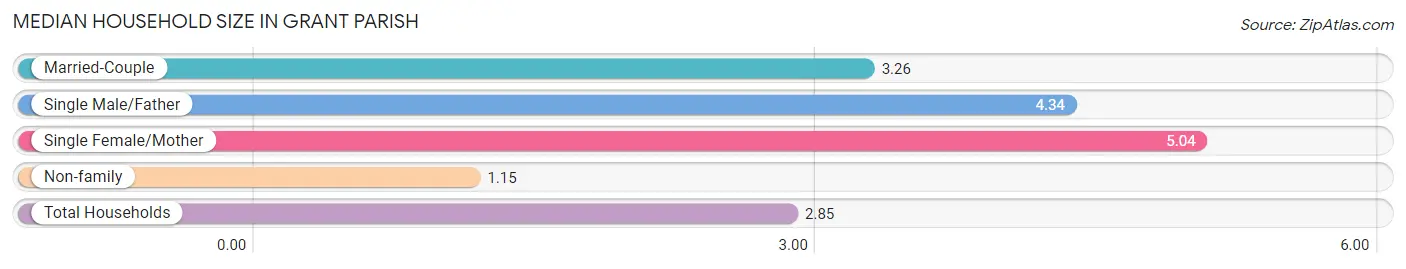
The median household size in Grant Parish is 2.85 persons per household, with single female/mother households (832 | 12.4%) accounting for the largest median household size of 5.04 persons per household. non-family households (2,137 | 31.8%) represent the smallest median household size with 1.15 persons per household.
| Household Type | # Households | Household Size |
| Married-Couple | 3,487 (51.9%) | 3.26 |
| Single Male/Father | 263 (3.9%) | 4.34 |
| Single Female/Mother | 832 (12.4%) | 5.04 |
| Non-family | 2,137 (31.8%) | 1.15 |
| Total Households | 6,719 (100.0%) | 2.85 |
Household Size by Marriage Status in Grant Parish
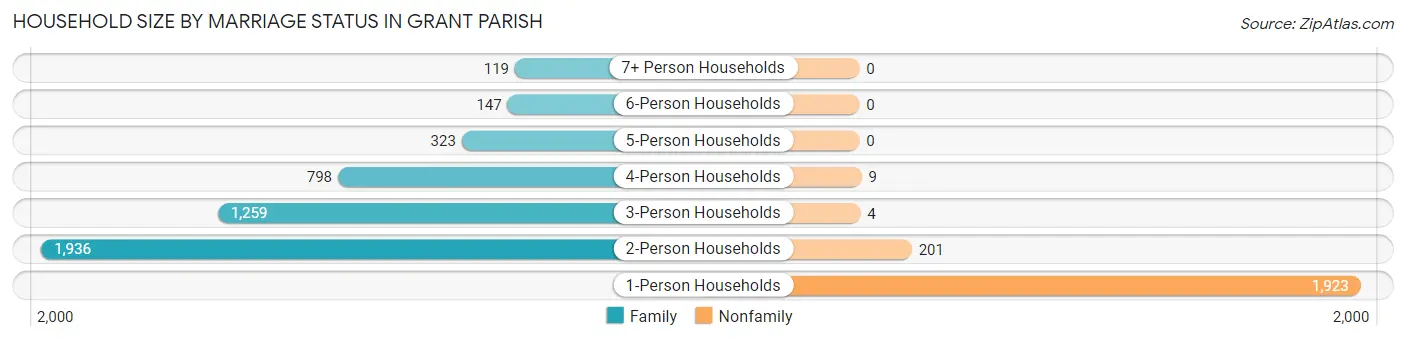
Out of a total of 6,719 households in Grant Parish, 4,582 (68.2%) are family households, while 2,137 (31.8%) are nonfamily households. The most numerous type of family households are 2-person households, comprising 1,936, and the most common type of nonfamily households are 1-person households, comprising 1,923.
| Household Size | Family Households | Nonfamily Households |
| 1-Person Households | - | 1,923 (28.6%) |
| 2-Person Households | 1,936 (28.8%) | 201 (3.0%) |
| 3-Person Households | 1,259 (18.7%) | 4 (0.1%) |
| 4-Person Households | 798 (11.9%) | 9 (0.1%) |
| 5-Person Households | 323 (4.8%) | 0 (0.0%) |
| 6-Person Households | 147 (2.2%) | 0 (0.0%) |
| 7+ Person Households | 119 (1.8%) | 0 (0.0%) |
| Total | 4,582 (68.2%) | 2,137 (31.8%) |
Female Fertility in Grant Parish
Fertility by Age in Grant Parish
Average fertility rate in Grant Parish is 76.0 births per 1,000 women. Women in the age bracket of 20 to 34 years have the highest fertility rate with 175.0 births per 1,000 women. Women in the age bracket of 20 to 34 years acount for 96.4% of all women with births.
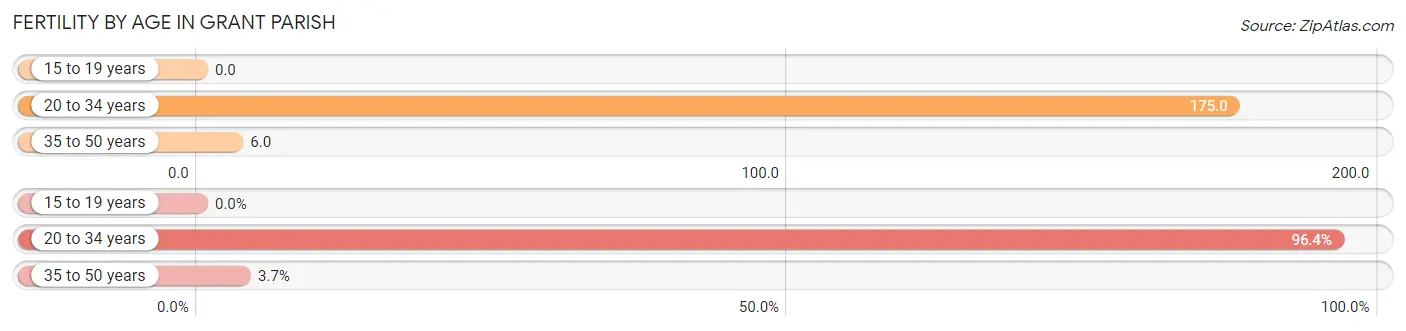
| Age Bracket | Women with Births | Births / 1,000 Women |
| 15 to 19 years | 0 (0.0%) | 0.0 |
| 20 to 34 years | 317 (96.4%) | 175.0 |
| 35 to 50 years | 12 (3.6%) | 6.0 |
| Total | 329 (100.0%) | 76.0 |
Fertility by Age by Marriage Status in Grant Parish
33.4% of women with births (329) in Grant Parish are married. The highest percentage of unmarried women with births falls into 20 to 34 years age bracket with 69.1% of them unmarried at the time of birth, while the lowest percentage of unmarried women with births belong to 35 to 50 years age bracket with 0.0% of them unmarried.
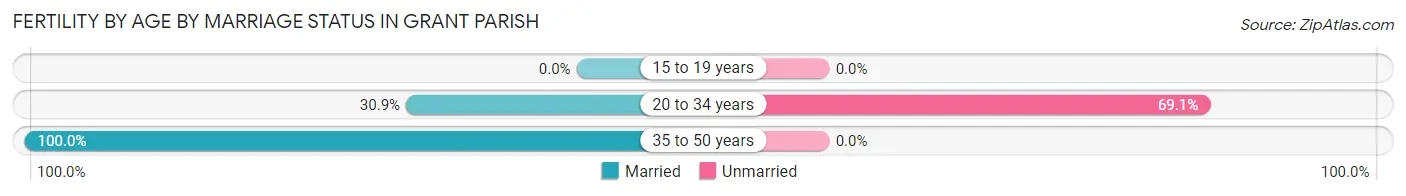
| Age Bracket | Married | Unmarried |
| 15 to 19 years | 0 (0.0%) | 0 (0.0%) |
| 20 to 34 years | 98 (30.9%) | 219 (69.1%) |
| 35 to 50 years | 12 (100.0%) | 0 (0.0%) |
| Total | 110 (33.4%) | 219 (66.6%) |
Fertility by Education in Grant Parish
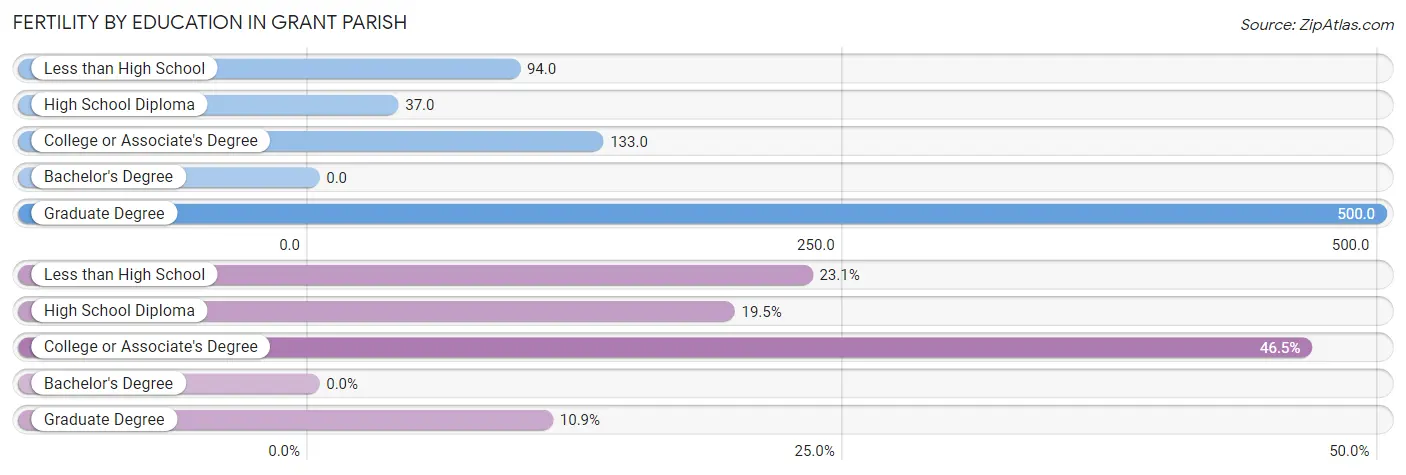
| Educational Attainment | Women with Births | Births / 1,000 Women |
| Less than High School | 76 (23.1%) | 94.0 |
| High School Diploma | 64 (19.5%) | 37.0 |
| College or Associate's Degree | 153 (46.5%) | 133.0 |
| Bachelor's Degree | 0 (0.0%) | 0.0 |
| Graduate Degree | 36 (10.9%) | 500.0 |
| Total | 329 (100.0%) | 76.0 |
Fertility by Education by Marriage Status in Grant Parish
66.6% of women with births in Grant Parish are unmarried. Women with the educational attainment of graduate degree are most likely to be married with 100.0% of them married at childbirth, while women with the educational attainment of less than high school are least likely to be married with 100.0% of them unmarried at childbirth.
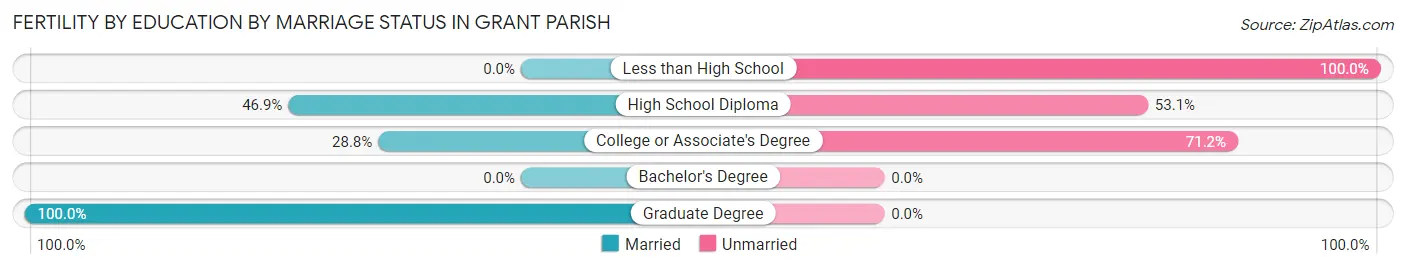
| Educational Attainment | Married | Unmarried |
| Less than High School | 0 (0.0%) | 76 (100.0%) |
| High School Diploma | 30 (46.9%) | 34 (53.1%) |
| College or Associate's Degree | 44 (28.8%) | 109 (71.2%) |
| Bachelor's Degree | 0 (0.0%) | 0 (0.0%) |
| Graduate Degree | 36 (100.0%) | 0 (0.0%) |
| Total | 110 (33.4%) | 219 (66.6%) |
Income in Grant Parish
Income Overview in Grant Parish
Per Capita Income in Grant Parish is $25,077, while median incomes of families and households are $65,681 and $57,362 respectively.
| Characteristic | Number | Measure |
| Per Capita Income | 22,185 | $25,077 |
| Median Family Income | 4,582 | $65,681 |
| Mean Family Income | 4,582 | $87,097 |
| Median Household Income | 6,719 | $57,362 |
| Mean Household Income | 6,719 | $75,336 |
| Income Deficit | 4,582 | $0 |
| Wage / Income Gap (%) | 22,185 | 31.24% |
| Wage / Income Gap ($) | 22,185 | 68.76¢ per $1 |
| Gini / Inequality Index | 22,185 | 0.43 |
Earnings by Sex in Grant Parish
Average Earnings in Grant Parish are $36,154, $42,069 for men and $28,927 for women, a difference of 31.2%.
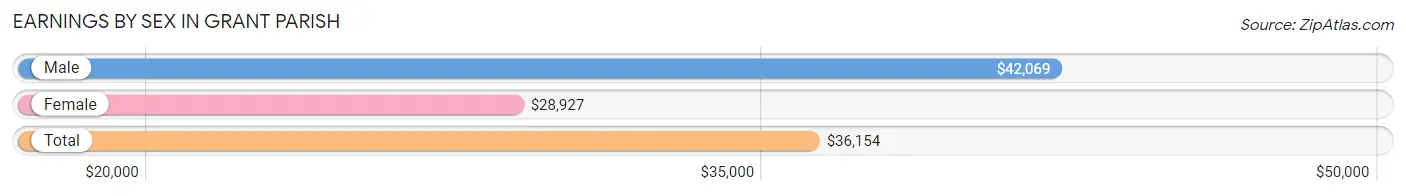
| Sex | Number | Average Earnings |
| Male | 5,063 (58.7%) | $42,069 |
| Female | 3,557 (41.3%) | $28,927 |
| Total | 8,620 (100.0%) | $36,154 |
Earnings by Sex by Income Bracket in Grant Parish
The most common earnings brackets in Grant Parish are $100,000+ for men (933 | 18.4%) and $25,000 to $29,999 for women (293 | 8.2%).
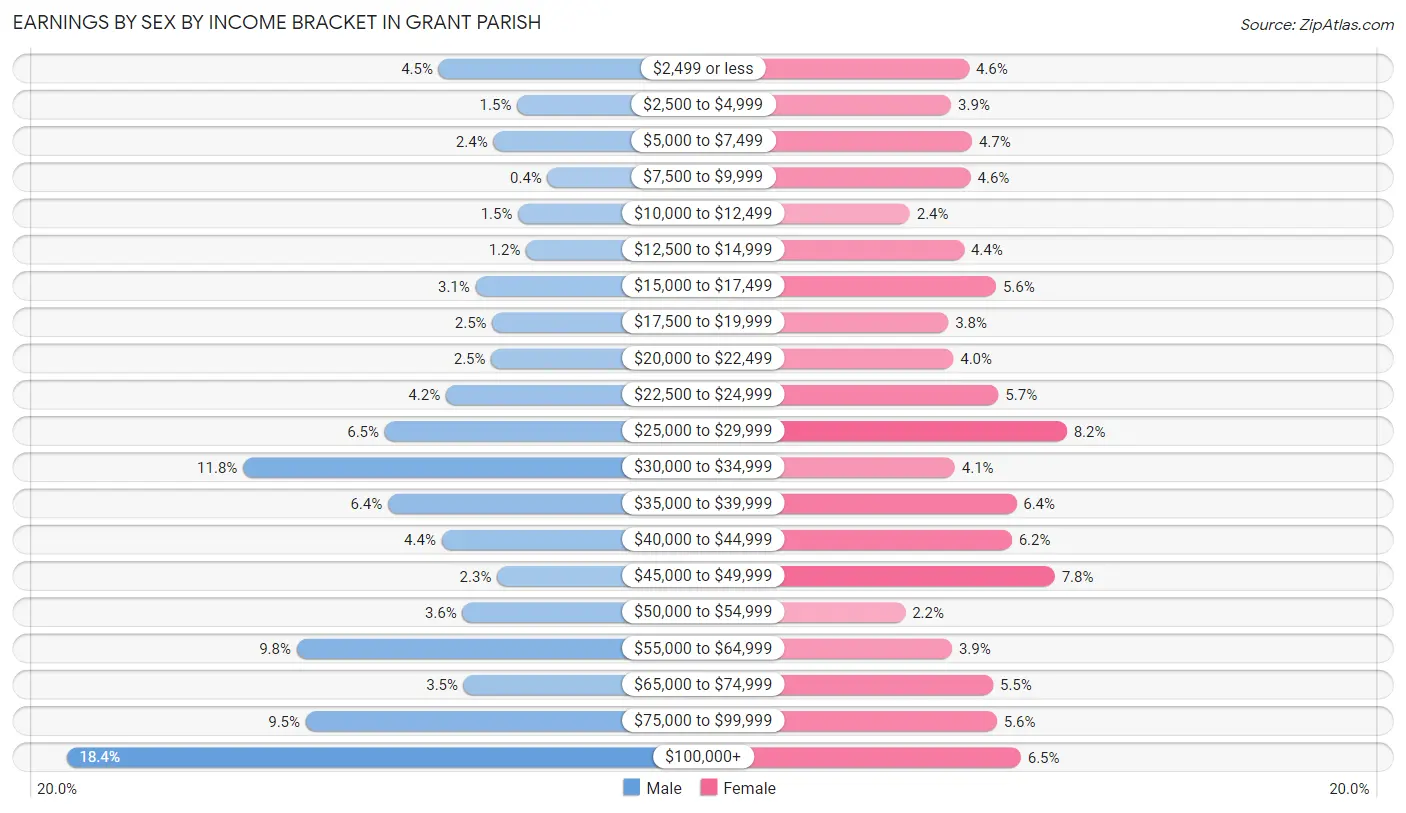
| Income | Male | Female |
| $2,499 or less | 227 (4.5%) | 163 (4.6%) |
| $2,500 to $4,999 | 78 (1.5%) | 139 (3.9%) |
| $5,000 to $7,499 | 123 (2.4%) | 167 (4.7%) |
| $7,500 to $9,999 | 20 (0.4%) | 165 (4.6%) |
| $10,000 to $12,499 | 76 (1.5%) | 84 (2.4%) |
| $12,500 to $14,999 | 61 (1.2%) | 156 (4.4%) |
| $15,000 to $17,499 | 157 (3.1%) | 199 (5.6%) |
| $17,500 to $19,999 | 125 (2.5%) | 135 (3.8%) |
| $20,000 to $22,499 | 127 (2.5%) | 142 (4.0%) |
| $22,500 to $24,999 | 213 (4.2%) | 202 (5.7%) |
| $25,000 to $29,999 | 329 (6.5%) | 293 (8.2%) |
| $30,000 to $34,999 | 598 (11.8%) | 144 (4.1%) |
| $35,000 to $39,999 | 323 (6.4%) | 226 (6.4%) |
| $40,000 to $44,999 | 221 (4.4%) | 220 (6.2%) |
| $45,000 to $49,999 | 116 (2.3%) | 277 (7.8%) |
| $50,000 to $54,999 | 182 (3.6%) | 78 (2.2%) |
| $55,000 to $64,999 | 496 (9.8%) | 140 (3.9%) |
| $65,000 to $74,999 | 179 (3.5%) | 195 (5.5%) |
| $75,000 to $99,999 | 479 (9.5%) | 200 (5.6%) |
| $100,000+ | 933 (18.4%) | 232 (6.5%) |
| Total | 5,063 (100.0%) | 3,557 (100.0%) |
Earnings by Sex by Educational Attainment in Grant Parish
Average earnings in Grant Parish are $47,132 for men and $34,873 for women, a difference of 26.0%. Men with an educational attainment of bachelor's degree enjoy the highest average annual earnings of $117,774, while those with less than high school education earn the least with $33,390. Women with an educational attainment of bachelor's degree earn the most with the average annual earnings of $48,919, while those with less than high school education have the smallest earnings of $18,672.
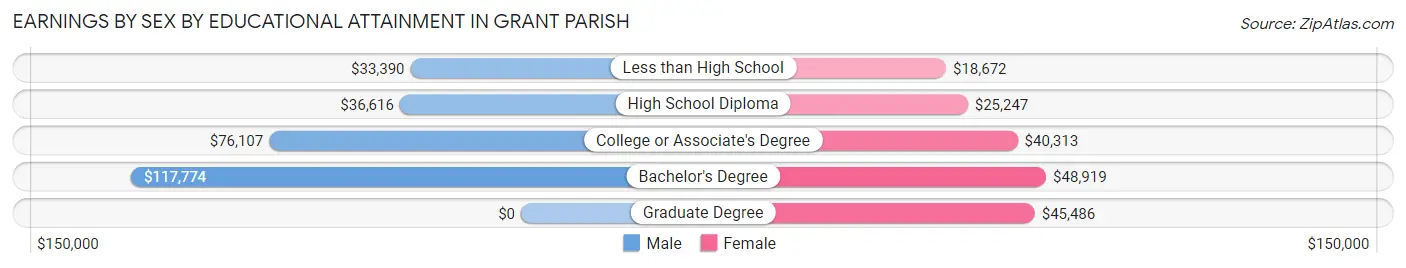
| Educational Attainment | Male Income | Female Income |
| Less than High School | $33,390 | $18,672 |
| High School Diploma | $36,616 | $25,247 |
| College or Associate's Degree | $76,107 | $40,313 |
| Bachelor's Degree | $117,774 | $48,919 |
| Graduate Degree | - | - |
| Total | $47,132 | $34,873 |
Family Income in Grant Parish
Family Income Brackets in Grant Parish
According to the Grant Parish family income data, there are 1,150 families falling into the $50,000 to $74,999 income range, which is the most common income bracket and makes up 25.1% of all families. Conversely, the $10,000 to $14,999 income bracket is the least frequent group with only 128 families (2.8%) belonging to this category.
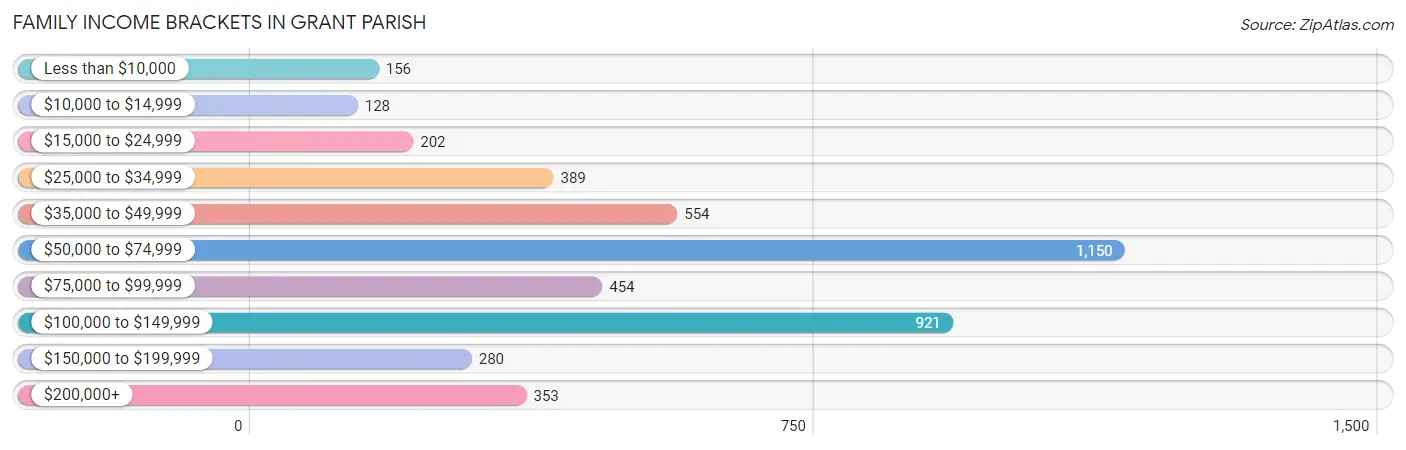
| Income Bracket | # Families | % Families |
| Less than $10,000 | 156 | 3.4% |
| $10,000 to $14,999 | 128 | 2.8% |
| $15,000 to $24,999 | 202 | 4.4% |
| $25,000 to $34,999 | 389 | 8.5% |
| $35,000 to $49,999 | 554 | 12.1% |
| $50,000 to $74,999 | 1,150 | 25.1% |
| $75,000 to $99,999 | 454 | 9.9% |
| $100,000 to $149,999 | 921 | 20.1% |
| $150,000 to $199,999 | 280 | 6.1% |
| $200,000+ | 353 | 7.7% |
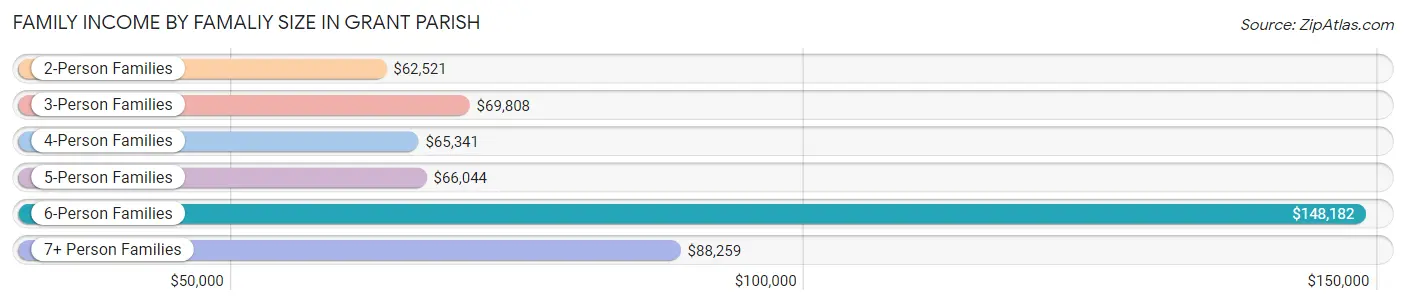
Family Income by Famaliy Size in Grant Parish
6-person families (40 | 0.9%) account for the highest median family income in Grant Parish with $148,182 per family, while 2-person families (2,027 | 44.2%) have the highest median income of $31,260 per family member.
| Income Bracket | # Families | Median Income |
| 2-Person Families | 2,027 (44.2%) | $62,521 |
| 3-Person Families | 1,282 (28.0%) | $69,808 |
| 4-Person Families | 712 (15.5%) | $65,341 |
| 5-Person Families | 480 (10.5%) | $66,044 |
| 6-Person Families | 40 (0.9%) | $148,182 |
| 7+ Person Families | 41 (0.9%) | $88,259 |
| Total | 4,582 (100.0%) | $65,681 |
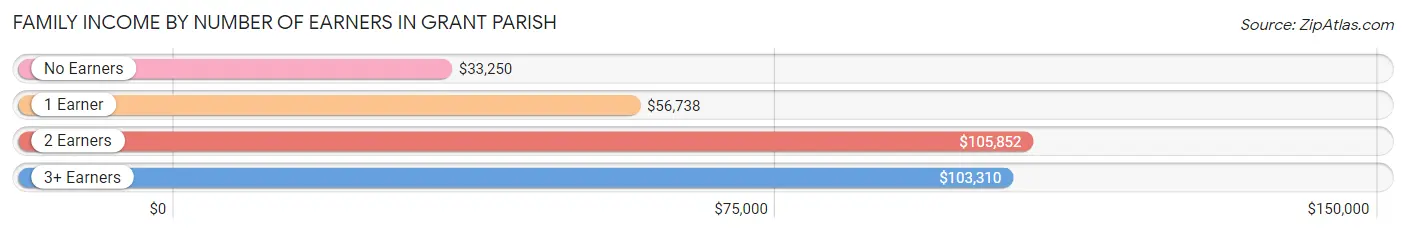
Family Income by Number of Earners in Grant Parish
The median family income in Grant Parish is $65,681, with families comprising 2 earners (1,600) having the highest median family income of $105,852, while families with no earners (818) have the lowest median family income of $33,250, accounting for 34.9% and 17.8% of families, respectively.
| Number of Earners | # Families | Median Income |
| No Earners | 818 (17.8%) | $33,250 |
| 1 Earner | 1,806 (39.4%) | $56,738 |
| 2 Earners | 1,600 (34.9%) | $105,852 |
| 3+ Earners | 358 (7.8%) | $103,310 |
| Total | 4,582 (100.0%) | $65,681 |
Household Income in Grant Parish
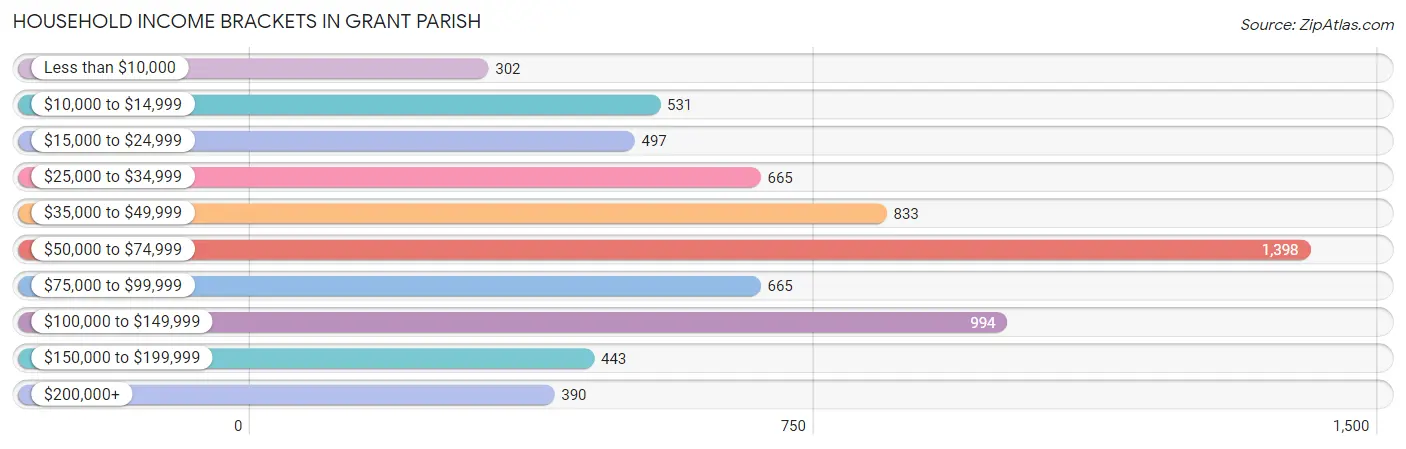
Household Income Brackets in Grant Parish
With 1,398 households falling in the category, the $50,000 to $74,999 income range is the most frequent in Grant Parish, accounting for 20.8% of all households. In contrast, only 302 households (4.5%) fall into the less than $10,000 income bracket, making it the least populous group.
| Income Bracket | # Households | % Households |
| Less than $10,000 | 302 | 4.5% |
| $10,000 to $14,999 | 531 | 7.9% |
| $15,000 to $24,999 | 497 | 7.4% |
| $25,000 to $34,999 | 665 | 9.9% |
| $35,000 to $49,999 | 833 | 12.4% |
| $50,000 to $74,999 | 1,398 | 20.8% |
| $75,000 to $99,999 | 665 | 9.9% |
| $100,000 to $149,999 | 994 | 14.8% |
| $150,000 to $199,999 | 443 | 6.6% |
| $200,000+ | 390 | 5.8% |
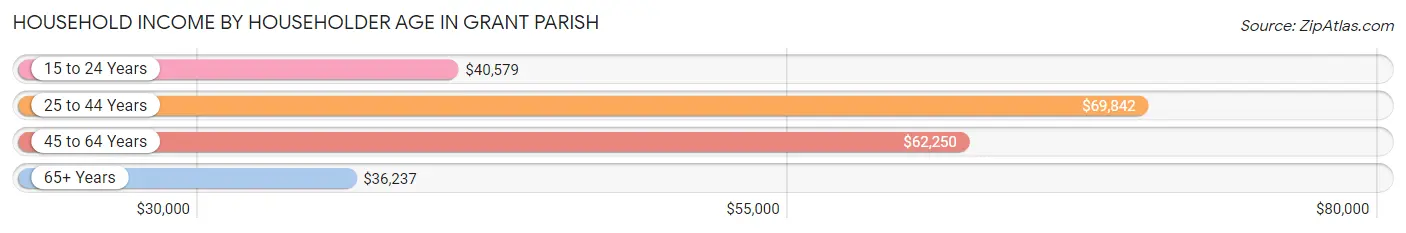
Household Income by Householder Age in Grant Parish
The median household income in Grant Parish is $57,362, with the highest median household income of $69,842 found in the 25 to 44 years age bracket for the primary householder. A total of 1,920 households (28.6%) fall into this category. Meanwhile, the 65+ years age bracket for the primary householder has the lowest median household income of $36,237, with 2,016 households (30.0%) in this group.
| Income Bracket | # Households | Median Income |
| 15 to 24 Years | 197 (2.9%) | $40,579 |
| 25 to 44 Years | 1,920 (28.6%) | $69,842 |
| 45 to 64 Years | 2,586 (38.5%) | $62,250 |
| 65+ Years | 2,016 (30.0%) | $36,237 |
| Total | 6,719 (100.0%) | $57,362 |
Poverty in Grant Parish
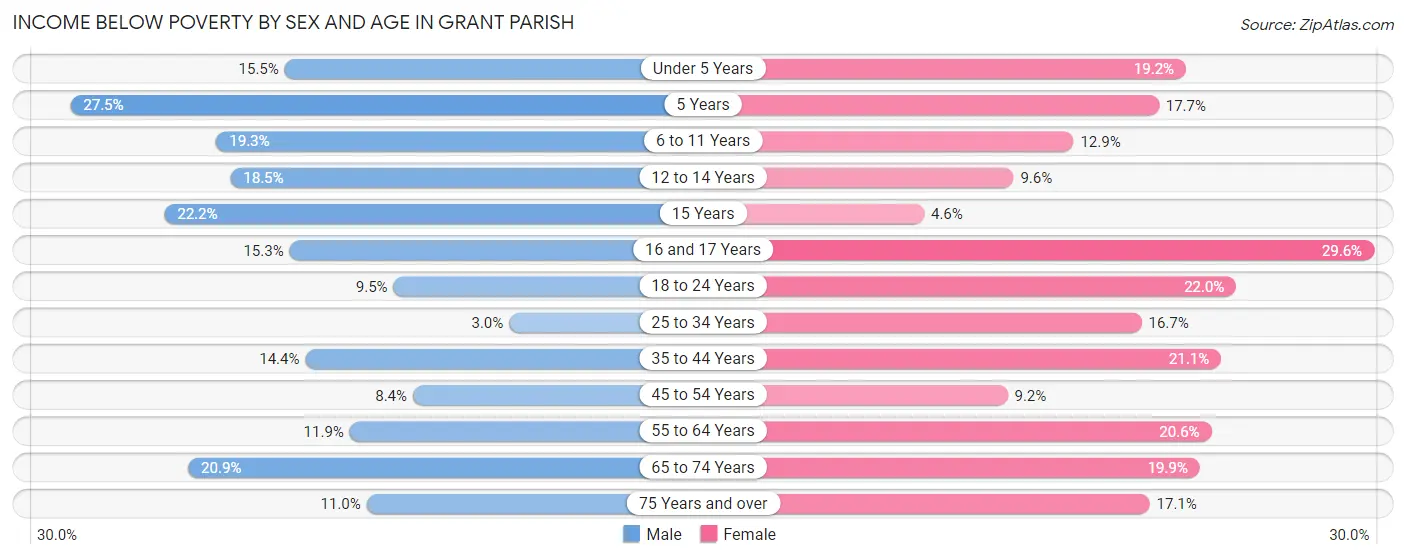
Income Below Poverty by Sex and Age in Grant Parish
With 12.7% poverty level for males and 17.4% for females among the residents of Grant Parish, 5 year old males and 16 and 17 year old females are the most vulnerable to poverty, with 14 males (27.5%) and 80 females (29.6%) in their respective age groups living below the poverty level.
| Age Bracket | Male | Female |
| Under 5 Years | 99 (15.5%) | 105 (19.2%) |
| 5 Years | 14 (27.5%) | 9 (17.6%) |
| 6 to 11 Years | 200 (19.3%) | 72 (12.9%) |
| 12 to 14 Years | 61 (18.5%) | 43 (9.6%) |
| 15 Years | 16 (22.2%) | 7 (4.6%) |
| 16 and 17 Years | 45 (15.2%) | 80 (29.6%) |
| 18 to 24 Years | 89 (9.5%) | 175 (22.0%) |
| 25 to 34 Years | 39 (3.0%) | 206 (16.7%) |
| 35 to 44 Years | 166 (14.4%) | 241 (21.1%) |
| 45 to 54 Years | 94 (8.4%) | 111 (9.2%) |
| 55 to 64 Years | 150 (11.9%) | 249 (20.6%) |
| 65 to 74 Years | 192 (20.9%) | 215 (19.9%) |
| 75 Years and over | 57 (11.0%) | 120 (17.1%) |
| Total | 1,222 (12.7%) | 1,633 (17.4%) |
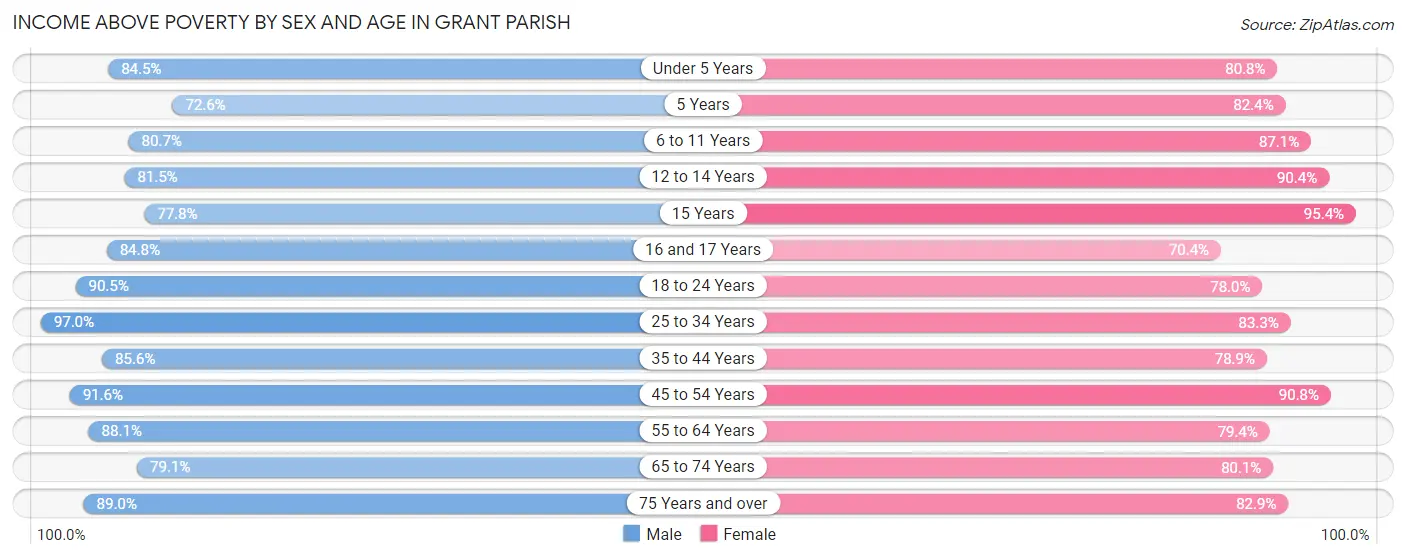
Income Above Poverty by Sex and Age in Grant Parish
According to the poverty statistics in Grant Parish, males aged 25 to 34 years and females aged 15 years are the age groups that are most secure financially, with 97.0% of males and 95.4% of females in these age groups living above the poverty line.
| Age Bracket | Male | Female |
| Under 5 Years | 539 (84.5%) | 443 (80.8%) |
| 5 Years | 37 (72.6%) | 42 (82.4%) |
| 6 to 11 Years | 835 (80.7%) | 486 (87.1%) |
| 12 to 14 Years | 268 (81.5%) | 407 (90.4%) |
| 15 Years | 56 (77.8%) | 146 (95.4%) |
| 16 and 17 Years | 250 (84.8%) | 190 (70.4%) |
| 18 to 24 Years | 852 (90.5%) | 622 (78.0%) |
| 25 to 34 Years | 1,251 (97.0%) | 1,028 (83.3%) |
| 35 to 44 Years | 989 (85.6%) | 900 (78.9%) |
| 45 to 54 Years | 1,028 (91.6%) | 1,092 (90.8%) |
| 55 to 64 Years | 1,111 (88.1%) | 961 (79.4%) |
| 65 to 74 Years | 727 (79.1%) | 864 (80.1%) |
| 75 Years and over | 463 (89.0%) | 580 (82.9%) |
| Total | 8,406 (87.3%) | 7,761 (82.6%) |
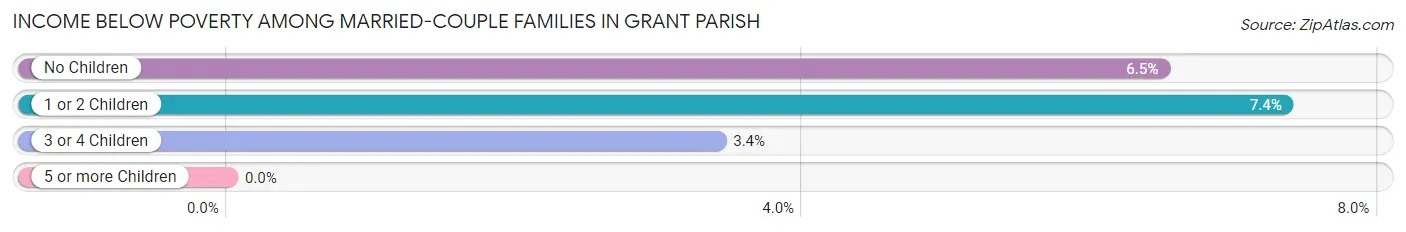
Income Below Poverty Among Married-Couple Families in Grant Parish
The poverty statistics for married-couple families in Grant Parish show that 6.5% or 228 of the total 3,487 families live below the poverty line. Families with 1 or 2 children have the highest poverty rate of 7.3%, comprising of 87 families. On the other hand, families with 5 or more children have the lowest poverty rate of 0.0%, which includes 0 families.
| Children | Above Poverty | Below Poverty |
| No Children | 1,903 (93.5%) | 132 (6.5%) |
| 1 or 2 Children | 1,097 (92.6%) | 87 (7.3%) |
| 3 or 4 Children | 256 (96.6%) | 9 (3.4%) |
| 5 or more Children | 3 (100.0%) | 0 (0.0%) |
| Total | 3,259 (93.5%) | 228 (6.5%) |
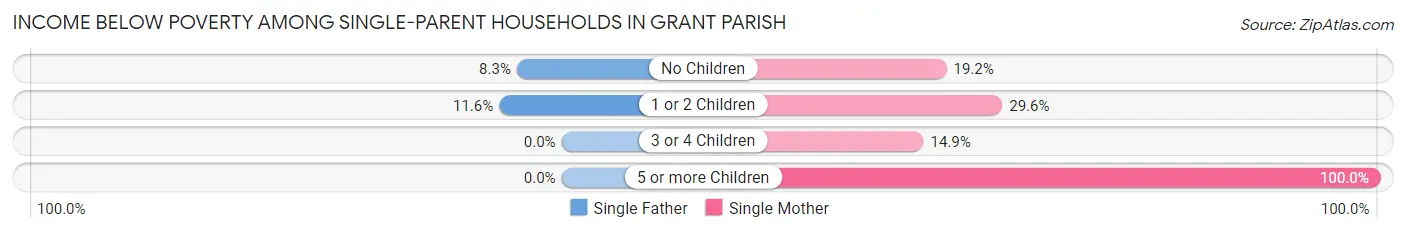
Income Below Poverty Among Single-Parent Households in Grant Parish
According to the poverty data in Grant Parish, 6.8% or 18 single-father households and 23.6% or 196 single-mother households are living below the poverty line. Among single-father households, those with 1 or 2 children have the highest poverty rate, with 10 households (11.6%) experiencing poverty. Likewise, among single-mother households, those with 5 or more children have the highest poverty rate, with 4 households (100.0%) falling below the poverty line.
| Children | Single Father | Single Mother |
| No Children | 8 (8.3%) | 59 (19.2%) |
| 1 or 2 Children | 10 (11.6%) | 112 (29.5%) |
| 3 or 4 Children | 0 (0.0%) | 21 (14.9%) |
| 5 or more Children | 0 (0.0%) | 4 (100.0%) |
| Total | 18 (6.8%) | 196 (23.6%) |
Income Below Poverty Among Married-Couple vs Single-Parent Households in Grant Parish
The poverty data for Grant Parish shows that 228 of the married-couple family households (6.5%) and 214 of the single-parent households (19.5%) are living below the poverty level. Within the married-couple family households, those with 1 or 2 children have the highest poverty rate, with 87 households (7.3%) falling below the poverty line. Among the single-parent households, those with 5 or more children have the highest poverty rate, with 4 household (100.0%) living below poverty.
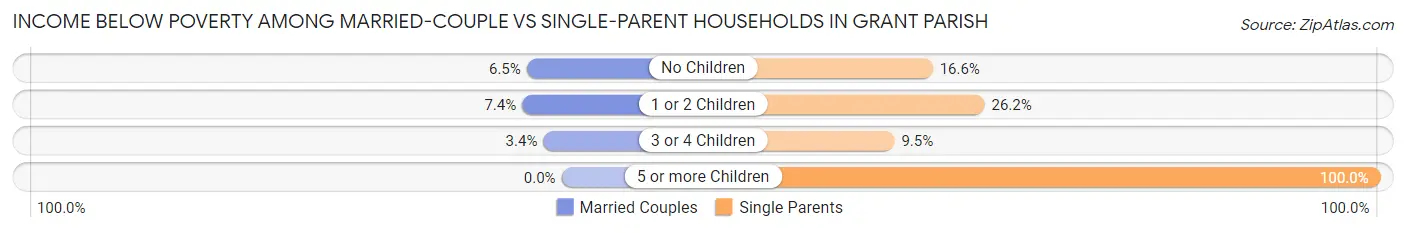
| Children | Married-Couple Families | Single-Parent Households |
| No Children | 132 (6.5%) | 67 (16.6%) |
| 1 or 2 Children | 87 (7.3%) | 122 (26.2%) |
| 3 or 4 Children | 9 (3.4%) | 21 (9.5%) |
| 5 or more Children | 0 (0.0%) | 4 (100.0%) |
| Total | 228 (6.5%) | 214 (19.5%) |
Employment Characteristics in Grant Parish
Employment by Class of Employer in Grant Parish
Among the 7,706 employed individuals in Grant Parish, private company employees (5,111 | 66.3%), local government employees (944 | 12.2%), and self-employed (not incorporated) (678 | 8.8%) make up the most common classes of employment.
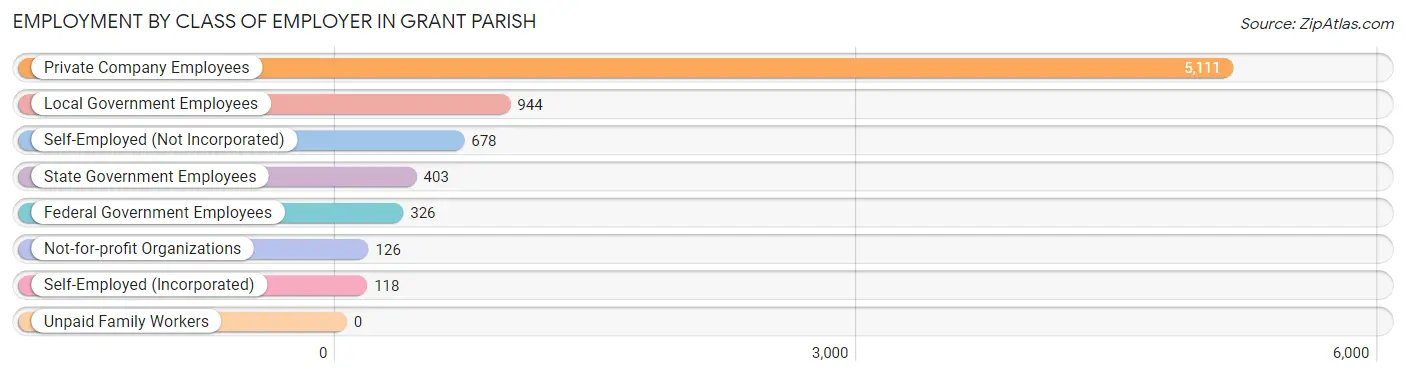
| Employer Class | # Employees | % Employees |
| Private Company Employees | 5,111 | 66.3% |
| Self-Employed (Incorporated) | 118 | 1.5% |
| Self-Employed (Not Incorporated) | 678 | 8.8% |
| Not-for-profit Organizations | 126 | 1.6% |
| Local Government Employees | 944 | 12.2% |
| State Government Employees | 403 | 5.2% |
| Federal Government Employees | 326 | 4.2% |
| Unpaid Family Workers | 0 | 0.0% |
| Total | 7,706 | 100.0% |
Employment Status by Age in Grant Parish
According to the labor force statistics for Grant Parish, out of the total population over 16 years of age (18,152), 44.9% or 8,150 individuals are in the labor force, with 4.0% or 326 of them unemployed. The age group with the highest labor force participation rate is 45 to 54 years, with 64.8% or 1,785 individuals in the labor force. Within the labor force, the 25 to 29 years age range has the highest percentage of unemployed individuals, with 5.3% or 57 of them being unemployed.
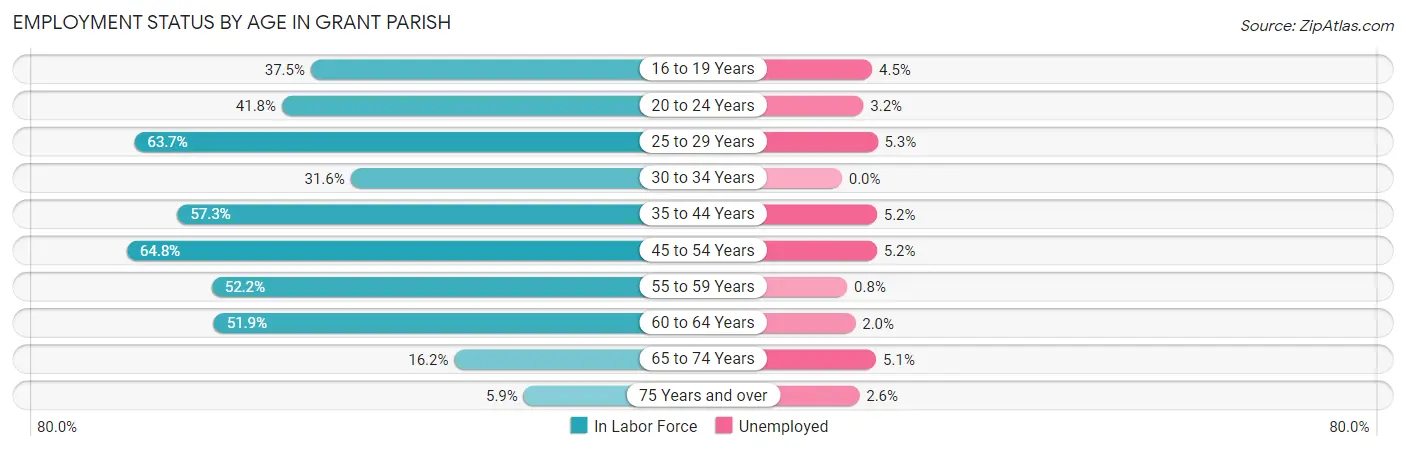
| Age Bracket | In Labor Force | Unemployed |
| 16 to 19 Years | 403 (37.5%) | 18 (4.5%) |
| 20 to 24 Years | 565 (41.8%) | 18 (3.2%) |
| 25 to 29 Years | 1,067 (63.7%) | 57 (5.3%) |
| 30 to 34 Years | 603 (31.6%) | 0 (0.0%) |
| 35 to 44 Years | 1,937 (57.3%) | 101 (5.2%) |
| 45 to 54 Years | 1,785 (64.8%) | 93 (5.2%) |
| 55 to 59 Years | 661 (52.2%) | 5 (0.8%) |
| 60 to 64 Years | 710 (51.9%) | 14 (2.0%) |
| 65 to 74 Years | 333 (16.2%) | 17 (5.1%) |
| 75 Years and over | 78 (5.9%) | 2 (2.6%) |
| Total | 8,150 (44.9%) | 326 (4.0%) |
Employment Status by Educational Attainment in Grant Parish
According to labor force statistics for Grant Parish, 54.8% of individuals (6,769) out of the total population between 25 and 64 years of age (12,353) are in the labor force, with 4.0% or 271 of them being unemployed. The group with the highest labor force participation rate are those with the educational attainment of bachelor's degree or higher, with 85.2% or 1,159 individuals in the labor force. Within the labor force, individuals with less than high school education have the highest percentage of unemployment, with 10.1% or 95 of them being unemployed.
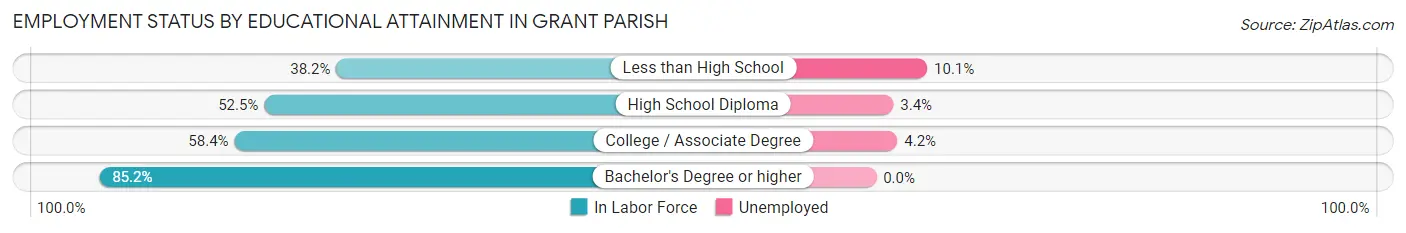
| Educational Attainment | In Labor Force | Unemployed |
| Less than High School | 940 (38.2%) | 249 (10.1%) |
| High School Diploma | 2,836 (52.5%) | 184 (3.4%) |
| College / Associate Degree | 1,828 (58.4%) | 131 (4.2%) |
| Bachelor's Degree or higher | 1,159 (85.2%) | 0 (0.0%) |
| Total | 6,769 (54.8%) | 494 (4.0%) |
Employment Occupations by Sex in Grant Parish
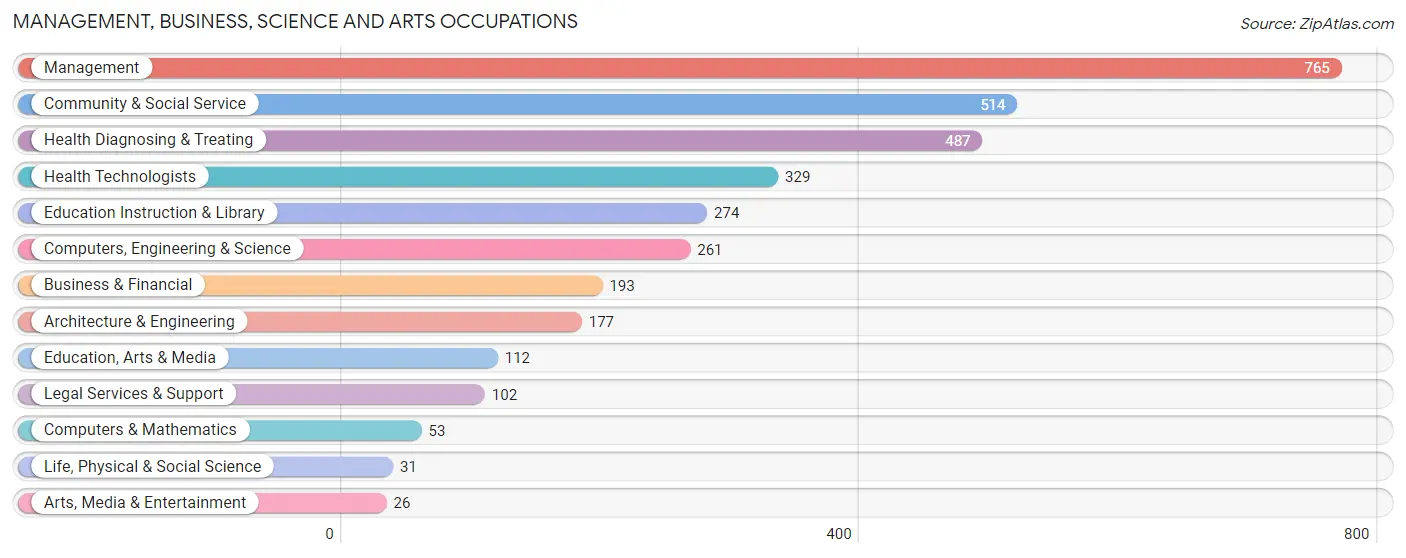
Management, Business, Science and Arts Occupations
The most common Management, Business, Science and Arts occupations in Grant Parish are Management (765 | 9.8%), Community & Social Service (514 | 6.6%), Health Diagnosing & Treating (487 | 6.2%), Health Technologists (329 | 4.2%), and Education Instruction & Library (274 | 3.5%).
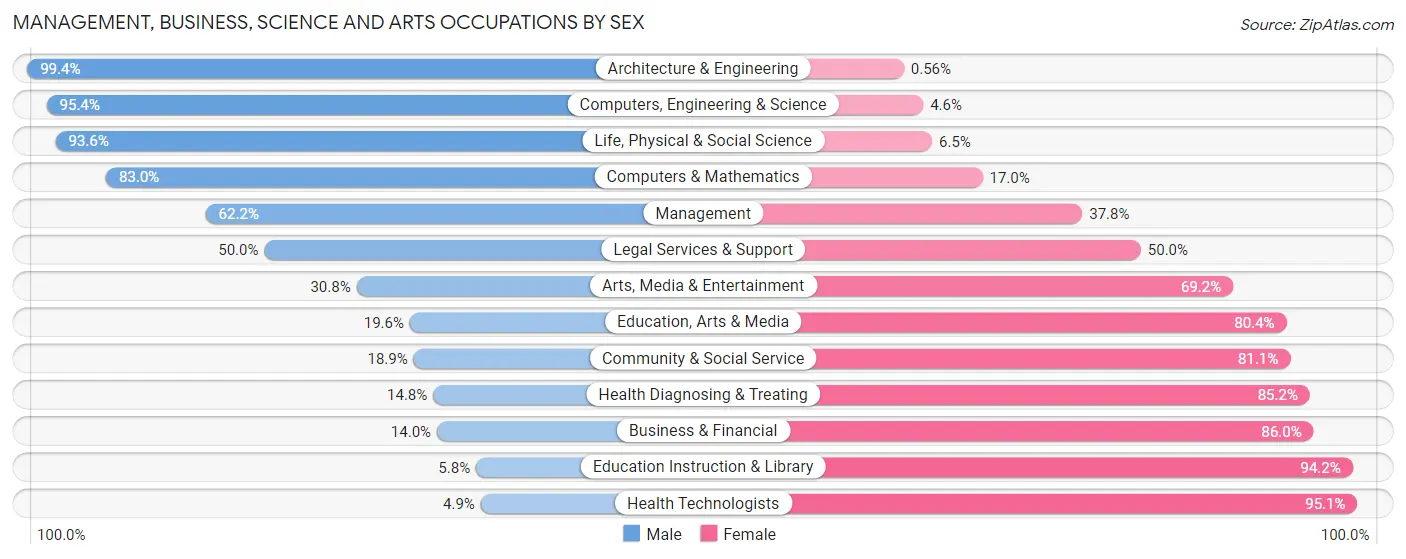
Management, Business, Science and Arts Occupations by Sex
Within the Management, Business, Science and Arts occupations in Grant Parish, the most male-oriented occupations are Architecture & Engineering (99.4%), Computers, Engineering & Science (95.4%), and Life, Physical & Social Science (93.5%), while the most female-oriented occupations are Health Technologists (95.1%), Education Instruction & Library (94.2%), and Business & Financial (86.0%).
| Occupation | Male | Female |
| Management | 476 (62.2%) | 289 (37.8%) |
| Business & Financial | 27 (14.0%) | 166 (86.0%) |
| Computers, Engineering & Science | 249 (95.4%) | 12 (4.6%) |
| Computers & Mathematics | 44 (83.0%) | 9 (17.0%) |
| Architecture & Engineering | 176 (99.4%) | 1 (0.6%) |
| Life, Physical & Social Science | 29 (93.5%) | 2 (6.5%) |
| Community & Social Service | 97 (18.9%) | 417 (81.1%) |
| Education, Arts & Media | 22 (19.6%) | 90 (80.4%) |
| Legal Services & Support | 51 (50.0%) | 51 (50.0%) |
| Education Instruction & Library | 16 (5.8%) | 258 (94.2%) |
| Arts, Media & Entertainment | 8 (30.8%) | 18 (69.2%) |
| Health Diagnosing & Treating | 72 (14.8%) | 415 (85.2%) |
| Health Technologists | 16 (4.9%) | 313 (95.1%) |
| Total (Category) | 921 (41.5%) | 1,299 (58.5%) |
| Total (Overall) | 4,543 (58.2%) | 3,258 (41.8%) |
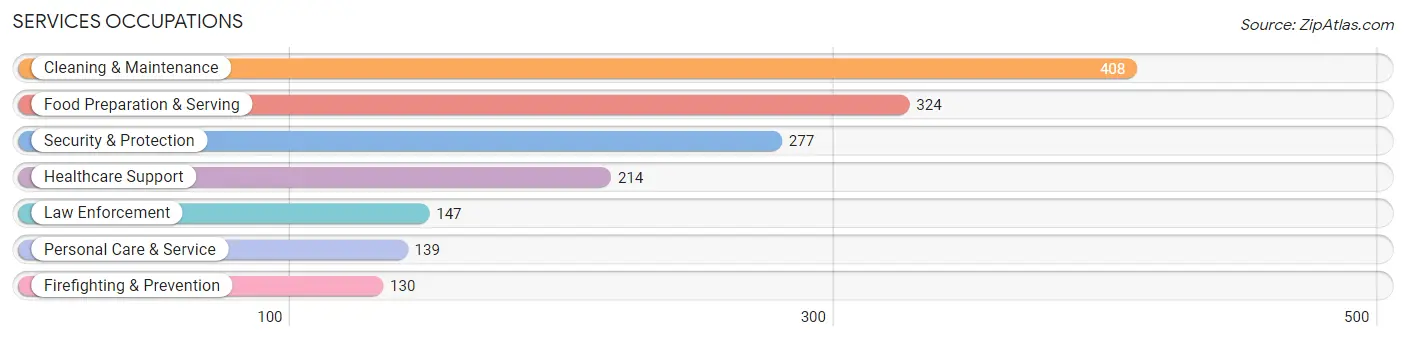
Services Occupations
The most common Services occupations in Grant Parish are Cleaning & Maintenance (408 | 5.2%), Food Preparation & Serving (324 | 4.2%), Security & Protection (277 | 3.5%), Healthcare Support (214 | 2.7%), and Law Enforcement (147 | 1.9%).
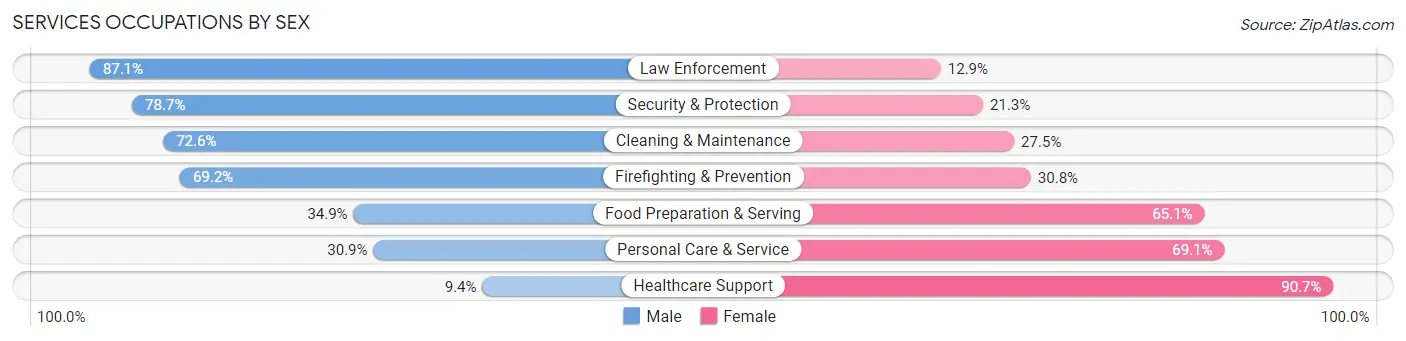
Services Occupations by Sex
Within the Services occupations in Grant Parish, the most male-oriented occupations are Law Enforcement (87.1%), Security & Protection (78.7%), and Cleaning & Maintenance (72.6%), while the most female-oriented occupations are Healthcare Support (90.6%), Personal Care & Service (69.1%), and Food Preparation & Serving (65.1%).
| Occupation | Male | Female |
| Healthcare Support | 20 (9.3%) | 194 (90.6%) |
| Security & Protection | 218 (78.7%) | 59 (21.3%) |
| Firefighting & Prevention | 90 (69.2%) | 40 (30.8%) |
| Law Enforcement | 128 (87.1%) | 19 (12.9%) |
| Food Preparation & Serving | 113 (34.9%) | 211 (65.1%) |
| Cleaning & Maintenance | 296 (72.6%) | 112 (27.5%) |
| Personal Care & Service | 43 (30.9%) | 96 (69.1%) |
| Total (Category) | 690 (50.7%) | 672 (49.3%) |
| Total (Overall) | 4,543 (58.2%) | 3,258 (41.8%) |
Sales and Office Occupations
The most common Sales and Office occupations in Grant Parish are Office & Administration (830 | 10.6%), and Sales & Related (534 | 6.9%).
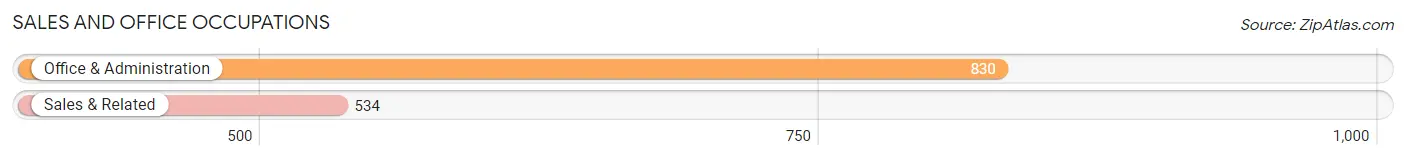
Sales and Office Occupations by Sex

| Occupation | Male | Female |
| Sales & Related | 184 (34.5%) | 350 (65.5%) |
| Office & Administration | 101 (12.2%) | 729 (87.8%) |
| Total (Category) | 285 (20.9%) | 1,079 (79.1%) |
| Total (Overall) | 4,543 (58.2%) | 3,258 (41.8%) |
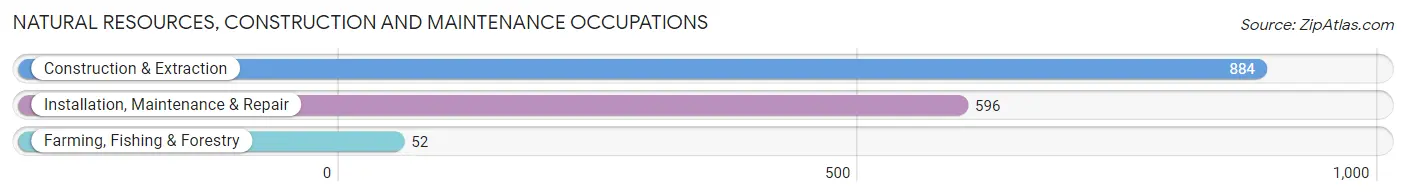
Natural Resources, Construction and Maintenance Occupations
The most common Natural Resources, Construction and Maintenance occupations in Grant Parish are Construction & Extraction (884 | 11.3%), Installation, Maintenance & Repair (596 | 7.6%), and Farming, Fishing & Forestry (52 | 0.7%).
Natural Resources, Construction and Maintenance Occupations by Sex
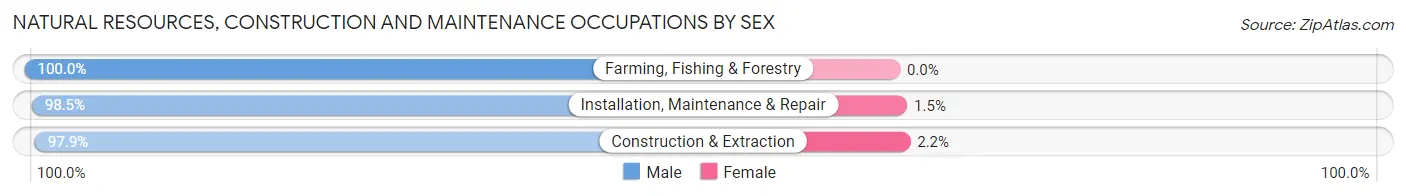
| Occupation | Male | Female |
| Farming, Fishing & Forestry | 52 (100.0%) | 0 (0.0%) |
| Construction & Extraction | 865 (97.9%) | 19 (2.1%) |
| Installation, Maintenance & Repair | 587 (98.5%) | 9 (1.5%) |
| Total (Category) | 1,504 (98.2%) | 28 (1.8%) |
| Total (Overall) | 4,543 (58.2%) | 3,258 (41.8%) |
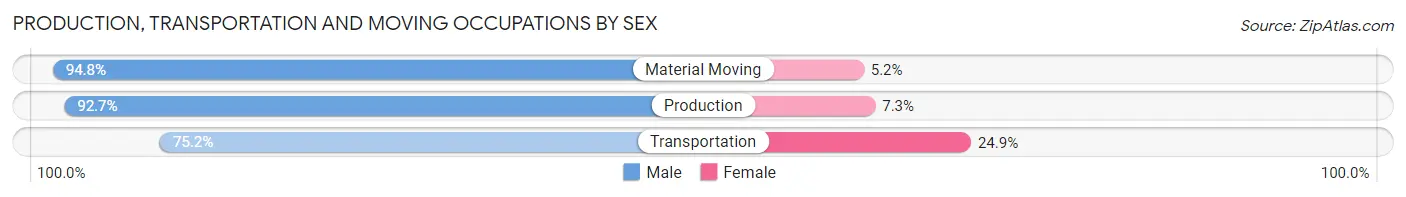
Production, Transportation and Moving Occupations
The most common Production, Transportation and Moving occupations in Grant Parish are Production (631 | 8.1%), Transportation (499 | 6.4%), and Material Moving (193 | 2.5%).
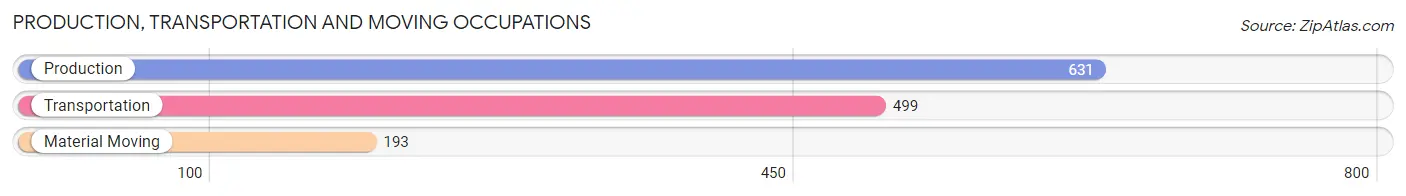
Production, Transportation and Moving Occupations by Sex
| Occupation | Male | Female |
| Production | 585 (92.7%) | 46 (7.3%) |
| Transportation | 375 (75.1%) | 124 (24.8%) |
| Material Moving | 183 (94.8%) | 10 (5.2%) |
| Total (Category) | 1,143 (86.4%) | 180 (13.6%) |
| Total (Overall) | 4,543 (58.2%) | 3,258 (41.8%) |
Employment Industries by Sex in Grant Parish
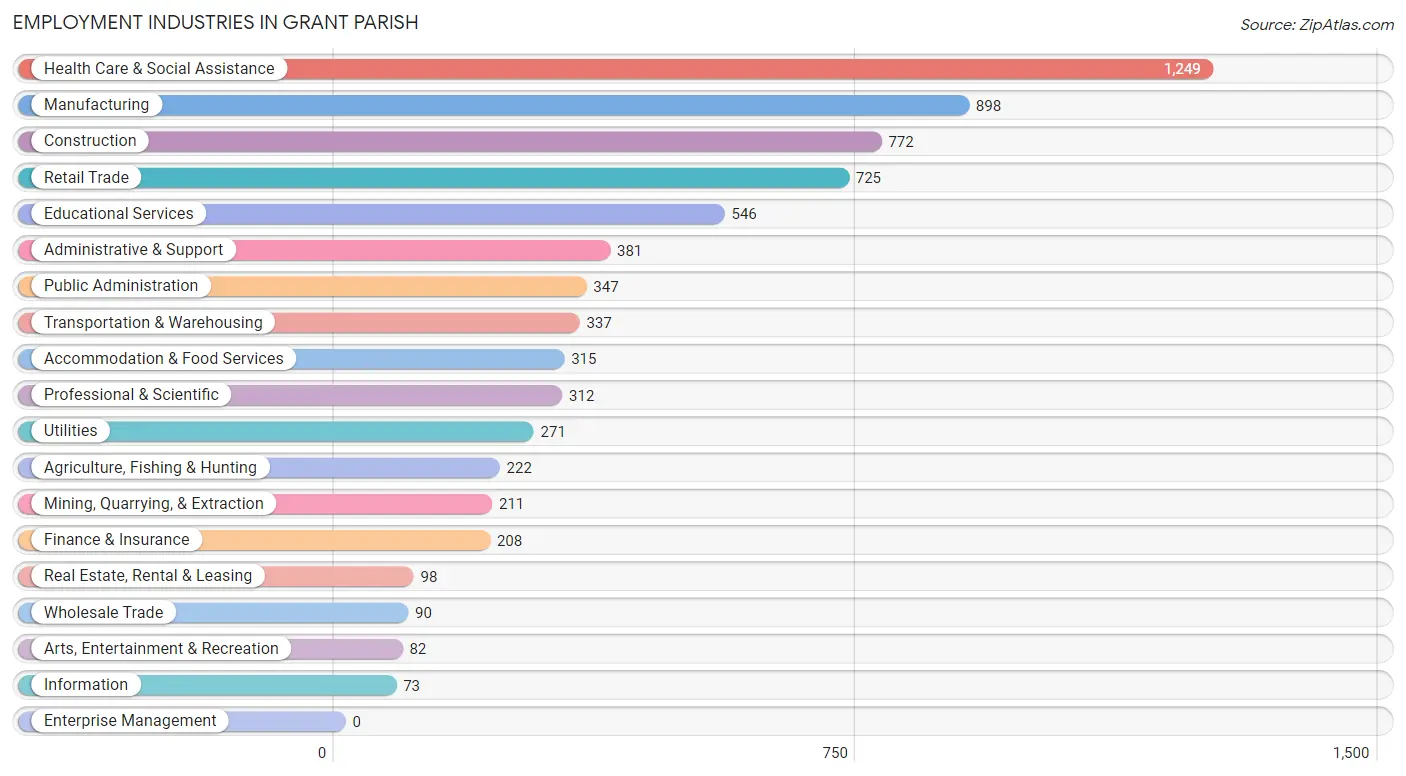
Employment Industries in Grant Parish
The major employment industries in Grant Parish include Health Care & Social Assistance (1,249 | 16.0%), Manufacturing (898 | 11.5%), Construction (772 | 9.9%), Retail Trade (725 | 9.3%), and Educational Services (546 | 7.0%).
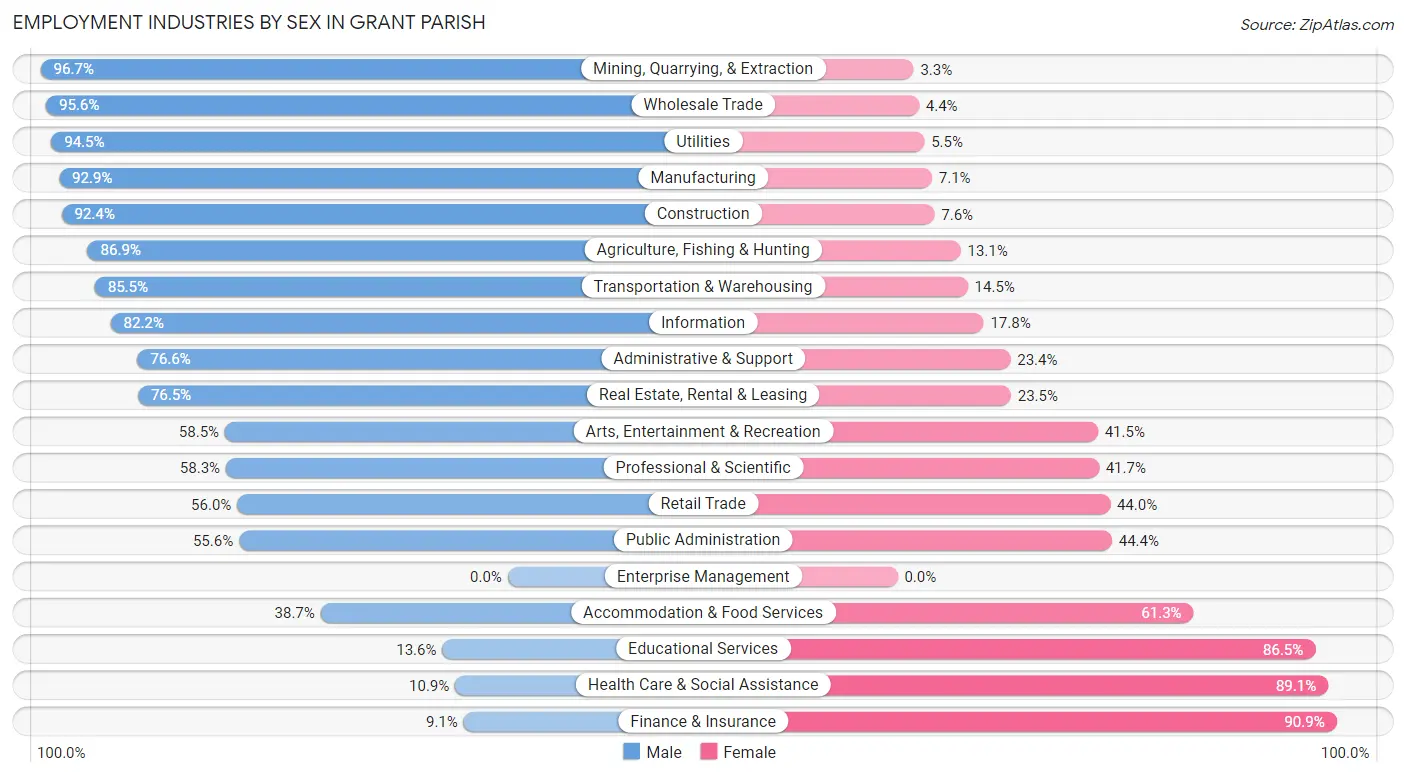
Employment Industries by Sex in Grant Parish
The Grant Parish industries that see more men than women are Mining, Quarrying, & Extraction (96.7%), Wholesale Trade (95.6%), and Utilities (94.5%), whereas the industries that tend to have a higher number of women are Finance & Insurance (90.9%), Health Care & Social Assistance (89.1%), and Educational Services (86.5%).
| Industry | Male | Female |
| Agriculture, Fishing & Hunting | 193 (86.9%) | 29 (13.1%) |
| Mining, Quarrying, & Extraction | 204 (96.7%) | 7 (3.3%) |
| Construction | 713 (92.4%) | 59 (7.6%) |
| Manufacturing | 834 (92.9%) | 64 (7.1%) |
| Wholesale Trade | 86 (95.6%) | 4 (4.4%) |
| Retail Trade | 406 (56.0%) | 319 (44.0%) |
| Transportation & Warehousing | 288 (85.5%) | 49 (14.5%) |
| Utilities | 256 (94.5%) | 15 (5.5%) |
| Information | 60 (82.2%) | 13 (17.8%) |
| Finance & Insurance | 19 (9.1%) | 189 (90.9%) |
| Real Estate, Rental & Leasing | 75 (76.5%) | 23 (23.5%) |
| Professional & Scientific | 182 (58.3%) | 130 (41.7%) |
| Enterprise Management | 0 (0.0%) | 0 (0.0%) |
| Administrative & Support | 292 (76.6%) | 89 (23.4%) |
| Educational Services | 74 (13.6%) | 472 (86.5%) |
| Health Care & Social Assistance | 136 (10.9%) | 1,113 (89.1%) |
| Arts, Entertainment & Recreation | 48 (58.5%) | 34 (41.5%) |
| Accommodation & Food Services | 122 (38.7%) | 193 (61.3%) |
| Public Administration | 193 (55.6%) | 154 (44.4%) |
| Total | 4,543 (58.2%) | 3,258 (41.8%) |
Education in Grant Parish
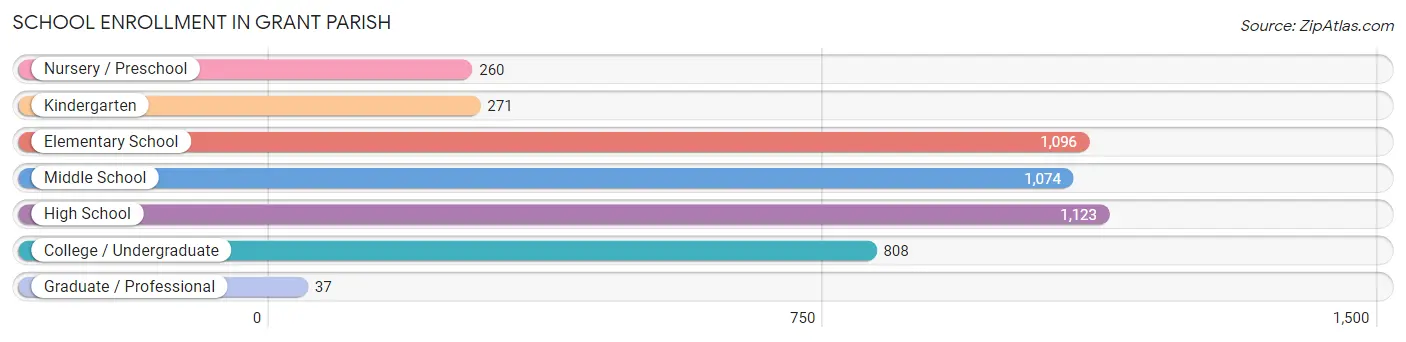
School Enrollment in Grant Parish
The most common levels of schooling among the 4,669 students in Grant Parish are high school (1,123 | 24.0%), elementary school (1,096 | 23.5%), and middle school (1,074 | 23.0%).
| School Level | # Students | % Students |
| Nursery / Preschool | 260 | 5.6% |
| Kindergarten | 271 | 5.8% |
| Elementary School | 1,096 | 23.5% |
| Middle School | 1,074 | 23.0% |
| High School | 1,123 | 24.0% |
| College / Undergraduate | 808 | 17.3% |
| Graduate / Professional | 37 | 0.8% |
| Total | 4,669 | 100.0% |
School Enrollment by Age by Funding Source in Grant Parish
Out of a total of 4,669 students who are enrolled in schools in Grant Parish, 677 (14.5%) attend a private institution, while the remaining 3,992 (85.5%) are enrolled in public schools. The age group of 3 to 4 year olds has the highest likelihood of being enrolled in private schools, with 104 (32.7% in the age bracket) enrolled. Conversely, the age group of 5 to 9 year old has the lowest likelihood of being enrolled in a private school, with 1,064 (95.1% in the age bracket) attending a public institution.
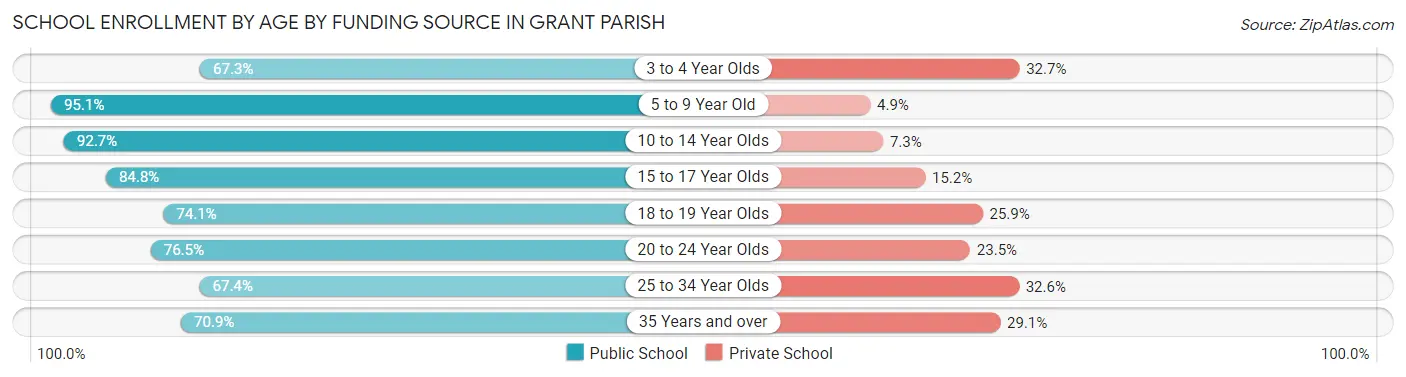
| Age Bracket | Public School | Private School |
| 3 to 4 Year Olds | 214 (67.3%) | 104 (32.7%) |
| 5 to 9 Year Old | 1,064 (95.1%) | 55 (4.9%) |
| 10 to 14 Year Olds | 1,368 (92.7%) | 108 (7.3%) |
| 15 to 17 Year Olds | 621 (84.8%) | 111 (15.2%) |
| 18 to 19 Year Olds | 86 (74.1%) | 30 (25.9%) |
| 20 to 24 Year Olds | 192 (76.5%) | 59 (23.5%) |
| 25 to 34 Year Olds | 341 (67.4%) | 165 (32.6%) |
| 35 Years and over | 107 (70.9%) | 44 (29.1%) |
| Total | 3,992 (85.5%) | 677 (14.5%) |
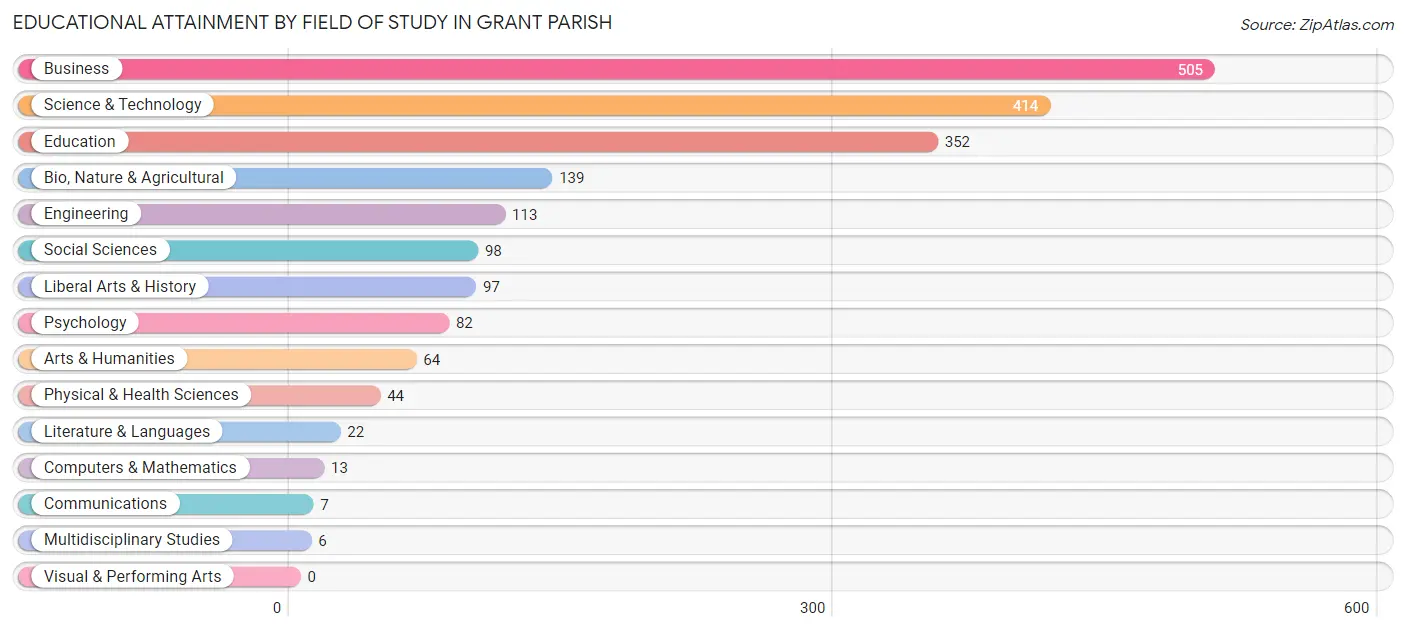
Educational Attainment by Field of Study in Grant Parish
Business (505 | 25.8%), science & technology (414 | 21.2%), education (352 | 18.0%), bio, nature & agricultural (139 | 7.1%), and engineering (113 | 5.8%) are the most common fields of study among 1,956 individuals in Grant Parish who have obtained a bachelor's degree or higher.
| Field of Study | # Graduates | % Graduates |
| Computers & Mathematics | 13 | 0.7% |
| Bio, Nature & Agricultural | 139 | 7.1% |
| Physical & Health Sciences | 44 | 2.2% |
| Psychology | 82 | 4.2% |
| Social Sciences | 98 | 5.0% |
| Engineering | 113 | 5.8% |
| Multidisciplinary Studies | 6 | 0.3% |
| Science & Technology | 414 | 21.2% |
| Business | 505 | 25.8% |
| Education | 352 | 18.0% |
| Literature & Languages | 22 | 1.1% |
| Liberal Arts & History | 97 | 5.0% |
| Visual & Performing Arts | 0 | 0.0% |
| Communications | 7 | 0.4% |
| Arts & Humanities | 64 | 3.3% |
| Total | 1,956 | 100.0% |
Transportation & Commute in Grant Parish
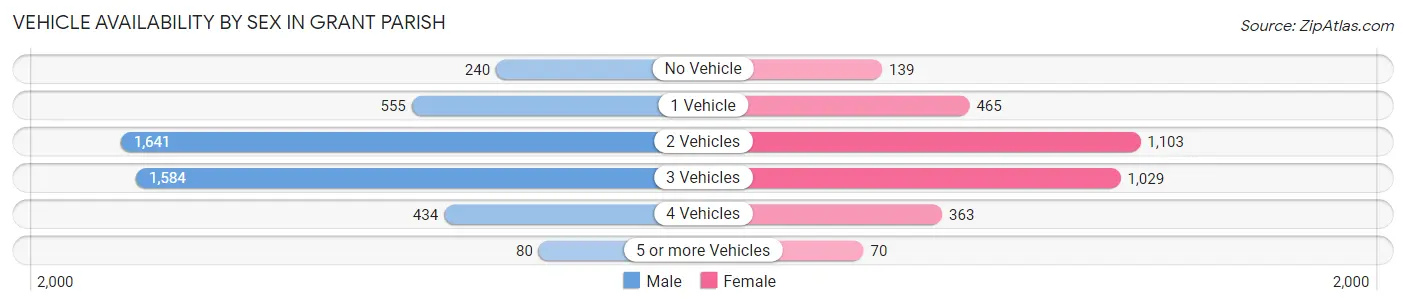
Vehicle Availability by Sex in Grant Parish
The most prevalent vehicle ownership categories in Grant Parish are males with 2 vehicles (1,641, accounting for 36.2%) and females with 2 vehicles (1,103, making up 51.8%).
| Vehicles Available | Male | Female |
| No Vehicle | 240 (5.3%) | 139 (4.4%) |
| 1 Vehicle | 555 (12.2%) | 465 (14.7%) |
| 2 Vehicles | 1,641 (36.2%) | 1,103 (34.8%) |
| 3 Vehicles | 1,584 (34.9%) | 1,029 (32.5%) |
| 4 Vehicles | 434 (9.6%) | 363 (11.5%) |
| 5 or more Vehicles | 80 (1.8%) | 70 (2.2%) |
| Total | 4,534 (100.0%) | 3,169 (100.0%) |
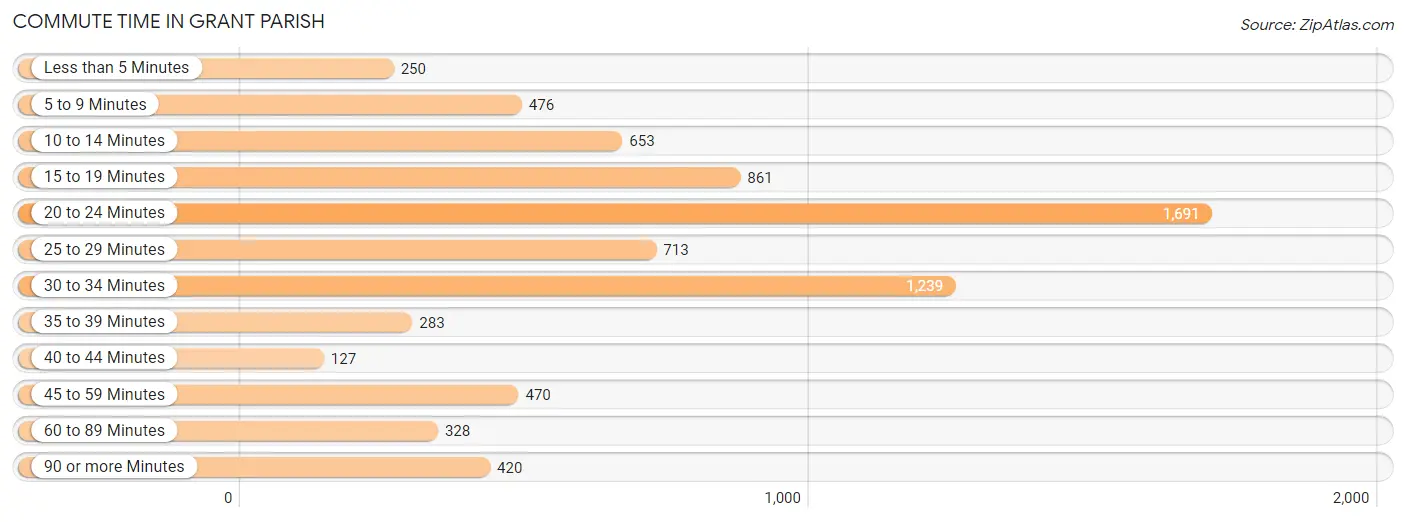
Commute Time in Grant Parish
The most frequently occuring commute durations in Grant Parish are 20 to 24 minutes (1,691 commuters, 22.5%), 30 to 34 minutes (1,239 commuters, 16.5%), and 15 to 19 minutes (861 commuters, 11.5%).
| Commute Time | # Commuters | % Commuters |
| Less than 5 Minutes | 250 | 3.3% |
| 5 to 9 Minutes | 476 | 6.3% |
| 10 to 14 Minutes | 653 | 8.7% |
| 15 to 19 Minutes | 861 | 11.5% |
| 20 to 24 Minutes | 1,691 | 22.5% |
| 25 to 29 Minutes | 713 | 9.5% |
| 30 to 34 Minutes | 1,239 | 16.5% |
| 35 to 39 Minutes | 283 | 3.8% |
| 40 to 44 Minutes | 127 | 1.7% |
| 45 to 59 Minutes | 470 | 6.3% |
| 60 to 89 Minutes | 328 | 4.4% |
| 90 or more Minutes | 420 | 5.6% |
Commute Time by Sex in Grant Parish
The most common commute times in Grant Parish are 20 to 24 minutes (884 commuters, 20.1%) for males and 20 to 24 minutes (807 commuters, 25.9%) for females.
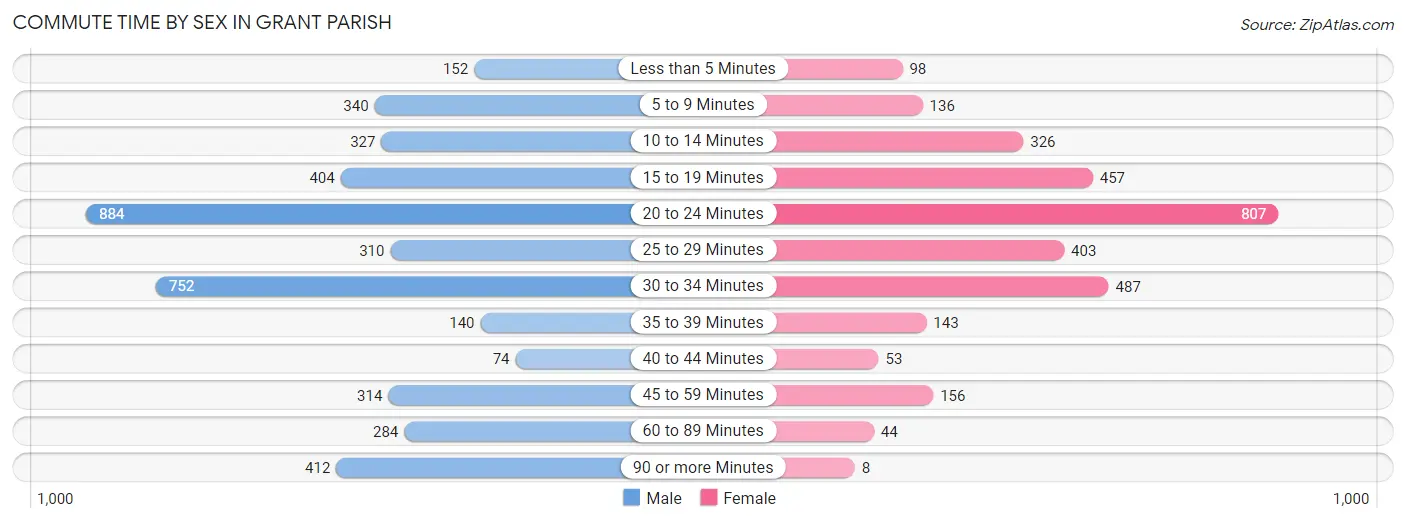
| Commute Time | Male | Female |
| Less than 5 Minutes | 152 (3.5%) | 98 (3.1%) |
| 5 to 9 Minutes | 340 (7.7%) | 136 (4.4%) |
| 10 to 14 Minutes | 327 (7.4%) | 326 (10.5%) |
| 15 to 19 Minutes | 404 (9.2%) | 457 (14.7%) |
| 20 to 24 Minutes | 884 (20.1%) | 807 (25.9%) |
| 25 to 29 Minutes | 310 (7.1%) | 403 (12.9%) |
| 30 to 34 Minutes | 752 (17.1%) | 487 (15.6%) |
| 35 to 39 Minutes | 140 (3.2%) | 143 (4.6%) |
| 40 to 44 Minutes | 74 (1.7%) | 53 (1.7%) |
| 45 to 59 Minutes | 314 (7.1%) | 156 (5.0%) |
| 60 to 89 Minutes | 284 (6.5%) | 44 (1.4%) |
| 90 or more Minutes | 412 (9.4%) | 8 (0.3%) |
Time of Departure to Work by Sex in Grant Parish
The most frequent times of departure to work in Grant Parish are 7:00 AM to 7:29 AM (825, 18.8%) for males and 7:00 AM to 7:29 AM (793, 25.4%) for females.
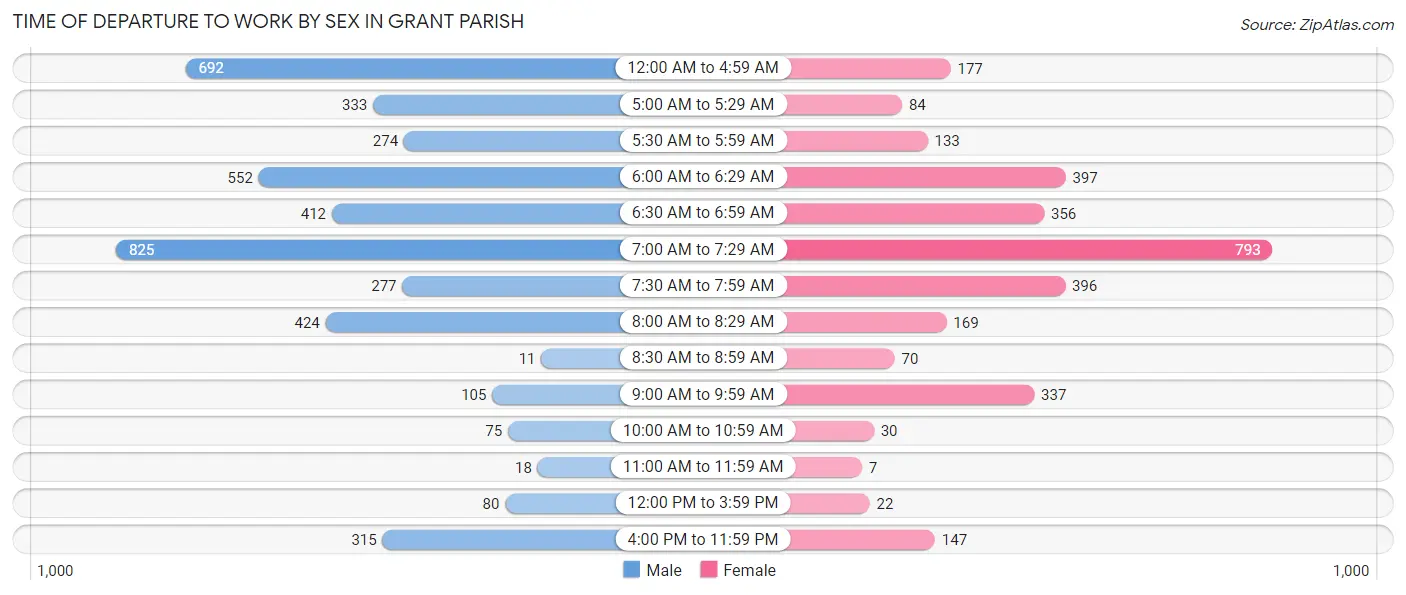
| Time of Departure | Male | Female |
| 12:00 AM to 4:59 AM | 692 (15.8%) | 177 (5.7%) |
| 5:00 AM to 5:29 AM | 333 (7.6%) | 84 (2.7%) |
| 5:30 AM to 5:59 AM | 274 (6.2%) | 133 (4.3%) |
| 6:00 AM to 6:29 AM | 552 (12.6%) | 397 (12.7%) |
| 6:30 AM to 6:59 AM | 412 (9.4%) | 356 (11.4%) |
| 7:00 AM to 7:29 AM | 825 (18.8%) | 793 (25.4%) |
| 7:30 AM to 7:59 AM | 277 (6.3%) | 396 (12.7%) |
| 8:00 AM to 8:29 AM | 424 (9.7%) | 169 (5.4%) |
| 8:30 AM to 8:59 AM | 11 (0.3%) | 70 (2.2%) |
| 9:00 AM to 9:59 AM | 105 (2.4%) | 337 (10.8%) |
| 10:00 AM to 10:59 AM | 75 (1.7%) | 30 (1.0%) |
| 11:00 AM to 11:59 AM | 18 (0.4%) | 7 (0.2%) |
| 12:00 PM to 3:59 PM | 80 (1.8%) | 22 (0.7%) |
| 4:00 PM to 11:59 PM | 315 (7.2%) | 147 (4.7%) |
| Total | 4,393 (100.0%) | 3,118 (100.0%) |
Housing Occupancy in Grant Parish
Occupancy by Ownership in Grant Parish
Of the total 6,719 dwellings in Grant Parish, owner-occupied units account for 5,499 (81.8%), while renter-occupied units make up 1,220 (18.2%).
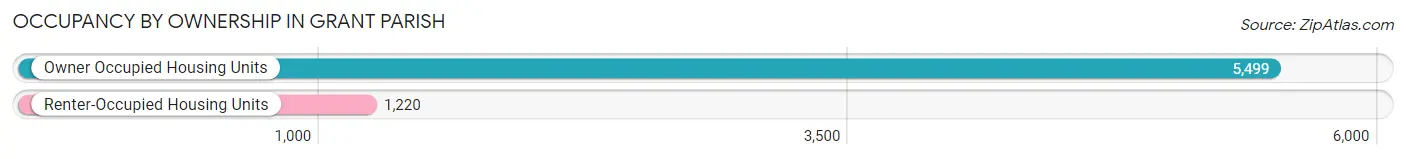
| Occupancy | # Housing Units | % Housing Units |
| Owner Occupied Housing Units | 5,499 | 81.8% |
| Renter-Occupied Housing Units | 1,220 | 18.2% |
| Total Occupied Housing Units | 6,719 | 100.0% |
Occupancy by Household Size in Grant Parish
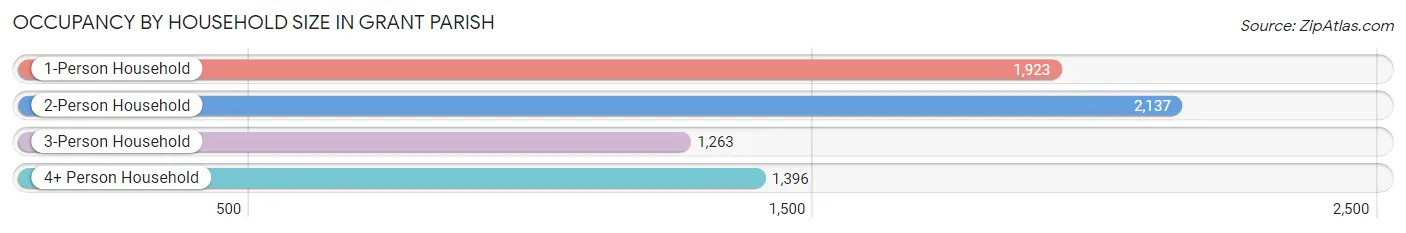
| Household Size | # Housing Units | % Housing Units |
| 1-Person Household | 1,923 | 28.6% |
| 2-Person Household | 2,137 | 31.8% |
| 3-Person Household | 1,263 | 18.8% |
| 4+ Person Household | 1,396 | 20.8% |
| Total Housing Units | 6,719 | 100.0% |
Occupancy by Ownership by Household Size in Grant Parish
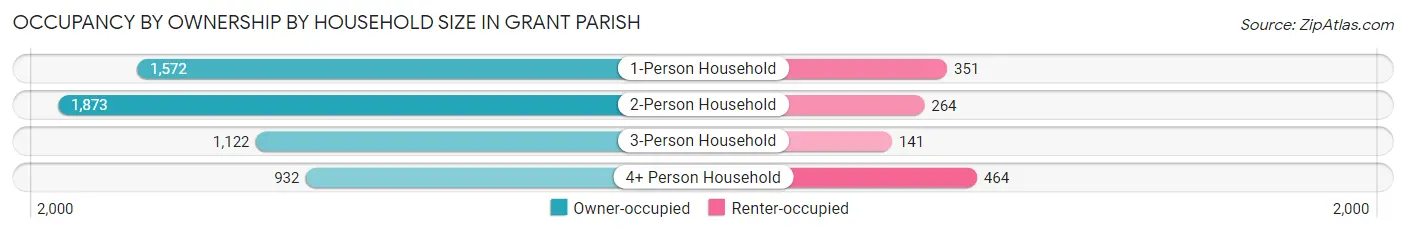
| Household Size | Owner-occupied | Renter-occupied |
| 1-Person Household | 1,572 (81.8%) | 351 (18.2%) |
| 2-Person Household | 1,873 (87.6%) | 264 (12.3%) |
| 3-Person Household | 1,122 (88.8%) | 141 (11.2%) |
| 4+ Person Household | 932 (66.8%) | 464 (33.2%) |
| Total Housing Units | 5,499 (81.8%) | 1,220 (18.2%) |
Occupancy by Educational Attainment in Grant Parish
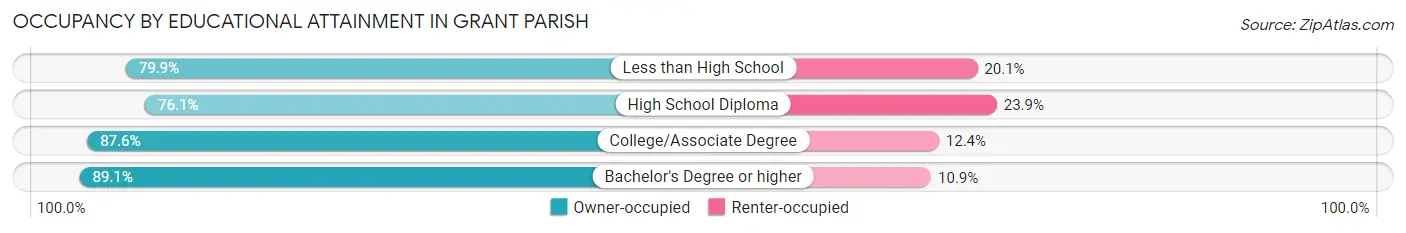
| Household Size | Owner-occupied | Renter-occupied |
| Less than High School | 609 (79.9%) | 153 (20.1%) |
| High School Diploma | 2,259 (76.1%) | 710 (23.9%) |
| College/Associate Degree | 1,796 (87.6%) | 255 (12.4%) |
| Bachelor's Degree or higher | 835 (89.1%) | 102 (10.9%) |
Occupancy by Age of Householder in Grant Parish
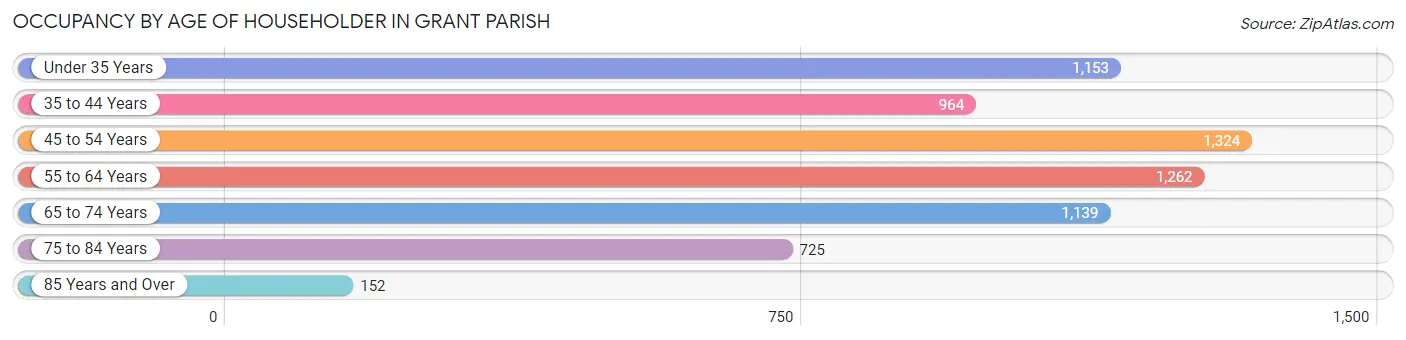
| Age Bracket | # Households | % Households |
| Under 35 Years | 1,153 | 17.2% |
| 35 to 44 Years | 964 | 14.3% |
| 45 to 54 Years | 1,324 | 19.7% |
| 55 to 64 Years | 1,262 | 18.8% |
| 65 to 74 Years | 1,139 | 17.0% |
| 75 to 84 Years | 725 | 10.8% |
| 85 Years and Over | 152 | 2.3% |
| Total | 6,719 | 100.0% |
Housing Finances in Grant Parish
Median Income by Occupancy in Grant Parish
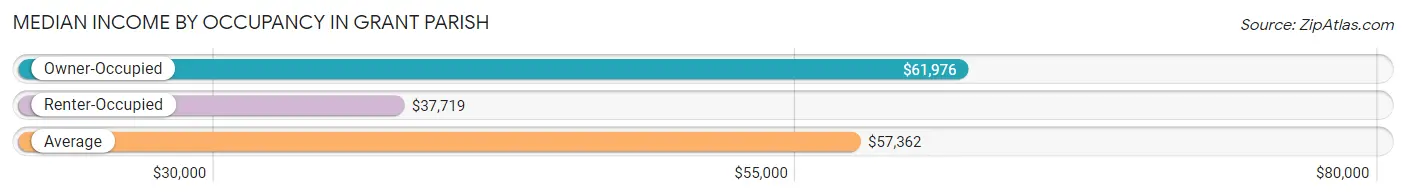
| Occupancy Type | # Households | Median Income |
| Owner-Occupied | 5,499 (81.8%) | $61,976 |
| Renter-Occupied | 1,220 (18.2%) | $37,719 |
| Average | 6,719 (100.0%) | $57,362 |
Occupancy by Householder Income Bracket in Grant Parish
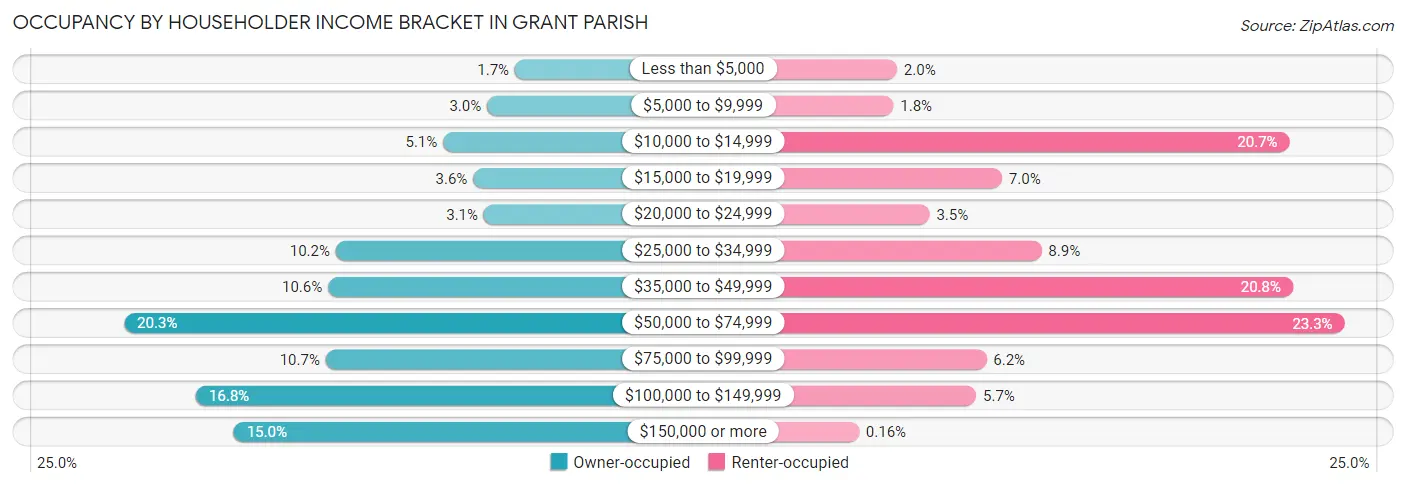
| Income Bracket | Owner-occupied | Renter-occupied |
| Less than $5,000 | 91 (1.7%) | 24 (2.0%) |
| $5,000 to $9,999 | 164 (3.0%) | 22 (1.8%) |
| $10,000 to $14,999 | 279 (5.1%) | 252 (20.7%) |
| $15,000 to $19,999 | 200 (3.6%) | 85 (7.0%) |
| $20,000 to $24,999 | 172 (3.1%) | 43 (3.5%) |
| $25,000 to $34,999 | 560 (10.2%) | 108 (8.8%) |
| $35,000 to $49,999 | 580 (10.5%) | 254 (20.8%) |
| $50,000 to $74,999 | 1,114 (20.3%) | 284 (23.3%) |
| $75,000 to $99,999 | 586 (10.7%) | 76 (6.2%) |
| $100,000 to $149,999 | 926 (16.8%) | 70 (5.7%) |
| $150,000 or more | 827 (15.0%) | 2 (0.2%) |
| Total | 5,499 (100.0%) | 1,220 (100.0%) |
Monthly Housing Cost Tiers in Grant Parish
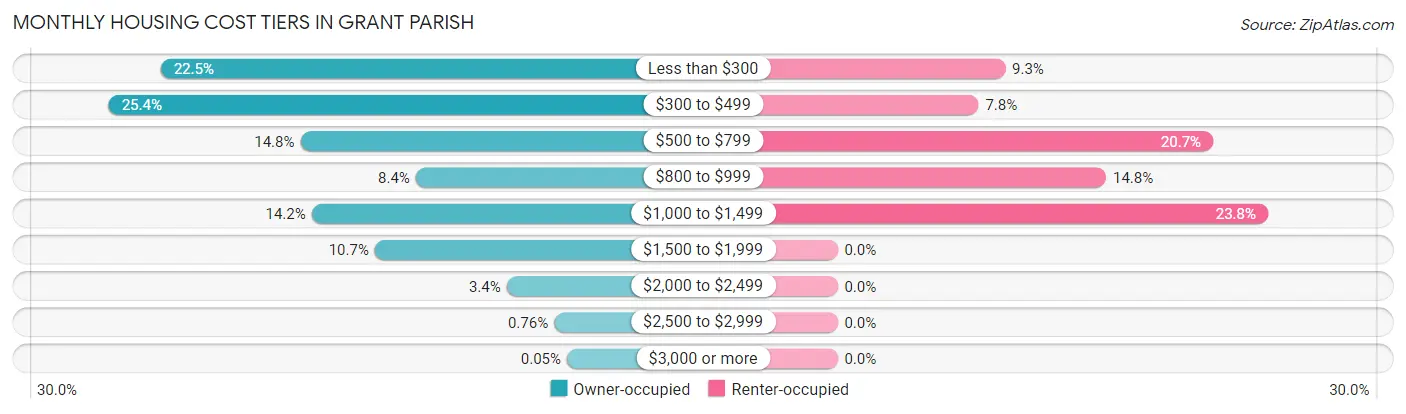
| Monthly Cost | Owner-occupied | Renter-occupied |
| Less than $300 | 1,236 (22.5%) | 113 (9.3%) |
| $300 to $499 | 1,394 (25.4%) | 95 (7.8%) |
| $500 to $799 | 812 (14.8%) | 253 (20.7%) |
| $800 to $999 | 462 (8.4%) | 181 (14.8%) |
| $1,000 to $1,499 | 778 (14.1%) | 290 (23.8%) |
| $1,500 to $1,999 | 586 (10.7%) | 0 (0.0%) |
| $2,000 to $2,499 | 186 (3.4%) | 0 (0.0%) |
| $2,500 to $2,999 | 42 (0.8%) | 0 (0.0%) |
| $3,000 or more | 3 (0.1%) | 0 (0.0%) |
| Total | 5,499 (100.0%) | 1,220 (100.0%) |
Physical Housing Characteristics in Grant Parish
Housing Structures in Grant Parish
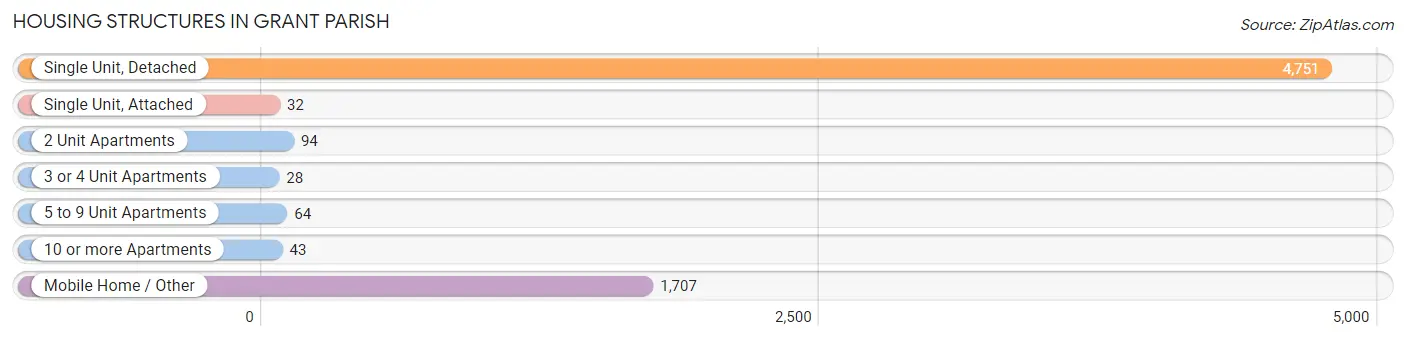
| Structure Type | # Housing Units | % Housing Units |
| Single Unit, Detached | 4,751 | 70.7% |
| Single Unit, Attached | 32 | 0.5% |
| 2 Unit Apartments | 94 | 1.4% |
| 3 or 4 Unit Apartments | 28 | 0.4% |
| 5 to 9 Unit Apartments | 64 | 0.9% |
| 10 or more Apartments | 43 | 0.6% |
| Mobile Home / Other | 1,707 | 25.4% |
| Total | 6,719 | 100.0% |
Housing Structures by Occupancy in Grant Parish
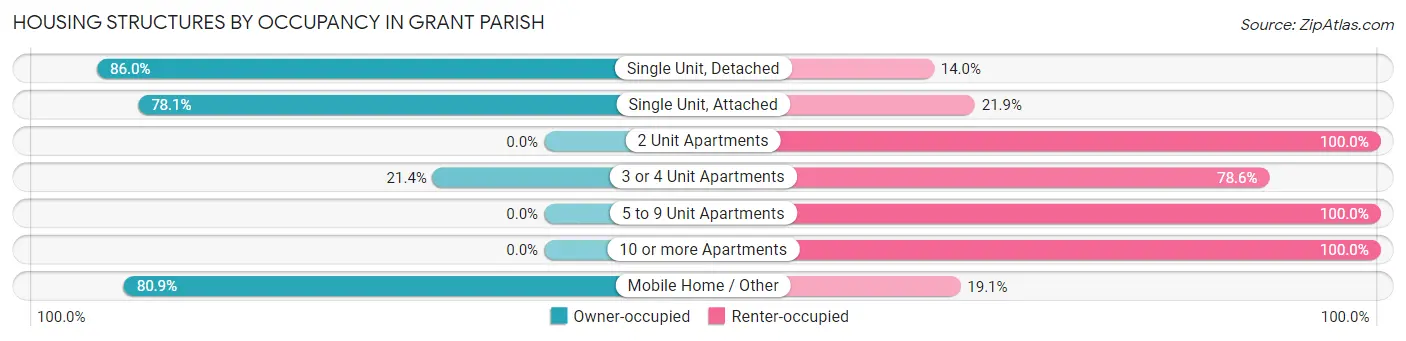
| Structure Type | Owner-occupied | Renter-occupied |
| Single Unit, Detached | 4,087 (86.0%) | 664 (14.0%) |
| Single Unit, Attached | 25 (78.1%) | 7 (21.9%) |
| 2 Unit Apartments | 0 (0.0%) | 94 (100.0%) |
| 3 or 4 Unit Apartments | 6 (21.4%) | 22 (78.6%) |
| 5 to 9 Unit Apartments | 0 (0.0%) | 64 (100.0%) |
| 10 or more Apartments | 0 (0.0%) | 43 (100.0%) |
| Mobile Home / Other | 1,381 (80.9%) | 326 (19.1%) |
| Total | 5,499 (81.8%) | 1,220 (18.2%) |
Housing Structures by Number of Rooms in Grant Parish
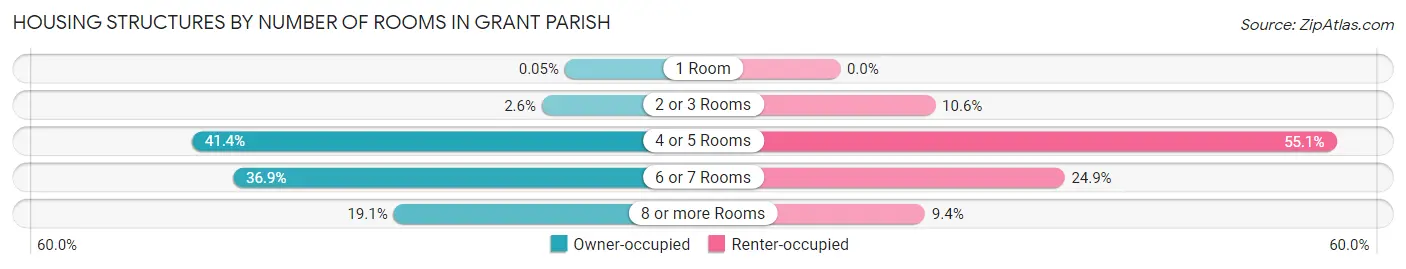
| Number of Rooms | Owner-occupied | Renter-occupied |
| 1 Room | 3 (0.1%) | 0 (0.0%) |
| 2 or 3 Rooms | 143 (2.6%) | 129 (10.6%) |
| 4 or 5 Rooms | 2,278 (41.4%) | 672 (55.1%) |
| 6 or 7 Rooms | 2,027 (36.9%) | 304 (24.9%) |
| 8 or more Rooms | 1,048 (19.1%) | 115 (9.4%) |
| Total | 5,499 (100.0%) | 1,220 (100.0%) |
Housing Structure by Heating Type in Grant Parish
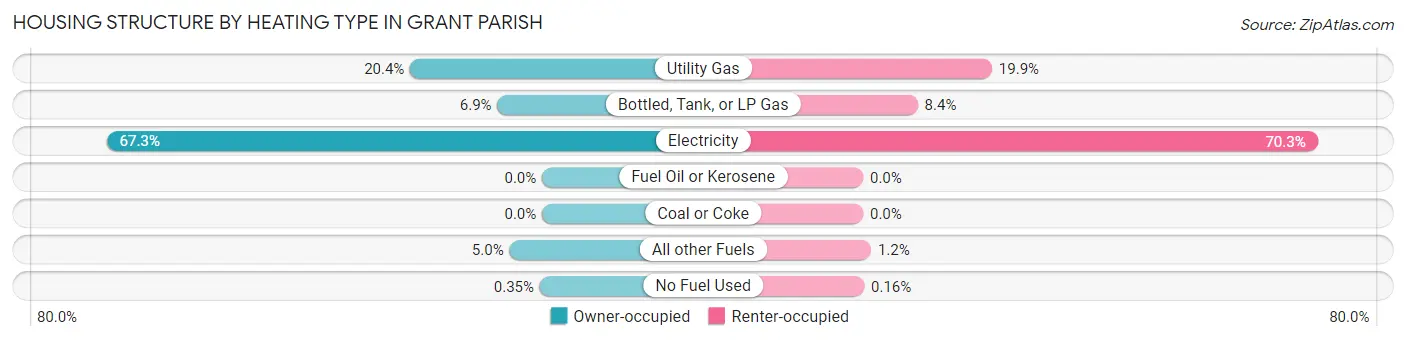
| Heating Type | Owner-occupied | Renter-occupied |
| Utility Gas | 1,121 (20.4%) | 243 (19.9%) |
| Bottled, Tank, or LP Gas | 380 (6.9%) | 103 (8.4%) |
| Electricity | 3,702 (67.3%) | 857 (70.3%) |
| Fuel Oil or Kerosene | 0 (0.0%) | 0 (0.0%) |
| Coal or Coke | 0 (0.0%) | 0 (0.0%) |
| All other Fuels | 277 (5.0%) | 15 (1.2%) |
| No Fuel Used | 19 (0.4%) | 2 (0.2%) |
| Total | 5,499 (100.0%) | 1,220 (100.0%) |
Household Vehicle Usage in Grant Parish
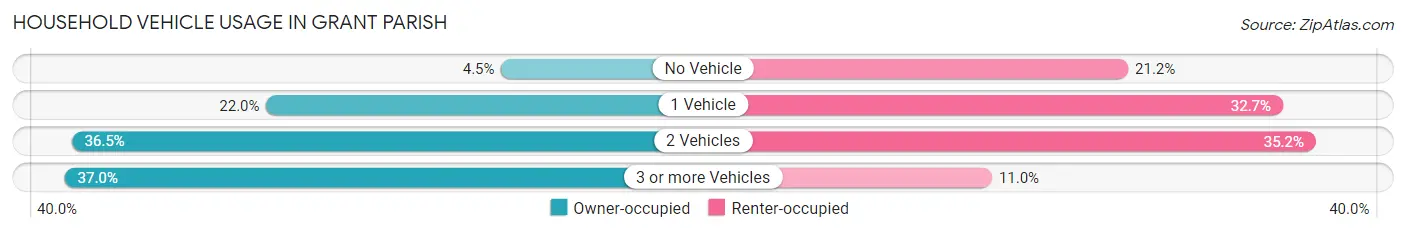
| Vehicles per Household | Owner-occupied | Renter-occupied |
| No Vehicle | 246 (4.5%) | 258 (21.1%) |
| 1 Vehicle | 1,211 (22.0%) | 399 (32.7%) |
| 2 Vehicles | 2,007 (36.5%) | 429 (35.2%) |
| 3 or more Vehicles | 2,035 (37.0%) | 134 (11.0%) |
| Total | 5,499 (100.0%) | 1,220 (100.0%) |
Real Estate & Mortgages in Grant Parish
Real Estate and Mortgage Overview in Grant Parish
| Characteristic | Without Mortgage | With Mortgage |
| Housing Units | 3,187 | 2,312 |
| Median Property Value | $99,700 | $162,000 |
| Median Household Income | $52,956 | $567 |
| Monthly Housing Costs | $346 | $3 |
| Real Estate Taxes | $594 | $789 |
Property Value by Mortgage Status in Grant Parish
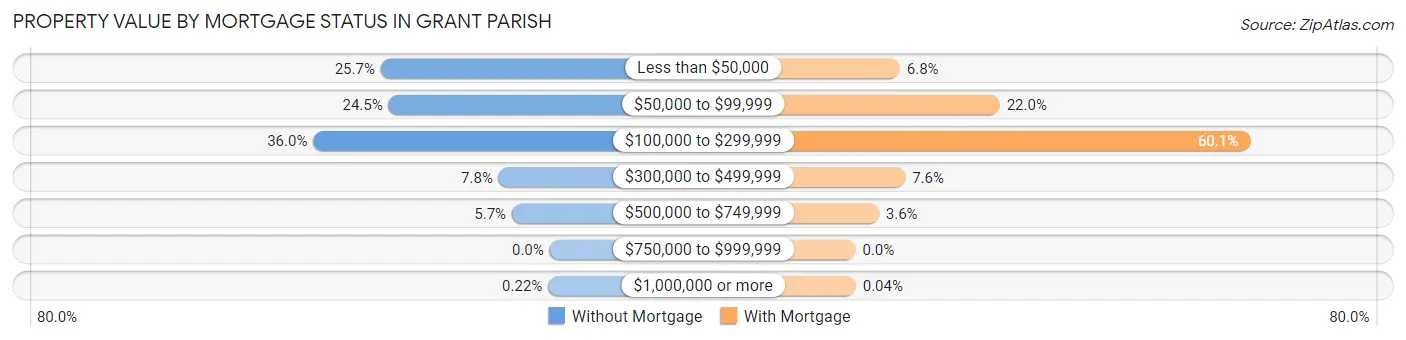
| Property Value | Without Mortgage | With Mortgage |
| Less than $50,000 | 820 (25.7%) | 156 (6.8%) |
| $50,000 to $99,999 | 782 (24.5%) | 508 (22.0%) |
| $100,000 to $299,999 | 1,148 (36.0%) | 1,390 (60.1%) |
| $300,000 to $499,999 | 247 (7.7%) | 175 (7.6%) |
| $500,000 to $749,999 | 183 (5.7%) | 82 (3.5%) |
| $750,000 to $999,999 | 0 (0.0%) | 0 (0.0%) |
| $1,000,000 or more | 7 (0.2%) | 1 (0.0%) |
| Total | 3,187 (100.0%) | 2,312 (100.0%) |
Household Income by Mortgage Status in Grant Parish
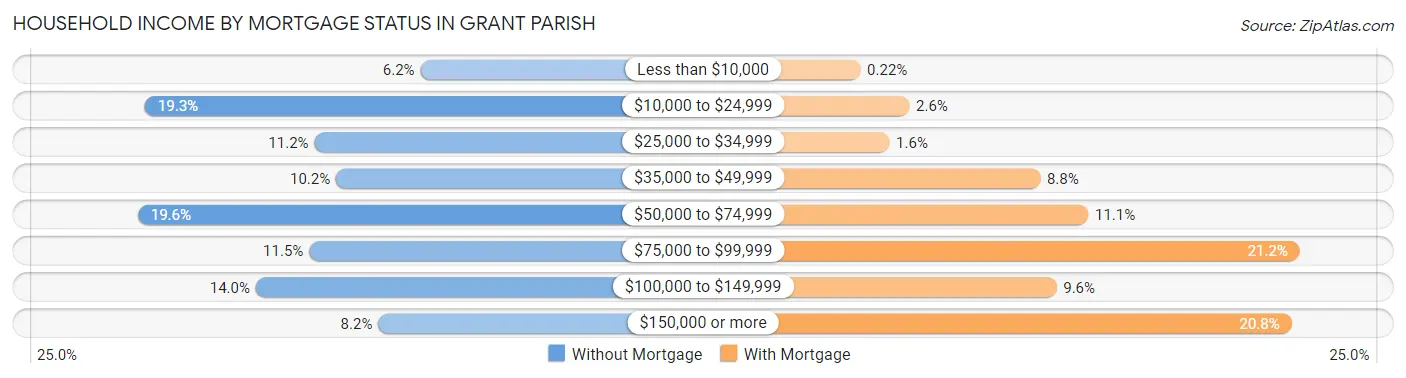
| Household Income | Without Mortgage | With Mortgage |
| Less than $10,000 | 196 (6.1%) | 5 (0.2%) |
| $10,000 to $24,999 | 614 (19.3%) | 59 (2.5%) |
| $25,000 to $34,999 | 357 (11.2%) | 37 (1.6%) |
| $35,000 to $49,999 | 324 (10.2%) | 203 (8.8%) |
| $50,000 to $74,999 | 625 (19.6%) | 256 (11.1%) |
| $75,000 to $99,999 | 365 (11.5%) | 489 (21.1%) |
| $100,000 to $149,999 | 446 (14.0%) | 221 (9.6%) |
| $150,000 or more | 260 (8.2%) | 480 (20.8%) |
| Total | 3,187 (100.0%) | 2,312 (100.0%) |
Property Value to Household Income Ratio in Grant Parish
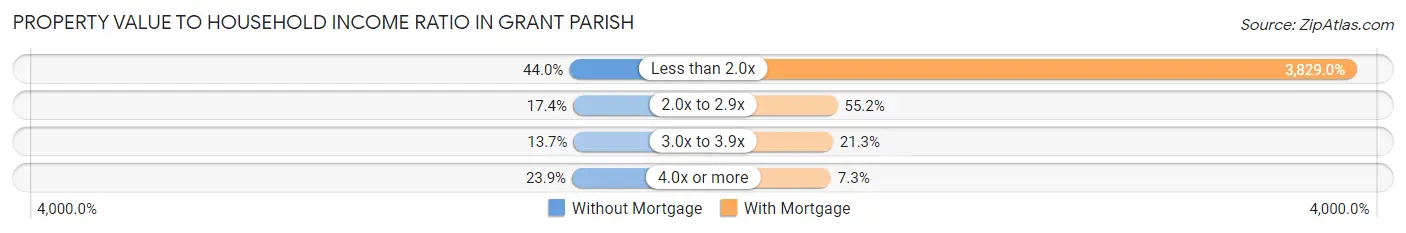
| Value-to-Income Ratio | Without Mortgage | With Mortgage |
| Less than 2.0x | 1,403 (44.0%) | 88,526 (3,829.0%) |
| 2.0x to 2.9x | 553 (17.3%) | 1,277 (55.2%) |
| 3.0x to 3.9x | 435 (13.7%) | 492 (21.3%) |
| 4.0x or more | 763 (23.9%) | 169 (7.3%) |
| Total | 3,187 (100.0%) | 2,312 (100.0%) |
Real Estate Taxes by Mortgage Status in Grant Parish
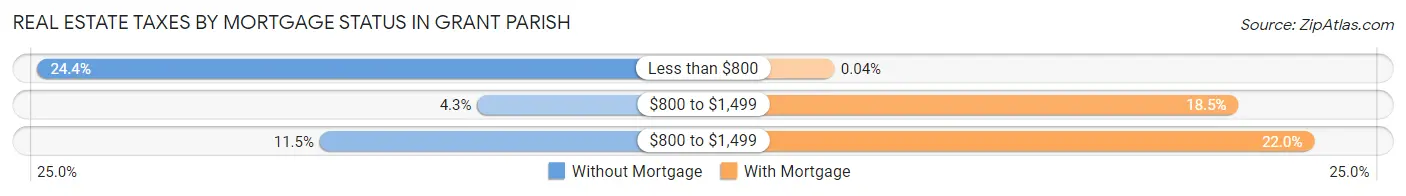
| Property Taxes | Without Mortgage | With Mortgage |
| Less than $800 | 778 (24.4%) | 1 (0.0%) |
| $800 to $1,499 | 138 (4.3%) | 428 (18.5%) |
| $800 to $1,499 | 367 (11.5%) | 508 (22.0%) |
| Total | 3,187 (100.0%) | 2,312 (100.0%) |
Health & Disability in Grant Parish
Health Insurance Coverage by Age in Grant Parish
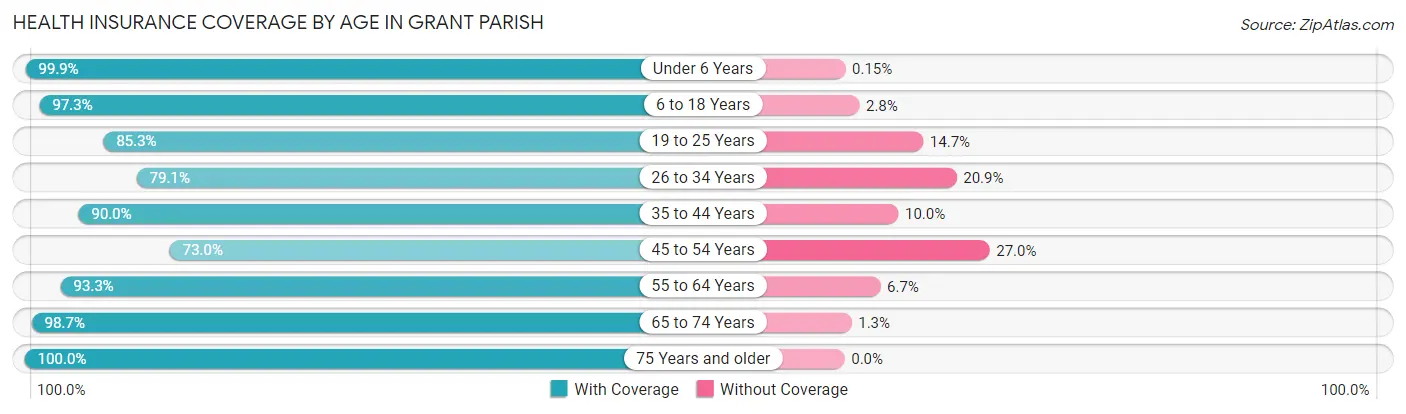
| Age Bracket | With Coverage | Without Coverage |
| Under 6 Years | 1,305 (99.9%) | 2 (0.2%) |
| 6 to 18 Years | 3,501 (97.3%) | 99 (2.8%) |
| 19 to 25 Years | 1,519 (85.3%) | 261 (14.7%) |
| 26 to 34 Years | 1,719 (79.1%) | 454 (20.9%) |
| 35 to 44 Years | 2,063 (90.0%) | 230 (10.0%) |
| 45 to 54 Years | 1,684 (73.0%) | 624 (27.0%) |
| 55 to 64 Years | 2,306 (93.3%) | 165 (6.7%) |
| 65 to 74 Years | 1,972 (98.7%) | 26 (1.3%) |
| 75 Years and older | 1,220 (100.0%) | 0 (0.0%) |
| Total | 17,289 (90.3%) | 1,861 (9.7%) |
Health Insurance Coverage by Citizenship Status in Grant Parish
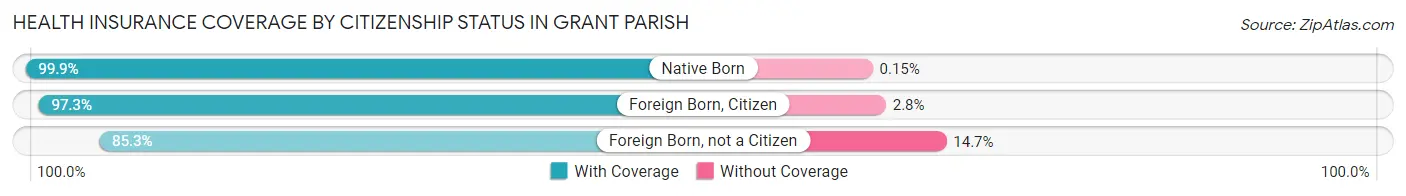
| Citizenship Status | With Coverage | Without Coverage |
| Native Born | 1,305 (99.9%) | 2 (0.2%) |
| Foreign Born, Citizen | 3,501 (97.3%) | 99 (2.8%) |
| Foreign Born, not a Citizen | 1,519 (85.3%) | 261 (14.7%) |
Health Insurance Coverage by Household Income in Grant Parish
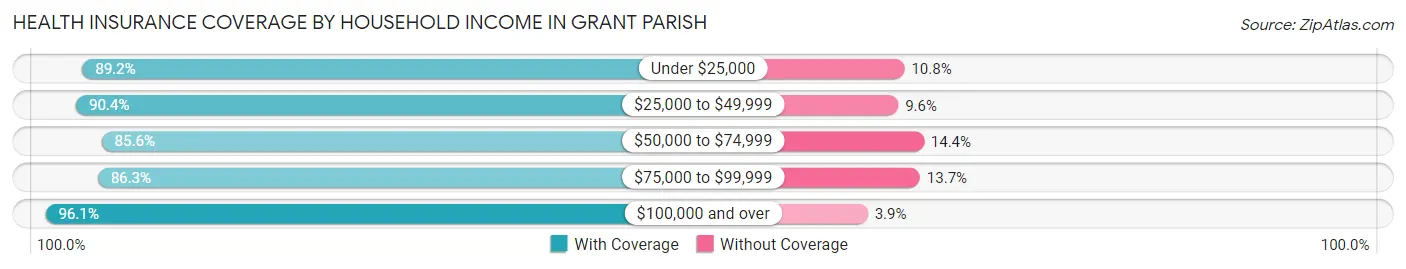
| Household Income | With Coverage | Without Coverage |
| Under $25,000 | 2,038 (89.2%) | 247 (10.8%) |
| $25,000 to $49,999 | 4,060 (90.4%) | 433 (9.6%) |
| $50,000 to $74,999 | 4,069 (85.6%) | 687 (14.4%) |
| $75,000 to $99,999 | 1,733 (86.3%) | 275 (13.7%) |
| $100,000 and over | 5,374 (96.1%) | 219 (3.9%) |
Public vs Private Health Insurance Coverage by Age in Grant Parish
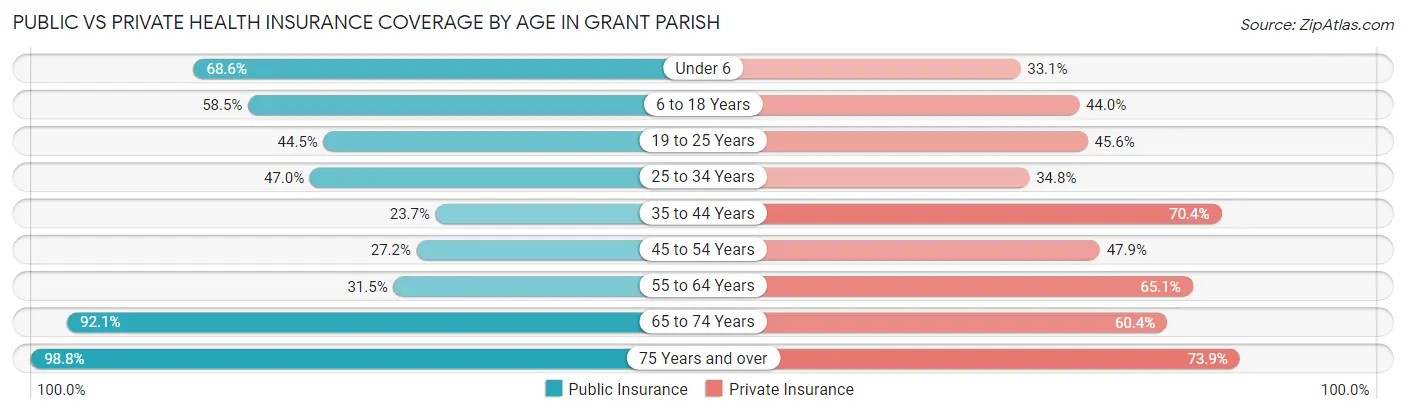
| Age Bracket | Public Insurance | Private Insurance |
| Under 6 | 897 (68.6%) | 433 (33.1%) |
| 6 to 18 Years | 2,106 (58.5%) | 1,585 (44.0%) |
| 19 to 25 Years | 792 (44.5%) | 812 (45.6%) |
| 25 to 34 Years | 1,022 (47.0%) | 756 (34.8%) |
| 35 to 44 Years | 543 (23.7%) | 1,615 (70.4%) |
| 45 to 54 Years | 628 (27.2%) | 1,105 (47.9%) |
| 55 to 64 Years | 779 (31.5%) | 1,609 (65.1%) |
| 65 to 74 Years | 1,840 (92.1%) | 1,206 (60.4%) |
| 75 Years and over | 1,205 (98.8%) | 901 (73.9%) |
| Total | 9,812 (51.2%) | 10,022 (52.3%) |
Disability Status by Sex by Age in Grant Parish
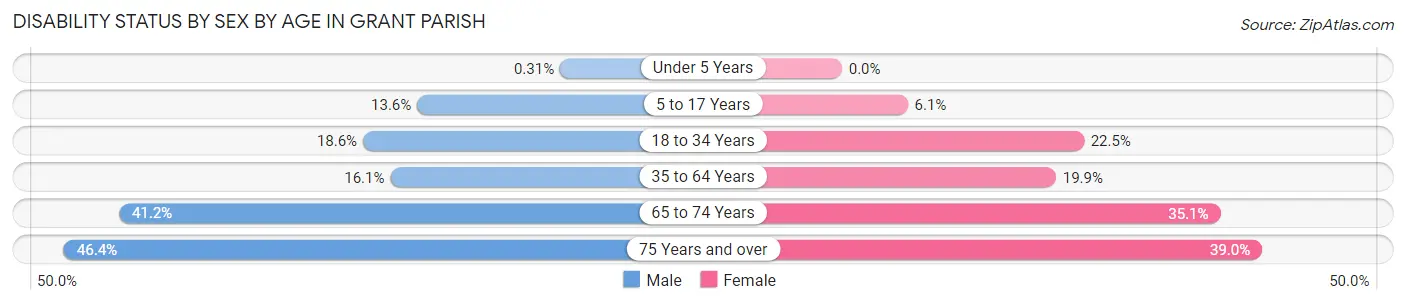
| Age Bracket | Male | Female |
| Under 5 Years | 2 (0.3%) | 0 (0.0%) |
| 5 to 17 Years | 243 (13.6%) | 98 (6.1%) |
| 18 to 34 Years | 415 (18.6%) | 456 (22.5%) |
| 35 to 64 Years | 565 (16.1%) | 706 (19.9%) |
| 65 to 74 Years | 379 (41.2%) | 379 (35.1%) |
| 75 Years and over | 241 (46.4%) | 273 (39.0%) |
Disability Class by Sex by Age in Grant Parish
Disability Class: Hearing Difficulty
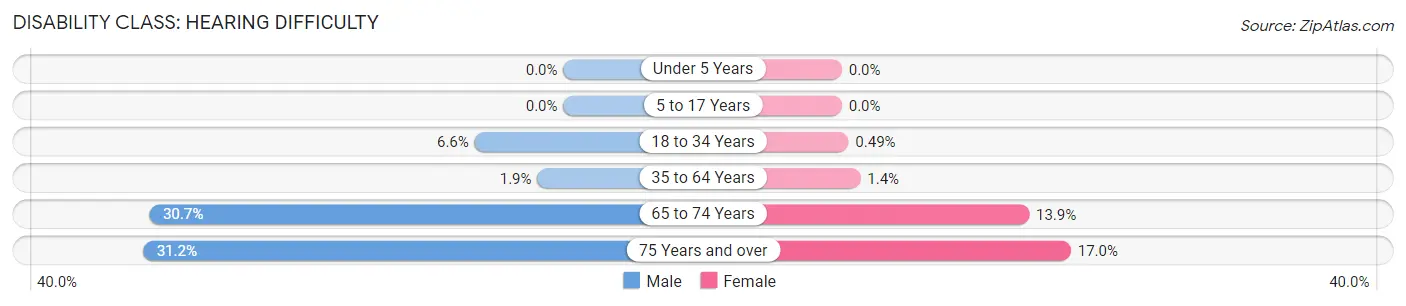
| Age Bracket | Male | Female |
| Under 5 Years | 0 (0.0%) | 0 (0.0%) |
| 5 to 17 Years | 0 (0.0%) | 0 (0.0%) |
| 18 to 34 Years | 147 (6.6%) | 10 (0.5%) |
| 35 to 64 Years | 68 (1.9%) | 49 (1.4%) |
| 65 to 74 Years | 282 (30.7%) | 150 (13.9%) |
| 75 Years and over | 162 (31.1%) | 119 (17.0%) |
Disability Class: Vision Difficulty
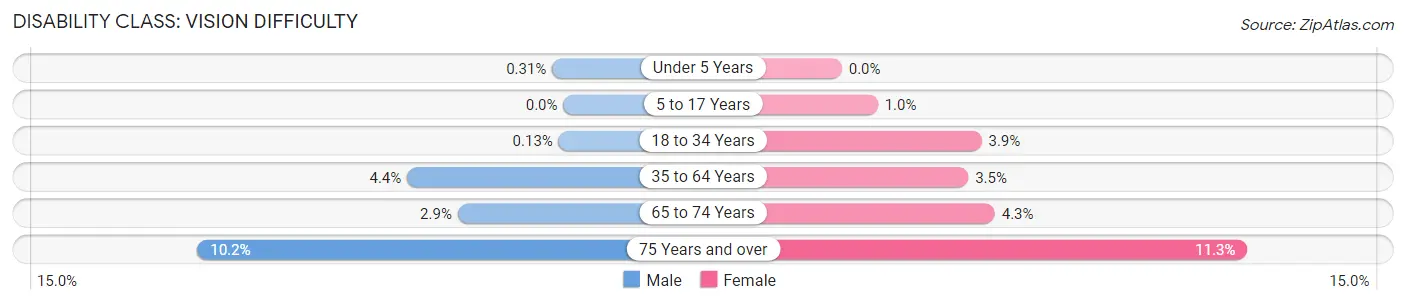
| Age Bracket | Male | Female |
| Under 5 Years | 2 (0.3%) | 0 (0.0%) |
| 5 to 17 Years | 0 (0.0%) | 16 (1.0%) |
| 18 to 34 Years | 3 (0.1%) | 79 (3.9%) |
| 35 to 64 Years | 153 (4.3%) | 125 (3.5%) |
| 65 to 74 Years | 27 (2.9%) | 46 (4.3%) |
| 75 Years and over | 53 (10.2%) | 79 (11.3%) |
Disability Class: Cognitive Difficulty
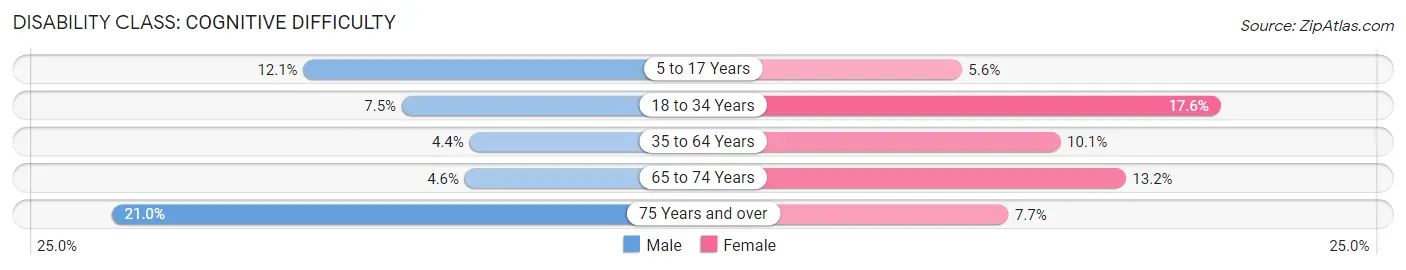
| Age Bracket | Male | Female |
| 5 to 17 Years | 216 (12.1%) | 89 (5.6%) |
| 18 to 34 Years | 167 (7.5%) | 357 (17.6%) |
| 35 to 64 Years | 153 (4.3%) | 360 (10.1%) |
| 65 to 74 Years | 42 (4.6%) | 142 (13.2%) |
| 75 Years and over | 109 (21.0%) | 54 (7.7%) |
Disability Class: Ambulatory Difficulty
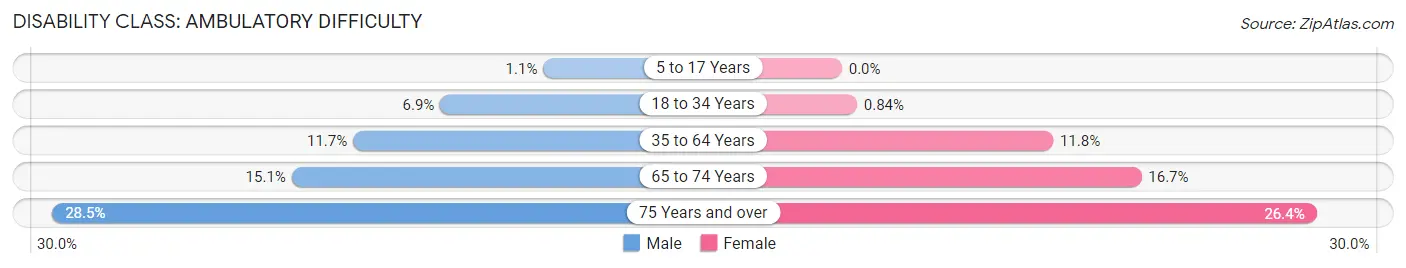
| Age Bracket | Male | Female |
| 5 to 17 Years | 20 (1.1%) | 0 (0.0%) |
| 18 to 34 Years | 153 (6.9%) | 17 (0.8%) |
| 35 to 64 Years | 412 (11.7%) | 418 (11.8%) |
| 65 to 74 Years | 139 (15.1%) | 180 (16.7%) |
| 75 Years and over | 148 (28.5%) | 185 (26.4%) |
Disability Class: Self-Care Difficulty
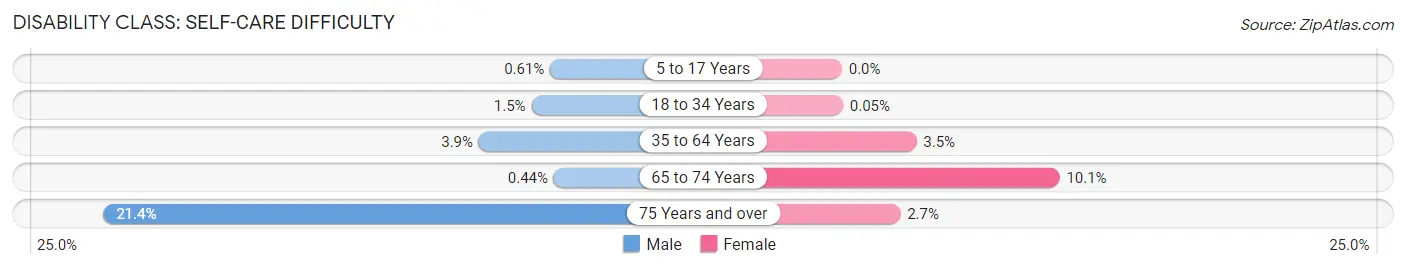
| Age Bracket | Male | Female |
| 5 to 17 Years | 11 (0.6%) | 0 (0.0%) |
| 18 to 34 Years | 33 (1.5%) | 1 (0.1%) |
| 35 to 64 Years | 138 (3.9%) | 123 (3.5%) |
| 65 to 74 Years | 4 (0.4%) | 109 (10.1%) |
| 75 Years and over | 111 (21.3%) | 19 (2.7%) |
Technology Access in Grant Parish
Computing Device Access in Grant Parish
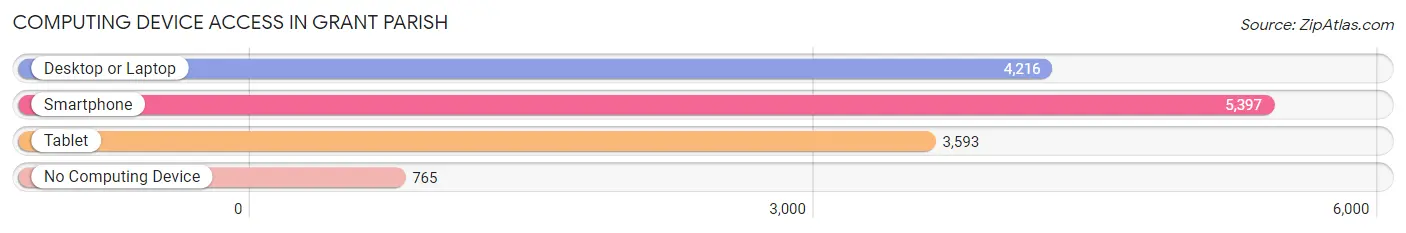
| Device Type | # Households | % Households |
| Desktop or Laptop | 4,216 | 62.7% |
| Smartphone | 5,397 | 80.3% |
| Tablet | 3,593 | 53.5% |
| No Computing Device | 765 | 11.4% |
| Total | 6,719 | 100.0% |
Internet Access in Grant Parish
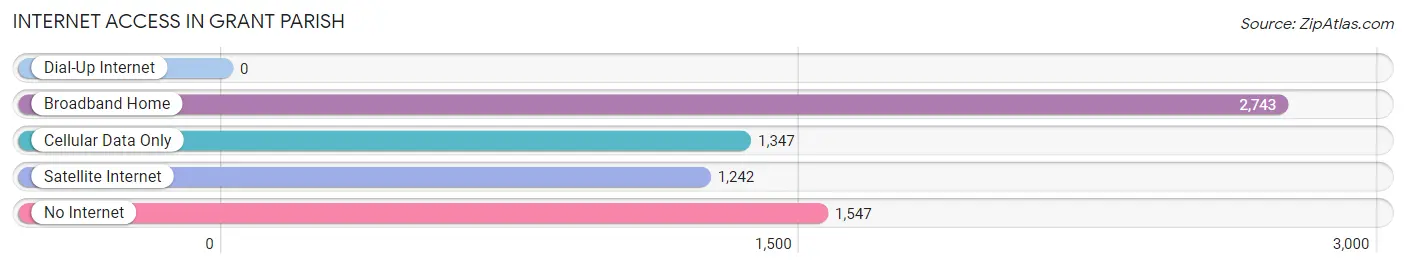
| Internet Type | # Households | % Households |
| Dial-Up Internet | 0 | 0.0% |
| Broadband Home | 2,743 | 40.8% |
| Cellular Data Only | 1,347 | 20.1% |
| Satellite Internet | 1,242 | 18.5% |
| No Internet | 1,547 | 23.0% |
| Total | 6,719 | 100.0% |
Grant Parish Summary
Parish History
Grant Parish is located in the north-central region of Louisiana and is bordered by the Red River to the north, Natchitoches Parish to the east, Rapides Parish to the south, and LaSalle Parish to the west. The parish was established in 1869 and is named after Ulysses S. Grant, the 18th President of the United States.
The area that is now Grant Parish was originally inhabited by the Caddo Indians, who were later displaced by French and Spanish settlers. The area was part of the Natchitoches District until 1853, when it was divided into two parishes: Rapides and Natchitoches. In 1869, Grant Parish was created from parts of both parishes.
The parish was largely rural until the early 20th century, when the timber industry began to boom. The area was home to several large sawmills, and the population began to grow rapidly. The parish seat, Colfax, was established in 1871 and named after Schuyler Colfax, the 17th Vice President of the United States.
Geography
Grant Parish is located in the north-central region of Louisiana and is bordered by the Red River to the north, Natchitoches Parish to the east, Rapides Parish to the south, and LaSalle Parish to the west. The parish covers an area of 845 square miles and has a population of 22,309 (as of the 2010 census).
The parish is mostly rural, with the majority of the land being used for agriculture. The terrain is mostly flat, with some rolling hills in the northern part of the parish. The Red River forms the northern border of the parish, and the Kisatchie National Forest is located in the western part of the parish.
Economy
The economy of Grant Parish is largely based on agriculture and timber. The parish is home to several large sawmills, and the timber industry is a major employer in the area. Other major industries include oil and gas production, manufacturing, and tourism.
The parish is also home to several large employers, including the Grant Parish School Board, the Grant Parish Sheriff’s Office, and the Grant Parish Hospital. The parish is also home to several small businesses, including restaurants, retail stores, and service providers.
Demographics
As of the 2010 census, Grant Parish had a population of 22,309. The racial makeup of the parish was 79.3% White, 18.2% African American, 0.5% Native American, 0.3% Asian, 0.1% Pacific Islander, 0.7% from other races, and 1.0% from two or more races. Hispanic or Latino of any race were 2.2% of the population.
The median income for a household in the parish was $35,945, and the median income for a family was $43,945. The per capita income for the parish was $17,845. About 17.2% of families and 21.3% of the population were below the poverty line, including 28.2% of those under age 18 and 16.2% of those age 65 or over.
Common Questions
What is the Total Population of Grant Parish?
Total Population of Grant Parish is 22,185.
What is the Total Male Population of Grant Parish?
Total Male Population of Grant Parish is 12,556.
What is the Total Female Population of Grant Parish?
Total Female Population of Grant Parish is 9,629.
What is the Ratio of Males per 100 Females in Grant Parish?
There are 130.40 Males per 100 Females in Grant Parish.
What is the Ratio of Females per 100 Males in Grant Parish?
There are 76.69 Females per 100 Males in Grant Parish.
What is the Median Population Age in Grant Parish?
Median Population Age in Grant Parish is 37.9 Years.
What is the Average Family Size in Grant Parish
Average Family Size in Grant Parish is 3.5 People.
What is the Average Household Size in Grant Parish
Average Household Size in Grant Parish is 2.9 People.
What is Per Capita Income in Grant Parish?
Per Capita income in Grant Parish is $25,077.
What is the Median Family Income in Grant Parish?
Median Family Income in Grant Parish is $65,681.
What is the Median Household income in Grant Parish?
Median Household Income in Grant Parish is $57,362.
What is Income or Wage Gap in Grant Parish?
Income or Wage Gap in Grant Parish is 31.2%.
Women in Grant Parish earn 68.8 cents for every dollar earned by a man.
What is Inequality or Gini Index in Grant Parish?
Inequality or Gini Index in Grant Parish is 0.43.
How Large is the Labor Force in Grant Parish?
There are 8,150 People in the Labor Forcein in Grant Parish.
What is the Percentage of People in the Labor Force in Grant Parish?
44.9% of People are in the Labor Force in Grant Parish.
What is the Unemployment Rate in Grant Parish?
Unemployment Rate in Grant Parish is 4.0%.