Franklin Parish, LA
Franklin Parish Overview
19,752
TOTAL POPULATION
9,408
MALE POPULATION
10,344
FEMALE POPULATION
90.95
MALES / 100 FEMALES
109.95
FEMALES / 100 MALES
39.0
MEDIAN AGE
3.1
AVG FAMILY SIZE
2.5
AVG HOUSEHOLD SIZE
$23,658
PER CAPITA INCOME
$50,753
AVG FAMILY INCOME
$41,129
AVG HOUSEHOLD INCOME
29.8%
WAGE / INCOME GAP [ % ]
70.2¢/ $1
WAGE / INCOME GAP [ $ ]
$13,658
FAMILY INCOME DEFICIT
0.50
INEQUALITY / GINI INDEX
7,368
LABOR FORCE [ PEOPLE ]
48.1%
PERCENT IN LABOR FORCE
9.2%
UNEMPLOYMENT RATE
Franklin Parish Area Codes
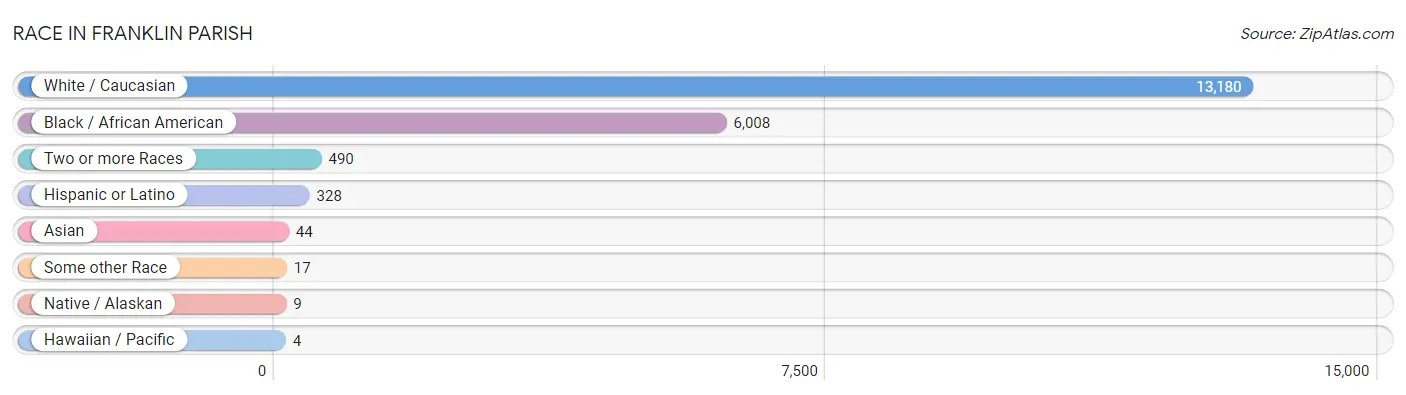
Race in Franklin Parish
The most populous races in Franklin Parish are White / Caucasian (13,180 | 66.7%), Black / African American (6,008 | 30.4%), and Two or more Races (490 | 2.5%).
| Race | # Population | % Population |
| Asian | 44 | 0.2% |
| Black / African American | 6,008 | 30.4% |
| Hawaiian / Pacific | 4 | 0.0% |
| Hispanic or Latino | 328 | 1.7% |
| Native / Alaskan | 9 | 0.1% |
| White / Caucasian | 13,180 | 66.7% |
| Two or more Races | 490 | 2.5% |
| Some other Race | 17 | 0.1% |
| Total | 19,752 | 100.0% |
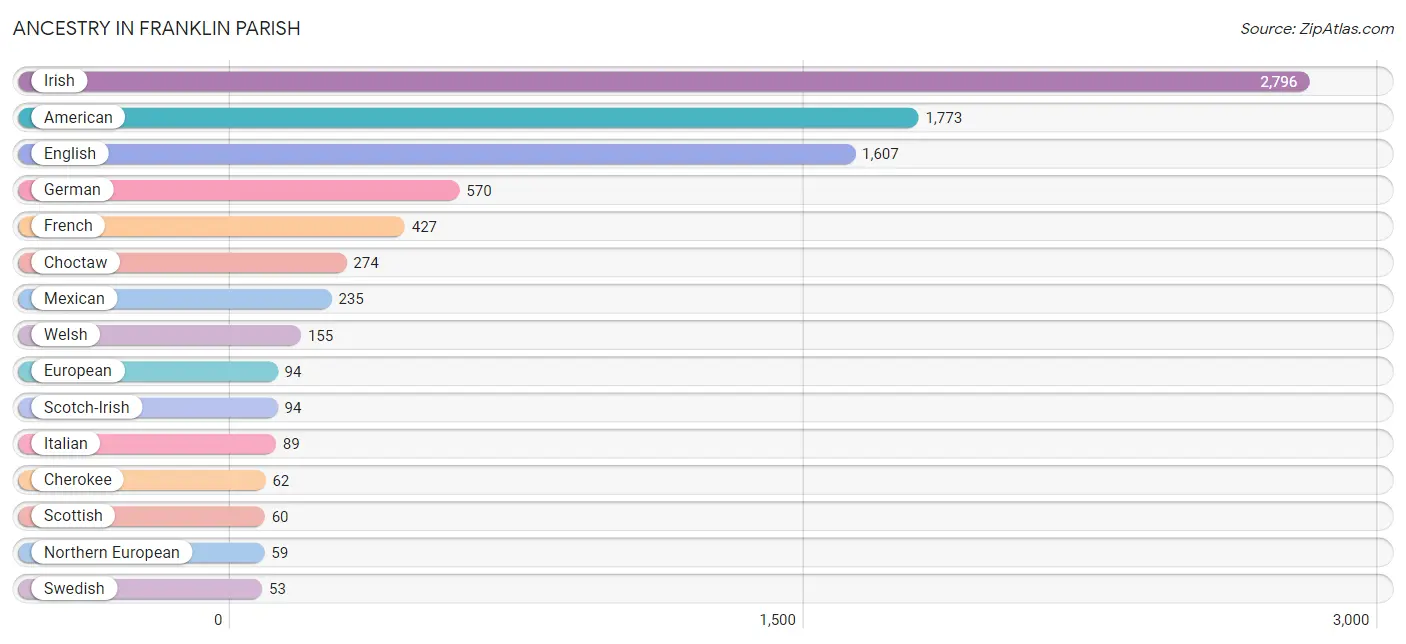
Ancestry in Franklin Parish
The most populous ancestries reported in Franklin Parish are Irish (2,796 | 14.2%), American (1,773 | 9.0%), English (1,607 | 8.1%), German (570 | 2.9%), and French (427 | 2.2%), together accounting for 36.3% of all Franklin Parish residents.
| Ancestry | # Population | % Population |
| African | 36 | 0.2% |
| American | 1,773 | 9.0% |
| Bhutanese | 15 | 0.1% |
| British | 47 | 0.2% |
| Cajun | 34 | 0.2% |
| Central American | 9 | 0.1% |
| Cherokee | 62 | 0.3% |
| Choctaw | 274 | 1.4% |
| Croatian | 17 | 0.1% |
| Cuban | 1 | 0.0% |
| Czech | 1 | 0.0% |
| Danish | 2 | 0.0% |
| Dutch | 13 | 0.1% |
| Eastern European | 5 | 0.0% |
| English | 1,607 | 8.1% |
| European | 94 | 0.5% |
| Finnish | 8 | 0.0% |
| French | 427 | 2.2% |
| French American Indian | 2 | 0.0% |
| French Canadian | 8 | 0.0% |
| German | 570 | 2.9% |
| Guamanian / Chamorro | 4 | 0.0% |
| Honduran | 9 | 0.1% |
| Irish | 2,796 | 14.2% |
| Italian | 89 | 0.4% |
| Mexican | 235 | 1.2% |
| Northern European | 59 | 0.3% |
| Norwegian | 11 | 0.1% |
| Polish | 23 | 0.1% |
| Romanian | 5 | 0.0% |
| Russian | 42 | 0.2% |
| Scandinavian | 10 | 0.1% |
| Scotch-Irish | 94 | 0.5% |
| Scottish | 60 | 0.3% |
| Spanish | 15 | 0.1% |
| Sri Lankan | 38 | 0.2% |
| Subsaharan African | 36 | 0.2% |
| Swedish | 53 | 0.3% |
| Thai | 6 | 0.0% |
| Ukrainian | 3 | 0.0% |
| Welsh | 155 | 0.8% | View All 41 Rows |
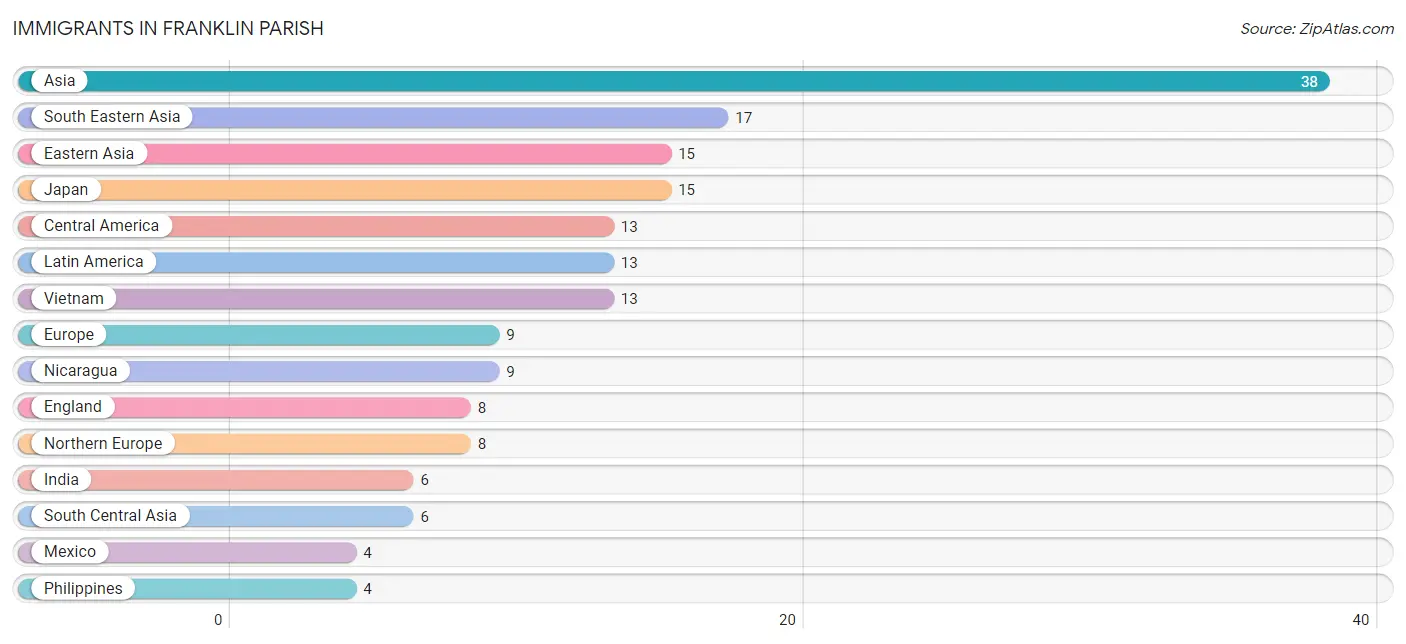
Immigrants in Franklin Parish
The most numerous immigrant groups reported in Franklin Parish came from Asia (38 | 0.2%), South Eastern Asia (17 | 0.1%), Eastern Asia (15 | 0.1%), Japan (15 | 0.1%), and Central America (13 | 0.1%), together accounting for 0.5% of all Franklin Parish residents.
| Immigration Origin | # Population | % Population |
| Asia | 38 | 0.2% |
| Central America | 13 | 0.1% |
| Eastern Asia | 15 | 0.1% |
| England | 8 | 0.0% |
| Europe | 9 | 0.1% |
| Germany | 1 | 0.0% |
| India | 6 | 0.0% |
| Japan | 15 | 0.1% |
| Latin America | 13 | 0.1% |
| Mexico | 4 | 0.0% |
| Nicaragua | 9 | 0.1% |
| Northern Europe | 8 | 0.0% |
| Philippines | 4 | 0.0% |
| South Central Asia | 6 | 0.0% |
| South Eastern Asia | 17 | 0.1% |
| Vietnam | 13 | 0.1% |
| Western Europe | 1 | 0.0% | View All 17 Rows |
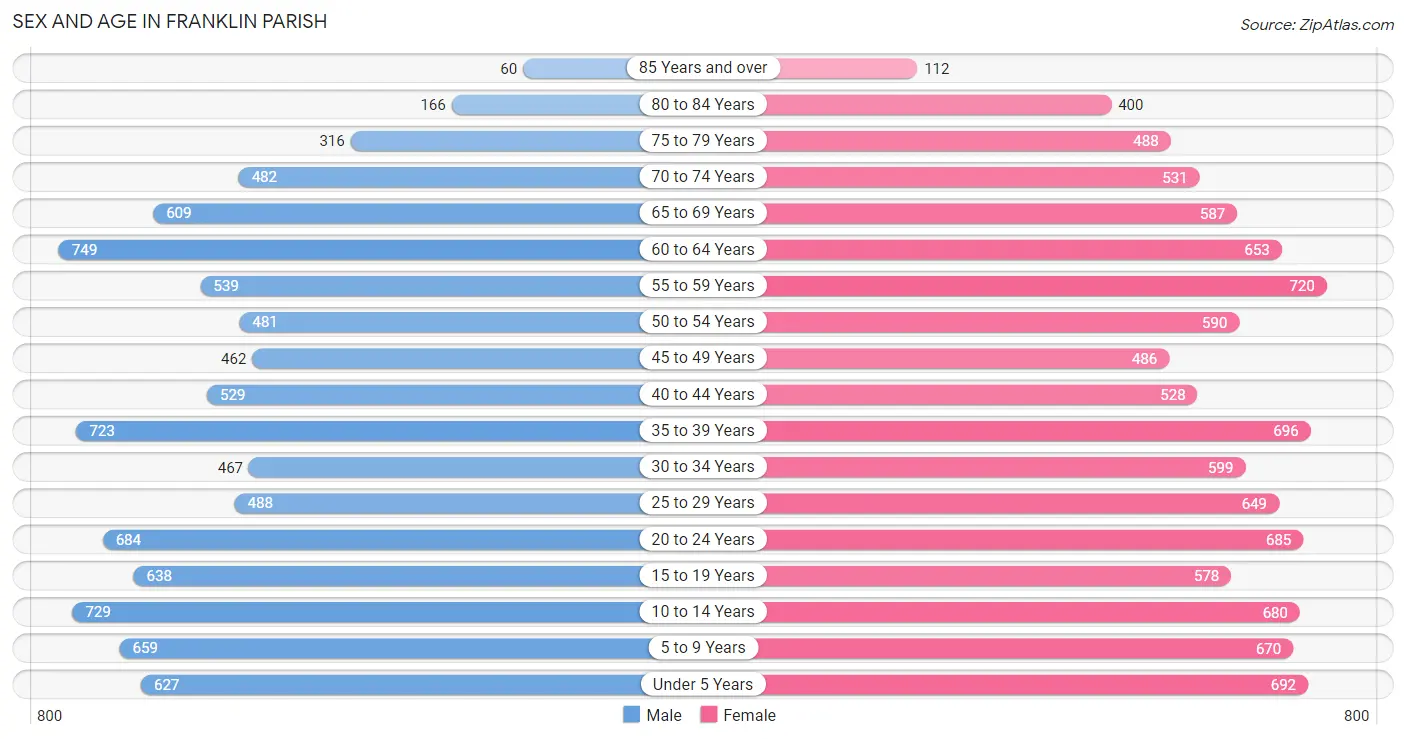
Sex and Age in Franklin Parish
Sex and Age in Franklin Parish
The most populous age groups in Franklin Parish are 60 to 64 Years (749 | 8.0%) for men and 55 to 59 Years (720 | 7.0%) for women.
| Age Bracket | Male | Female |
| Under 5 Years | 627 (6.7%) | 692 (6.7%) |
| 5 to 9 Years | 659 (7.0%) | 670 (6.5%) |
| 10 to 14 Years | 729 (7.7%) | 680 (6.6%) |
| 15 to 19 Years | 638 (6.8%) | 578 (5.6%) |
| 20 to 24 Years | 684 (7.3%) | 685 (6.6%) |
| 25 to 29 Years | 488 (5.2%) | 649 (6.3%) |
| 30 to 34 Years | 467 (5.0%) | 599 (5.8%) |
| 35 to 39 Years | 723 (7.7%) | 696 (6.7%) |
| 40 to 44 Years | 529 (5.6%) | 528 (5.1%) |
| 45 to 49 Years | 462 (4.9%) | 486 (4.7%) |
| 50 to 54 Years | 481 (5.1%) | 590 (5.7%) |
| 55 to 59 Years | 539 (5.7%) | 720 (7.0%) |
| 60 to 64 Years | 749 (8.0%) | 653 (6.3%) |
| 65 to 69 Years | 609 (6.5%) | 587 (5.7%) |
| 70 to 74 Years | 482 (5.1%) | 531 (5.1%) |
| 75 to 79 Years | 316 (3.4%) | 488 (4.7%) |
| 80 to 84 Years | 166 (1.8%) | 400 (3.9%) |
| 85 Years and over | 60 (0.6%) | 112 (1.1%) |
| Total | 9,408 (100.0%) | 10,344 (100.0%) |
Families and Households in Franklin Parish
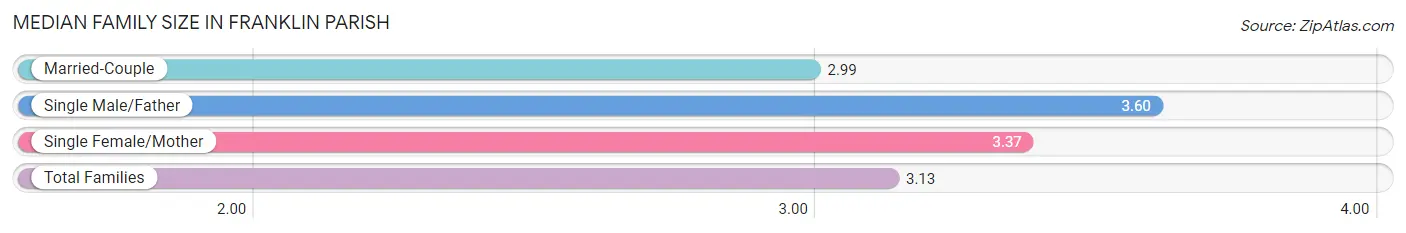
Median Family Size in Franklin Parish
The median family size in Franklin Parish is 3.13 persons per family, with single male/father families (371 | 7.3%) accounting for the largest median family size of 3.6 persons per family. On the other hand, married-couple families (3,472 | 67.9%) represent the smallest median family size with 2.99 persons per family.
| Family Type | # Families | Family Size |
| Married-Couple | 3,472 (67.9%) | 2.99 |
| Single Male/Father | 371 (7.3%) | 3.60 |
| Single Female/Mother | 1,268 (24.8%) | 3.37 |
| Total Families | 5,111 (100.0%) | 3.13 |
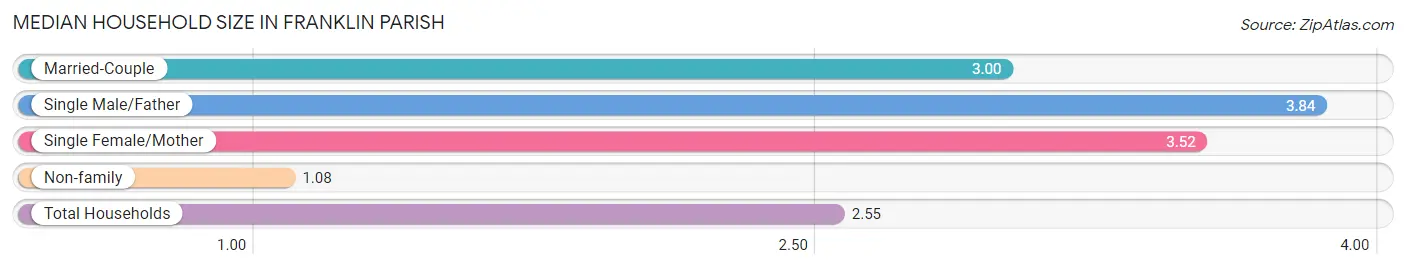
Median Household Size in Franklin Parish
The median household size in Franklin Parish is 2.55 persons per household, with single male/father households (371 | 5.1%) accounting for the largest median household size of 3.84 persons per household. non-family households (2,197 | 30.1%) represent the smallest median household size with 1.08 persons per household.
| Household Type | # Households | Household Size |
| Married-Couple | 3,472 (47.5%) | 3.00 |
| Single Male/Father | 371 (5.1%) | 3.84 |
| Single Female/Mother | 1,268 (17.3%) | 3.52 |
| Non-family | 2,197 (30.1%) | 1.08 |
| Total Households | 7,308 (100.0%) | 2.55 |
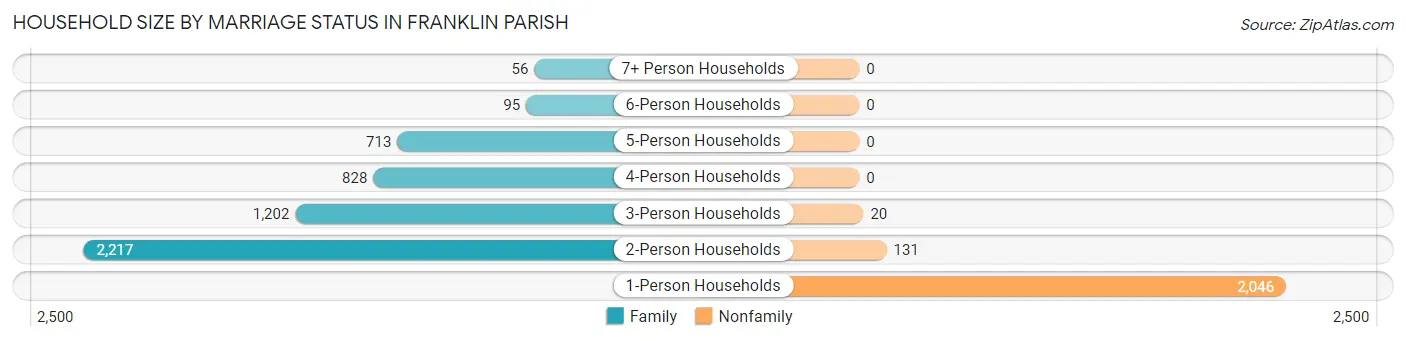
Household Size by Marriage Status in Franklin Parish
Out of a total of 7,308 households in Franklin Parish, 5,111 (69.9%) are family households, while 2,197 (30.1%) are nonfamily households. The most numerous type of family households are 2-person households, comprising 2,217, and the most common type of nonfamily households are 1-person households, comprising 2,046.
| Household Size | Family Households | Nonfamily Households |
| 1-Person Households | - | 2,046 (28.0%) |
| 2-Person Households | 2,217 (30.3%) | 131 (1.8%) |
| 3-Person Households | 1,202 (16.5%) | 20 (0.3%) |
| 4-Person Households | 828 (11.3%) | 0 (0.0%) |
| 5-Person Households | 713 (9.8%) | 0 (0.0%) |
| 6-Person Households | 95 (1.3%) | 0 (0.0%) |
| 7+ Person Households | 56 (0.8%) | 0 (0.0%) |
| Total | 5,111 (69.9%) | 2,197 (30.1%) |
Female Fertility in Franklin Parish
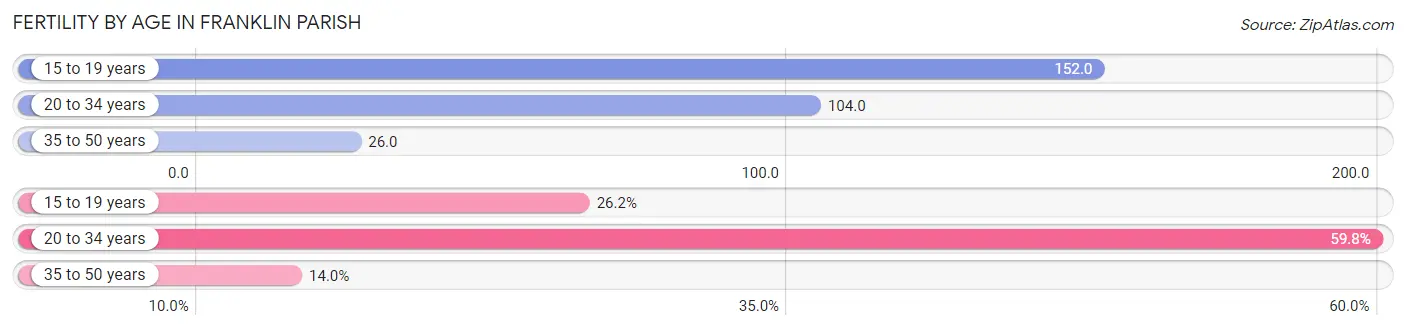
Fertility by Age in Franklin Parish
Average fertility rate in Franklin Parish is 78.0 births per 1,000 women. Women in the age bracket of 15 to 19 years have the highest fertility rate with 152.0 births per 1,000 women. Women in the age bracket of 20 to 34 years acount for 59.8% of all women with births.
| Age Bracket | Women with Births | Births / 1,000 Women |
| 15 to 19 years | 88 (26.2%) | 152.0 |
| 20 to 34 years | 201 (59.8%) | 104.0 |
| 35 to 50 years | 47 (14.0%) | 26.0 |
| Total | 336 (100.0%) | 78.0 |
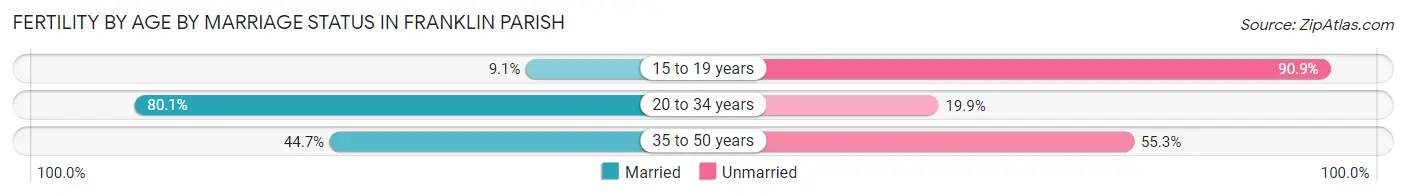
Fertility by Age by Marriage Status in Franklin Parish
56.5% of women with births (336) in Franklin Parish are married. The highest percentage of unmarried women with births falls into 15 to 19 years age bracket with 90.9% of them unmarried at the time of birth, while the lowest percentage of unmarried women with births belong to 20 to 34 years age bracket with 19.9% of them unmarried.
| Age Bracket | Married | Unmarried |
| 15 to 19 years | 8 (9.1%) | 80 (90.9%) |
| 20 to 34 years | 161 (80.1%) | 40 (19.9%) |
| 35 to 50 years | 21 (44.7%) | 26 (55.3%) |
| Total | 190 (56.6%) | 146 (43.4%) |
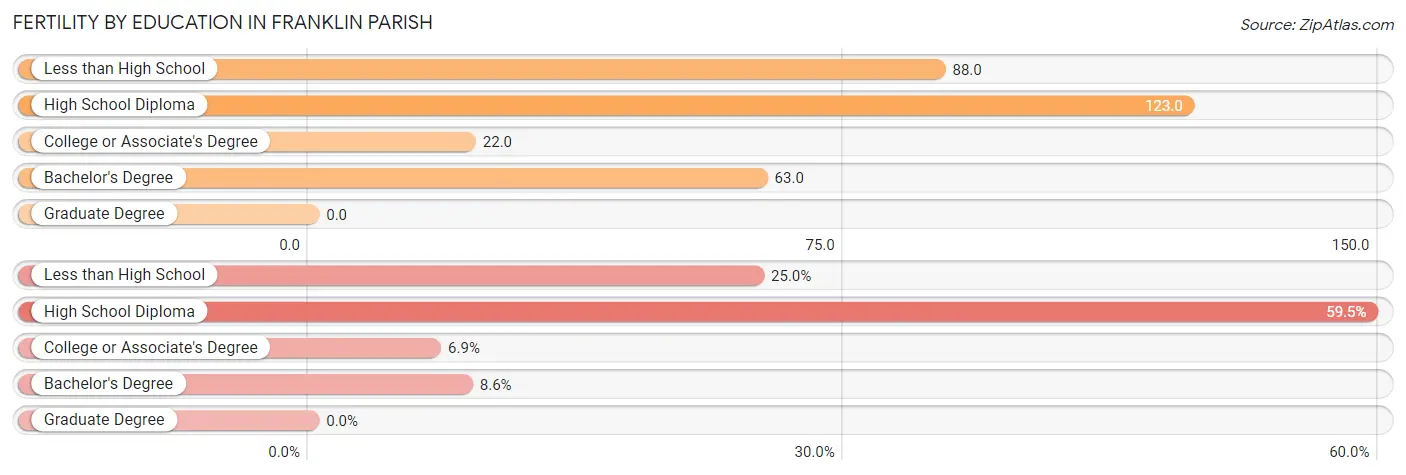
Fertility by Education in Franklin Parish
| Educational Attainment | Women with Births | Births / 1,000 Women |
| Less than High School | 84 (25.0%) | 88.0 |
| High School Diploma | 200 (59.5%) | 123.0 |
| College or Associate's Degree | 23 (6.9%) | 22.0 |
| Bachelor's Degree | 29 (8.6%) | 63.0 |
| Graduate Degree | 0 (0.0%) | 0.0 |
| Total | 336 (100.0%) | 78.0 |
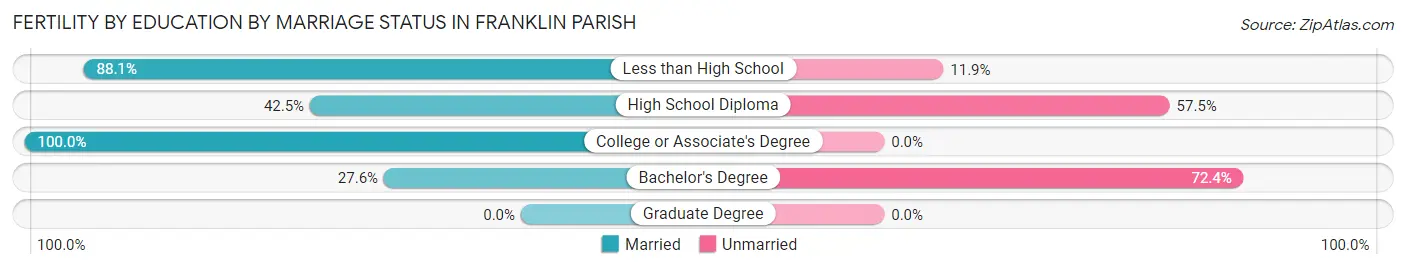
Fertility by Education by Marriage Status in Franklin Parish
43.4% of women with births in Franklin Parish are unmarried. Women with the educational attainment of college or associate's degree are most likely to be married with 100.0% of them married at childbirth, while women with the educational attainment of bachelor's degree are least likely to be married with 72.4% of them unmarried at childbirth.
| Educational Attainment | Married | Unmarried |
| Less than High School | 74 (88.1%) | 10 (11.9%) |
| High School Diploma | 85 (42.5%) | 115 (57.5%) |
| College or Associate's Degree | 23 (100.0%) | 0 (0.0%) |
| Bachelor's Degree | 8 (27.6%) | 21 (72.4%) |
| Graduate Degree | 0 (0.0%) | 0 (0.0%) |
| Total | 190 (56.6%) | 146 (43.4%) |
Income in Franklin Parish
Income Overview in Franklin Parish
Per Capita Income in Franklin Parish is $23,658, while median incomes of families and households are $50,753 and $41,129 respectively.
| Characteristic | Number | Measure |
| Per Capita Income | 19,752 | $23,658 |
| Median Family Income | 5,111 | $50,753 |
| Mean Family Income | 5,111 | $72,691 |
| Median Household Income | 7,308 | $41,129 |
| Mean Household Income | 7,308 | $62,149 |
| Income Deficit | 5,111 | $13,658 |
| Wage / Income Gap (%) | 19,752 | 29.76% |
| Wage / Income Gap ($) | 19,752 | 70.24¢ per $1 |
| Gini / Inequality Index | 19,752 | 0.50 |
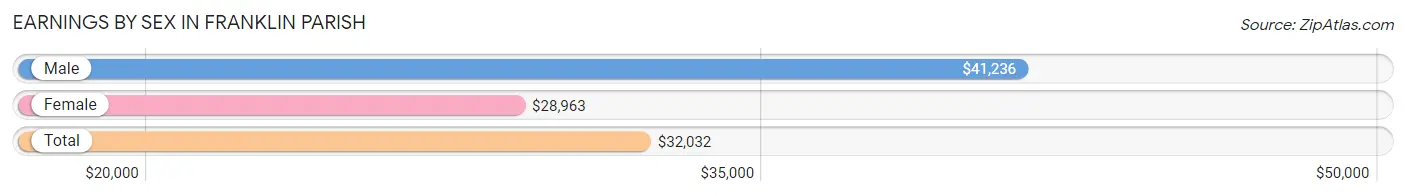
Earnings by Sex in Franklin Parish
Average Earnings in Franklin Parish are $32,032, $41,236 for men and $28,963 for women, a difference of 29.8%.
| Sex | Number | Average Earnings |
| Male | 3,677 (49.3%) | $41,236 |
| Female | 3,779 (50.7%) | $28,963 |
| Total | 7,456 (100.0%) | $32,032 |
Earnings by Sex by Income Bracket in Franklin Parish
The most common earnings brackets in Franklin Parish are $100,000+ for men (577 | 15.7%) and $55,000 to $64,999 for women (408 | 10.8%).
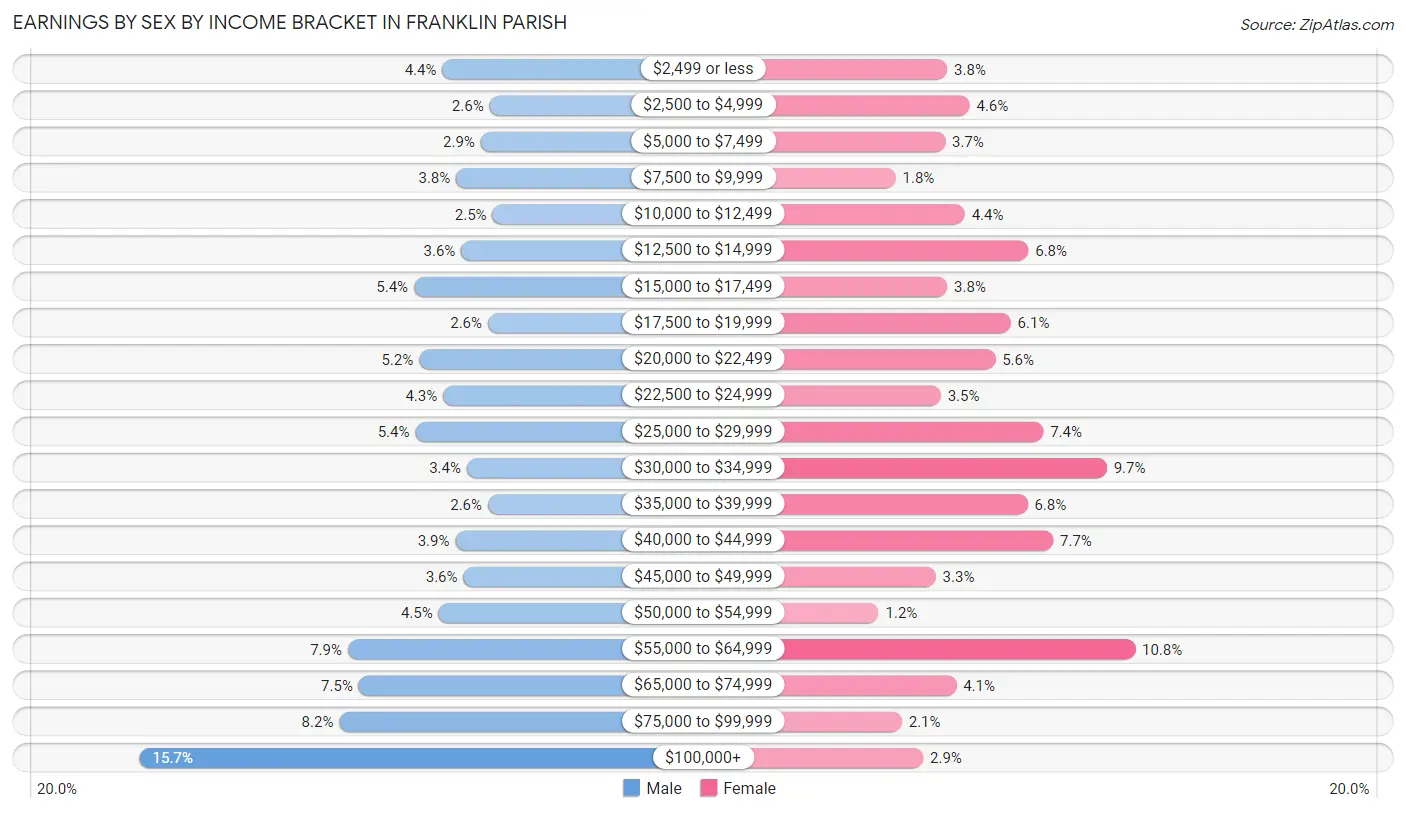
| Income | Male | Female |
| $2,499 or less | 160 (4.3%) | 142 (3.8%) |
| $2,500 to $4,999 | 95 (2.6%) | 174 (4.6%) |
| $5,000 to $7,499 | 107 (2.9%) | 139 (3.7%) |
| $7,500 to $9,999 | 141 (3.8%) | 69 (1.8%) |
| $10,000 to $12,499 | 91 (2.5%) | 167 (4.4%) |
| $12,500 to $14,999 | 134 (3.6%) | 257 (6.8%) |
| $15,000 to $17,499 | 199 (5.4%) | 142 (3.8%) |
| $17,500 to $19,999 | 97 (2.6%) | 232 (6.1%) |
| $20,000 to $22,499 | 192 (5.2%) | 210 (5.6%) |
| $22,500 to $24,999 | 159 (4.3%) | 133 (3.5%) |
| $25,000 to $29,999 | 197 (5.4%) | 278 (7.4%) |
| $30,000 to $34,999 | 126 (3.4%) | 368 (9.7%) |
| $35,000 to $39,999 | 97 (2.6%) | 256 (6.8%) |
| $40,000 to $44,999 | 142 (3.9%) | 292 (7.7%) |
| $45,000 to $49,999 | 131 (3.6%) | 126 (3.3%) |
| $50,000 to $54,999 | 165 (4.5%) | 45 (1.2%) |
| $55,000 to $64,999 | 290 (7.9%) | 408 (10.8%) |
| $65,000 to $74,999 | 275 (7.5%) | 155 (4.1%) |
| $75,000 to $99,999 | 302 (8.2%) | 78 (2.1%) |
| $100,000+ | 577 (15.7%) | 108 (2.9%) |
| Total | 3,677 (100.0%) | 3,779 (100.0%) |
Earnings by Sex by Educational Attainment in Franklin Parish
Average earnings in Franklin Parish are $43,218 for men and $31,705 for women, a difference of 26.6%. Men with an educational attainment of graduate degree enjoy the highest average annual earnings of $83,351, while those with less than high school education earn the least with $40,392. Women with an educational attainment of bachelor's degree earn the most with the average annual earnings of $55,824, while those with less than high school education have the smallest earnings of $13,364.
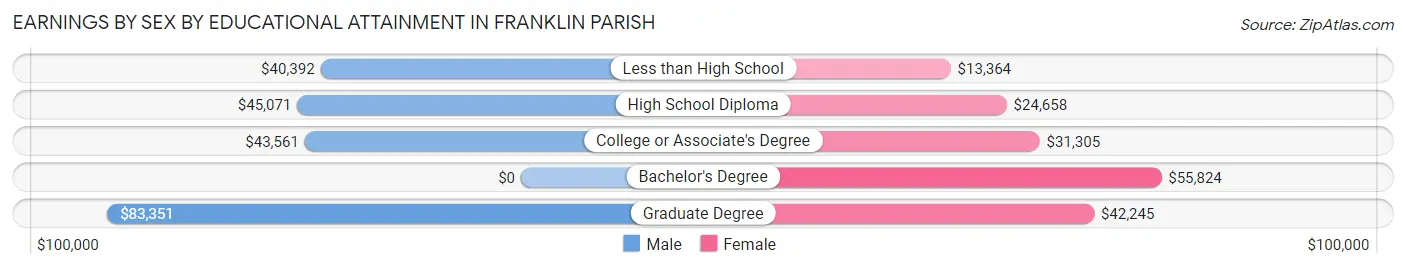
| Educational Attainment | Male Income | Female Income |
| Less than High School | $40,392 | $13,364 |
| High School Diploma | $45,071 | $24,658 |
| College or Associate's Degree | $43,561 | $31,305 |
| Bachelor's Degree | - | - |
| Graduate Degree | $83,351 | $42,245 |
| Total | $43,218 | $31,705 |
Family Income in Franklin Parish
Family Income Brackets in Franklin Parish
According to the Franklin Parish family income data, there are 997 families falling into the $50,000 to $74,999 income range, which is the most common income bracket and makes up 19.5% of all families. Conversely, the $10,000 to $14,999 income bracket is the least frequent group with only 179 families (3.5%) belonging to this category.
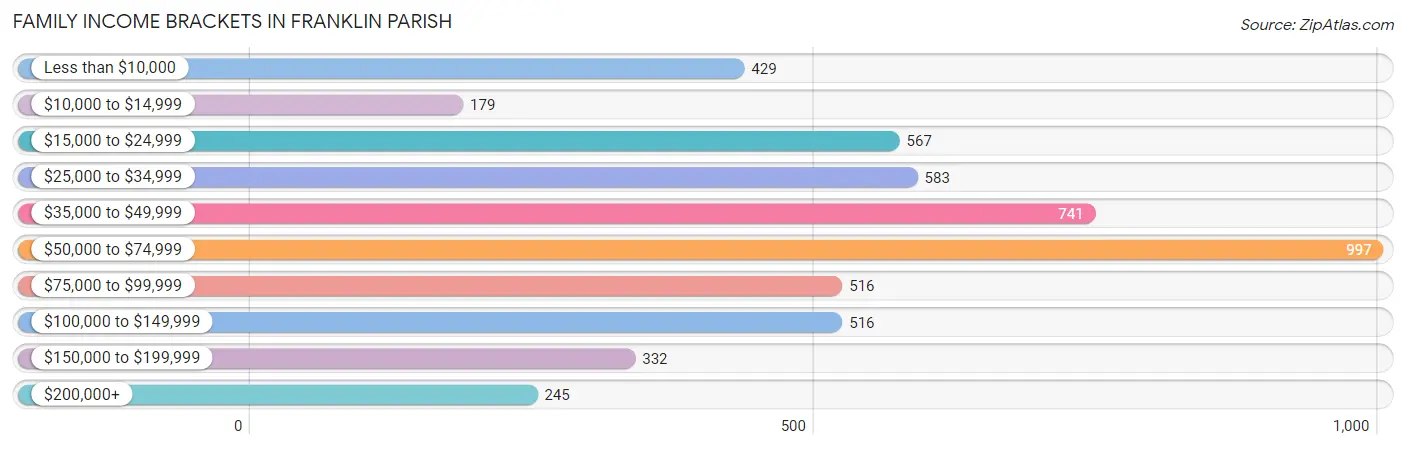
| Income Bracket | # Families | % Families |
| Less than $10,000 | 429 | 8.4% |
| $10,000 to $14,999 | 179 | 3.5% |
| $15,000 to $24,999 | 567 | 11.1% |
| $25,000 to $34,999 | 583 | 11.4% |
| $35,000 to $49,999 | 741 | 14.5% |
| $50,000 to $74,999 | 997 | 19.5% |
| $75,000 to $99,999 | 516 | 10.1% |
| $100,000 to $149,999 | 516 | 10.1% |
| $150,000 to $199,999 | 332 | 6.5% |
| $200,000+ | 245 | 4.8% |
Family Income by Famaliy Size in Franklin Parish
2-person families (2,298 | 45.0%) account for the highest median family income in Franklin Parish with $54,808 per family, while 2-person families (2,298 | 45.0%) have the highest median income of $27,404 per family member.
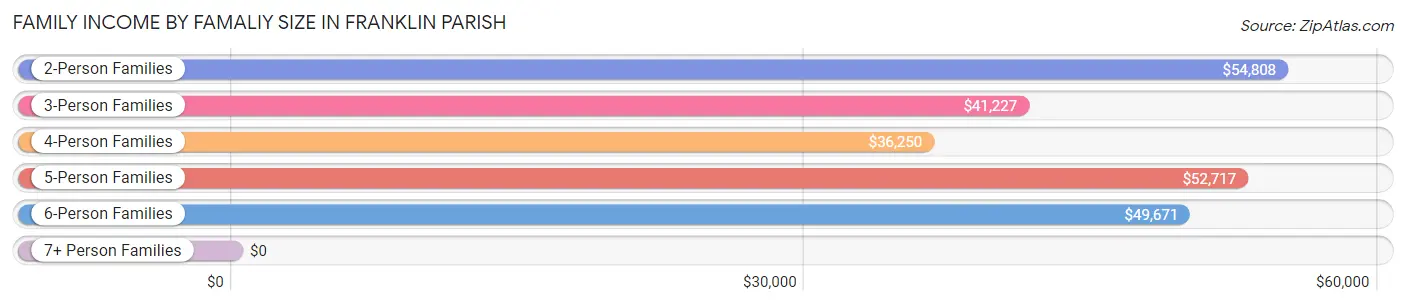
| Income Bracket | # Families | Median Income |
| 2-Person Families | 2,298 (45.0%) | $54,808 |
| 3-Person Families | 1,314 (25.7%) | $41,227 |
| 4-Person Families | 748 (14.6%) | $36,250 |
| 5-Person Families | 600 (11.7%) | $52,717 |
| 6-Person Families | 96 (1.9%) | $49,671 |
| 7+ Person Families | 55 (1.1%) | $0 |
| Total | 5,111 (100.0%) | $50,753 |
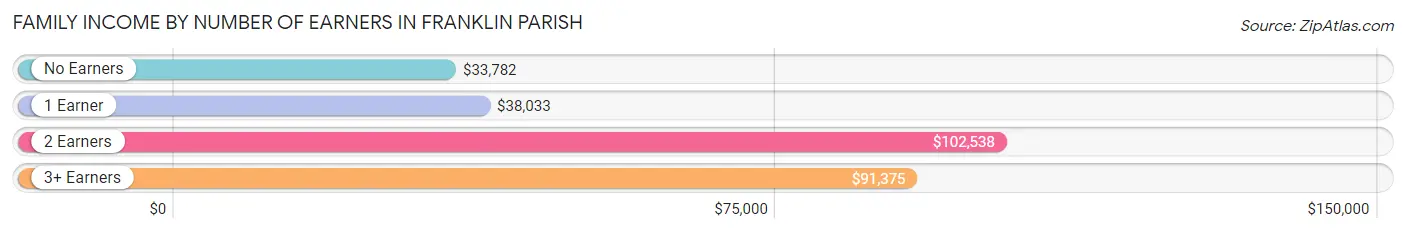
Family Income by Number of Earners in Franklin Parish
The median family income in Franklin Parish is $50,753, with families comprising 2 earners (1,421) having the highest median family income of $102,538, while families with no earners (1,069) have the lowest median family income of $33,782, accounting for 27.8% and 20.9% of families, respectively.
| Number of Earners | # Families | Median Income |
| No Earners | 1,069 (20.9%) | $33,782 |
| 1 Earner | 2,394 (46.8%) | $38,033 |
| 2 Earners | 1,421 (27.8%) | $102,538 |
| 3+ Earners | 227 (4.4%) | $91,375 |
| Total | 5,111 (100.0%) | $50,753 |
Household Income in Franklin Parish
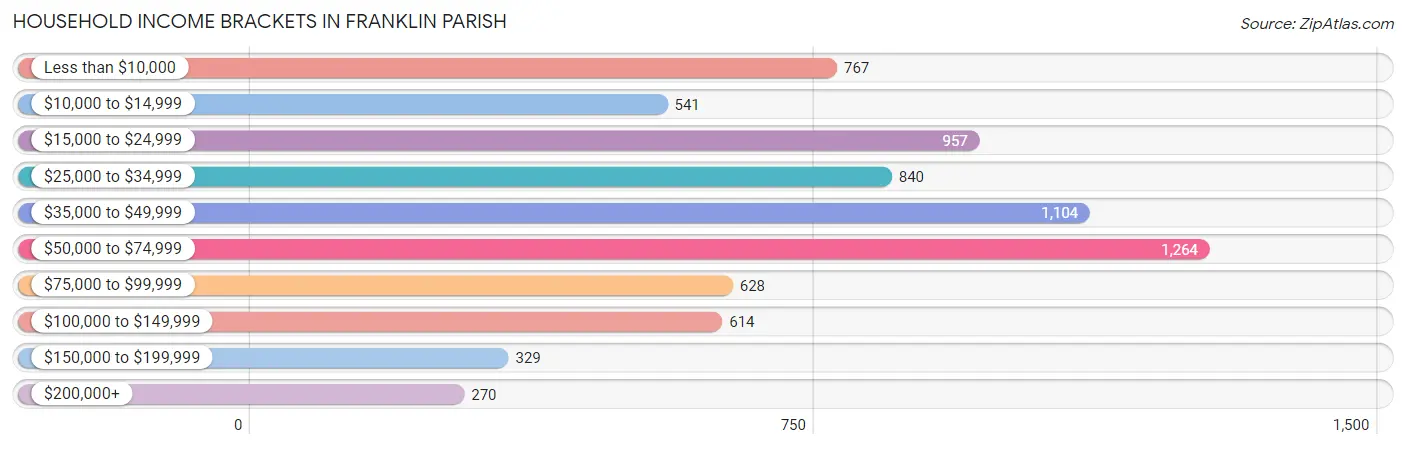
Household Income Brackets in Franklin Parish
With 1,264 households falling in the category, the $50,000 to $74,999 income range is the most frequent in Franklin Parish, accounting for 17.3% of all households. In contrast, only 270 households (3.7%) fall into the $200,000+ income bracket, making it the least populous group.
| Income Bracket | # Households | % Households |
| Less than $10,000 | 767 | 10.5% |
| $10,000 to $14,999 | 541 | 7.4% |
| $15,000 to $24,999 | 957 | 13.1% |
| $25,000 to $34,999 | 840 | 11.5% |
| $35,000 to $49,999 | 1,104 | 15.1% |
| $50,000 to $74,999 | 1,264 | 17.3% |
| $75,000 to $99,999 | 628 | 8.6% |
| $100,000 to $149,999 | 614 | 8.4% |
| $150,000 to $199,999 | 329 | 4.5% |
| $200,000+ | 270 | 3.7% |
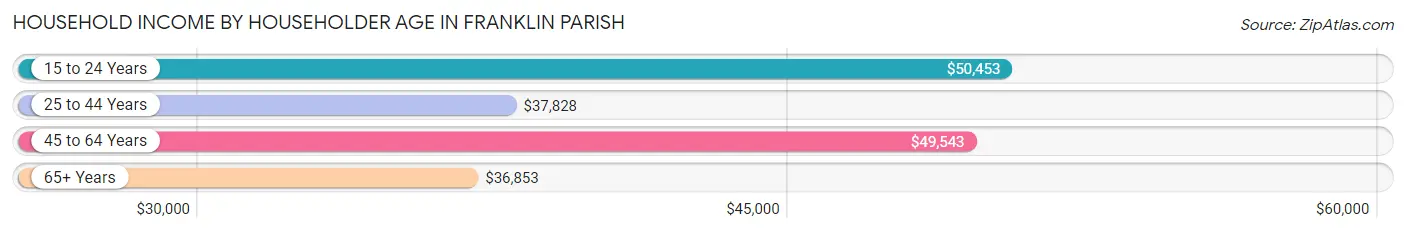
Household Income by Householder Age in Franklin Parish
The median household income in Franklin Parish is $41,129, with the highest median household income of $50,453 found in the 15 to 24 years age bracket for the primary householder. A total of 357 households (4.9%) fall into this category. Meanwhile, the 65+ years age bracket for the primary householder has the lowest median household income of $36,853, with 2,435 households (33.3%) in this group.
| Income Bracket | # Households | Median Income |
| 15 to 24 Years | 357 (4.9%) | $50,453 |
| 25 to 44 Years | 2,148 (29.4%) | $37,828 |
| 45 to 64 Years | 2,368 (32.4%) | $49,543 |
| 65+ Years | 2,435 (33.3%) | $36,853 |
| Total | 7,308 (100.0%) | $41,129 |
Poverty in Franklin Parish
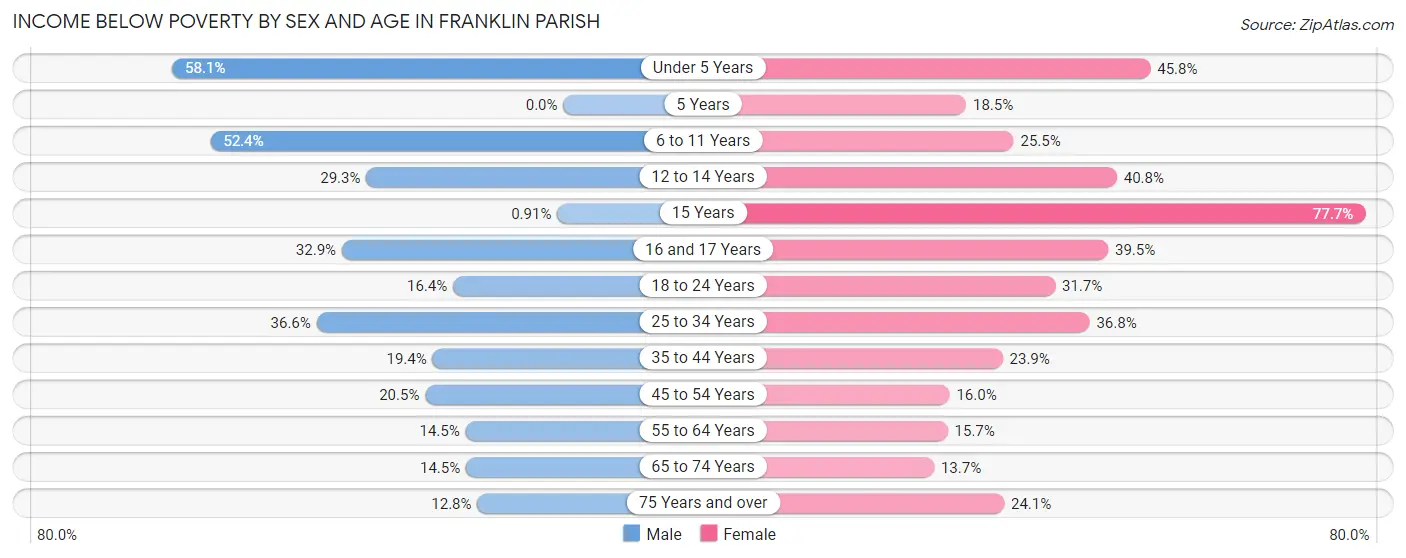
Income Below Poverty by Sex and Age in Franklin Parish
With 25.3% poverty level for males and 26.6% for females among the residents of Franklin Parish, under 5 year old males and 15 year old females are the most vulnerable to poverty, with 359 males (58.1%) and 122 females (77.7%) in their respective age groups living below the poverty level.
| Age Bracket | Male | Female |
| Under 5 Years | 359 (58.1%) | 317 (45.8%) |
| 5 Years | 0 (0.0%) | 31 (18.4%) |
| 6 to 11 Years | 433 (52.4%) | 191 (25.5%) |
| 12 to 14 Years | 146 (29.3%) | 176 (40.8%) |
| 15 Years | 2 (0.9%) | 122 (77.7%) |
| 16 and 17 Years | 72 (32.9%) | 104 (39.5%) |
| 18 to 24 Years | 134 (16.4%) | 267 (31.7%) |
| 25 to 34 Years | 277 (36.6%) | 459 (36.8%) |
| 35 to 44 Years | 195 (19.4%) | 289 (23.9%) |
| 45 to 54 Years | 170 (20.5%) | 172 (16.0%) |
| 55 to 64 Years | 173 (14.5%) | 214 (15.7%) |
| 65 to 74 Years | 150 (14.4%) | 147 (13.7%) |
| 75 Years and over | 65 (12.8%) | 219 (24.1%) |
| Total | 2,176 (25.3%) | 2,708 (26.6%) |
Income Above Poverty by Sex and Age in Franklin Parish
According to the poverty statistics in Franklin Parish, males aged 5 years and females aged 65 to 74 years are the age groups that are most secure financially, with 100.0% of males and 86.3% of females in these age groups living above the poverty line.
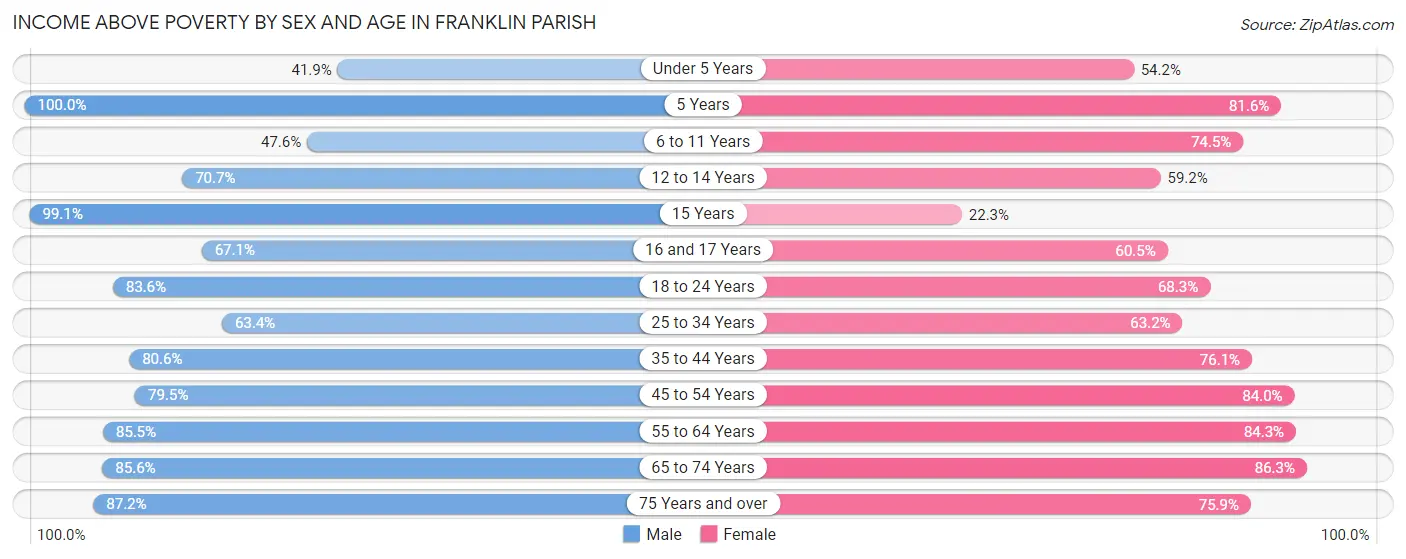
| Age Bracket | Male | Female |
| Under 5 Years | 259 (41.9%) | 375 (54.2%) |
| 5 Years | 60 (100.0%) | 137 (81.6%) |
| 6 to 11 Years | 393 (47.6%) | 558 (74.5%) |
| 12 to 14 Years | 353 (70.7%) | 255 (59.2%) |
| 15 Years | 218 (99.1%) | 35 (22.3%) |
| 16 and 17 Years | 147 (67.1%) | 159 (60.5%) |
| 18 to 24 Years | 684 (83.6%) | 576 (68.3%) |
| 25 to 34 Years | 479 (63.4%) | 789 (63.2%) |
| 35 to 44 Years | 809 (80.6%) | 921 (76.1%) |
| 45 to 54 Years | 659 (79.5%) | 904 (84.0%) |
| 55 to 64 Years | 1,018 (85.5%) | 1,148 (84.3%) |
| 65 to 74 Years | 888 (85.6%) | 927 (86.3%) |
| 75 Years and over | 444 (87.2%) | 690 (75.9%) |
| Total | 6,411 (74.7%) | 7,474 (73.4%) |
Income Below Poverty Among Married-Couple Families in Franklin Parish
The poverty statistics for married-couple families in Franklin Parish show that 8.2% or 284 of the total 3,472 families live below the poverty line. Families with 1 or 2 children have the highest poverty rate of 15.4%, comprising of 153 families. On the other hand, families with 5 or more children have the lowest poverty rate of 0.0%, which includes 0 families.
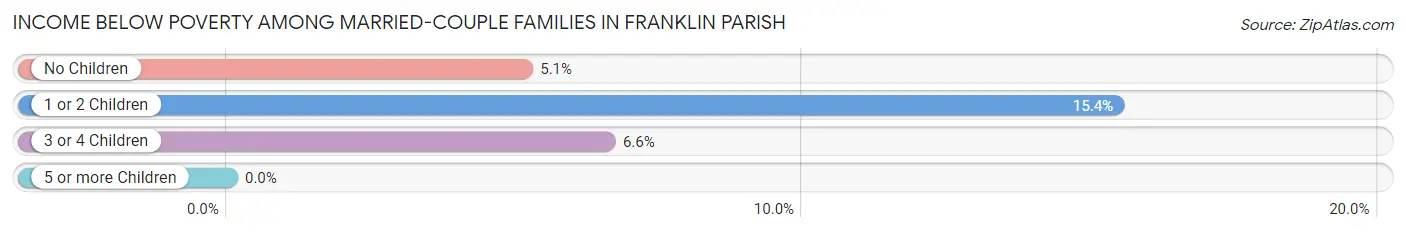
| Children | Above Poverty | Below Poverty |
| No Children | 2,047 (94.9%) | 111 (5.1%) |
| 1 or 2 Children | 838 (84.6%) | 153 (15.4%) |
| 3 or 4 Children | 284 (93.4%) | 20 (6.6%) |
| 5 or more Children | 19 (100.0%) | 0 (0.0%) |
| Total | 3,188 (91.8%) | 284 (8.2%) |
Income Below Poverty Among Single-Parent Households in Franklin Parish
According to the poverty data in Franklin Parish, 24.5% or 91 single-father households and 52.4% or 665 single-mother households are living below the poverty line. Among single-father households, those with 5 or more children have the highest poverty rate, with 1 households (100.0%) experiencing poverty. Likewise, among single-mother households, those with 5 or more children have the highest poverty rate, with 26 households (100.0%) falling below the poverty line.
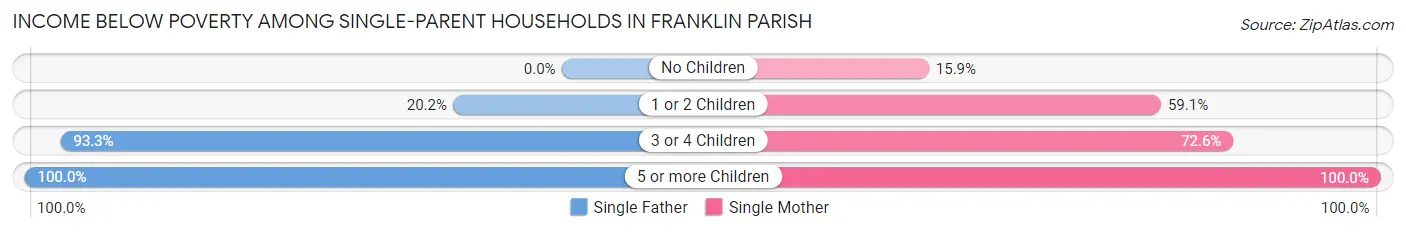
| Children | Single Father | Single Mother |
| No Children | 0 (0.0%) | 50 (15.9%) |
| 1 or 2 Children | 34 (20.2%) | 367 (59.1%) |
| 3 or 4 Children | 56 (93.3%) | 222 (72.6%) |
| 5 or more Children | 1 (100.0%) | 26 (100.0%) |
| Total | 91 (24.5%) | 665 (52.4%) |
Income Below Poverty Among Married-Couple vs Single-Parent Households in Franklin Parish
The poverty data for Franklin Parish shows that 284 of the married-couple family households (8.2%) and 756 of the single-parent households (46.1%) are living below the poverty level. Within the married-couple family households, those with 1 or 2 children have the highest poverty rate, with 153 households (15.4%) falling below the poverty line. Among the single-parent households, those with 5 or more children have the highest poverty rate, with 27 household (100.0%) living below poverty.
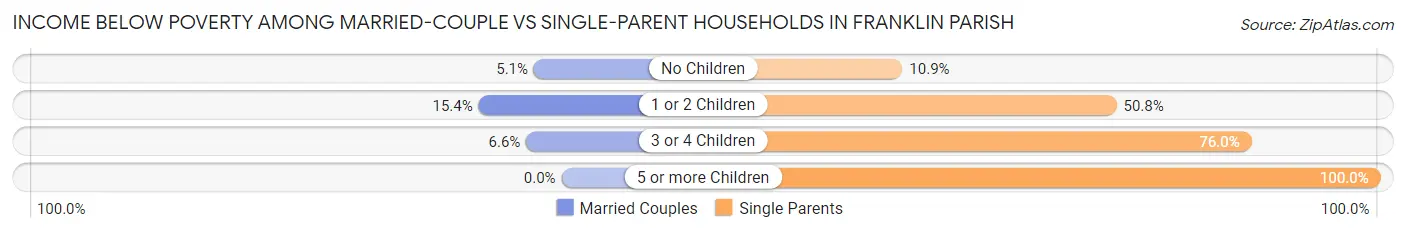
| Children | Married-Couple Families | Single-Parent Households |
| No Children | 111 (5.1%) | 50 (10.9%) |
| 1 or 2 Children | 153 (15.4%) | 401 (50.8%) |
| 3 or 4 Children | 20 (6.6%) | 278 (76.0%) |
| 5 or more Children | 0 (0.0%) | 27 (100.0%) |
| Total | 284 (8.2%) | 756 (46.1%) |
Employment Characteristics in Franklin Parish
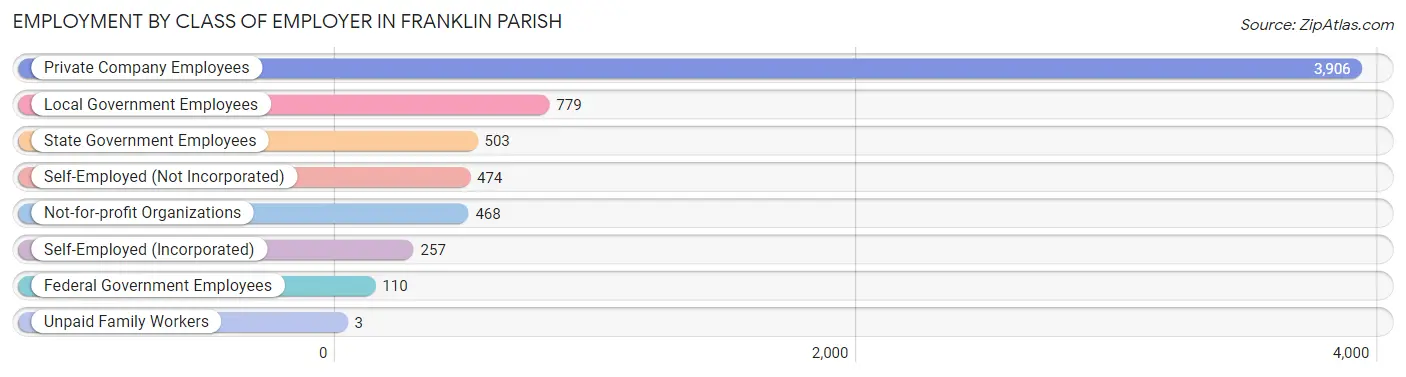
Employment by Class of Employer in Franklin Parish
Among the 6,500 employed individuals in Franklin Parish, private company employees (3,906 | 60.1%), local government employees (779 | 12.0%), and state government employees (503 | 7.7%) make up the most common classes of employment.
| Employer Class | # Employees | % Employees |
| Private Company Employees | 3,906 | 60.1% |
| Self-Employed (Incorporated) | 257 | 4.0% |
| Self-Employed (Not Incorporated) | 474 | 7.3% |
| Not-for-profit Organizations | 468 | 7.2% |
| Local Government Employees | 779 | 12.0% |
| State Government Employees | 503 | 7.7% |
| Federal Government Employees | 110 | 1.7% |
| Unpaid Family Workers | 3 | 0.1% |
| Total | 6,500 | 100.0% |
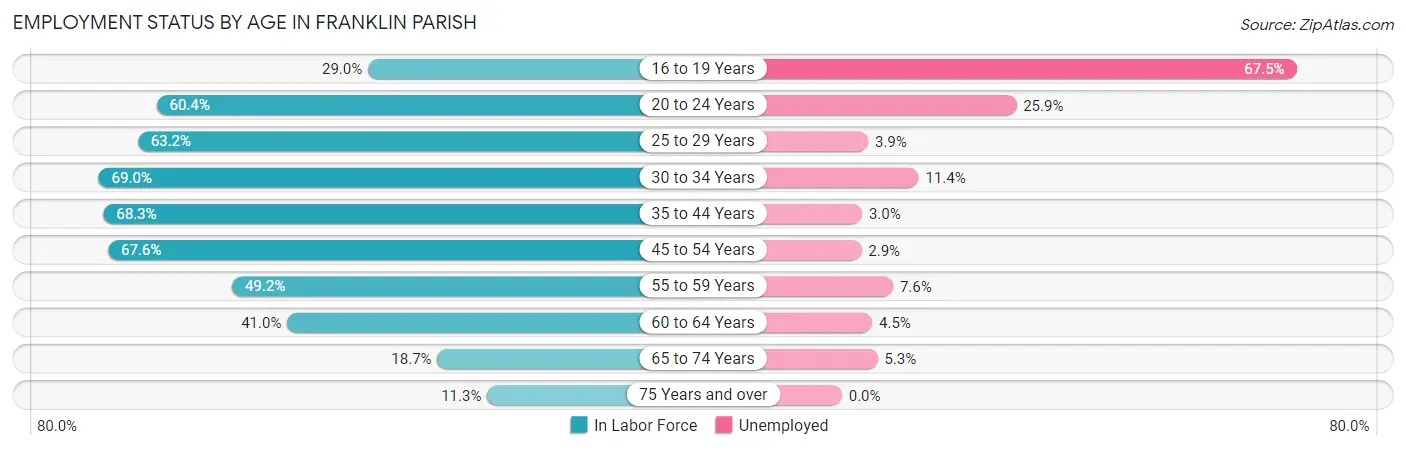
Employment Status by Age in Franklin Parish
According to the labor force statistics for Franklin Parish, out of the total population over 16 years of age (15,318), 48.1% or 7,368 individuals are in the labor force, with 9.2% or 678 of them unemployed. The age group with the highest labor force participation rate is 30 to 34 years, with 69.0% or 736 individuals in the labor force. Within the labor force, the 16 to 19 years age range has the highest percentage of unemployed individuals, with 67.5% or 164 of them being unemployed.
| Age Bracket | In Labor Force | Unemployed |
| 16 to 19 Years | 243 (29.0%) | 164 (67.5%) |
| 20 to 24 Years | 827 (60.4%) | 214 (25.9%) |
| 25 to 29 Years | 719 (63.2%) | 28 (3.9%) |
| 30 to 34 Years | 736 (69.0%) | 84 (11.4%) |
| 35 to 44 Years | 1,691 (68.3%) | 51 (3.0%) |
| 45 to 54 Years | 1,365 (67.6%) | 40 (2.9%) |
| 55 to 59 Years | 619 (49.2%) | 47 (7.6%) |
| 60 to 64 Years | 575 (41.0%) | 26 (4.5%) |
| 65 to 74 Years | 413 (18.7%) | 22 (5.3%) |
| 75 Years and over | 174 (11.3%) | 0 (0.0%) |
| Total | 7,368 (48.1%) | 678 (9.2%) |
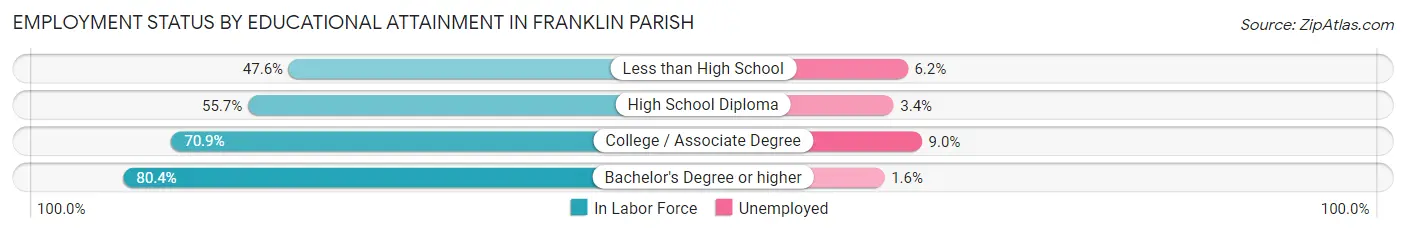
Employment Status by Educational Attainment in Franklin Parish
According to labor force statistics for Franklin Parish, 61.0% of individuals (5,709) out of the total population between 25 and 64 years of age (9,359) are in the labor force, with 4.8% or 274 of them being unemployed. The group with the highest labor force participation rate are those with the educational attainment of bachelor's degree or higher, with 80.4% or 1,147 individuals in the labor force. Within the labor force, individuals with college / associate degree education have the highest percentage of unemployment, with 9.0% or 125 of them being unemployed.
| Educational Attainment | In Labor Force | Unemployed |
| Less than High School | 918 (47.6%) | 120 (6.2%) |
| High School Diploma | 2,257 (55.7%) | 138 (3.4%) |
| College / Associate Degree | 1,384 (70.9%) | 176 (9.0%) |
| Bachelor's Degree or higher | 1,147 (80.4%) | 23 (1.6%) |
| Total | 5,709 (61.0%) | 449 (4.8%) |
Employment Occupations by Sex in Franklin Parish
Management, Business, Science and Arts Occupations
The most common Management, Business, Science and Arts occupations in Franklin Parish are Management (727 | 10.9%), Community & Social Service (585 | 8.7%), Health Diagnosing & Treating (463 | 6.9%), Education Instruction & Library (376 | 5.6%), and Health Technologists (282 | 4.2%).
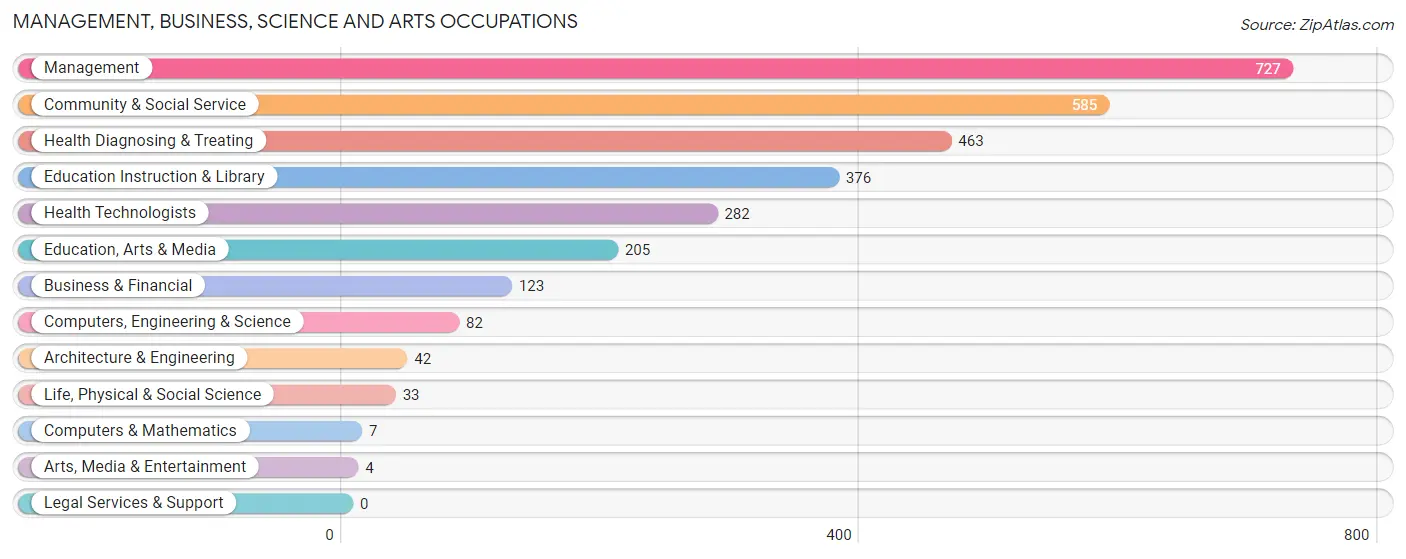
Management, Business, Science and Arts Occupations by Sex
Within the Management, Business, Science and Arts occupations in Franklin Parish, the most male-oriented occupations are Architecture & Engineering (100.0%), Life, Physical & Social Science (100.0%), and Arts, Media & Entertainment (100.0%), while the most female-oriented occupations are Health Technologists (91.1%), Health Diagnosing & Treating (90.9%), and Education Instruction & Library (90.7%).
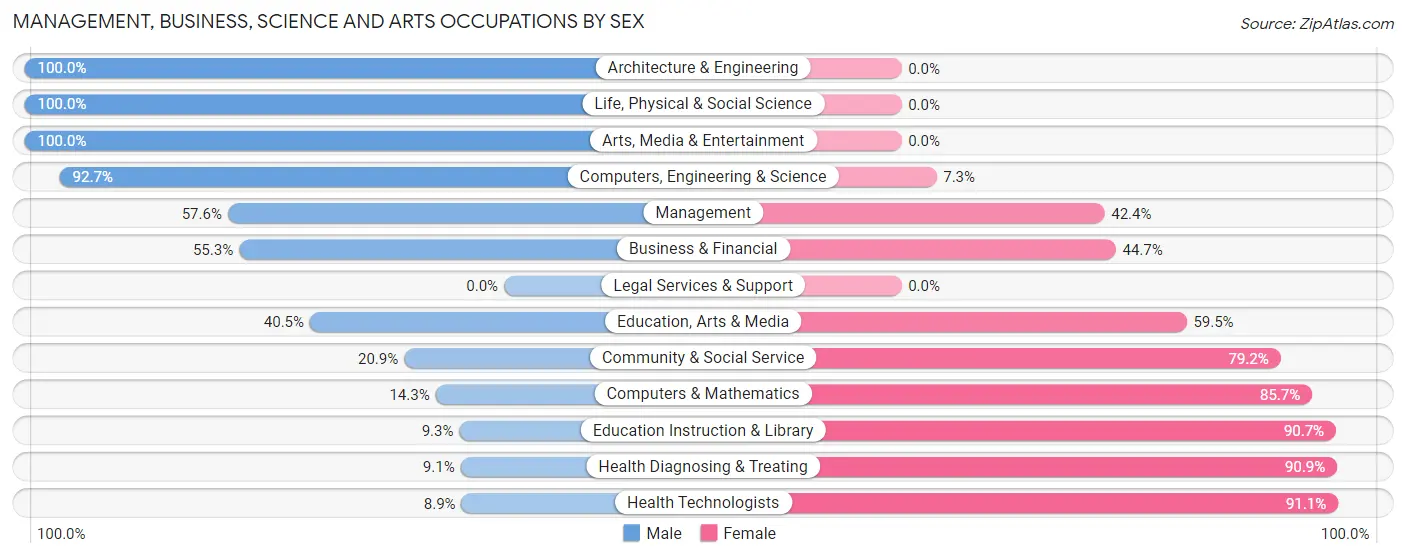
| Occupation | Male | Female |
| Management | 419 (57.6%) | 308 (42.4%) |
| Business & Financial | 68 (55.3%) | 55 (44.7%) |
| Computers, Engineering & Science | 76 (92.7%) | 6 (7.3%) |
| Computers & Mathematics | 1 (14.3%) | 6 (85.7%) |
| Architecture & Engineering | 42 (100.0%) | 0 (0.0%) |
| Life, Physical & Social Science | 33 (100.0%) | 0 (0.0%) |
| Community & Social Service | 122 (20.8%) | 463 (79.1%) |
| Education, Arts & Media | 83 (40.5%) | 122 (59.5%) |
| Legal Services & Support | 0 (0.0%) | 0 (0.0%) |
| Education Instruction & Library | 35 (9.3%) | 341 (90.7%) |
| Arts, Media & Entertainment | 4 (100.0%) | 0 (0.0%) |
| Health Diagnosing & Treating | 42 (9.1%) | 421 (90.9%) |
| Health Technologists | 25 (8.9%) | 257 (91.1%) |
| Total (Category) | 727 (36.7%) | 1,253 (63.3%) |
| Total (Overall) | 3,333 (49.8%) | 3,353 (50.1%) |
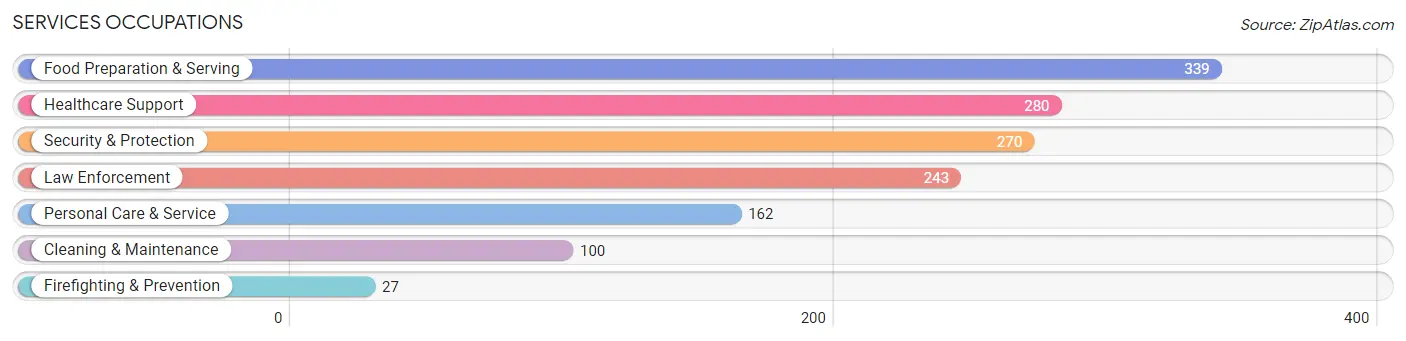
Services Occupations
The most common Services occupations in Franklin Parish are Food Preparation & Serving (339 | 5.1%), Healthcare Support (280 | 4.2%), Security & Protection (270 | 4.0%), Law Enforcement (243 | 3.6%), and Personal Care & Service (162 | 2.4%).
Services Occupations by Sex
Within the Services occupations in Franklin Parish, the most male-oriented occupations are Law Enforcement (88.9%), Security & Protection (82.6%), and Cleaning & Maintenance (73.0%), while the most female-oriented occupations are Healthcare Support (86.4%), Food Preparation & Serving (79.6%), and Firefighting & Prevention (74.1%).
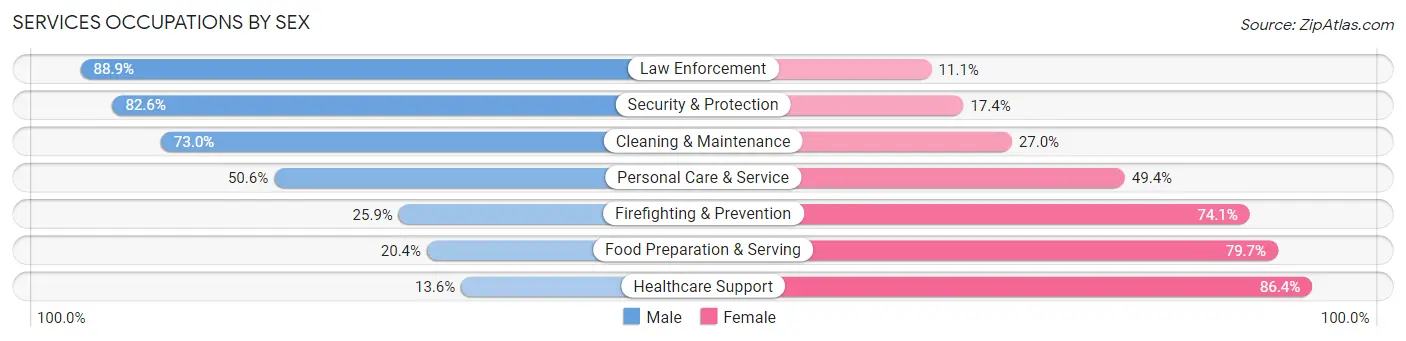
| Occupation | Male | Female |
| Healthcare Support | 38 (13.6%) | 242 (86.4%) |
| Security & Protection | 223 (82.6%) | 47 (17.4%) |
| Firefighting & Prevention | 7 (25.9%) | 20 (74.1%) |
| Law Enforcement | 216 (88.9%) | 27 (11.1%) |
| Food Preparation & Serving | 69 (20.3%) | 270 (79.6%) |
| Cleaning & Maintenance | 73 (73.0%) | 27 (27.0%) |
| Personal Care & Service | 82 (50.6%) | 80 (49.4%) |
| Total (Category) | 485 (42.1%) | 666 (57.9%) |
| Total (Overall) | 3,333 (49.8%) | 3,353 (50.1%) |
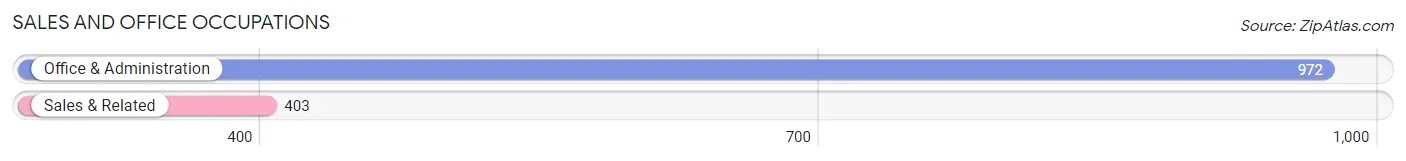
Sales and Office Occupations
The most common Sales and Office occupations in Franklin Parish are Office & Administration (972 | 14.5%), and Sales & Related (403 | 6.0%).
Sales and Office Occupations by Sex
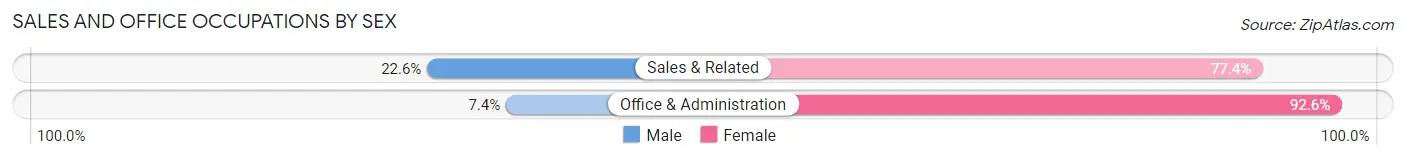
| Occupation | Male | Female |
| Sales & Related | 91 (22.6%) | 312 (77.4%) |
| Office & Administration | 72 (7.4%) | 900 (92.6%) |
| Total (Category) | 163 (11.8%) | 1,212 (88.1%) |
| Total (Overall) | 3,333 (49.8%) | 3,353 (50.1%) |
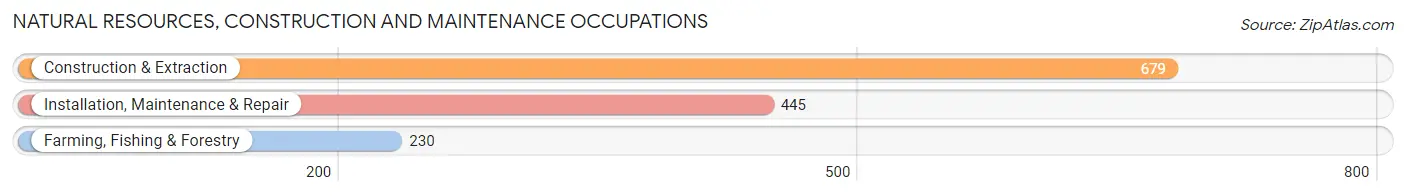
Natural Resources, Construction and Maintenance Occupations
The most common Natural Resources, Construction and Maintenance occupations in Franklin Parish are Construction & Extraction (679 | 10.2%), Installation, Maintenance & Repair (445 | 6.7%), and Farming, Fishing & Forestry (230 | 3.4%).
Natural Resources, Construction and Maintenance Occupations by Sex
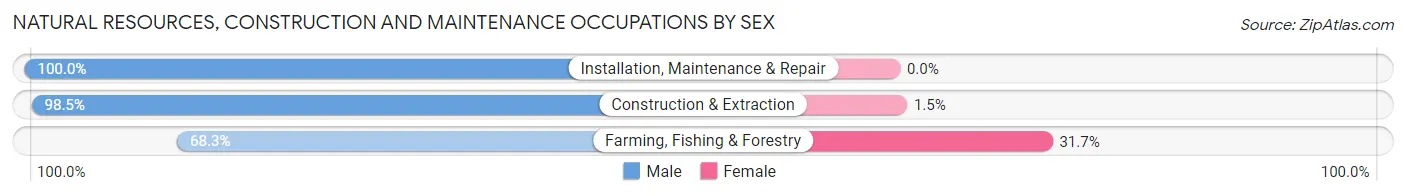
| Occupation | Male | Female |
| Farming, Fishing & Forestry | 157 (68.3%) | 73 (31.7%) |
| Construction & Extraction | 669 (98.5%) | 10 (1.5%) |
| Installation, Maintenance & Repair | 445 (100.0%) | 0 (0.0%) |
| Total (Category) | 1,271 (93.9%) | 83 (6.1%) |
| Total (Overall) | 3,333 (49.8%) | 3,353 (50.1%) |
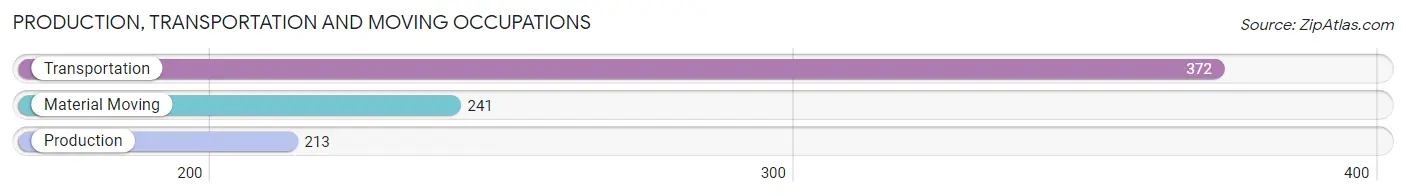
Production, Transportation and Moving Occupations
The most common Production, Transportation and Moving occupations in Franklin Parish are Transportation (372 | 5.6%), Material Moving (241 | 3.6%), and Production (213 | 3.2%).
Production, Transportation and Moving Occupations by Sex
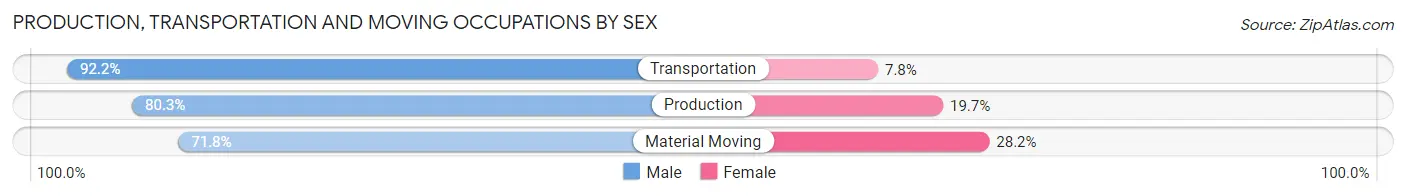
| Occupation | Male | Female |
| Production | 171 (80.3%) | 42 (19.7%) |
| Transportation | 343 (92.2%) | 29 (7.8%) |
| Material Moving | 173 (71.8%) | 68 (28.2%) |
| Total (Category) | 687 (83.2%) | 139 (16.8%) |
| Total (Overall) | 3,333 (49.8%) | 3,353 (50.1%) |
Employment Industries by Sex in Franklin Parish
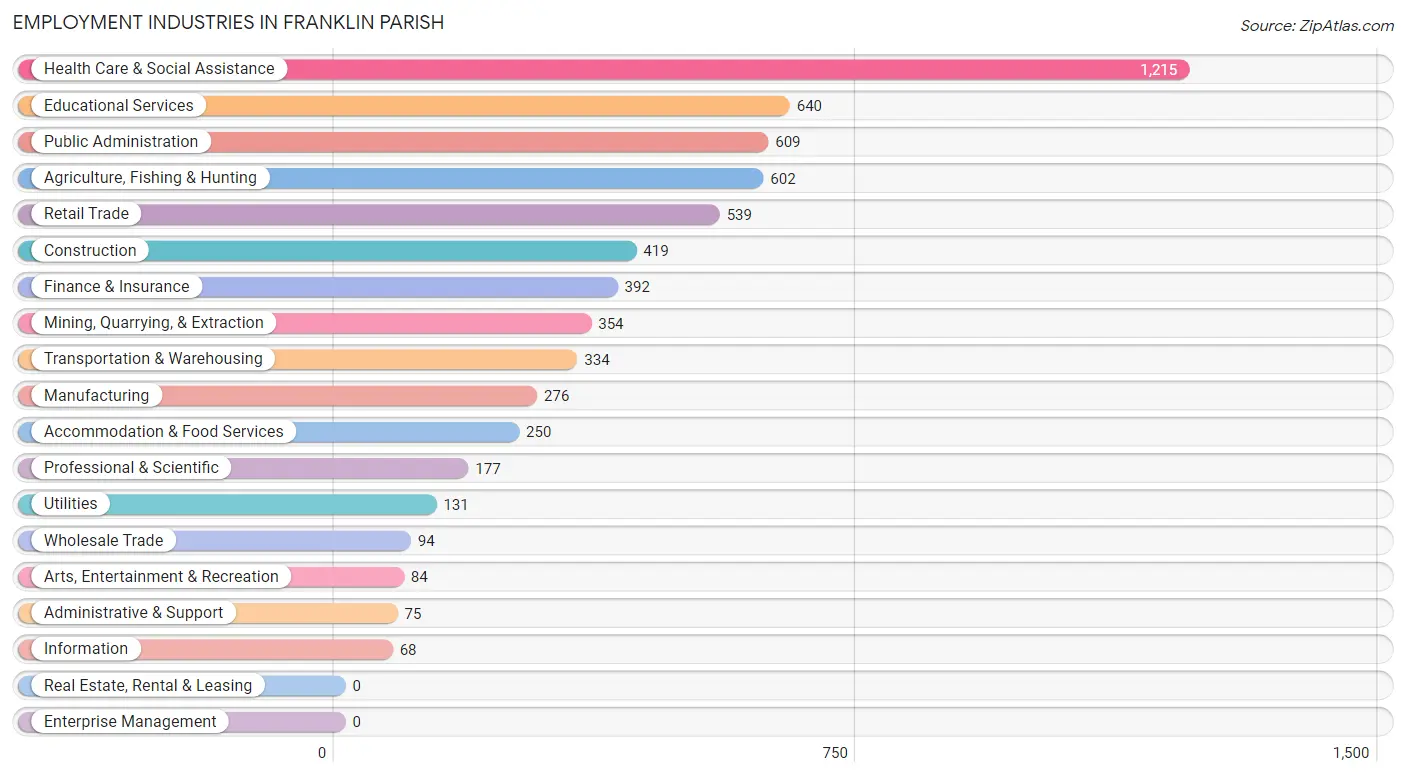
Employment Industries in Franklin Parish
The major employment industries in Franklin Parish include Health Care & Social Assistance (1,215 | 18.2%), Educational Services (640 | 9.6%), Public Administration (609 | 9.1%), Agriculture, Fishing & Hunting (602 | 9.0%), and Retail Trade (539 | 8.1%).
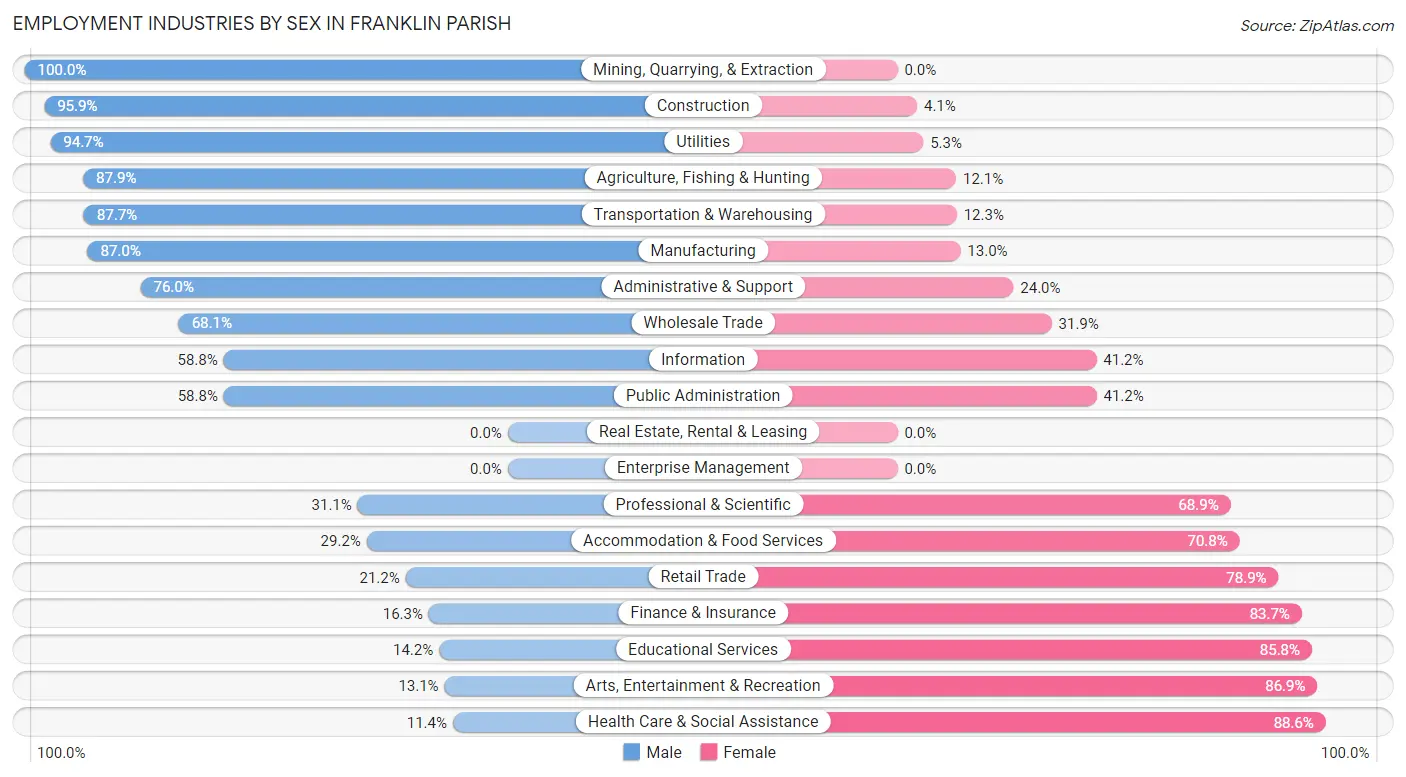
Employment Industries by Sex in Franklin Parish
The Franklin Parish industries that see more men than women are Mining, Quarrying, & Extraction (100.0%), Construction (95.9%), and Utilities (94.7%), whereas the industries that tend to have a higher number of women are Health Care & Social Assistance (88.6%), Arts, Entertainment & Recreation (86.9%), and Educational Services (85.8%).
| Industry | Male | Female |
| Agriculture, Fishing & Hunting | 529 (87.9%) | 73 (12.1%) |
| Mining, Quarrying, & Extraction | 354 (100.0%) | 0 (0.0%) |
| Construction | 402 (95.9%) | 17 (4.1%) |
| Manufacturing | 240 (87.0%) | 36 (13.0%) |
| Wholesale Trade | 64 (68.1%) | 30 (31.9%) |
| Retail Trade | 114 (21.1%) | 425 (78.8%) |
| Transportation & Warehousing | 293 (87.7%) | 41 (12.3%) |
| Utilities | 124 (94.7%) | 7 (5.3%) |
| Information | 40 (58.8%) | 28 (41.2%) |
| Finance & Insurance | 64 (16.3%) | 328 (83.7%) |
| Real Estate, Rental & Leasing | 0 (0.0%) | 0 (0.0%) |
| Professional & Scientific | 55 (31.1%) | 122 (68.9%) |
| Enterprise Management | 0 (0.0%) | 0 (0.0%) |
| Administrative & Support | 57 (76.0%) | 18 (24.0%) |
| Educational Services | 91 (14.2%) | 549 (85.8%) |
| Health Care & Social Assistance | 138 (11.4%) | 1,077 (88.6%) |
| Arts, Entertainment & Recreation | 11 (13.1%) | 73 (86.9%) |
| Accommodation & Food Services | 73 (29.2%) | 177 (70.8%) |
| Public Administration | 358 (58.8%) | 251 (41.2%) |
| Total | 3,333 (49.8%) | 3,353 (50.1%) |
Education in Franklin Parish
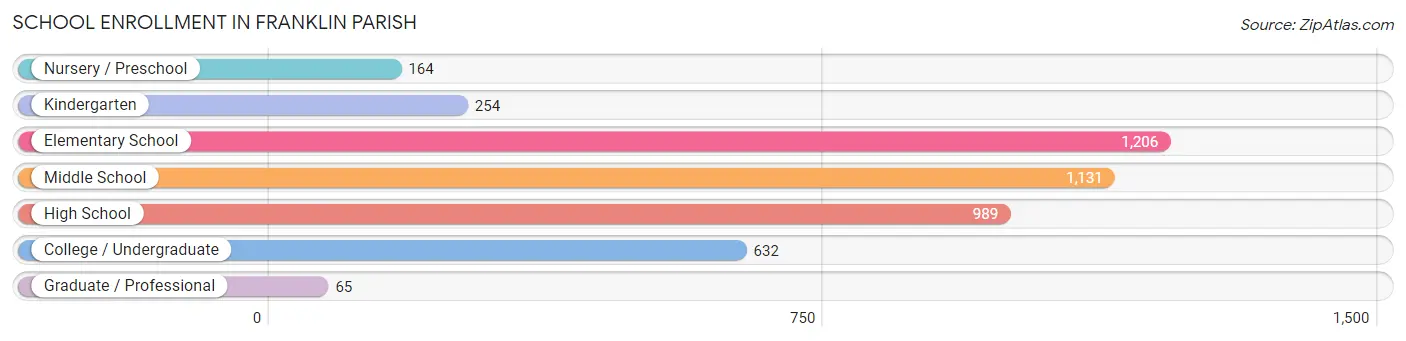
School Enrollment in Franklin Parish
The most common levels of schooling among the 4,441 students in Franklin Parish are elementary school (1,206 | 27.2%), middle school (1,131 | 25.5%), and high school (989 | 22.3%).
| School Level | # Students | % Students |
| Nursery / Preschool | 164 | 3.7% |
| Kindergarten | 254 | 5.7% |
| Elementary School | 1,206 | 27.2% |
| Middle School | 1,131 | 25.5% |
| High School | 989 | 22.3% |
| College / Undergraduate | 632 | 14.2% |
| Graduate / Professional | 65 | 1.5% |
| Total | 4,441 | 100.0% |
School Enrollment by Age by Funding Source in Franklin Parish
Out of a total of 4,441 students who are enrolled in schools in Franklin Parish, 906 (20.4%) attend a private institution, while the remaining 3,535 (79.6%) are enrolled in public schools. The age group of 3 to 4 year olds has the highest likelihood of being enrolled in private schools, with 86 (47.2% in the age bracket) enrolled. Conversely, the age group of 20 to 24 year olds has the lowest likelihood of being enrolled in a private school, with 249 (92.6% in the age bracket) attending a public institution.
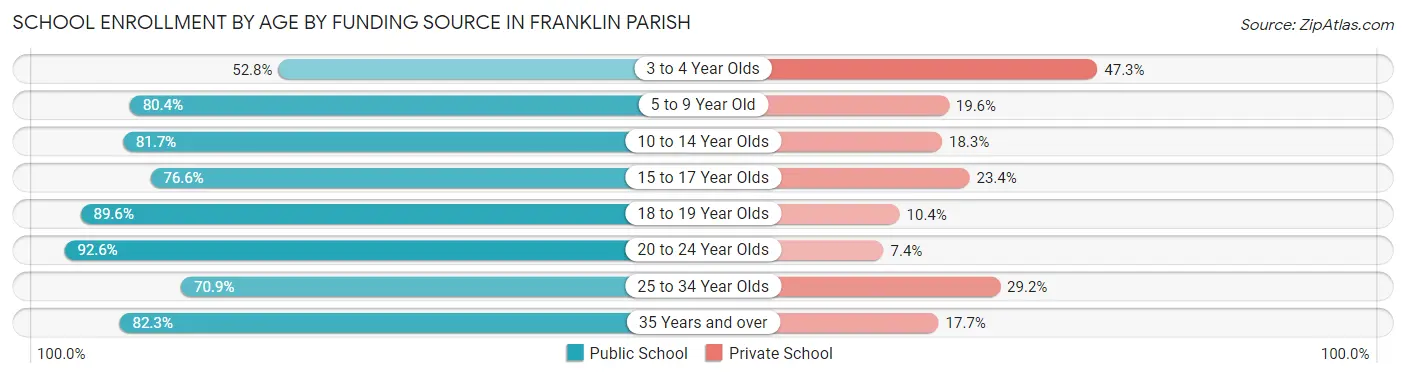
| Age Bracket | Public School | Private School |
| 3 to 4 Year Olds | 96 (52.7%) | 86 (47.2%) |
| 5 to 9 Year Old | 989 (80.4%) | 241 (19.6%) |
| 10 to 14 Year Olds | 1,110 (81.7%) | 249 (18.3%) |
| 15 to 17 Year Olds | 637 (76.6%) | 195 (23.4%) |
| 18 to 19 Year Olds | 172 (89.6%) | 20 (10.4%) |
| 20 to 24 Year Olds | 249 (92.6%) | 20 (7.4%) |
| 25 to 34 Year Olds | 175 (70.9%) | 72 (29.1%) |
| 35 Years and over | 107 (82.3%) | 23 (17.7%) |
| Total | 3,535 (79.6%) | 906 (20.4%) |
Educational Attainment by Field of Study in Franklin Parish
Education (680 | 32.2%), science & technology (365 | 17.3%), business (235 | 11.1%), arts & humanities (180 | 8.5%), and social sciences (167 | 7.9%) are the most common fields of study among 2,114 individuals in Franklin Parish who have obtained a bachelor's degree or higher.
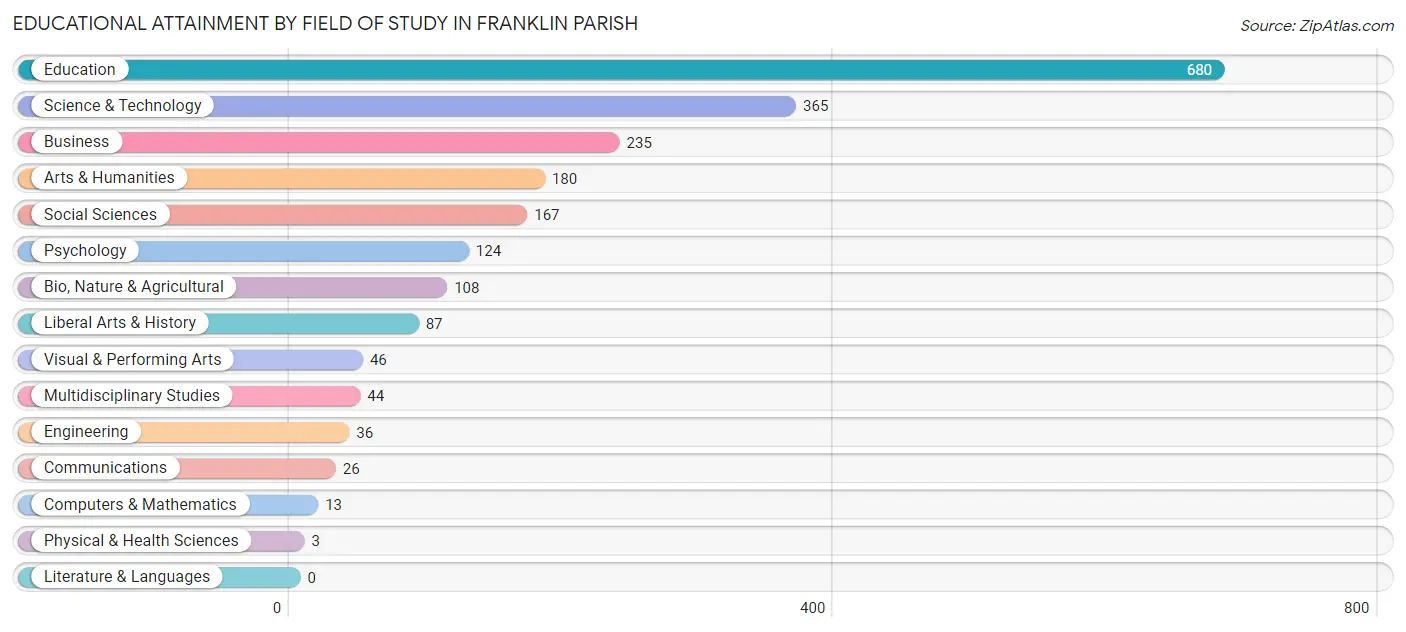
| Field of Study | # Graduates | % Graduates |
| Computers & Mathematics | 13 | 0.6% |
| Bio, Nature & Agricultural | 108 | 5.1% |
| Physical & Health Sciences | 3 | 0.1% |
| Psychology | 124 | 5.9% |
| Social Sciences | 167 | 7.9% |
| Engineering | 36 | 1.7% |
| Multidisciplinary Studies | 44 | 2.1% |
| Science & Technology | 365 | 17.3% |
| Business | 235 | 11.1% |
| Education | 680 | 32.2% |
| Literature & Languages | 0 | 0.0% |
| Liberal Arts & History | 87 | 4.1% |
| Visual & Performing Arts | 46 | 2.2% |
| Communications | 26 | 1.2% |
| Arts & Humanities | 180 | 8.5% |
| Total | 2,114 | 100.0% |
Transportation & Commute in Franklin Parish
Vehicle Availability by Sex in Franklin Parish
The most prevalent vehicle ownership categories in Franklin Parish are males with 2 vehicles (1,514, accounting for 47.0%) and females with 2 vehicles (1,252, making up 46.4%).
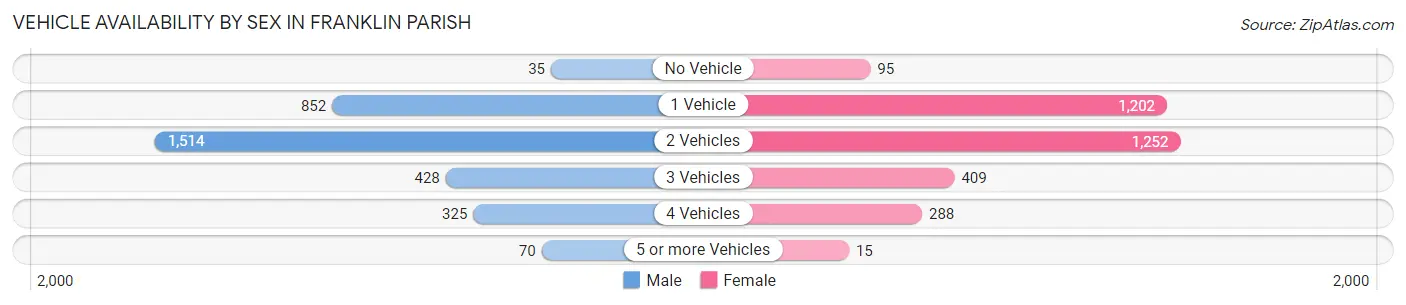
| Vehicles Available | Male | Female |
| No Vehicle | 35 (1.1%) | 95 (2.9%) |
| 1 Vehicle | 852 (26.4%) | 1,202 (36.9%) |
| 2 Vehicles | 1,514 (47.0%) | 1,252 (38.4%) |
| 3 Vehicles | 428 (13.3%) | 409 (12.5%) |
| 4 Vehicles | 325 (10.1%) | 288 (8.8%) |
| 5 or more Vehicles | 70 (2.2%) | 15 (0.5%) |
| Total | 3,224 (100.0%) | 3,261 (100.0%) |
Commute Time in Franklin Parish
The most frequently occuring commute durations in Franklin Parish are 15 to 19 minutes (1,515 commuters, 24.3%), 5 to 9 minutes (839 commuters, 13.4%), and 30 to 34 minutes (785 commuters, 12.6%).
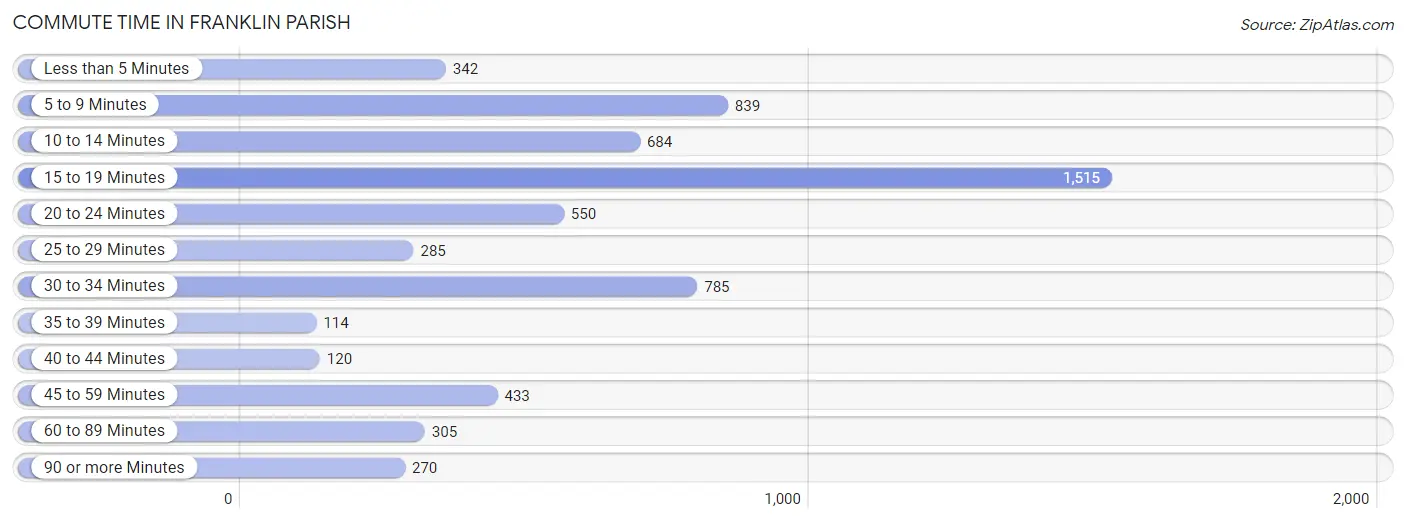
| Commute Time | # Commuters | % Commuters |
| Less than 5 Minutes | 342 | 5.5% |
| 5 to 9 Minutes | 839 | 13.4% |
| 10 to 14 Minutes | 684 | 11.0% |
| 15 to 19 Minutes | 1,515 | 24.3% |
| 20 to 24 Minutes | 550 | 8.8% |
| 25 to 29 Minutes | 285 | 4.6% |
| 30 to 34 Minutes | 785 | 12.6% |
| 35 to 39 Minutes | 114 | 1.8% |
| 40 to 44 Minutes | 120 | 1.9% |
| 45 to 59 Minutes | 433 | 6.9% |
| 60 to 89 Minutes | 305 | 4.9% |
| 90 or more Minutes | 270 | 4.3% |
Commute Time by Sex in Franklin Parish
The most common commute times in Franklin Parish are 15 to 19 minutes (674 commuters, 21.3%) for males and 15 to 19 minutes (841 commuters, 27.4%) for females.
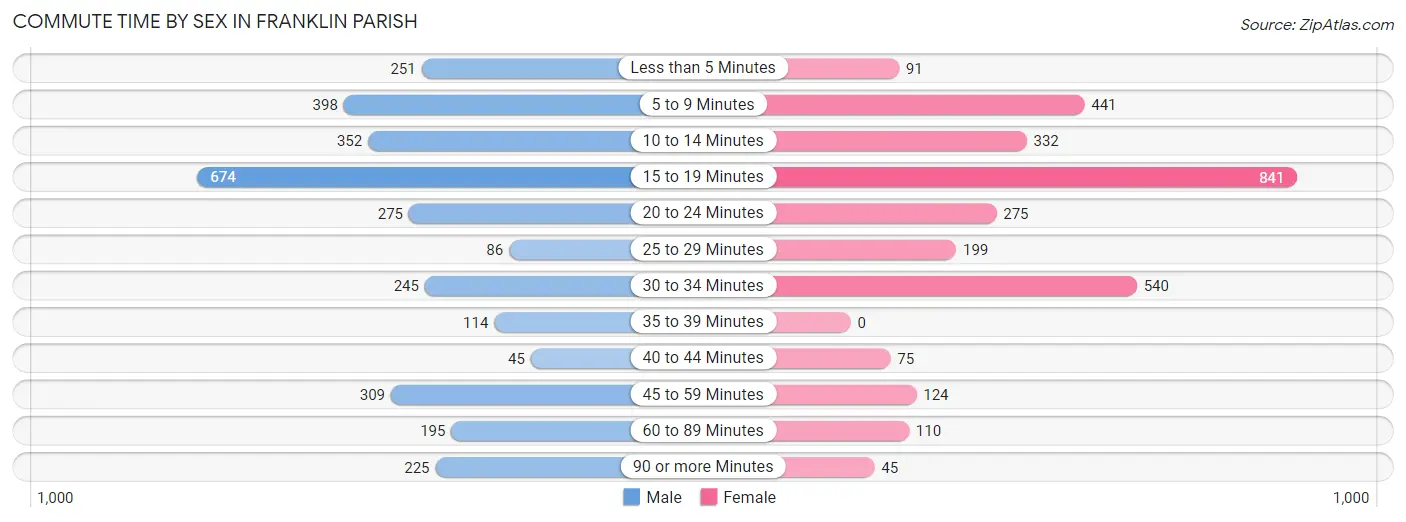
| Commute Time | Male | Female |
| Less than 5 Minutes | 251 (7.9%) | 91 (3.0%) |
| 5 to 9 Minutes | 398 (12.6%) | 441 (14.3%) |
| 10 to 14 Minutes | 352 (11.1%) | 332 (10.8%) |
| 15 to 19 Minutes | 674 (21.3%) | 841 (27.4%) |
| 20 to 24 Minutes | 275 (8.7%) | 275 (8.9%) |
| 25 to 29 Minutes | 86 (2.7%) | 199 (6.5%) |
| 30 to 34 Minutes | 245 (7.7%) | 540 (17.6%) |
| 35 to 39 Minutes | 114 (3.6%) | 0 (0.0%) |
| 40 to 44 Minutes | 45 (1.4%) | 75 (2.4%) |
| 45 to 59 Minutes | 309 (9.8%) | 124 (4.0%) |
| 60 to 89 Minutes | 195 (6.1%) | 110 (3.6%) |
| 90 or more Minutes | 225 (7.1%) | 45 (1.5%) |
Time of Departure to Work by Sex in Franklin Parish
The most frequent times of departure to work in Franklin Parish are 7:00 AM to 7:29 AM (743, 23.4%) for males and 7:00 AM to 7:29 AM (1,064, 34.6%) for females.
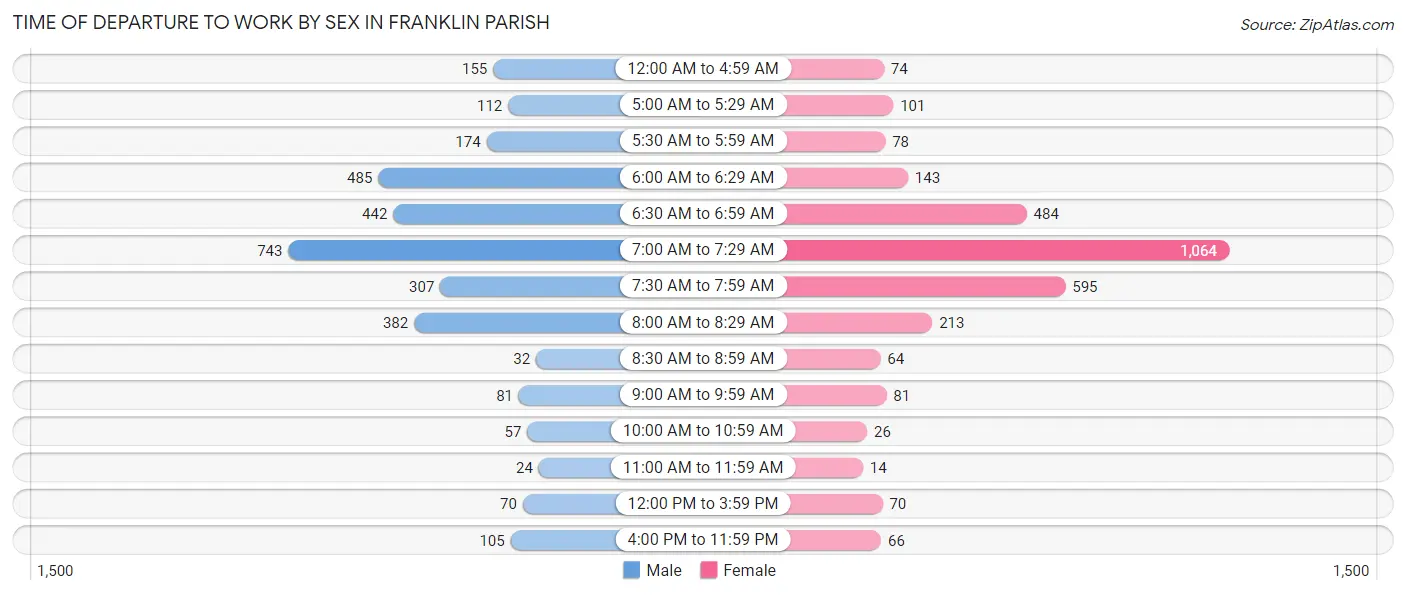
| Time of Departure | Male | Female |
| 12:00 AM to 4:59 AM | 155 (4.9%) | 74 (2.4%) |
| 5:00 AM to 5:29 AM | 112 (3.5%) | 101 (3.3%) |
| 5:30 AM to 5:59 AM | 174 (5.5%) | 78 (2.5%) |
| 6:00 AM to 6:29 AM | 485 (15.3%) | 143 (4.6%) |
| 6:30 AM to 6:59 AM | 442 (14.0%) | 484 (15.8%) |
| 7:00 AM to 7:29 AM | 743 (23.4%) | 1,064 (34.6%) |
| 7:30 AM to 7:59 AM | 307 (9.7%) | 595 (19.4%) |
| 8:00 AM to 8:29 AM | 382 (12.0%) | 213 (6.9%) |
| 8:30 AM to 8:59 AM | 32 (1.0%) | 64 (2.1%) |
| 9:00 AM to 9:59 AM | 81 (2.6%) | 81 (2.6%) |
| 10:00 AM to 10:59 AM | 57 (1.8%) | 26 (0.9%) |
| 11:00 AM to 11:59 AM | 24 (0.8%) | 14 (0.5%) |
| 12:00 PM to 3:59 PM | 70 (2.2%) | 70 (2.3%) |
| 4:00 PM to 11:59 PM | 105 (3.3%) | 66 (2.1%) |
| Total | 3,169 (100.0%) | 3,073 (100.0%) |
Housing Occupancy in Franklin Parish
Occupancy by Ownership in Franklin Parish
Of the total 7,308 dwellings in Franklin Parish, owner-occupied units account for 5,464 (74.8%), while renter-occupied units make up 1,844 (25.2%).
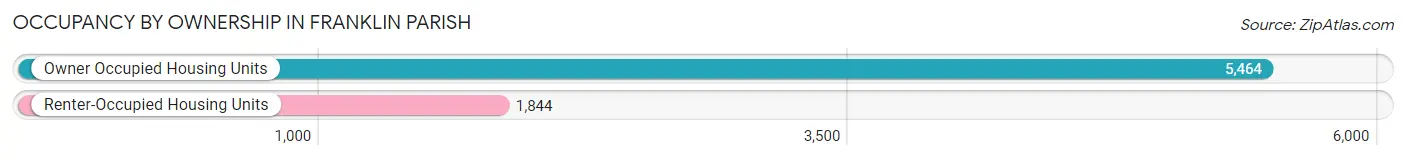
| Occupancy | # Housing Units | % Housing Units |
| Owner Occupied Housing Units | 5,464 | 74.8% |
| Renter-Occupied Housing Units | 1,844 | 25.2% |
| Total Occupied Housing Units | 7,308 | 100.0% |
Occupancy by Household Size in Franklin Parish
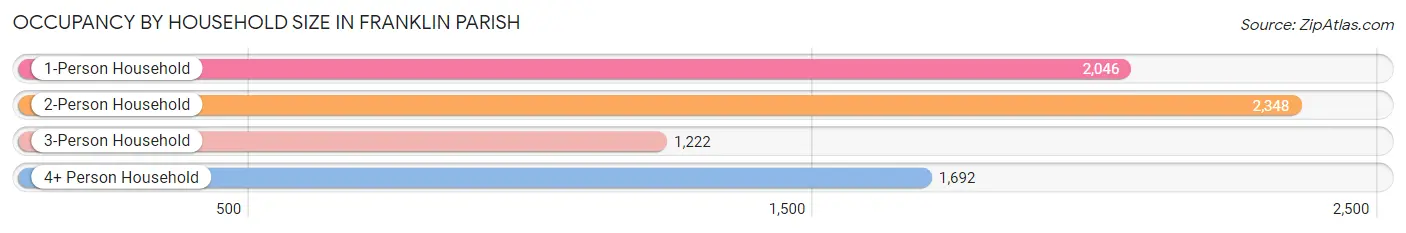
| Household Size | # Housing Units | % Housing Units |
| 1-Person Household | 2,046 | 28.0% |
| 2-Person Household | 2,348 | 32.1% |
| 3-Person Household | 1,222 | 16.7% |
| 4+ Person Household | 1,692 | 23.2% |
| Total Housing Units | 7,308 | 100.0% |
Occupancy by Ownership by Household Size in Franklin Parish
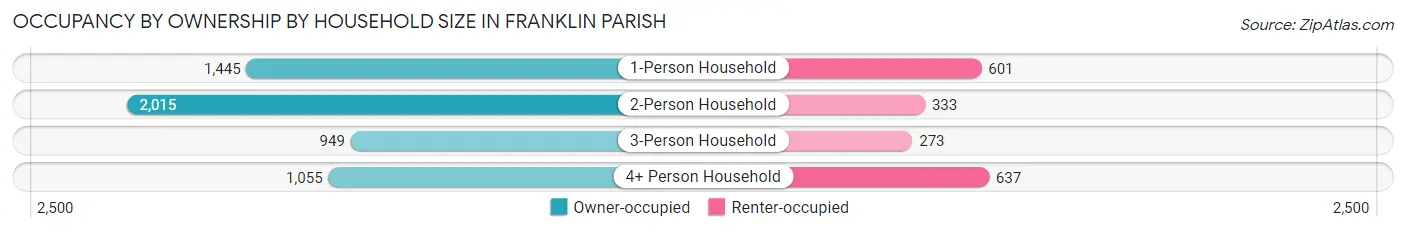
| Household Size | Owner-occupied | Renter-occupied |
| 1-Person Household | 1,445 (70.6%) | 601 (29.4%) |
| 2-Person Household | 2,015 (85.8%) | 333 (14.2%) |
| 3-Person Household | 949 (77.7%) | 273 (22.3%) |
| 4+ Person Household | 1,055 (62.4%) | 637 (37.7%) |
| Total Housing Units | 5,464 (74.8%) | 1,844 (25.2%) |
Occupancy by Educational Attainment in Franklin Parish
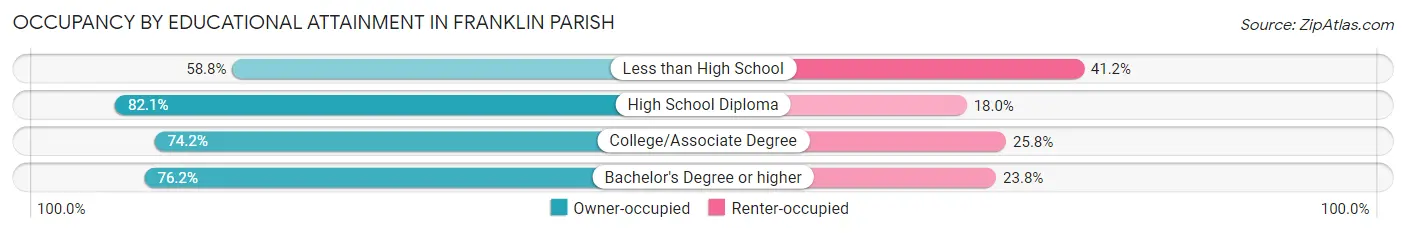
| Household Size | Owner-occupied | Renter-occupied |
| Less than High School | 864 (58.8%) | 605 (41.2%) |
| High School Diploma | 2,555 (82.1%) | 559 (17.9%) |
| College/Associate Degree | 1,193 (74.2%) | 414 (25.8%) |
| Bachelor's Degree or higher | 852 (76.2%) | 266 (23.8%) |
Occupancy by Age of Householder in Franklin Parish
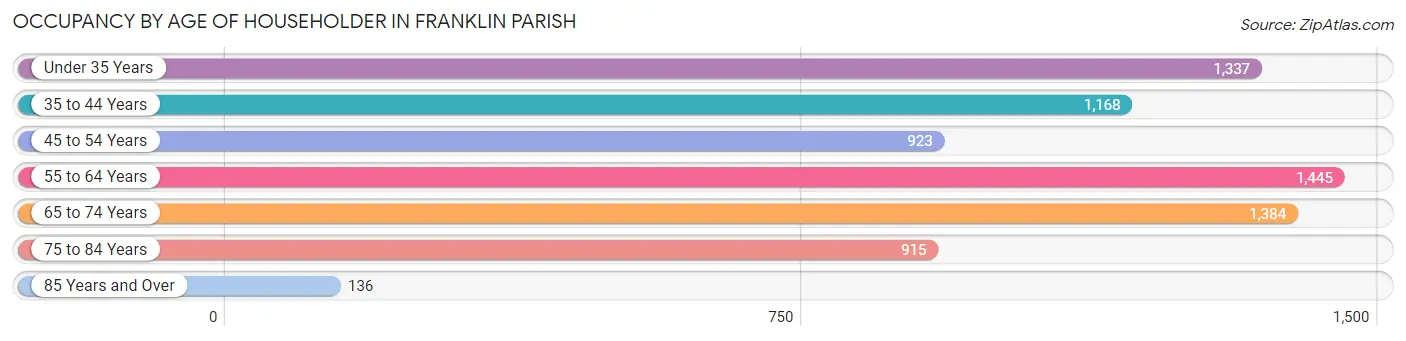
| Age Bracket | # Households | % Households |
| Under 35 Years | 1,337 | 18.3% |
| 35 to 44 Years | 1,168 | 16.0% |
| 45 to 54 Years | 923 | 12.6% |
| 55 to 64 Years | 1,445 | 19.8% |
| 65 to 74 Years | 1,384 | 18.9% |
| 75 to 84 Years | 915 | 12.5% |
| 85 Years and Over | 136 | 1.9% |
| Total | 7,308 | 100.0% |
Housing Finances in Franklin Parish
Median Income by Occupancy in Franklin Parish
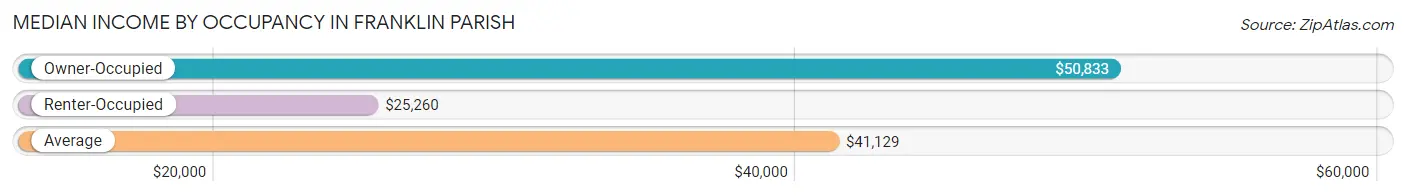
| Occupancy Type | # Households | Median Income |
| Owner-Occupied | 5,464 (74.8%) | $50,833 |
| Renter-Occupied | 1,844 (25.2%) | $25,260 |
| Average | 7,308 (100.0%) | $41,129 |
Occupancy by Householder Income Bracket in Franklin Parish
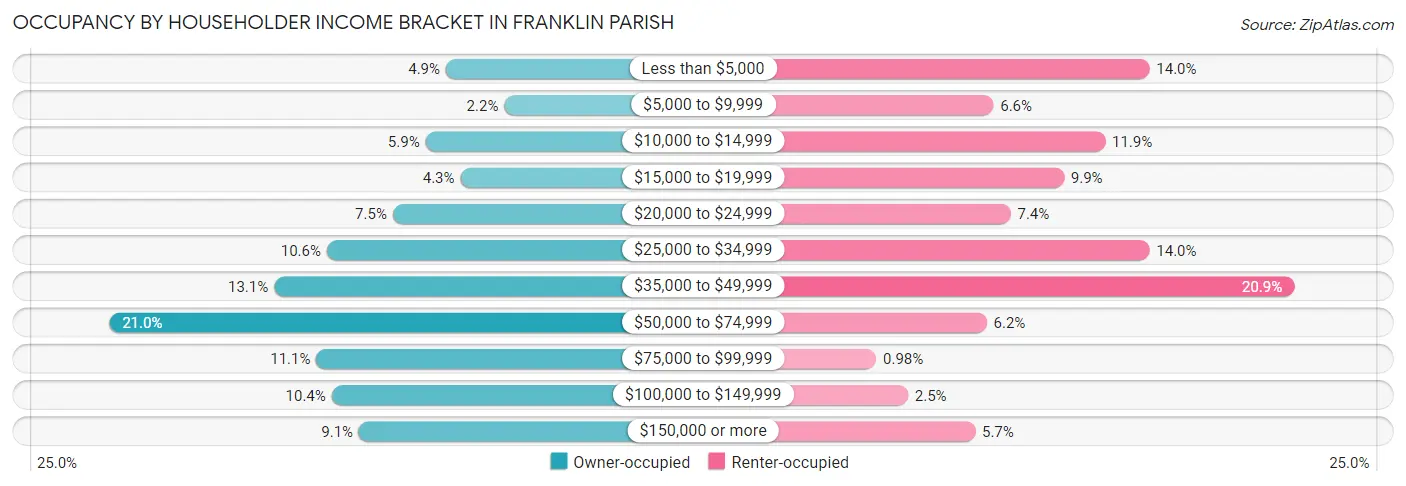
| Income Bracket | Owner-occupied | Renter-occupied |
| Less than $5,000 | 270 (4.9%) | 258 (14.0%) |
| $5,000 to $9,999 | 118 (2.2%) | 121 (6.6%) |
| $10,000 to $14,999 | 323 (5.9%) | 219 (11.9%) |
| $15,000 to $19,999 | 232 (4.3%) | 183 (9.9%) |
| $20,000 to $24,999 | 408 (7.5%) | 136 (7.4%) |
| $25,000 to $34,999 | 580 (10.6%) | 258 (14.0%) |
| $35,000 to $49,999 | 717 (13.1%) | 385 (20.9%) |
| $50,000 to $74,999 | 1,146 (21.0%) | 115 (6.2%) |
| $75,000 to $99,999 | 607 (11.1%) | 18 (1.0%) |
| $100,000 to $149,999 | 567 (10.4%) | 46 (2.5%) |
| $150,000 or more | 496 (9.1%) | 105 (5.7%) |
| Total | 5,464 (100.0%) | 1,844 (100.0%) |
Monthly Housing Cost Tiers in Franklin Parish
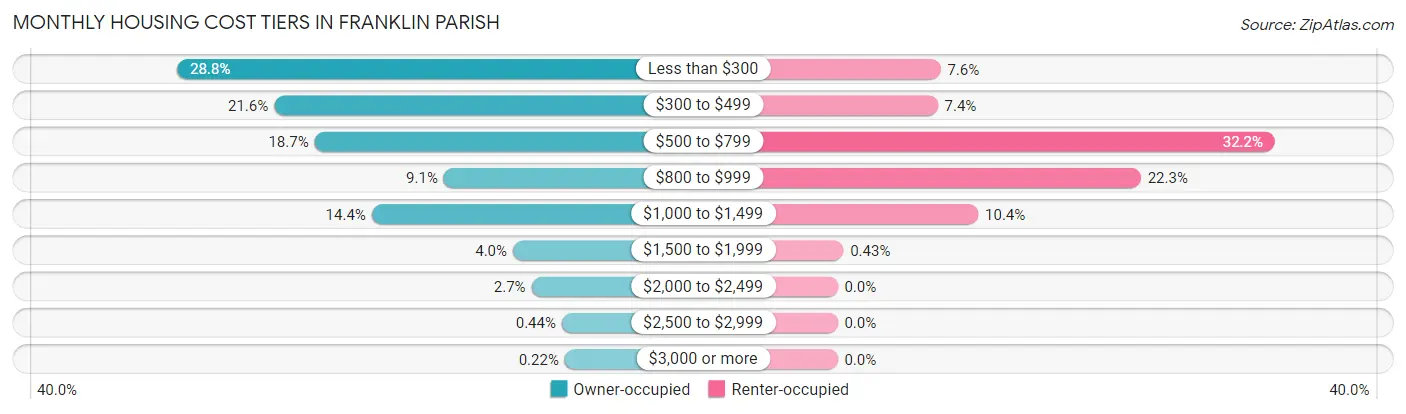
| Monthly Cost | Owner-occupied | Renter-occupied |
| Less than $300 | 1,572 (28.8%) | 140 (7.6%) |
| $300 to $499 | 1,182 (21.6%) | 136 (7.4%) |
| $500 to $799 | 1,019 (18.6%) | 594 (32.2%) |
| $800 to $999 | 499 (9.1%) | 412 (22.3%) |
| $1,000 to $1,499 | 789 (14.4%) | 191 (10.4%) |
| $1,500 to $1,999 | 221 (4.0%) | 8 (0.4%) |
| $2,000 to $2,499 | 146 (2.7%) | 0 (0.0%) |
| $2,500 to $2,999 | 24 (0.4%) | 0 (0.0%) |
| $3,000 or more | 12 (0.2%) | 0 (0.0%) |
| Total | 5,464 (100.0%) | 1,844 (100.0%) |
Physical Housing Characteristics in Franklin Parish
Housing Structures in Franklin Parish
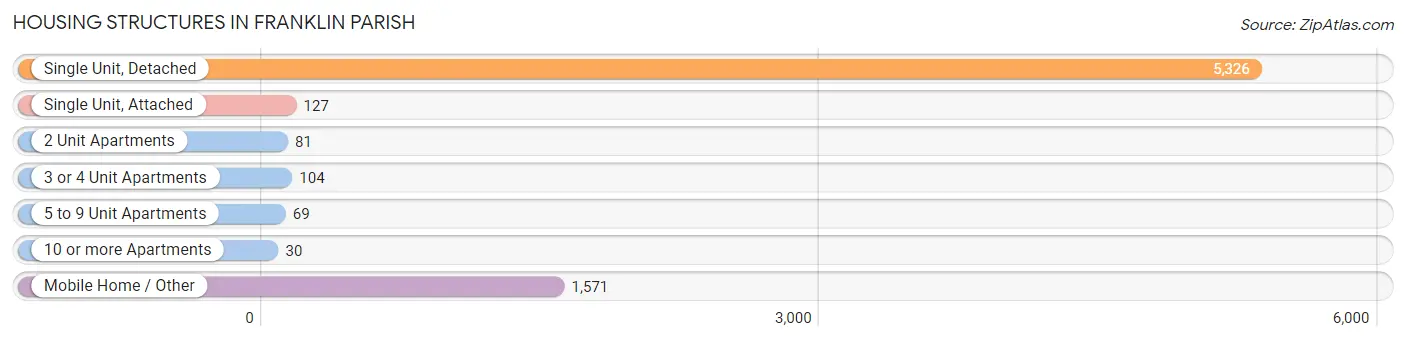
| Structure Type | # Housing Units | % Housing Units |
| Single Unit, Detached | 5,326 | 72.9% |
| Single Unit, Attached | 127 | 1.7% |
| 2 Unit Apartments | 81 | 1.1% |
| 3 or 4 Unit Apartments | 104 | 1.4% |
| 5 to 9 Unit Apartments | 69 | 0.9% |
| 10 or more Apartments | 30 | 0.4% |
| Mobile Home / Other | 1,571 | 21.5% |
| Total | 7,308 | 100.0% |
Housing Structures by Occupancy in Franklin Parish
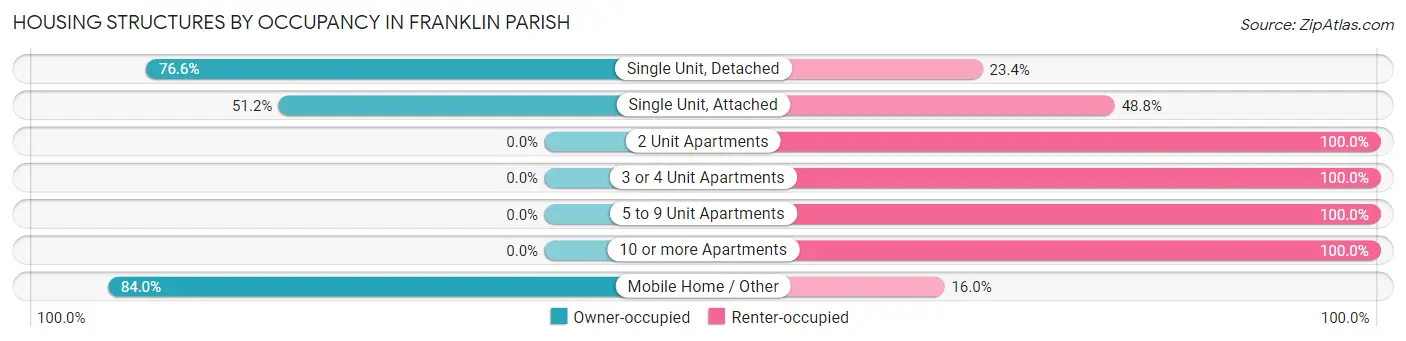
| Structure Type | Owner-occupied | Renter-occupied |
| Single Unit, Detached | 4,080 (76.6%) | 1,246 (23.4%) |
| Single Unit, Attached | 65 (51.2%) | 62 (48.8%) |
| 2 Unit Apartments | 0 (0.0%) | 81 (100.0%) |
| 3 or 4 Unit Apartments | 0 (0.0%) | 104 (100.0%) |
| 5 to 9 Unit Apartments | 0 (0.0%) | 69 (100.0%) |
| 10 or more Apartments | 0 (0.0%) | 30 (100.0%) |
| Mobile Home / Other | 1,319 (84.0%) | 252 (16.0%) |
| Total | 5,464 (74.8%) | 1,844 (25.2%) |
Housing Structures by Number of Rooms in Franklin Parish
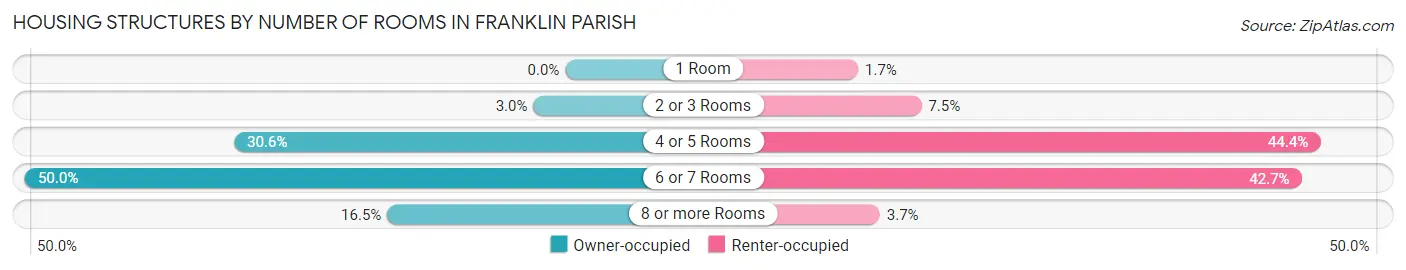
| Number of Rooms | Owner-occupied | Renter-occupied |
| 1 Room | 0 (0.0%) | 31 (1.7%) |
| 2 or 3 Rooms | 161 (2.9%) | 139 (7.5%) |
| 4 or 5 Rooms | 1,673 (30.6%) | 819 (44.4%) |
| 6 or 7 Rooms | 2,730 (50.0%) | 787 (42.7%) |
| 8 or more Rooms | 900 (16.5%) | 68 (3.7%) |
| Total | 5,464 (100.0%) | 1,844 (100.0%) |
Housing Structure by Heating Type in Franklin Parish
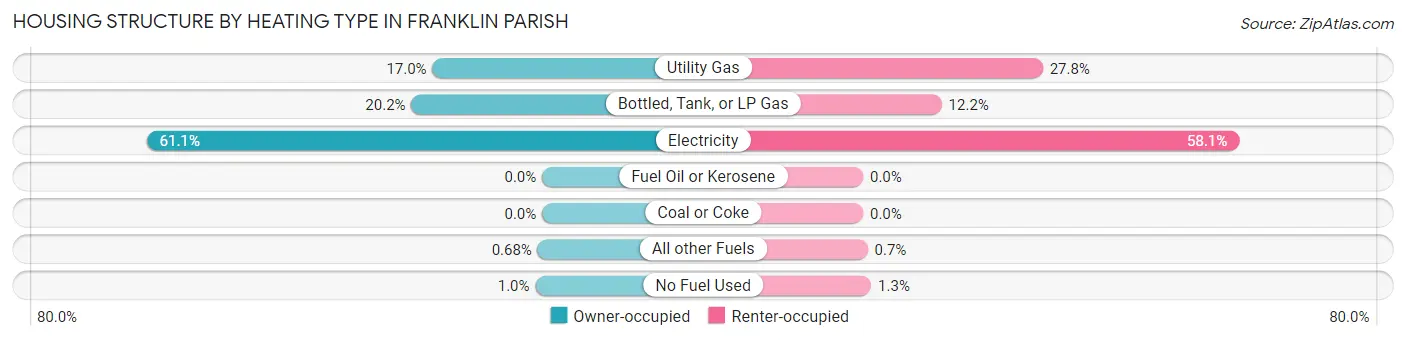
| Heating Type | Owner-occupied | Renter-occupied |
| Utility Gas | 926 (17.0%) | 512 (27.8%) |
| Bottled, Tank, or LP Gas | 1,104 (20.2%) | 224 (12.1%) |
| Electricity | 3,340 (61.1%) | 1,072 (58.1%) |
| Fuel Oil or Kerosene | 0 (0.0%) | 0 (0.0%) |
| Coal or Coke | 0 (0.0%) | 0 (0.0%) |
| All other Fuels | 37 (0.7%) | 13 (0.7%) |
| No Fuel Used | 57 (1.0%) | 23 (1.3%) |
| Total | 5,464 (100.0%) | 1,844 (100.0%) |
Household Vehicle Usage in Franklin Parish
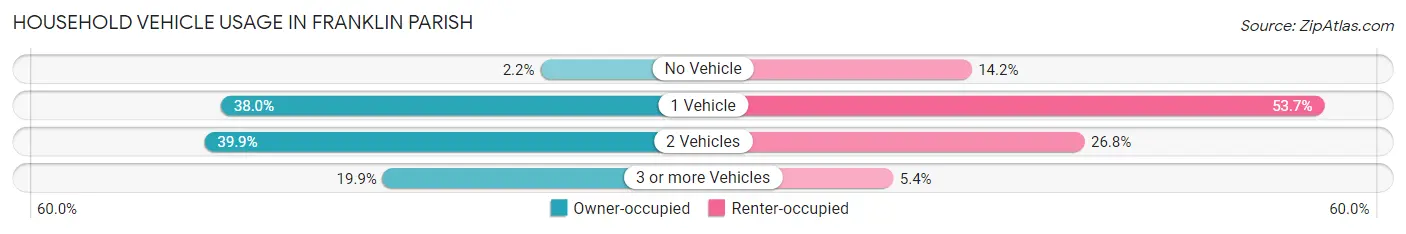
| Vehicles per Household | Owner-occupied | Renter-occupied |
| No Vehicle | 122 (2.2%) | 261 (14.1%) |
| 1 Vehicle | 2,077 (38.0%) | 990 (53.7%) |
| 2 Vehicles | 2,178 (39.9%) | 494 (26.8%) |
| 3 or more Vehicles | 1,087 (19.9%) | 99 (5.4%) |
| Total | 5,464 (100.0%) | 1,844 (100.0%) |
Real Estate & Mortgages in Franklin Parish
Real Estate and Mortgage Overview in Franklin Parish
| Characteristic | Without Mortgage | With Mortgage |
| Housing Units | 3,508 | 1,956 |
| Median Property Value | $88,700 | $117,700 |
| Median Household Income | $44,886 | $163 |
| Monthly Housing Costs | $323 | $12 |
| Real Estate Taxes | $272 | $634 |
Property Value by Mortgage Status in Franklin Parish
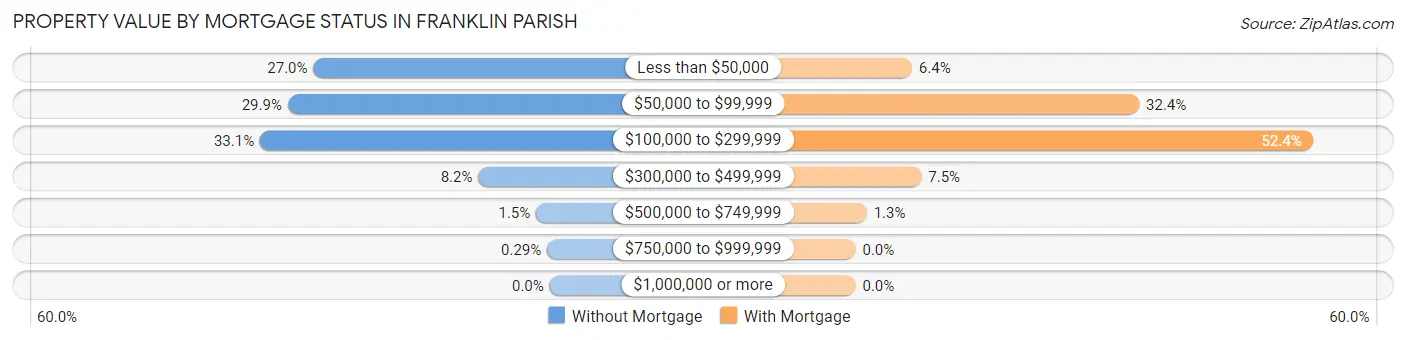
| Property Value | Without Mortgage | With Mortgage |
| Less than $50,000 | 947 (27.0%) | 126 (6.4%) |
| $50,000 to $99,999 | 1,050 (29.9%) | 634 (32.4%) |
| $100,000 to $299,999 | 1,161 (33.1%) | 1,024 (52.3%) |
| $300,000 to $499,999 | 286 (8.2%) | 147 (7.5%) |
| $500,000 to $749,999 | 54 (1.5%) | 25 (1.3%) |
| $750,000 to $999,999 | 10 (0.3%) | 0 (0.0%) |
| $1,000,000 or more | 0 (0.0%) | 0 (0.0%) |
| Total | 3,508 (100.0%) | 1,956 (100.0%) |
Household Income by Mortgage Status in Franklin Parish
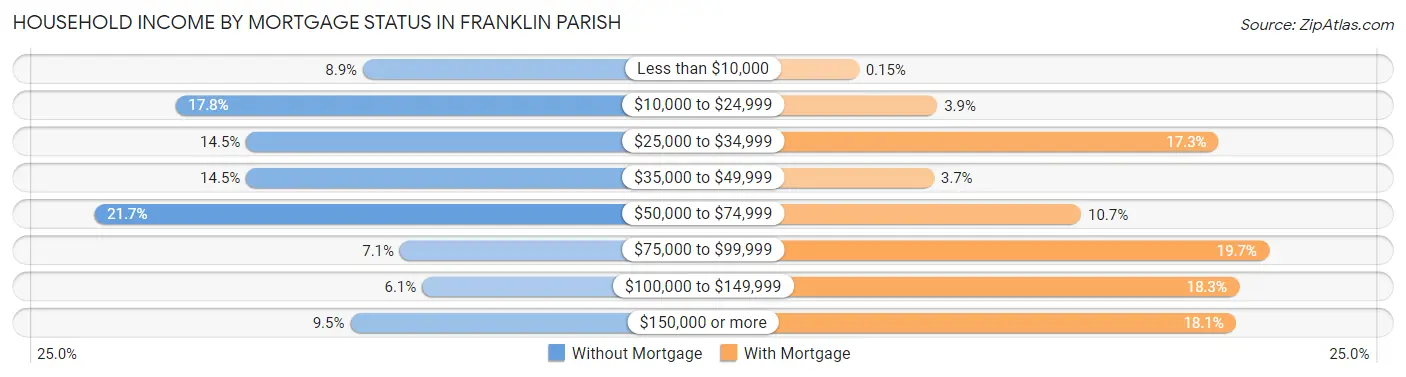
| Household Income | Without Mortgage | With Mortgage |
| Less than $10,000 | 312 (8.9%) | 3 (0.2%) |
| $10,000 to $24,999 | 625 (17.8%) | 76 (3.9%) |
| $25,000 to $34,999 | 507 (14.4%) | 338 (17.3%) |
| $35,000 to $49,999 | 507 (14.4%) | 73 (3.7%) |
| $50,000 to $74,999 | 761 (21.7%) | 210 (10.7%) |
| $75,000 to $99,999 | 250 (7.1%) | 385 (19.7%) |
| $100,000 to $149,999 | 213 (6.1%) | 357 (18.2%) |
| $150,000 or more | 333 (9.5%) | 354 (18.1%) |
| Total | 3,508 (100.0%) | 1,956 (100.0%) |
Property Value to Household Income Ratio in Franklin Parish
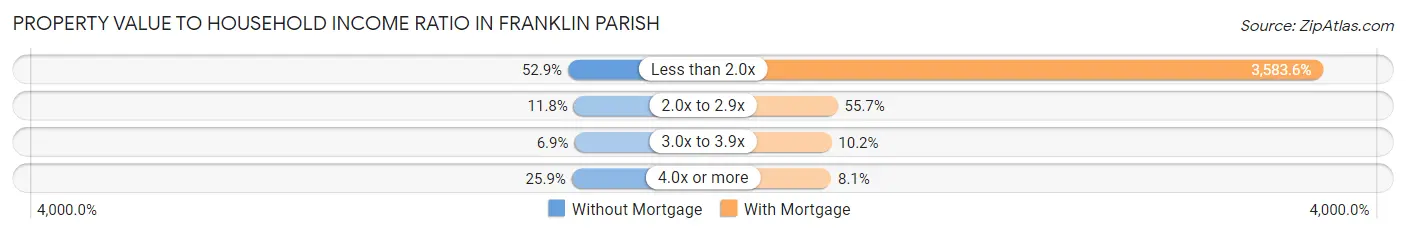
| Value-to-Income Ratio | Without Mortgage | With Mortgage |
| Less than 2.0x | 1,854 (52.8%) | 70,096 (3,583.6%) |
| 2.0x to 2.9x | 414 (11.8%) | 1,089 (55.7%) |
| 3.0x to 3.9x | 242 (6.9%) | 200 (10.2%) |
| 4.0x or more | 909 (25.9%) | 158 (8.1%) |
| Total | 3,508 (100.0%) | 1,956 (100.0%) |
Real Estate Taxes by Mortgage Status in Franklin Parish
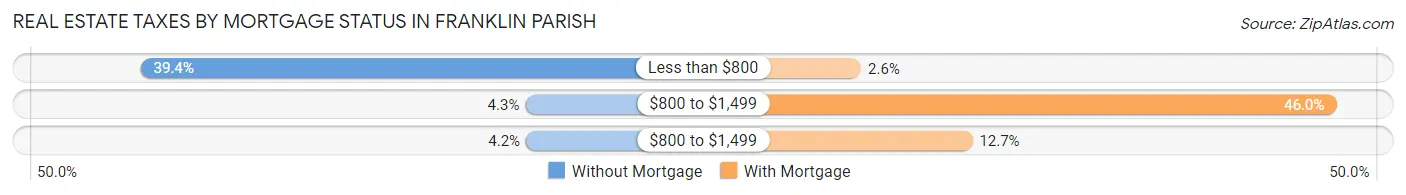
| Property Taxes | Without Mortgage | With Mortgage |
| Less than $800 | 1,382 (39.4%) | 50 (2.6%) |
| $800 to $1,499 | 150 (4.3%) | 899 (46.0%) |
| $800 to $1,499 | 148 (4.2%) | 249 (12.7%) |
| Total | 3,508 (100.0%) | 1,956 (100.0%) |
Health & Disability in Franklin Parish
Health Insurance Coverage by Age in Franklin Parish
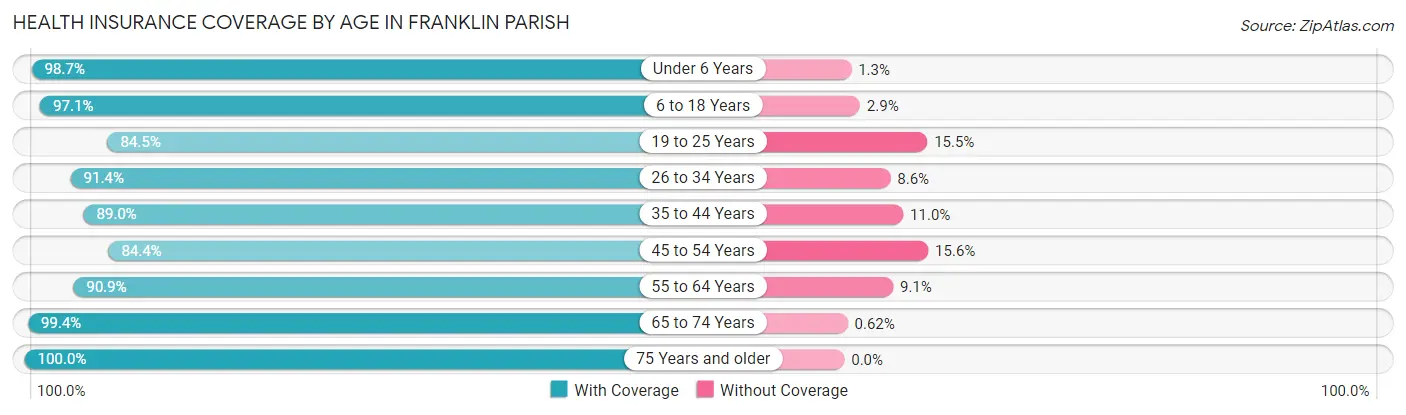
| Age Bracket | With Coverage | Without Coverage |
| Under 6 Years | 1,527 (98.7%) | 20 (1.3%) |
| 6 to 18 Years | 3,475 (97.1%) | 104 (2.9%) |
| 19 to 25 Years | 1,356 (84.5%) | 248 (15.5%) |
| 26 to 34 Years | 1,692 (91.4%) | 159 (8.6%) |
| 35 to 44 Years | 1,971 (89.0%) | 243 (11.0%) |
| 45 to 54 Years | 1,607 (84.4%) | 298 (15.6%) |
| 55 to 64 Years | 2,321 (90.9%) | 232 (9.1%) |
| 65 to 74 Years | 2,099 (99.4%) | 13 (0.6%) |
| 75 Years and older | 1,418 (100.0%) | 0 (0.0%) |
| Total | 17,466 (93.0%) | 1,317 (7.0%) |
Health Insurance Coverage by Citizenship Status in Franklin Parish
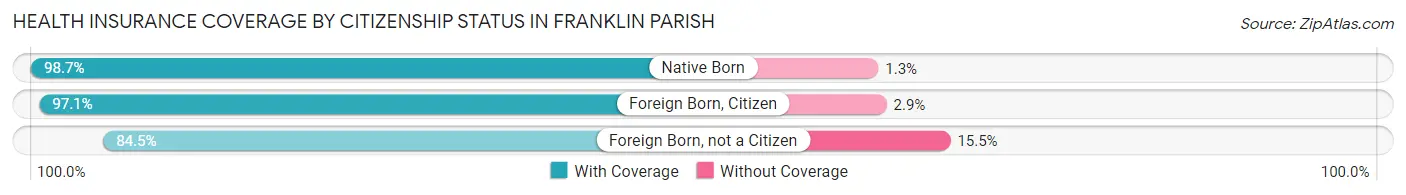
| Citizenship Status | With Coverage | Without Coverage |
| Native Born | 1,527 (98.7%) | 20 (1.3%) |
| Foreign Born, Citizen | 3,475 (97.1%) | 104 (2.9%) |
| Foreign Born, not a Citizen | 1,356 (84.5%) | 248 (15.5%) |
Health Insurance Coverage by Household Income in Franklin Parish
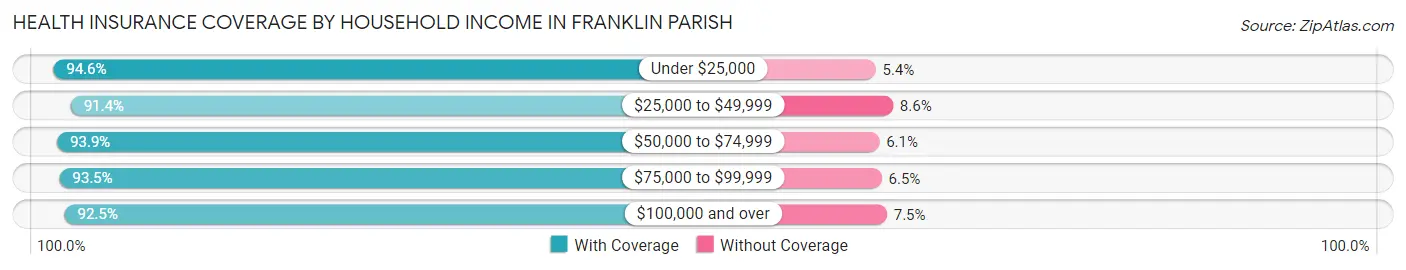
| Household Income | With Coverage | Without Coverage |
| Under $25,000 | 4,795 (94.6%) | 273 (5.4%) |
| $25,000 to $49,999 | 4,333 (91.4%) | 410 (8.6%) |
| $50,000 to $74,999 | 3,173 (93.9%) | 205 (6.1%) |
| $75,000 to $99,999 | 1,578 (93.5%) | 110 (6.5%) |
| $100,000 and over | 3,493 (92.5%) | 283 (7.5%) |
Public vs Private Health Insurance Coverage by Age in Franklin Parish
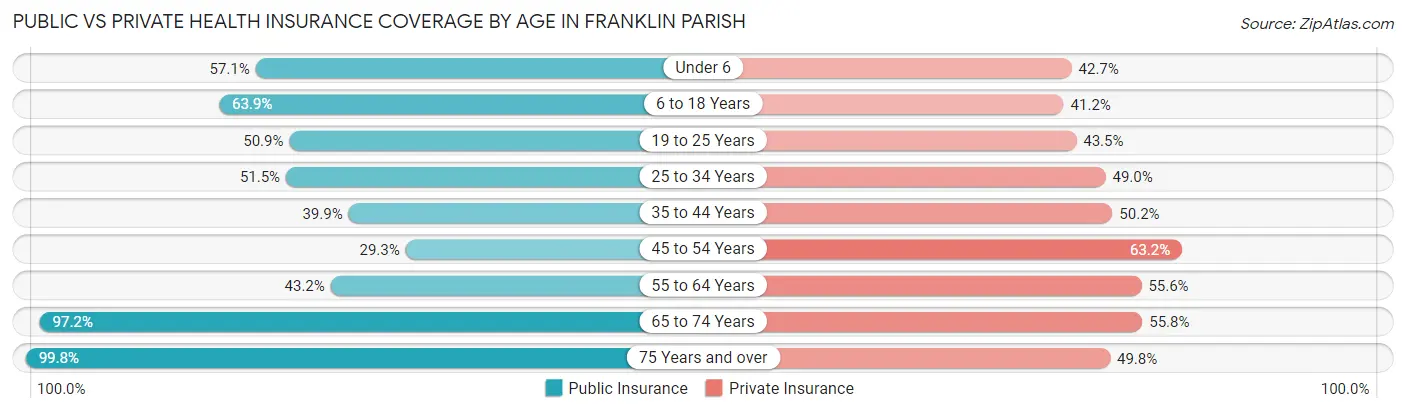
| Age Bracket | Public Insurance | Private Insurance |
| Under 6 | 884 (57.1%) | 660 (42.7%) |
| 6 to 18 Years | 2,287 (63.9%) | 1,474 (41.2%) |
| 19 to 25 Years | 816 (50.9%) | 698 (43.5%) |
| 25 to 34 Years | 953 (51.5%) | 906 (48.9%) |
| 35 to 44 Years | 883 (39.9%) | 1,112 (50.2%) |
| 45 to 54 Years | 558 (29.3%) | 1,203 (63.1%) |
| 55 to 64 Years | 1,103 (43.2%) | 1,420 (55.6%) |
| 65 to 74 Years | 2,053 (97.2%) | 1,178 (55.8%) |
| 75 Years and over | 1,415 (99.8%) | 706 (49.8%) |
| Total | 10,952 (58.3%) | 9,357 (49.8%) |
Disability Status by Sex by Age in Franklin Parish
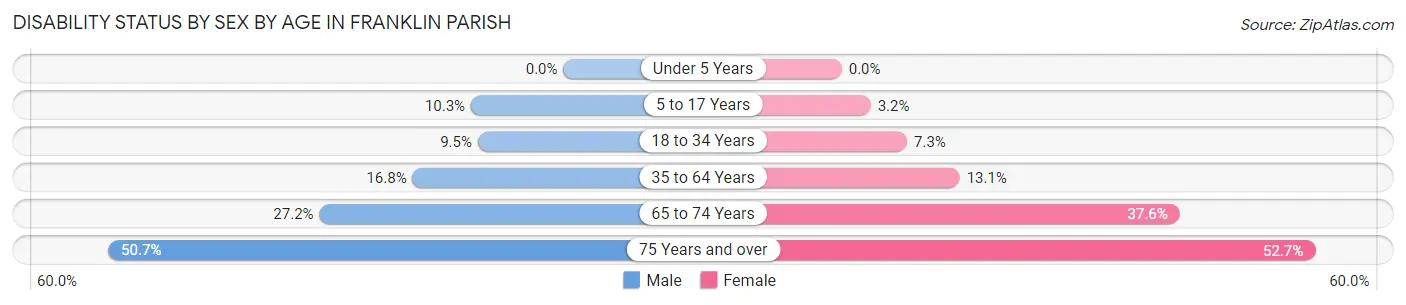
| Age Bracket | Male | Female |
| Under 5 Years | 0 (0.0%) | 0 (0.0%) |
| 5 to 17 Years | 188 (10.3%) | 57 (3.2%) |
| 18 to 34 Years | 150 (9.5%) | 152 (7.3%) |
| 35 to 64 Years | 508 (16.8%) | 479 (13.1%) |
| 65 to 74 Years | 282 (27.2%) | 404 (37.6%) |
| 75 Years and over | 258 (50.7%) | 479 (52.7%) |
Disability Class by Sex by Age in Franklin Parish
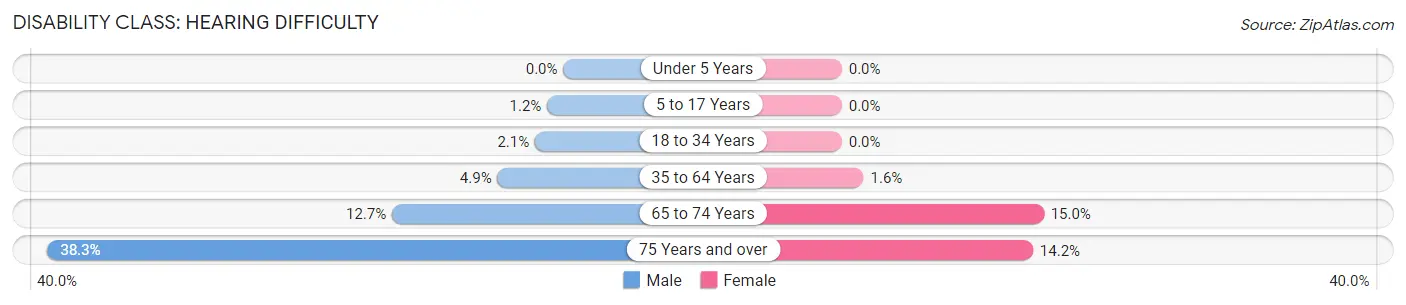
Disability Class: Hearing Difficulty
| Age Bracket | Male | Female |
| Under 5 Years | 0 (0.0%) | 0 (0.0%) |
| 5 to 17 Years | 22 (1.2%) | 0 (0.0%) |
| 18 to 34 Years | 33 (2.1%) | 0 (0.0%) |
| 35 to 64 Years | 148 (4.9%) | 59 (1.6%) |
| 65 to 74 Years | 132 (12.7%) | 161 (15.0%) |
| 75 Years and over | 195 (38.3%) | 129 (14.2%) |
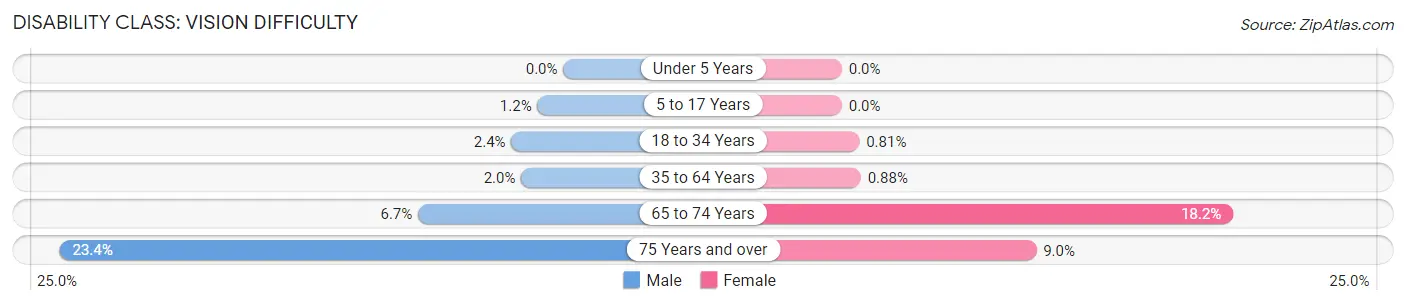
Disability Class: Vision Difficulty
| Age Bracket | Male | Female |
| Under 5 Years | 0 (0.0%) | 0 (0.0%) |
| 5 to 17 Years | 22 (1.2%) | 0 (0.0%) |
| 18 to 34 Years | 38 (2.4%) | 17 (0.8%) |
| 35 to 64 Years | 59 (1.9%) | 32 (0.9%) |
| 65 to 74 Years | 70 (6.7%) | 195 (18.2%) |
| 75 Years and over | 119 (23.4%) | 82 (9.0%) |
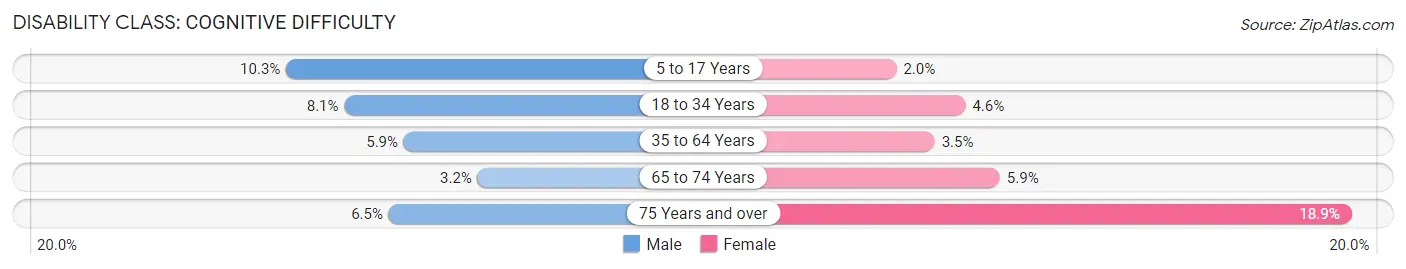
Disability Class: Cognitive Difficulty
| Age Bracket | Male | Female |
| 5 to 17 Years | 188 (10.3%) | 36 (2.0%) |
| 18 to 34 Years | 128 (8.1%) | 96 (4.6%) |
| 35 to 64 Years | 179 (5.9%) | 126 (3.5%) |
| 65 to 74 Years | 33 (3.2%) | 63 (5.9%) |
| 75 Years and over | 33 (6.5%) | 172 (18.9%) |
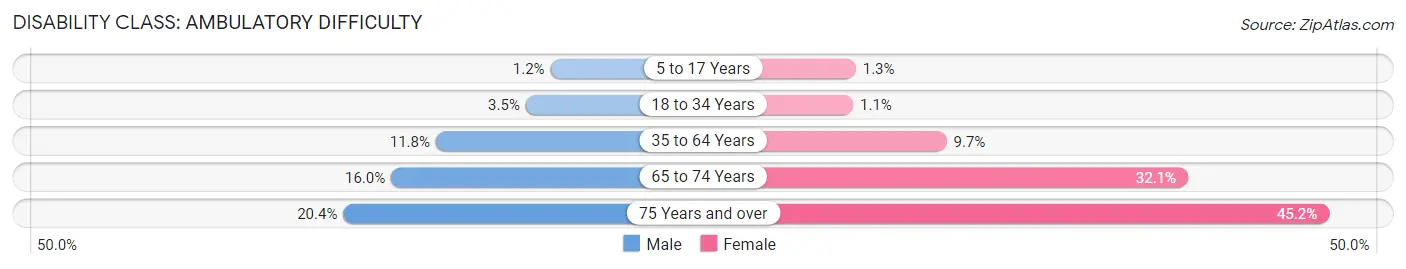
Disability Class: Ambulatory Difficulty
| Age Bracket | Male | Female |
| 5 to 17 Years | 22 (1.2%) | 23 (1.3%) |
| 18 to 34 Years | 55 (3.5%) | 22 (1.1%) |
| 35 to 64 Years | 358 (11.8%) | 355 (9.7%) |
| 65 to 74 Years | 166 (16.0%) | 345 (32.1%) |
| 75 Years and over | 104 (20.4%) | 411 (45.2%) |
Disability Class: Self-Care Difficulty
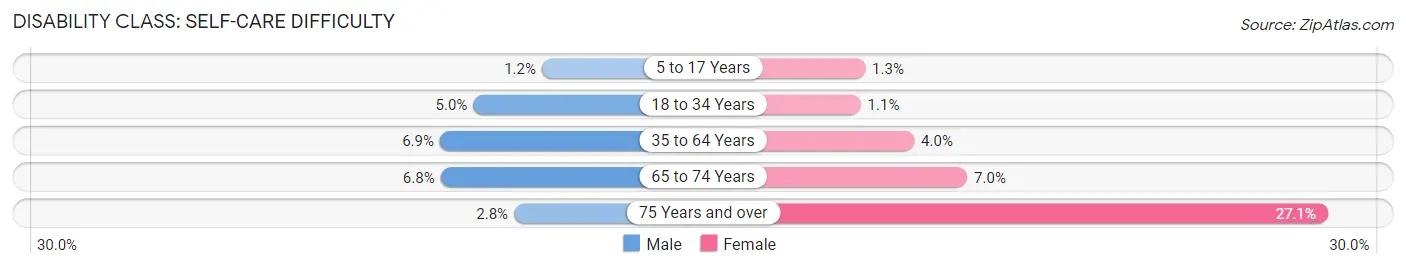
| Age Bracket | Male | Female |
| 5 to 17 Years | 22 (1.2%) | 23 (1.3%) |
| 18 to 34 Years | 79 (5.0%) | 22 (1.1%) |
| 35 to 64 Years | 208 (6.9%) | 147 (4.0%) |
| 65 to 74 Years | 71 (6.8%) | 75 (7.0%) |
| 75 Years and over | 14 (2.8%) | 246 (27.1%) |
Technology Access in Franklin Parish
Computing Device Access in Franklin Parish
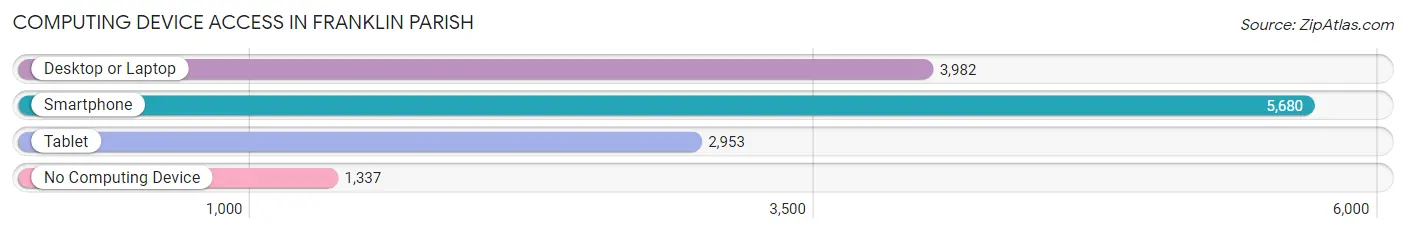
| Device Type | # Households | % Households |
| Desktop or Laptop | 3,982 | 54.5% |
| Smartphone | 5,680 | 77.7% |
| Tablet | 2,953 | 40.4% |
| No Computing Device | 1,337 | 18.3% |
| Total | 7,308 | 100.0% |
Internet Access in Franklin Parish
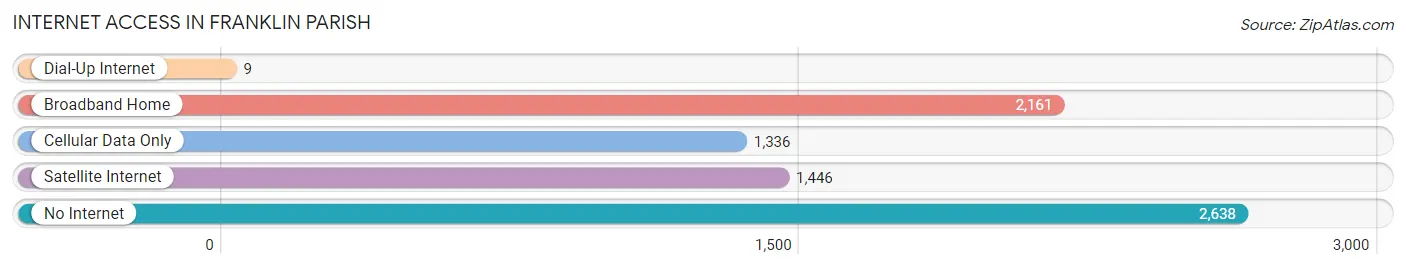
| Internet Type | # Households | % Households |
| Dial-Up Internet | 9 | 0.1% |
| Broadband Home | 2,161 | 29.6% |
| Cellular Data Only | 1,336 | 18.3% |
| Satellite Internet | 1,446 | 19.8% |
| No Internet | 2,638 | 36.1% |
| Total | 7,308 | 100.0% |
Franklin Parish Summary
Franklin Parish is a parish located in the northeastern part of the state of Louisiana. It is bordered by Ouachita Parish to the north, Richland Parish to the east, Madison Parish to the south, and Caldwell Parish to the west. The parish seat is Winnsboro, and the largest city is Winnsboro. The parish was created in 1843 and named for Benjamin Franklin.
Geography
Franklin Parish is located in the northeastern part of Louisiana and is bordered by Ouachita Parish to the north, Richland Parish to the east, Madison Parish to the south, and Caldwell Parish to the west. The parish has a total area of 590 square miles, of which 586 square miles is land and 4 square miles (0.7%) is water. The terrain is mostly flat with some rolling hills. The parish is drained by the Ouachita River and its tributaries.
Demographics
As of the 2010 census, there were 20,767 people, 7,845 households, and 5,619 families residing in the parish. The population density was 35.4 people per square mile. The racial makeup of the parish was 68.2% White, 29.7% African American, 0.3% Native American, 0.2% Asian, 0.2% from other races, and 1.4% from two or more races. Hispanic or Latino of any race were 1.2% of the population.
The median income for a household in the parish was $30,917, and the median income for a family was $37,945. The per capita income for the parish was $15,845. About 19.2% of families and 24.2% of the population were below the poverty line, including 33.2% of those under age 18 and 20.2% of those age 65 or over.
Economy
Franklin Parish is a rural parish with a largely agricultural economy. The main crops grown in the parish are cotton, soybeans, corn, and wheat. The parish also has a large timber industry, with pine and hardwood being the main products. The parish is also home to several manufacturing companies, including a paper mill, a furniture factory, and a plastics plant.
The parish is served by two major highways, U.S. Route 425 and Louisiana Highway 15. The parish also has a small airport, the Franklin Parish Airport, located in Winnsboro.
History
Franklin Parish was created in 1843 from portions of Ouachita and Madison parishes. It was named for Benjamin Franklin, one of the Founding Fathers of the United States.
The parish was largely agricultural in its early years, with cotton, corn, and wheat being the main crops. The timber industry also began to develop in the late 19th century, with pine and hardwood being the main products.
In the early 20th century, the parish began to develop a manufacturing sector, with a paper mill, a furniture factory, and a plastics plant all opening in the 1920s. The parish also began to develop a tourism industry, with the opening of several hunting lodges and fishing camps.
In the 1950s, the parish began to experience a population boom, with the population increasing from 12,000 in 1950 to 20,000 in 1960. This population growth was largely due to the development of the oil and gas industry in the parish.
Today, Franklin Parish is a largely rural parish with a largely agricultural economy. The main crops grown in the parish are cotton, soybeans, corn, and wheat. The timber industry is also still important, with pine and hardwood being the main products. The parish is also home to several manufacturing companies, including a paper mill, a furniture factory, and a plastics plant. The parish is served by two major highways, U.S. Route 425 and Louisiana Highway 15. The parish also has a small airport, the Franklin Parish Airport, located in Winnsboro.
Common Questions
What is the Total Population of Franklin Parish?
Total Population of Franklin Parish is 19,752.
What is the Total Male Population of Franklin Parish?
Total Male Population of Franklin Parish is 9,408.
What is the Total Female Population of Franklin Parish?
Total Female Population of Franklin Parish is 10,344.
What is the Ratio of Males per 100 Females in Franklin Parish?
There are 90.95 Males per 100 Females in Franklin Parish.
What is the Ratio of Females per 100 Males in Franklin Parish?
There are 109.95 Females per 100 Males in Franklin Parish.
What is the Median Population Age in Franklin Parish?
Median Population Age in Franklin Parish is 39.0 Years.
What is the Average Family Size in Franklin Parish
Average Family Size in Franklin Parish is 3.1 People.
What is the Average Household Size in Franklin Parish
Average Household Size in Franklin Parish is 2.5 People.
What is Per Capita Income in Franklin Parish?
Per Capita income in Franklin Parish is $23,658.
What is the Median Family Income in Franklin Parish?
Median Family Income in Franklin Parish is $50,753.
What is the Median Household income in Franklin Parish?
Median Household Income in Franklin Parish is $41,129.
What is Income or Wage Gap in Franklin Parish?
Income or Wage Gap in Franklin Parish is 29.8%.
Women in Franklin Parish earn 70.2 cents for every dollar earned by a man.
What is Family Income Deficit in Franklin Parish?
Family Income Deficit in Franklin Parish is $13,658.
Families that are below poverty line in Franklin Parish earn $13,658 less on average than the poverty threshold level.
What is Inequality or Gini Index in Franklin Parish?
Inequality or Gini Index in Franklin Parish is 0.50.
How Large is the Labor Force in Franklin Parish?
There are 7,368 People in the Labor Forcein in Franklin Parish.
What is the Percentage of People in the Labor Force in Franklin Parish?
48.1% of People are in the Labor Force in Franklin Parish.
What is the Unemployment Rate in Franklin Parish?
Unemployment Rate in Franklin Parish is 9.2%.