East Feliciana Parish, LA
East Feliciana Parish Map
East Feliciana Parish Overview
19,452
TOTAL POPULATION
10,737
MALE POPULATION
8,715
FEMALE POPULATION
123.20
MALES / 100 FEMALES
81.17
FEMALES / 100 MALES
44.3
MEDIAN AGE
3.1
AVG FAMILY SIZE
2.5
AVG HOUSEHOLD SIZE
$32,720
PER CAPITA INCOME
$85,571
AVG FAMILY INCOME
$64,709
AVG HOUSEHOLD INCOME
27.7%
WAGE / INCOME GAP [ % ]
72.3¢/ $1
WAGE / INCOME GAP [ $ ]
$8,318
FAMILY INCOME DEFICIT
0.49
INEQUALITY / GINI INDEX
7,041
LABOR FORCE [ PEOPLE ]
42.5%
PERCENT IN LABOR FORCE
5.5%
UNEMPLOYMENT RATE
East Feliciana Parish Area Codes
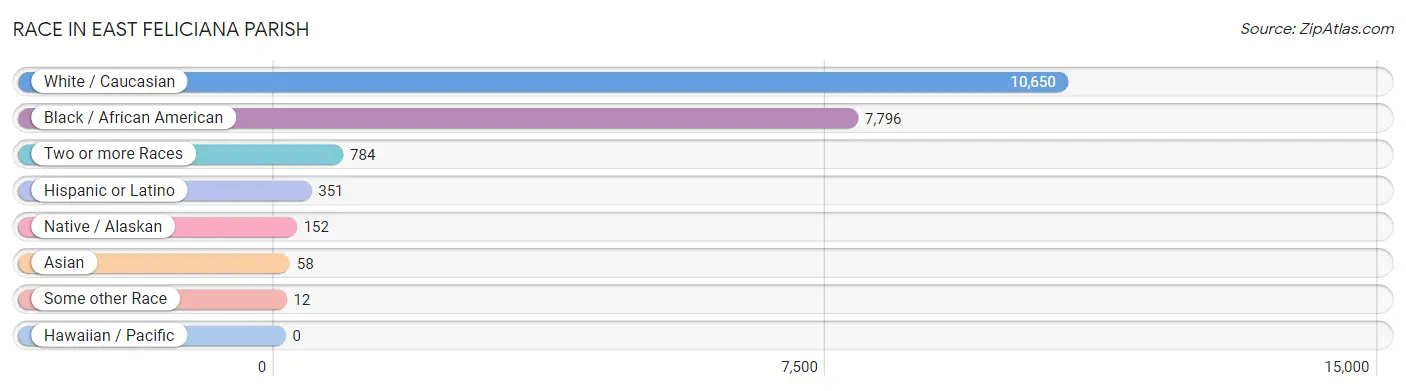
Race in East Feliciana Parish
The most populous races in East Feliciana Parish are White / Caucasian (10,650 | 54.7%), Black / African American (7,796 | 40.1%), and Two or more Races (784 | 4.0%).
| Race | # Population | % Population |
| Asian | 58 | 0.3% |
| Black / African American | 7,796 | 40.1% |
| Hawaiian / Pacific | 0 | 0.0% |
| Hispanic or Latino | 351 | 1.8% |
| Native / Alaskan | 152 | 0.8% |
| White / Caucasian | 10,650 | 54.7% |
| Two or more Races | 784 | 4.0% |
| Some other Race | 12 | 0.1% |
| Total | 19,452 | 100.0% |
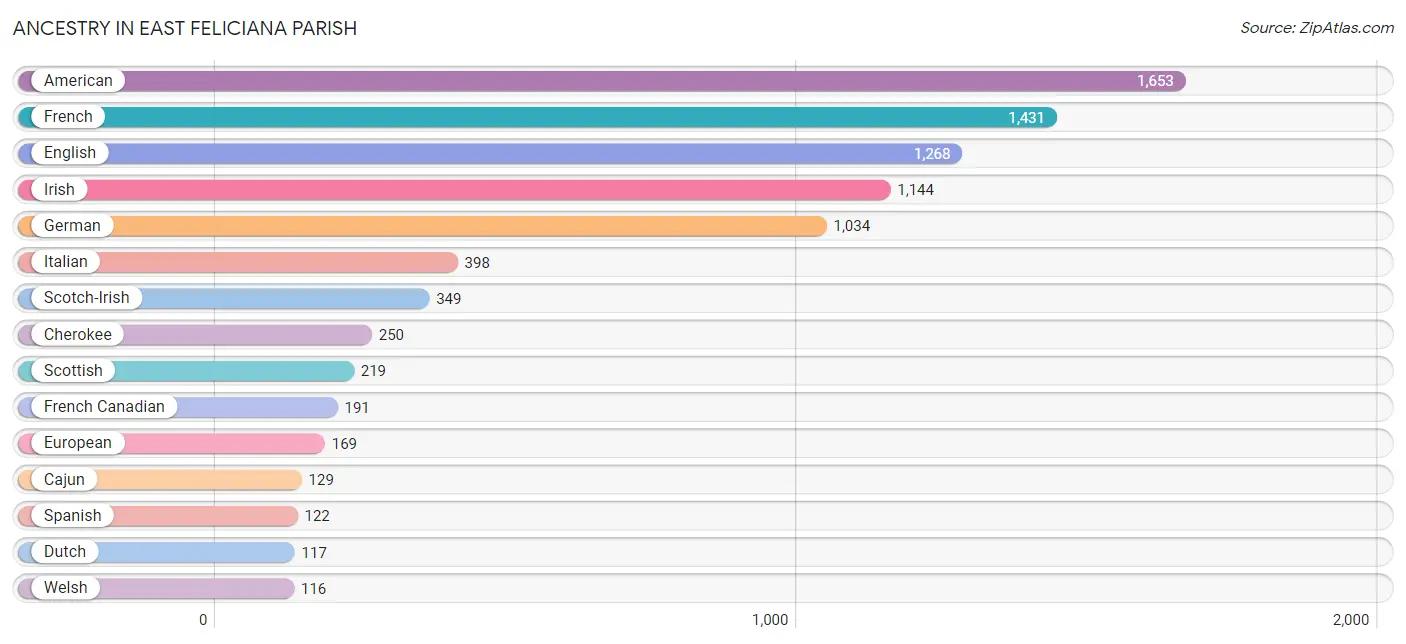
Ancestry in East Feliciana Parish
The most populous ancestries reported in East Feliciana Parish are American (1,653 | 8.5%), French (1,431 | 7.4%), English (1,268 | 6.5%), Irish (1,144 | 5.9%), and German (1,034 | 5.3%), together accounting for 33.6% of all East Feliciana Parish residents.
| Ancestry | # Population | % Population |
| African | 56 | 0.3% |
| American | 1,653 | 8.5% |
| Apache | 5 | 0.0% |
| Arab | 5 | 0.0% |
| Bhutanese | 44 | 0.2% |
| Blackfeet | 60 | 0.3% |
| British | 25 | 0.1% |
| Burmese | 20 | 0.1% |
| Cajun | 129 | 0.7% |
| Central American | 18 | 0.1% |
| Cherokee | 250 | 1.3% |
| Choctaw | 21 | 0.1% |
| Cuban | 17 | 0.1% |
| Czech | 10 | 0.1% |
| Danish | 18 | 0.1% |
| Dominican | 24 | 0.1% |
| Dutch | 117 | 0.6% |
| Eastern European | 17 | 0.1% |
| English | 1,268 | 6.5% |
| European | 169 | 0.9% |
| Finnish | 11 | 0.1% |
| French | 1,431 | 7.4% |
| French American Indian | 24 | 0.1% |
| French Canadian | 191 | 1.0% |
| German | 1,034 | 5.3% |
| Greek | 10 | 0.1% |
| Guatemalan | 16 | 0.1% |
| Houma | 20 | 0.1% |
| Hungarian | 42 | 0.2% |
| Irish | 1,144 | 5.9% |
| Italian | 398 | 2.1% |
| Korean | 12 | 0.1% |
| Lebanese | 1 | 0.0% |
| Mexican | 63 | 0.3% |
| Nicaraguan | 2 | 0.0% |
| Norwegian | 20 | 0.1% |
| Polish | 33 | 0.2% |
| Puerto Rican | 15 | 0.1% |
| Romanian | 6 | 0.0% |
| Russian | 3 | 0.0% |
| Scandinavian | 17 | 0.1% |
| Scotch-Irish | 349 | 1.8% |
| Scottish | 219 | 1.1% |
| Spaniard | 5 | 0.0% |
| Spanish | 122 | 0.6% |
| Sri Lankan | 9 | 0.1% |
| Subsaharan African | 56 | 0.3% |
| Swedish | 11 | 0.1% |
| Ukrainian | 14 | 0.1% |
| Welsh | 116 | 0.6% |
| West Indian | 12 | 0.1% |
| Yugoslavian | 8 | 0.0% | View All 52 Rows |
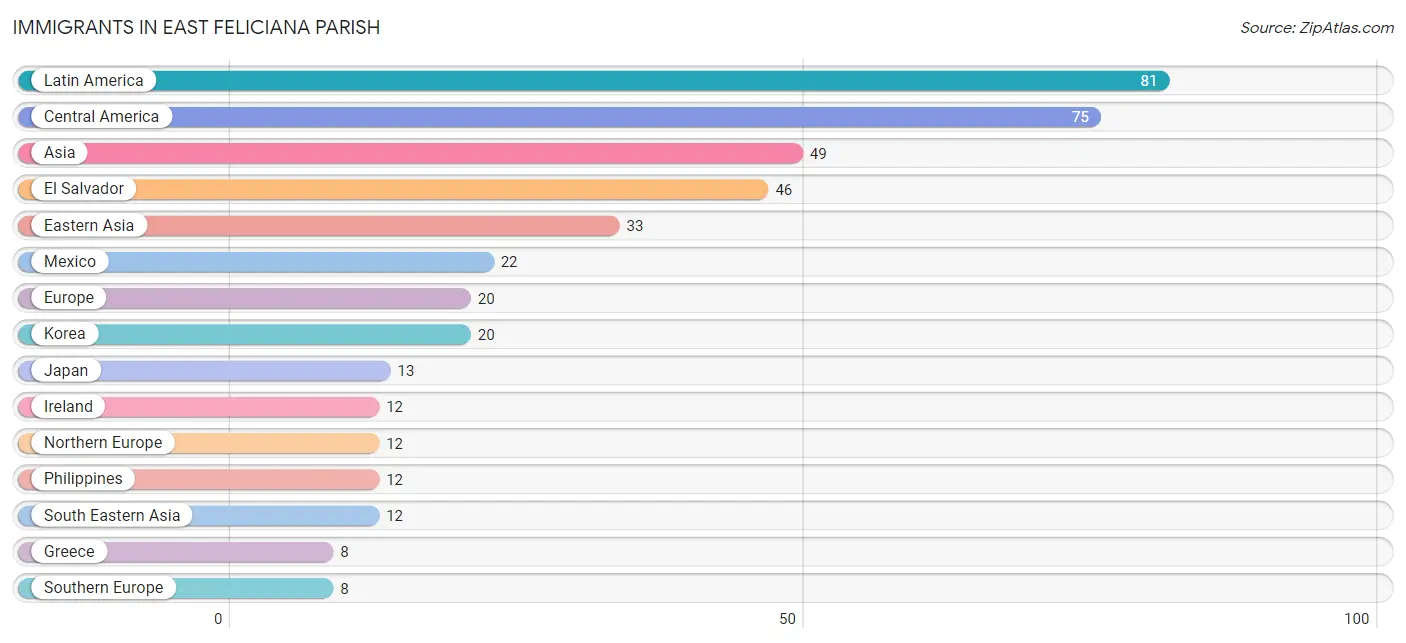
Immigrants in East Feliciana Parish
The most numerous immigrant groups reported in East Feliciana Parish came from Latin America (81 | 0.4%), Central America (75 | 0.4%), Asia (49 | 0.3%), El Salvador (46 | 0.2%), and Eastern Asia (33 | 0.2%), together accounting for 1.5% of all East Feliciana Parish residents.
| Immigration Origin | # Population | % Population |
| Asia | 49 | 0.3% |
| Australia | 3 | 0.0% |
| Caribbean | 6 | 0.0% |
| Central America | 75 | 0.4% |
| Eastern Asia | 33 | 0.2% |
| El Salvador | 46 | 0.2% |
| Europe | 20 | 0.1% |
| Greece | 8 | 0.0% |
| Honduras | 5 | 0.0% |
| Ireland | 12 | 0.1% |
| Japan | 13 | 0.1% |
| Korea | 20 | 0.1% |
| Latin America | 81 | 0.4% |
| Mexico | 22 | 0.1% |
| Nicaragua | 2 | 0.0% |
| Northern Europe | 12 | 0.1% |
| Oceania | 3 | 0.0% |
| Philippines | 12 | 0.1% |
| South Eastern Asia | 12 | 0.1% |
| Southern Europe | 8 | 0.0% |
| Western Asia | 4 | 0.0% |
| Yemen | 4 | 0.0% | View All 22 Rows |
Sex and Age in East Feliciana Parish
Sex and Age in East Feliciana Parish
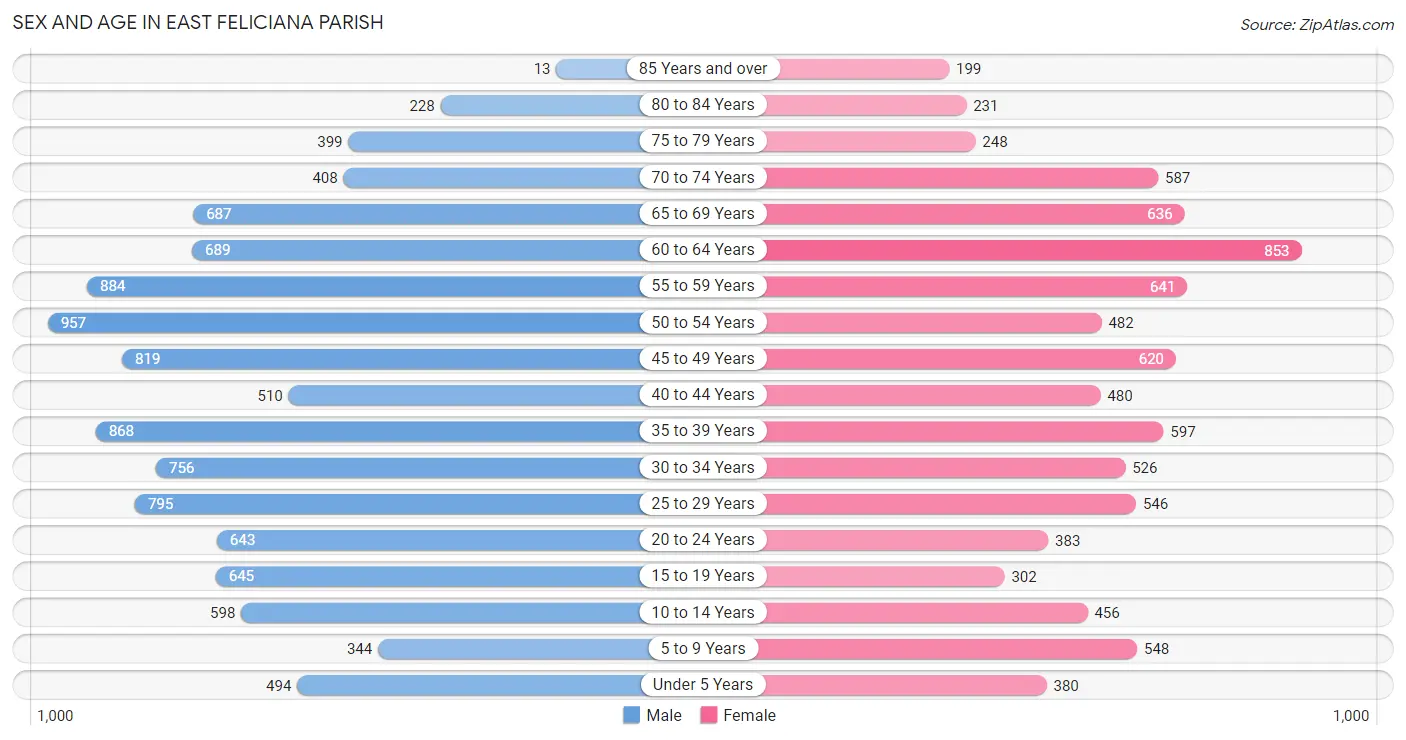
The most populous age groups in East Feliciana Parish are 50 to 54 Years (957 | 8.9%) for men and 60 to 64 Years (853 | 9.8%) for women.
| Age Bracket | Male | Female |
| Under 5 Years | 494 (4.6%) | 380 (4.4%) |
| 5 to 9 Years | 344 (3.2%) | 548 (6.3%) |
| 10 to 14 Years | 598 (5.6%) | 456 (5.2%) |
| 15 to 19 Years | 645 (6.0%) | 302 (3.5%) |
| 20 to 24 Years | 643 (6.0%) | 383 (4.4%) |
| 25 to 29 Years | 795 (7.4%) | 546 (6.3%) |
| 30 to 34 Years | 756 (7.0%) | 526 (6.0%) |
| 35 to 39 Years | 868 (8.1%) | 597 (6.9%) |
| 40 to 44 Years | 510 (4.8%) | 480 (5.5%) |
| 45 to 49 Years | 819 (7.6%) | 620 (7.1%) |
| 50 to 54 Years | 957 (8.9%) | 482 (5.5%) |
| 55 to 59 Years | 884 (8.2%) | 641 (7.4%) |
| 60 to 64 Years | 689 (6.4%) | 853 (9.8%) |
| 65 to 69 Years | 687 (6.4%) | 636 (7.3%) |
| 70 to 74 Years | 408 (3.8%) | 587 (6.7%) |
| 75 to 79 Years | 399 (3.7%) | 248 (2.9%) |
| 80 to 84 Years | 228 (2.1%) | 231 (2.6%) |
| 85 Years and over | 13 (0.1%) | 199 (2.3%) |
| Total | 10,737 (100.0%) | 8,715 (100.0%) |
Families and Households in East Feliciana Parish
Median Family Size in East Feliciana Parish
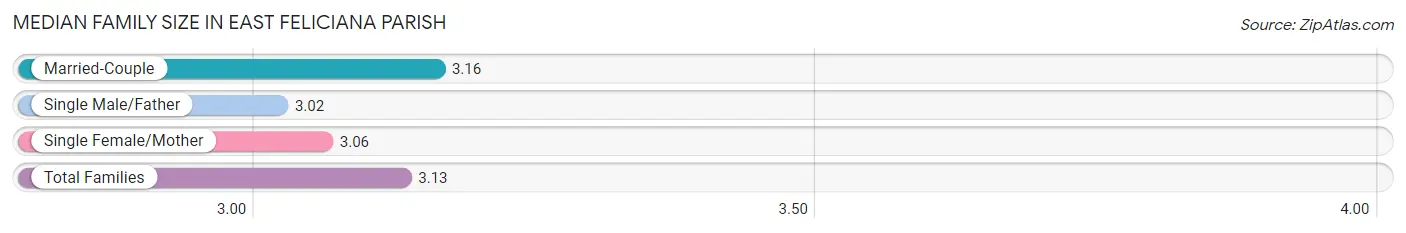
The median family size in East Feliciana Parish is 3.13 persons per family, with married-couple families (3,107 | 72.0%) accounting for the largest median family size of 3.16 persons per family. On the other hand, single male/father families (306 | 7.1%) represent the smallest median family size with 3.02 persons per family.
| Family Type | # Families | Family Size |
| Married-Couple | 3,107 (72.0%) | 3.16 |
| Single Male/Father | 306 (7.1%) | 3.02 |
| Single Female/Mother | 900 (20.9%) | 3.06 |
| Total Families | 4,313 (100.0%) | 3.13 |
Median Household Size in East Feliciana Parish
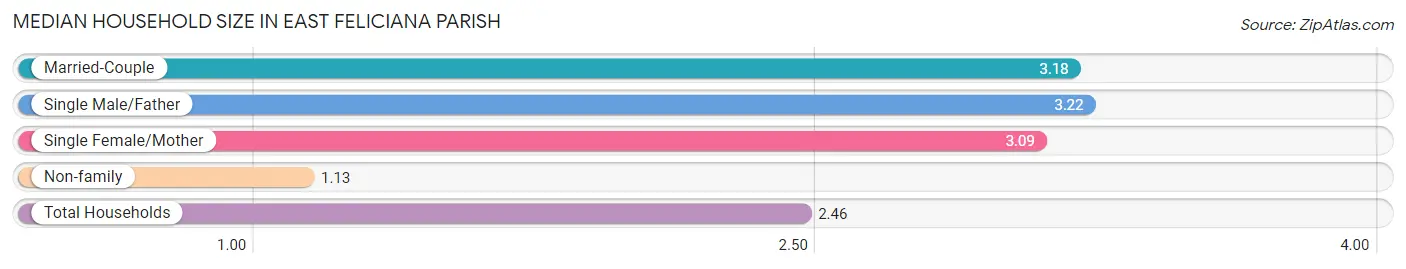
The median household size in East Feliciana Parish is 2.46 persons per household, with single male/father households (306 | 4.6%) accounting for the largest median household size of 3.22 persons per household. non-family households (2,300 | 34.8%) represent the smallest median household size with 1.13 persons per household.
| Household Type | # Households | Household Size |
| Married-Couple | 3,107 (47.0%) | 3.18 |
| Single Male/Father | 306 (4.6%) | 3.22 |
| Single Female/Mother | 900 (13.6%) | 3.09 |
| Non-family | 2,300 (34.8%) | 1.13 |
| Total Households | 6,613 (100.0%) | 2.46 |
Household Size by Marriage Status in East Feliciana Parish
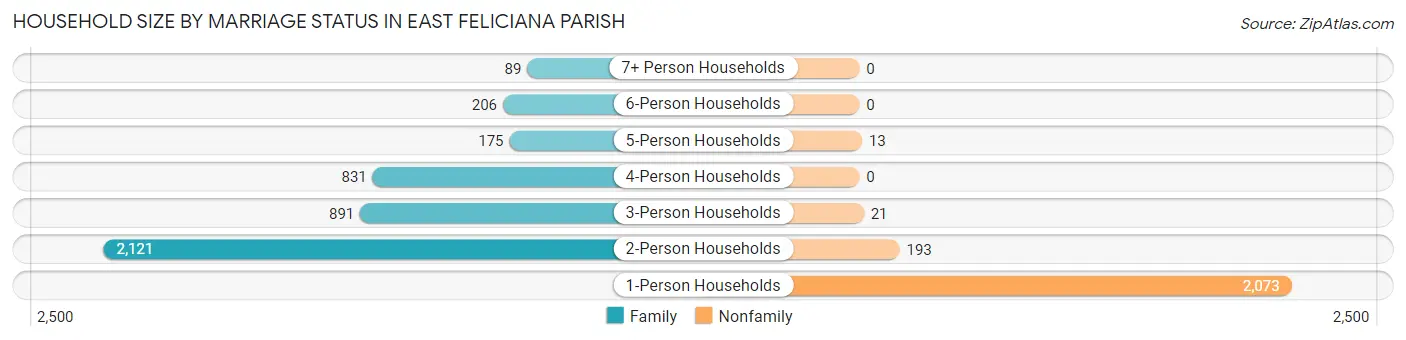
Out of a total of 6,613 households in East Feliciana Parish, 4,313 (65.2%) are family households, while 2,300 (34.8%) are nonfamily households. The most numerous type of family households are 2-person households, comprising 2,121, and the most common type of nonfamily households are 1-person households, comprising 2,073.
| Household Size | Family Households | Nonfamily Households |
| 1-Person Households | - | 2,073 (31.4%) |
| 2-Person Households | 2,121 (32.1%) | 193 (2.9%) |
| 3-Person Households | 891 (13.5%) | 21 (0.3%) |
| 4-Person Households | 831 (12.6%) | 0 (0.0%) |
| 5-Person Households | 175 (2.6%) | 13 (0.2%) |
| 6-Person Households | 206 (3.1%) | 0 (0.0%) |
| 7+ Person Households | 89 (1.3%) | 0 (0.0%) |
| Total | 4,313 (65.2%) | 2,300 (34.8%) |
Female Fertility in East Feliciana Parish
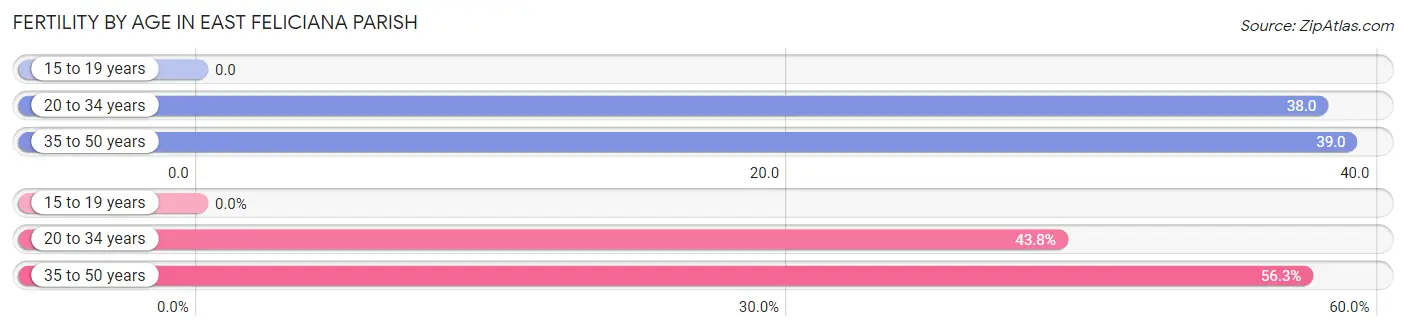
Fertility by Age in East Feliciana Parish
Average fertility rate in East Feliciana Parish is 36.0 births per 1,000 women. Women in the age bracket of 35 to 50 years have the highest fertility rate with 39.0 births per 1,000 women. Women in the age bracket of 35 to 50 years acount for 56.2% of all women with births.
| Age Bracket | Women with Births | Births / 1,000 Women |
| 15 to 19 years | 0 (0.0%) | 0.0 |
| 20 to 34 years | 56 (43.8%) | 38.0 |
| 35 to 50 years | 72 (56.2%) | 39.0 |
| Total | 128 (100.0%) | 36.0 |
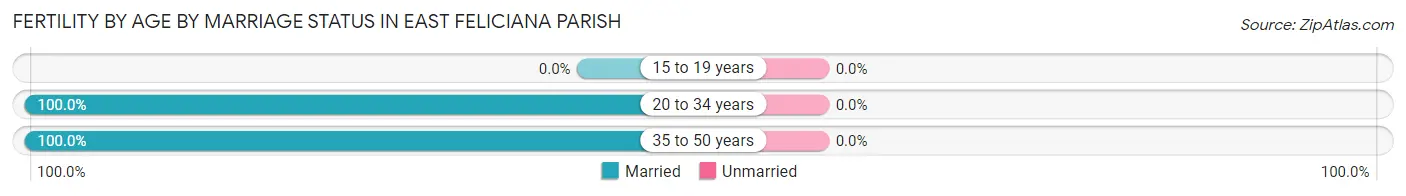
Fertility by Age by Marriage Status in East Feliciana Parish
| Age Bracket | Married | Unmarried |
| 15 to 19 years | 0 (0.0%) | 0 (0.0%) |
| 20 to 34 years | 56 (100.0%) | 0 (0.0%) |
| 35 to 50 years | 72 (100.0%) | 0 (0.0%) |
| Total | 128 (100.0%) | 0 (0.0%) |
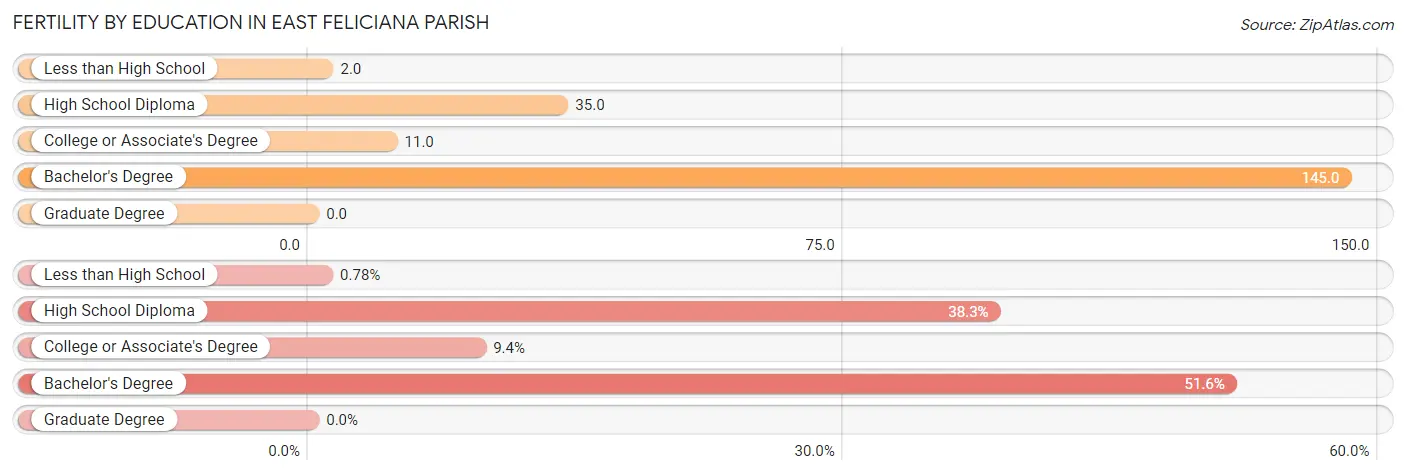
Fertility by Education in East Feliciana Parish
| Educational Attainment | Women with Births | Births / 1,000 Women |
| Less than High School | 1 (0.8%) | 2.0 |
| High School Diploma | 49 (38.3%) | 35.0 |
| College or Associate's Degree | 12 (9.4%) | 11.0 |
| Bachelor's Degree | 66 (51.6%) | 145.0 |
| Graduate Degree | 0 (0.0%) | 0.0 |
| Total | 128 (100.0%) | 36.0 |
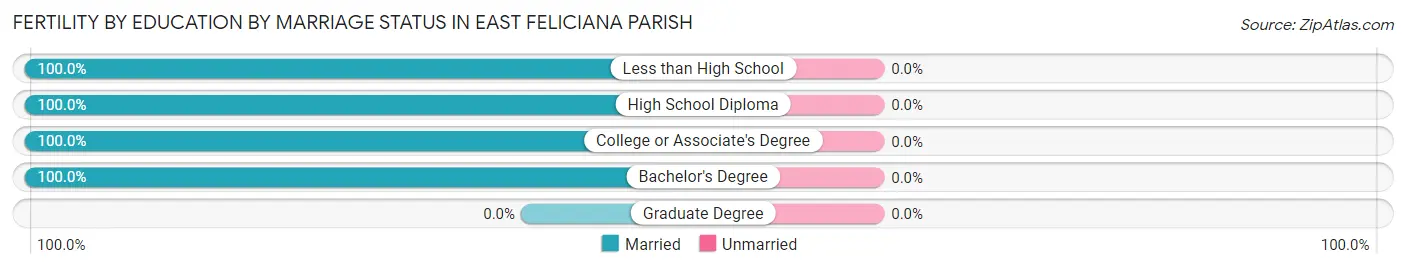
Fertility by Education by Marriage Status in East Feliciana Parish
| Educational Attainment | Married | Unmarried |
| Less than High School | 1 (100.0%) | 0 (0.0%) |
| High School Diploma | 49 (100.0%) | 0 (0.0%) |
| College or Associate's Degree | 12 (100.0%) | 0 (0.0%) |
| Bachelor's Degree | 66 (100.0%) | 0 (0.0%) |
| Graduate Degree | 0 (0.0%) | 0 (0.0%) |
| Total | 128 (100.0%) | 0 (0.0%) |
Income in East Feliciana Parish
Income Overview in East Feliciana Parish
Per Capita Income in East Feliciana Parish is $32,720, while median incomes of families and households are $85,571 and $64,709 respectively.
| Characteristic | Number | Measure |
| Per Capita Income | 19,452 | $32,720 |
| Median Family Income | 4,313 | $85,571 |
| Mean Family Income | 4,313 | $114,122 |
| Median Household Income | 6,613 | $64,709 |
| Mean Household Income | 6,613 | $92,942 |
| Income Deficit | 4,313 | $8,318 |
| Wage / Income Gap (%) | 19,452 | 27.68% |
| Wage / Income Gap ($) | 19,452 | 72.32¢ per $1 |
| Gini / Inequality Index | 19,452 | 0.49 |
Earnings by Sex in East Feliciana Parish
Average Earnings in East Feliciana Parish are $47,046, $56,159 for men and $40,613 for women, a difference of 27.7%.
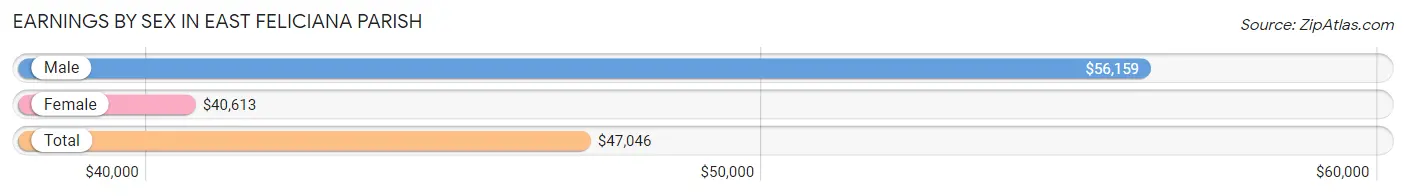
| Sex | Number | Average Earnings |
| Male | 3,529 (48.7%) | $56,159 |
| Female | 3,711 (51.3%) | $40,613 |
| Total | 7,240 (100.0%) | $47,046 |
Earnings by Sex by Income Bracket in East Feliciana Parish
The most common earnings brackets in East Feliciana Parish are $100,000+ for men (683 | 19.4%) and $100,000+ for women (459 | 12.4%).
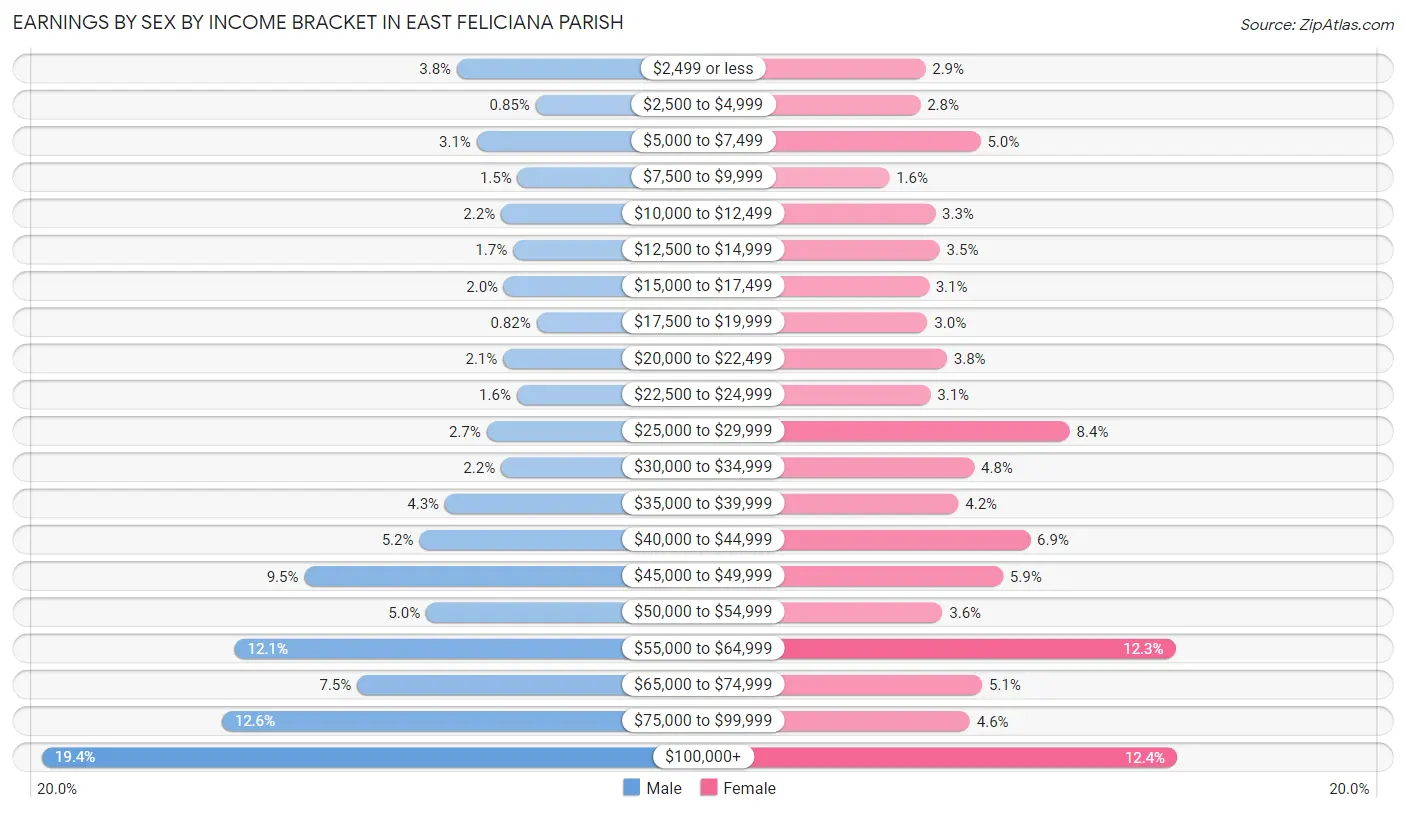
| Income | Male | Female |
| $2,499 or less | 134 (3.8%) | 109 (2.9%) |
| $2,500 to $4,999 | 30 (0.9%) | 102 (2.8%) |
| $5,000 to $7,499 | 108 (3.1%) | 186 (5.0%) |
| $7,500 to $9,999 | 54 (1.5%) | 59 (1.6%) |
| $10,000 to $12,499 | 76 (2.1%) | 123 (3.3%) |
| $12,500 to $14,999 | 60 (1.7%) | 129 (3.5%) |
| $15,000 to $17,499 | 72 (2.0%) | 114 (3.1%) |
| $17,500 to $19,999 | 29 (0.8%) | 112 (3.0%) |
| $20,000 to $22,499 | 73 (2.1%) | 139 (3.7%) |
| $22,500 to $24,999 | 55 (1.6%) | 116 (3.1%) |
| $25,000 to $29,999 | 95 (2.7%) | 310 (8.4%) |
| $30,000 to $34,999 | 76 (2.1%) | 177 (4.8%) |
| $35,000 to $39,999 | 150 (4.3%) | 155 (4.2%) |
| $40,000 to $44,999 | 184 (5.2%) | 255 (6.9%) |
| $45,000 to $49,999 | 336 (9.5%) | 217 (5.9%) |
| $50,000 to $54,999 | 175 (5.0%) | 133 (3.6%) |
| $55,000 to $64,999 | 428 (12.1%) | 457 (12.3%) |
| $65,000 to $74,999 | 266 (7.5%) | 188 (5.1%) |
| $75,000 to $99,999 | 445 (12.6%) | 171 (4.6%) |
| $100,000+ | 683 (19.4%) | 459 (12.4%) |
| Total | 3,529 (100.0%) | 3,711 (100.0%) |
Earnings by Sex by Educational Attainment in East Feliciana Parish
Average earnings in East Feliciana Parish are $61,603 for men and $43,637 for women, a difference of 29.2%. Men with an educational attainment of graduate degree enjoy the highest average annual earnings of $116,875, while those with less than high school education earn the least with $38,750. Women with an educational attainment of bachelor's degree earn the most with the average annual earnings of $58,782, while those with high school diploma education have the smallest earnings of $33,731.
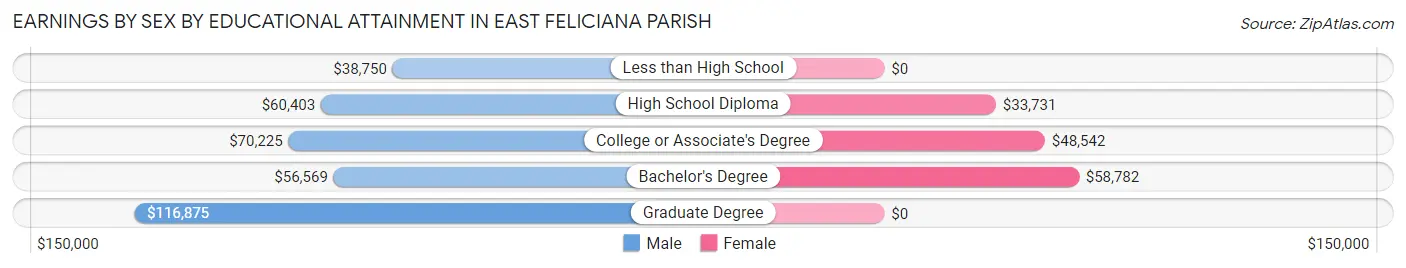
| Educational Attainment | Male Income | Female Income |
| Less than High School | $38,750 | $0 |
| High School Diploma | $60,403 | $33,731 |
| College or Associate's Degree | $70,225 | $48,542 |
| Bachelor's Degree | $56,569 | $58,782 |
| Graduate Degree | $116,875 | $0 |
| Total | $61,603 | $43,637 |
Family Income in East Feliciana Parish
Family Income Brackets in East Feliciana Parish
According to the East Feliciana Parish family income data, there are 966 families falling into the $100,000 to $149,999 income range, which is the most common income bracket and makes up 22.4% of all families. Conversely, the less than $10,000 income bracket is the least frequent group with only 99 families (2.3%) belonging to this category.
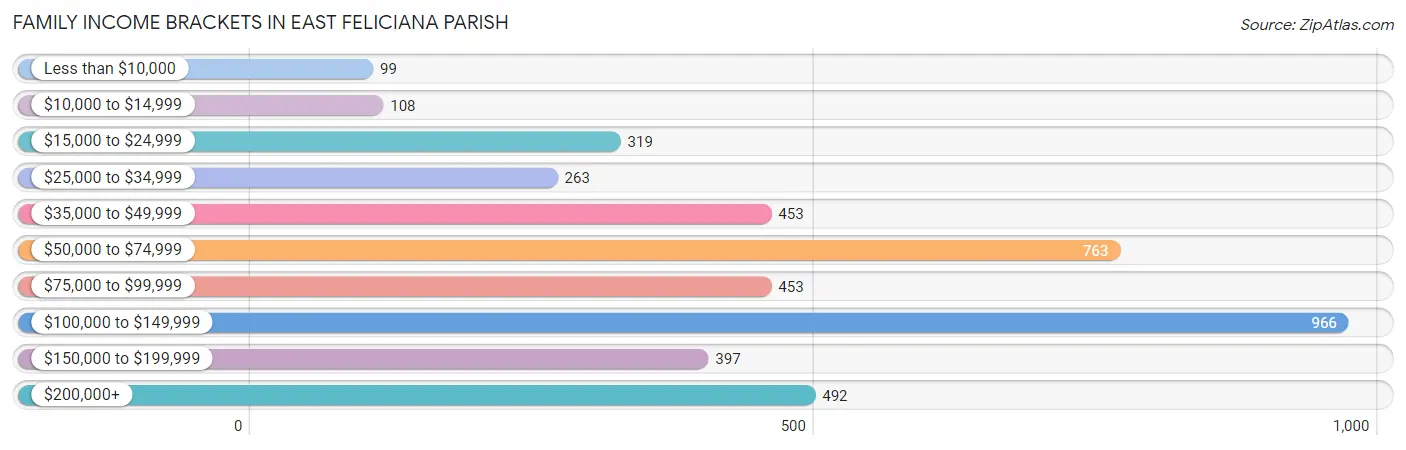
| Income Bracket | # Families | % Families |
| Less than $10,000 | 99 | 2.3% |
| $10,000 to $14,999 | 108 | 2.5% |
| $15,000 to $24,999 | 319 | 7.4% |
| $25,000 to $34,999 | 263 | 6.1% |
| $35,000 to $49,999 | 453 | 10.5% |
| $50,000 to $74,999 | 763 | 17.7% |
| $75,000 to $99,999 | 453 | 10.5% |
| $100,000 to $149,999 | 966 | 22.4% |
| $150,000 to $199,999 | 397 | 9.2% |
| $200,000+ | 492 | 11.4% |
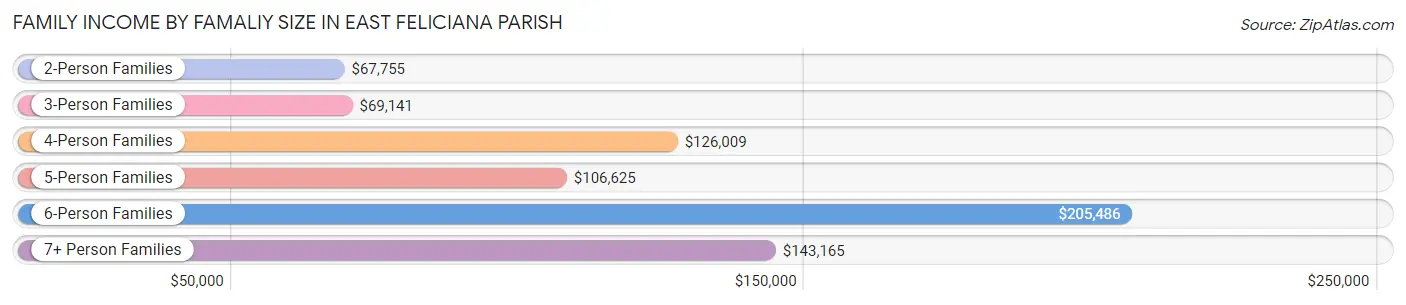
Family Income by Famaliy Size in East Feliciana Parish
6-person families (206 | 4.8%) account for the highest median family income in East Feliciana Parish with $205,486 per family, while 6-person families (206 | 4.8%) have the highest median income of $34,248 per family member.
| Income Bracket | # Families | Median Income |
| 2-Person Families | 2,213 (51.3%) | $67,755 |
| 3-Person Families | 822 (19.1%) | $69,141 |
| 4-Person Families | 836 (19.4%) | $126,009 |
| 5-Person Families | 147 (3.4%) | $106,625 |
| 6-Person Families | 206 (4.8%) | $205,486 |
| 7+ Person Families | 89 (2.1%) | $143,165 |
| Total | 4,313 (100.0%) | $85,571 |
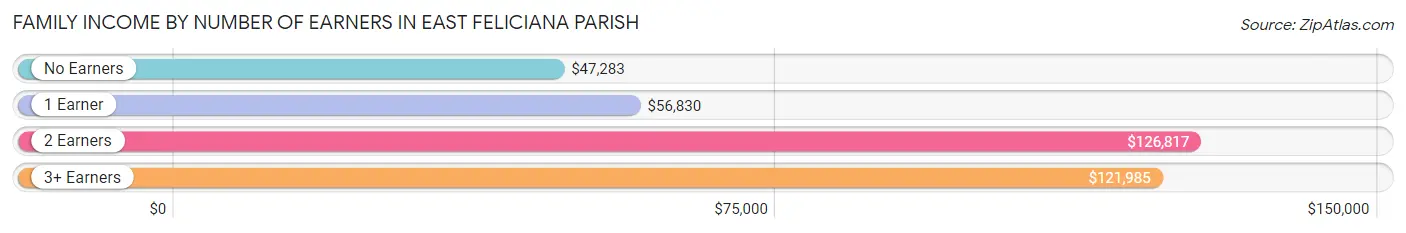
Family Income by Number of Earners in East Feliciana Parish
The median family income in East Feliciana Parish is $85,571, with families comprising 2 earners (1,680) having the highest median family income of $126,817, while families with no earners (974) have the lowest median family income of $47,283, accounting for 39.0% and 22.6% of families, respectively.
| Number of Earners | # Families | Median Income |
| No Earners | 974 (22.6%) | $47,283 |
| 1 Earner | 1,398 (32.4%) | $56,830 |
| 2 Earners | 1,680 (39.0%) | $126,817 |
| 3+ Earners | 261 (6.0%) | $121,985 |
| Total | 4,313 (100.0%) | $85,571 |
Household Income in East Feliciana Parish
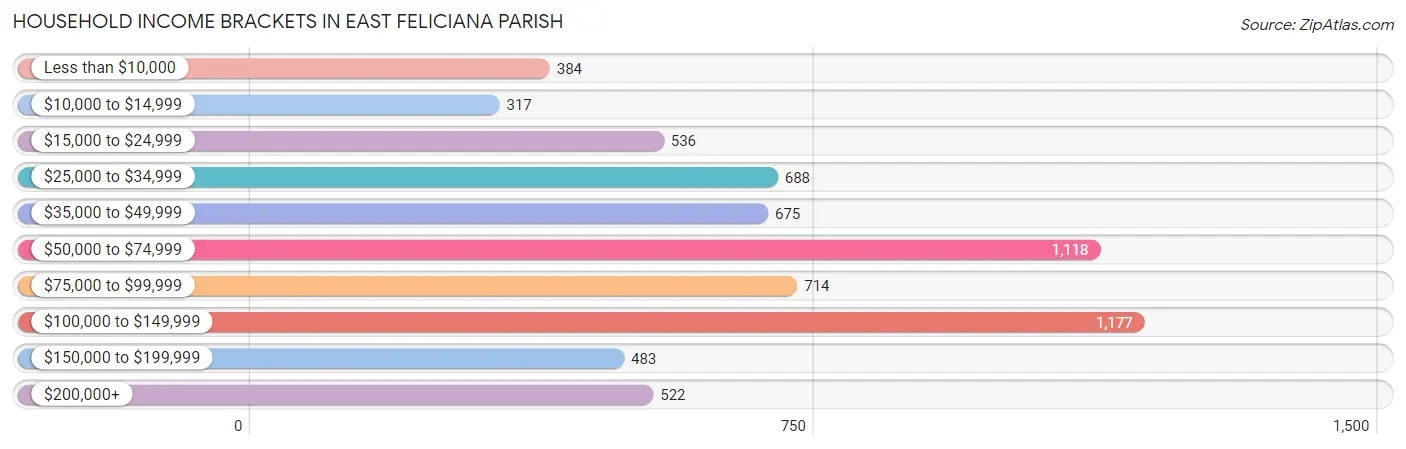
Household Income Brackets in East Feliciana Parish
With 1,177 households falling in the category, the $100,000 to $149,999 income range is the most frequent in East Feliciana Parish, accounting for 17.8% of all households. In contrast, only 317 households (4.8%) fall into the $10,000 to $14,999 income bracket, making it the least populous group.
| Income Bracket | # Households | % Households |
| Less than $10,000 | 384 | 5.8% |
| $10,000 to $14,999 | 317 | 4.8% |
| $15,000 to $24,999 | 536 | 8.1% |
| $25,000 to $34,999 | 688 | 10.4% |
| $35,000 to $49,999 | 675 | 10.2% |
| $50,000 to $74,999 | 1,118 | 16.9% |
| $75,000 to $99,999 | 714 | 10.8% |
| $100,000 to $149,999 | 1,177 | 17.8% |
| $150,000 to $199,999 | 483 | 7.3% |
| $200,000+ | 522 | 7.9% |
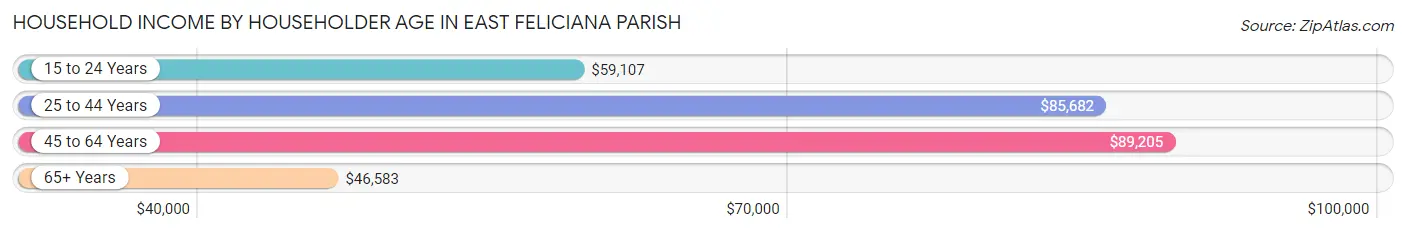
Household Income by Householder Age in East Feliciana Parish
The median household income in East Feliciana Parish is $64,709, with the highest median household income of $89,205 found in the 45 to 64 years age bracket for the primary householder. A total of 2,829 households (42.8%) fall into this category. Meanwhile, the 65+ years age bracket for the primary householder has the lowest median household income of $46,583, with 2,309 households (34.9%) in this group.
| Income Bracket | # Households | Median Income |
| 15 to 24 Years | 129 (1.9%) | $59,107 |
| 25 to 44 Years | 1,346 (20.3%) | $85,682 |
| 45 to 64 Years | 2,829 (42.8%) | $89,205 |
| 65+ Years | 2,309 (34.9%) | $46,583 |
| Total | 6,613 (100.0%) | $64,709 |
Poverty in East Feliciana Parish
Income Below Poverty by Sex and Age in East Feliciana Parish
With 13.5% poverty level for males and 15.8% for females among the residents of East Feliciana Parish, 16 and 17 year old males and under 5 year old females are the most vulnerable to poverty, with 118 males (42.7%) and 140 females (36.8%) in their respective age groups living below the poverty level.
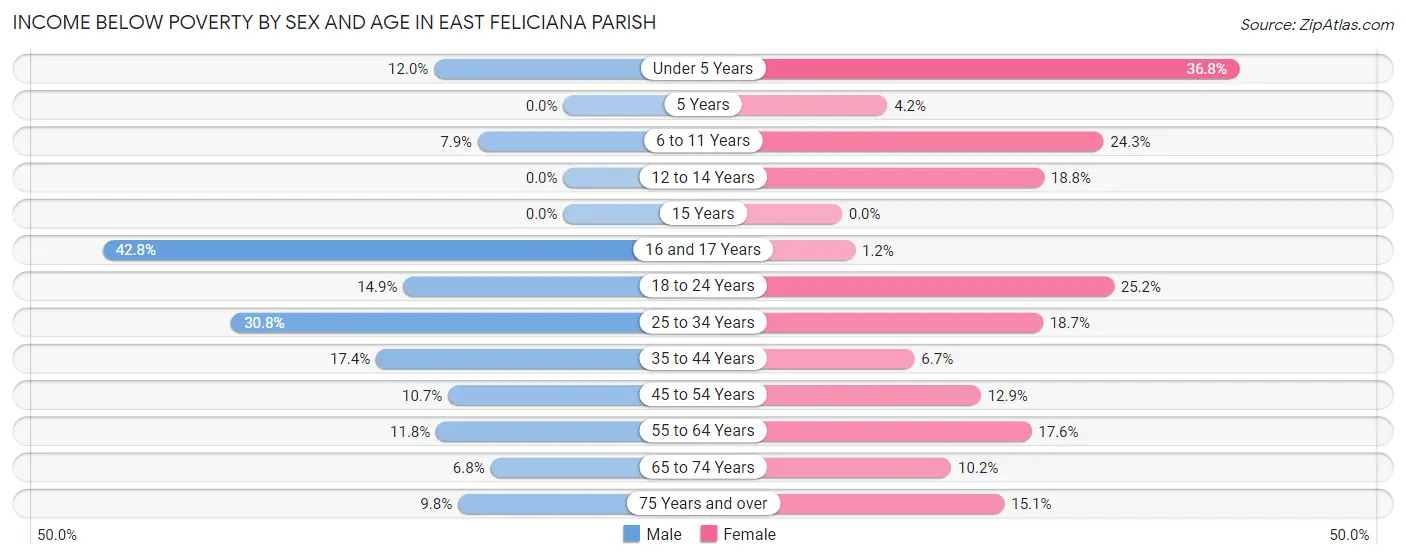
| Age Bracket | Male | Female |
| Under 5 Years | 59 (12.0%) | 140 (36.8%) |
| 5 Years | 0 (0.0%) | 7 (4.2%) |
| 6 to 11 Years | 39 (7.9%) | 118 (24.3%) |
| 12 to 14 Years | 0 (0.0%) | 66 (18.8%) |
| 15 Years | 0 (0.0%) | 0 (0.0%) |
| 16 and 17 Years | 118 (42.7%) | 2 (1.2%) |
| 18 to 24 Years | 115 (14.9%) | 131 (25.2%) |
| 25 to 34 Years | 204 (30.8%) | 199 (18.6%) |
| 35 to 44 Years | 162 (17.4%) | 69 (6.7%) |
| 45 to 54 Years | 137 (10.7%) | 140 (12.9%) |
| 55 to 64 Years | 136 (11.8%) | 257 (17.6%) |
| 65 to 74 Years | 59 (6.8%) | 122 (10.2%) |
| 75 Years and over | 61 (9.8%) | 100 (15.1%) |
| Total | 1,090 (13.5%) | 1,351 (15.8%) |
Income Above Poverty by Sex and Age in East Feliciana Parish
According to the poverty statistics in East Feliciana Parish, males aged 5 years and females aged 15 years are the age groups that are most secure financially, with 100.0% of males and 100.0% of females in these age groups living above the poverty line.
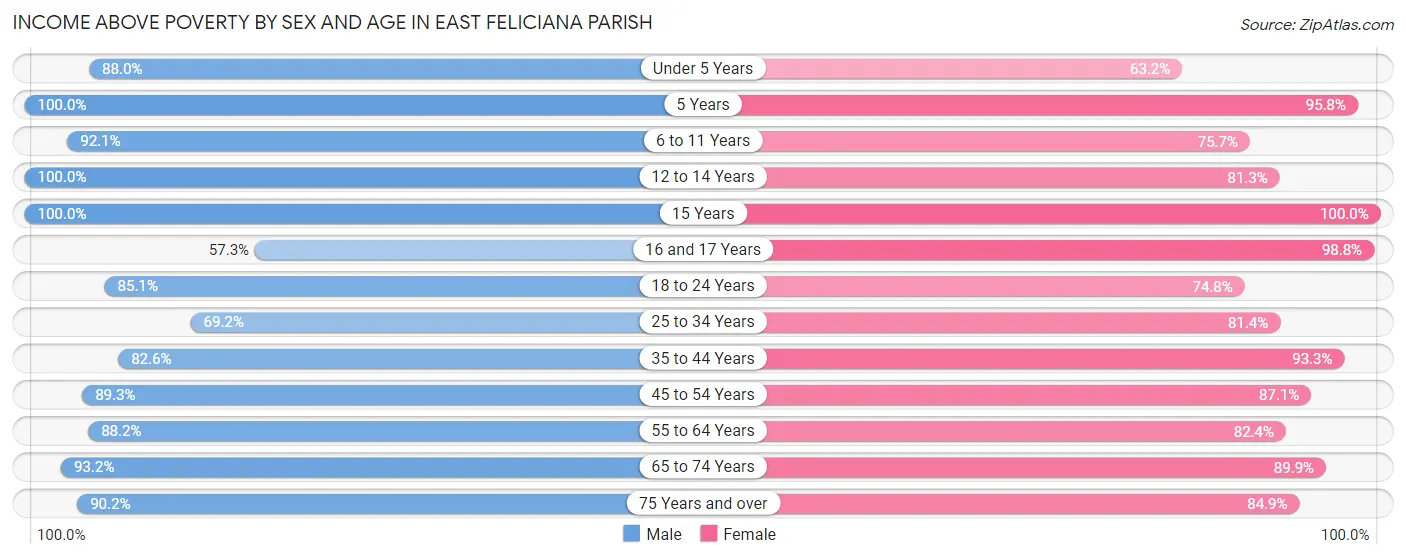
| Age Bracket | Male | Female |
| Under 5 Years | 433 (88.0%) | 240 (63.2%) |
| 5 Years | 105 (100.0%) | 159 (95.8%) |
| 6 to 11 Years | 453 (92.1%) | 368 (75.7%) |
| 12 to 14 Years | 345 (100.0%) | 286 (81.2%) |
| 15 Years | 62 (100.0%) | 4 (100.0%) |
| 16 and 17 Years | 158 (57.3%) | 160 (98.8%) |
| 18 to 24 Years | 659 (85.1%) | 388 (74.8%) |
| 25 to 34 Years | 458 (69.2%) | 868 (81.4%) |
| 35 to 44 Years | 770 (82.6%) | 954 (93.3%) |
| 45 to 54 Years | 1,143 (89.3%) | 946 (87.1%) |
| 55 to 64 Years | 1,016 (88.2%) | 1,204 (82.4%) |
| 65 to 74 Years | 814 (93.2%) | 1,080 (89.8%) |
| 75 Years and over | 563 (90.2%) | 563 (84.9%) |
| Total | 6,979 (86.5%) | 7,220 (84.2%) |
Income Below Poverty Among Married-Couple Families in East Feliciana Parish
The poverty statistics for married-couple families in East Feliciana Parish show that 5.1% or 157 of the total 3,107 families live below the poverty line. Families with 3 or 4 children have the highest poverty rate of 19.2%, comprising of 30 families. On the other hand, families with 5 or more children have the lowest poverty rate of 0.0%, which includes 0 families.
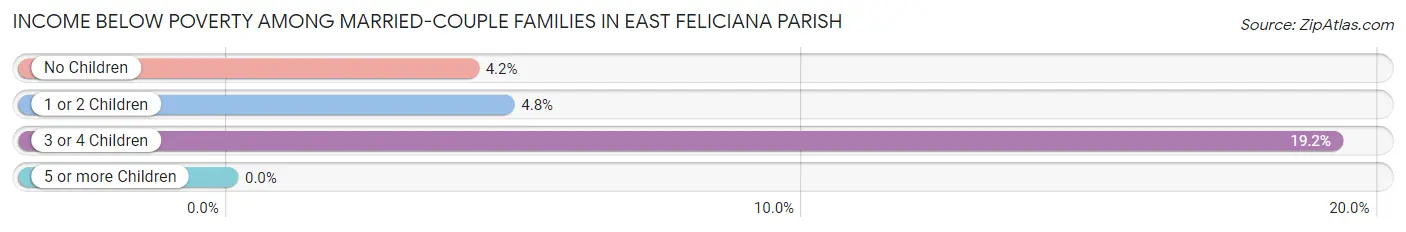
| Children | Above Poverty | Below Poverty |
| No Children | 1,876 (95.8%) | 82 (4.2%) |
| 1 or 2 Children | 890 (95.2%) | 45 (4.8%) |
| 3 or 4 Children | 126 (80.8%) | 30 (19.2%) |
| 5 or more Children | 58 (100.0%) | 0 (0.0%) |
| Total | 2,950 (95.0%) | 157 (5.1%) |
Income Below Poverty Among Single-Parent Households in East Feliciana Parish
According to the poverty data in East Feliciana Parish, 12.1% or 37 single-father households and 25.7% or 231 single-mother households are living below the poverty line. Among single-father households, those with 1 or 2 children have the highest poverty rate, with 24 households (22.9%) experiencing poverty. Likewise, among single-mother households, those with 1 or 2 children have the highest poverty rate, with 111 households (36.9%) falling below the poverty line.
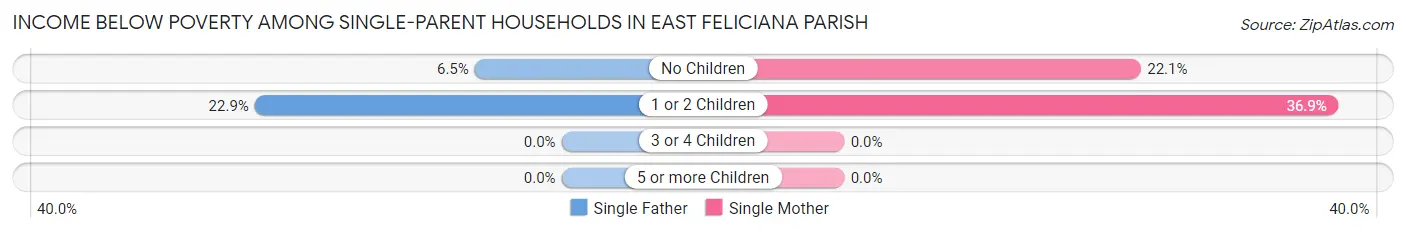
| Children | Single Father | Single Mother |
| No Children | 13 (6.5%) | 120 (22.1%) |
| 1 or 2 Children | 24 (22.9%) | 111 (36.9%) |
| 3 or 4 Children | 0 (0.0%) | 0 (0.0%) |
| 5 or more Children | 0 (0.0%) | 0 (0.0%) |
| Total | 37 (12.1%) | 231 (25.7%) |
Income Below Poverty Among Married-Couple vs Single-Parent Households in East Feliciana Parish
The poverty data for East Feliciana Parish shows that 157 of the married-couple family households (5.1%) and 268 of the single-parent households (22.2%) are living below the poverty level. Within the married-couple family households, those with 3 or 4 children have the highest poverty rate, with 30 households (19.2%) falling below the poverty line. Among the single-parent households, those with 1 or 2 children have the highest poverty rate, with 135 household (33.3%) living below poverty.
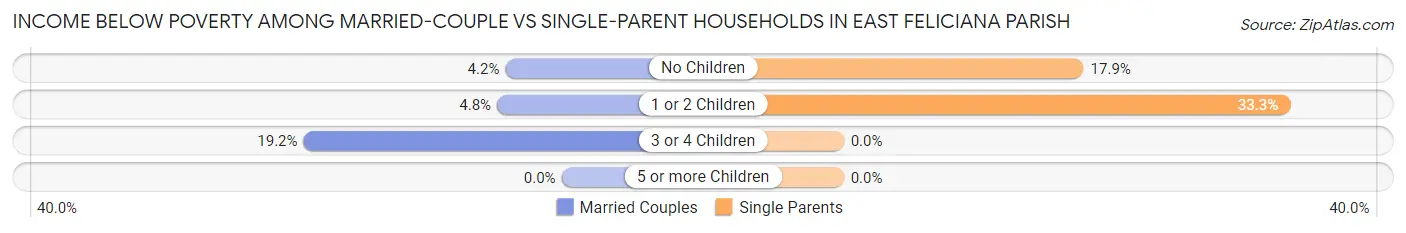
| Children | Married-Couple Families | Single-Parent Households |
| No Children | 82 (4.2%) | 133 (17.9%) |
| 1 or 2 Children | 45 (4.8%) | 135 (33.3%) |
| 3 or 4 Children | 30 (19.2%) | 0 (0.0%) |
| 5 or more Children | 0 (0.0%) | 0 (0.0%) |
| Total | 157 (5.1%) | 268 (22.2%) |
Employment Characteristics in East Feliciana Parish
Employment by Class of Employer in East Feliciana Parish
Among the 6,530 employed individuals in East Feliciana Parish, private company employees (3,828 | 58.6%), state government employees (1,081 | 16.6%), and local government employees (434 | 6.7%) make up the most common classes of employment.
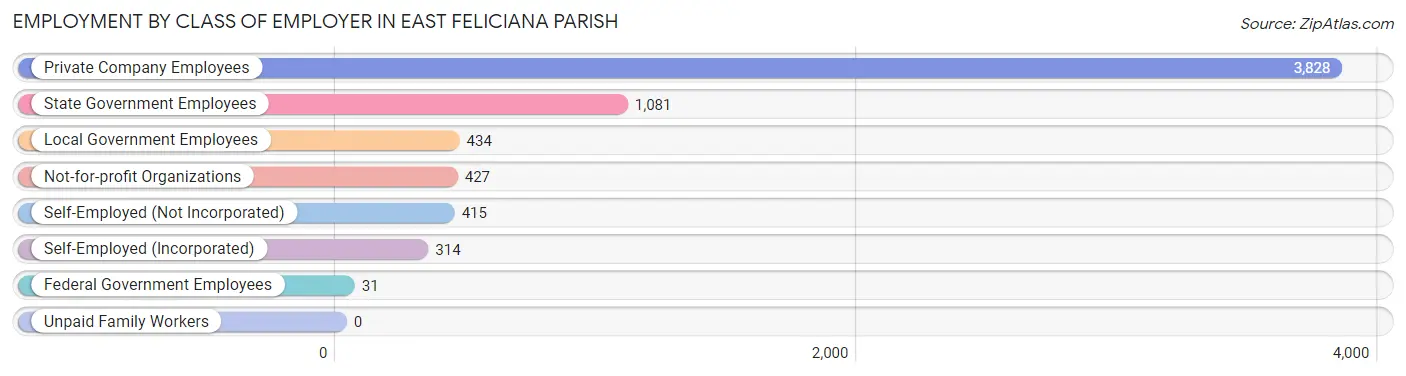
| Employer Class | # Employees | % Employees |
| Private Company Employees | 3,828 | 58.6% |
| Self-Employed (Incorporated) | 314 | 4.8% |
| Self-Employed (Not Incorporated) | 415 | 6.4% |
| Not-for-profit Organizations | 427 | 6.5% |
| Local Government Employees | 434 | 6.7% |
| State Government Employees | 1,081 | 16.6% |
| Federal Government Employees | 31 | 0.5% |
| Unpaid Family Workers | 0 | 0.0% |
| Total | 6,530 | 100.0% |
Employment Status by Age in East Feliciana Parish
According to the labor force statistics for East Feliciana Parish, out of the total population over 16 years of age (16,566), 42.5% or 7,041 individuals are in the labor force, with 5.5% or 387 of them unemployed. The age group with the highest labor force participation rate is 20 to 24 years, with 68.3% or 701 individuals in the labor force. Within the labor force, the 20 to 24 years age range has the highest percentage of unemployed individuals, with 30.4% or 213 of them being unemployed.
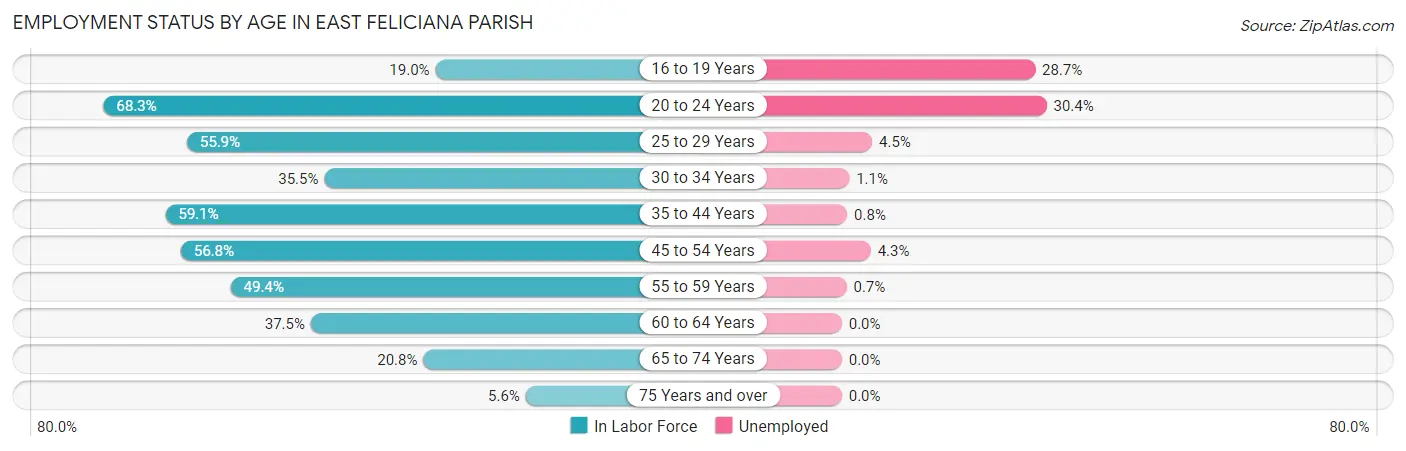
| Age Bracket | In Labor Force | Unemployed |
| 16 to 19 Years | 167 (19.0%) | 48 (28.7%) |
| 20 to 24 Years | 701 (68.3%) | 213 (30.4%) |
| 25 to 29 Years | 750 (55.9%) | 34 (4.5%) |
| 30 to 34 Years | 455 (35.5%) | 5 (1.1%) |
| 35 to 44 Years | 1,451 (59.1%) | 12 (0.8%) |
| 45 to 54 Years | 1,635 (56.8%) | 70 (4.3%) |
| 55 to 59 Years | 753 (49.4%) | 5 (0.7%) |
| 60 to 64 Years | 578 (37.5%) | 0 (0.0%) |
| 65 to 74 Years | 482 (20.8%) | 0 (0.0%) |
| 75 Years and over | 74 (5.6%) | 0 (0.0%) |
| Total | 7,041 (42.5%) | 387 (5.5%) |
Employment Status by Educational Attainment in East Feliciana Parish
According to labor force statistics for East Feliciana Parish, 51.0% of individuals (5,622) out of the total population between 25 and 64 years of age (11,023) are in the labor force, with 2.2% or 124 of them being unemployed. The group with the highest labor force participation rate are those with the educational attainment of college / associate degree, with 65.4% or 1,895 individuals in the labor force. Within the labor force, individuals with less than high school education have the highest percentage of unemployment, with 4.0% or 13 of them being unemployed.
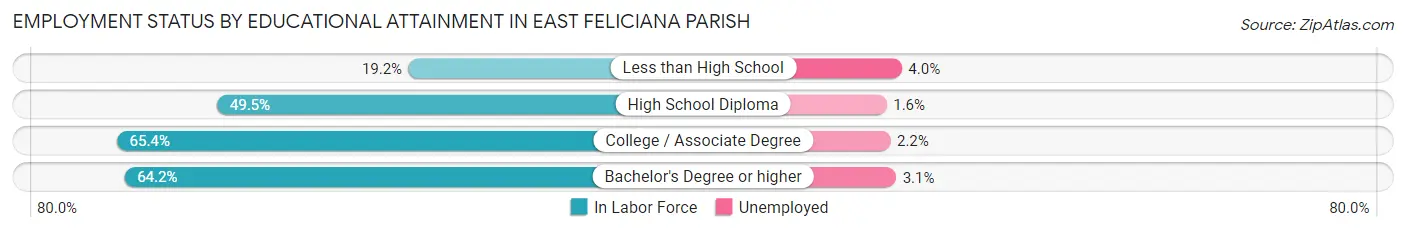
| Educational Attainment | In Labor Force | Unemployed |
| Less than High School | 328 (19.2%) | 68 (4.0%) |
| High School Diploma | 2,426 (49.5%) | 78 (1.6%) |
| College / Associate Degree | 1,895 (65.4%) | 64 (2.2%) |
| Bachelor's Degree or higher | 973 (64.2%) | 47 (3.1%) |
| Total | 5,622 (51.0%) | 243 (2.2%) |
Employment Occupations by Sex in East Feliciana Parish
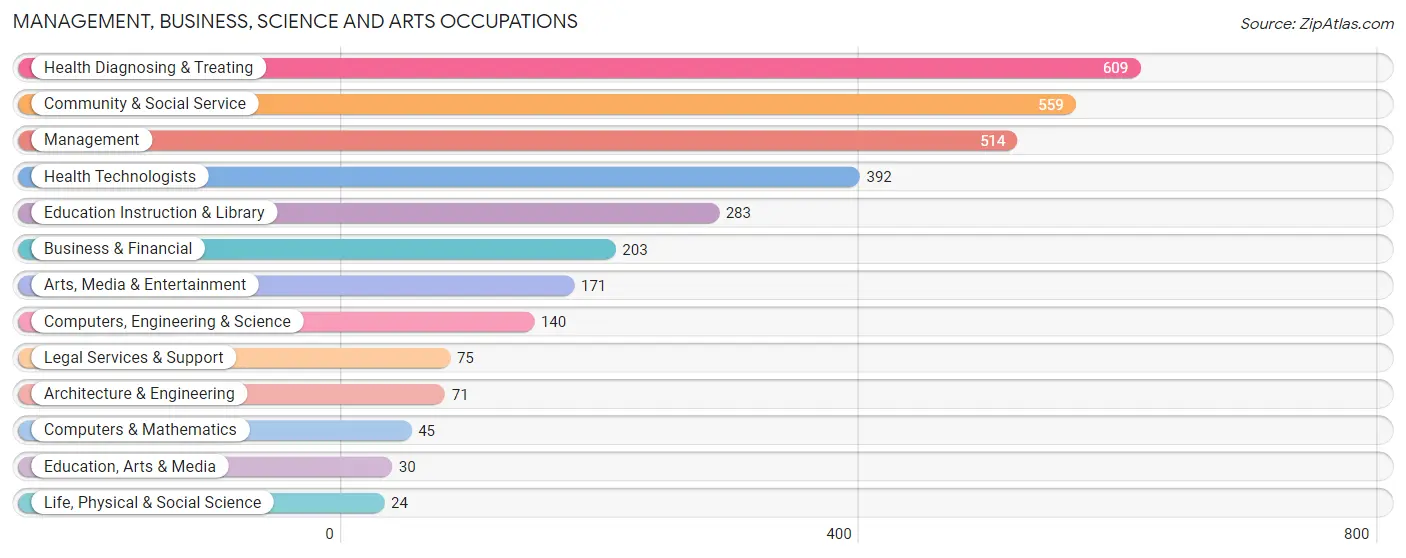
Management, Business, Science and Arts Occupations
The most common Management, Business, Science and Arts occupations in East Feliciana Parish are Health Diagnosing & Treating (609 | 9.2%), Community & Social Service (559 | 8.4%), Management (514 | 7.7%), Health Technologists (392 | 5.9%), and Education Instruction & Library (283 | 4.3%).
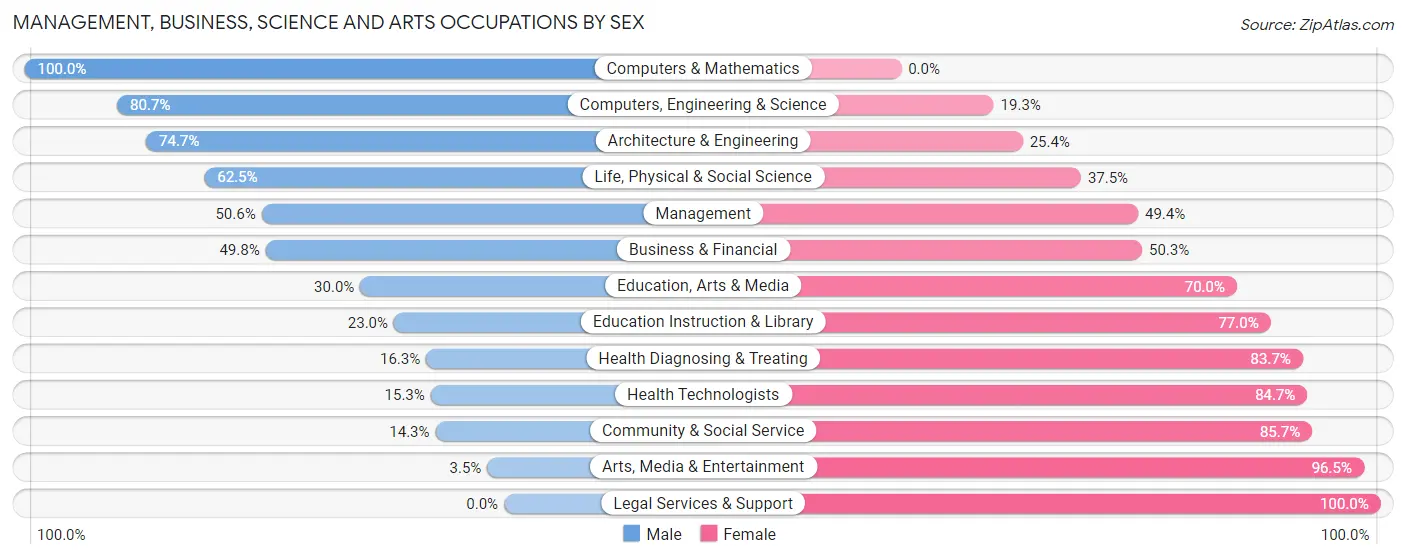
Management, Business, Science and Arts Occupations by Sex
Within the Management, Business, Science and Arts occupations in East Feliciana Parish, the most male-oriented occupations are Computers & Mathematics (100.0%), Computers, Engineering & Science (80.7%), and Architecture & Engineering (74.7%), while the most female-oriented occupations are Legal Services & Support (100.0%), Arts, Media & Entertainment (96.5%), and Community & Social Service (85.7%).
| Occupation | Male | Female |
| Management | 260 (50.6%) | 254 (49.4%) |
| Business & Financial | 101 (49.7%) | 102 (50.2%) |
| Computers, Engineering & Science | 113 (80.7%) | 27 (19.3%) |
| Computers & Mathematics | 45 (100.0%) | 0 (0.0%) |
| Architecture & Engineering | 53 (74.7%) | 18 (25.4%) |
| Life, Physical & Social Science | 15 (62.5%) | 9 (37.5%) |
| Community & Social Service | 80 (14.3%) | 479 (85.7%) |
| Education, Arts & Media | 9 (30.0%) | 21 (70.0%) |
| Legal Services & Support | 0 (0.0%) | 75 (100.0%) |
| Education Instruction & Library | 65 (23.0%) | 218 (77.0%) |
| Arts, Media & Entertainment | 6 (3.5%) | 165 (96.5%) |
| Health Diagnosing & Treating | 99 (16.3%) | 510 (83.7%) |
| Health Technologists | 60 (15.3%) | 332 (84.7%) |
| Total (Category) | 653 (32.3%) | 1,372 (67.7%) |
| Total (Overall) | 3,209 (48.3%) | 3,438 (51.7%) |
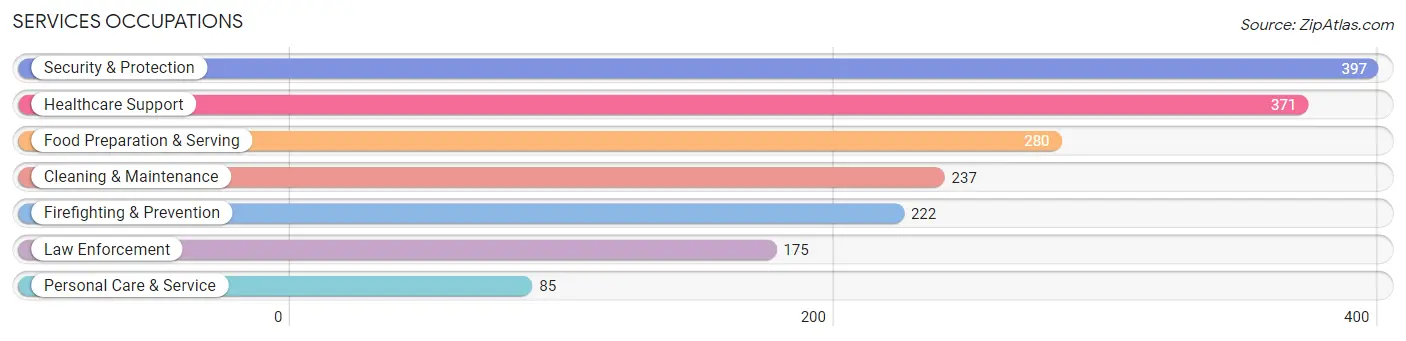
Services Occupations
The most common Services occupations in East Feliciana Parish are Security & Protection (397 | 6.0%), Healthcare Support (371 | 5.6%), Food Preparation & Serving (280 | 4.2%), Cleaning & Maintenance (237 | 3.6%), and Firefighting & Prevention (222 | 3.3%).
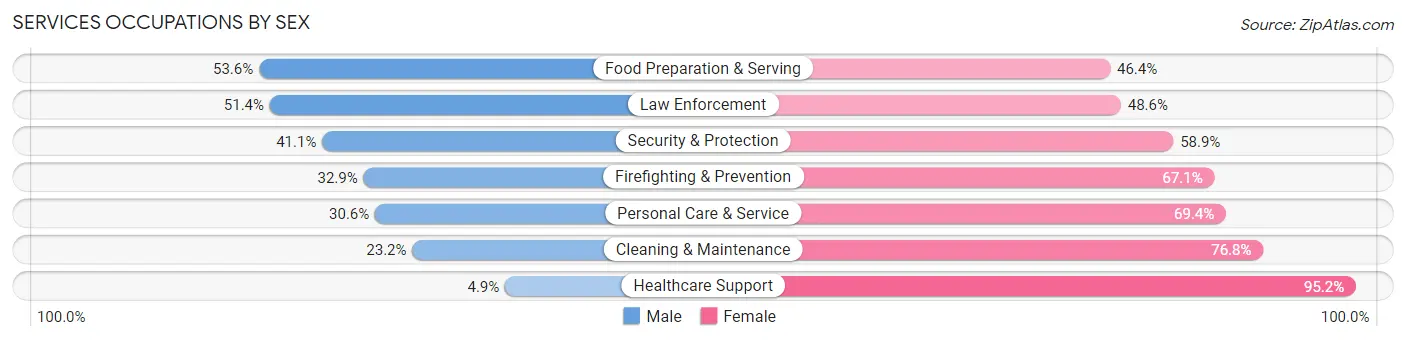
Services Occupations by Sex
Within the Services occupations in East Feliciana Parish, the most male-oriented occupations are Food Preparation & Serving (53.6%), Law Enforcement (51.4%), and Security & Protection (41.1%), while the most female-oriented occupations are Healthcare Support (95.2%), Cleaning & Maintenance (76.8%), and Personal Care & Service (69.4%).
| Occupation | Male | Female |
| Healthcare Support | 18 (4.9%) | 353 (95.2%) |
| Security & Protection | 163 (41.1%) | 234 (58.9%) |
| Firefighting & Prevention | 73 (32.9%) | 149 (67.1%) |
| Law Enforcement | 90 (51.4%) | 85 (48.6%) |
| Food Preparation & Serving | 150 (53.6%) | 130 (46.4%) |
| Cleaning & Maintenance | 55 (23.2%) | 182 (76.8%) |
| Personal Care & Service | 26 (30.6%) | 59 (69.4%) |
| Total (Category) | 412 (30.1%) | 958 (69.9%) |
| Total (Overall) | 3,209 (48.3%) | 3,438 (51.7%) |
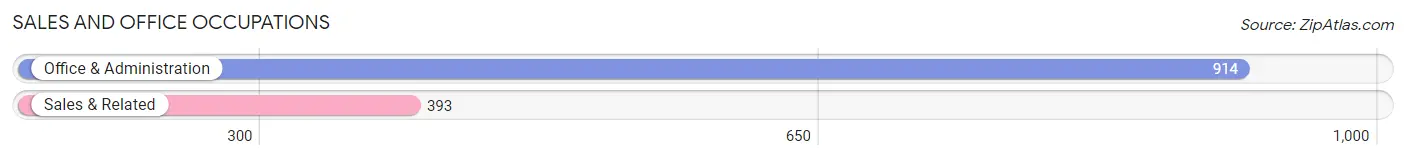
Sales and Office Occupations
The most common Sales and Office occupations in East Feliciana Parish are Office & Administration (914 | 13.8%), and Sales & Related (393 | 5.9%).
Sales and Office Occupations by Sex
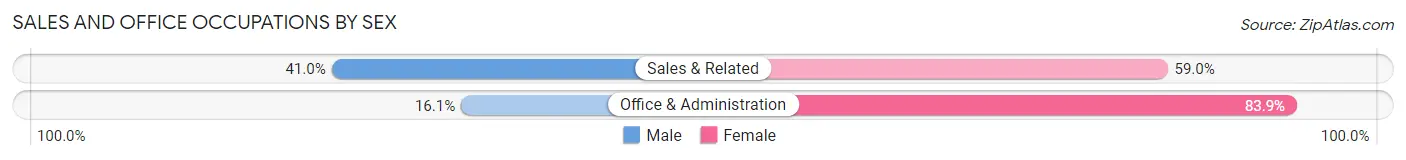
| Occupation | Male | Female |
| Sales & Related | 161 (41.0%) | 232 (59.0%) |
| Office & Administration | 147 (16.1%) | 767 (83.9%) |
| Total (Category) | 308 (23.6%) | 999 (76.4%) |
| Total (Overall) | 3,209 (48.3%) | 3,438 (51.7%) |
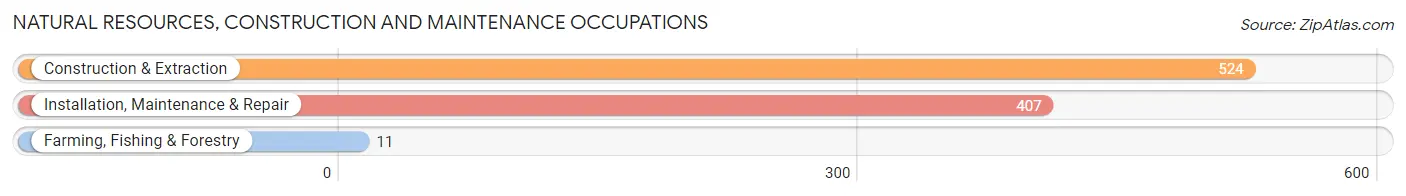
Natural Resources, Construction and Maintenance Occupations
The most common Natural Resources, Construction and Maintenance occupations in East Feliciana Parish are Construction & Extraction (524 | 7.9%), Installation, Maintenance & Repair (407 | 6.1%), and Farming, Fishing & Forestry (11 | 0.2%).
Natural Resources, Construction and Maintenance Occupations by Sex
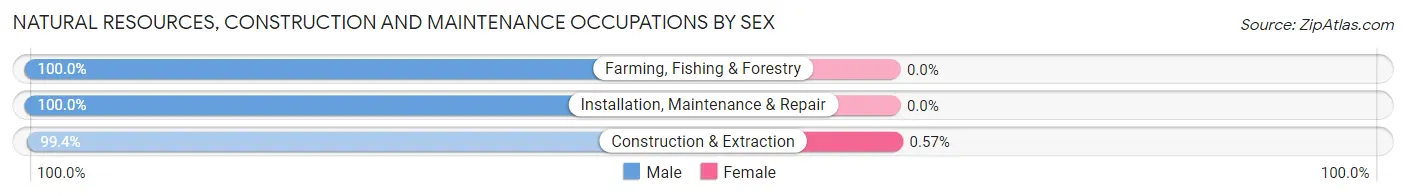
| Occupation | Male | Female |
| Farming, Fishing & Forestry | 11 (100.0%) | 0 (0.0%) |
| Construction & Extraction | 521 (99.4%) | 3 (0.6%) |
| Installation, Maintenance & Repair | 407 (100.0%) | 0 (0.0%) |
| Total (Category) | 939 (99.7%) | 3 (0.3%) |
| Total (Overall) | 3,209 (48.3%) | 3,438 (51.7%) |
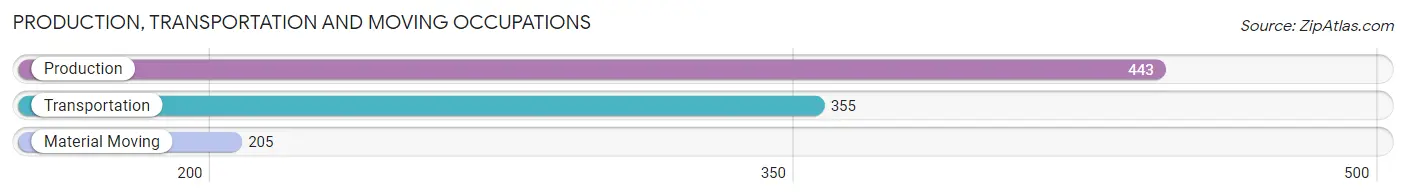
Production, Transportation and Moving Occupations
The most common Production, Transportation and Moving occupations in East Feliciana Parish are Production (443 | 6.7%), Transportation (355 | 5.3%), and Material Moving (205 | 3.1%).
Production, Transportation and Moving Occupations by Sex
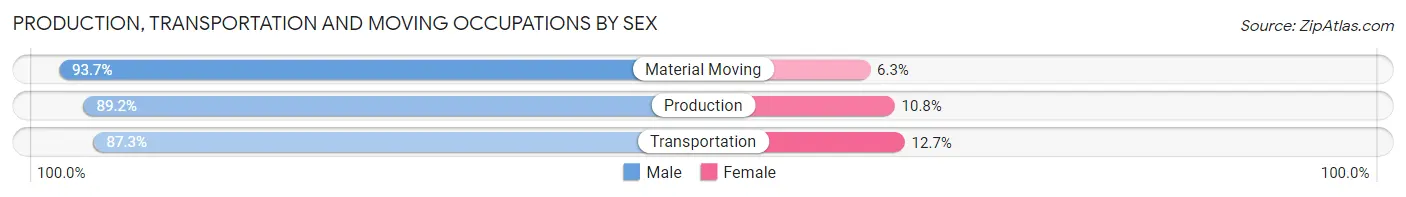
| Occupation | Male | Female |
| Production | 395 (89.2%) | 48 (10.8%) |
| Transportation | 310 (87.3%) | 45 (12.7%) |
| Material Moving | 192 (93.7%) | 13 (6.3%) |
| Total (Category) | 897 (89.4%) | 106 (10.6%) |
| Total (Overall) | 3,209 (48.3%) | 3,438 (51.7%) |
Employment Industries by Sex in East Feliciana Parish
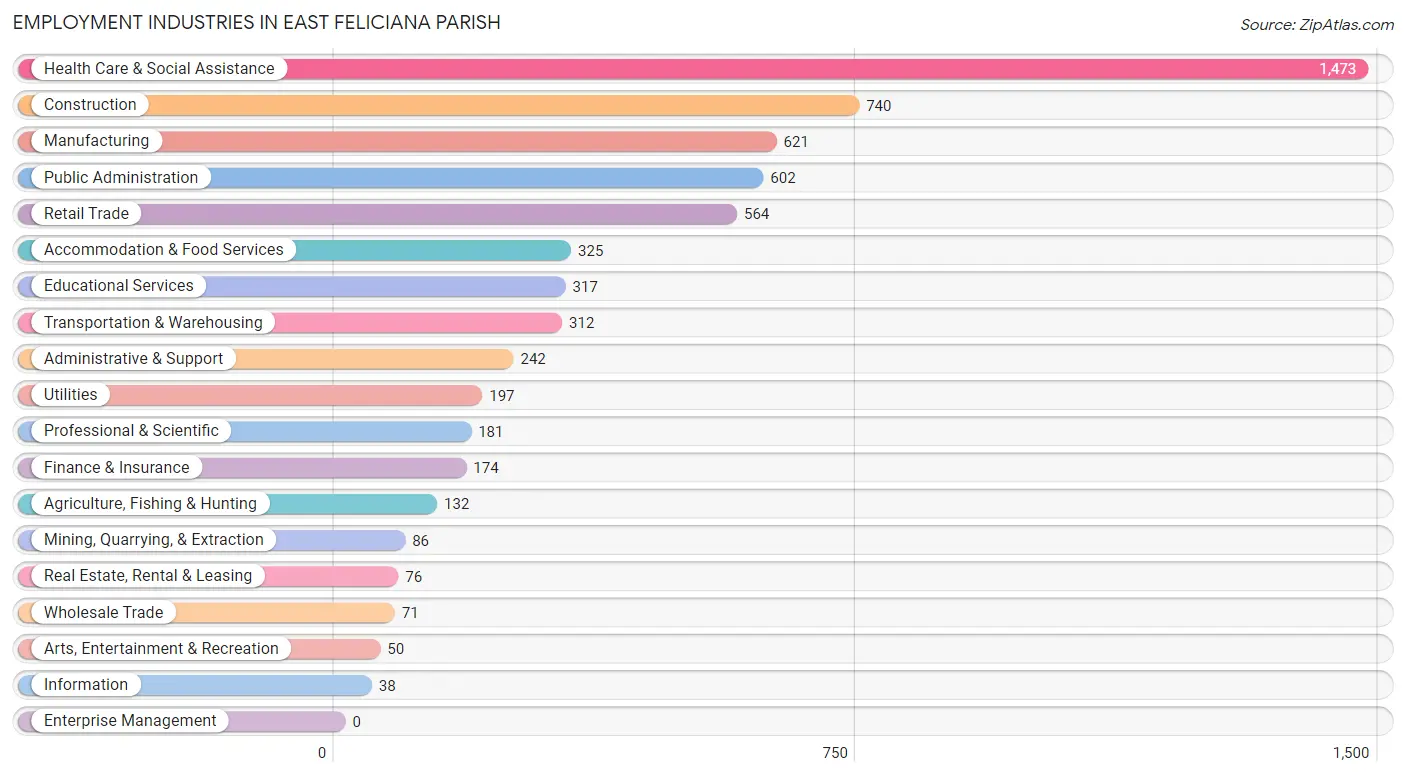
Employment Industries in East Feliciana Parish
The major employment industries in East Feliciana Parish include Health Care & Social Assistance (1,473 | 22.2%), Construction (740 | 11.1%), Manufacturing (621 | 9.3%), Public Administration (602 | 9.1%), and Retail Trade (564 | 8.5%).
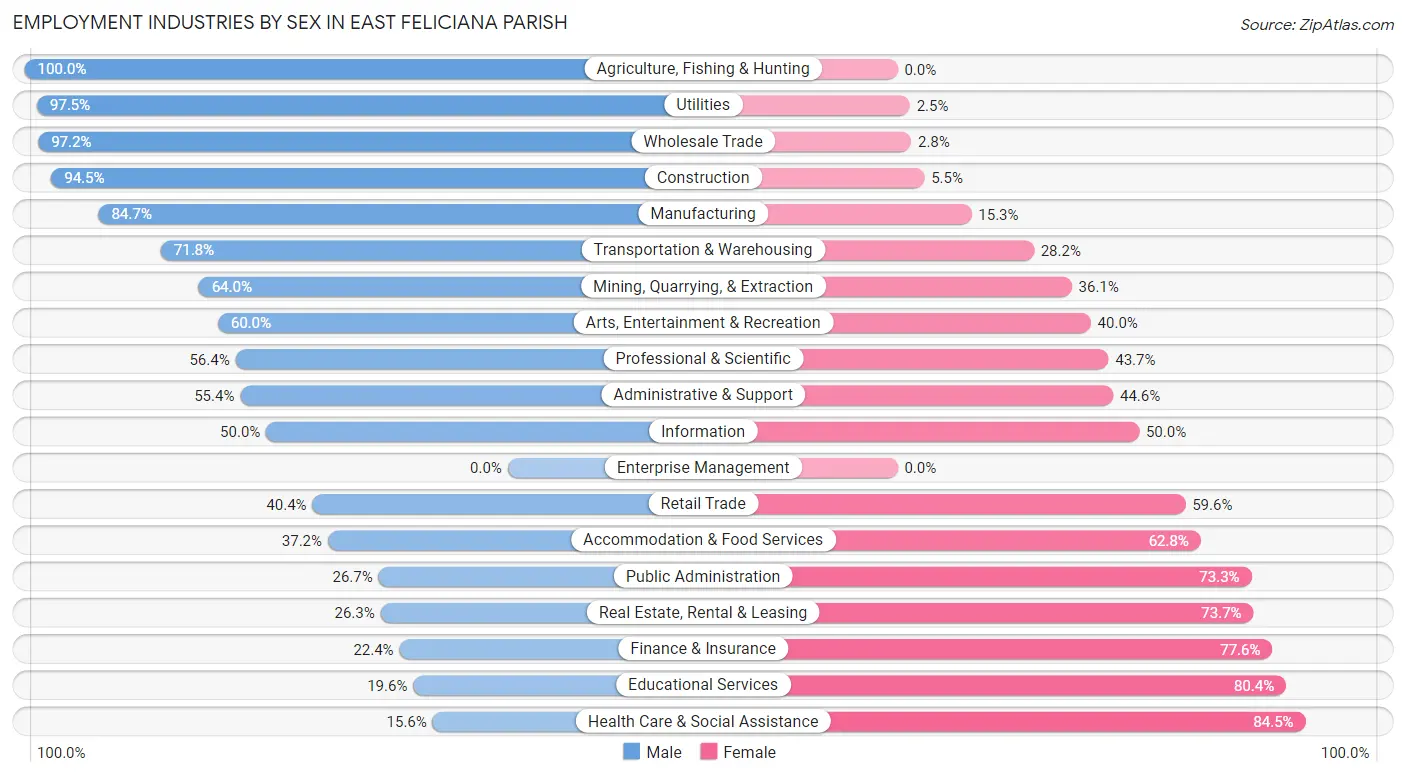
Employment Industries by Sex in East Feliciana Parish
The East Feliciana Parish industries that see more men than women are Agriculture, Fishing & Hunting (100.0%), Utilities (97.5%), and Wholesale Trade (97.2%), whereas the industries that tend to have a higher number of women are Health Care & Social Assistance (84.5%), Educational Services (80.4%), and Finance & Insurance (77.6%).
| Industry | Male | Female |
| Agriculture, Fishing & Hunting | 132 (100.0%) | 0 (0.0%) |
| Mining, Quarrying, & Extraction | 55 (63.9%) | 31 (36.0%) |
| Construction | 699 (94.5%) | 41 (5.5%) |
| Manufacturing | 526 (84.7%) | 95 (15.3%) |
| Wholesale Trade | 69 (97.2%) | 2 (2.8%) |
| Retail Trade | 228 (40.4%) | 336 (59.6%) |
| Transportation & Warehousing | 224 (71.8%) | 88 (28.2%) |
| Utilities | 192 (97.5%) | 5 (2.5%) |
| Information | 19 (50.0%) | 19 (50.0%) |
| Finance & Insurance | 39 (22.4%) | 135 (77.6%) |
| Real Estate, Rental & Leasing | 20 (26.3%) | 56 (73.7%) |
| Professional & Scientific | 102 (56.4%) | 79 (43.6%) |
| Enterprise Management | 0 (0.0%) | 0 (0.0%) |
| Administrative & Support | 134 (55.4%) | 108 (44.6%) |
| Educational Services | 62 (19.6%) | 255 (80.4%) |
| Health Care & Social Assistance | 229 (15.5%) | 1,244 (84.5%) |
| Arts, Entertainment & Recreation | 30 (60.0%) | 20 (40.0%) |
| Accommodation & Food Services | 121 (37.2%) | 204 (62.8%) |
| Public Administration | 161 (26.7%) | 441 (73.3%) |
| Total | 3,209 (48.3%) | 3,438 (51.7%) |
Education in East Feliciana Parish
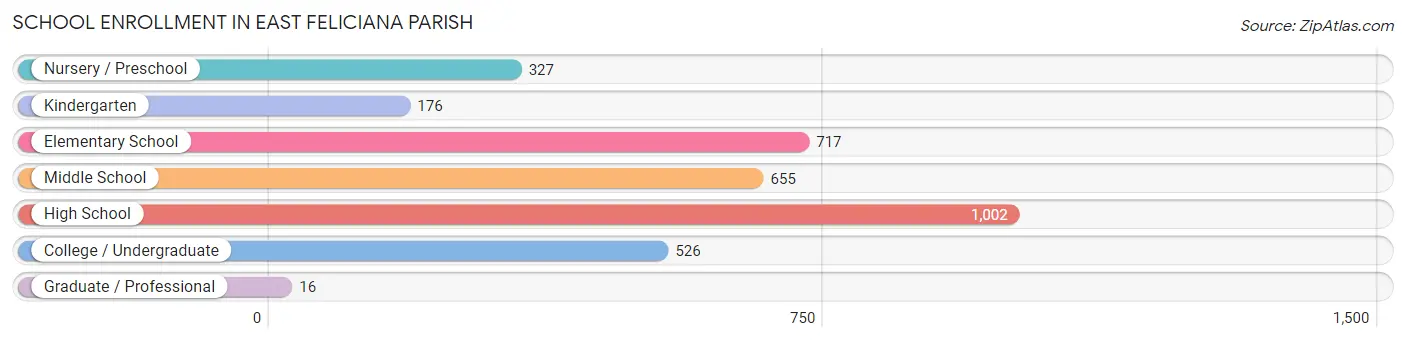
School Enrollment in East Feliciana Parish
The most common levels of schooling among the 3,419 students in East Feliciana Parish are high school (1,002 | 29.3%), elementary school (717 | 21.0%), and middle school (655 | 19.2%).
| School Level | # Students | % Students |
| Nursery / Preschool | 327 | 9.6% |
| Kindergarten | 176 | 5.1% |
| Elementary School | 717 | 21.0% |
| Middle School | 655 | 19.2% |
| High School | 1,002 | 29.3% |
| College / Undergraduate | 526 | 15.4% |
| Graduate / Professional | 16 | 0.5% |
| Total | 3,419 | 100.0% |
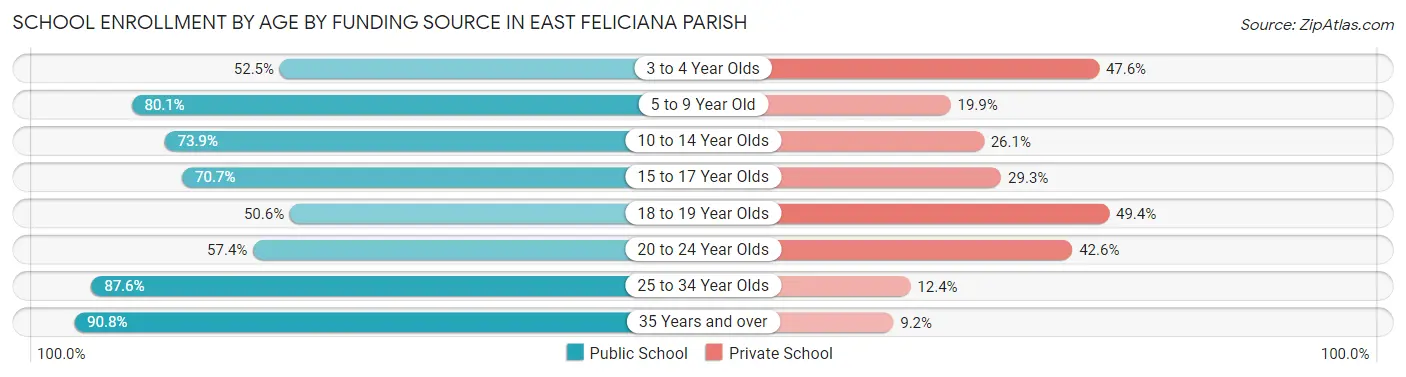
School Enrollment by Age by Funding Source in East Feliciana Parish
Out of a total of 3,419 students who are enrolled in schools in East Feliciana Parish, 909 (26.6%) attend a private institution, while the remaining 2,510 (73.4%) are enrolled in public schools. The age group of 18 to 19 year olds has the highest likelihood of being enrolled in private schools, with 129 (49.4% in the age bracket) enrolled. Conversely, the age group of 35 years and over has the lowest likelihood of being enrolled in a private school, with 226 (90.8% in the age bracket) attending a public institution.
| Age Bracket | Public School | Private School |
| 3 to 4 Year Olds | 107 (52.4%) | 97 (47.5%) |
| 5 to 9 Year Old | 700 (80.1%) | 174 (19.9%) |
| 10 to 14 Year Olds | 779 (73.9%) | 275 (26.1%) |
| 15 to 17 Year Olds | 347 (70.7%) | 144 (29.3%) |
| 18 to 19 Year Olds | 132 (50.6%) | 129 (49.4%) |
| 20 to 24 Year Olds | 58 (57.4%) | 43 (42.6%) |
| 25 to 34 Year Olds | 162 (87.6%) | 23 (12.4%) |
| 35 Years and over | 226 (90.8%) | 23 (9.2%) |
| Total | 2,510 (73.4%) | 909 (26.6%) |
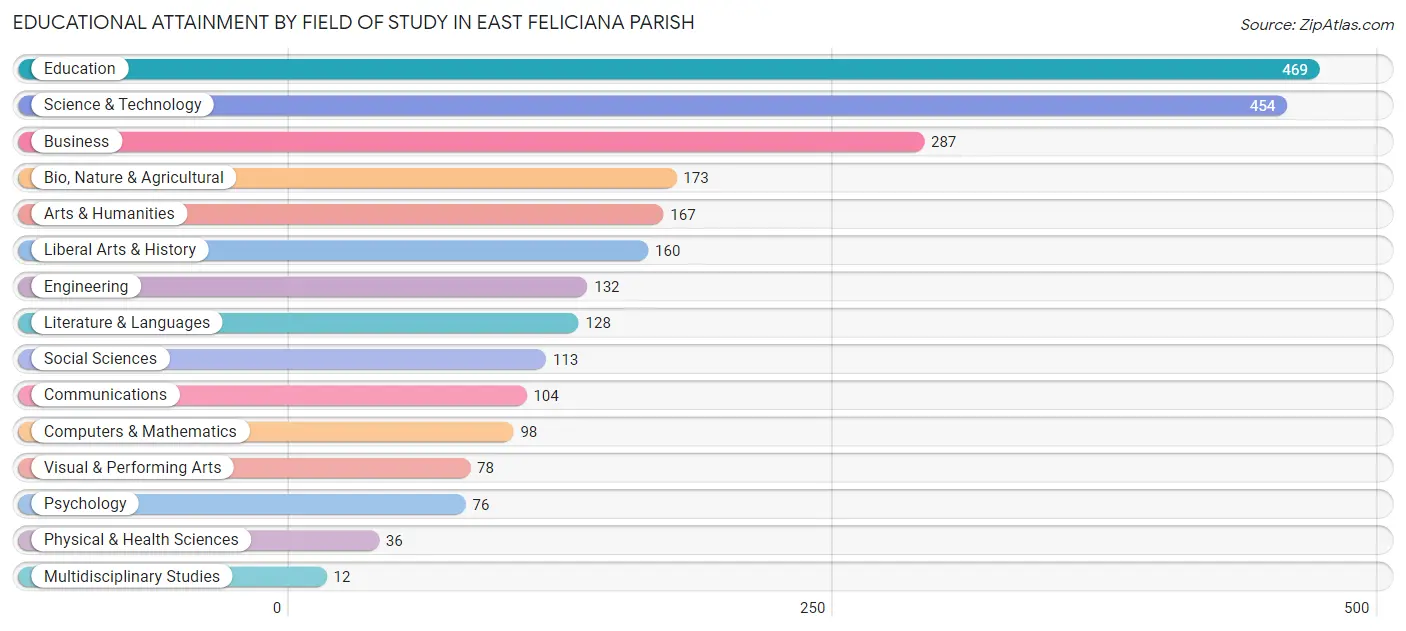
Educational Attainment by Field of Study in East Feliciana Parish
Education (469 | 18.9%), science & technology (454 | 18.2%), business (287 | 11.5%), bio, nature & agricultural (173 | 7.0%), and arts & humanities (167 | 6.7%) are the most common fields of study among 2,487 individuals in East Feliciana Parish who have obtained a bachelor's degree or higher.
| Field of Study | # Graduates | % Graduates |
| Computers & Mathematics | 98 | 3.9% |
| Bio, Nature & Agricultural | 173 | 7.0% |
| Physical & Health Sciences | 36 | 1.5% |
| Psychology | 76 | 3.1% |
| Social Sciences | 113 | 4.5% |
| Engineering | 132 | 5.3% |
| Multidisciplinary Studies | 12 | 0.5% |
| Science & Technology | 454 | 18.2% |
| Business | 287 | 11.5% |
| Education | 469 | 18.9% |
| Literature & Languages | 128 | 5.1% |
| Liberal Arts & History | 160 | 6.4% |
| Visual & Performing Arts | 78 | 3.1% |
| Communications | 104 | 4.2% |
| Arts & Humanities | 167 | 6.7% |
| Total | 2,487 | 100.0% |
Transportation & Commute in East Feliciana Parish
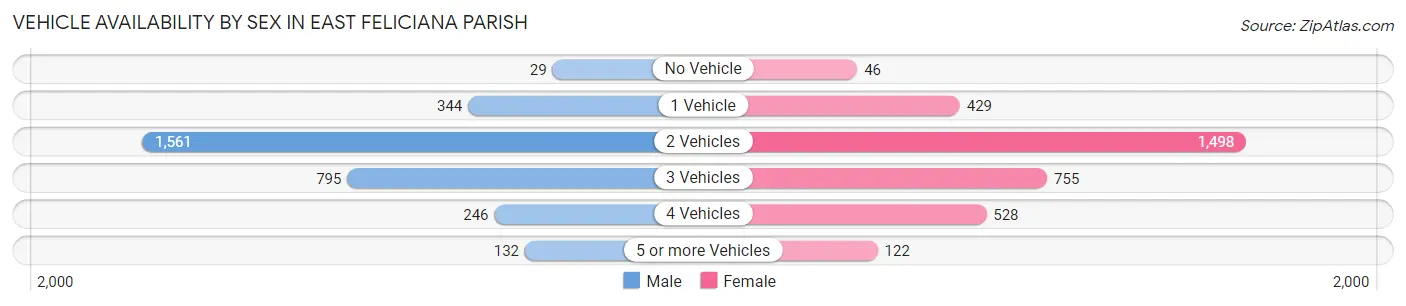
Vehicle Availability by Sex in East Feliciana Parish
The most prevalent vehicle ownership categories in East Feliciana Parish are males with 2 vehicles (1,561, accounting for 50.2%) and females with 2 vehicles (1,498, making up 46.2%).
| Vehicles Available | Male | Female |
| No Vehicle | 29 (0.9%) | 46 (1.4%) |
| 1 Vehicle | 344 (11.1%) | 429 (12.7%) |
| 2 Vehicles | 1,561 (50.2%) | 1,498 (44.4%) |
| 3 Vehicles | 795 (25.6%) | 755 (22.4%) |
| 4 Vehicles | 246 (7.9%) | 528 (15.6%) |
| 5 or more Vehicles | 132 (4.3%) | 122 (3.6%) |
| Total | 3,107 (100.0%) | 3,378 (100.0%) |
Commute Time in East Feliciana Parish
The most frequently occuring commute durations in East Feliciana Parish are 45 to 59 minutes (1,001 commuters, 16.1%), 60 to 89 minutes (930 commuters, 15.0%), and 30 to 34 minutes (902 commuters, 14.5%).
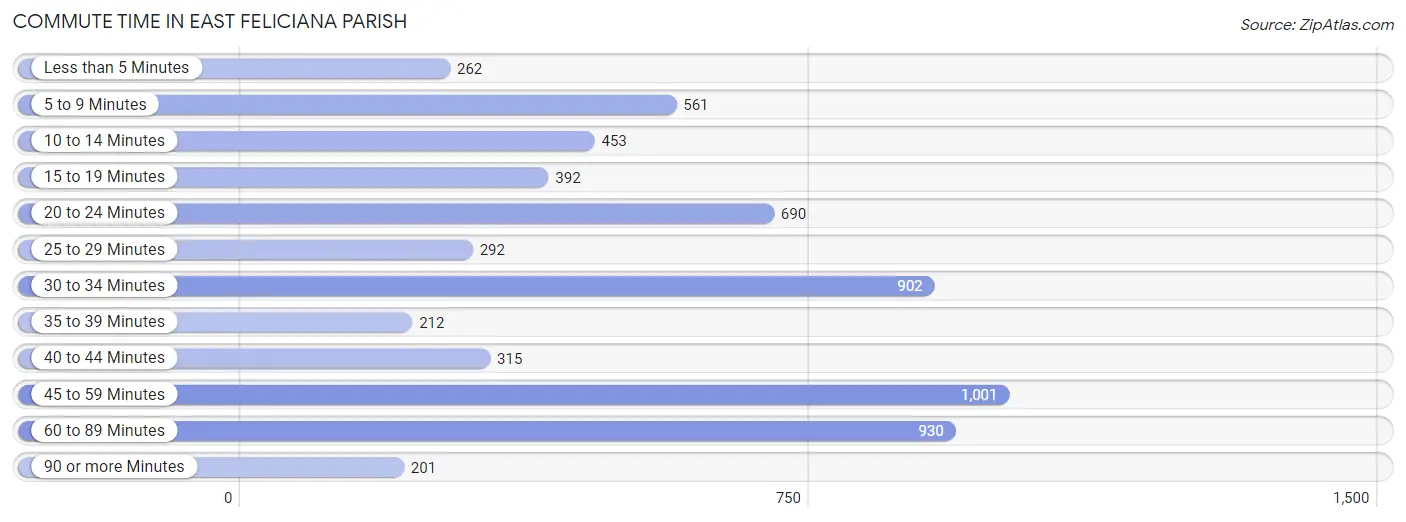
| Commute Time | # Commuters | % Commuters |
| Less than 5 Minutes | 262 | 4.2% |
| 5 to 9 Minutes | 561 | 9.0% |
| 10 to 14 Minutes | 453 | 7.3% |
| 15 to 19 Minutes | 392 | 6.3% |
| 20 to 24 Minutes | 690 | 11.1% |
| 25 to 29 Minutes | 292 | 4.7% |
| 30 to 34 Minutes | 902 | 14.5% |
| 35 to 39 Minutes | 212 | 3.4% |
| 40 to 44 Minutes | 315 | 5.1% |
| 45 to 59 Minutes | 1,001 | 16.1% |
| 60 to 89 Minutes | 930 | 15.0% |
| 90 or more Minutes | 201 | 3.2% |
Commute Time by Sex in East Feliciana Parish
The most common commute times in East Feliciana Parish are 45 to 59 minutes (676 commuters, 22.9%) for males and 20 to 24 minutes (496 commuters, 15.2%) for females.
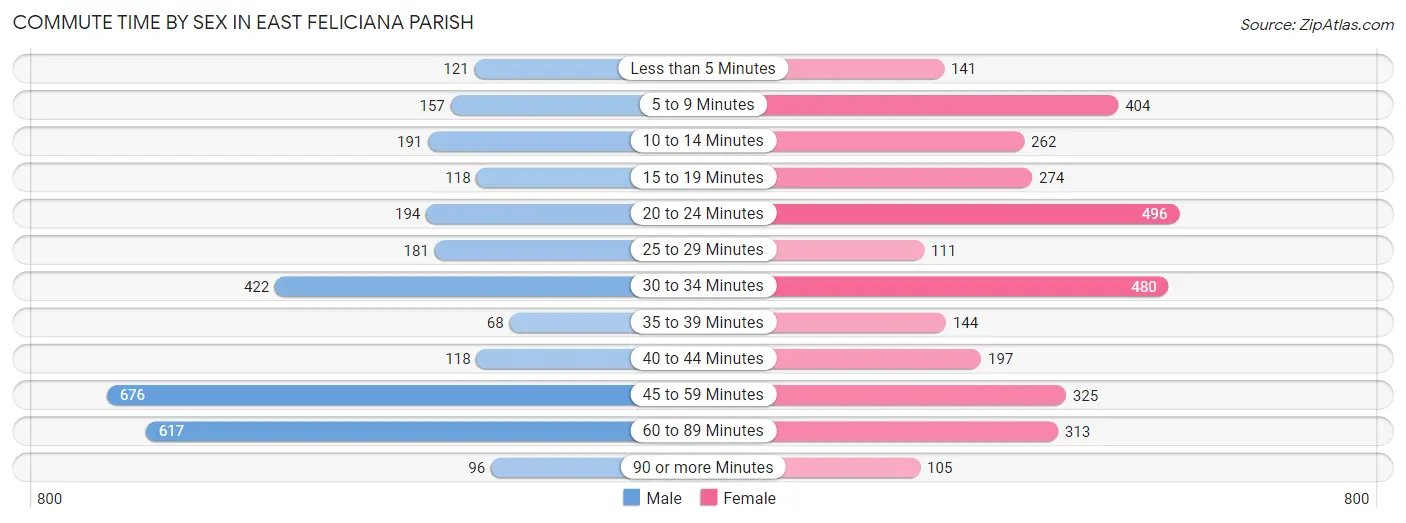
| Commute Time | Male | Female |
| Less than 5 Minutes | 121 (4.1%) | 141 (4.3%) |
| 5 to 9 Minutes | 157 (5.3%) | 404 (12.4%) |
| 10 to 14 Minutes | 191 (6.5%) | 262 (8.1%) |
| 15 to 19 Minutes | 118 (4.0%) | 274 (8.4%) |
| 20 to 24 Minutes | 194 (6.6%) | 496 (15.2%) |
| 25 to 29 Minutes | 181 (6.1%) | 111 (3.4%) |
| 30 to 34 Minutes | 422 (14.3%) | 480 (14.8%) |
| 35 to 39 Minutes | 68 (2.3%) | 144 (4.4%) |
| 40 to 44 Minutes | 118 (4.0%) | 197 (6.1%) |
| 45 to 59 Minutes | 676 (22.9%) | 325 (10.0%) |
| 60 to 89 Minutes | 617 (20.8%) | 313 (9.6%) |
| 90 or more Minutes | 96 (3.2%) | 105 (3.2%) |
Time of Departure to Work by Sex in East Feliciana Parish
The most frequent times of departure to work in East Feliciana Parish are 12:00 AM to 4:59 AM (684, 23.1%) for males and 7:30 AM to 7:59 AM (549, 16.9%) for females.
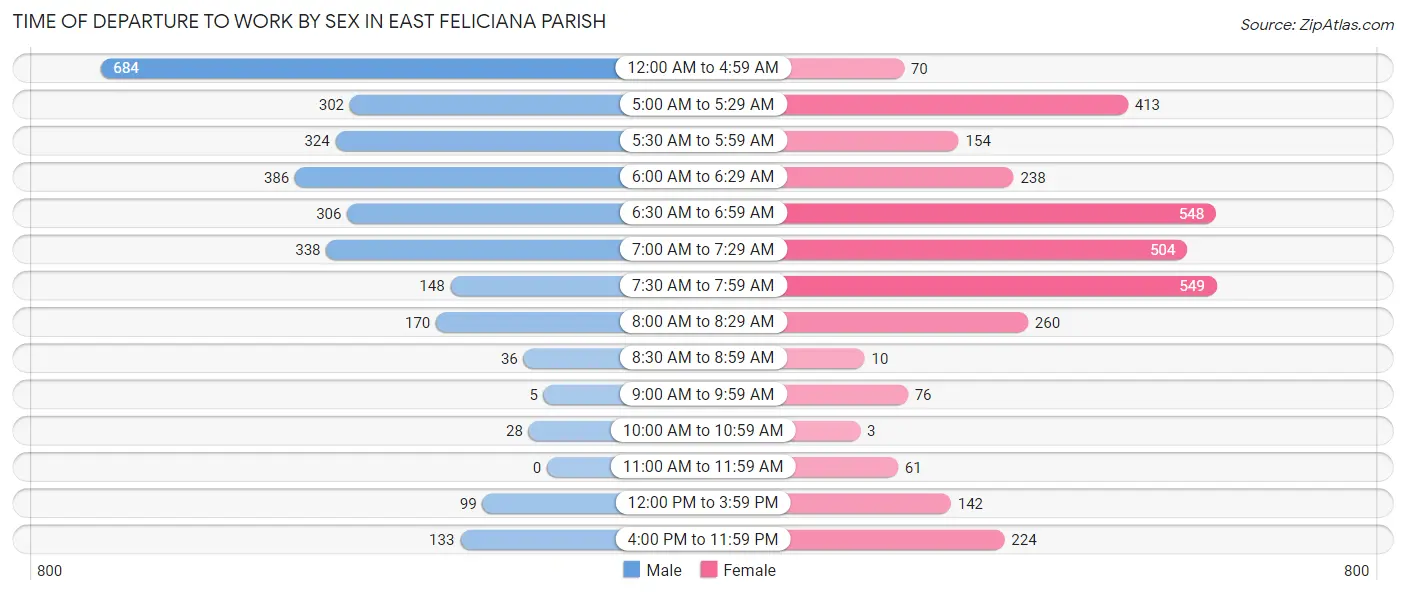
| Time of Departure | Male | Female |
| 12:00 AM to 4:59 AM | 684 (23.1%) | 70 (2.1%) |
| 5:00 AM to 5:29 AM | 302 (10.2%) | 413 (12.7%) |
| 5:30 AM to 5:59 AM | 324 (11.0%) | 154 (4.7%) |
| 6:00 AM to 6:29 AM | 386 (13.0%) | 238 (7.3%) |
| 6:30 AM to 6:59 AM | 306 (10.3%) | 548 (16.9%) |
| 7:00 AM to 7:29 AM | 338 (11.4%) | 504 (15.5%) |
| 7:30 AM to 7:59 AM | 148 (5.0%) | 549 (16.9%) |
| 8:00 AM to 8:29 AM | 170 (5.8%) | 260 (8.0%) |
| 8:30 AM to 8:59 AM | 36 (1.2%) | 10 (0.3%) |
| 9:00 AM to 9:59 AM | 5 (0.2%) | 76 (2.3%) |
| 10:00 AM to 10:59 AM | 28 (0.9%) | 3 (0.1%) |
| 11:00 AM to 11:59 AM | 0 (0.0%) | 61 (1.9%) |
| 12:00 PM to 3:59 PM | 99 (3.4%) | 142 (4.4%) |
| 4:00 PM to 11:59 PM | 133 (4.5%) | 224 (6.9%) |
| Total | 2,959 (100.0%) | 3,252 (100.0%) |
Housing Occupancy in East Feliciana Parish
Occupancy by Ownership in East Feliciana Parish
Of the total 6,613 dwellings in East Feliciana Parish, owner-occupied units account for 5,449 (82.4%), while renter-occupied units make up 1,164 (17.6%).
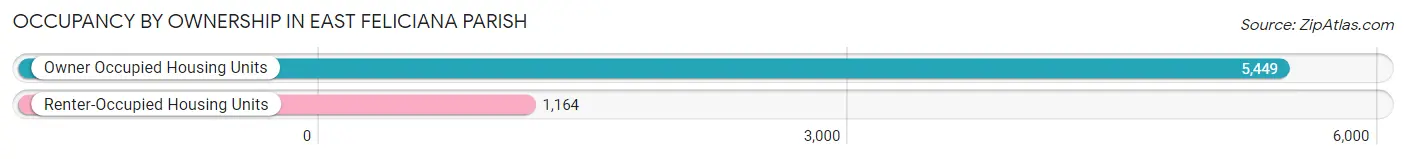
| Occupancy | # Housing Units | % Housing Units |
| Owner Occupied Housing Units | 5,449 | 82.4% |
| Renter-Occupied Housing Units | 1,164 | 17.6% |
| Total Occupied Housing Units | 6,613 | 100.0% |
Occupancy by Household Size in East Feliciana Parish
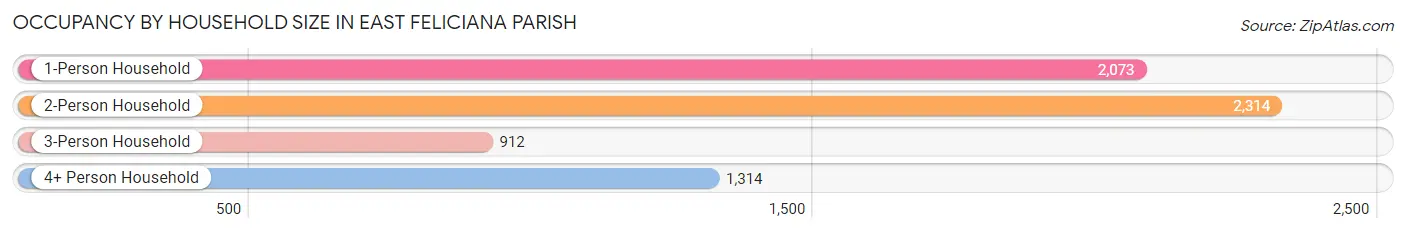
| Household Size | # Housing Units | % Housing Units |
| 1-Person Household | 2,073 | 31.4% |
| 2-Person Household | 2,314 | 35.0% |
| 3-Person Household | 912 | 13.8% |
| 4+ Person Household | 1,314 | 19.9% |
| Total Housing Units | 6,613 | 100.0% |
Occupancy by Ownership by Household Size in East Feliciana Parish
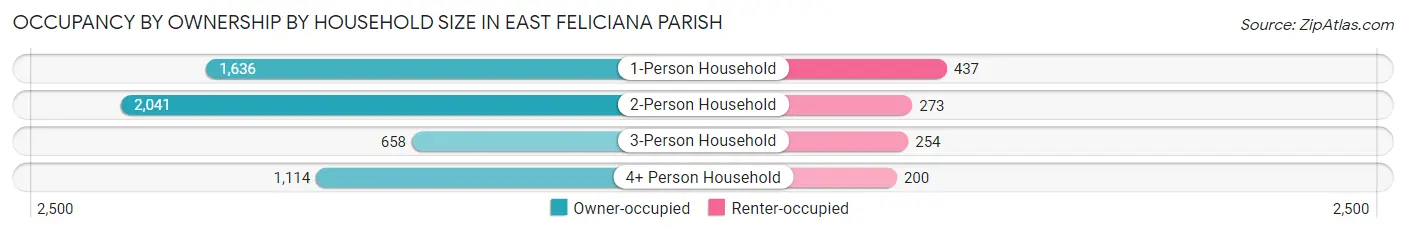
| Household Size | Owner-occupied | Renter-occupied |
| 1-Person Household | 1,636 (78.9%) | 437 (21.1%) |
| 2-Person Household | 2,041 (88.2%) | 273 (11.8%) |
| 3-Person Household | 658 (72.2%) | 254 (27.9%) |
| 4+ Person Household | 1,114 (84.8%) | 200 (15.2%) |
| Total Housing Units | 5,449 (82.4%) | 1,164 (17.6%) |
Occupancy by Educational Attainment in East Feliciana Parish
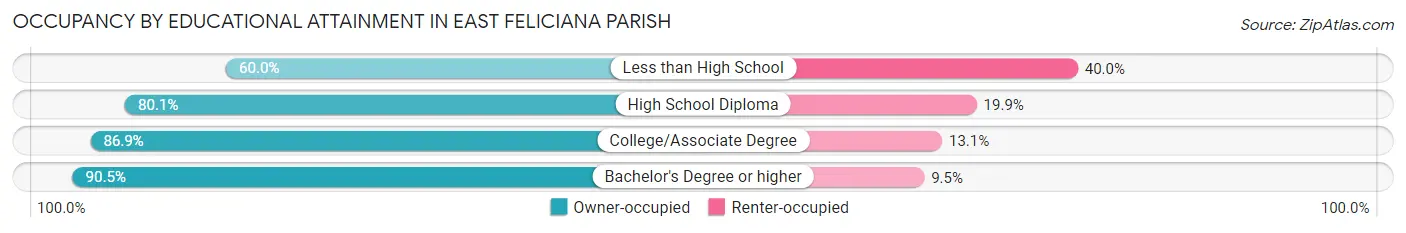
| Household Size | Owner-occupied | Renter-occupied |
| Less than High School | 443 (60.0%) | 295 (40.0%) |
| High School Diploma | 1,793 (80.1%) | 446 (19.9%) |
| College/Associate Degree | 1,884 (86.9%) | 283 (13.1%) |
| Bachelor's Degree or higher | 1,329 (90.5%) | 140 (9.5%) |
Occupancy by Age of Householder in East Feliciana Parish
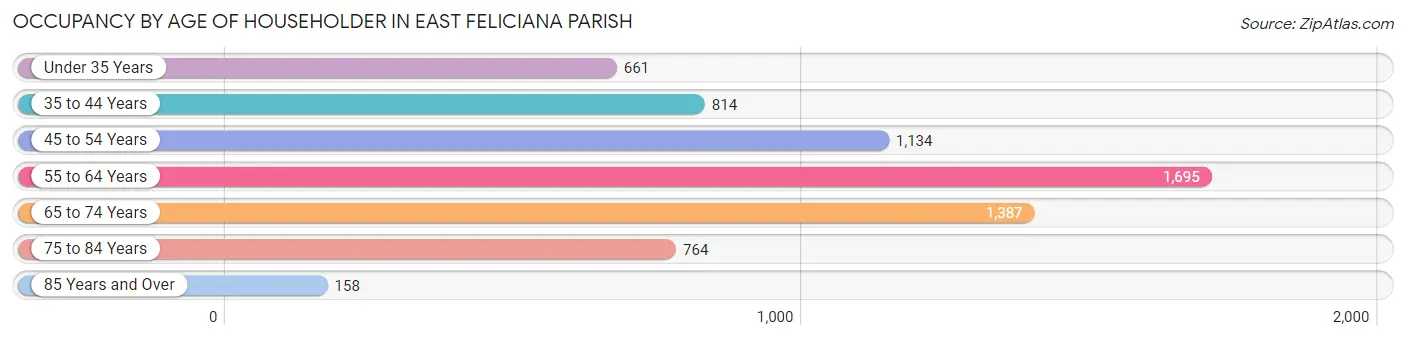
| Age Bracket | # Households | % Households |
| Under 35 Years | 661 | 10.0% |
| 35 to 44 Years | 814 | 12.3% |
| 45 to 54 Years | 1,134 | 17.2% |
| 55 to 64 Years | 1,695 | 25.6% |
| 65 to 74 Years | 1,387 | 21.0% |
| 75 to 84 Years | 764 | 11.6% |
| 85 Years and Over | 158 | 2.4% |
| Total | 6,613 | 100.0% |
Housing Finances in East Feliciana Parish
Median Income by Occupancy in East Feliciana Parish
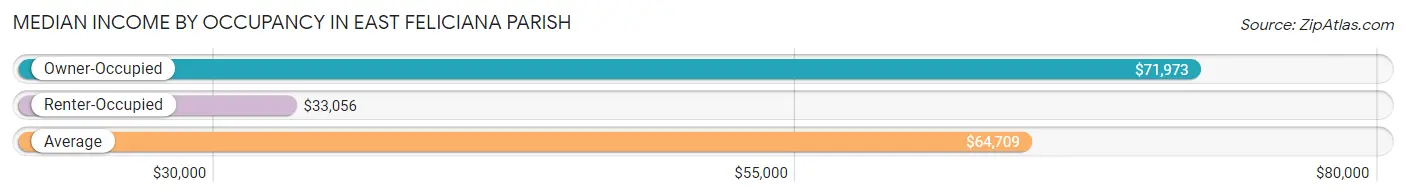
| Occupancy Type | # Households | Median Income |
| Owner-Occupied | 5,449 (82.4%) | $71,973 |
| Renter-Occupied | 1,164 (17.6%) | $33,056 |
| Average | 6,613 (100.0%) | $64,709 |
Occupancy by Householder Income Bracket in East Feliciana Parish
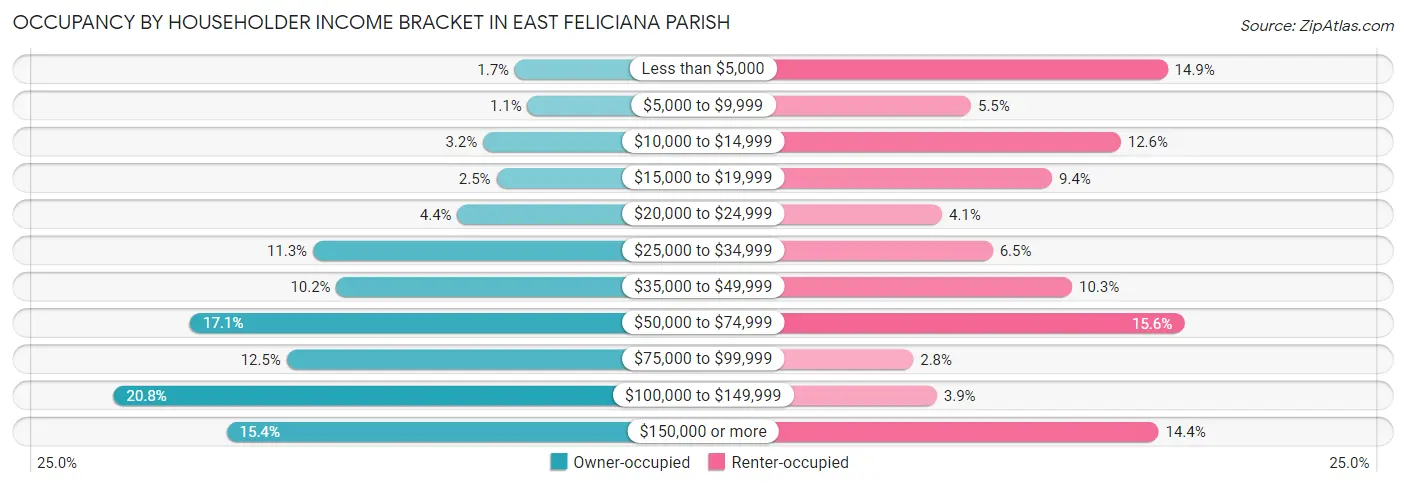
| Income Bracket | Owner-occupied | Renter-occupied |
| Less than $5,000 | 90 (1.7%) | 173 (14.9%) |
| $5,000 to $9,999 | 57 (1.1%) | 64 (5.5%) |
| $10,000 to $14,999 | 173 (3.2%) | 147 (12.6%) |
| $15,000 to $19,999 | 138 (2.5%) | 109 (9.4%) |
| $20,000 to $24,999 | 239 (4.4%) | 48 (4.1%) |
| $25,000 to $34,999 | 614 (11.3%) | 76 (6.5%) |
| $35,000 to $49,999 | 553 (10.2%) | 120 (10.3%) |
| $50,000 to $74,999 | 933 (17.1%) | 182 (15.6%) |
| $75,000 to $99,999 | 682 (12.5%) | 32 (2.8%) |
| $100,000 to $149,999 | 1,132 (20.8%) | 45 (3.9%) |
| $150,000 or more | 838 (15.4%) | 168 (14.4%) |
| Total | 5,449 (100.0%) | 1,164 (100.0%) |
Monthly Housing Cost Tiers in East Feliciana Parish
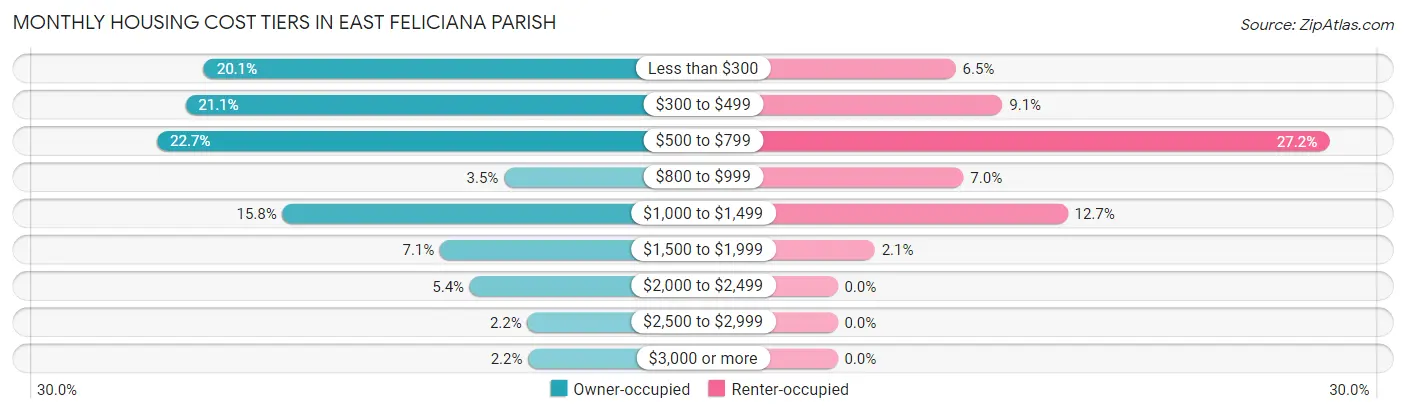
| Monthly Cost | Owner-occupied | Renter-occupied |
| Less than $300 | 1,095 (20.1%) | 76 (6.5%) |
| $300 to $499 | 1,151 (21.1%) | 106 (9.1%) |
| $500 to $799 | 1,236 (22.7%) | 316 (27.2%) |
| $800 to $999 | 191 (3.5%) | 81 (7.0%) |
| $1,000 to $1,499 | 858 (15.8%) | 148 (12.7%) |
| $1,500 to $1,999 | 384 (7.0%) | 24 (2.1%) |
| $2,000 to $2,499 | 294 (5.4%) | 0 (0.0%) |
| $2,500 to $2,999 | 121 (2.2%) | 0 (0.0%) |
| $3,000 or more | 119 (2.2%) | 0 (0.0%) |
| Total | 5,449 (100.0%) | 1,164 (100.0%) |
Physical Housing Characteristics in East Feliciana Parish
Housing Structures in East Feliciana Parish
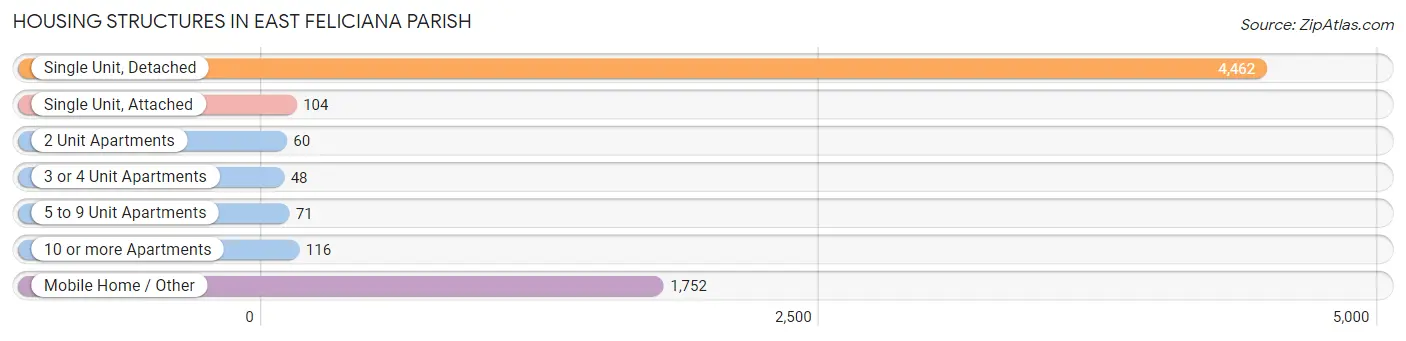
| Structure Type | # Housing Units | % Housing Units |
| Single Unit, Detached | 4,462 | 67.5% |
| Single Unit, Attached | 104 | 1.6% |
| 2 Unit Apartments | 60 | 0.9% |
| 3 or 4 Unit Apartments | 48 | 0.7% |
| 5 to 9 Unit Apartments | 71 | 1.1% |
| 10 or more Apartments | 116 | 1.8% |
| Mobile Home / Other | 1,752 | 26.5% |
| Total | 6,613 | 100.0% |
Housing Structures by Occupancy in East Feliciana Parish
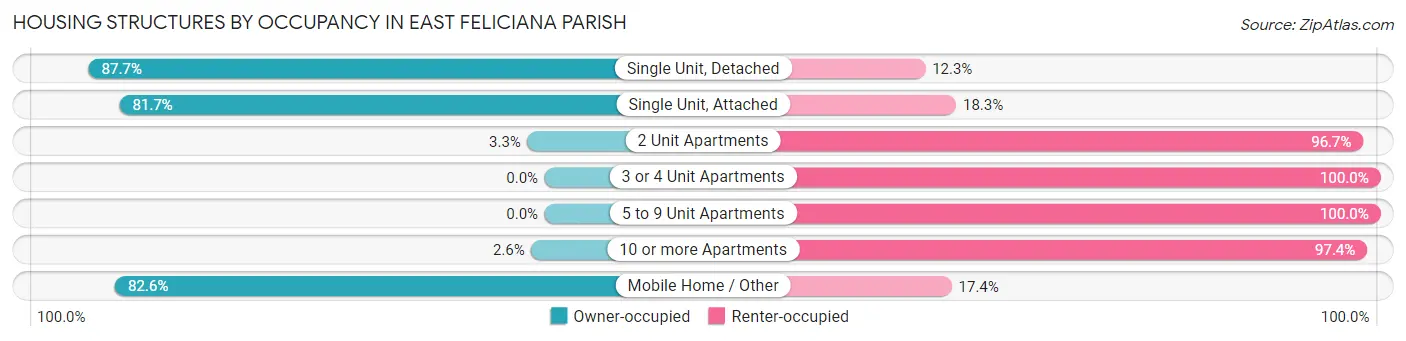
| Structure Type | Owner-occupied | Renter-occupied |
| Single Unit, Detached | 3,912 (87.7%) | 550 (12.3%) |
| Single Unit, Attached | 85 (81.7%) | 19 (18.3%) |
| 2 Unit Apartments | 2 (3.3%) | 58 (96.7%) |
| 3 or 4 Unit Apartments | 0 (0.0%) | 48 (100.0%) |
| 5 to 9 Unit Apartments | 0 (0.0%) | 71 (100.0%) |
| 10 or more Apartments | 3 (2.6%) | 113 (97.4%) |
| Mobile Home / Other | 1,447 (82.6%) | 305 (17.4%) |
| Total | 5,449 (82.4%) | 1,164 (17.6%) |
Housing Structures by Number of Rooms in East Feliciana Parish
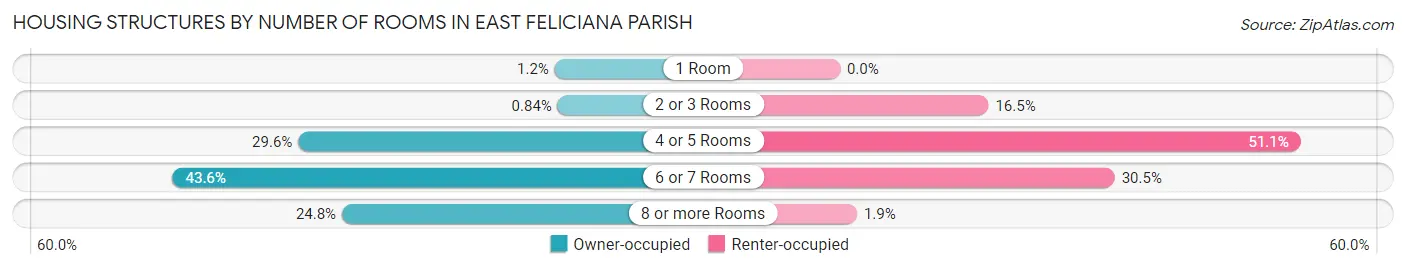
| Number of Rooms | Owner-occupied | Renter-occupied |
| 1 Room | 64 (1.2%) | 0 (0.0%) |
| 2 or 3 Rooms | 46 (0.8%) | 192 (16.5%) |
| 4 or 5 Rooms | 1,615 (29.6%) | 595 (51.1%) |
| 6 or 7 Rooms | 2,374 (43.6%) | 355 (30.5%) |
| 8 or more Rooms | 1,350 (24.8%) | 22 (1.9%) |
| Total | 5,449 (100.0%) | 1,164 (100.0%) |
Housing Structure by Heating Type in East Feliciana Parish
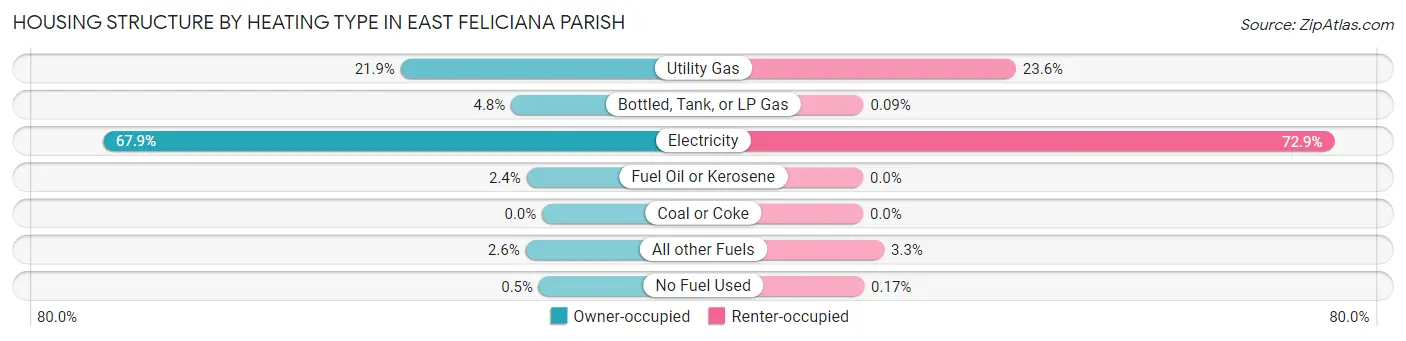
| Heating Type | Owner-occupied | Renter-occupied |
| Utility Gas | 1,191 (21.9%) | 275 (23.6%) |
| Bottled, Tank, or LP Gas | 261 (4.8%) | 1 (0.1%) |
| Electricity | 3,700 (67.9%) | 848 (72.9%) |
| Fuel Oil or Kerosene | 130 (2.4%) | 0 (0.0%) |
| Coal or Coke | 0 (0.0%) | 0 (0.0%) |
| All other Fuels | 140 (2.6%) | 38 (3.3%) |
| No Fuel Used | 27 (0.5%) | 2 (0.2%) |
| Total | 5,449 (100.0%) | 1,164 (100.0%) |
Household Vehicle Usage in East Feliciana Parish
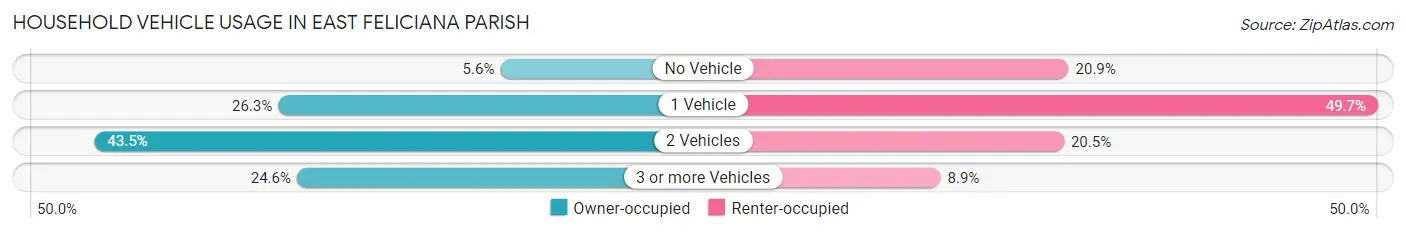
| Vehicles per Household | Owner-occupied | Renter-occupied |
| No Vehicle | 305 (5.6%) | 243 (20.9%) |
| 1 Vehicle | 1,435 (26.3%) | 579 (49.7%) |
| 2 Vehicles | 2,369 (43.5%) | 238 (20.4%) |
| 3 or more Vehicles | 1,340 (24.6%) | 104 (8.9%) |
| Total | 5,449 (100.0%) | 1,164 (100.0%) |
Real Estate & Mortgages in East Feliciana Parish
Real Estate and Mortgage Overview in East Feliciana Parish
| Characteristic | Without Mortgage | With Mortgage |
| Housing Units | 3,131 | 2,318 |
| Median Property Value | $193,800 | $212,300 |
| Median Household Income | $61,504 | $546 |
| Monthly Housing Costs | $394 | $119 |
| Real Estate Taxes | $260 | $320 |
Property Value by Mortgage Status in East Feliciana Parish
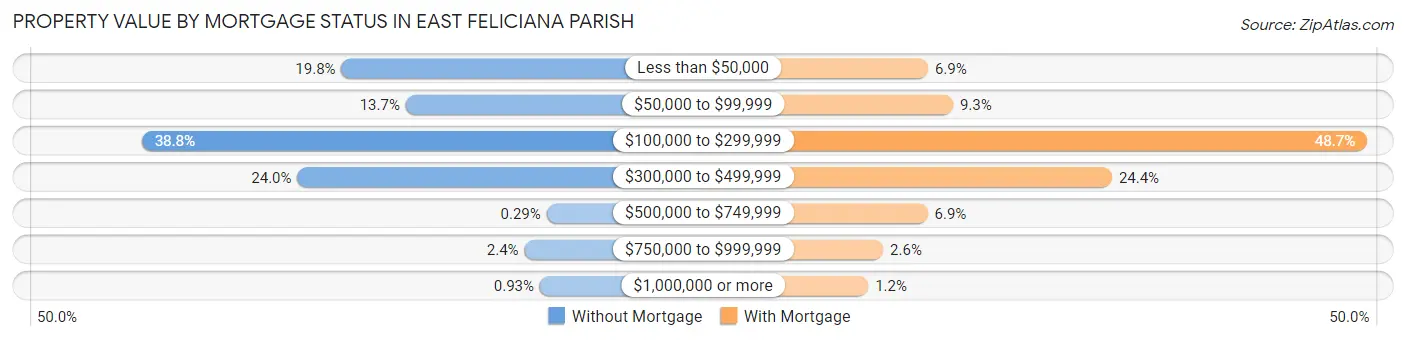
| Property Value | Without Mortgage | With Mortgage |
| Less than $50,000 | 621 (19.8%) | 160 (6.9%) |
| $50,000 to $99,999 | 429 (13.7%) | 215 (9.3%) |
| $100,000 to $299,999 | 1,216 (38.8%) | 1,129 (48.7%) |
| $300,000 to $499,999 | 752 (24.0%) | 566 (24.4%) |
| $500,000 to $749,999 | 9 (0.3%) | 159 (6.9%) |
| $750,000 to $999,999 | 75 (2.4%) | 61 (2.6%) |
| $1,000,000 or more | 29 (0.9%) | 28 (1.2%) |
| Total | 3,131 (100.0%) | 2,318 (100.0%) |
Household Income by Mortgage Status in East Feliciana Parish
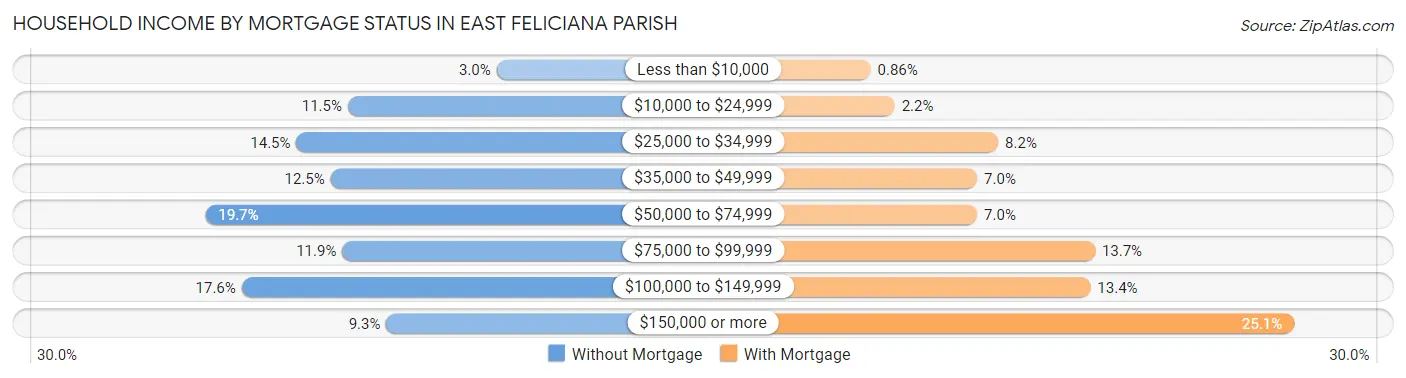
| Household Income | Without Mortgage | With Mortgage |
| Less than $10,000 | 95 (3.0%) | 20 (0.9%) |
| $10,000 to $24,999 | 361 (11.5%) | 52 (2.2%) |
| $25,000 to $34,999 | 453 (14.5%) | 189 (8.2%) |
| $35,000 to $49,999 | 392 (12.5%) | 161 (7.0%) |
| $50,000 to $74,999 | 616 (19.7%) | 161 (7.0%) |
| $75,000 to $99,999 | 371 (11.8%) | 317 (13.7%) |
| $100,000 to $149,999 | 551 (17.6%) | 311 (13.4%) |
| $150,000 or more | 292 (9.3%) | 581 (25.1%) |
| Total | 3,131 (100.0%) | 2,318 (100.0%) |
Property Value to Household Income Ratio in East Feliciana Parish
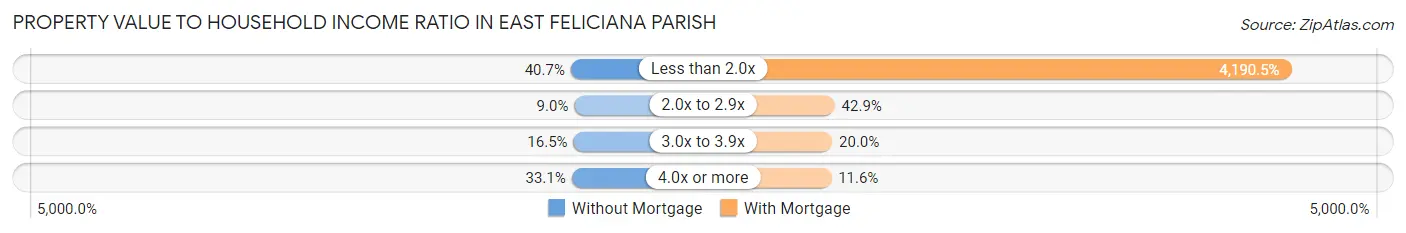
| Value-to-Income Ratio | Without Mortgage | With Mortgage |
| Less than 2.0x | 1,274 (40.7%) | 97,135 (4,190.5%) |
| 2.0x to 2.9x | 283 (9.0%) | 995 (42.9%) |
| 3.0x to 3.9x | 515 (16.5%) | 464 (20.0%) |
| 4.0x or more | 1,037 (33.1%) | 268 (11.6%) |
| Total | 3,131 (100.0%) | 2,318 (100.0%) |
Real Estate Taxes by Mortgage Status in East Feliciana Parish
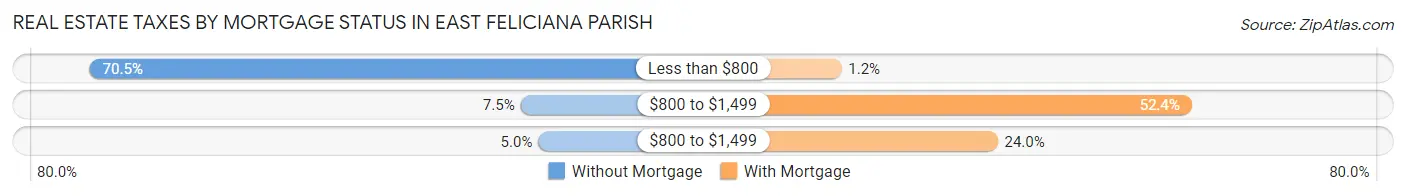
| Property Taxes | Without Mortgage | With Mortgage |
| Less than $800 | 2,207 (70.5%) | 28 (1.2%) |
| $800 to $1,499 | 236 (7.5%) | 1,215 (52.4%) |
| $800 to $1,499 | 155 (5.0%) | 557 (24.0%) |
| Total | 3,131 (100.0%) | 2,318 (100.0%) |
Health & Disability in East Feliciana Parish
Health Insurance Coverage by Age in East Feliciana Parish
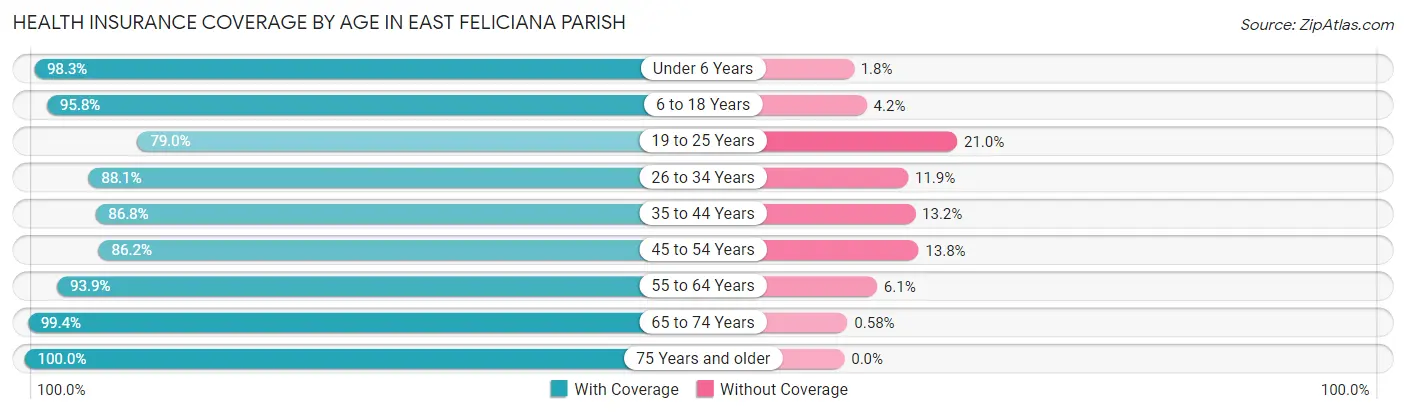
| Age Bracket | With Coverage | Without Coverage |
| Under 6 Years | 1,125 (98.3%) | 20 (1.8%) |
| 6 to 18 Years | 2,231 (95.8%) | 97 (4.2%) |
| 19 to 25 Years | 1,071 (79.0%) | 285 (21.0%) |
| 26 to 34 Years | 1,326 (88.1%) | 179 (11.9%) |
| 35 to 44 Years | 1,697 (86.8%) | 258 (13.2%) |
| 45 to 54 Years | 2,039 (86.2%) | 327 (13.8%) |
| 55 to 64 Years | 2,454 (93.9%) | 159 (6.1%) |
| 65 to 74 Years | 2,063 (99.4%) | 12 (0.6%) |
| 75 Years and older | 1,287 (100.0%) | 0 (0.0%) |
| Total | 15,293 (92.0%) | 1,337 (8.0%) |
Health Insurance Coverage by Citizenship Status in East Feliciana Parish
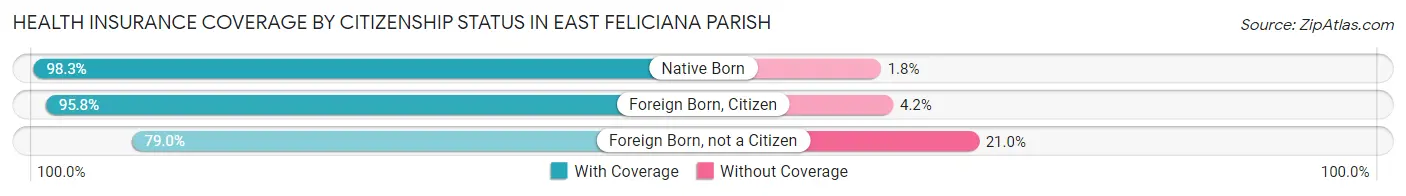
| Citizenship Status | With Coverage | Without Coverage |
| Native Born | 1,125 (98.3%) | 20 (1.8%) |
| Foreign Born, Citizen | 2,231 (95.8%) | 97 (4.2%) |
| Foreign Born, not a Citizen | 1,071 (79.0%) | 285 (21.0%) |
Health Insurance Coverage by Household Income in East Feliciana Parish
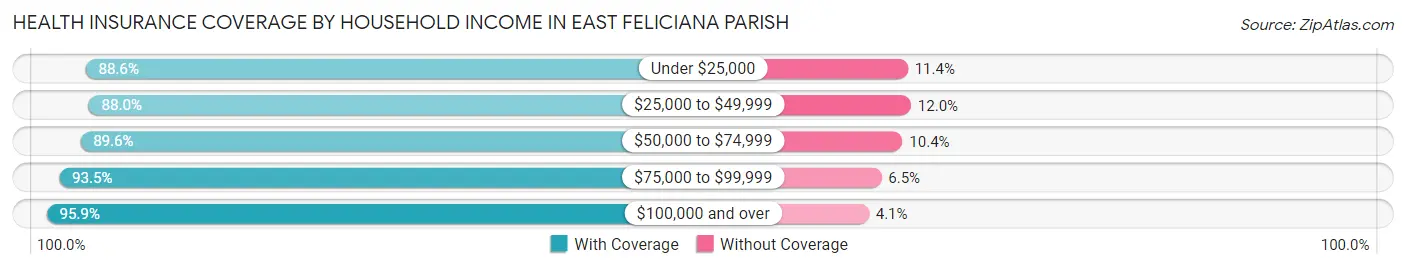
| Household Income | With Coverage | Without Coverage |
| Under $25,000 | 2,109 (88.6%) | 272 (11.4%) |
| $25,000 to $49,999 | 2,271 (88.0%) | 310 (12.0%) |
| $50,000 to $74,999 | 2,322 (89.6%) | 270 (10.4%) |
| $75,000 to $99,999 | 1,342 (93.5%) | 93 (6.5%) |
| $100,000 and over | 6,977 (95.9%) | 300 (4.1%) |
Public vs Private Health Insurance Coverage by Age in East Feliciana Parish
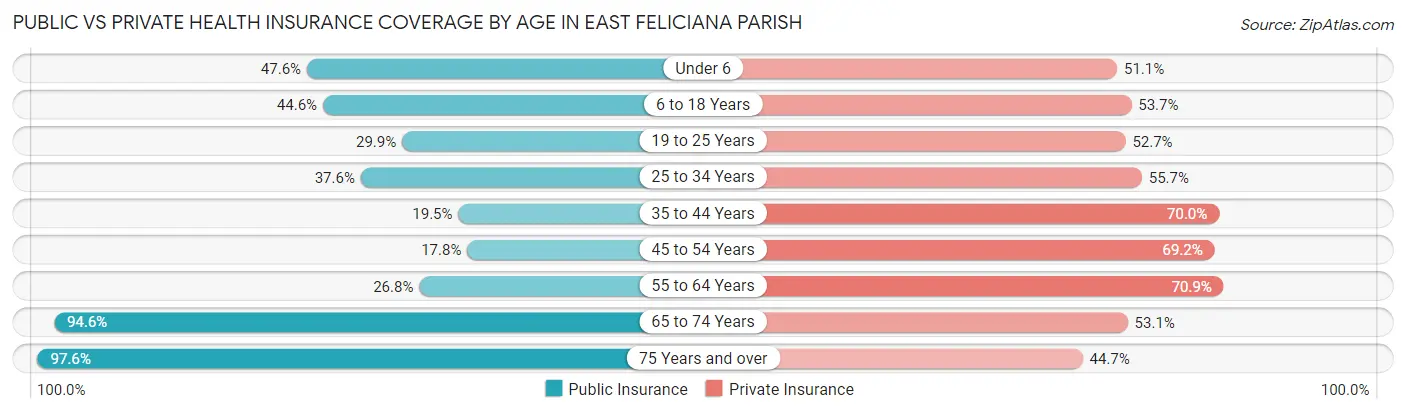
| Age Bracket | Public Insurance | Private Insurance |
| Under 6 | 545 (47.6%) | 585 (51.1%) |
| 6 to 18 Years | 1,039 (44.6%) | 1,251 (53.7%) |
| 19 to 25 Years | 406 (29.9%) | 714 (52.6%) |
| 25 to 34 Years | 566 (37.6%) | 838 (55.7%) |
| 35 to 44 Years | 381 (19.5%) | 1,369 (70.0%) |
| 45 to 54 Years | 422 (17.8%) | 1,637 (69.2%) |
| 55 to 64 Years | 699 (26.8%) | 1,852 (70.9%) |
| 65 to 74 Years | 1,962 (94.6%) | 1,101 (53.1%) |
| 75 Years and over | 1,256 (97.6%) | 575 (44.7%) |
| Total | 7,276 (43.8%) | 9,922 (59.7%) |
Disability Status by Sex by Age in East Feliciana Parish
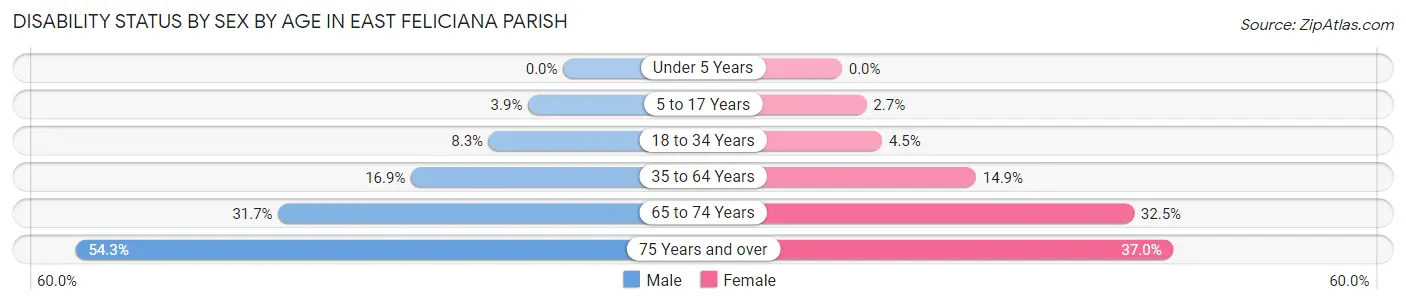
| Age Bracket | Male | Female |
| Under 5 Years | 0 (0.0%) | 0 (0.0%) |
| 5 to 17 Years | 50 (3.9%) | 32 (2.7%) |
| 18 to 34 Years | 118 (8.3%) | 71 (4.5%) |
| 35 to 64 Years | 570 (16.9%) | 533 (14.9%) |
| 65 to 74 Years | 277 (31.7%) | 391 (32.5%) |
| 75 Years and over | 339 (54.3%) | 245 (36.9%) |
Disability Class by Sex by Age in East Feliciana Parish
Disability Class: Hearing Difficulty
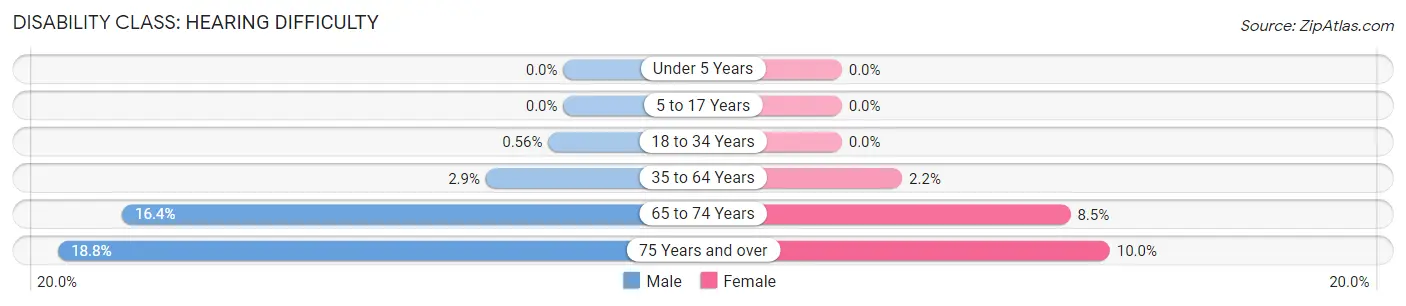
| Age Bracket | Male | Female |
| Under 5 Years | 0 (0.0%) | 0 (0.0%) |
| 5 to 17 Years | 0 (0.0%) | 0 (0.0%) |
| 18 to 34 Years | 8 (0.6%) | 0 (0.0%) |
| 35 to 64 Years | 97 (2.9%) | 80 (2.2%) |
| 65 to 74 Years | 143 (16.4%) | 102 (8.5%) |
| 75 Years and over | 117 (18.8%) | 66 (10.0%) |
Disability Class: Vision Difficulty
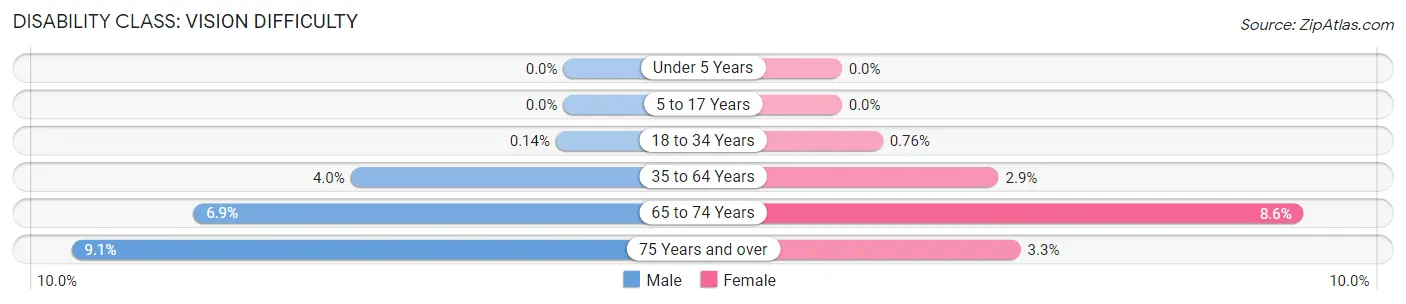
| Age Bracket | Male | Female |
| Under 5 Years | 0 (0.0%) | 0 (0.0%) |
| 5 to 17 Years | 0 (0.0%) | 0 (0.0%) |
| 18 to 34 Years | 2 (0.1%) | 12 (0.8%) |
| 35 to 64 Years | 133 (4.0%) | 104 (2.9%) |
| 65 to 74 Years | 60 (6.9%) | 103 (8.6%) |
| 75 Years and over | 57 (9.1%) | 22 (3.3%) |
Disability Class: Cognitive Difficulty
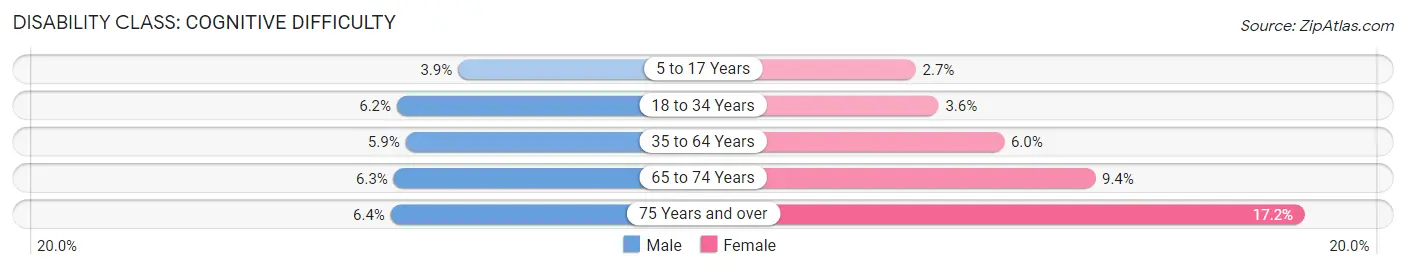
| Age Bracket | Male | Female |
| 5 to 17 Years | 50 (3.9%) | 32 (2.7%) |
| 18 to 34 Years | 88 (6.2%) | 57 (3.6%) |
| 35 to 64 Years | 197 (5.9%) | 215 (6.0%) |
| 65 to 74 Years | 55 (6.3%) | 113 (9.4%) |
| 75 Years and over | 40 (6.4%) | 114 (17.2%) |
Disability Class: Ambulatory Difficulty
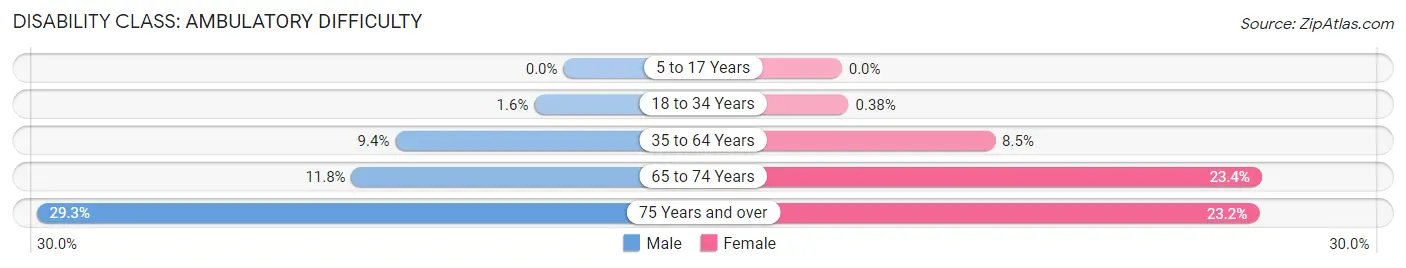
| Age Bracket | Male | Female |
| 5 to 17 Years | 0 (0.0%) | 0 (0.0%) |
| 18 to 34 Years | 23 (1.6%) | 6 (0.4%) |
| 35 to 64 Years | 315 (9.4%) | 305 (8.5%) |
| 65 to 74 Years | 103 (11.8%) | 281 (23.4%) |
| 75 Years and over | 183 (29.3%) | 154 (23.2%) |
Disability Class: Self-Care Difficulty
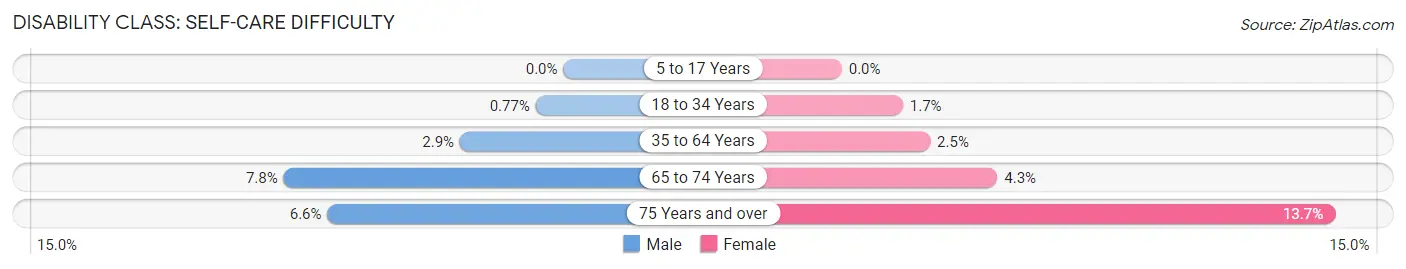
| Age Bracket | Male | Female |
| 5 to 17 Years | 0 (0.0%) | 0 (0.0%) |
| 18 to 34 Years | 11 (0.8%) | 27 (1.7%) |
| 35 to 64 Years | 97 (2.9%) | 88 (2.5%) |
| 65 to 74 Years | 68 (7.8%) | 52 (4.3%) |
| 75 Years and over | 41 (6.6%) | 91 (13.7%) |
Technology Access in East Feliciana Parish
Computing Device Access in East Feliciana Parish
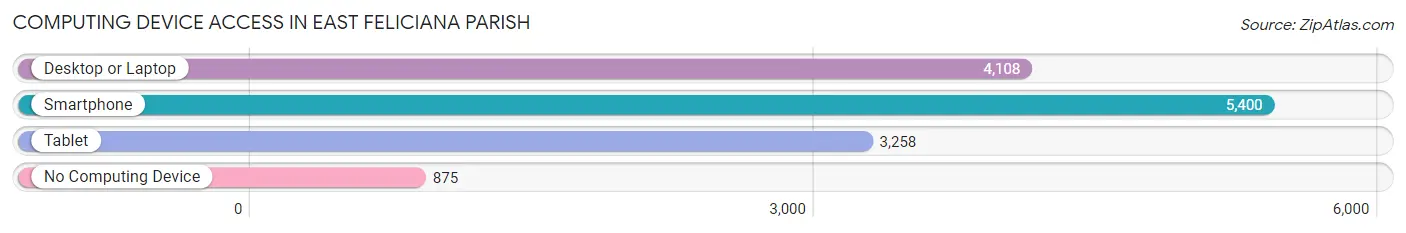
| Device Type | # Households | % Households |
| Desktop or Laptop | 4,108 | 62.1% |
| Smartphone | 5,400 | 81.7% |
| Tablet | 3,258 | 49.3% |
| No Computing Device | 875 | 13.2% |
| Total | 6,613 | 100.0% |
Internet Access in East Feliciana Parish
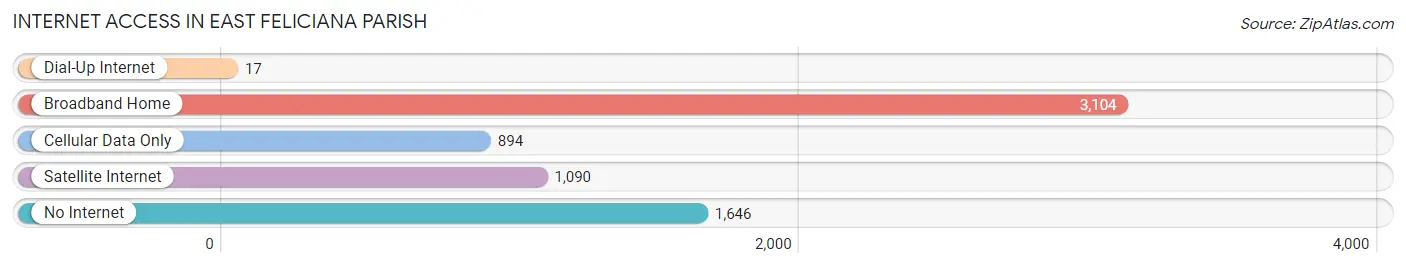
| Internet Type | # Households | % Households |
| Dial-Up Internet | 17 | 0.3% |
| Broadband Home | 3,104 | 46.9% |
| Cellular Data Only | 894 | 13.5% |
| Satellite Internet | 1,090 | 16.5% |
| No Internet | 1,646 | 24.9% |
| Total | 6,613 | 100.0% |
East Feliciana Parish Summary
History
Located in the southeastern corner of Louisiana, East Feliciana Parish is a rural parish with a rich history. The parish was established in 1824 and was named after the Feliciana region of Spain. The parish was originally part of West Feliciana Parish, but was split off in 1824. The parish is bordered by the Mississippi River to the east, the Amite River to the south, and the Tangipahoa River to the west.
The parish was originally inhabited by the Choctaw and Natchez Native American tribes. The first European settlers arrived in the area in the late 1700s. These settlers were mostly French and Spanish, and they established small farms and plantations. The parish was an important center of cotton production during the antebellum period.
During the Civil War, East Feliciana Parish was the site of several battles. The Battle of Jackson was fought in the parish in 1863, and the Battle of Clinton was fought in 1864. After the war, the parish was devastated by Reconstruction. The economy was in ruins, and many of the plantations were abandoned.
Geography
East Feliciana Parish is located in the southeastern corner of Louisiana. It is bordered by the Mississippi River to the east, the Amite River to the south, and the Tangipahoa River to the west. The parish covers an area of 545 square miles and has a population of 19,890.
The parish is mostly rural, with small towns and villages scattered throughout. The largest town is Clinton, which is the parish seat. Other towns include Jackson, Slaughter, and Ethel. The parish is mostly flat, with some rolling hills in the northern part. The soil is mostly sandy loam, and the climate is humid subtropical.
Economy
The economy of East Feliciana Parish is largely based on agriculture. The main crops are cotton, soybeans, corn, and wheat. The parish also has a thriving timber industry, and there are several sawmills in the area.
The parish also has a growing tourism industry. The area is known for its historic sites, such as the Battle of Jackson and the Battle of Clinton. There are also several state parks and recreational areas in the parish.
Demographics
As of the 2010 census, the population of East Feliciana Parish was 19,890. The racial makeup of the parish was 79.3% White, 18.2% African American, 0.5% Native American, 0.3% Asian, 0.1% Pacific Islander, and 1.6% from other races. Hispanic or Latino of any race were 2.2% of the population.
The median household income in the parish was $37,945, and the median family income was $45,945. The per capita income was $18,945. About 17.2% of the population was below the poverty line.
Common Questions
What is the Total Population of East Feliciana Parish?
Total Population of East Feliciana Parish is 19,452.
What is the Total Male Population of East Feliciana Parish?
Total Male Population of East Feliciana Parish is 10,737.
What is the Total Female Population of East Feliciana Parish?
Total Female Population of East Feliciana Parish is 8,715.
What is the Ratio of Males per 100 Females in East Feliciana Parish?
There are 123.20 Males per 100 Females in East Feliciana Parish.
What is the Ratio of Females per 100 Males in East Feliciana Parish?
There are 81.17 Females per 100 Males in East Feliciana Parish.
What is the Median Population Age in East Feliciana Parish?
Median Population Age in East Feliciana Parish is 44.3 Years.
What is the Average Family Size in East Feliciana Parish
Average Family Size in East Feliciana Parish is 3.1 People.
What is the Average Household Size in East Feliciana Parish
Average Household Size in East Feliciana Parish is 2.5 People.
What is Per Capita Income in East Feliciana Parish?
Per Capita income in East Feliciana Parish is $32,720.
What is the Median Family Income in East Feliciana Parish?
Median Family Income in East Feliciana Parish is $85,571.
What is the Median Household income in East Feliciana Parish?
Median Household Income in East Feliciana Parish is $64,709.
What is Income or Wage Gap in East Feliciana Parish?
Income or Wage Gap in East Feliciana Parish is 27.7%.
Women in East Feliciana Parish earn 72.3 cents for every dollar earned by a man.
What is Family Income Deficit in East Feliciana Parish?
Family Income Deficit in East Feliciana Parish is $8,318.
Families that are below poverty line in East Feliciana Parish earn $8,318 less on average than the poverty threshold level.
What is Inequality or Gini Index in East Feliciana Parish?
Inequality or Gini Index in East Feliciana Parish is 0.49.
How Large is the Labor Force in East Feliciana Parish?
There are 7,041 People in the Labor Forcein in East Feliciana Parish.
What is the Percentage of People in the Labor Force in East Feliciana Parish?
42.5% of People are in the Labor Force in East Feliciana Parish.
What is the Unemployment Rate in East Feliciana Parish?
Unemployment Rate in East Feliciana Parish is 5.5%.