East Carroll Parish, LA
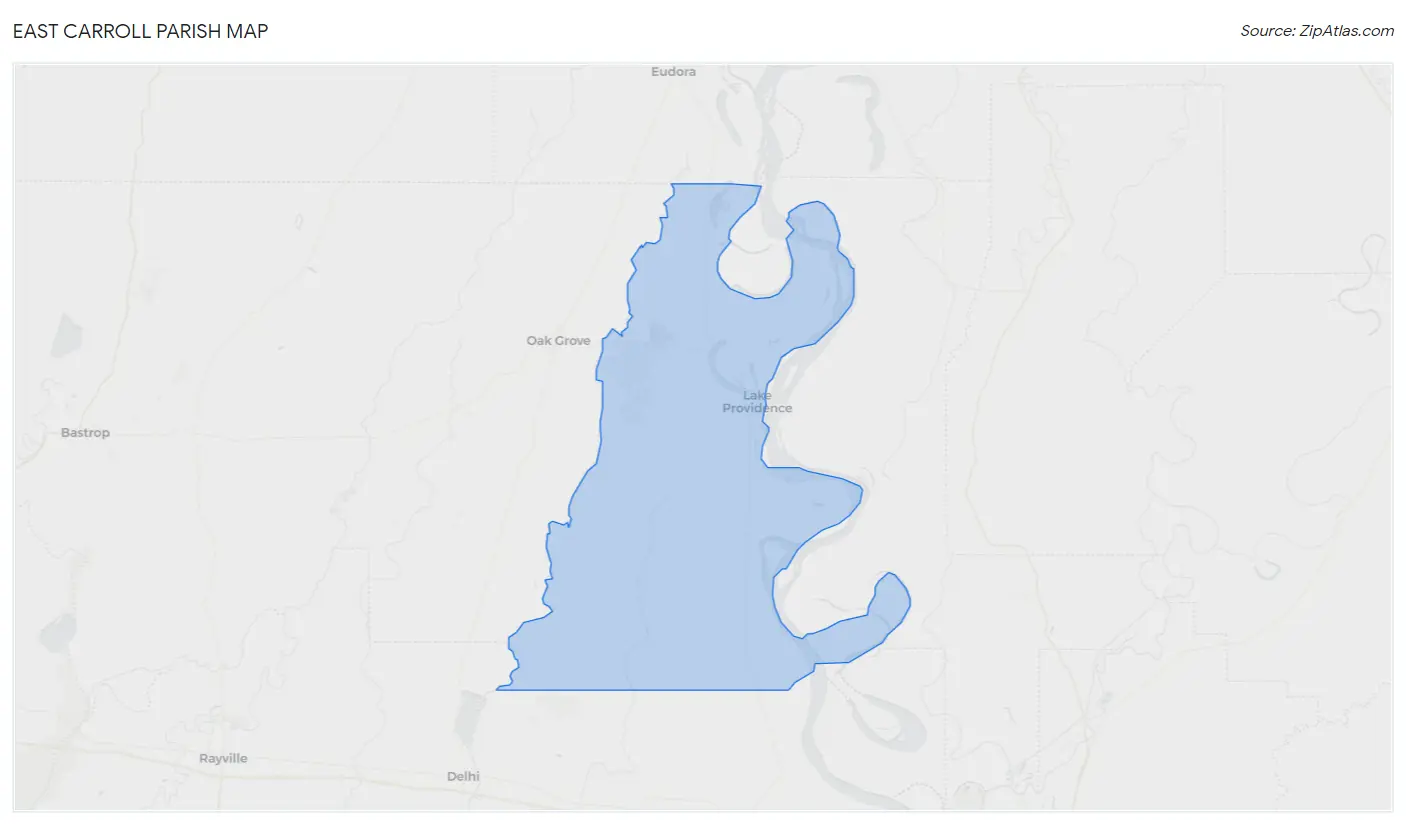
East Carroll Parish Map
East Carroll Parish Overview
7,371
TOTAL POPULATION
4,122
MALE POPULATION
3,249
FEMALE POPULATION
126.87
MALES / 100 FEMALES
78.82
FEMALES / 100 MALES
33.9
MEDIAN AGE
3.0
AVG FAMILY SIZE
2.3
AVG HOUSEHOLD SIZE
$19,646
PER CAPITA INCOME
$36,875
AVG FAMILY INCOME
$30,856
AVG HOUSEHOLD INCOME
17.7%
WAGE / INCOME GAP [ % ]
82.3¢/ $1
WAGE / INCOME GAP [ $ ]
0.61
INEQUALITY / GINI INDEX
1,993
LABOR FORCE [ PEOPLE ]
33.6%
PERCENT IN LABOR FORCE
15.1%
UNEMPLOYMENT RATE
East Carroll Parish Area Codes
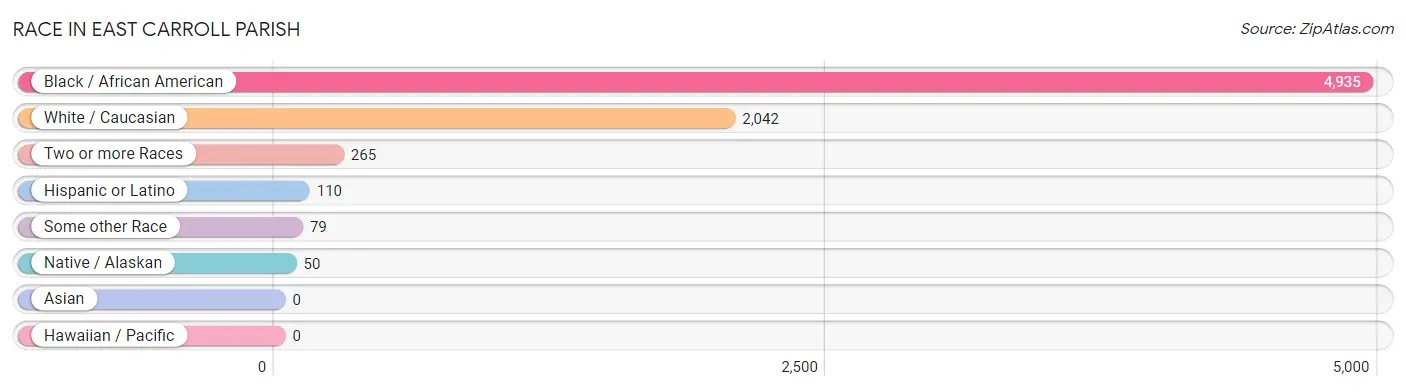
Race in East Carroll Parish
The most populous races in East Carroll Parish are Black / African American (4,935 | 66.9%), White / Caucasian (2,042 | 27.7%), and Two or more Races (265 | 3.6%).
| Race | # Population | % Population |
| Asian | 0 | 0.0% |
| Black / African American | 4,935 | 66.9% |
| Hawaiian / Pacific | 0 | 0.0% |
| Hispanic or Latino | 110 | 1.5% |
| Native / Alaskan | 50 | 0.7% |
| White / Caucasian | 2,042 | 27.7% |
| Two or more Races | 265 | 3.6% |
| Some other Race | 79 | 1.1% |
| Total | 7,371 | 100.0% |
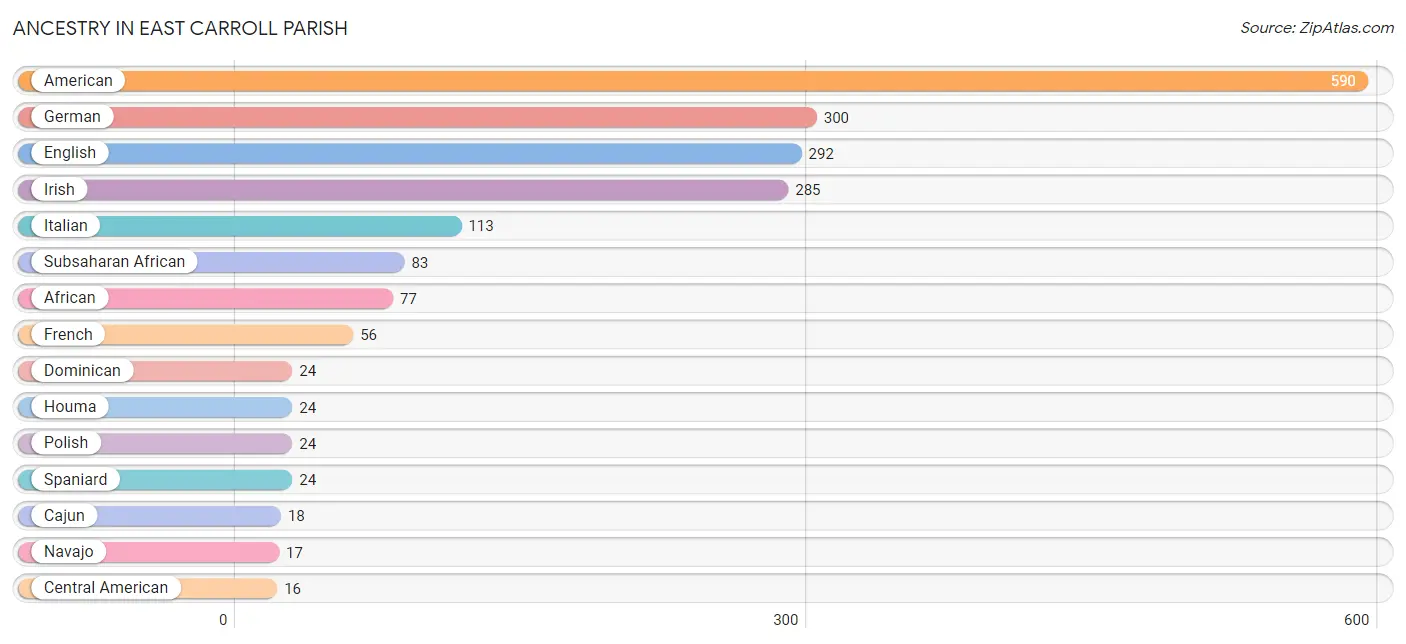
Ancestry in East Carroll Parish
The most populous ancestries reported in East Carroll Parish are American (590 | 8.0%), German (300 | 4.1%), English (292 | 4.0%), Irish (285 | 3.9%), and Italian (113 | 1.5%), together accounting for 21.4% of all East Carroll Parish residents.
| Ancestry | # Population | % Population |
| African | 77 | 1.0% |
| American | 590 | 8.0% |
| Cajun | 18 | 0.2% |
| Canadian | 6 | 0.1% |
| Central American | 16 | 0.2% |
| Choctaw | 9 | 0.1% |
| Colombian | 14 | 0.2% |
| Dominican | 24 | 0.3% |
| Dutch | 16 | 0.2% |
| Eastern European | 7 | 0.1% |
| English | 292 | 4.0% |
| European | 8 | 0.1% |
| French | 56 | 0.8% |
| French Canadian | 12 | 0.2% |
| German | 300 | 4.1% |
| Honduran | 16 | 0.2% |
| Houma | 24 | 0.3% |
| Irish | 285 | 3.9% |
| Italian | 113 | 1.5% |
| Jamaican | 2 | 0.0% |
| Mexican | 7 | 0.1% |
| Navajo | 17 | 0.2% |
| Nigerian | 6 | 0.1% |
| Polish | 24 | 0.3% |
| Scotch-Irish | 2 | 0.0% |
| Scottish | 7 | 0.1% |
| South American | 14 | 0.2% |
| Spaniard | 24 | 0.3% |
| Subsaharan African | 83 | 1.1% |
| Swedish | 1 | 0.0% | View All 30 Rows |
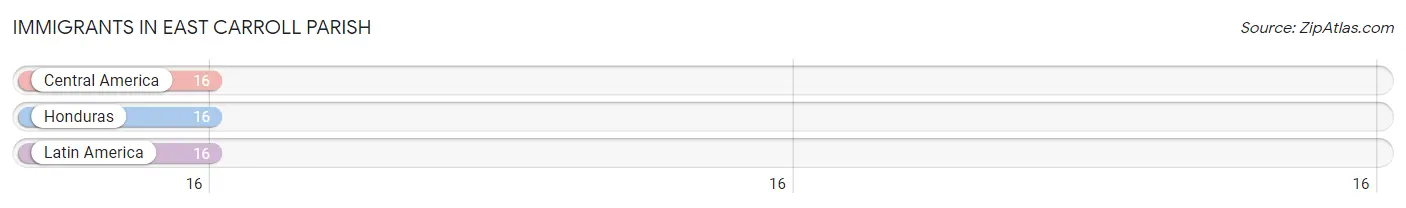
Immigrants in East Carroll Parish
The most numerous immigrant groups reported in East Carroll Parish came from Central America (16 | 0.2%), Honduras (16 | 0.2%), and Latin America (16 | 0.2%), together accounting for 0.7% of all East Carroll Parish residents.
| Immigration Origin | # Population | % Population |
| Central America | 16 | 0.2% |
| Honduras | 16 | 0.2% |
| Latin America | 16 | 0.2% | View All 3 Rows |
Sex and Age in East Carroll Parish
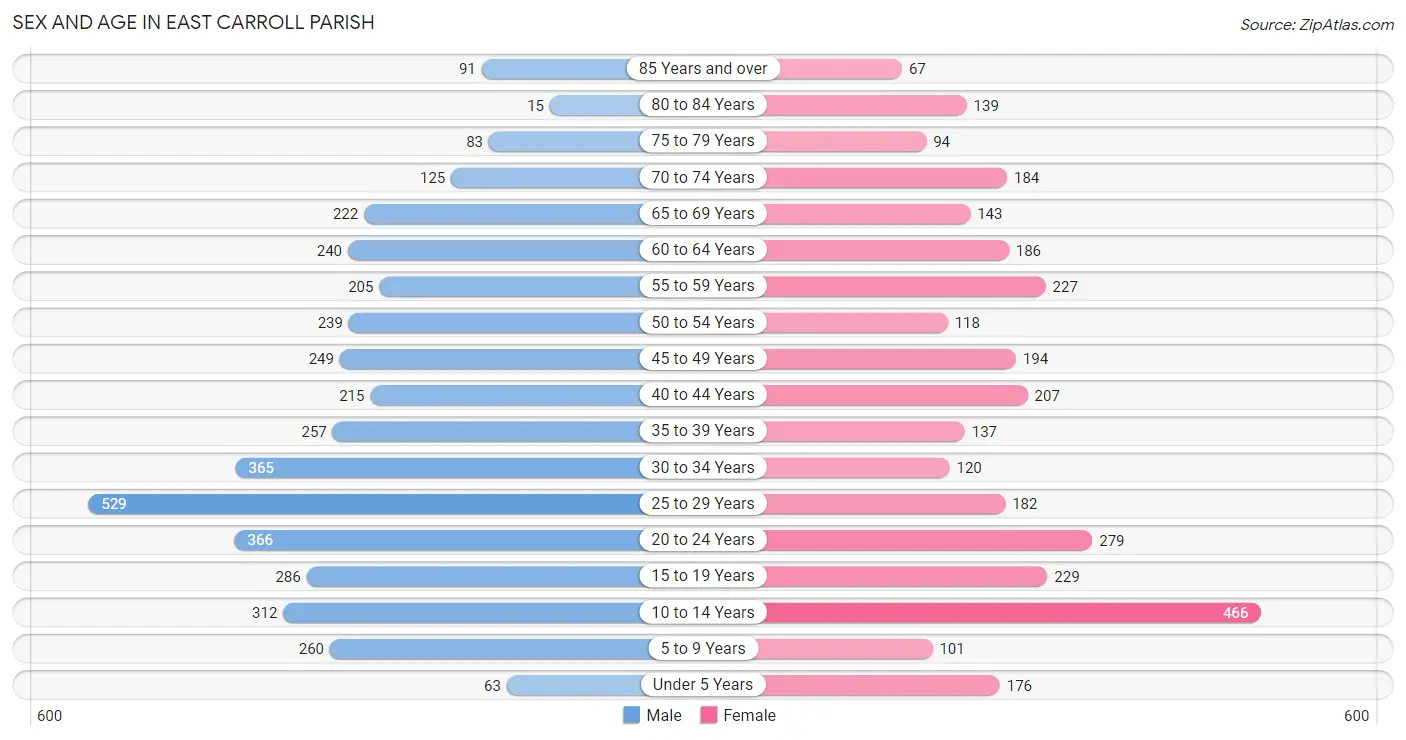
Sex and Age in East Carroll Parish
The most populous age groups in East Carroll Parish are 25 to 29 Years (529 | 12.8%) for men and 10 to 14 Years (466 | 14.3%) for women.
| Age Bracket | Male | Female |
| Under 5 Years | 63 (1.5%) | 176 (5.4%) |
| 5 to 9 Years | 260 (6.3%) | 101 (3.1%) |
| 10 to 14 Years | 312 (7.6%) | 466 (14.3%) |
| 15 to 19 Years | 286 (6.9%) | 229 (7.0%) |
| 20 to 24 Years | 366 (8.9%) | 279 (8.6%) |
| 25 to 29 Years | 529 (12.8%) | 182 (5.6%) |
| 30 to 34 Years | 365 (8.8%) | 120 (3.7%) |
| 35 to 39 Years | 257 (6.2%) | 137 (4.2%) |
| 40 to 44 Years | 215 (5.2%) | 207 (6.4%) |
| 45 to 49 Years | 249 (6.0%) | 194 (6.0%) |
| 50 to 54 Years | 239 (5.8%) | 118 (3.6%) |
| 55 to 59 Years | 205 (5.0%) | 227 (7.0%) |
| 60 to 64 Years | 240 (5.8%) | 186 (5.7%) |
| 65 to 69 Years | 222 (5.4%) | 143 (4.4%) |
| 70 to 74 Years | 125 (3.0%) | 184 (5.7%) |
| 75 to 79 Years | 83 (2.0%) | 94 (2.9%) |
| 80 to 84 Years | 15 (0.4%) | 139 (4.3%) |
| 85 Years and over | 91 (2.2%) | 67 (2.1%) |
| Total | 4,122 (100.0%) | 3,249 (100.0%) |
Families and Households in East Carroll Parish
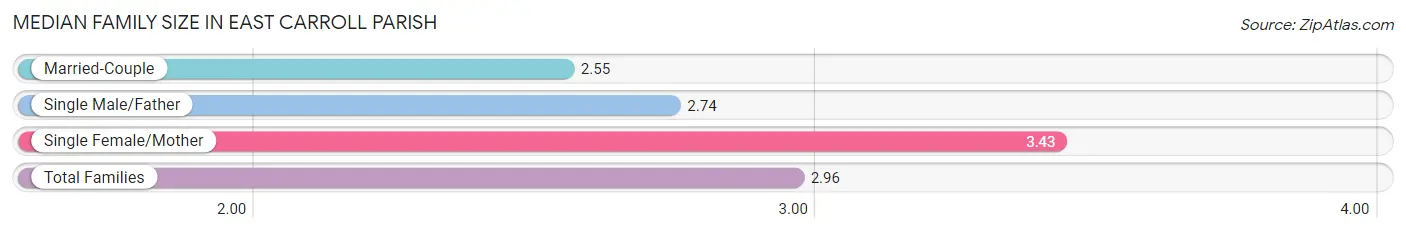
Median Family Size in East Carroll Parish
The median family size in East Carroll Parish is 2.96 persons per family, with single female/mother families (701 | 46.0%) accounting for the largest median family size of 3.43 persons per family. On the other hand, married-couple families (789 | 51.7%) represent the smallest median family size with 2.55 persons per family.
| Family Type | # Families | Family Size |
| Married-Couple | 789 (51.7%) | 2.55 |
| Single Male/Father | 35 (2.3%) | 2.74 |
| Single Female/Mother | 701 (46.0%) | 3.43 |
| Total Families | 1,525 (100.0%) | 2.96 |
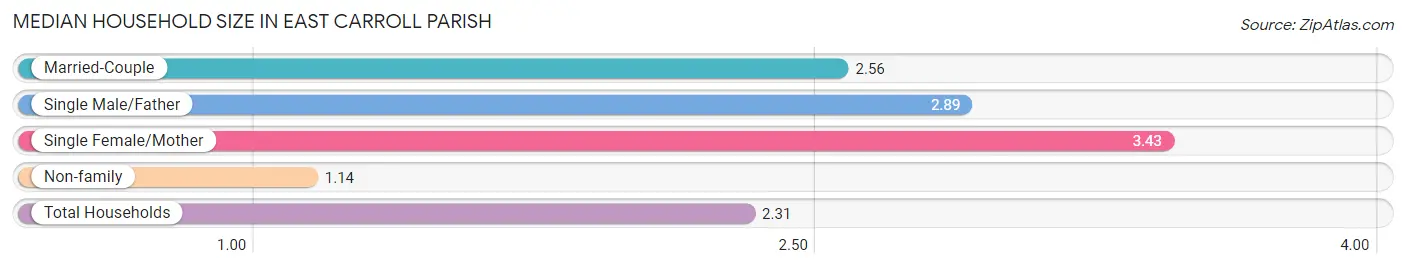
Median Household Size in East Carroll Parish
The median household size in East Carroll Parish is 2.31 persons per household, with single female/mother households (701 | 29.4%) accounting for the largest median household size of 3.43 persons per household. non-family households (856 | 35.9%) represent the smallest median household size with 1.14 persons per household.
| Household Type | # Households | Household Size |
| Married-Couple | 789 (33.1%) | 2.56 |
| Single Male/Father | 35 (1.5%) | 2.89 |
| Single Female/Mother | 701 (29.4%) | 3.43 |
| Non-family | 856 (35.9%) | 1.14 |
| Total Households | 2,381 (100.0%) | 2.31 |
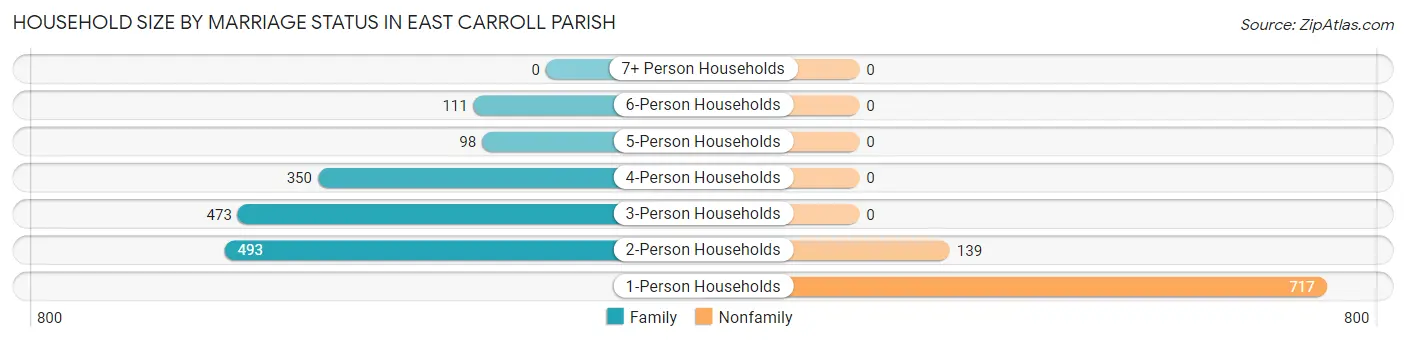
Household Size by Marriage Status in East Carroll Parish
Out of a total of 2,381 households in East Carroll Parish, 1,525 (64.0%) are family households, while 856 (35.9%) are nonfamily households. The most numerous type of family households are 2-person households, comprising 493, and the most common type of nonfamily households are 1-person households, comprising 717.
| Household Size | Family Households | Nonfamily Households |
| 1-Person Households | - | 717 (30.1%) |
| 2-Person Households | 493 (20.7%) | 139 (5.8%) |
| 3-Person Households | 473 (19.9%) | 0 (0.0%) |
| 4-Person Households | 350 (14.7%) | 0 (0.0%) |
| 5-Person Households | 98 (4.1%) | 0 (0.0%) |
| 6-Person Households | 111 (4.7%) | 0 (0.0%) |
| 7+ Person Households | 0 (0.0%) | 0 (0.0%) |
| Total | 1,525 (64.0%) | 856 (35.9%) |
Female Fertility in East Carroll Parish
Fertility by Age in East Carroll Parish
Average fertility rate in East Carroll Parish is 107.0 births per 1,000 women. Women in the age bracket of 20 to 34 years have the highest fertility rate with 248.0 births per 1,000 women. Women in the age bracket of 20 to 34 years acount for 96.6% of all women with births.
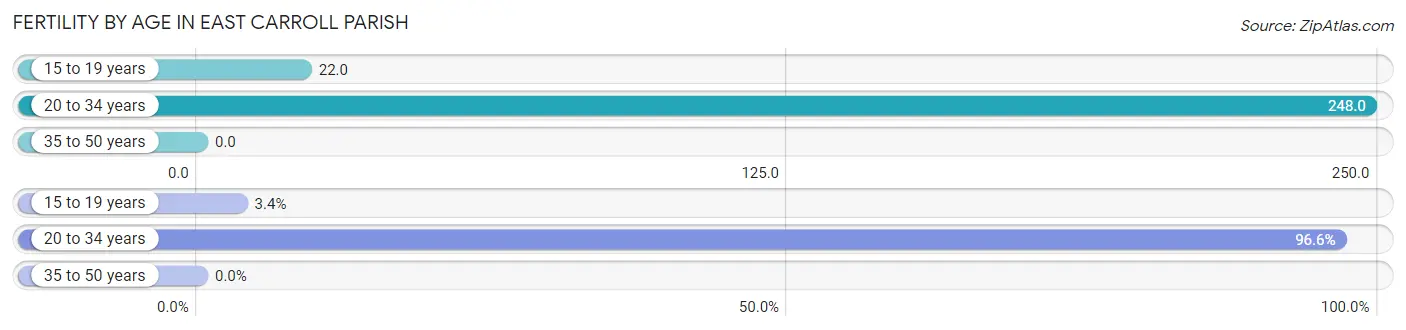
| Age Bracket | Women with Births | Births / 1,000 Women |
| 15 to 19 years | 5 (3.4%) | 22.0 |
| 20 to 34 years | 144 (96.6%) | 248.0 |
| 35 to 50 years | 0 (0.0%) | 0.0 |
| Total | 149 (100.0%) | 107.0 |
Fertility by Age by Marriage Status in East Carroll Parish
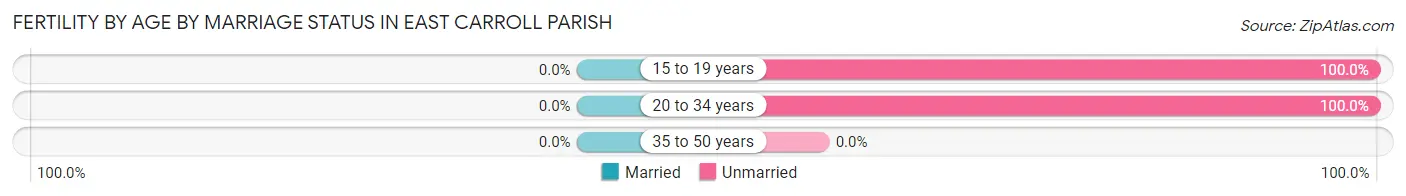
| Age Bracket | Married | Unmarried |
| 15 to 19 years | 0 (0.0%) | 5 (100.0%) |
| 20 to 34 years | 0 (0.0%) | 144 (100.0%) |
| 35 to 50 years | 0 (0.0%) | 0 (0.0%) |
| Total | 0 (0.0%) | 149 (100.0%) |
Fertility by Education in East Carroll Parish
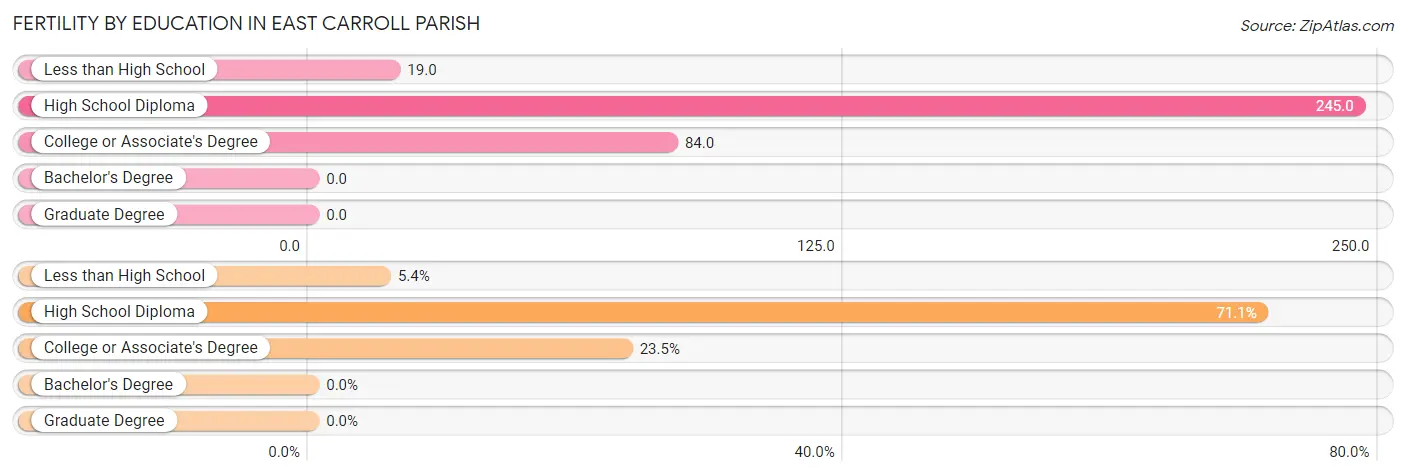
| Educational Attainment | Women with Births | Births / 1,000 Women |
| Less than High School | 8 (5.4%) | 19.0 |
| High School Diploma | 106 (71.1%) | 245.0 |
| College or Associate's Degree | 35 (23.5%) | 84.0 |
| Bachelor's Degree | 0 (0.0%) | 0.0 |
| Graduate Degree | 0 (0.0%) | 0.0 |
| Total | 149 (100.0%) | 107.0 |
Fertility by Education by Marriage Status in East Carroll Parish
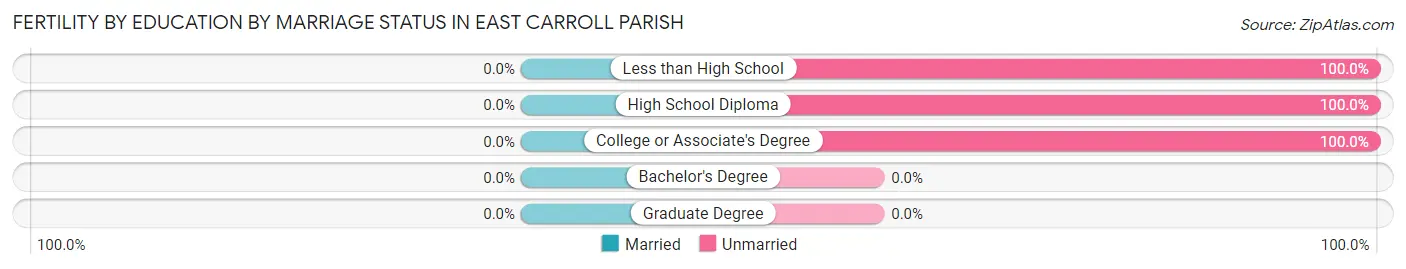
| Educational Attainment | Married | Unmarried |
| Less than High School | 0 (0.0%) | 8 (100.0%) |
| High School Diploma | 0 (0.0%) | 106 (100.0%) |
| College or Associate's Degree | 0 (0.0%) | 35 (100.0%) |
| Bachelor's Degree | 0 (0.0%) | 0 (0.0%) |
| Graduate Degree | 0 (0.0%) | 0 (0.0%) |
| Total | 0 (0.0%) | 149 (100.0%) |
Income in East Carroll Parish
Income Overview in East Carroll Parish
Per Capita Income in East Carroll Parish is $19,646, while median incomes of families and households are $36,875 and $30,856 respectively.
| Characteristic | Number | Measure |
| Per Capita Income | 7,371 | $19,646 |
| Median Family Income | 1,525 | $36,875 |
| Mean Family Income | 1,525 | $69,714 |
| Median Household Income | 2,381 | $30,856 |
| Mean Household Income | 2,381 | $60,044 |
| Income Deficit | 1,525 | $0 |
| Wage / Income Gap (%) | 7,371 | 17.74% |
| Wage / Income Gap ($) | 7,371 | 82.26¢ per $1 |
| Gini / Inequality Index | 7,371 | 0.61 |
Earnings by Sex in East Carroll Parish
Average Earnings in East Carroll Parish are $22,567, $25,407 for men and $20,901 for women, a difference of 17.7%.
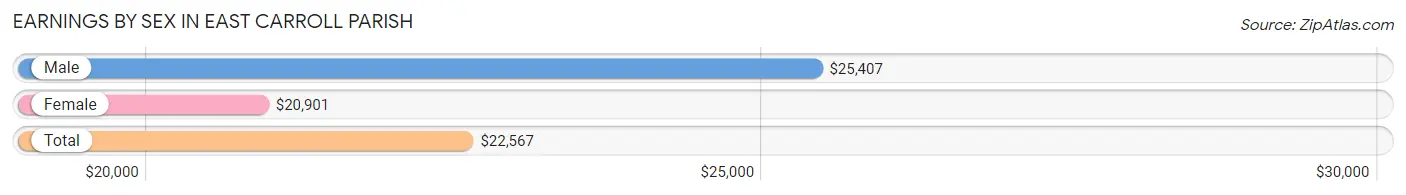
| Sex | Number | Average Earnings |
| Male | 1,239 (52.2%) | $25,407 |
| Female | 1,133 (47.8%) | $20,901 |
| Total | 2,372 (100.0%) | $22,567 |
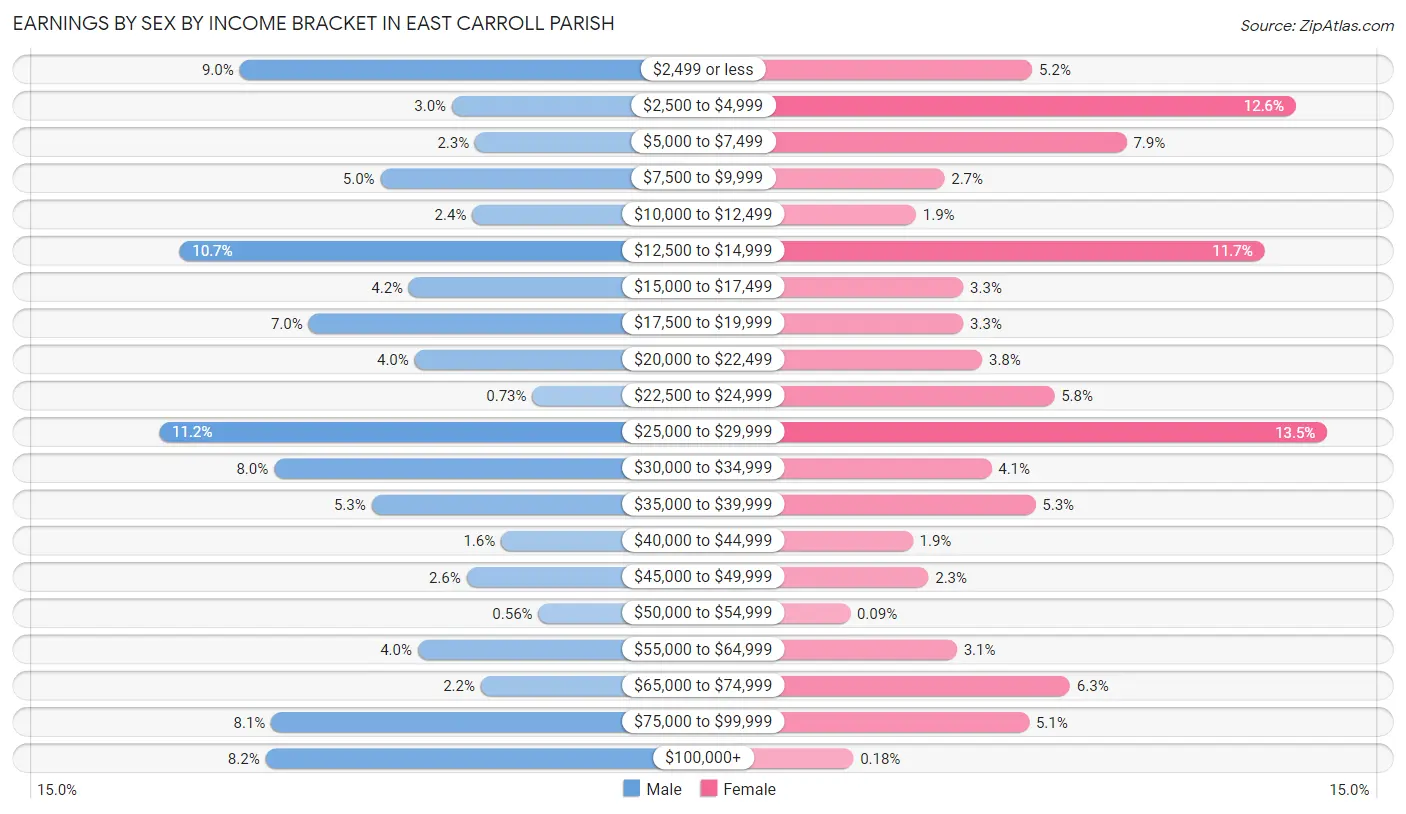
Earnings by Sex by Income Bracket in East Carroll Parish
The most common earnings brackets in East Carroll Parish are $25,000 to $29,999 for men (139 | 11.2%) and $25,000 to $29,999 for women (153 | 13.5%).
| Income | Male | Female |
| $2,499 or less | 111 (9.0%) | 59 (5.2%) |
| $2,500 to $4,999 | 37 (3.0%) | 143 (12.6%) |
| $5,000 to $7,499 | 29 (2.3%) | 89 (7.9%) |
| $7,500 to $9,999 | 62 (5.0%) | 31 (2.7%) |
| $10,000 to $12,499 | 30 (2.4%) | 22 (1.9%) |
| $12,500 to $14,999 | 132 (10.6%) | 133 (11.7%) |
| $15,000 to $17,499 | 52 (4.2%) | 37 (3.3%) |
| $17,500 to $19,999 | 87 (7.0%) | 37 (3.3%) |
| $20,000 to $22,499 | 50 (4.0%) | 43 (3.8%) |
| $22,500 to $24,999 | 9 (0.7%) | 66 (5.8%) |
| $25,000 to $29,999 | 139 (11.2%) | 153 (13.5%) |
| $30,000 to $34,999 | 99 (8.0%) | 46 (4.1%) |
| $35,000 to $39,999 | 65 (5.2%) | 60 (5.3%) |
| $40,000 to $44,999 | 20 (1.6%) | 21 (1.8%) |
| $45,000 to $49,999 | 32 (2.6%) | 26 (2.3%) |
| $50,000 to $54,999 | 7 (0.6%) | 1 (0.1%) |
| $55,000 to $64,999 | 49 (4.0%) | 35 (3.1%) |
| $65,000 to $74,999 | 27 (2.2%) | 71 (6.3%) |
| $75,000 to $99,999 | 100 (8.1%) | 58 (5.1%) |
| $100,000+ | 102 (8.2%) | 2 (0.2%) |
| Total | 1,239 (100.0%) | 1,133 (100.0%) |
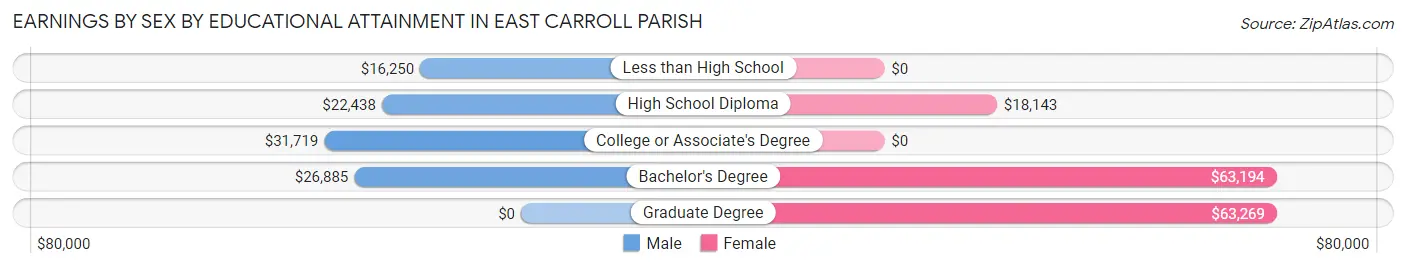
Earnings by Sex by Educational Attainment in East Carroll Parish
Average earnings in East Carroll Parish are $26,696 for men and $21,366 for women, a difference of 20.0%. Men with an educational attainment of college or associate's degree enjoy the highest average annual earnings of $31,719, while those with less than high school education earn the least with $16,250. Women with an educational attainment of graduate degree earn the most with the average annual earnings of $63,269, while those with high school diploma education have the smallest earnings of $18,143.
| Educational Attainment | Male Income | Female Income |
| Less than High School | $16,250 | $0 |
| High School Diploma | $22,438 | $18,143 |
| College or Associate's Degree | $31,719 | $0 |
| Bachelor's Degree | $26,885 | $63,194 |
| Graduate Degree | - | - |
| Total | $26,696 | $21,366 |
Family Income in East Carroll Parish
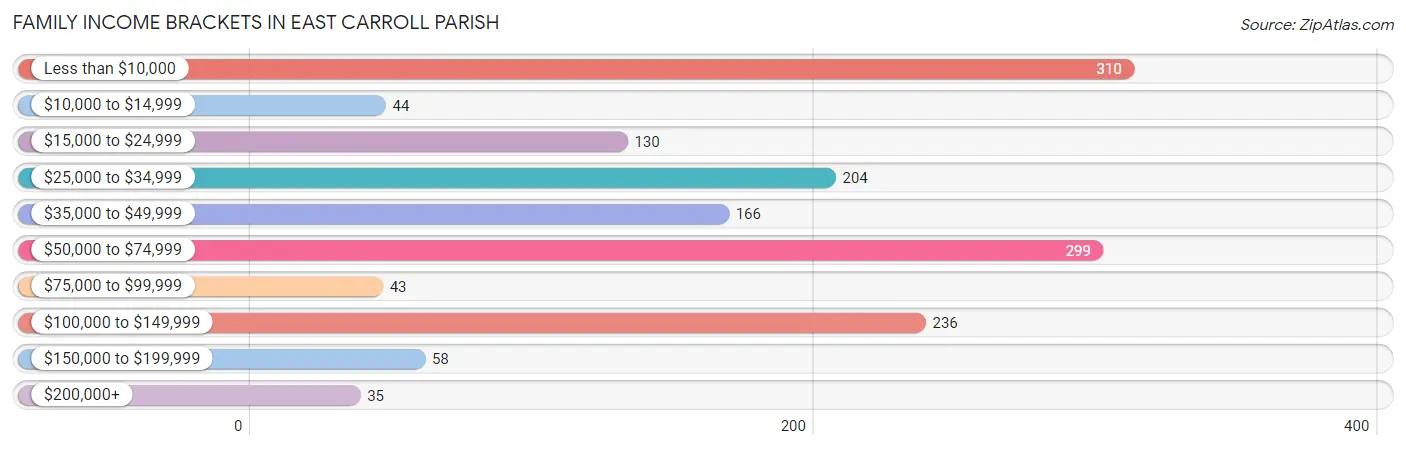
Family Income Brackets in East Carroll Parish
According to the East Carroll Parish family income data, there are 310 families falling into the less than $10,000 income range, which is the most common income bracket and makes up 20.3% of all families. Conversely, the $200,000+ income bracket is the least frequent group with only 35 families (2.3%) belonging to this category.
| Income Bracket | # Families | % Families |
| Less than $10,000 | 310 | 20.3% |
| $10,000 to $14,999 | 44 | 2.9% |
| $15,000 to $24,999 | 130 | 8.5% |
| $25,000 to $34,999 | 204 | 13.4% |
| $35,000 to $49,999 | 166 | 10.9% |
| $50,000 to $74,999 | 299 | 19.6% |
| $75,000 to $99,999 | 43 | 2.8% |
| $100,000 to $149,999 | 236 | 15.5% |
| $150,000 to $199,999 | 58 | 3.8% |
| $200,000+ | 35 | 2.3% |
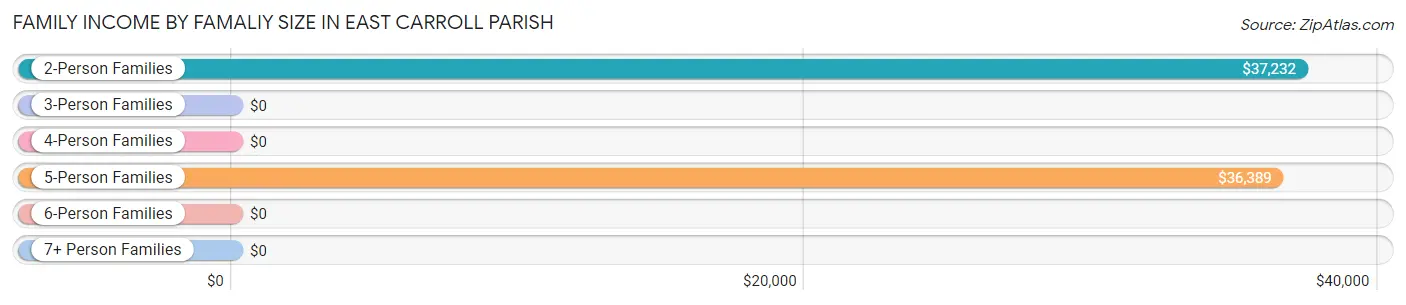
Family Income by Famaliy Size in East Carroll Parish
2-person families (513 | 33.6%) account for the highest median family income in East Carroll Parish with $37,232 per family, while 2-person families (513 | 33.6%) have the highest median income of $18,616 per family member.
| Income Bracket | # Families | Median Income |
| 2-Person Families | 513 (33.6%) | $37,232 |
| 3-Person Families | 453 (29.7%) | $0 |
| 4-Person Families | 350 (23.0%) | $0 |
| 5-Person Families | 98 (6.4%) | $36,389 |
| 6-Person Families | 111 (7.3%) | $0 |
| 7+ Person Families | 0 (0.0%) | $0 |
| Total | 1,525 (100.0%) | $36,875 |
Family Income by Number of Earners in East Carroll Parish
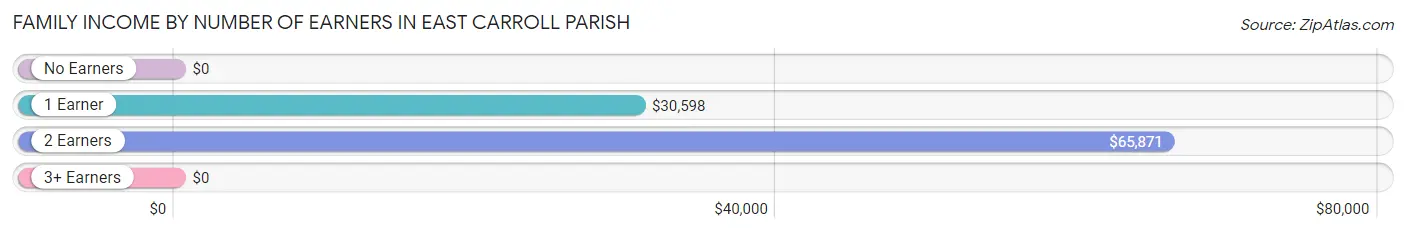
| Number of Earners | # Families | Median Income |
| No Earners | 427 (28.0%) | $0 |
| 1 Earner | 504 (33.1%) | $30,598 |
| 2 Earners | 577 (37.8%) | $65,871 |
| 3+ Earners | 17 (1.1%) | $0 |
| Total | 1,525 (100.0%) | $36,875 |
Household Income in East Carroll Parish
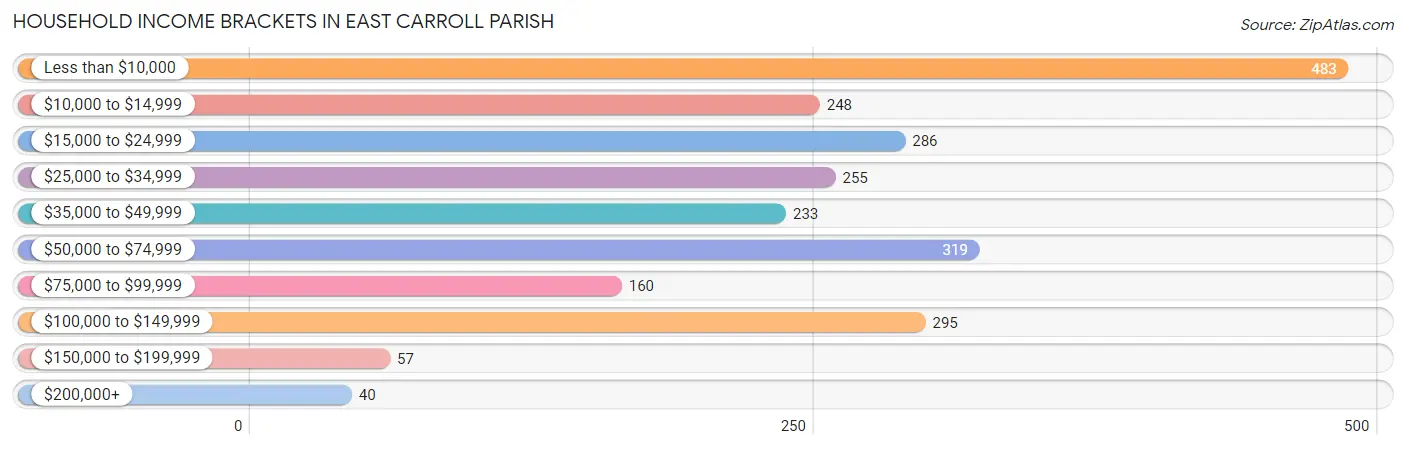
Household Income Brackets in East Carroll Parish
With 483 households falling in the category, the less than $10,000 income range is the most frequent in East Carroll Parish, accounting for 20.3% of all households. In contrast, only 40 households (1.7%) fall into the $200,000+ income bracket, making it the least populous group.
| Income Bracket | # Households | % Households |
| Less than $10,000 | 483 | 20.3% |
| $10,000 to $14,999 | 248 | 10.4% |
| $15,000 to $24,999 | 286 | 12.0% |
| $25,000 to $34,999 | 255 | 10.7% |
| $35,000 to $49,999 | 233 | 9.8% |
| $50,000 to $74,999 | 319 | 13.4% |
| $75,000 to $99,999 | 160 | 6.7% |
| $100,000 to $149,999 | 295 | 12.4% |
| $150,000 to $199,999 | 57 | 2.4% |
| $200,000+ | 40 | 1.7% |
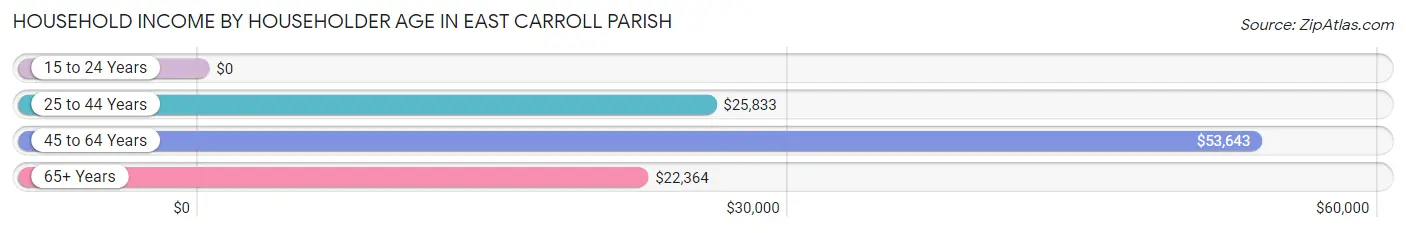
Household Income by Householder Age in East Carroll Parish
The median household income in East Carroll Parish is $30,856, with the highest median household income of $53,643 found in the 45 to 64 years age bracket for the primary householder. A total of 948 households (39.8%) fall into this category. Meanwhile, the 15 to 24 years age bracket for the primary householder has the lowest median household income of $0, with 205 households (8.6%) in this group.
| Income Bracket | # Households | Median Income |
| 15 to 24 Years | 205 (8.6%) | $0 |
| 25 to 44 Years | 486 (20.4%) | $25,833 |
| 45 to 64 Years | 948 (39.8%) | $53,643 |
| 65+ Years | 742 (31.2%) | $22,364 |
| Total | 2,381 (100.0%) | $30,856 |
Poverty in East Carroll Parish
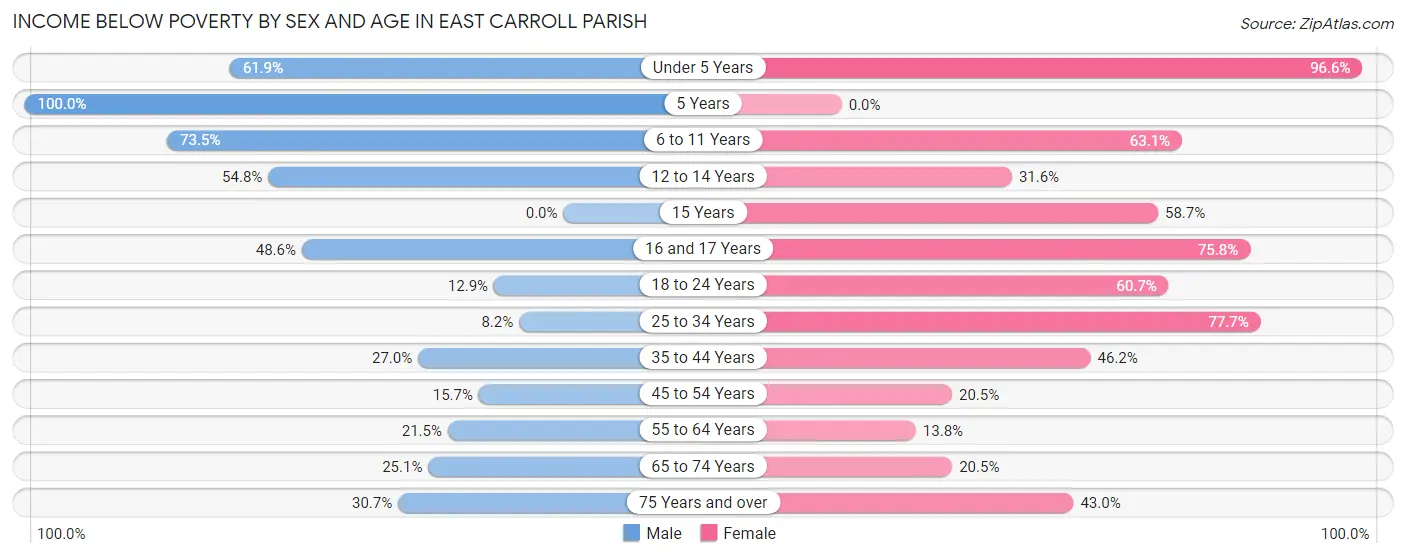
Income Below Poverty by Sex and Age in East Carroll Parish
With 34.2% poverty level for males and 45.2% for females among the residents of East Carroll Parish, 5 year old males and under 5 year old females are the most vulnerable to poverty, with 33 males (100.0%) and 170 females (96.6%) in their respective age groups living below the poverty level.
| Age Bracket | Male | Female |
| Under 5 Years | 39 (61.9%) | 170 (96.6%) |
| 5 Years | 33 (100.0%) | 0 (0.0%) |
| 6 to 11 Years | 289 (73.5%) | 190 (63.1%) |
| 12 to 14 Years | 80 (54.8%) | 84 (31.6%) |
| 15 Years | 0 (0.0%) | 27 (58.7%) |
| 16 and 17 Years | 67 (48.5%) | 75 (75.8%) |
| 18 to 24 Years | 29 (12.9%) | 202 (60.7%) |
| 25 to 34 Years | 18 (8.2%) | 185 (77.7%) |
| 35 to 44 Years | 24 (27.0%) | 145 (46.2%) |
| 45 to 54 Years | 38 (15.7%) | 53 (20.5%) |
| 55 to 64 Years | 83 (21.4%) | 56 (13.8%) |
| 65 to 74 Years | 77 (25.1%) | 65 (20.5%) |
| 75 Years and over | 58 (30.7%) | 129 (43.0%) |
| Total | 835 (34.2%) | 1,381 (45.2%) |
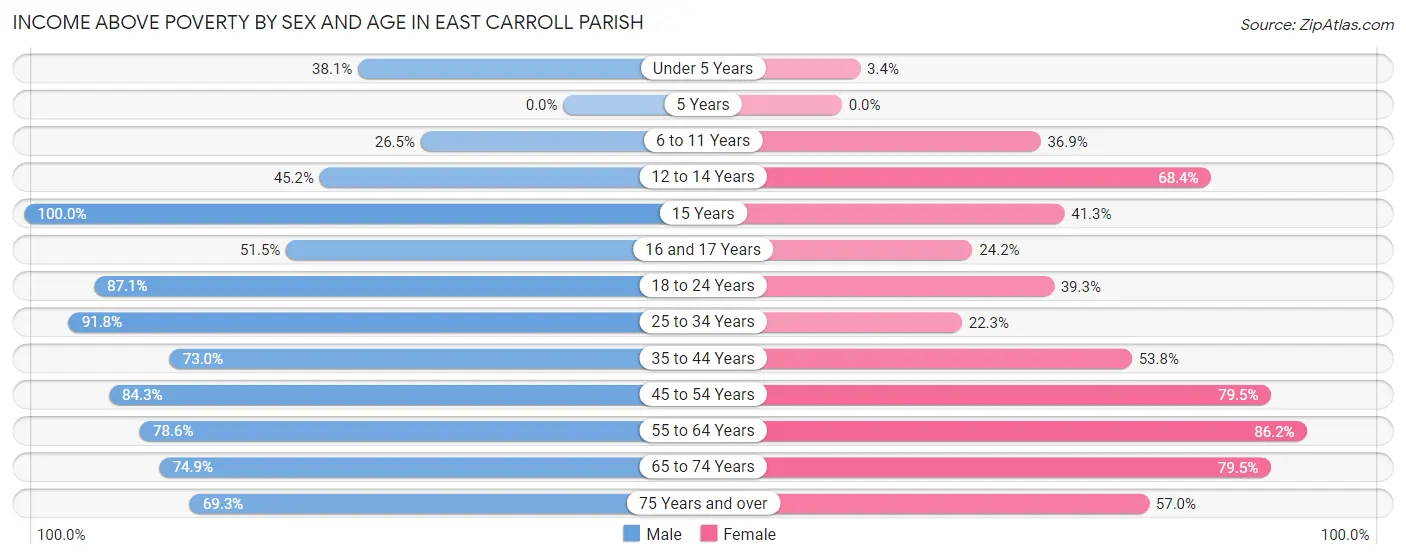
Income Above Poverty by Sex and Age in East Carroll Parish
According to the poverty statistics in East Carroll Parish, males aged 15 years and females aged 55 to 64 years are the age groups that are most secure financially, with 100.0% of males and 86.2% of females in these age groups living above the poverty line.
| Age Bracket | Male | Female |
| Under 5 Years | 24 (38.1%) | 6 (3.4%) |
| 5 Years | 0 (0.0%) | 0 (0.0%) |
| 6 to 11 Years | 104 (26.5%) | 111 (36.9%) |
| 12 to 14 Years | 66 (45.2%) | 182 (68.4%) |
| 15 Years | 14 (100.0%) | 19 (41.3%) |
| 16 and 17 Years | 71 (51.4%) | 24 (24.2%) |
| 18 to 24 Years | 196 (87.1%) | 131 (39.3%) |
| 25 to 34 Years | 201 (91.8%) | 53 (22.3%) |
| 35 to 44 Years | 65 (73.0%) | 169 (53.8%) |
| 45 to 54 Years | 204 (84.3%) | 206 (79.5%) |
| 55 to 64 Years | 304 (78.5%) | 351 (86.2%) |
| 65 to 74 Years | 230 (74.9%) | 252 (79.5%) |
| 75 Years and over | 131 (69.3%) | 171 (57.0%) |
| Total | 1,610 (65.8%) | 1,675 (54.8%) |
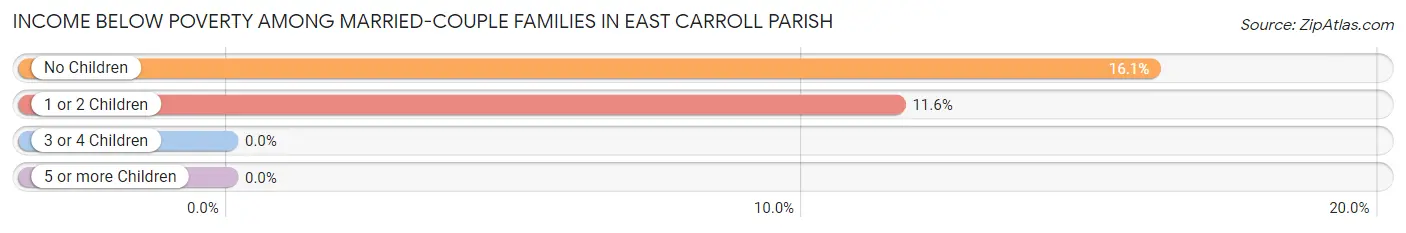
Income Below Poverty Among Married-Couple Families in East Carroll Parish
The poverty statistics for married-couple families in East Carroll Parish show that 13.8% or 109 of the total 789 families live below the poverty line. Families with no children have the highest poverty rate of 16.1%, comprising of 76 families. On the other hand, families with 3 or 4 children have the lowest poverty rate of 0.0%, which includes 0 families.
| Children | Above Poverty | Below Poverty |
| No Children | 397 (83.9%) | 76 (16.1%) |
| 1 or 2 Children | 251 (88.4%) | 33 (11.6%) |
| 3 or 4 Children | 32 (100.0%) | 0 (0.0%) |
| 5 or more Children | 0 (0.0%) | 0 (0.0%) |
| Total | 680 (86.2%) | 109 (13.8%) |
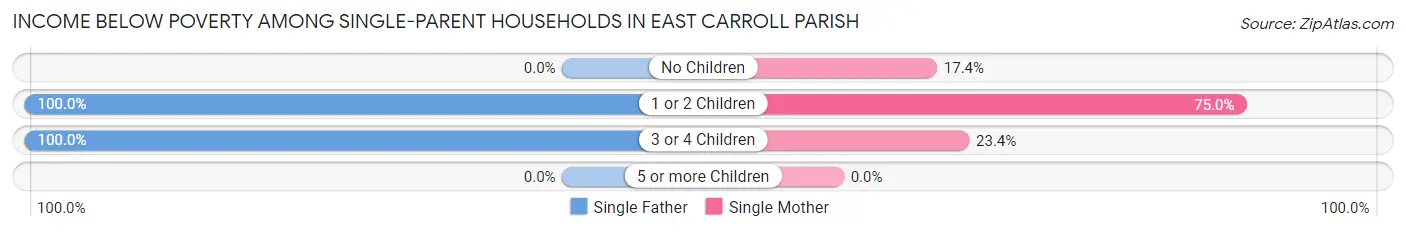
Income Below Poverty Among Single-Parent Households in East Carroll Parish
According to the poverty data in East Carroll Parish, 45.7% or 16 single-father households and 53.1% or 372 single-mother households are living below the poverty line. Among single-father households, those with 1 or 2 children have the highest poverty rate, with 10 households (100.0%) experiencing poverty. Likewise, among single-mother households, those with 1 or 2 children have the highest poverty rate, with 315 households (75.0%) falling below the poverty line.
| Children | Single Father | Single Mother |
| No Children | 0 (0.0%) | 25 (17.4%) |
| 1 or 2 Children | 10 (100.0%) | 315 (75.0%) |
| 3 or 4 Children | 6 (100.0%) | 32 (23.4%) |
| 5 or more Children | 0 (0.0%) | 0 (0.0%) |
| Total | 16 (45.7%) | 372 (53.1%) |
Income Below Poverty Among Married-Couple vs Single-Parent Households in East Carroll Parish
The poverty data for East Carroll Parish shows that 109 of the married-couple family households (13.8%) and 388 of the single-parent households (52.7%) are living below the poverty level. Within the married-couple family households, those with no children have the highest poverty rate, with 76 households (16.1%) falling below the poverty line. Among the single-parent households, those with 1 or 2 children have the highest poverty rate, with 325 household (75.6%) living below poverty.
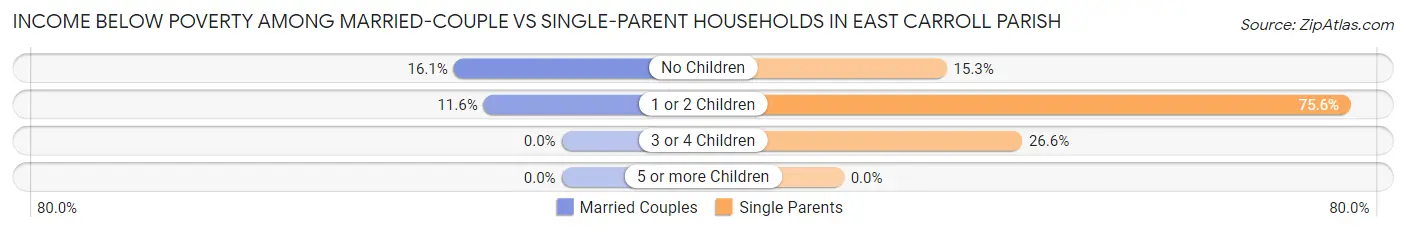
| Children | Married-Couple Families | Single-Parent Households |
| No Children | 76 (16.1%) | 25 (15.3%) |
| 1 or 2 Children | 33 (11.6%) | 325 (75.6%) |
| 3 or 4 Children | 0 (0.0%) | 38 (26.6%) |
| 5 or more Children | 0 (0.0%) | 0 (0.0%) |
| Total | 109 (13.8%) | 388 (52.7%) |
Employment Characteristics in East Carroll Parish
Employment by Class of Employer in East Carroll Parish
Among the 1,623 employed individuals in East Carroll Parish, private company employees (889 | 54.8%), state government employees (191 | 11.8%), and federal government employees (165 | 10.2%) make up the most common classes of employment.
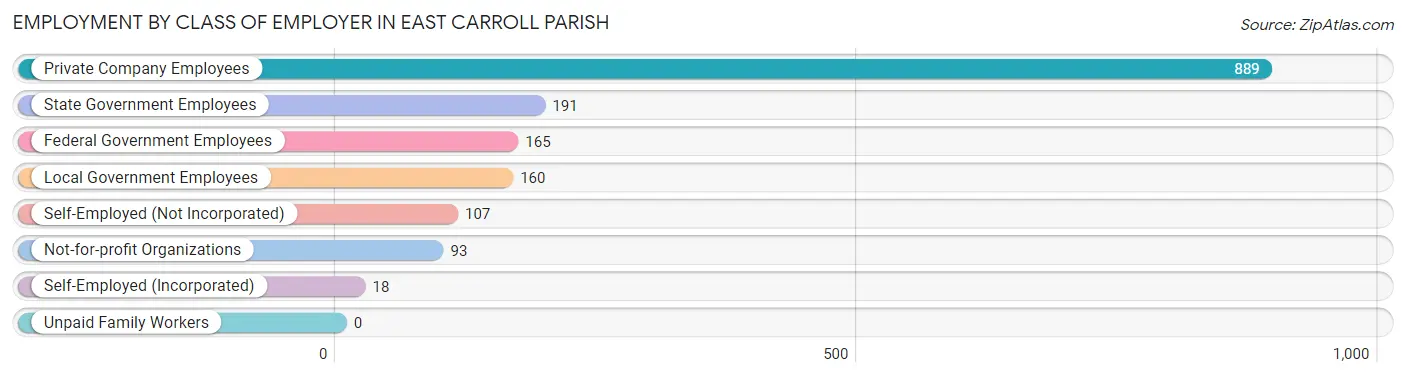
| Employer Class | # Employees | % Employees |
| Private Company Employees | 889 | 54.8% |
| Self-Employed (Incorporated) | 18 | 1.1% |
| Self-Employed (Not Incorporated) | 107 | 6.6% |
| Not-for-profit Organizations | 93 | 5.7% |
| Local Government Employees | 160 | 9.9% |
| State Government Employees | 191 | 11.8% |
| Federal Government Employees | 165 | 10.2% |
| Unpaid Family Workers | 0 | 0.0% |
| Total | 1,623 | 100.0% |
Employment Status by Age in East Carroll Parish
According to the labor force statistics for East Carroll Parish, out of the total population over 16 years of age (5,933), 33.6% or 1,993 individuals are in the labor force, with 15.1% or 301 of them unemployed. The age group with the highest labor force participation rate is 60 to 64 years, with 66.7% or 284 individuals in the labor force. Within the labor force, the 16 to 19 years age range has the highest percentage of unemployed individuals, with 63.0% or 58 of them being unemployed.
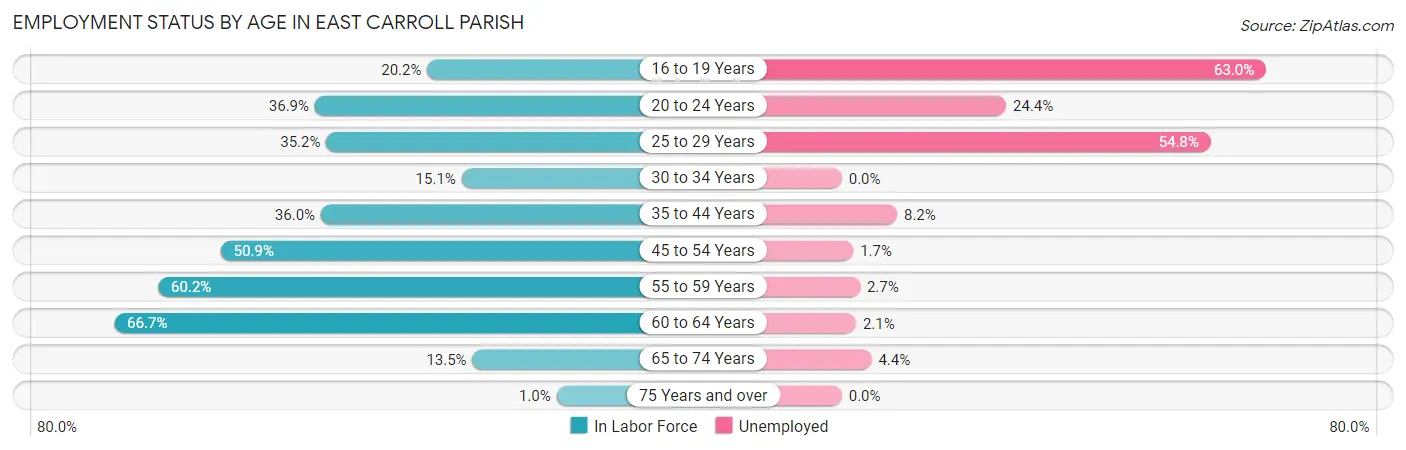
| Age Bracket | In Labor Force | Unemployed |
| 16 to 19 Years | 92 (20.2%) | 58 (63.0%) |
| 20 to 24 Years | 238 (36.9%) | 58 (24.4%) |
| 25 to 29 Years | 250 (35.2%) | 137 (54.8%) |
| 30 to 34 Years | 73 (15.1%) | 0 (0.0%) |
| 35 to 44 Years | 294 (36.0%) | 24 (8.2%) |
| 45 to 54 Years | 407 (50.9%) | 7 (1.7%) |
| 55 to 59 Years | 260 (60.2%) | 7 (2.7%) |
| 60 to 64 Years | 284 (66.7%) | 6 (2.1%) |
| 65 to 74 Years | 91 (13.5%) | 4 (4.4%) |
| 75 Years and over | 5 (1.0%) | 0 (0.0%) |
| Total | 1,993 (33.6%) | 301 (15.1%) |
Employment Status by Educational Attainment in East Carroll Parish
According to labor force statistics for East Carroll Parish, 42.7% of individuals (1,567) out of the total population between 25 and 64 years of age (3,670) are in the labor force, with 11.5% or 180 of them being unemployed. The group with the highest labor force participation rate are those with the educational attainment of bachelor's degree or higher, with 74.9% or 307 individuals in the labor force. Within the labor force, individuals with less than high school education have the highest percentage of unemployment, with 19.0% or 34 of them being unemployed.
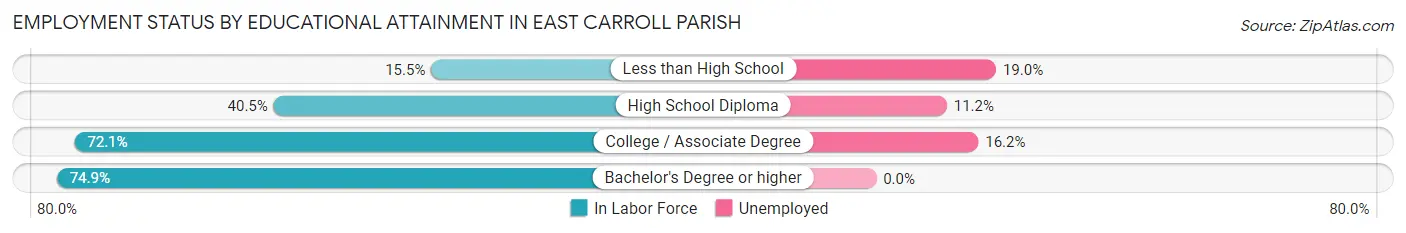
| Educational Attainment | In Labor Force | Unemployed |
| Less than High School | 179 (15.5%) | 220 (19.0%) |
| High School Diploma | 556 (40.5%) | 154 (11.2%) |
| College / Associate Degree | 526 (72.1%) | 118 (16.2%) |
| Bachelor's Degree or higher | 307 (74.9%) | 0 (0.0%) |
| Total | 1,567 (42.7%) | 422 (11.5%) |
Employment Occupations by Sex in East Carroll Parish
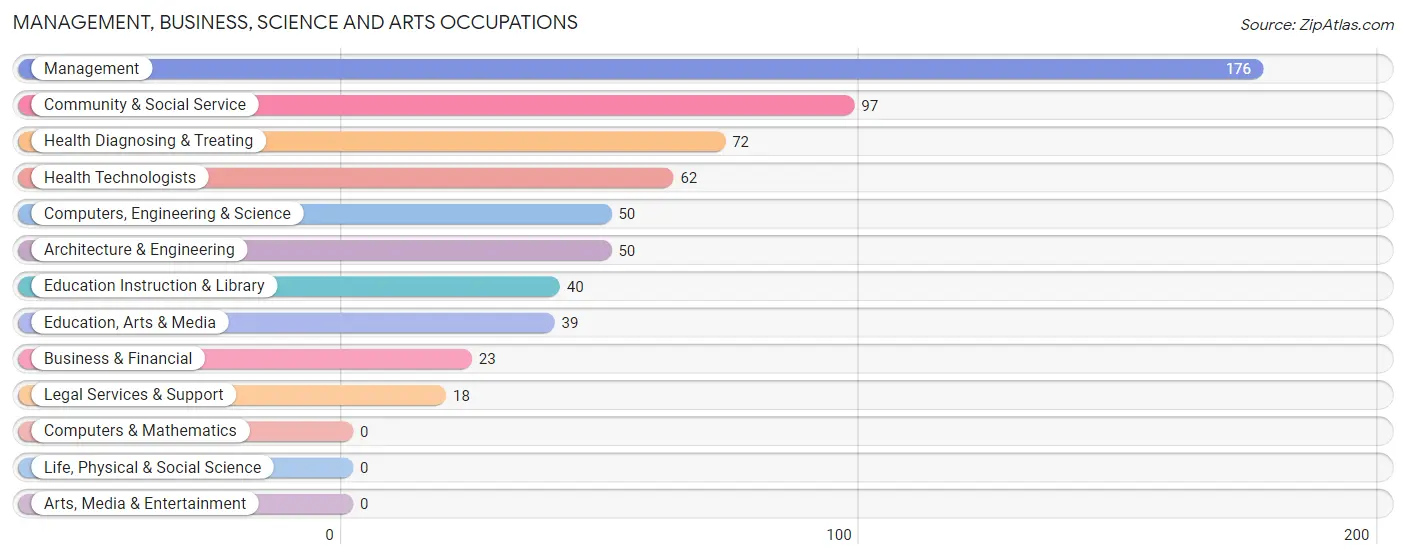
Management, Business, Science and Arts Occupations
The most common Management, Business, Science and Arts occupations in East Carroll Parish are Management (176 | 10.4%), Community & Social Service (97 | 5.7%), Health Diagnosing & Treating (72 | 4.3%), Health Technologists (62 | 3.7%), and Computers, Engineering & Science (50 | 2.9%).
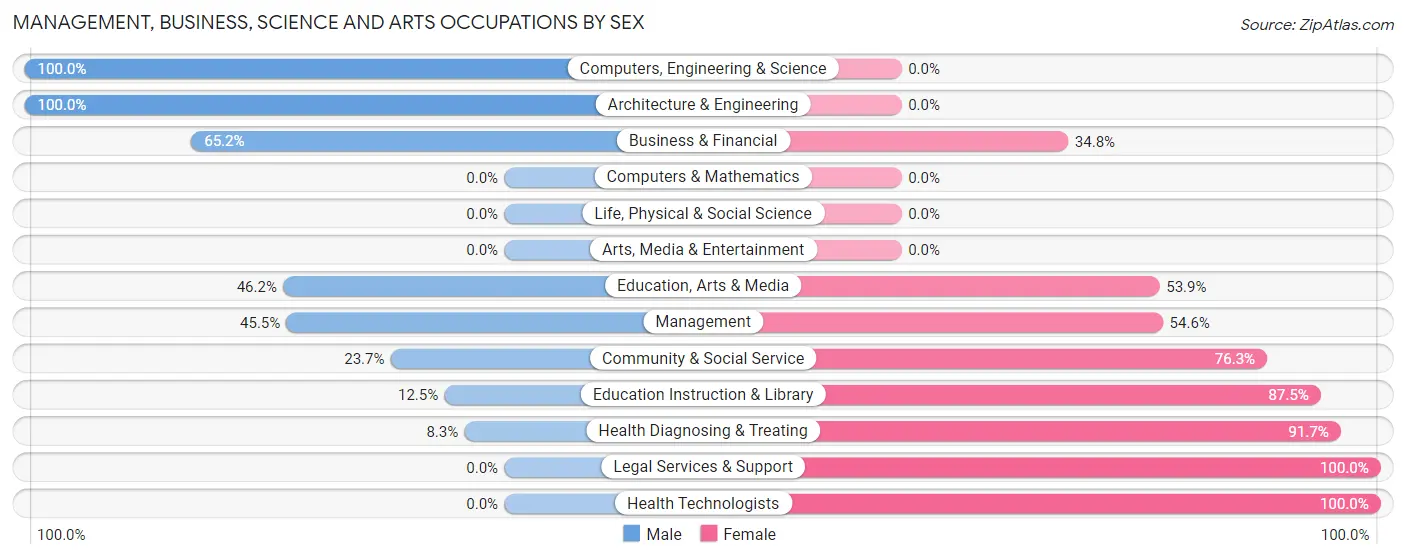
Management, Business, Science and Arts Occupations by Sex
Within the Management, Business, Science and Arts occupations in East Carroll Parish, the most male-oriented occupations are Computers, Engineering & Science (100.0%), Architecture & Engineering (100.0%), and Business & Financial (65.2%), while the most female-oriented occupations are Legal Services & Support (100.0%), Health Technologists (100.0%), and Health Diagnosing & Treating (91.7%).
| Occupation | Male | Female |
| Management | 80 (45.5%) | 96 (54.5%) |
| Business & Financial | 15 (65.2%) | 8 (34.8%) |
| Computers, Engineering & Science | 50 (100.0%) | 0 (0.0%) |
| Computers & Mathematics | 0 (0.0%) | 0 (0.0%) |
| Architecture & Engineering | 50 (100.0%) | 0 (0.0%) |
| Life, Physical & Social Science | 0 (0.0%) | 0 (0.0%) |
| Community & Social Service | 23 (23.7%) | 74 (76.3%) |
| Education, Arts & Media | 18 (46.2%) | 21 (53.8%) |
| Legal Services & Support | 0 (0.0%) | 18 (100.0%) |
| Education Instruction & Library | 5 (12.5%) | 35 (87.5%) |
| Arts, Media & Entertainment | 0 (0.0%) | 0 (0.0%) |
| Health Diagnosing & Treating | 6 (8.3%) | 66 (91.7%) |
| Health Technologists | 0 (0.0%) | 62 (100.0%) |
| Total (Category) | 174 (41.6%) | 244 (58.4%) |
| Total (Overall) | 775 (45.8%) | 918 (54.2%) |
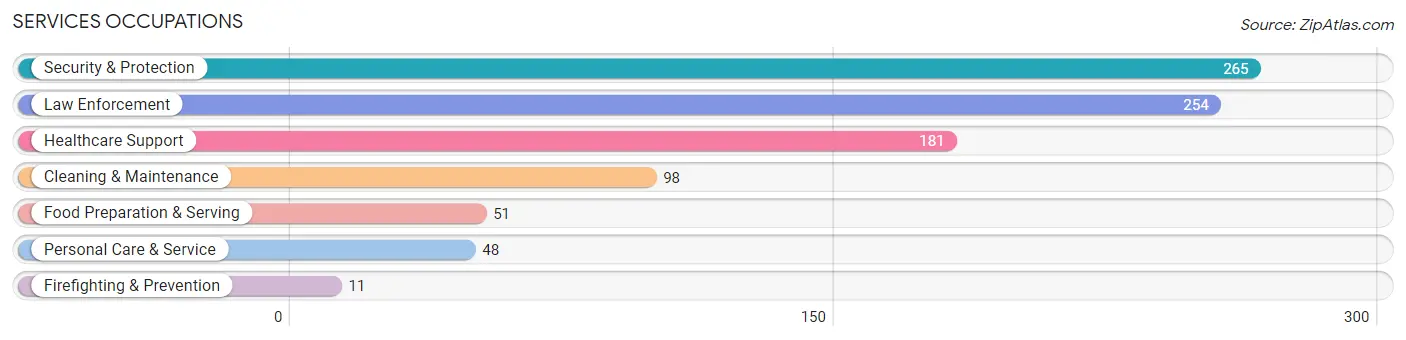
Services Occupations
The most common Services occupations in East Carroll Parish are Security & Protection (265 | 15.7%), Law Enforcement (254 | 15.0%), Healthcare Support (181 | 10.7%), Cleaning & Maintenance (98 | 5.8%), and Food Preparation & Serving (51 | 3.0%).
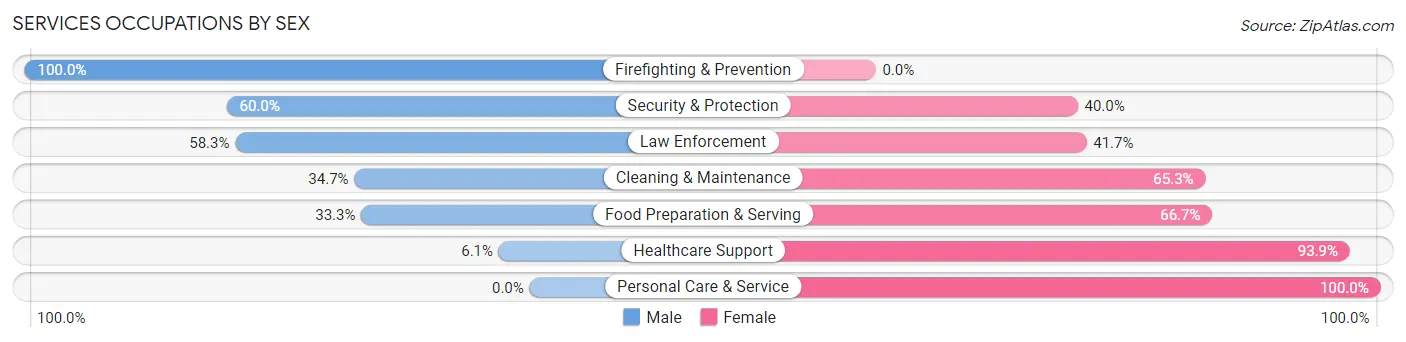
Services Occupations by Sex
Within the Services occupations in East Carroll Parish, the most male-oriented occupations are Firefighting & Prevention (100.0%), Security & Protection (60.0%), and Law Enforcement (58.3%), while the most female-oriented occupations are Personal Care & Service (100.0%), Healthcare Support (93.9%), and Food Preparation & Serving (66.7%).
| Occupation | Male | Female |
| Healthcare Support | 11 (6.1%) | 170 (93.9%) |
| Security & Protection | 159 (60.0%) | 106 (40.0%) |
| Firefighting & Prevention | 11 (100.0%) | 0 (0.0%) |
| Law Enforcement | 148 (58.3%) | 106 (41.7%) |
| Food Preparation & Serving | 17 (33.3%) | 34 (66.7%) |
| Cleaning & Maintenance | 34 (34.7%) | 64 (65.3%) |
| Personal Care & Service | 0 (0.0%) | 48 (100.0%) |
| Total (Category) | 221 (34.4%) | 422 (65.6%) |
| Total (Overall) | 775 (45.8%) | 918 (54.2%) |
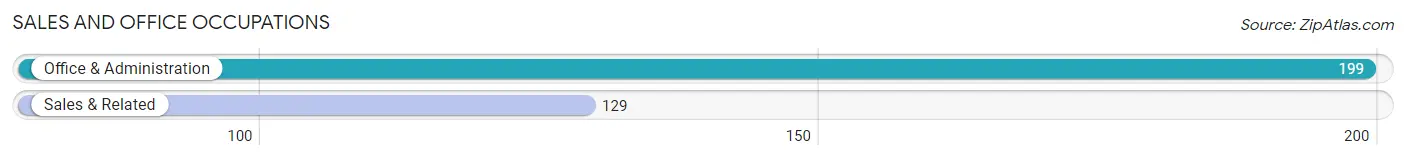
Sales and Office Occupations
The most common Sales and Office occupations in East Carroll Parish are Office & Administration (199 | 11.7%), and Sales & Related (129 | 7.6%).
Sales and Office Occupations by Sex
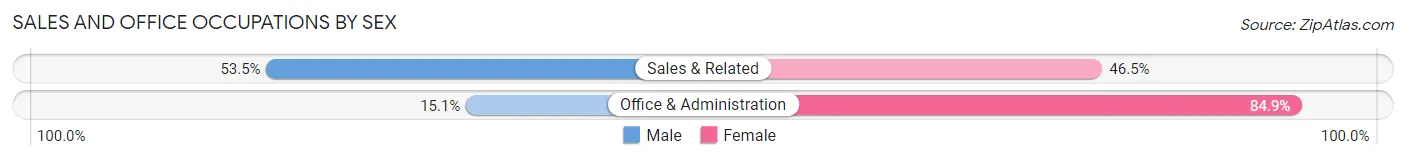
| Occupation | Male | Female |
| Sales & Related | 69 (53.5%) | 60 (46.5%) |
| Office & Administration | 30 (15.1%) | 169 (84.9%) |
| Total (Category) | 99 (30.2%) | 229 (69.8%) |
| Total (Overall) | 775 (45.8%) | 918 (54.2%) |
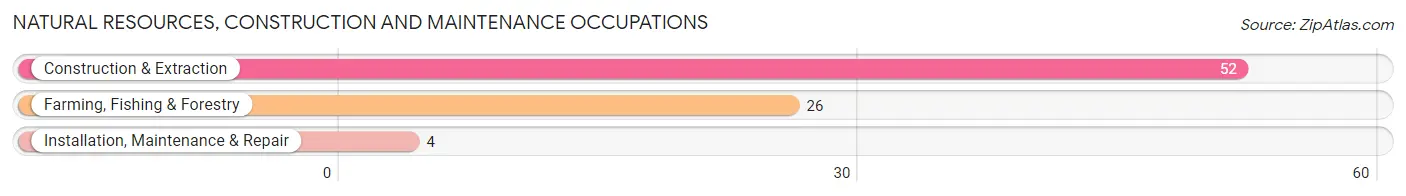
Natural Resources, Construction and Maintenance Occupations
The most common Natural Resources, Construction and Maintenance occupations in East Carroll Parish are Construction & Extraction (52 | 3.1%), Farming, Fishing & Forestry (26 | 1.5%), and Installation, Maintenance & Repair (4 | 0.2%).
Natural Resources, Construction and Maintenance Occupations by Sex
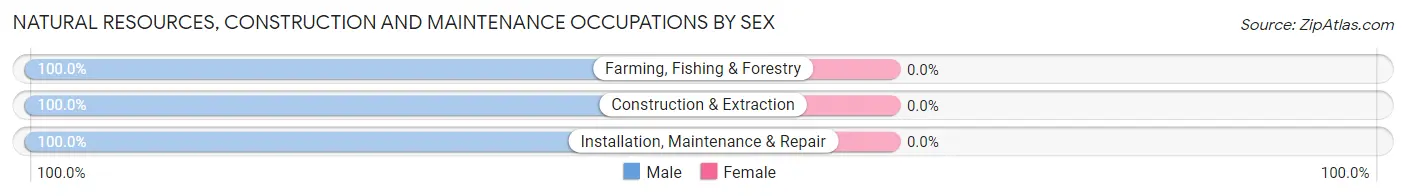
| Occupation | Male | Female |
| Farming, Fishing & Forestry | 26 (100.0%) | 0 (0.0%) |
| Construction & Extraction | 52 (100.0%) | 0 (0.0%) |
| Installation, Maintenance & Repair | 4 (100.0%) | 0 (0.0%) |
| Total (Category) | 82 (100.0%) | 0 (0.0%) |
| Total (Overall) | 775 (45.8%) | 918 (54.2%) |
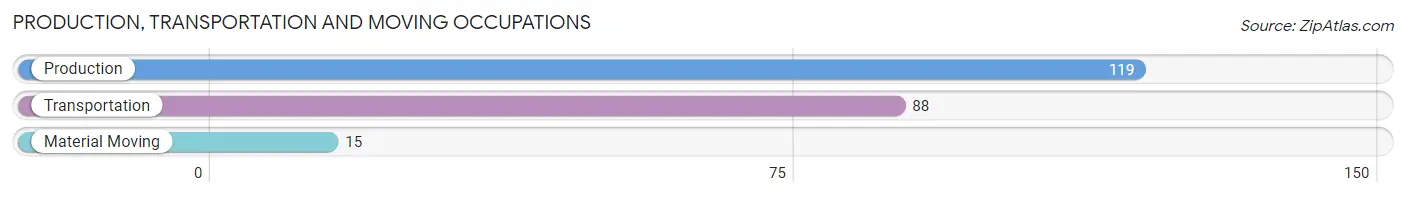
Production, Transportation and Moving Occupations
The most common Production, Transportation and Moving occupations in East Carroll Parish are Production (119 | 7.0%), Transportation (88 | 5.2%), and Material Moving (15 | 0.9%).
Production, Transportation and Moving Occupations by Sex
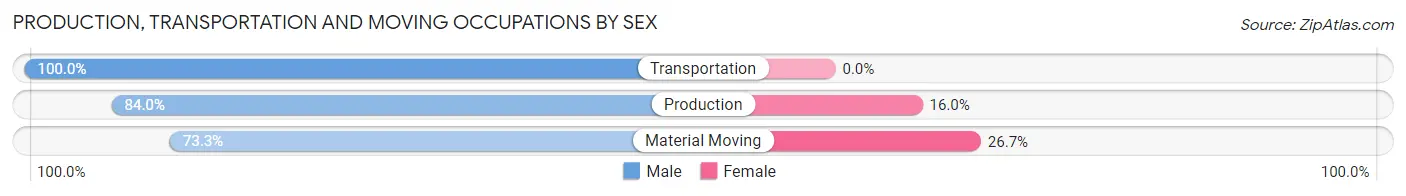
| Occupation | Male | Female |
| Production | 100 (84.0%) | 19 (16.0%) |
| Transportation | 88 (100.0%) | 0 (0.0%) |
| Material Moving | 11 (73.3%) | 4 (26.7%) |
| Total (Category) | 199 (89.6%) | 23 (10.4%) |
| Total (Overall) | 775 (45.8%) | 918 (54.2%) |
Employment Industries by Sex in East Carroll Parish
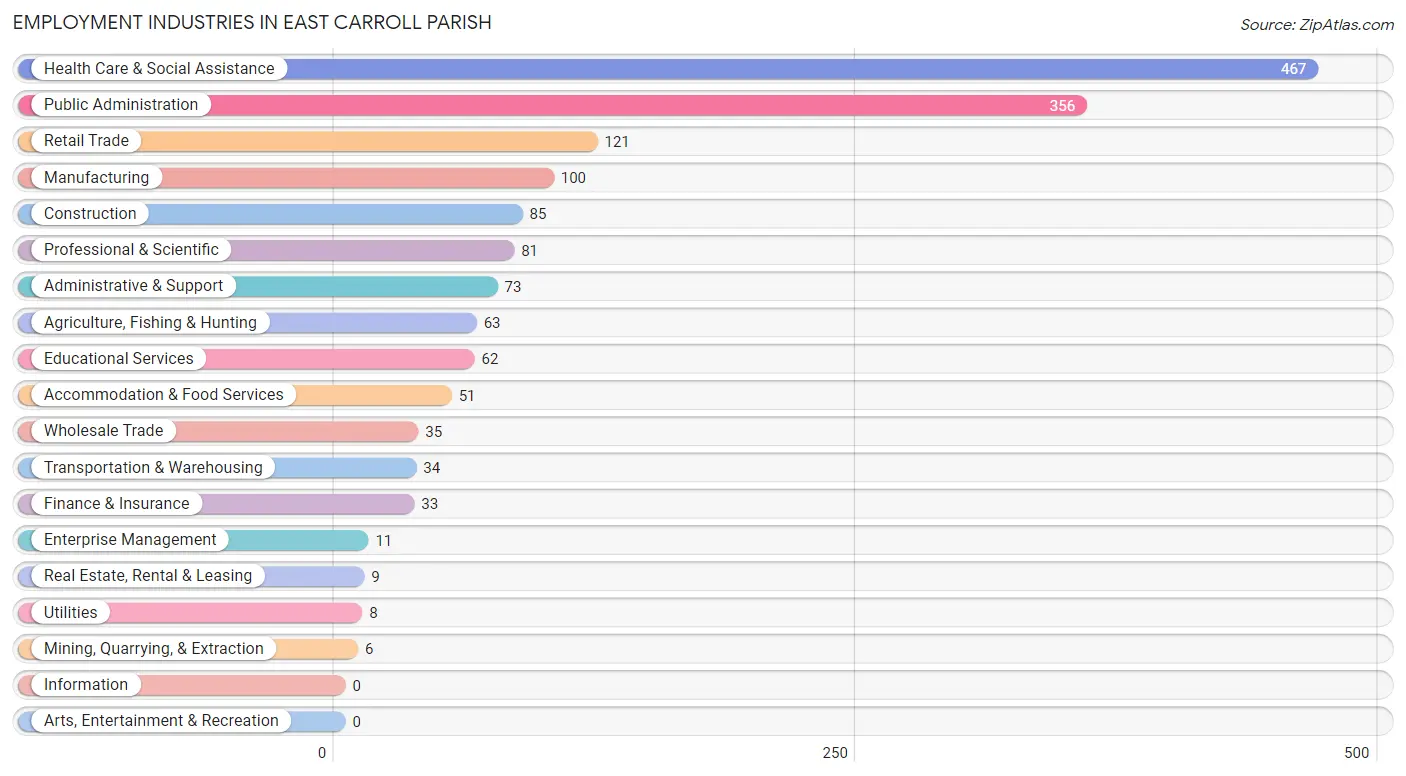
Employment Industries in East Carroll Parish
The major employment industries in East Carroll Parish include Health Care & Social Assistance (467 | 27.6%), Public Administration (356 | 21.0%), Retail Trade (121 | 7.1%), Manufacturing (100 | 5.9%), and Construction (85 | 5.0%).
Employment Industries by Sex in East Carroll Parish
The East Carroll Parish industries that see more men than women are Transportation & Warehousing (100.0%), Utilities (100.0%), and Finance & Insurance (100.0%), whereas the industries that tend to have a higher number of women are Mining, Quarrying, & Extraction (100.0%), Real Estate, Rental & Leasing (100.0%), and Health Care & Social Assistance (81.8%).
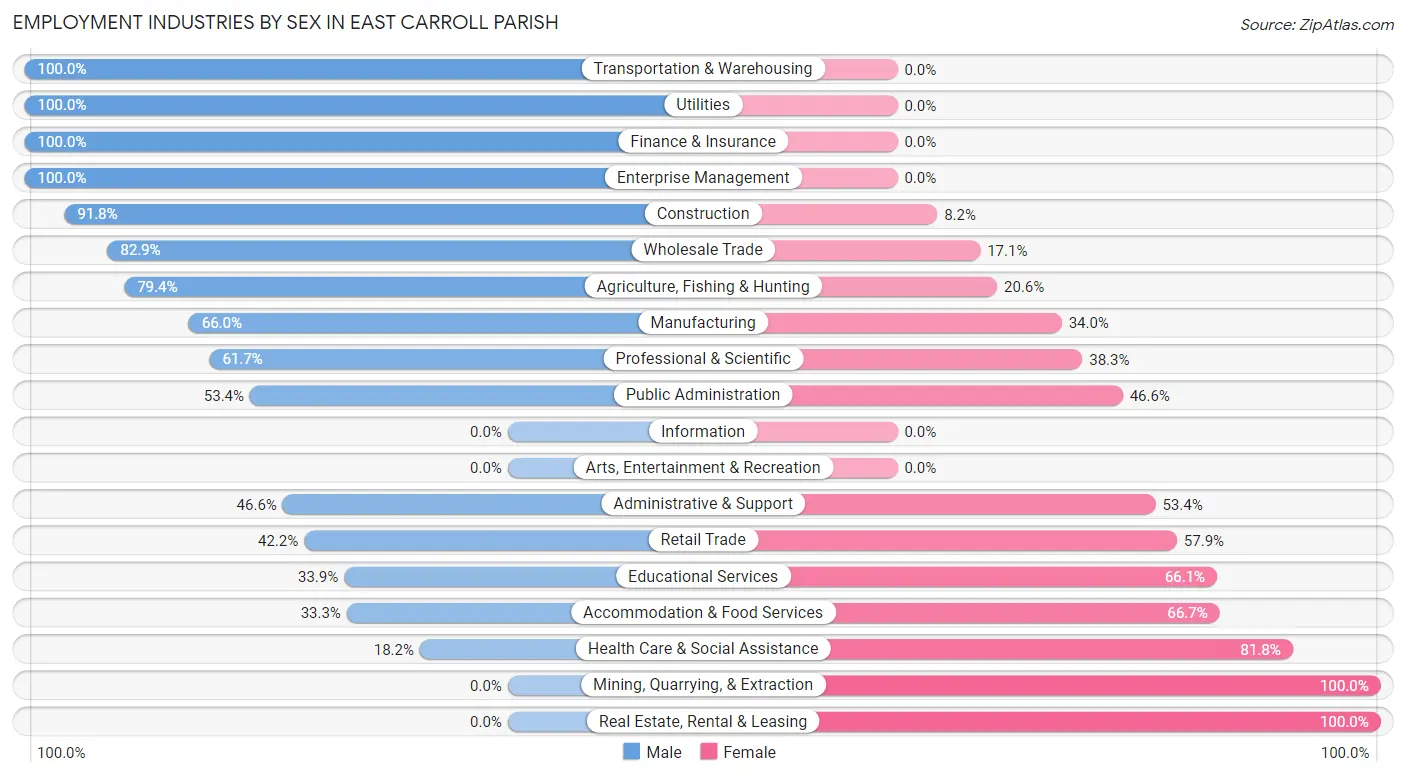
| Industry | Male | Female |
| Agriculture, Fishing & Hunting | 50 (79.4%) | 13 (20.6%) |
| Mining, Quarrying, & Extraction | 0 (0.0%) | 6 (100.0%) |
| Construction | 78 (91.8%) | 7 (8.2%) |
| Manufacturing | 66 (66.0%) | 34 (34.0%) |
| Wholesale Trade | 29 (82.9%) | 6 (17.1%) |
| Retail Trade | 51 (42.1%) | 70 (57.9%) |
| Transportation & Warehousing | 34 (100.0%) | 0 (0.0%) |
| Utilities | 8 (100.0%) | 0 (0.0%) |
| Information | 0 (0.0%) | 0 (0.0%) |
| Finance & Insurance | 33 (100.0%) | 0 (0.0%) |
| Real Estate, Rental & Leasing | 0 (0.0%) | 9 (100.0%) |
| Professional & Scientific | 50 (61.7%) | 31 (38.3%) |
| Enterprise Management | 11 (100.0%) | 0 (0.0%) |
| Administrative & Support | 34 (46.6%) | 39 (53.4%) |
| Educational Services | 21 (33.9%) | 41 (66.1%) |
| Health Care & Social Assistance | 85 (18.2%) | 382 (81.8%) |
| Arts, Entertainment & Recreation | 0 (0.0%) | 0 (0.0%) |
| Accommodation & Food Services | 17 (33.3%) | 34 (66.7%) |
| Public Administration | 190 (53.4%) | 166 (46.6%) |
| Total | 775 (45.8%) | 918 (54.2%) |
Education in East Carroll Parish
School Enrollment in East Carroll Parish
The most common levels of schooling among the 1,738 students in East Carroll Parish are middle school (515 | 29.6%), high school (482 | 27.7%), and elementary school (381 | 21.9%).
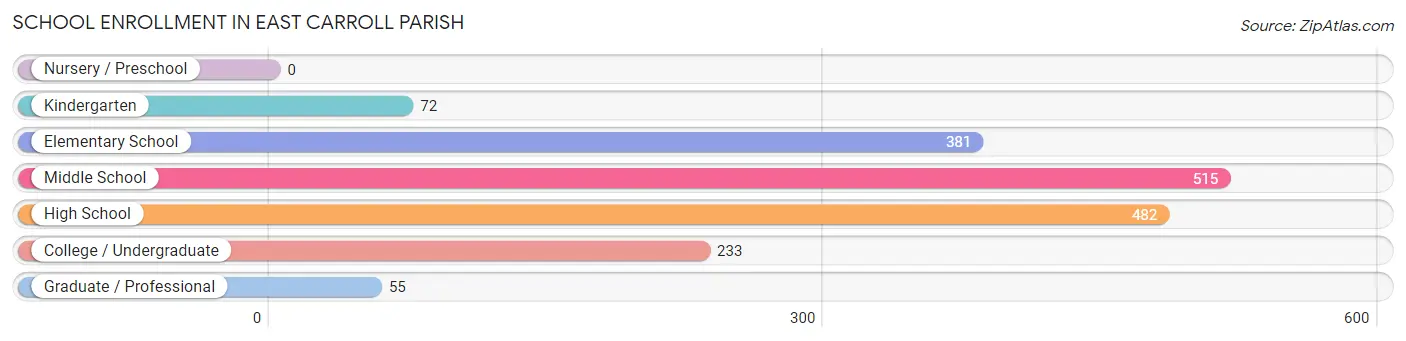
| School Level | # Students | % Students |
| Nursery / Preschool | 0 | 0.0% |
| Kindergarten | 72 | 4.1% |
| Elementary School | 381 | 21.9% |
| Middle School | 515 | 29.6% |
| High School | 482 | 27.7% |
| College / Undergraduate | 233 | 13.4% |
| Graduate / Professional | 55 | 3.2% |
| Total | 1,738 | 100.0% |
School Enrollment by Age by Funding Source in East Carroll Parish
Out of a total of 1,738 students who are enrolled in schools in East Carroll Parish, 229 (13.2%) attend a private institution, while the remaining 1,509 (86.8%) are enrolled in public schools. The age group of 10 to 14 year olds has the highest likelihood of being enrolled in private schools, with 176 (24.0% in the age bracket) enrolled. Conversely, the age group of 18 to 19 year olds has the lowest likelihood of being enrolled in a private school, with 153 (100.0% in the age bracket) attending a public institution.
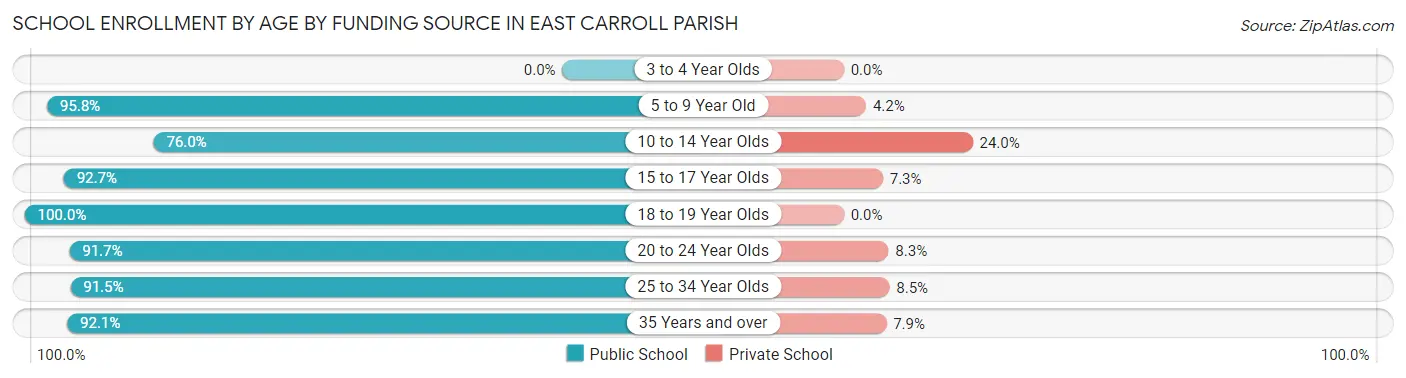
| Age Bracket | Public School | Private School |
| 3 to 4 Year Olds | 0 (0.0%) | 0 (0.0%) |
| 5 to 9 Year Old | 346 (95.8%) | 15 (4.2%) |
| 10 to 14 Year Olds | 557 (76.0%) | 176 (24.0%) |
| 15 to 17 Year Olds | 229 (92.7%) | 18 (7.3%) |
| 18 to 19 Year Olds | 153 (100.0%) | 0 (0.0%) |
| 20 to 24 Year Olds | 88 (91.7%) | 8 (8.3%) |
| 25 to 34 Year Olds | 43 (91.5%) | 4 (8.5%) |
| 35 Years and over | 93 (92.1%) | 8 (7.9%) |
| Total | 1,509 (86.8%) | 229 (13.2%) |
Educational Attainment by Field of Study in East Carroll Parish
Social sciences (142 | 23.3%), business (89 | 14.6%), psychology (66 | 10.8%), bio, nature & agricultural (54 | 8.9%), and arts & humanities (43 | 7.1%) are the most common fields of study among 609 individuals in East Carroll Parish who have obtained a bachelor's degree or higher.
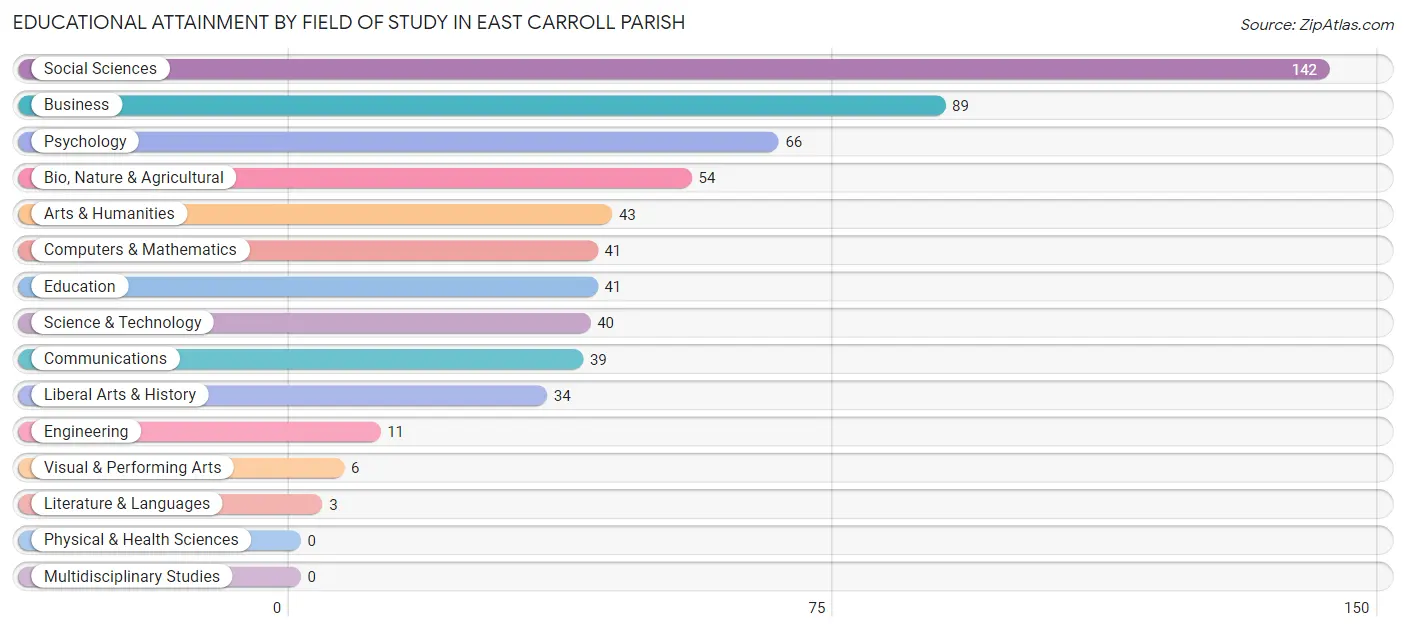
| Field of Study | # Graduates | % Graduates |
| Computers & Mathematics | 41 | 6.7% |
| Bio, Nature & Agricultural | 54 | 8.9% |
| Physical & Health Sciences | 0 | 0.0% |
| Psychology | 66 | 10.8% |
| Social Sciences | 142 | 23.3% |
| Engineering | 11 | 1.8% |
| Multidisciplinary Studies | 0 | 0.0% |
| Science & Technology | 40 | 6.6% |
| Business | 89 | 14.6% |
| Education | 41 | 6.7% |
| Literature & Languages | 3 | 0.5% |
| Liberal Arts & History | 34 | 5.6% |
| Visual & Performing Arts | 6 | 1.0% |
| Communications | 39 | 6.4% |
| Arts & Humanities | 43 | 7.1% |
| Total | 609 | 100.0% |
Transportation & Commute in East Carroll Parish
Vehicle Availability by Sex in East Carroll Parish
The most prevalent vehicle ownership categories in East Carroll Parish are males with 2 vehicles (349, accounting for 45.0%) and females with 2 vehicles (351, making up 41.2%).
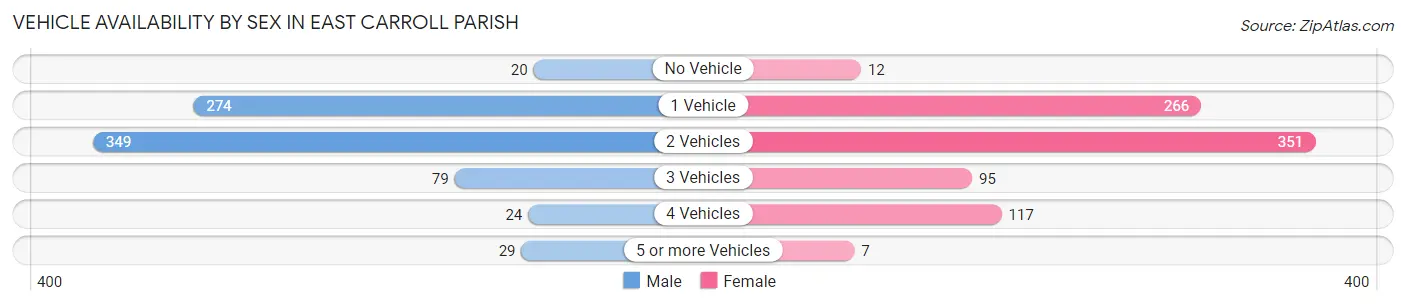
| Vehicles Available | Male | Female |
| No Vehicle | 20 (2.6%) | 12 (1.4%) |
| 1 Vehicle | 274 (35.3%) | 266 (31.4%) |
| 2 Vehicles | 349 (45.0%) | 351 (41.4%) |
| 3 Vehicles | 79 (10.2%) | 95 (11.2%) |
| 4 Vehicles | 24 (3.1%) | 117 (13.8%) |
| 5 or more Vehicles | 29 (3.7%) | 7 (0.8%) |
| Total | 775 (100.0%) | 848 (100.0%) |
Commute Time in East Carroll Parish
The most frequently occuring commute durations in East Carroll Parish are 5 to 9 minutes (409 commuters, 25.5%), 10 to 14 minutes (388 commuters, 24.2%), and 15 to 19 minutes (228 commuters, 14.2%).
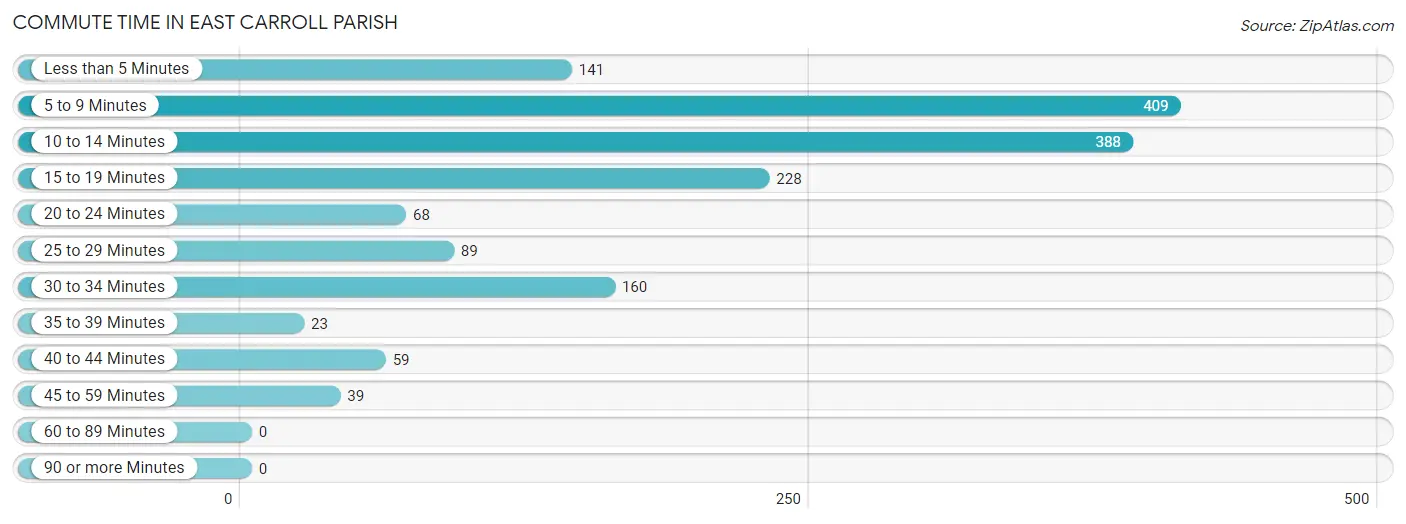
| Commute Time | # Commuters | % Commuters |
| Less than 5 Minutes | 141 | 8.8% |
| 5 to 9 Minutes | 409 | 25.5% |
| 10 to 14 Minutes | 388 | 24.2% |
| 15 to 19 Minutes | 228 | 14.2% |
| 20 to 24 Minutes | 68 | 4.2% |
| 25 to 29 Minutes | 89 | 5.6% |
| 30 to 34 Minutes | 160 | 10.0% |
| 35 to 39 Minutes | 23 | 1.4% |
| 40 to 44 Minutes | 59 | 3.7% |
| 45 to 59 Minutes | 39 | 2.4% |
| 60 to 89 Minutes | 0 | 0.0% |
| 90 or more Minutes | 0 | 0.0% |
Commute Time by Sex in East Carroll Parish
The most common commute times in East Carroll Parish are 10 to 14 minutes (221 commuters, 28.5%) for males and 5 to 9 minutes (308 commuters, 37.1%) for females.
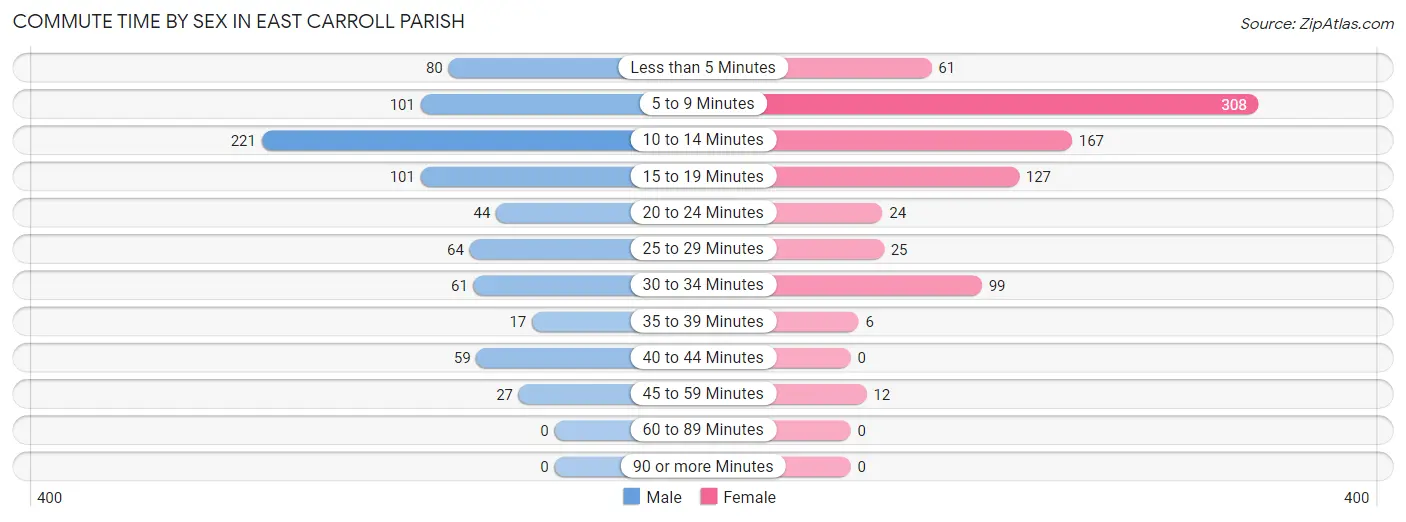
| Commute Time | Male | Female |
| Less than 5 Minutes | 80 (10.3%) | 61 (7.4%) |
| 5 to 9 Minutes | 101 (13.0%) | 308 (37.1%) |
| 10 to 14 Minutes | 221 (28.5%) | 167 (20.1%) |
| 15 to 19 Minutes | 101 (13.0%) | 127 (15.3%) |
| 20 to 24 Minutes | 44 (5.7%) | 24 (2.9%) |
| 25 to 29 Minutes | 64 (8.3%) | 25 (3.0%) |
| 30 to 34 Minutes | 61 (7.9%) | 99 (11.9%) |
| 35 to 39 Minutes | 17 (2.2%) | 6 (0.7%) |
| 40 to 44 Minutes | 59 (7.6%) | 0 (0.0%) |
| 45 to 59 Minutes | 27 (3.5%) | 12 (1.5%) |
| 60 to 89 Minutes | 0 (0.0%) | 0 (0.0%) |
| 90 or more Minutes | 0 (0.0%) | 0 (0.0%) |
Time of Departure to Work by Sex in East Carroll Parish
The most frequent times of departure to work in East Carroll Parish are 7:00 AM to 7:29 AM (249, 32.1%) for males and 8:00 AM to 8:29 AM (160, 19.3%) for females.
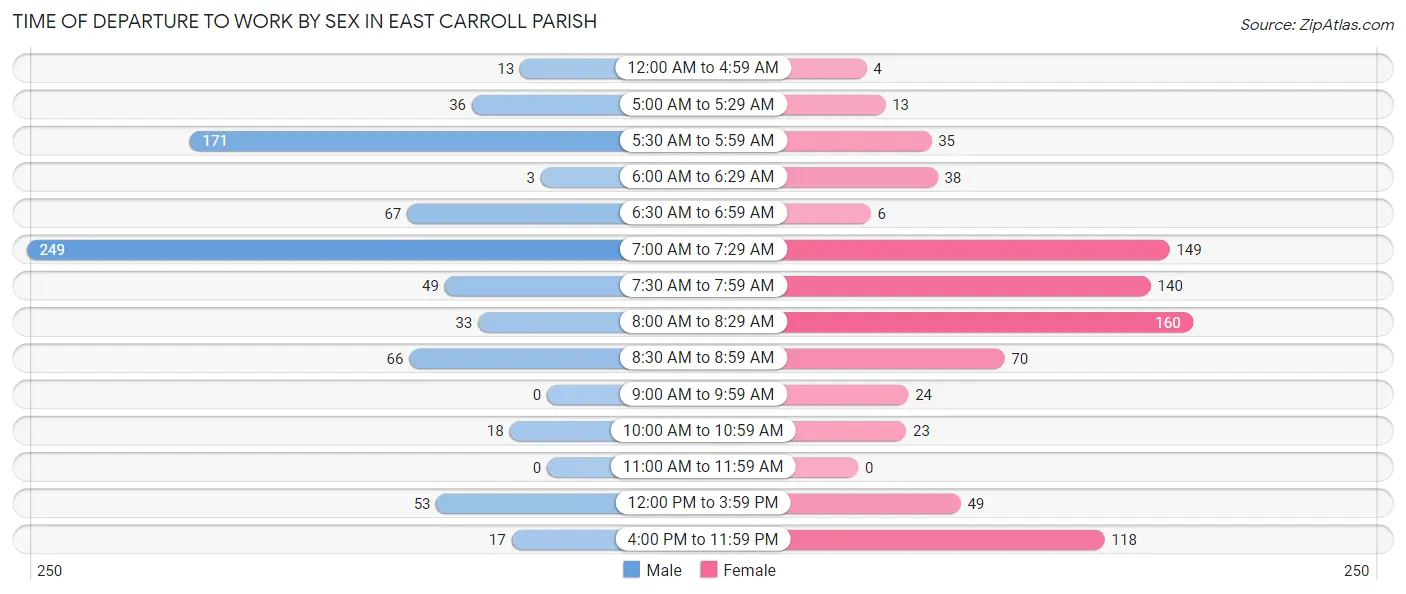
| Time of Departure | Male | Female |
| 12:00 AM to 4:59 AM | 13 (1.7%) | 4 (0.5%) |
| 5:00 AM to 5:29 AM | 36 (4.6%) | 13 (1.6%) |
| 5:30 AM to 5:59 AM | 171 (22.1%) | 35 (4.2%) |
| 6:00 AM to 6:29 AM | 3 (0.4%) | 38 (4.6%) |
| 6:30 AM to 6:59 AM | 67 (8.6%) | 6 (0.7%) |
| 7:00 AM to 7:29 AM | 249 (32.1%) | 149 (18.0%) |
| 7:30 AM to 7:59 AM | 49 (6.3%) | 140 (16.9%) |
| 8:00 AM to 8:29 AM | 33 (4.3%) | 160 (19.3%) |
| 8:30 AM to 8:59 AM | 66 (8.5%) | 70 (8.4%) |
| 9:00 AM to 9:59 AM | 0 (0.0%) | 24 (2.9%) |
| 10:00 AM to 10:59 AM | 18 (2.3%) | 23 (2.8%) |
| 11:00 AM to 11:59 AM | 0 (0.0%) | 0 (0.0%) |
| 12:00 PM to 3:59 PM | 53 (6.8%) | 49 (5.9%) |
| 4:00 PM to 11:59 PM | 17 (2.2%) | 118 (14.2%) |
| Total | 775 (100.0%) | 829 (100.0%) |
Housing Occupancy in East Carroll Parish
Occupancy by Ownership in East Carroll Parish
Of the total 2,381 dwellings in East Carroll Parish, owner-occupied units account for 1,462 (61.4%), while renter-occupied units make up 919 (38.6%).
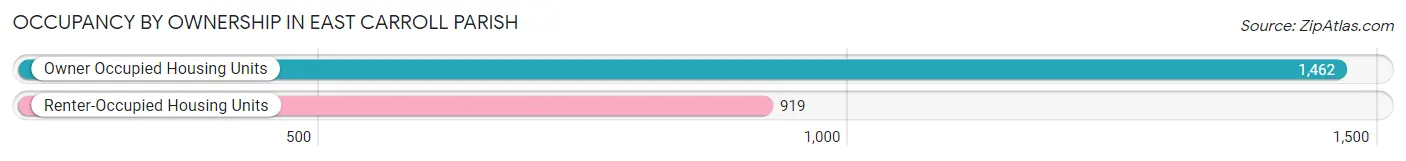
| Occupancy | # Housing Units | % Housing Units |
| Owner Occupied Housing Units | 1,462 | 61.4% |
| Renter-Occupied Housing Units | 919 | 38.6% |
| Total Occupied Housing Units | 2,381 | 100.0% |
Occupancy by Household Size in East Carroll Parish
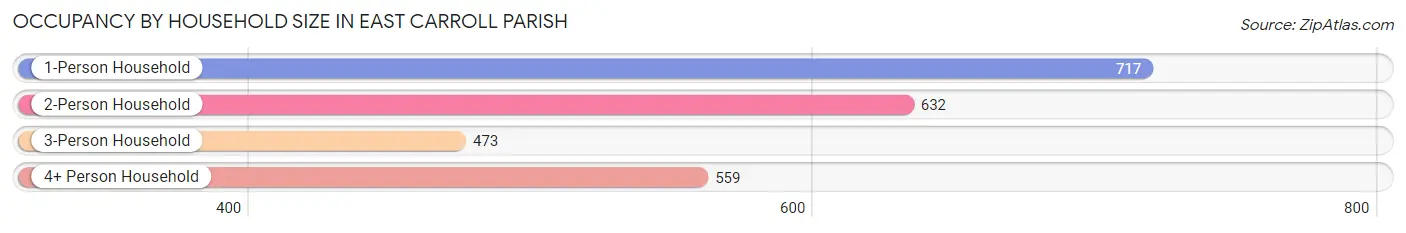
| Household Size | # Housing Units | % Housing Units |
| 1-Person Household | 717 | 30.1% |
| 2-Person Household | 632 | 26.5% |
| 3-Person Household | 473 | 19.9% |
| 4+ Person Household | 559 | 23.5% |
| Total Housing Units | 2,381 | 100.0% |
Occupancy by Ownership by Household Size in East Carroll Parish
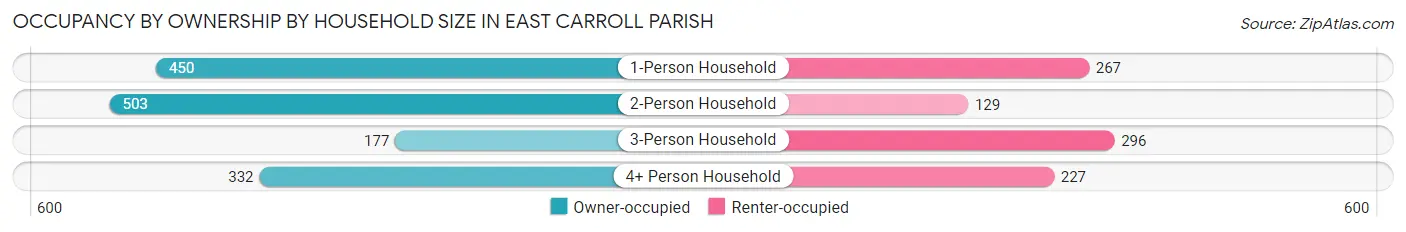
| Household Size | Owner-occupied | Renter-occupied |
| 1-Person Household | 450 (62.8%) | 267 (37.2%) |
| 2-Person Household | 503 (79.6%) | 129 (20.4%) |
| 3-Person Household | 177 (37.4%) | 296 (62.6%) |
| 4+ Person Household | 332 (59.4%) | 227 (40.6%) |
| Total Housing Units | 1,462 (61.4%) | 919 (38.6%) |
Occupancy by Educational Attainment in East Carroll Parish
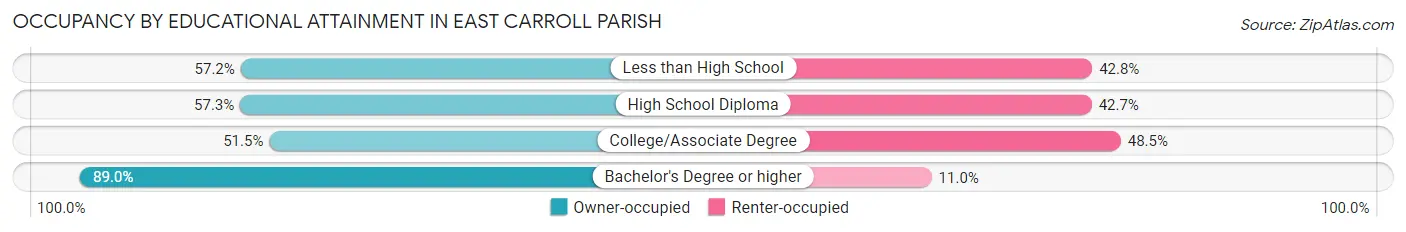
| Household Size | Owner-occupied | Renter-occupied |
| Less than High School | 367 (57.2%) | 275 (42.8%) |
| High School Diploma | 524 (57.3%) | 391 (42.7%) |
| College/Associate Degree | 223 (51.5%) | 210 (48.5%) |
| Bachelor's Degree or higher | 348 (89.0%) | 43 (11.0%) |
Occupancy by Age of Householder in East Carroll Parish
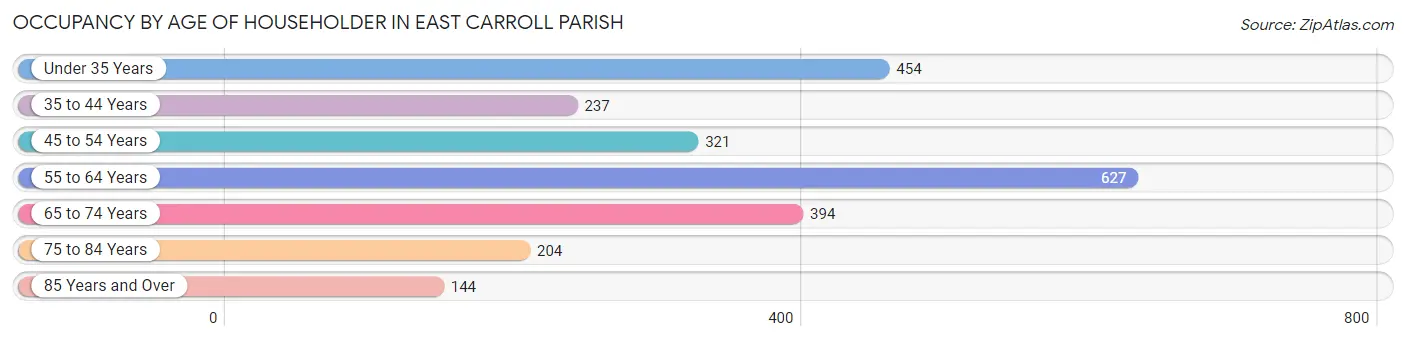
| Age Bracket | # Households | % Households |
| Under 35 Years | 454 | 19.1% |
| 35 to 44 Years | 237 | 10.0% |
| 45 to 54 Years | 321 | 13.5% |
| 55 to 64 Years | 627 | 26.3% |
| 65 to 74 Years | 394 | 16.6% |
| 75 to 84 Years | 204 | 8.6% |
| 85 Years and Over | 144 | 6.0% |
| Total | 2,381 | 100.0% |
Housing Finances in East Carroll Parish
Median Income by Occupancy in East Carroll Parish
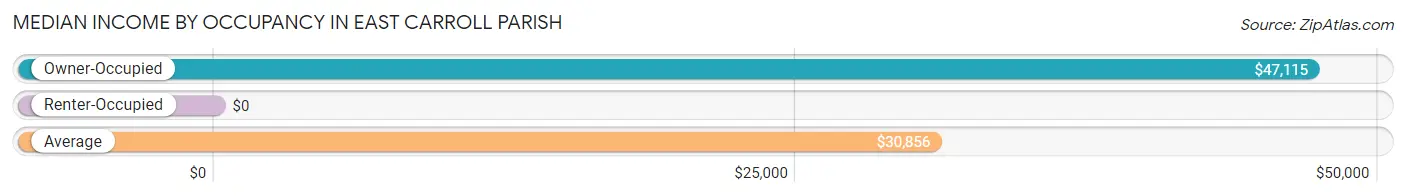
| Occupancy Type | # Households | Median Income |
| Owner-Occupied | 1,462 (61.4%) | $47,115 |
| Renter-Occupied | 919 (38.6%) | $0 |
| Average | 2,381 (100.0%) | $30,856 |
Occupancy by Householder Income Bracket in East Carroll Parish
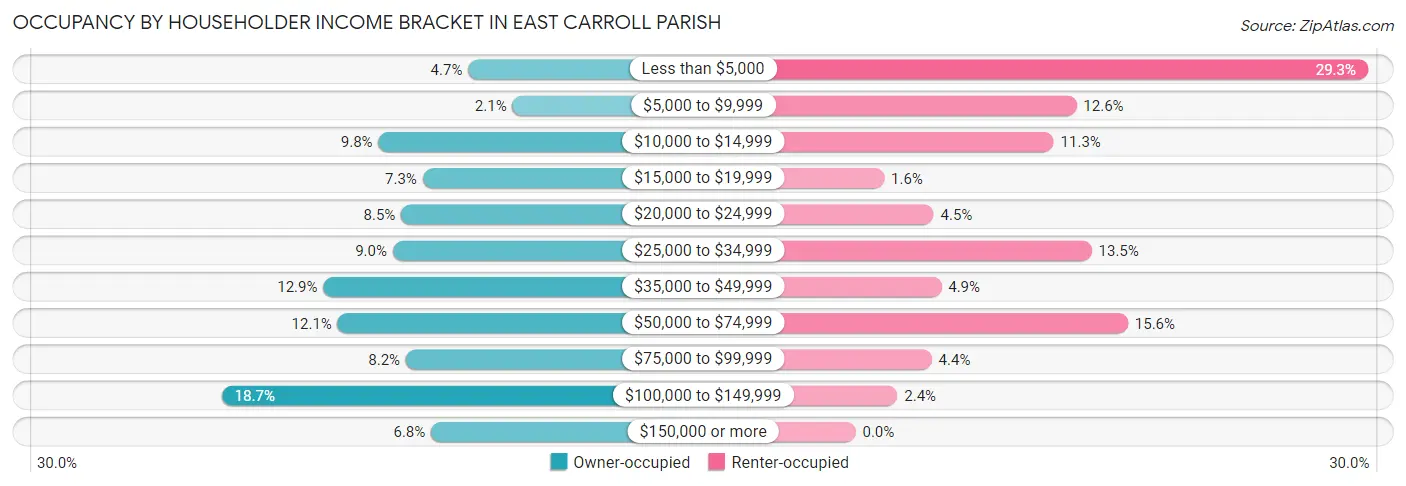
| Income Bracket | Owner-occupied | Renter-occupied |
| Less than $5,000 | 68 (4.6%) | 269 (29.3%) |
| $5,000 to $9,999 | 31 (2.1%) | 116 (12.6%) |
| $10,000 to $14,999 | 143 (9.8%) | 104 (11.3%) |
| $15,000 to $19,999 | 106 (7.2%) | 15 (1.6%) |
| $20,000 to $24,999 | 124 (8.5%) | 41 (4.5%) |
| $25,000 to $34,999 | 131 (9.0%) | 124 (13.5%) |
| $35,000 to $49,999 | 189 (12.9%) | 45 (4.9%) |
| $50,000 to $74,999 | 177 (12.1%) | 143 (15.6%) |
| $75,000 to $99,999 | 120 (8.2%) | 40 (4.3%) |
| $100,000 to $149,999 | 274 (18.7%) | 22 (2.4%) |
| $150,000 or more | 99 (6.8%) | 0 (0.0%) |
| Total | 1,462 (100.0%) | 919 (100.0%) |
Monthly Housing Cost Tiers in East Carroll Parish
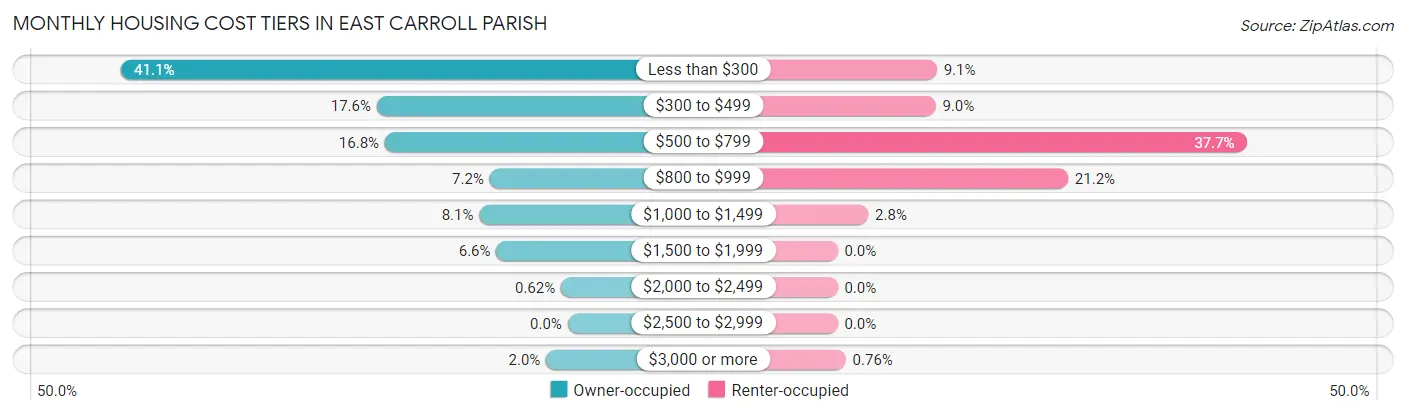
| Monthly Cost | Owner-occupied | Renter-occupied |
| Less than $300 | 601 (41.1%) | 84 (9.1%) |
| $300 to $499 | 257 (17.6%) | 83 (9.0%) |
| $500 to $799 | 246 (16.8%) | 346 (37.7%) |
| $800 to $999 | 105 (7.2%) | 195 (21.2%) |
| $1,000 to $1,499 | 119 (8.1%) | 26 (2.8%) |
| $1,500 to $1,999 | 96 (6.6%) | 0 (0.0%) |
| $2,000 to $2,499 | 9 (0.6%) | 0 (0.0%) |
| $2,500 to $2,999 | 0 (0.0%) | 0 (0.0%) |
| $3,000 or more | 29 (2.0%) | 7 (0.8%) |
| Total | 1,462 (100.0%) | 919 (100.0%) |
Physical Housing Characteristics in East Carroll Parish
Housing Structures in East Carroll Parish
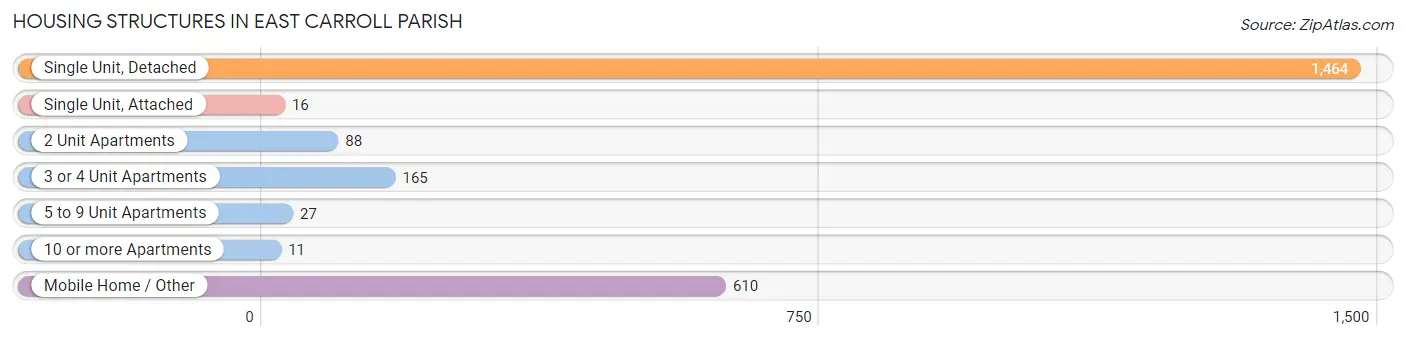
| Structure Type | # Housing Units | % Housing Units |
| Single Unit, Detached | 1,464 | 61.5% |
| Single Unit, Attached | 16 | 0.7% |
| 2 Unit Apartments | 88 | 3.7% |
| 3 or 4 Unit Apartments | 165 | 6.9% |
| 5 to 9 Unit Apartments | 27 | 1.1% |
| 10 or more Apartments | 11 | 0.5% |
| Mobile Home / Other | 610 | 25.6% |
| Total | 2,381 | 100.0% |
Housing Structures by Occupancy in East Carroll Parish
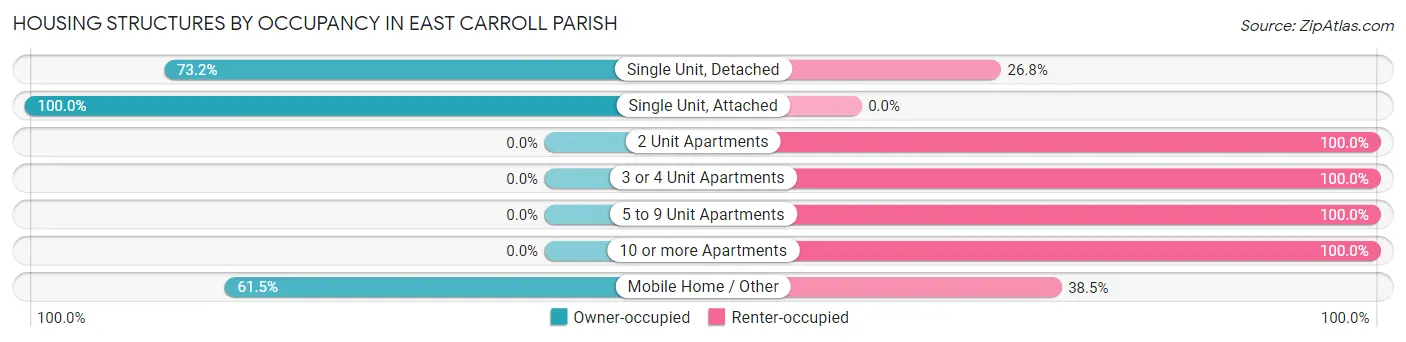
| Structure Type | Owner-occupied | Renter-occupied |
| Single Unit, Detached | 1,071 (73.2%) | 393 (26.8%) |
| Single Unit, Attached | 16 (100.0%) | 0 (0.0%) |
| 2 Unit Apartments | 0 (0.0%) | 88 (100.0%) |
| 3 or 4 Unit Apartments | 0 (0.0%) | 165 (100.0%) |
| 5 to 9 Unit Apartments | 0 (0.0%) | 27 (100.0%) |
| 10 or more Apartments | 0 (0.0%) | 11 (100.0%) |
| Mobile Home / Other | 375 (61.5%) | 235 (38.5%) |
| Total | 1,462 (61.4%) | 919 (38.6%) |
Housing Structures by Number of Rooms in East Carroll Parish
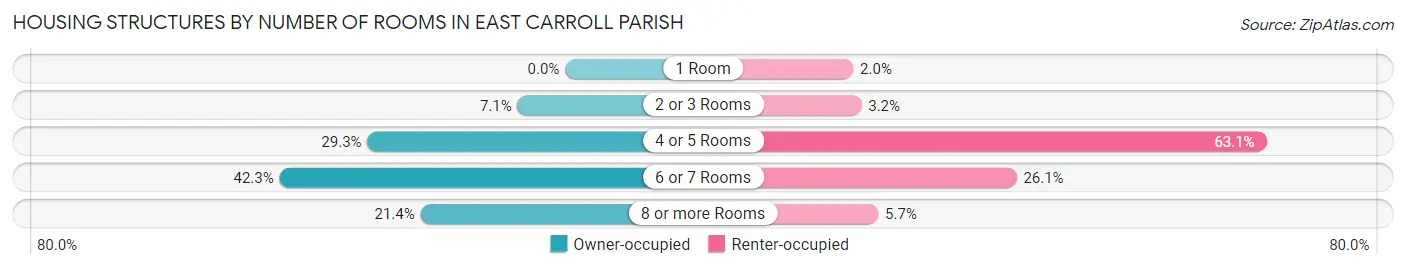
| Number of Rooms | Owner-occupied | Renter-occupied |
| 1 Room | 0 (0.0%) | 18 (2.0%) |
| 2 or 3 Rooms | 103 (7.0%) | 29 (3.2%) |
| 4 or 5 Rooms | 428 (29.3%) | 580 (63.1%) |
| 6 or 7 Rooms | 618 (42.3%) | 240 (26.1%) |
| 8 or more Rooms | 313 (21.4%) | 52 (5.7%) |
| Total | 1,462 (100.0%) | 919 (100.0%) |
Housing Structure by Heating Type in East Carroll Parish
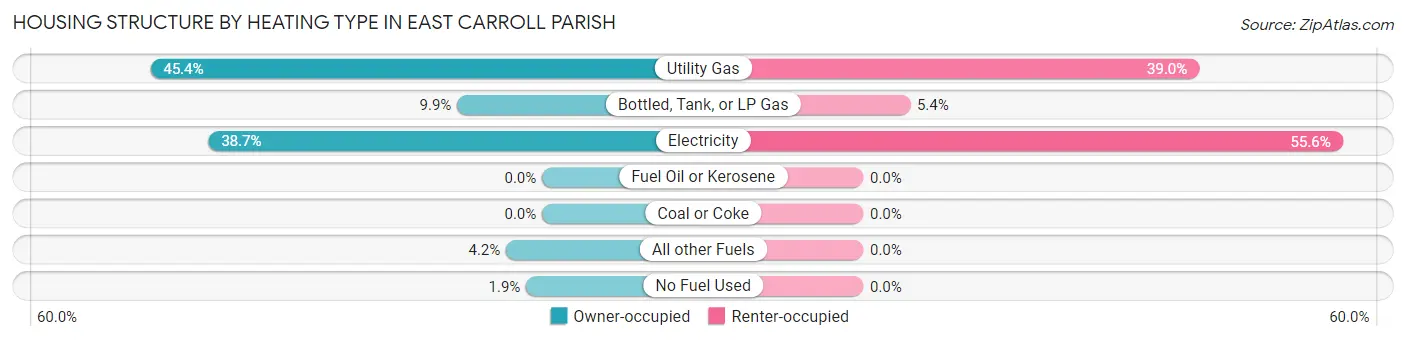
| Heating Type | Owner-occupied | Renter-occupied |
| Utility Gas | 664 (45.4%) | 358 (39.0%) |
| Bottled, Tank, or LP Gas | 144 (9.9%) | 50 (5.4%) |
| Electricity | 566 (38.7%) | 511 (55.6%) |
| Fuel Oil or Kerosene | 0 (0.0%) | 0 (0.0%) |
| Coal or Coke | 0 (0.0%) | 0 (0.0%) |
| All other Fuels | 61 (4.2%) | 0 (0.0%) |
| No Fuel Used | 27 (1.8%) | 0 (0.0%) |
| Total | 1,462 (100.0%) | 919 (100.0%) |
Household Vehicle Usage in East Carroll Parish
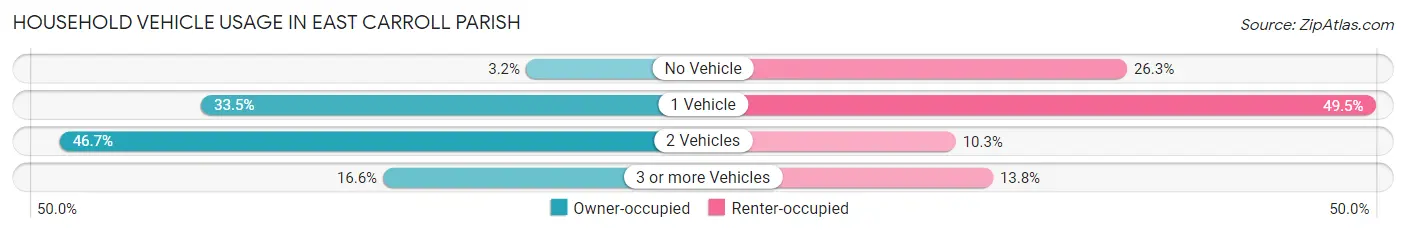
| Vehicles per Household | Owner-occupied | Renter-occupied |
| No Vehicle | 47 (3.2%) | 242 (26.3%) |
| 1 Vehicle | 490 (33.5%) | 455 (49.5%) |
| 2 Vehicles | 683 (46.7%) | 95 (10.3%) |
| 3 or more Vehicles | 242 (16.6%) | 127 (13.8%) |
| Total | 1,462 (100.0%) | 919 (100.0%) |
Real Estate & Mortgages in East Carroll Parish
Real Estate and Mortgage Overview in East Carroll Parish
| Characteristic | Without Mortgage | With Mortgage |
| Housing Units | 1,041 | 421 |
| Median Property Value | $59,700 | $118,600 |
| Median Household Income | $35,353 | $41 |
| Monthly Housing Costs | $273 | $13 |
| Real Estate Taxes | $199 | $209 |
Property Value by Mortgage Status in East Carroll Parish
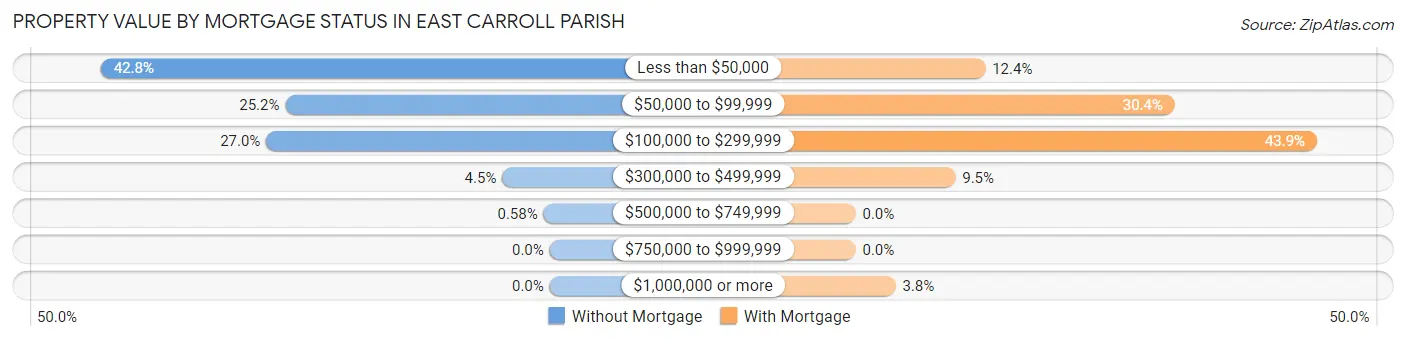
| Property Value | Without Mortgage | With Mortgage |
| Less than $50,000 | 445 (42.7%) | 52 (12.3%) |
| $50,000 to $99,999 | 262 (25.2%) | 128 (30.4%) |
| $100,000 to $299,999 | 281 (27.0%) | 185 (43.9%) |
| $300,000 to $499,999 | 47 (4.5%) | 40 (9.5%) |
| $500,000 to $749,999 | 6 (0.6%) | 0 (0.0%) |
| $750,000 to $999,999 | 0 (0.0%) | 0 (0.0%) |
| $1,000,000 or more | 0 (0.0%) | 16 (3.8%) |
| Total | 1,041 (100.0%) | 421 (100.0%) |
Household Income by Mortgage Status in East Carroll Parish
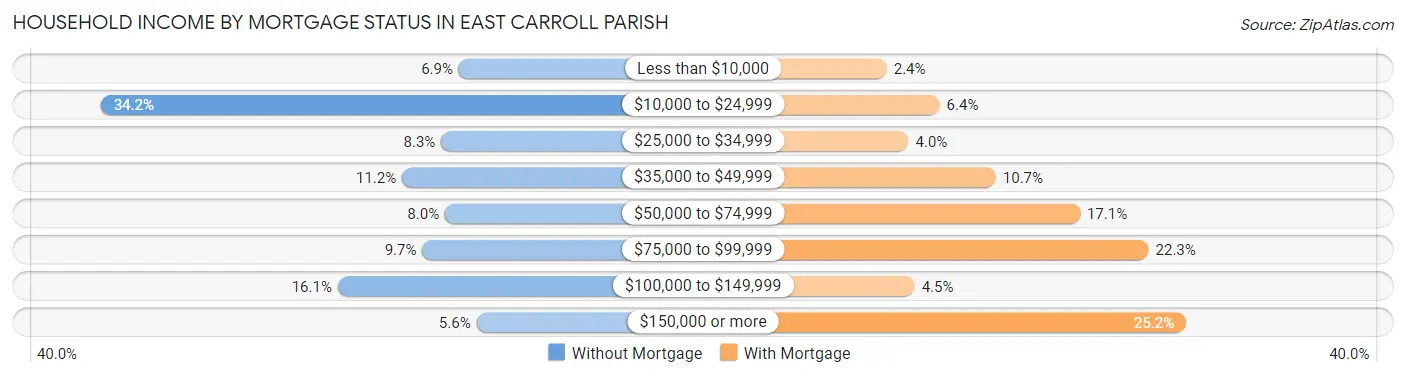
| Household Income | Without Mortgage | With Mortgage |
| Less than $10,000 | 72 (6.9%) | 10 (2.4%) |
| $10,000 to $24,999 | 356 (34.2%) | 27 (6.4%) |
| $25,000 to $34,999 | 86 (8.3%) | 17 (4.0%) |
| $35,000 to $49,999 | 117 (11.2%) | 45 (10.7%) |
| $50,000 to $74,999 | 83 (8.0%) | 72 (17.1%) |
| $75,000 to $99,999 | 101 (9.7%) | 94 (22.3%) |
| $100,000 to $149,999 | 168 (16.1%) | 19 (4.5%) |
| $150,000 or more | 58 (5.6%) | 106 (25.2%) |
| Total | 1,041 (100.0%) | 421 (100.0%) |
Property Value to Household Income Ratio in East Carroll Parish
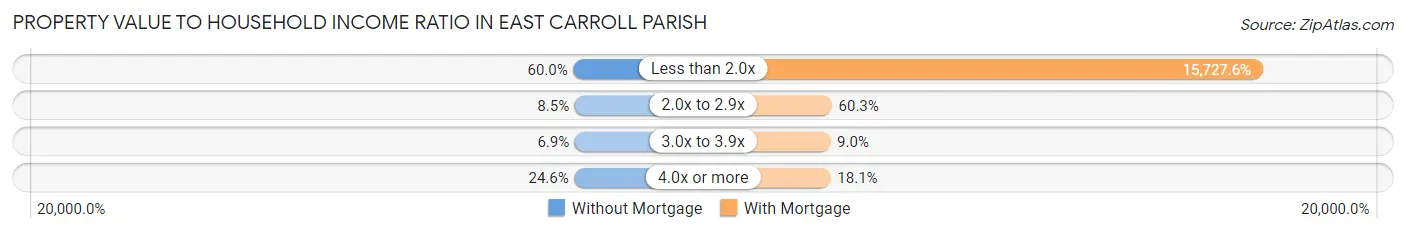
| Value-to-Income Ratio | Without Mortgage | With Mortgage |
| Less than 2.0x | 625 (60.0%) | 66,213 (15,727.5%) |
| 2.0x to 2.9x | 88 (8.5%) | 254 (60.3%) |
| 3.0x to 3.9x | 72 (6.9%) | 38 (9.0%) |
| 4.0x or more | 256 (24.6%) | 76 (18.0%) |
| Total | 1,041 (100.0%) | 421 (100.0%) |
Real Estate Taxes by Mortgage Status in East Carroll Parish
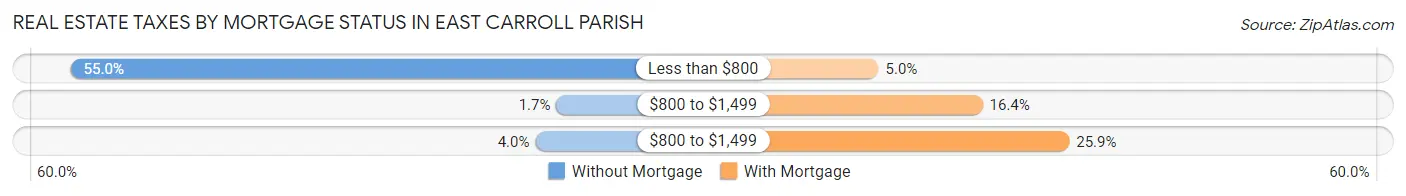
| Property Taxes | Without Mortgage | With Mortgage |
| Less than $800 | 572 (54.9%) | 21 (5.0%) |
| $800 to $1,499 | 18 (1.7%) | 69 (16.4%) |
| $800 to $1,499 | 42 (4.0%) | 109 (25.9%) |
| Total | 1,041 (100.0%) | 421 (100.0%) |
Health & Disability in East Carroll Parish
Health Insurance Coverage by Age in East Carroll Parish
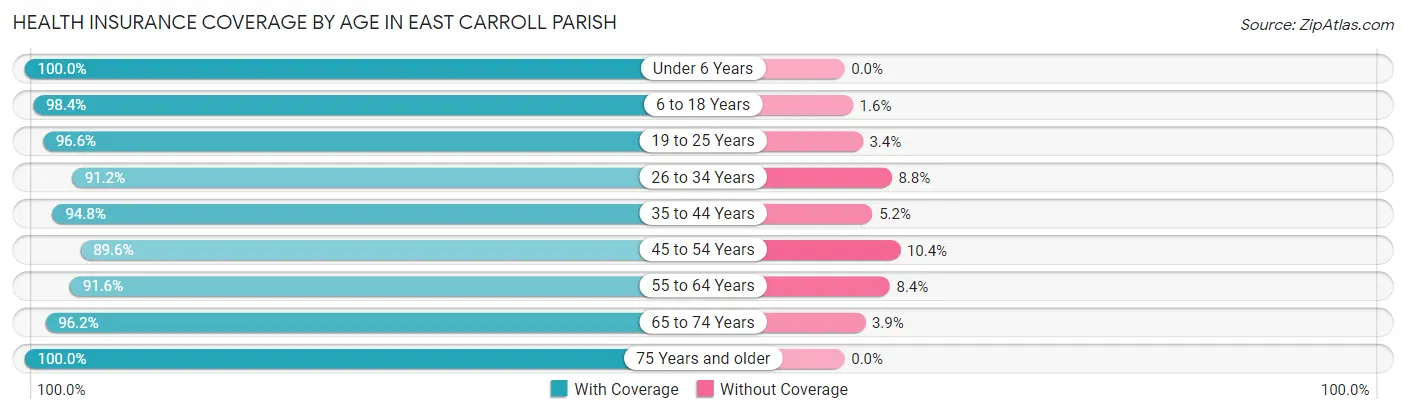
| Age Bracket | With Coverage | Without Coverage |
| Under 6 Years | 272 (100.0%) | 0 (0.0%) |
| 6 to 18 Years | 1,449 (98.4%) | 23 (1.6%) |
| 19 to 25 Years | 486 (96.6%) | 17 (3.4%) |
| 26 to 34 Years | 404 (91.2%) | 39 (8.8%) |
| 35 to 44 Years | 382 (94.8%) | 21 (5.2%) |
| 45 to 54 Years | 449 (89.6%) | 52 (10.4%) |
| 55 to 64 Years | 727 (91.6%) | 67 (8.4%) |
| 65 to 74 Years | 600 (96.2%) | 24 (3.8%) |
| 75 Years and older | 489 (100.0%) | 0 (0.0%) |
| Total | 5,258 (95.6%) | 243 (4.4%) |
Health Insurance Coverage by Citizenship Status in East Carroll Parish
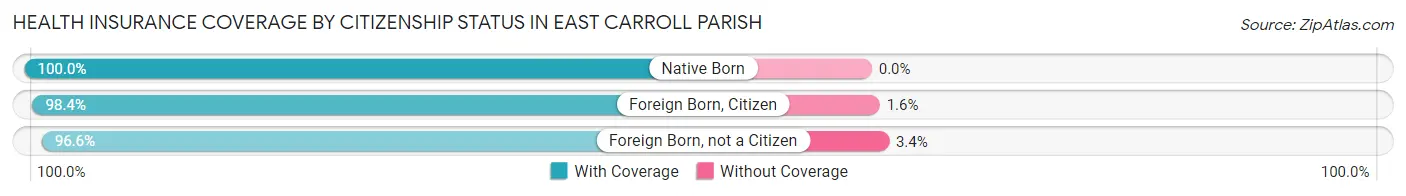
| Citizenship Status | With Coverage | Without Coverage |
| Native Born | 272 (100.0%) | 0 (0.0%) |
| Foreign Born, Citizen | 1,449 (98.4%) | 23 (1.6%) |
| Foreign Born, not a Citizen | 486 (96.6%) | 17 (3.4%) |
Health Insurance Coverage by Household Income in East Carroll Parish
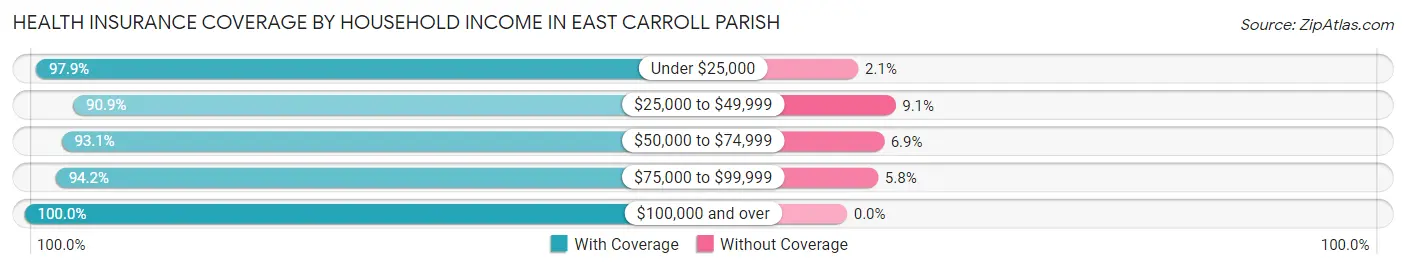
| Household Income | With Coverage | Without Coverage |
| Under $25,000 | 2,064 (97.9%) | 45 (2.1%) |
| $25,000 to $49,999 | 1,301 (90.9%) | 130 (9.1%) |
| $50,000 to $74,999 | 674 (93.1%) | 50 (6.9%) |
| $75,000 to $99,999 | 291 (94.2%) | 18 (5.8%) |
| $100,000 and over | 928 (100.0%) | 0 (0.0%) |
Public vs Private Health Insurance Coverage by Age in East Carroll Parish
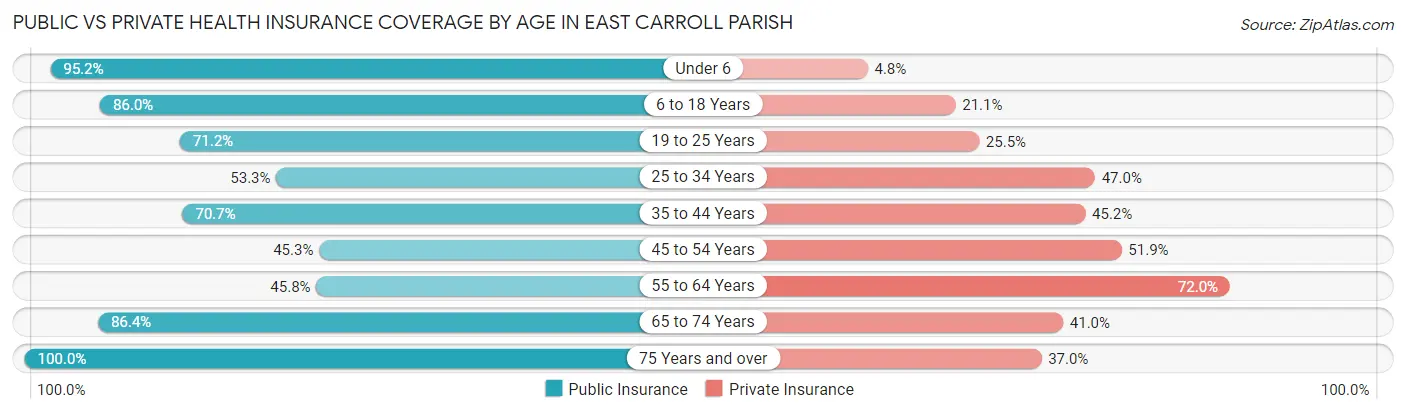
| Age Bracket | Public Insurance | Private Insurance |
| Under 6 | 259 (95.2%) | 13 (4.8%) |
| 6 to 18 Years | 1,266 (86.0%) | 310 (21.1%) |
| 19 to 25 Years | 358 (71.2%) | 128 (25.5%) |
| 25 to 34 Years | 236 (53.3%) | 208 (46.9%) |
| 35 to 44 Years | 285 (70.7%) | 182 (45.2%) |
| 45 to 54 Years | 227 (45.3%) | 260 (51.9%) |
| 55 to 64 Years | 364 (45.8%) | 572 (72.0%) |
| 65 to 74 Years | 539 (86.4%) | 256 (41.0%) |
| 75 Years and over | 489 (100.0%) | 181 (37.0%) |
| Total | 4,023 (73.1%) | 2,110 (38.4%) |
Disability Status by Sex by Age in East Carroll Parish
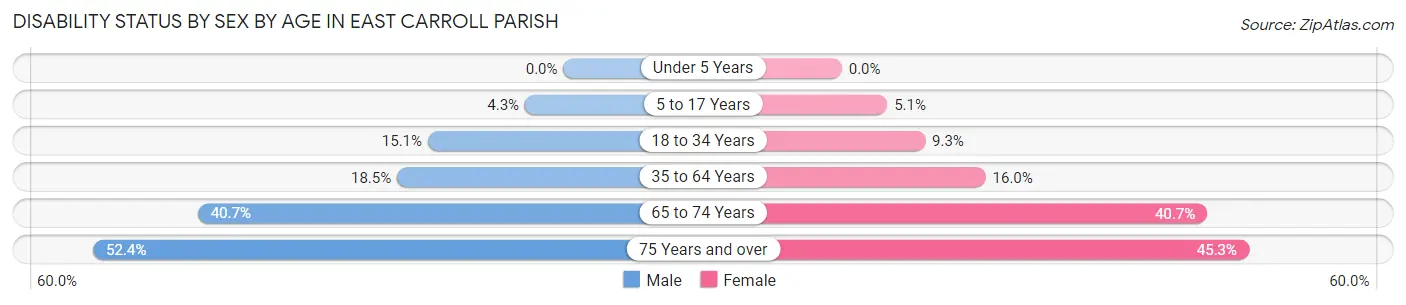
| Age Bracket | Male | Female |
| Under 5 Years | 0 (0.0%) | 0 (0.0%) |
| 5 to 17 Years | 31 (4.3%) | 36 (5.1%) |
| 18 to 34 Years | 67 (15.1%) | 53 (9.3%) |
| 35 to 64 Years | 133 (18.5%) | 157 (16.0%) |
| 65 to 74 Years | 125 (40.7%) | 129 (40.7%) |
| 75 Years and over | 99 (52.4%) | 136 (45.3%) |
Disability Class by Sex by Age in East Carroll Parish
Disability Class: Hearing Difficulty
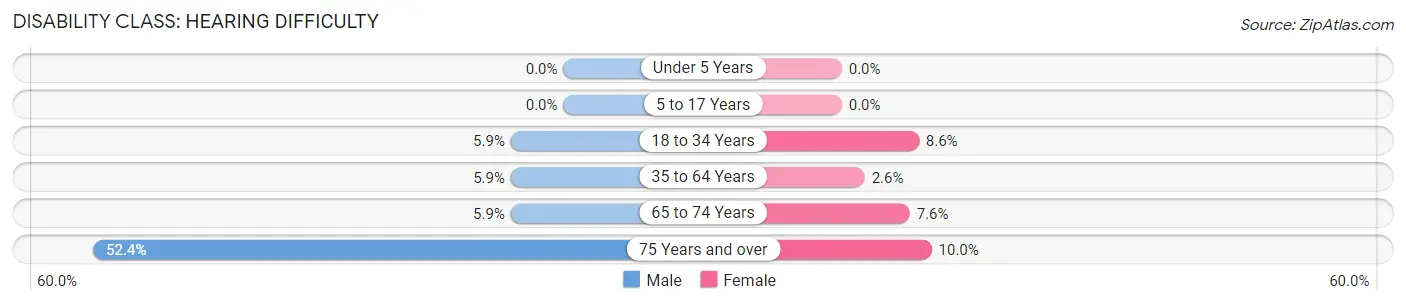
| Age Bracket | Male | Female |
| Under 5 Years | 0 (0.0%) | 0 (0.0%) |
| 5 to 17 Years | 0 (0.0%) | 0 (0.0%) |
| 18 to 34 Years | 26 (5.9%) | 49 (8.6%) |
| 35 to 64 Years | 42 (5.9%) | 25 (2.5%) |
| 65 to 74 Years | 18 (5.9%) | 24 (7.6%) |
| 75 Years and over | 99 (52.4%) | 30 (10.0%) |
Disability Class: Vision Difficulty
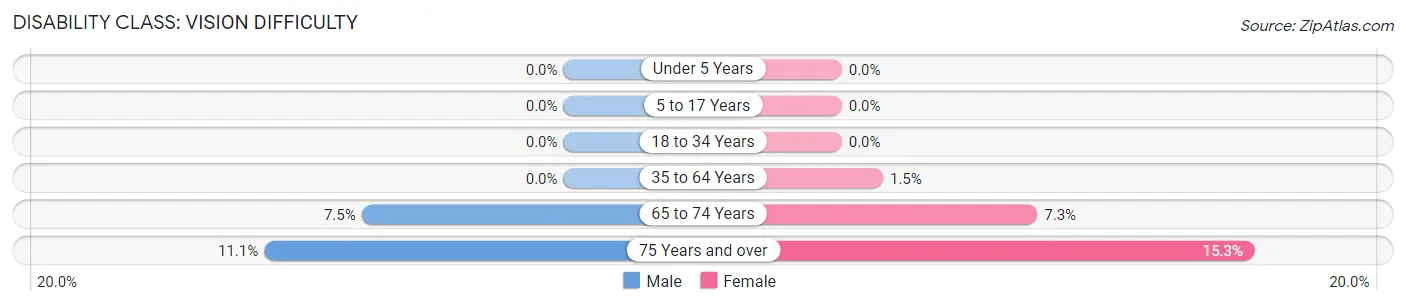
| Age Bracket | Male | Female |
| Under 5 Years | 0 (0.0%) | 0 (0.0%) |
| 5 to 17 Years | 0 (0.0%) | 0 (0.0%) |
| 18 to 34 Years | 0 (0.0%) | 0 (0.0%) |
| 35 to 64 Years | 0 (0.0%) | 15 (1.5%) |
| 65 to 74 Years | 23 (7.5%) | 23 (7.3%) |
| 75 Years and over | 21 (11.1%) | 46 (15.3%) |
Disability Class: Cognitive Difficulty
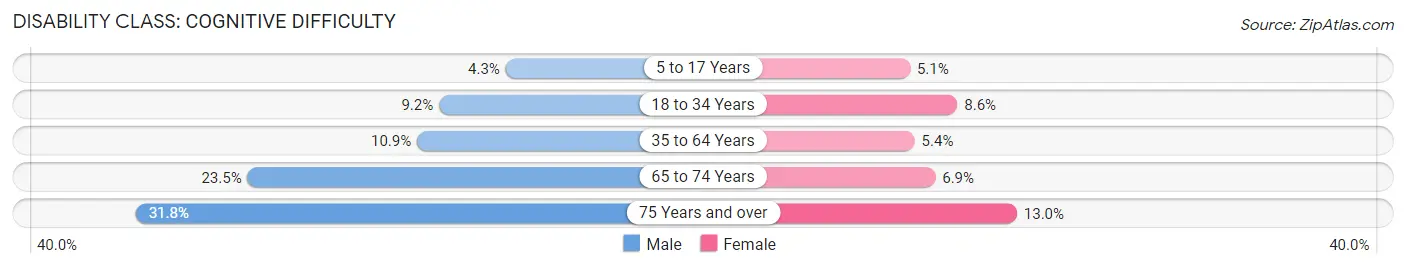
| Age Bracket | Male | Female |
| 5 to 17 Years | 31 (4.3%) | 36 (5.1%) |
| 18 to 34 Years | 41 (9.2%) | 49 (8.6%) |
| 35 to 64 Years | 78 (10.9%) | 53 (5.4%) |
| 65 to 74 Years | 72 (23.4%) | 22 (6.9%) |
| 75 Years and over | 60 (31.8%) | 39 (13.0%) |
Disability Class: Ambulatory Difficulty
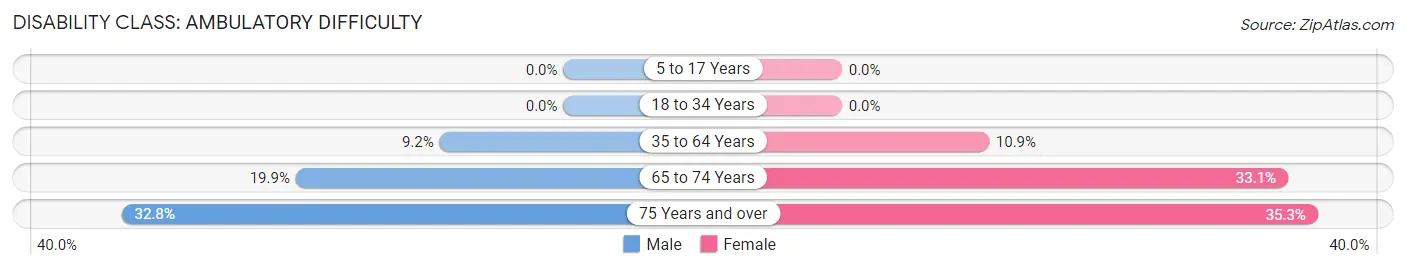
| Age Bracket | Male | Female |
| 5 to 17 Years | 0 (0.0%) | 0 (0.0%) |
| 18 to 34 Years | 0 (0.0%) | 0 (0.0%) |
| 35 to 64 Years | 66 (9.2%) | 107 (10.9%) |
| 65 to 74 Years | 61 (19.9%) | 105 (33.1%) |
| 75 Years and over | 62 (32.8%) | 106 (35.3%) |
Disability Class: Self-Care Difficulty
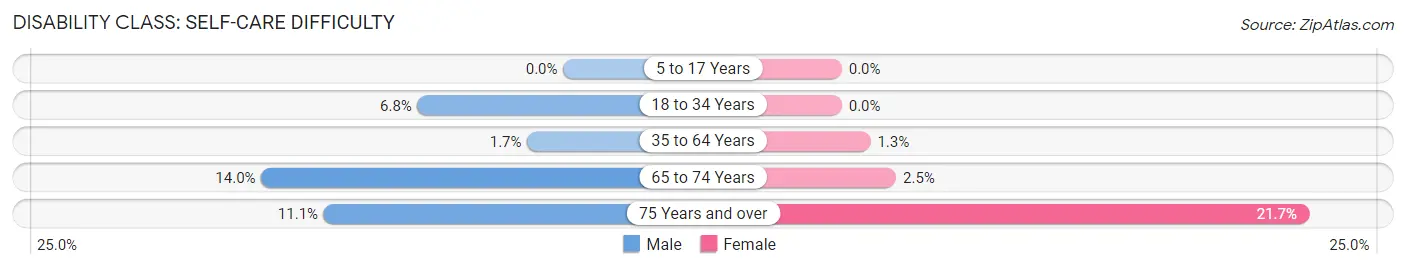
| Age Bracket | Male | Female |
| 5 to 17 Years | 0 (0.0%) | 0 (0.0%) |
| 18 to 34 Years | 30 (6.8%) | 0 (0.0%) |
| 35 to 64 Years | 12 (1.7%) | 13 (1.3%) |
| 65 to 74 Years | 43 (14.0%) | 8 (2.5%) |
| 75 Years and over | 21 (11.1%) | 65 (21.7%) |
Technology Access in East Carroll Parish
Computing Device Access in East Carroll Parish
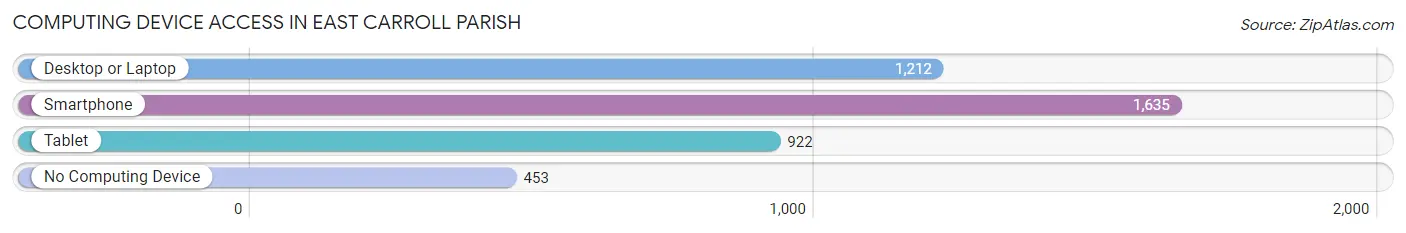
| Device Type | # Households | % Households |
| Desktop or Laptop | 1,212 | 50.9% |
| Smartphone | 1,635 | 68.7% |
| Tablet | 922 | 38.7% |
| No Computing Device | 453 | 19.0% |
| Total | 2,381 | 100.0% |
Internet Access in East Carroll Parish
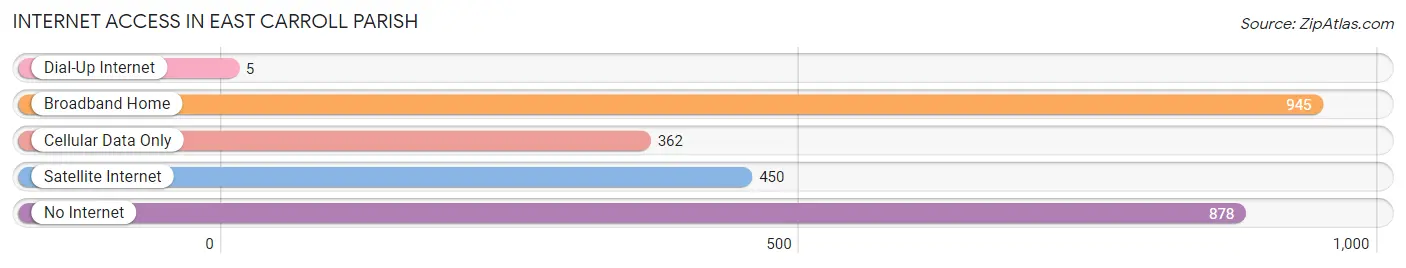
| Internet Type | # Households | % Households |
| Dial-Up Internet | 5 | 0.2% |
| Broadband Home | 945 | 39.7% |
| Cellular Data Only | 362 | 15.2% |
| Satellite Internet | 450 | 18.9% |
| No Internet | 878 | 36.9% |
| Total | 2,381 | 100.0% |
East Carroll Parish Summary
History
East Carroll Parish is located in the northeastern corner of Louisiana and is part of the Mississippi Delta region. The parish was created in 1877 from parts of Carroll and Madison Parishes. It was named for the eastern portion of Carroll Parish. The parish seat is Lake Providence.
The area was first inhabited by the Tunica and Chitimacha Native American tribes. The first European settlers arrived in the area in the late 1700s. The area was part of the Louisiana Purchase in 1803.
The parish was largely agricultural in the 19th century, with cotton and corn being the main crops. The area was also known for its timber industry. The parish was also home to several plantations, including the historic Oakley Plantation.
Geography
East Carroll Parish is located in the northeastern corner of Louisiana and is bordered by the Mississippi River to the east and the Tensas River to the west. The parish has a total area of 545 square miles, of which 543 square miles is land and 2 square miles is water.
The parish is mostly flat, with some rolling hills in the northern part of the parish. The soil is mostly sandy loam, with some clay in the northern part of the parish. The climate is humid subtropical, with hot, humid summers and mild winters.
Economy
The economy of East Carroll Parish is largely based on agriculture. The main crops are cotton, corn, soybeans, and rice. The parish is also home to several timber companies, which harvest timber from the area.
The parish is also home to several manufacturing companies, including a paper mill, a furniture factory, and a plastics plant. The parish is also home to several oil and gas companies, which operate in the area.
Demographics
As of the 2010 census, the population of East Carroll Parish was 7,759. The racial makeup of the parish was 65.3% White, 32.2% African American, 0.3% Native American, 0.2% Asian, 0.1% Pacific Islander, 0.7% from other races, and 1.4% from two or more races. Hispanic or Latino of any race were 1.7% of the population.
The median income for a household in the parish was $25,938, and the median income for a family was $32,917. The per capita income for the parish was $14,845. About 22.2% of families and 27.2% of the population were below the poverty line, including 37.2% of those under age 18 and 22.2% of those age 65 or over.
Common Questions
What is the Total Population of East Carroll Parish?
Total Population of East Carroll Parish is 7,371.
What is the Total Male Population of East Carroll Parish?
Total Male Population of East Carroll Parish is 4,122.
What is the Total Female Population of East Carroll Parish?
Total Female Population of East Carroll Parish is 3,249.
What is the Ratio of Males per 100 Females in East Carroll Parish?
There are 126.87 Males per 100 Females in East Carroll Parish.
What is the Ratio of Females per 100 Males in East Carroll Parish?
There are 78.82 Females per 100 Males in East Carroll Parish.
What is the Median Population Age in East Carroll Parish?
Median Population Age in East Carroll Parish is 33.9 Years.
What is the Average Family Size in East Carroll Parish
Average Family Size in East Carroll Parish is 3.0 People.
What is the Average Household Size in East Carroll Parish
Average Household Size in East Carroll Parish is 2.3 People.
What is Per Capita Income in East Carroll Parish?
Per Capita income in East Carroll Parish is $19,646.
What is the Median Family Income in East Carroll Parish?
Median Family Income in East Carroll Parish is $36,875.
What is the Median Household income in East Carroll Parish?
Median Household Income in East Carroll Parish is $30,856.
What is Income or Wage Gap in East Carroll Parish?
Income or Wage Gap in East Carroll Parish is 17.7%.
Women in East Carroll Parish earn 82.3 cents for every dollar earned by a man.
What is Inequality or Gini Index in East Carroll Parish?
Inequality or Gini Index in East Carroll Parish is 0.61.
How Large is the Labor Force in East Carroll Parish?
There are 1,993 People in the Labor Forcein in East Carroll Parish.
What is the Percentage of People in the Labor Force in East Carroll Parish?
33.6% of People are in the Labor Force in East Carroll Parish.
What is the Unemployment Rate in East Carroll Parish?
Unemployment Rate in East Carroll Parish is 15.1%.