East Baton Rouge Parish, LA
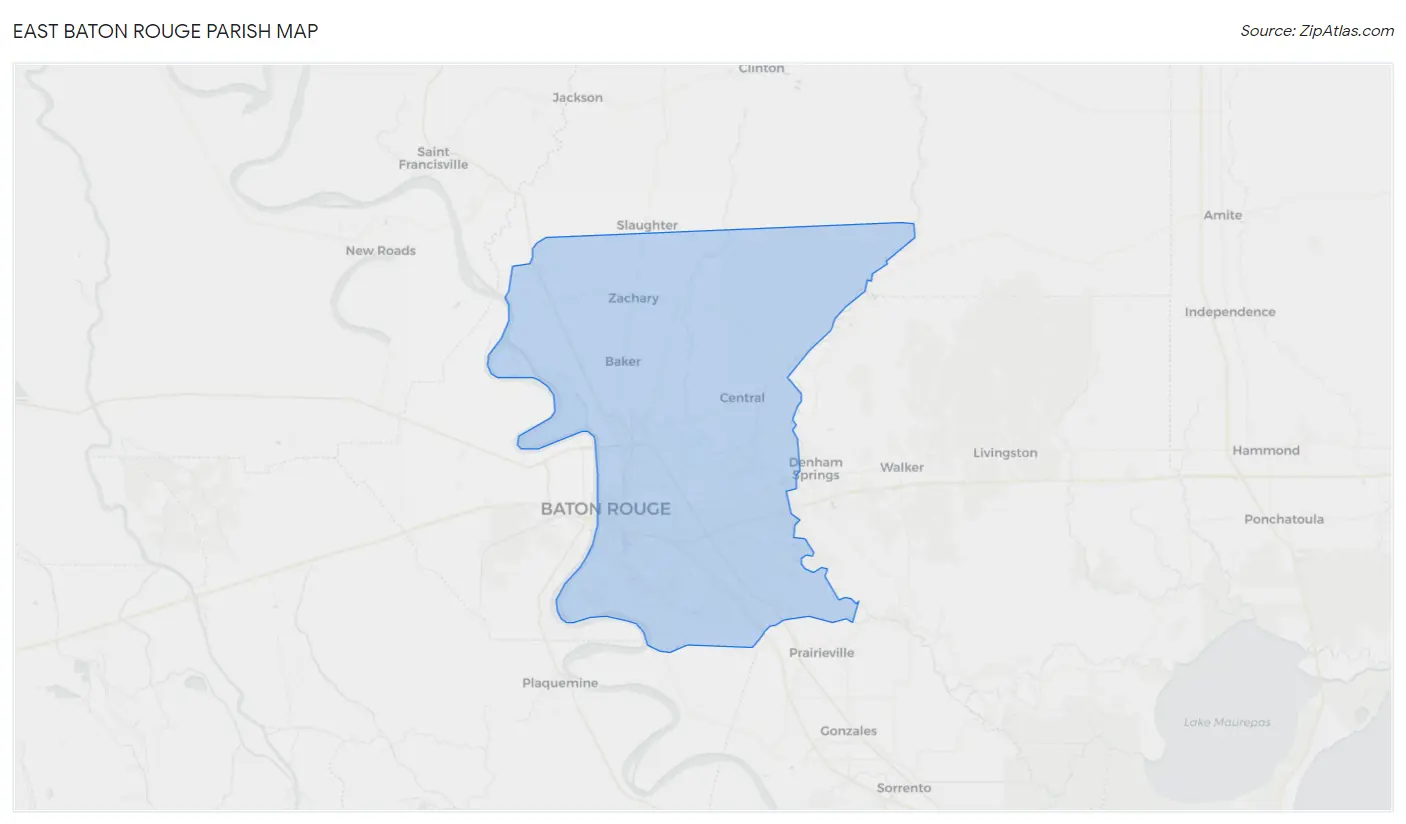
East Baton Rouge Parish Map
East Baton Rouge Parish Overview
454,369
TOTAL POPULATION
217,767
MALE POPULATION
236,602
FEMALE POPULATION
92.04
MALES / 100 FEMALES
108.65
FEMALES / 100 MALES
34.0
MEDIAN AGE
3.3
AVG FAMILY SIZE
2.5
AVG HOUSEHOLD SIZE
$37,540
PER CAPITA INCOME
$82,355
AVG FAMILY INCOME
$62,083
AVG HOUSEHOLD INCOME
35.4%
WAGE / INCOME GAP [ % ]
64.6¢/ $1
WAGE / INCOME GAP [ $ ]
$11,222
FAMILY INCOME DEFICIT
0.51
INEQUALITY / GINI INDEX
234,747
LABOR FORCE [ PEOPLE ]
64.4%
PERCENT IN LABOR FORCE
7.1%
UNEMPLOYMENT RATE
East Baton Rouge Parish Area Codes
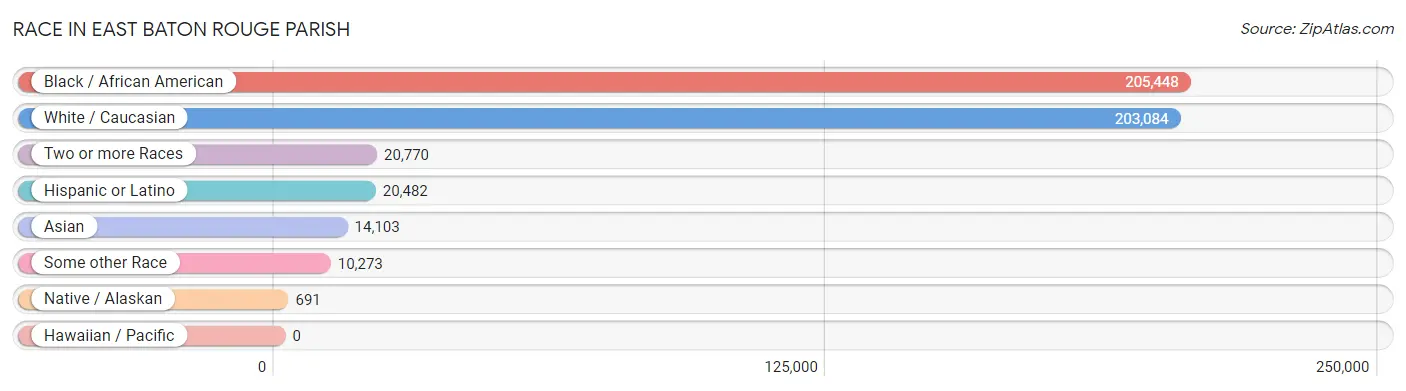
Race in East Baton Rouge Parish
The most populous races in East Baton Rouge Parish are Black / African American (205,448 | 45.2%), White / Caucasian (203,084 | 44.7%), and Two or more Races (20,770 | 4.6%).
| Race | # Population | % Population |
| Asian | 14,103 | 3.1% |
| Black / African American | 205,448 | 45.2% |
| Hawaiian / Pacific | 0 | 0.0% |
| Hispanic or Latino | 20,482 | 4.5% |
| Native / Alaskan | 691 | 0.2% |
| White / Caucasian | 203,084 | 44.7% |
| Two or more Races | 20,770 | 4.6% |
| Some other Race | 10,273 | 2.3% |
| Total | 454,369 | 100.0% |
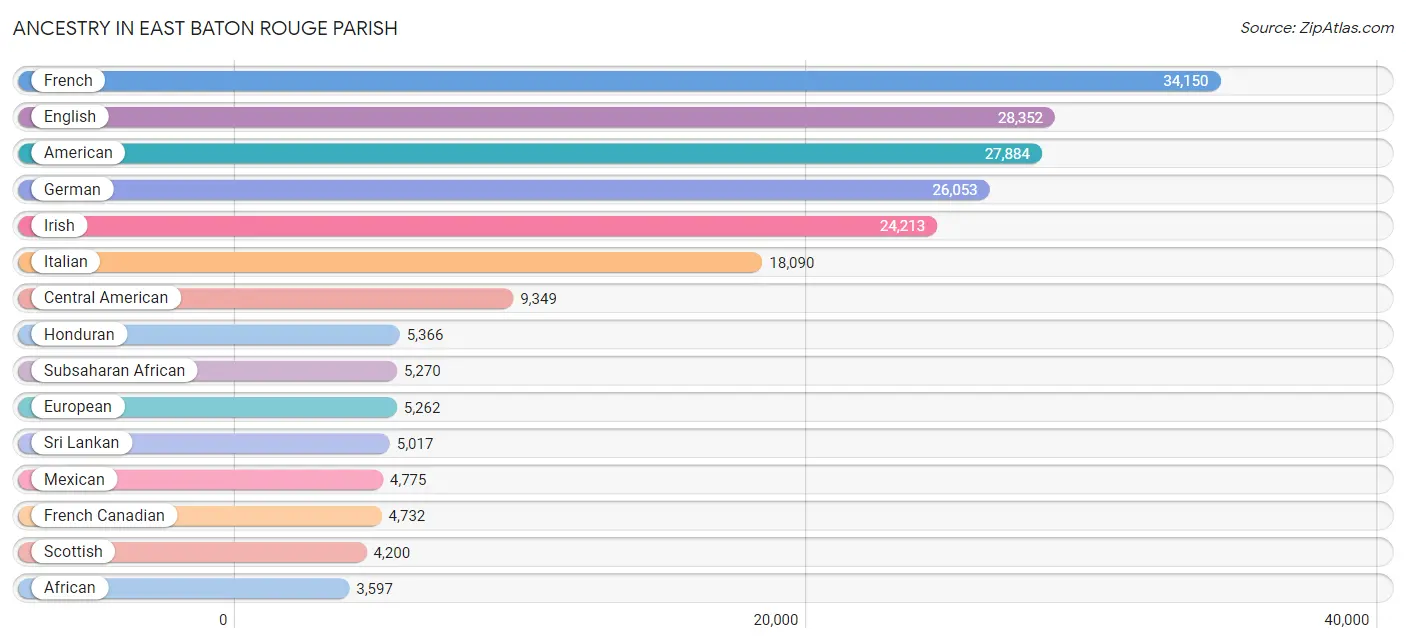
Ancestry in East Baton Rouge Parish
The most populous ancestries reported in East Baton Rouge Parish are French (34,150 | 7.5%), English (28,352 | 6.2%), American (27,884 | 6.1%), German (26,053 | 5.7%), and Irish (24,213 | 5.3%), together accounting for 31.0% of all East Baton Rouge Parish residents.
| Ancestry | # Population | % Population |
| African | 3,597 | 0.8% |
| Alaska Native | 20 | 0.0% |
| American | 27,884 | 6.1% |
| Arab | 3,534 | 0.8% |
| Argentinean | 28 | 0.0% |
| Armenian | 79 | 0.0% |
| Australian | 168 | 0.0% |
| Austrian | 163 | 0.0% |
| Bahamian | 8 | 0.0% |
| Basque | 22 | 0.0% |
| Belgian | 517 | 0.1% |
| Belizean | 59 | 0.0% |
| Bhutanese | 816 | 0.2% |
| Blackfeet | 18 | 0.0% |
| Bolivian | 10 | 0.0% |
| Brazilian | 512 | 0.1% |
| British | 1,452 | 0.3% |
| Bulgarian | 106 | 0.0% |
| Burmese | 785 | 0.2% |
| Cajun | 2,180 | 0.5% |
| Canadian | 180 | 0.0% |
| Cape Verdean | 20 | 0.0% |
| Celtic | 6 | 0.0% |
| Central American | 9,349 | 2.1% |
| Central American Indian | 165 | 0.0% |
| Cherokee | 584 | 0.1% |
| Chickasaw | 62 | 0.0% |
| Chilean | 121 | 0.0% |
| Choctaw | 763 | 0.2% |
| Colombian | 427 | 0.1% |
| Comanche | 8 | 0.0% |
| Costa Rican | 137 | 0.0% |
| Creek | 23 | 0.0% |
| Croatian | 155 | 0.0% |
| Cuban | 632 | 0.1% |
| Czech | 407 | 0.1% |
| Czechoslovakian | 44 | 0.0% |
| Danish | 240 | 0.1% |
| Dominican | 355 | 0.1% |
| Dutch | 1,381 | 0.3% |
| Eastern European | 368 | 0.1% |
| Ecuadorian | 78 | 0.0% |
| Egyptian | 405 | 0.1% |
| English | 28,352 | 6.2% |
| Estonian | 9 | 0.0% |
| Ethiopian | 44 | 0.0% |
| European | 5,262 | 1.2% |
| Filipino | 111 | 0.0% |
| Finnish | 252 | 0.1% |
| French | 34,150 | 7.5% |
| French American Indian | 98 | 0.0% |
| French Canadian | 4,732 | 1.0% |
| German | 26,053 | 5.7% |
| Ghanaian | 209 | 0.1% |
| Greek | 685 | 0.2% |
| Guamanian / Chamorro | 8 | 0.0% |
| Guatemalan | 1,245 | 0.3% |
| Guyanese | 223 | 0.1% |
| Haitian | 340 | 0.1% |
| Honduran | 5,366 | 1.2% |
| Houma | 425 | 0.1% |
| Hungarian | 587 | 0.1% |
| Indian (Asian) | 3,214 | 0.7% |
| Iranian | 327 | 0.1% |
| Iraqi | 132 | 0.0% |
| Irish | 24,213 | 5.3% |
| Iroquois | 62 | 0.0% |
| Israeli | 456 | 0.1% |
| Italian | 18,090 | 4.0% |
| Jamaican | 274 | 0.1% |
| Jordanian | 103 | 0.0% |
| Korean | 2,745 | 0.6% |
| Laotian | 486 | 0.1% |
| Latvian | 8 | 0.0% |
| Lebanese | 987 | 0.2% |
| Lithuanian | 238 | 0.1% |
| Macedonian | 28 | 0.0% |
| Malaysian | 526 | 0.1% |
| Menominee | 43 | 0.0% |
| Mexican | 4,775 | 1.1% |
| Mexican American Indian | 38 | 0.0% |
| Mongolian | 13 | 0.0% |
| Moroccan | 32 | 0.0% |
| Native Hawaiian | 52 | 0.0% |
| Nicaraguan | 804 | 0.2% |
| Nigerian | 840 | 0.2% |
| Northern European | 278 | 0.1% |
| Norwegian | 1,111 | 0.2% |
| Pakistani | 164 | 0.0% |
| Palestinian | 213 | 0.1% |
| Panamanian | 99 | 0.0% |
| Paraguayan | 1 | 0.0% |
| Pennsylvania German | 37 | 0.0% |
| Peruvian | 64 | 0.0% |
| Polish | 1,845 | 0.4% |
| Portuguese | 272 | 0.1% |
| Potawatomi | 32 | 0.0% |
| Pueblo | 16 | 0.0% |
| Puerto Rican | 1,127 | 0.3% |
| Romanian | 205 | 0.1% |
| Russian | 681 | 0.2% |
| Salvadoran | 1,698 | 0.4% |
| Samoan | 15 | 0.0% |
| Scandinavian | 953 | 0.2% |
| Scotch-Irish | 3,492 | 0.8% |
| Scottish | 4,200 | 0.9% |
| Serbian | 10 | 0.0% |
| Slavic | 8 | 0.0% |
| Slovak | 314 | 0.1% |
| Slovene | 44 | 0.0% |
| South African | 11 | 0.0% |
| South American | 1,132 | 0.3% |
| South American Indian | 50 | 0.0% |
| Spaniard | 580 | 0.1% |
| Spanish | 1,224 | 0.3% |
| Spanish American Indian | 73 | 0.0% |
| Sri Lankan | 5,017 | 1.1% |
| Subsaharan African | 5,270 | 1.2% |
| Sudanese | 22 | 0.0% |
| Swedish | 1,607 | 0.4% |
| Swiss | 610 | 0.1% |
| Syrian | 99 | 0.0% |
| Thai | 3,067 | 0.7% |
| Trinidadian and Tobagonian | 52 | 0.0% |
| Turkish | 268 | 0.1% |
| Ugandan | 106 | 0.0% |
| Ukrainian | 397 | 0.1% |
| Ute | 4 | 0.0% |
| Venezuelan | 403 | 0.1% |
| Vietnamese | 143 | 0.0% |
| Welsh | 1,895 | 0.4% |
| West Indian | 68 | 0.0% |
| Zimbabwean | 22 | 0.0% | View All 133 Rows |
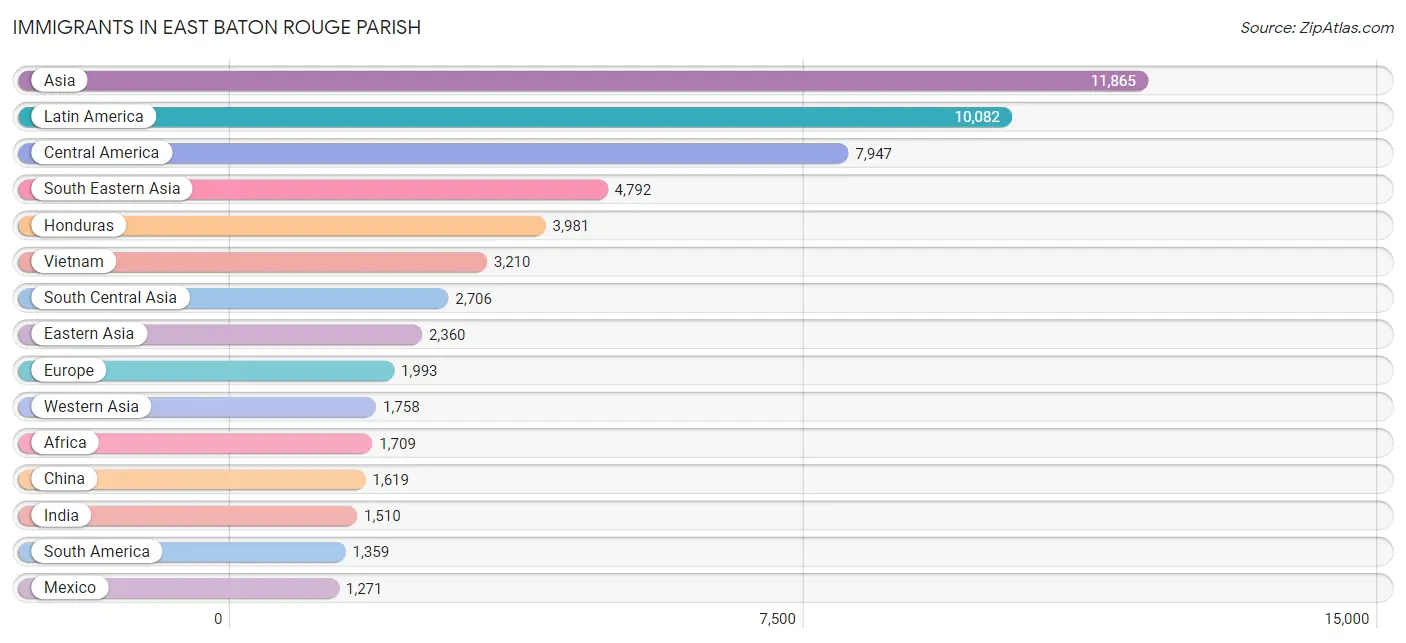
Immigrants in East Baton Rouge Parish
The most numerous immigrant groups reported in East Baton Rouge Parish came from Asia (11,865 | 2.6%), Latin America (10,082 | 2.2%), Central America (7,947 | 1.8%), South Eastern Asia (4,792 | 1.1%), and Honduras (3,981 | 0.9%), together accounting for 8.5% of all East Baton Rouge Parish residents.
| Immigration Origin | # Population | % Population |
| Africa | 1,709 | 0.4% |
| Argentina | 10 | 0.0% |
| Asia | 11,865 | 2.6% |
| Australia | 184 | 0.0% |
| Bangladesh | 618 | 0.1% |
| Belgium | 128 | 0.0% |
| Belize | 31 | 0.0% |
| Bolivia | 10 | 0.0% |
| Brazil | 541 | 0.1% |
| Bulgaria | 106 | 0.0% |
| Cameroon | 252 | 0.1% |
| Canada | 335 | 0.1% |
| Caribbean | 776 | 0.2% |
| Central America | 7,947 | 1.8% |
| Chile | 119 | 0.0% |
| China | 1,619 | 0.4% |
| Colombia | 160 | 0.0% |
| Costa Rica | 141 | 0.0% |
| Croatia | 122 | 0.0% |
| Cuba | 374 | 0.1% |
| Czechoslovakia | 9 | 0.0% |
| Denmark | 4 | 0.0% |
| Dominican Republic | 209 | 0.1% |
| Eastern Africa | 322 | 0.1% |
| Eastern Asia | 2,360 | 0.5% |
| Eastern Europe | 842 | 0.2% |
| Ecuador | 70 | 0.0% |
| Egypt | 244 | 0.1% |
| El Salvador | 1,208 | 0.3% |
| England | 165 | 0.0% |
| Ethiopia | 108 | 0.0% |
| Europe | 1,993 | 0.4% |
| France | 9 | 0.0% |
| Germany | 514 | 0.1% |
| Ghana | 132 | 0.0% |
| Guatemala | 676 | 0.2% |
| Guyana | 258 | 0.1% |
| Haiti | 21 | 0.0% |
| Honduras | 3,981 | 0.9% |
| Hong Kong | 109 | 0.0% |
| Hungary | 18 | 0.0% |
| India | 1,510 | 0.3% |
| Indonesia | 179 | 0.0% |
| Iran | 301 | 0.1% |
| Iraq | 222 | 0.1% |
| Ireland | 51 | 0.0% |
| Israel | 88 | 0.0% |
| Italy | 81 | 0.0% |
| Jamaica | 96 | 0.0% |
| Japan | 294 | 0.1% |
| Jordan | 150 | 0.0% |
| Kazakhstan | 45 | 0.0% |
| Kenya | 15 | 0.0% |
| Korea | 447 | 0.1% |
| Kuwait | 102 | 0.0% |
| Laos | 57 | 0.0% |
| Latin America | 10,082 | 2.2% |
| Lebanon | 170 | 0.0% |
| Lithuania | 29 | 0.0% |
| Malaysia | 56 | 0.0% |
| Mexico | 1,271 | 0.3% |
| Middle Africa | 252 | 0.1% |
| Morocco | 69 | 0.0% |
| Nepal | 150 | 0.0% |
| Netherlands | 36 | 0.0% |
| Nicaragua | 544 | 0.1% |
| Nigeria | 294 | 0.1% |
| Northern Africa | 494 | 0.1% |
| Northern Europe | 358 | 0.1% |
| Norway | 16 | 0.0% |
| Oceania | 228 | 0.1% |
| Pakistan | 38 | 0.0% |
| Panama | 92 | 0.0% |
| Peru | 27 | 0.0% |
| Philippines | 1,061 | 0.2% |
| Poland | 8 | 0.0% |
| Romania | 60 | 0.0% |
| Russia | 271 | 0.1% |
| Saudi Arabia | 84 | 0.0% |
| Scotland | 14 | 0.0% |
| Senegal | 3 | 0.0% |
| Singapore | 10 | 0.0% |
| South Africa | 97 | 0.0% |
| South America | 1,359 | 0.3% |
| South Central Asia | 2,706 | 0.6% |
| South Eastern Asia | 4,792 | 1.1% |
| Southern Europe | 106 | 0.0% |
| Spain | 25 | 0.0% |
| Sri Lanka | 44 | 0.0% |
| Sudan | 47 | 0.0% |
| Sweden | 28 | 0.0% |
| Syria | 126 | 0.0% |
| Taiwan | 82 | 0.0% |
| Thailand | 219 | 0.1% |
| Trinidad and Tobago | 76 | 0.0% |
| Turkey | 186 | 0.0% |
| Uganda | 106 | 0.0% |
| Ukraine | 219 | 0.1% |
| Venezuela | 155 | 0.0% |
| Vietnam | 3,210 | 0.7% |
| Western Africa | 440 | 0.1% |
| Western Asia | 1,758 | 0.4% |
| Western Europe | 687 | 0.2% |
| Yemen | 553 | 0.1% |
| Zimbabwe | 69 | 0.0% | View All 105 Rows |
Sex and Age in East Baton Rouge Parish
Sex and Age in East Baton Rouge Parish
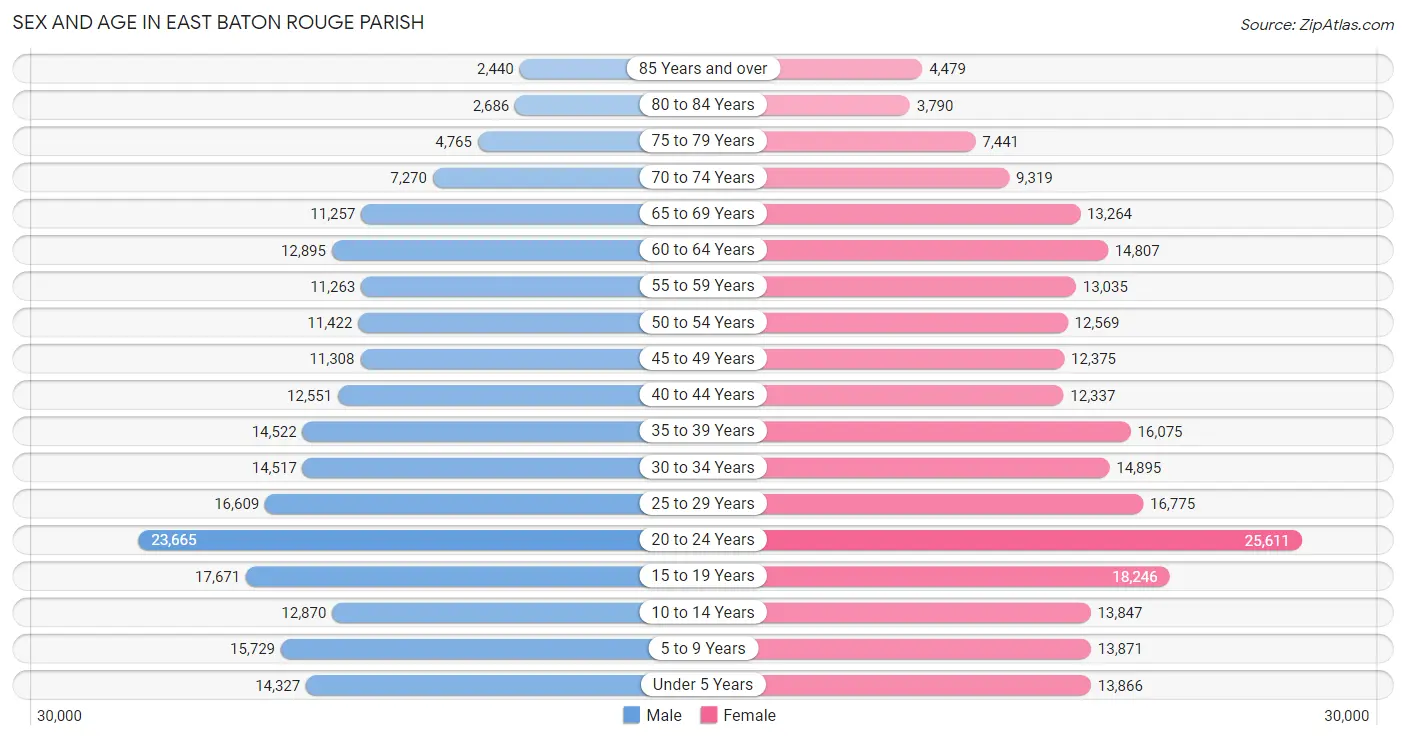
The most populous age groups in East Baton Rouge Parish are 20 to 24 Years (23,665 | 10.9%) for men and 20 to 24 Years (25,611 | 10.8%) for women.
| Age Bracket | Male | Female |
| Under 5 Years | 14,327 (6.6%) | 13,866 (5.9%) |
| 5 to 9 Years | 15,729 (7.2%) | 13,871 (5.9%) |
| 10 to 14 Years | 12,870 (5.9%) | 13,847 (5.9%) |
| 15 to 19 Years | 17,671 (8.1%) | 18,246 (7.7%) |
| 20 to 24 Years | 23,665 (10.9%) | 25,611 (10.8%) |
| 25 to 29 Years | 16,609 (7.6%) | 16,775 (7.1%) |
| 30 to 34 Years | 14,517 (6.7%) | 14,895 (6.3%) |
| 35 to 39 Years | 14,522 (6.7%) | 16,075 (6.8%) |
| 40 to 44 Years | 12,551 (5.8%) | 12,337 (5.2%) |
| 45 to 49 Years | 11,308 (5.2%) | 12,375 (5.2%) |
| 50 to 54 Years | 11,422 (5.2%) | 12,569 (5.3%) |
| 55 to 59 Years | 11,263 (5.2%) | 13,035 (5.5%) |
| 60 to 64 Years | 12,895 (5.9%) | 14,807 (6.3%) |
| 65 to 69 Years | 11,257 (5.2%) | 13,264 (5.6%) |
| 70 to 74 Years | 7,270 (3.3%) | 9,319 (3.9%) |
| 75 to 79 Years | 4,765 (2.2%) | 7,441 (3.1%) |
| 80 to 84 Years | 2,686 (1.2%) | 3,790 (1.6%) |
| 85 Years and over | 2,440 (1.1%) | 4,479 (1.9%) |
| Total | 217,767 (100.0%) | 236,602 (100.0%) |
Families and Households in East Baton Rouge Parish
Median Family Size in East Baton Rouge Parish
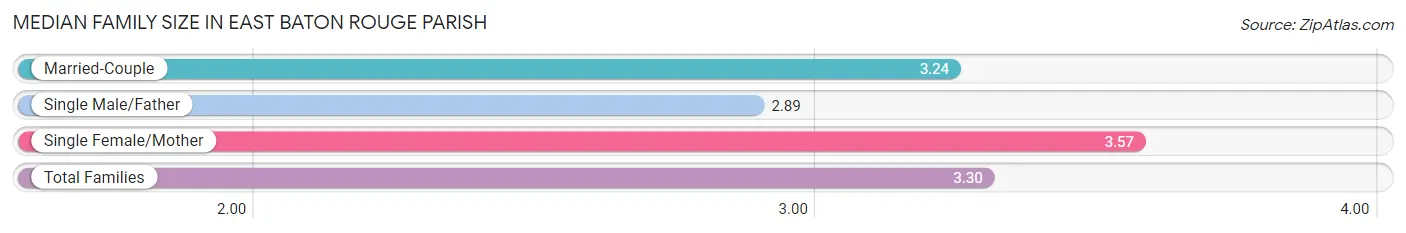
The median family size in East Baton Rouge Parish is 3.30 persons per family, with single female/mother families (28,753 | 28.0%) accounting for the largest median family size of 3.57 persons per family. On the other hand, single male/father families (8,675 | 8.5%) represent the smallest median family size with 2.89 persons per family.
| Family Type | # Families | Family Size |
| Married-Couple | 65,173 (63.5%) | 3.24 |
| Single Male/Father | 8,675 (8.5%) | 2.89 |
| Single Female/Mother | 28,753 (28.0%) | 3.57 |
| Total Families | 102,601 (100.0%) | 3.30 |
Median Household Size in East Baton Rouge Parish
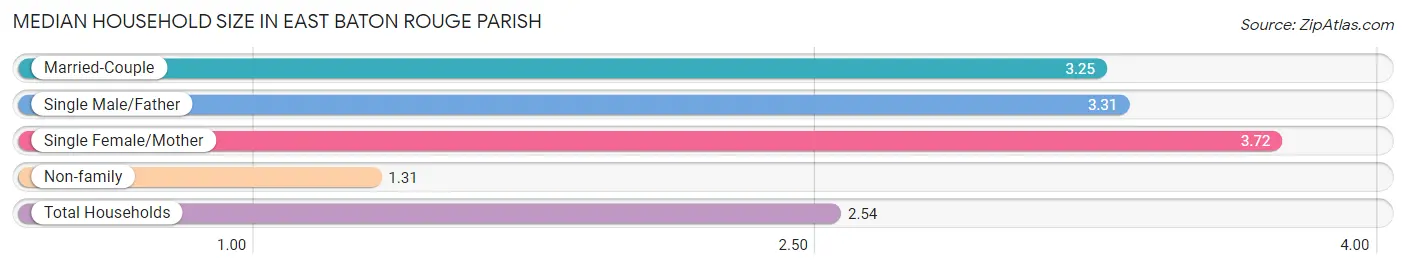
The median household size in East Baton Rouge Parish is 2.54 persons per household, with single female/mother households (28,753 | 16.5%) accounting for the largest median household size of 3.72 persons per household. non-family households (71,191 | 41.0%) represent the smallest median household size with 1.31 persons per household.
| Household Type | # Households | Household Size |
| Married-Couple | 65,173 (37.5%) | 3.25 |
| Single Male/Father | 8,675 (5.0%) | 3.31 |
| Single Female/Mother | 28,753 (16.5%) | 3.72 |
| Non-family | 71,191 (41.0%) | 1.31 |
| Total Households | 173,792 (100.0%) | 2.54 |
Household Size by Marriage Status in East Baton Rouge Parish
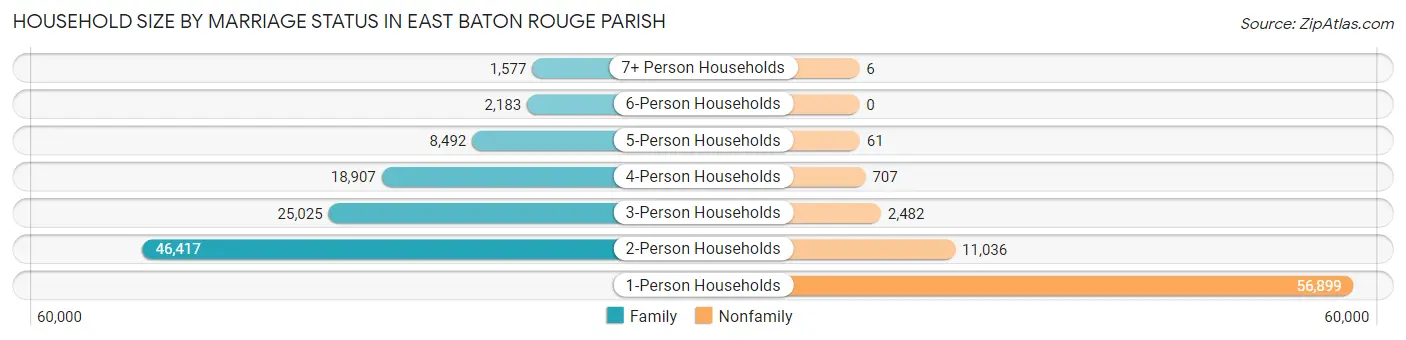
Out of a total of 173,792 households in East Baton Rouge Parish, 102,601 (59.0%) are family households, while 71,191 (41.0%) are nonfamily households. The most numerous type of family households are 2-person households, comprising 46,417, and the most common type of nonfamily households are 1-person households, comprising 56,899.
| Household Size | Family Households | Nonfamily Households |
| 1-Person Households | - | 56,899 (32.7%) |
| 2-Person Households | 46,417 (26.7%) | 11,036 (6.4%) |
| 3-Person Households | 25,025 (14.4%) | 2,482 (1.4%) |
| 4-Person Households | 18,907 (10.9%) | 707 (0.4%) |
| 5-Person Households | 8,492 (4.9%) | 61 (0.0%) |
| 6-Person Households | 2,183 (1.3%) | 0 (0.0%) |
| 7+ Person Households | 1,577 (0.9%) | 6 (0.0%) |
| Total | 102,601 (59.0%) | 71,191 (41.0%) |
Female Fertility in East Baton Rouge Parish
Fertility by Age in East Baton Rouge Parish
Average fertility rate in East Baton Rouge Parish is 46.0 births per 1,000 women. Women in the age bracket of 20 to 34 years have the highest fertility rate with 70.0 births per 1,000 women. Women in the age bracket of 20 to 34 years acount for 73.5% of all women with births.
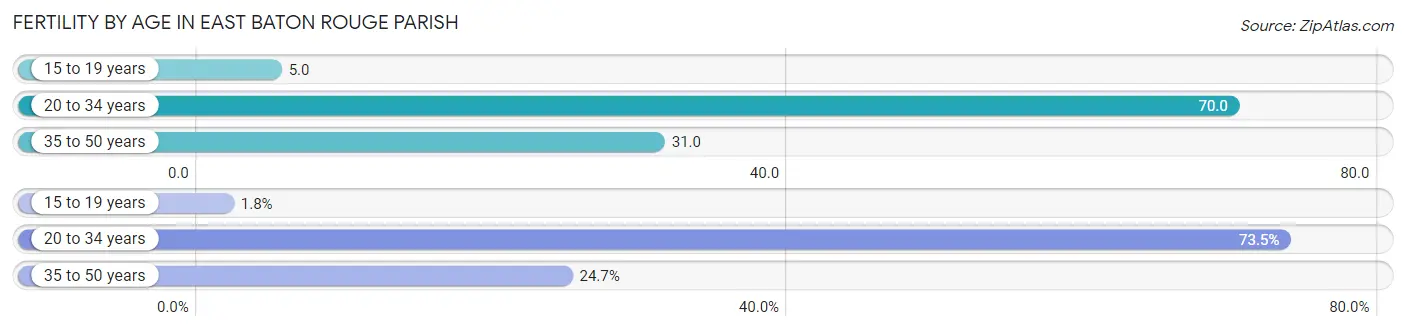
| Age Bracket | Women with Births | Births / 1,000 Women |
| 15 to 19 years | 96 (1.8%) | 5.0 |
| 20 to 34 years | 4,025 (73.5%) | 70.0 |
| 35 to 50 years | 1,355 (24.7%) | 31.0 |
| Total | 5,476 (100.0%) | 46.0 |
Fertility by Age by Marriage Status in East Baton Rouge Parish
50.0% of women with births (5,476) in East Baton Rouge Parish are married. The highest percentage of unmarried women with births falls into 15 to 19 years age bracket with 100.0% of them unmarried at the time of birth, while the lowest percentage of unmarried women with births belong to 35 to 50 years age bracket with 20.5% of them unmarried.
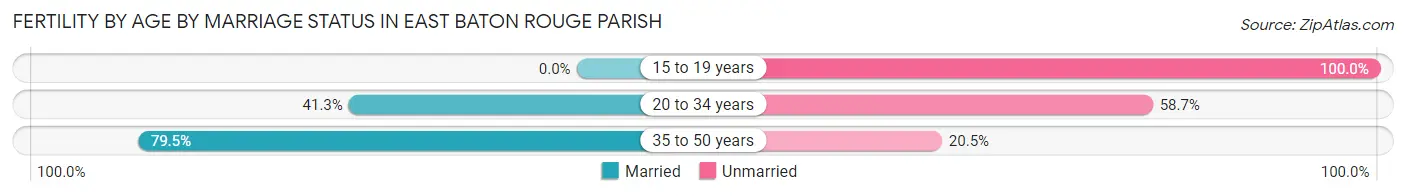
| Age Bracket | Married | Unmarried |
| 15 to 19 years | 0 (0.0%) | 96 (100.0%) |
| 20 to 34 years | 1,662 (41.3%) | 2,363 (58.7%) |
| 35 to 50 years | 1,077 (79.5%) | 278 (20.5%) |
| Total | 2,738 (50.0%) | 2,738 (50.0%) |
Fertility by Education in East Baton Rouge Parish
Average fertility rate in East Baton Rouge Parish is 46.0 births per 1,000 women. Women with the education attainment of bachelor's degree have the highest fertility rate of 62.0 births per 1,000 women, while women with the education attainment of less than high school have the lowest fertility at 31.0 births per 1,000 women. Women with the education attainment of bachelor's degree represent 28.1% of all women with births.
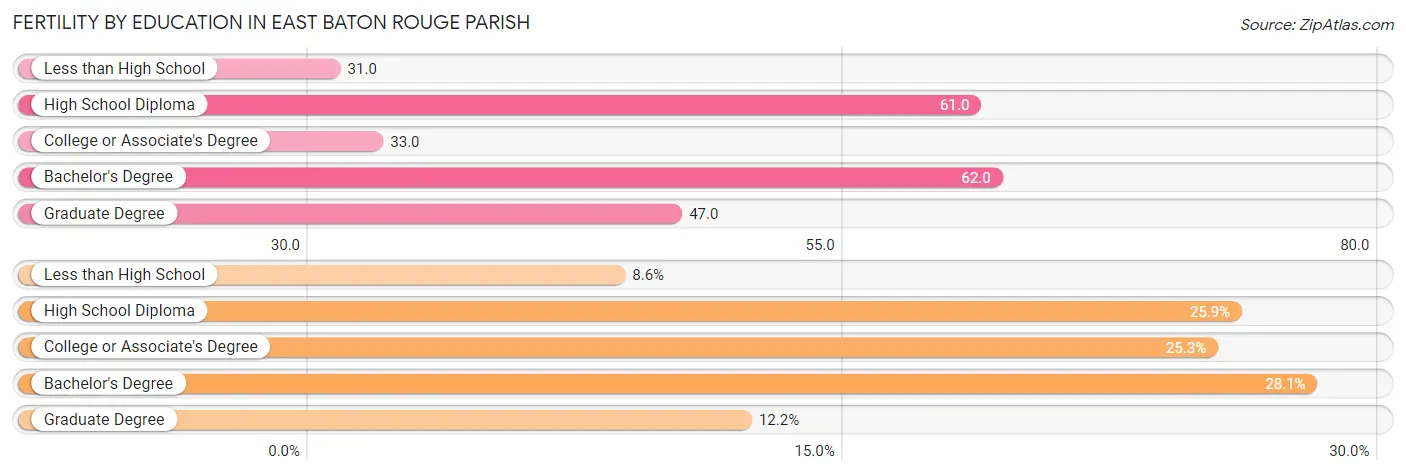
| Educational Attainment | Women with Births | Births / 1,000 Women |
| Less than High School | 471 (8.6%) | 31.0 |
| High School Diploma | 1,420 (25.9%) | 61.0 |
| College or Associate's Degree | 1,383 (25.3%) | 33.0 |
| Bachelor's Degree | 1,536 (28.1%) | 62.0 |
| Graduate Degree | 666 (12.2%) | 47.0 |
| Total | 5,476 (100.0%) | 46.0 |
Fertility by Education by Marriage Status in East Baton Rouge Parish
50.0% of women with births in East Baton Rouge Parish are unmarried. Women with the educational attainment of bachelor's degree are most likely to be married with 87.8% of them married at childbirth, while women with the educational attainment of high school diploma are least likely to be married with 85.7% of them unmarried at childbirth.
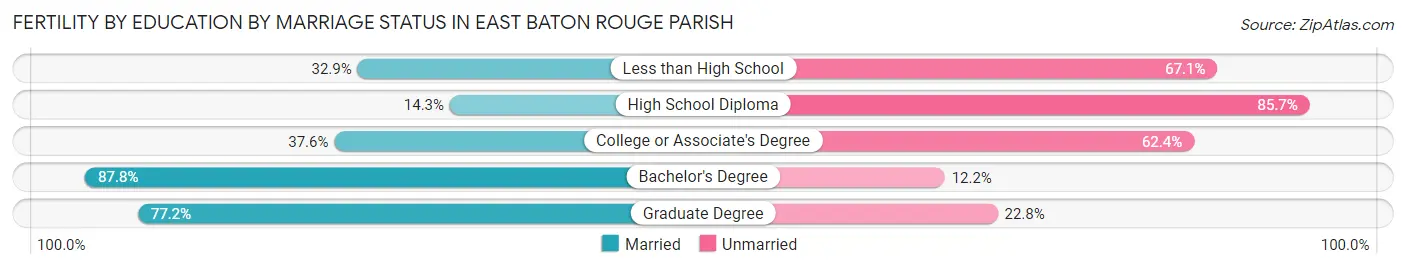
| Educational Attainment | Married | Unmarried |
| Less than High School | 155 (32.9%) | 316 (67.1%) |
| High School Diploma | 203 (14.3%) | 1,217 (85.7%) |
| College or Associate's Degree | 520 (37.6%) | 863 (62.4%) |
| Bachelor's Degree | 1,349 (87.8%) | 187 (12.2%) |
| Graduate Degree | 514 (77.2%) | 152 (22.8%) |
| Total | 2,738 (50.0%) | 2,738 (50.0%) |
Income in East Baton Rouge Parish
Income Overview in East Baton Rouge Parish
Per Capita Income in East Baton Rouge Parish is $37,540, while median incomes of families and households are $82,355 and $62,083 respectively.
| Characteristic | Number | Measure |
| Per Capita Income | 454,369 | $37,540 |
| Median Family Income | 102,601 | $82,355 |
| Mean Family Income | 102,601 | $114,976 |
| Median Household Income | 173,792 | $62,083 |
| Mean Household Income | 173,792 | $93,990 |
| Income Deficit | 102,601 | $11,222 |
| Wage / Income Gap (%) | 454,369 | 35.45% |
| Wage / Income Gap ($) | 454,369 | 64.55¢ per $1 |
| Gini / Inequality Index | 454,369 | 0.51 |
Earnings by Sex in East Baton Rouge Parish
Average Earnings in East Baton Rouge Parish are $37,043, $46,954 for men and $30,311 for women, a difference of 35.4%.
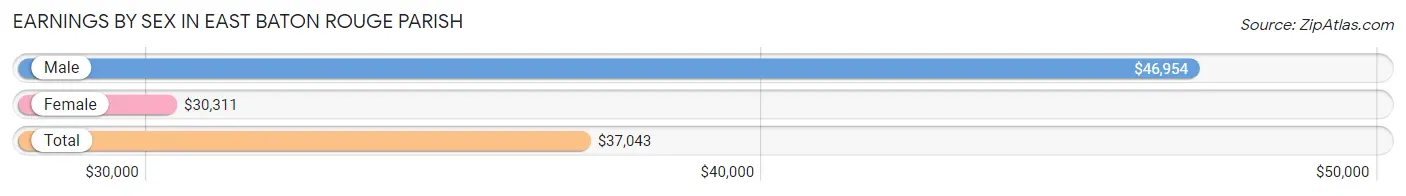
| Sex | Number | Average Earnings |
| Male | 122,834 (50.4%) | $46,954 |
| Female | 120,985 (49.6%) | $30,311 |
| Total | 243,819 (100.0%) | $37,043 |
Earnings by Sex by Income Bracket in East Baton Rouge Parish
The most common earnings brackets in East Baton Rouge Parish are $100,000+ for men (23,607 | 19.2%) and $55,000 to $64,999 for women (8,849 | 7.3%).
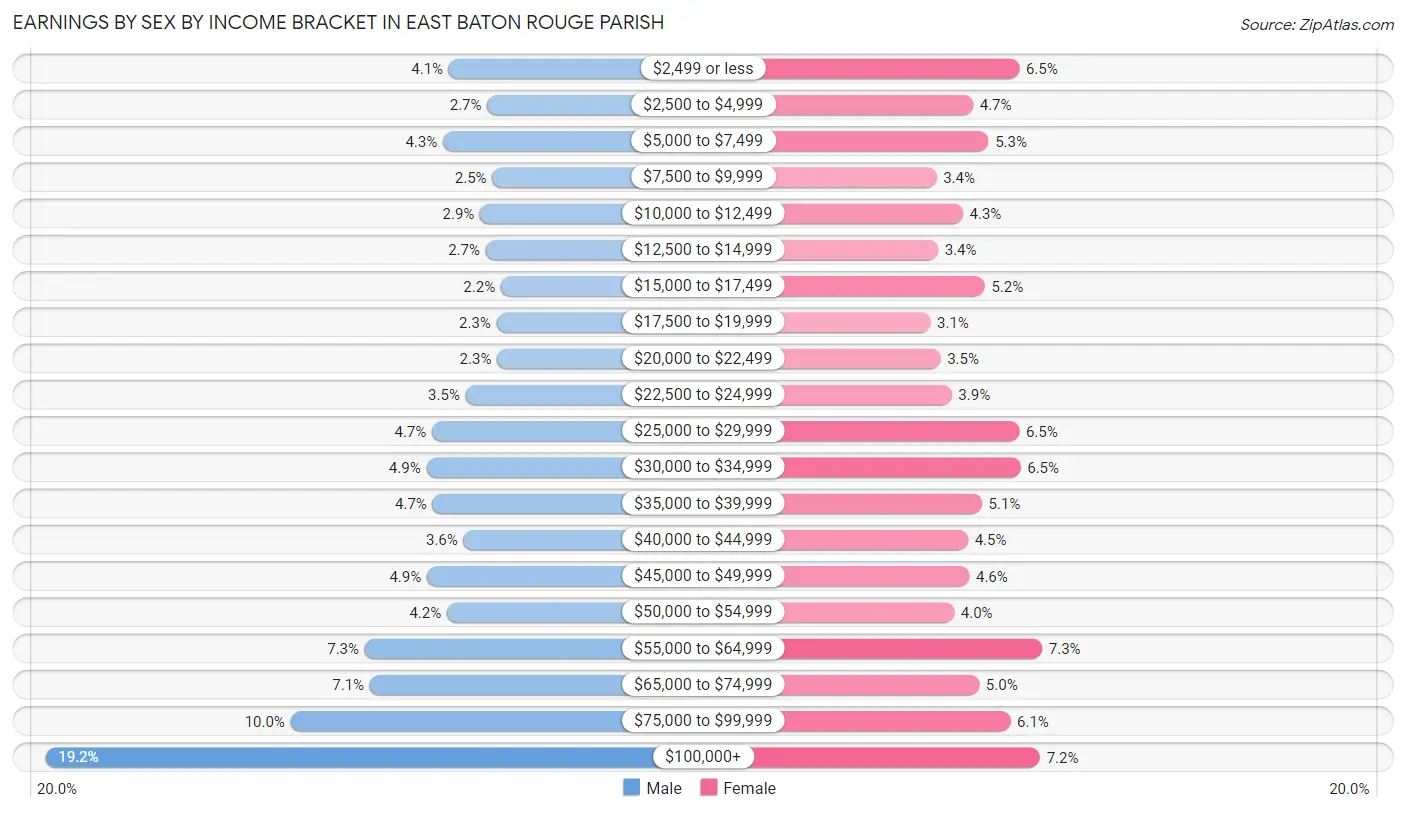
| Income | Male | Female |
| $2,499 or less | 5,031 (4.1%) | 7,799 (6.5%) |
| $2,500 to $4,999 | 3,267 (2.7%) | 5,712 (4.7%) |
| $5,000 to $7,499 | 5,312 (4.3%) | 6,414 (5.3%) |
| $7,500 to $9,999 | 3,036 (2.5%) | 4,051 (3.4%) |
| $10,000 to $12,499 | 3,604 (2.9%) | 5,251 (4.3%) |
| $12,500 to $14,999 | 3,341 (2.7%) | 4,121 (3.4%) |
| $15,000 to $17,499 | 2,642 (2.1%) | 6,243 (5.2%) |
| $17,500 to $19,999 | 2,840 (2.3%) | 3,776 (3.1%) |
| $20,000 to $22,499 | 2,812 (2.3%) | 4,238 (3.5%) |
| $22,500 to $24,999 | 4,265 (3.5%) | 4,740 (3.9%) |
| $25,000 to $29,999 | 5,809 (4.7%) | 7,803 (6.5%) |
| $30,000 to $34,999 | 6,074 (4.9%) | 7,861 (6.5%) |
| $35,000 to $39,999 | 5,788 (4.7%) | 6,107 (5.1%) |
| $40,000 to $44,999 | 4,357 (3.5%) | 5,483 (4.5%) |
| $45,000 to $49,999 | 6,043 (4.9%) | 5,544 (4.6%) |
| $50,000 to $54,999 | 5,122 (4.2%) | 4,856 (4.0%) |
| $55,000 to $64,999 | 8,903 (7.2%) | 8,849 (7.3%) |
| $65,000 to $74,999 | 8,666 (7.1%) | 5,993 (5.0%) |
| $75,000 to $99,999 | 12,315 (10.0%) | 7,401 (6.1%) |
| $100,000+ | 23,607 (19.2%) | 8,743 (7.2%) |
| Total | 122,834 (100.0%) | 120,985 (100.0%) |
Earnings by Sex by Educational Attainment in East Baton Rouge Parish
Average earnings in East Baton Rouge Parish are $58,215 for men and $37,964 for women, a difference of 34.8%. Men with an educational attainment of graduate degree enjoy the highest average annual earnings of $92,838, while those with less than high school education earn the least with $33,980. Women with an educational attainment of graduate degree earn the most with the average annual earnings of $56,916, while those with less than high school education have the smallest earnings of $22,333.
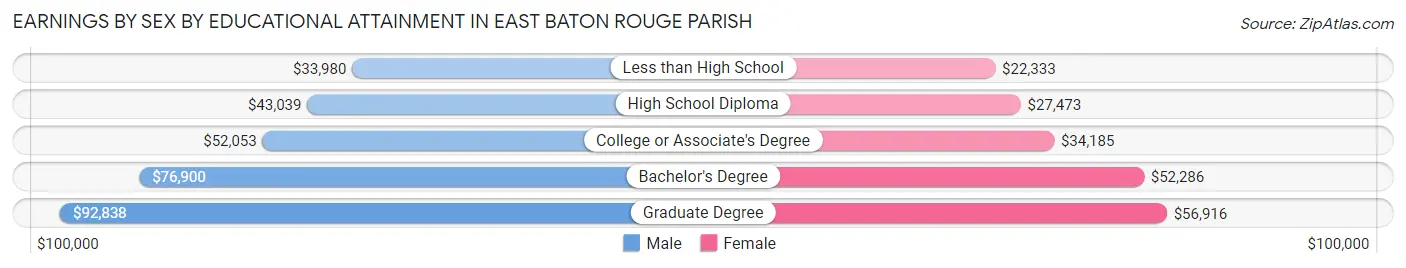
| Educational Attainment | Male Income | Female Income |
| Less than High School | $33,980 | $22,333 |
| High School Diploma | $43,039 | $27,473 |
| College or Associate's Degree | $52,053 | $34,185 |
| Bachelor's Degree | $76,900 | $52,286 |
| Graduate Degree | $92,838 | $56,916 |
| Total | $58,215 | $37,964 |
Family Income in East Baton Rouge Parish
Family Income Brackets in East Baton Rouge Parish
According to the East Baton Rouge Parish family income data, there are 18,160 families falling into the $100,000 to $149,999 income range, which is the most common income bracket and makes up 17.7% of all families. Conversely, the $10,000 to $14,999 income bracket is the least frequent group with only 2,770 families (2.7%) belonging to this category.
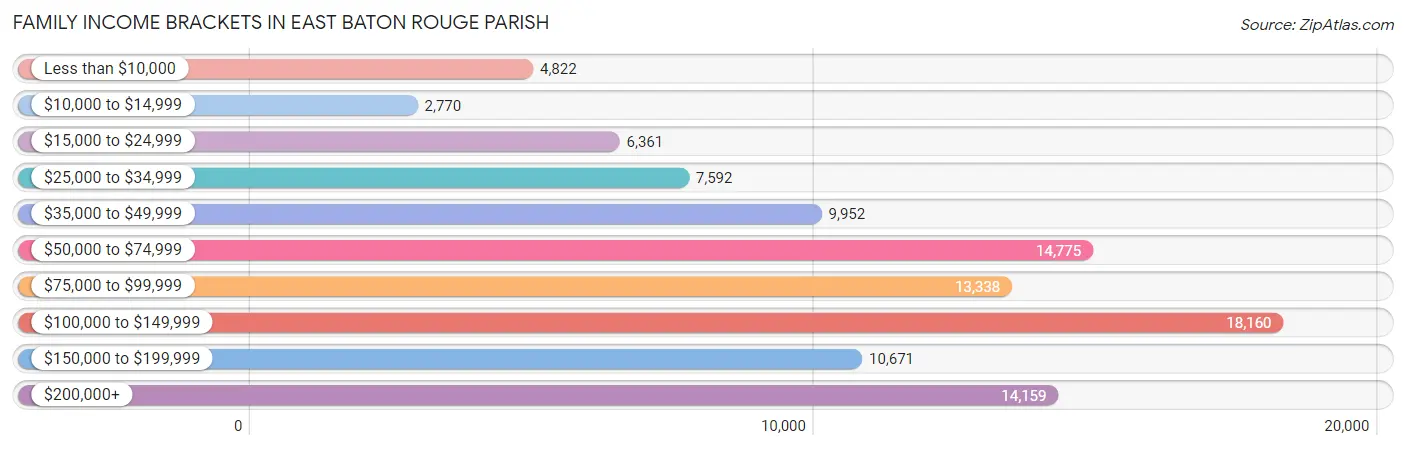
| Income Bracket | # Families | % Families |
| Less than $10,000 | 4,822 | 4.7% |
| $10,000 to $14,999 | 2,770 | 2.7% |
| $15,000 to $24,999 | 6,361 | 6.2% |
| $25,000 to $34,999 | 7,592 | 7.4% |
| $35,000 to $49,999 | 9,952 | 9.7% |
| $50,000 to $74,999 | 14,775 | 14.4% |
| $75,000 to $99,999 | 13,338 | 13.0% |
| $100,000 to $149,999 | 18,160 | 17.7% |
| $150,000 to $199,999 | 10,671 | 10.4% |
| $200,000+ | 14,159 | 13.8% |
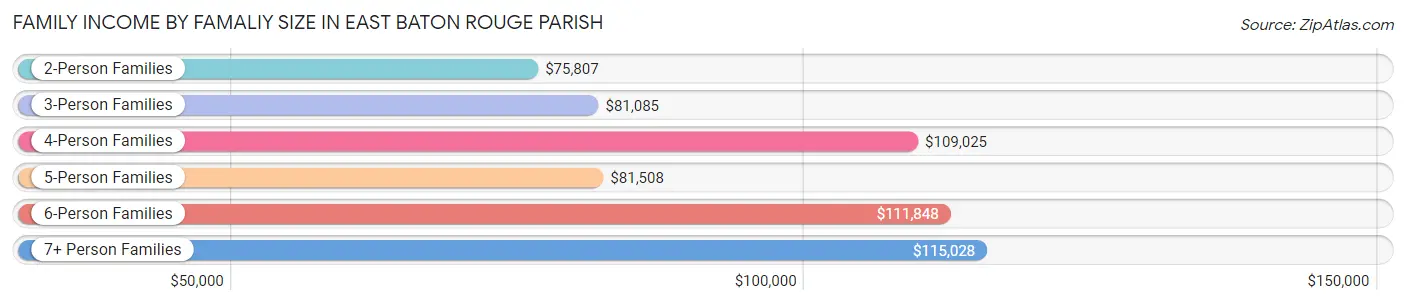
Family Income by Famaliy Size in East Baton Rouge Parish
7+ person families (1,423 | 1.4%) account for the highest median family income in East Baton Rouge Parish with $115,028 per family, while 2-person families (50,016 | 48.7%) have the highest median income of $37,904 per family member.
| Income Bracket | # Families | Median Income |
| 2-Person Families | 50,016 (48.7%) | $75,807 |
| 3-Person Families | 24,104 (23.5%) | $81,085 |
| 4-Person Families | 17,381 (16.9%) | $109,025 |
| 5-Person Families | 7,657 (7.5%) | $81,508 |
| 6-Person Families | 2,020 (2.0%) | $111,848 |
| 7+ Person Families | 1,423 (1.4%) | $115,028 |
| Total | 102,601 (100.0%) | $82,355 |
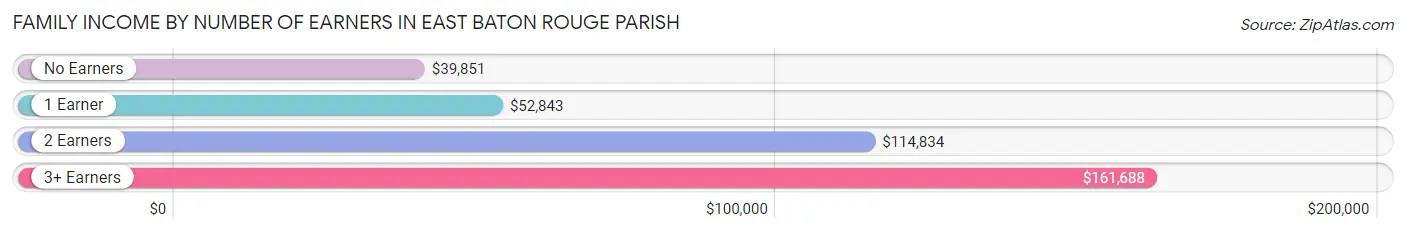
Family Income by Number of Earners in East Baton Rouge Parish
The median family income in East Baton Rouge Parish is $82,355, with families comprising 3+ earners (9,096) having the highest median family income of $161,688, while families with no earners (14,407) have the lowest median family income of $39,851, accounting for 8.9% and 14.0% of families, respectively.
| Number of Earners | # Families | Median Income |
| No Earners | 14,407 (14.0%) | $39,851 |
| 1 Earner | 37,081 (36.1%) | $52,843 |
| 2 Earners | 42,017 (40.9%) | $114,834 |
| 3+ Earners | 9,096 (8.9%) | $161,688 |
| Total | 102,601 (100.0%) | $82,355 |
Household Income in East Baton Rouge Parish
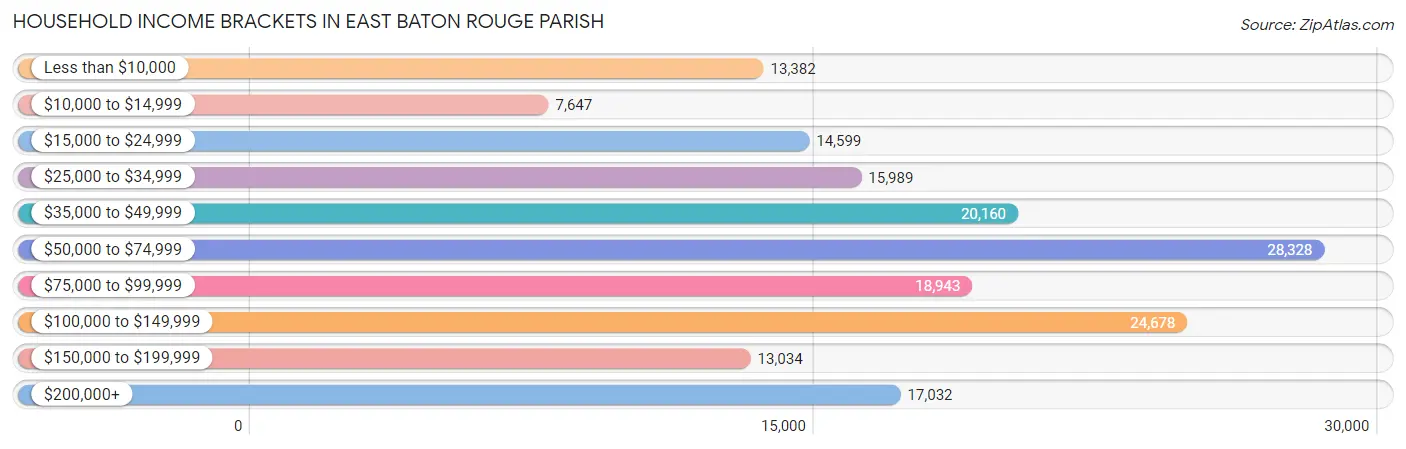
Household Income Brackets in East Baton Rouge Parish
With 28,328 households falling in the category, the $50,000 to $74,999 income range is the most frequent in East Baton Rouge Parish, accounting for 16.3% of all households. In contrast, only 7,647 households (4.4%) fall into the $10,000 to $14,999 income bracket, making it the least populous group.
| Income Bracket | # Households | % Households |
| Less than $10,000 | 13,382 | 7.7% |
| $10,000 to $14,999 | 7,647 | 4.4% |
| $15,000 to $24,999 | 14,599 | 8.4% |
| $25,000 to $34,999 | 15,989 | 9.2% |
| $35,000 to $49,999 | 20,160 | 11.6% |
| $50,000 to $74,999 | 28,328 | 16.3% |
| $75,000 to $99,999 | 18,943 | 10.9% |
| $100,000 to $149,999 | 24,678 | 14.2% |
| $150,000 to $199,999 | 13,034 | 7.5% |
| $200,000+ | 17,032 | 9.8% |
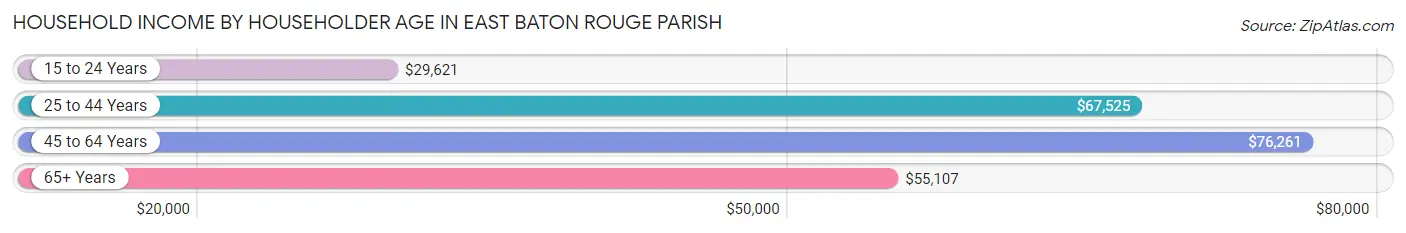
Household Income by Householder Age in East Baton Rouge Parish
The median household income in East Baton Rouge Parish is $62,083, with the highest median household income of $76,261 found in the 45 to 64 years age bracket for the primary householder. A total of 56,691 households (32.6%) fall into this category. Meanwhile, the 15 to 24 years age bracket for the primary householder has the lowest median household income of $29,621, with 13,761 households (7.9%) in this group.
| Income Bracket | # Households | Median Income |
| 15 to 24 Years | 13,761 (7.9%) | $29,621 |
| 25 to 44 Years | 59,583 (34.3%) | $67,525 |
| 45 to 64 Years | 56,691 (32.6%) | $76,261 |
| 65+ Years | 43,757 (25.2%) | $55,107 |
| Total | 173,792 (100.0%) | $62,083 |
Poverty in East Baton Rouge Parish
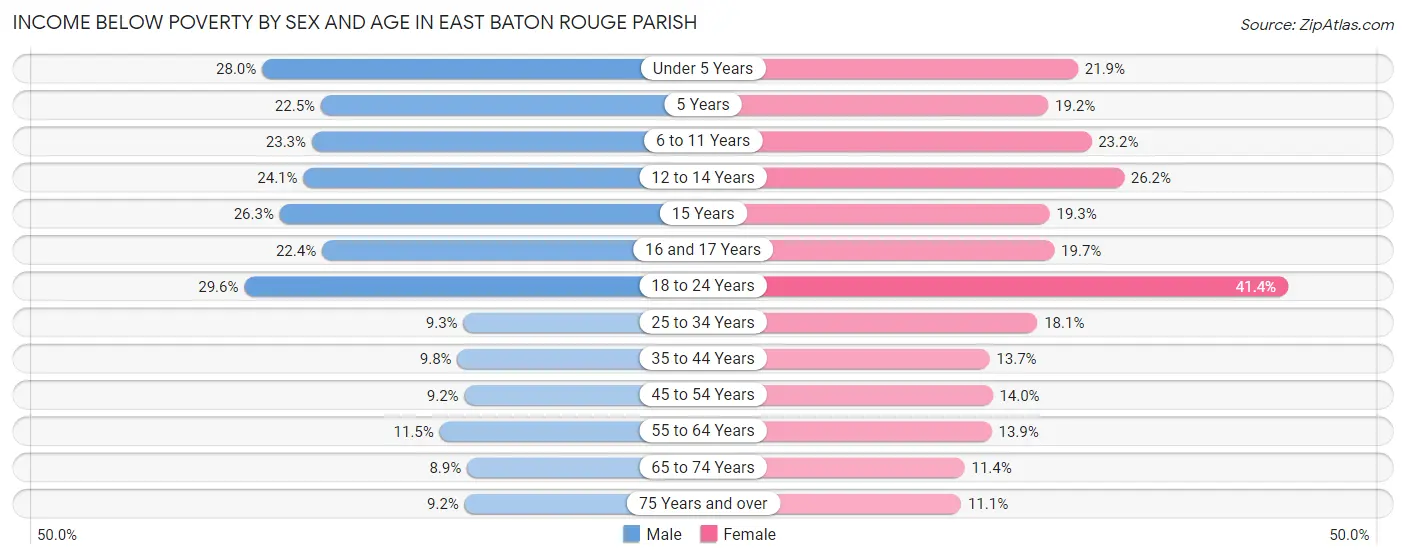
Income Below Poverty by Sex and Age in East Baton Rouge Parish
With 16.1% poverty level for males and 19.5% for females among the residents of East Baton Rouge Parish, 18 to 24 year old males and 18 to 24 year old females are the most vulnerable to poverty, with 8,680 males (29.6%) and 12,606 females (41.4%) in their respective age groups living below the poverty level.
| Age Bracket | Male | Female |
| Under 5 Years | 4,000 (28.0%) | 3,020 (21.9%) |
| 5 Years | 732 (22.5%) | 645 (19.2%) |
| 6 to 11 Years | 4,098 (23.3%) | 3,607 (23.2%) |
| 12 to 14 Years | 1,780 (24.1%) | 2,122 (26.2%) |
| 15 Years | 764 (26.3%) | 470 (19.3%) |
| 16 and 17 Years | 1,255 (22.4%) | 1,096 (19.7%) |
| 18 to 24 Years | 8,680 (29.6%) | 12,606 (41.4%) |
| 25 to 34 Years | 2,862 (9.3%) | 5,725 (18.1%) |
| 35 to 44 Years | 2,646 (9.8%) | 3,873 (13.7%) |
| 45 to 54 Years | 2,059 (9.2%) | 3,472 (14.0%) |
| 55 to 64 Years | 2,744 (11.5%) | 3,852 (13.9%) |
| 65 to 74 Years | 1,637 (8.9%) | 2,545 (11.4%) |
| 75 Years and over | 878 (9.2%) | 1,665 (11.1%) |
| Total | 34,135 (16.1%) | 44,698 (19.5%) |
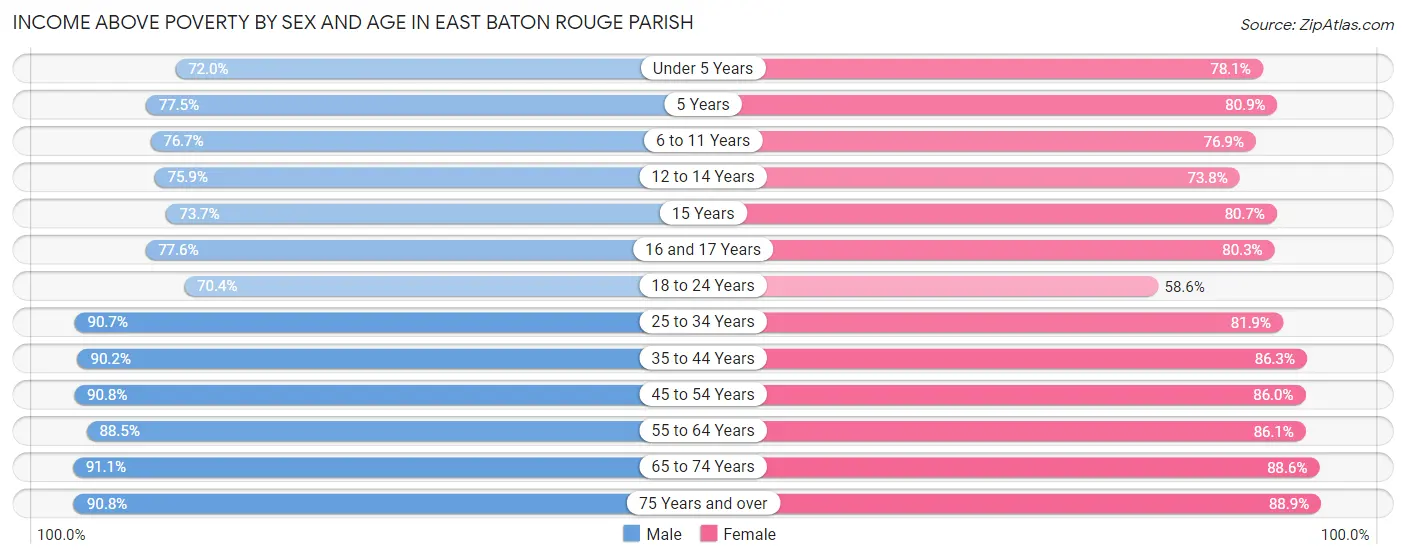
Income Above Poverty by Sex and Age in East Baton Rouge Parish
According to the poverty statistics in East Baton Rouge Parish, males aged 65 to 74 years and females aged 75 years and over are the age groups that are most secure financially, with 91.1% of males and 88.9% of females in these age groups living above the poverty line.
| Age Bracket | Male | Female |
| Under 5 Years | 10,306 (72.0%) | 10,761 (78.1%) |
| 5 Years | 2,521 (77.5%) | 2,723 (80.8%) |
| 6 to 11 Years | 13,459 (76.7%) | 11,974 (76.8%) |
| 12 to 14 Years | 5,596 (75.9%) | 5,982 (73.8%) |
| 15 Years | 2,139 (73.7%) | 1,968 (80.7%) |
| 16 and 17 Years | 4,348 (77.6%) | 4,465 (80.3%) |
| 18 to 24 Years | 20,639 (70.4%) | 17,840 (58.6%) |
| 25 to 34 Years | 28,024 (90.7%) | 25,828 (81.9%) |
| 35 to 44 Years | 24,269 (90.2%) | 24,404 (86.3%) |
| 45 to 54 Years | 20,368 (90.8%) | 21,368 (86.0%) |
| 55 to 64 Years | 21,137 (88.5%) | 23,857 (86.1%) |
| 65 to 74 Years | 16,670 (91.1%) | 19,801 (88.6%) |
| 75 Years and over | 8,703 (90.8%) | 13,389 (88.9%) |
| Total | 178,179 (83.9%) | 184,360 (80.5%) |
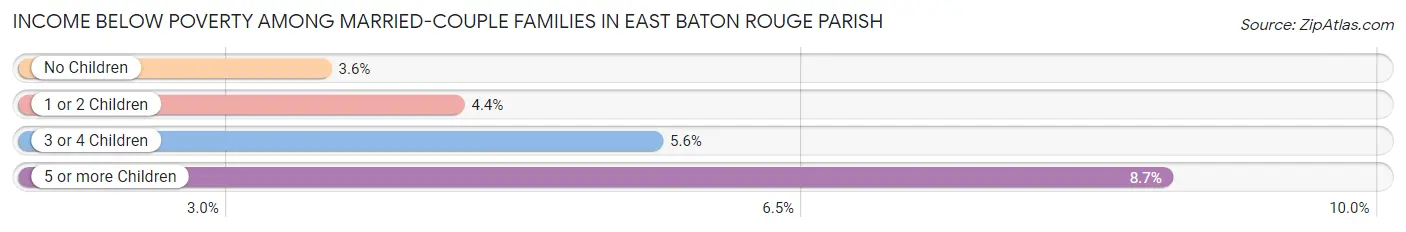
Income Below Poverty Among Married-Couple Families in East Baton Rouge Parish
The poverty statistics for married-couple families in East Baton Rouge Parish show that 4.0% or 2,612 of the total 65,173 families live below the poverty line. Families with 5 or more children have the highest poverty rate of 8.7%, comprising of 48 families. On the other hand, families with no children have the lowest poverty rate of 3.6%, which includes 1,420 families.
| Children | Above Poverty | Below Poverty |
| No Children | 38,399 (96.4%) | 1,420 (3.6%) |
| 1 or 2 Children | 19,077 (95.6%) | 873 (4.4%) |
| 3 or 4 Children | 4,581 (94.4%) | 271 (5.6%) |
| 5 or more Children | 504 (91.3%) | 48 (8.7%) |
| Total | 62,561 (96.0%) | 2,612 (4.0%) |
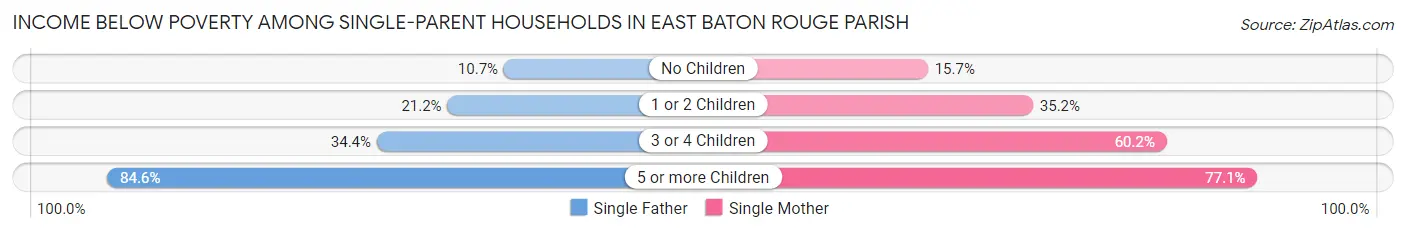
Income Below Poverty Among Single-Parent Households in East Baton Rouge Parish
According to the poverty data in East Baton Rouge Parish, 17.6% or 1,530 single-father households and 30.6% or 8,801 single-mother households are living below the poverty line. Among single-father households, those with 5 or more children have the highest poverty rate, with 22 households (84.6%) experiencing poverty. Likewise, among single-mother households, those with 5 or more children have the highest poverty rate, with 178 households (77.1%) falling below the poverty line.
| Children | Single Father | Single Mother |
| No Children | 403 (10.7%) | 1,761 (15.7%) |
| 1 or 2 Children | 932 (21.2%) | 4,998 (35.2%) |
| 3 or 4 Children | 173 (34.4%) | 1,864 (60.2%) |
| 5 or more Children | 22 (84.6%) | 178 (77.1%) |
| Total | 1,530 (17.6%) | 8,801 (30.6%) |
Income Below Poverty Among Married-Couple vs Single-Parent Households in East Baton Rouge Parish
The poverty data for East Baton Rouge Parish shows that 2,612 of the married-couple family households (4.0%) and 10,331 of the single-parent households (27.6%) are living below the poverty level. Within the married-couple family households, those with 5 or more children have the highest poverty rate, with 48 households (8.7%) falling below the poverty line. Among the single-parent households, those with 5 or more children have the highest poverty rate, with 200 household (77.8%) living below poverty.
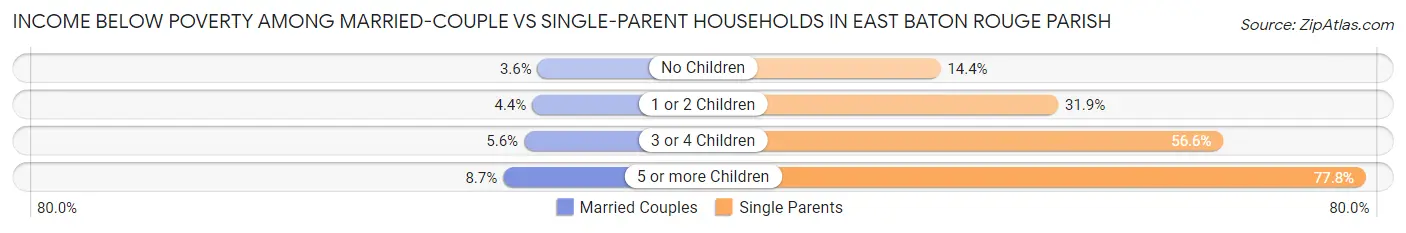
| Children | Married-Couple Families | Single-Parent Households |
| No Children | 1,420 (3.6%) | 2,164 (14.4%) |
| 1 or 2 Children | 873 (4.4%) | 5,930 (31.9%) |
| 3 or 4 Children | 271 (5.6%) | 2,037 (56.6%) |
| 5 or more Children | 48 (8.7%) | 200 (77.8%) |
| Total | 2,612 (4.0%) | 10,331 (27.6%) |
Employment Characteristics in East Baton Rouge Parish
Employment by Class of Employer in East Baton Rouge Parish
Among the 213,013 employed individuals in East Baton Rouge Parish, private company employees (139,560 | 65.5%), state government employees (22,360 | 10.5%), and not-for-profit organizations (16,262 | 7.6%) make up the most common classes of employment.
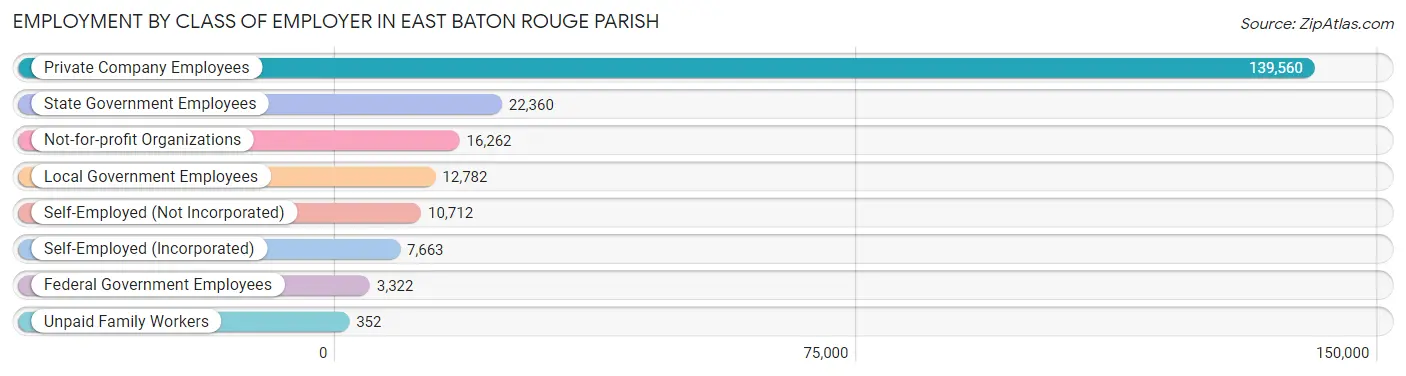
| Employer Class | # Employees | % Employees |
| Private Company Employees | 139,560 | 65.5% |
| Self-Employed (Incorporated) | 7,663 | 3.6% |
| Self-Employed (Not Incorporated) | 10,712 | 5.0% |
| Not-for-profit Organizations | 16,262 | 7.6% |
| Local Government Employees | 12,782 | 6.0% |
| State Government Employees | 22,360 | 10.5% |
| Federal Government Employees | 3,322 | 1.6% |
| Unpaid Family Workers | 352 | 0.2% |
| Total | 213,013 | 100.0% |
Employment Status by Age in East Baton Rouge Parish
According to the labor force statistics for East Baton Rouge Parish, out of the total population over 16 years of age (364,514), 64.4% or 234,747 individuals are in the labor force, with 7.1% or 16,667 of them unemployed. The age group with the highest labor force participation rate is 30 to 34 years, with 86.6% or 25,471 individuals in the labor force. Within the labor force, the 16 to 19 years age range has the highest percentage of unemployed individuals, with 22.2% or 2,484 of them being unemployed.
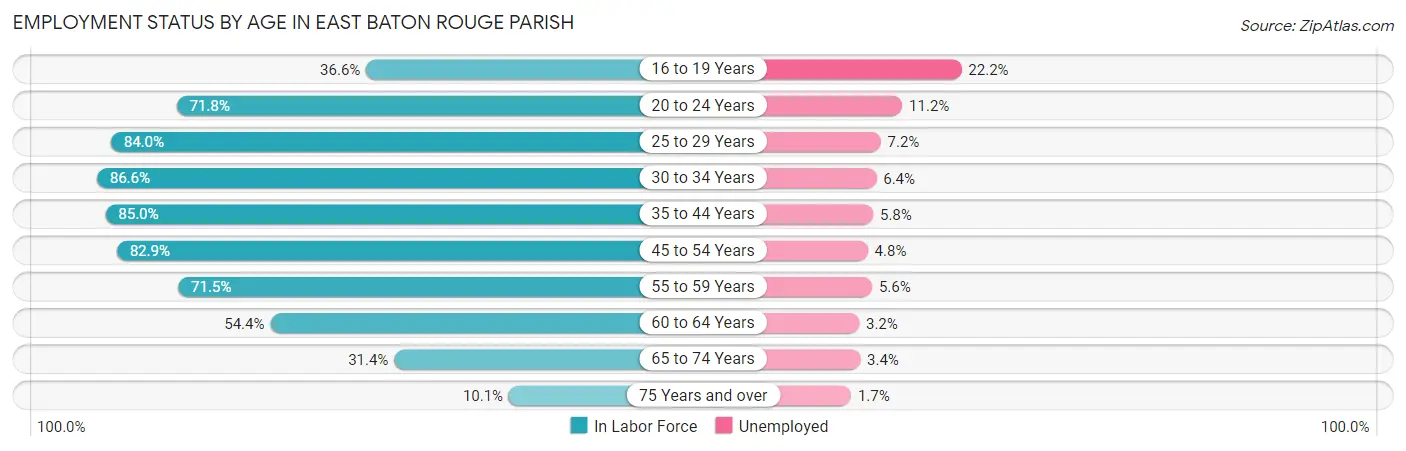
| Age Bracket | In Labor Force | Unemployed |
| 16 to 19 Years | 11,189 (36.6%) | 2,484 (22.2%) |
| 20 to 24 Years | 35,380 (71.8%) | 3,963 (11.2%) |
| 25 to 29 Years | 28,043 (84.0%) | 2,019 (7.2%) |
| 30 to 34 Years | 25,471 (86.6%) | 1,630 (6.4%) |
| 35 to 44 Years | 47,162 (85.0%) | 2,735 (5.8%) |
| 45 to 54 Years | 39,522 (82.9%) | 1,897 (4.8%) |
| 55 to 59 Years | 17,373 (71.5%) | 973 (5.6%) |
| 60 to 64 Years | 15,070 (54.4%) | 482 (3.2%) |
| 65 to 74 Years | 12,909 (31.4%) | 439 (3.4%) |
| 75 Years and over | 2,586 (10.1%) | 44 (1.7%) |
| Total | 234,747 (64.4%) | 16,667 (7.1%) |
Employment Status by Educational Attainment in East Baton Rouge Parish
According to labor force statistics for East Baton Rouge Parish, 79.2% of individuals (172,620) out of the total population between 25 and 64 years of age (217,955) are in the labor force, with 5.6% or 9,667 of them being unemployed. The group with the highest labor force participation rate are those with the educational attainment of bachelor's degree or higher, with 85.7% or 71,214 individuals in the labor force. Within the labor force, individuals with less than high school education have the highest percentage of unemployment, with 11.4% or 1,336 of them being unemployed.
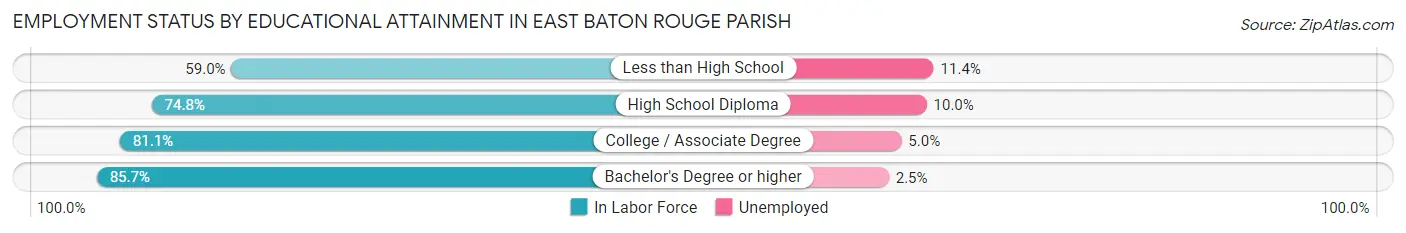
| Educational Attainment | In Labor Force | Unemployed |
| Less than High School | 11,722 (59.0%) | 2,265 (11.4%) |
| High School Diploma | 41,546 (74.8%) | 5,554 (10.0%) |
| College / Associate Degree | 48,212 (81.1%) | 2,972 (5.0%) |
| Bachelor's Degree or higher | 71,214 (85.7%) | 2,077 (2.5%) |
| Total | 172,620 (79.2%) | 12,205 (5.6%) |
Employment Occupations by Sex in East Baton Rouge Parish
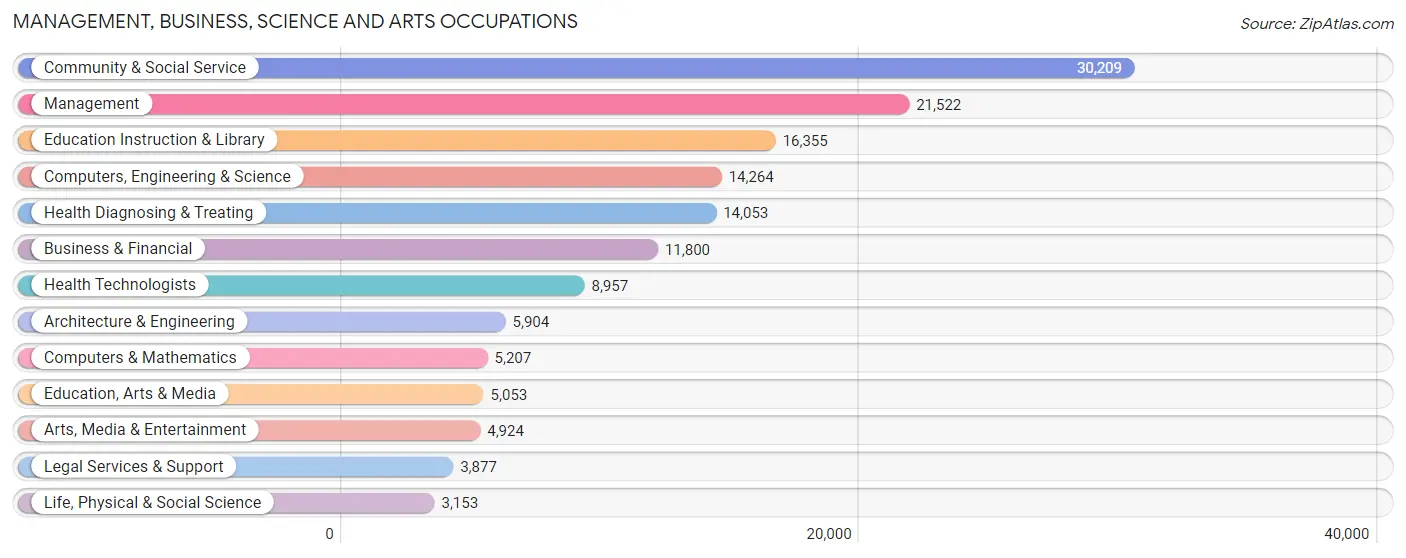
Management, Business, Science and Arts Occupations
The most common Management, Business, Science and Arts occupations in East Baton Rouge Parish are Community & Social Service (30,209 | 13.9%), Management (21,522 | 9.9%), Education Instruction & Library (16,355 | 7.5%), Computers, Engineering & Science (14,264 | 6.6%), and Health Diagnosing & Treating (14,053 | 6.5%).
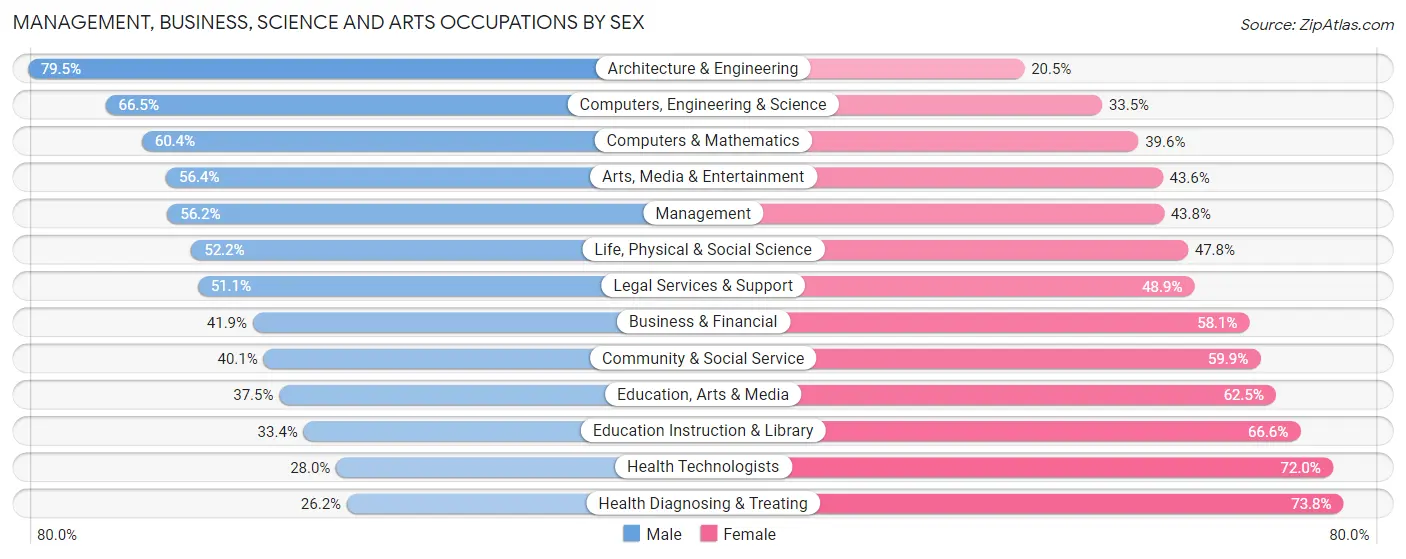
Management, Business, Science and Arts Occupations by Sex
Within the Management, Business, Science and Arts occupations in East Baton Rouge Parish, the most male-oriented occupations are Architecture & Engineering (79.5%), Computers, Engineering & Science (66.5%), and Computers & Mathematics (60.4%), while the most female-oriented occupations are Health Diagnosing & Treating (73.8%), Health Technologists (72.0%), and Education Instruction & Library (66.6%).
| Occupation | Male | Female |
| Management | 12,092 (56.2%) | 9,430 (43.8%) |
| Business & Financial | 4,945 (41.9%) | 6,855 (58.1%) |
| Computers, Engineering & Science | 9,484 (66.5%) | 4,780 (33.5%) |
| Computers & Mathematics | 3,147 (60.4%) | 2,060 (39.6%) |
| Architecture & Engineering | 4,692 (79.5%) | 1,212 (20.5%) |
| Life, Physical & Social Science | 1,645 (52.2%) | 1,508 (47.8%) |
| Community & Social Service | 12,119 (40.1%) | 18,090 (59.9%) |
| Education, Arts & Media | 1,895 (37.5%) | 3,158 (62.5%) |
| Legal Services & Support | 1,981 (51.1%) | 1,896 (48.9%) |
| Education Instruction & Library | 5,467 (33.4%) | 10,888 (66.6%) |
| Arts, Media & Entertainment | 2,776 (56.4%) | 2,148 (43.6%) |
| Health Diagnosing & Treating | 3,683 (26.2%) | 10,370 (73.8%) |
| Health Technologists | 2,508 (28.0%) | 6,449 (72.0%) |
| Total (Category) | 42,323 (46.1%) | 49,525 (53.9%) |
| Total (Overall) | 111,042 (51.0%) | 106,877 (49.0%) |
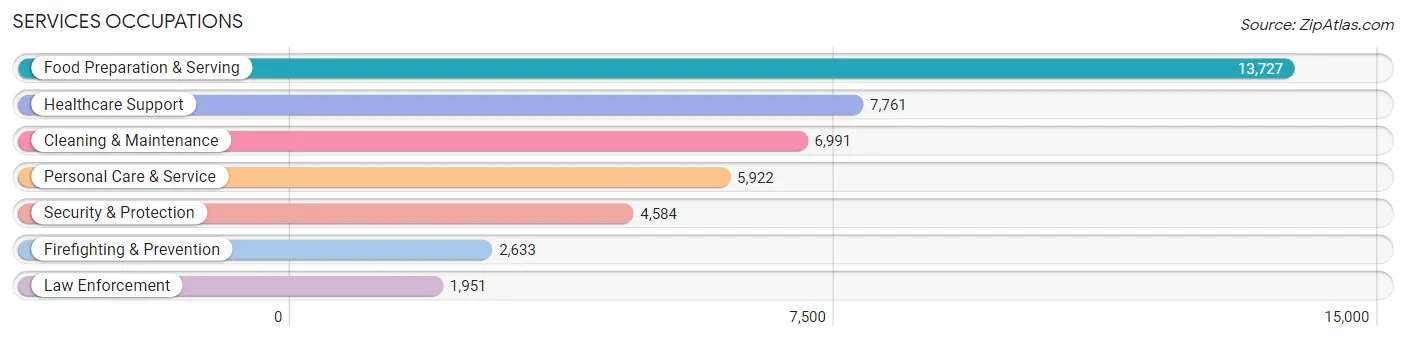
Services Occupations
The most common Services occupations in East Baton Rouge Parish are Food Preparation & Serving (13,727 | 6.3%), Healthcare Support (7,761 | 3.6%), Cleaning & Maintenance (6,991 | 3.2%), Personal Care & Service (5,922 | 2.7%), and Security & Protection (4,584 | 2.1%).
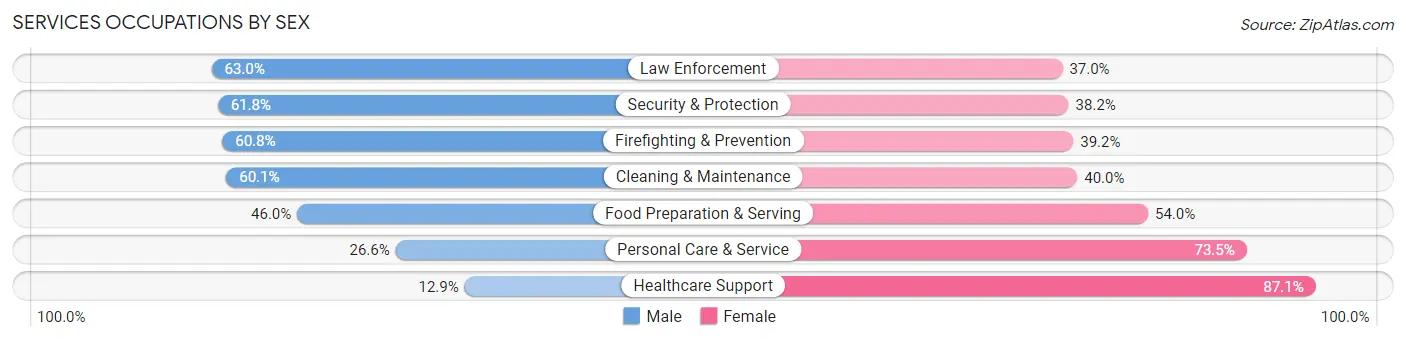
Services Occupations by Sex
Within the Services occupations in East Baton Rouge Parish, the most male-oriented occupations are Law Enforcement (63.0%), Security & Protection (61.8%), and Firefighting & Prevention (60.8%), while the most female-oriented occupations are Healthcare Support (87.1%), Personal Care & Service (73.5%), and Food Preparation & Serving (54.0%).
| Occupation | Male | Female |
| Healthcare Support | 1,000 (12.9%) | 6,761 (87.1%) |
| Security & Protection | 2,831 (61.8%) | 1,753 (38.2%) |
| Firefighting & Prevention | 1,602 (60.8%) | 1,031 (39.2%) |
| Law Enforcement | 1,229 (63.0%) | 722 (37.0%) |
| Food Preparation & Serving | 6,320 (46.0%) | 7,407 (54.0%) |
| Cleaning & Maintenance | 4,198 (60.1%) | 2,793 (40.0%) |
| Personal Care & Service | 1,572 (26.6%) | 4,350 (73.5%) |
| Total (Category) | 15,921 (40.8%) | 23,064 (59.2%) |
| Total (Overall) | 111,042 (51.0%) | 106,877 (49.0%) |
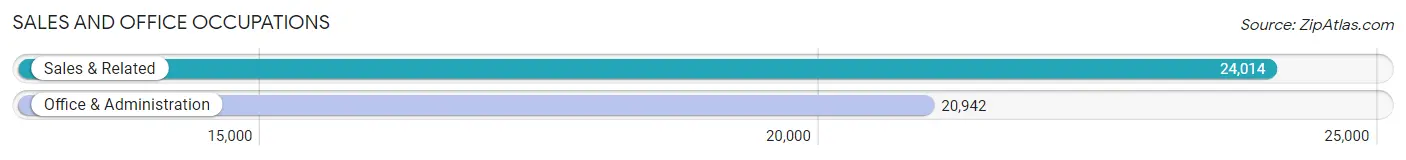
Sales and Office Occupations
The most common Sales and Office occupations in East Baton Rouge Parish are Sales & Related (24,014 | 11.0%), and Office & Administration (20,942 | 9.6%).
Sales and Office Occupations by Sex
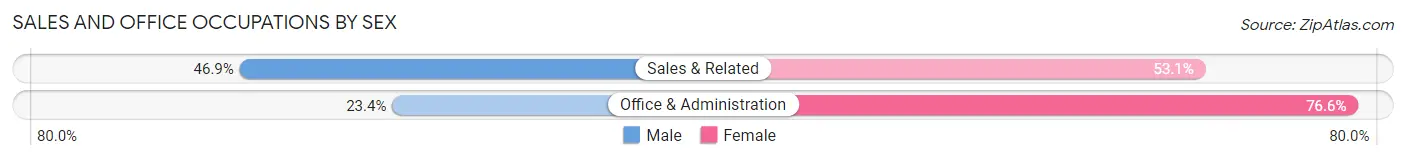
| Occupation | Male | Female |
| Sales & Related | 11,268 (46.9%) | 12,746 (53.1%) |
| Office & Administration | 4,908 (23.4%) | 16,034 (76.6%) |
| Total (Category) | 16,176 (36.0%) | 28,780 (64.0%) |
| Total (Overall) | 111,042 (51.0%) | 106,877 (49.0%) |
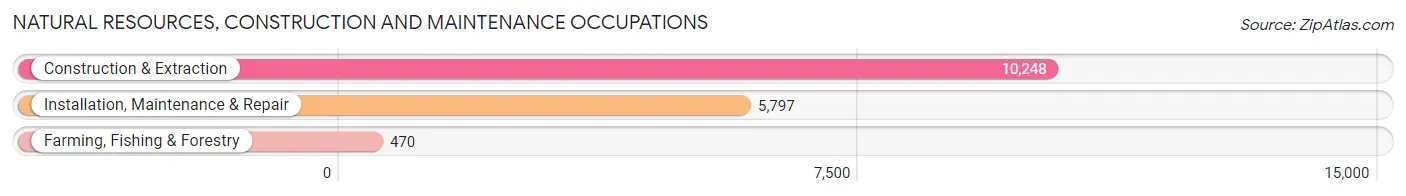
Natural Resources, Construction and Maintenance Occupations
The most common Natural Resources, Construction and Maintenance occupations in East Baton Rouge Parish are Construction & Extraction (10,248 | 4.7%), Installation, Maintenance & Repair (5,797 | 2.7%), and Farming, Fishing & Forestry (470 | 0.2%).
Natural Resources, Construction and Maintenance Occupations by Sex
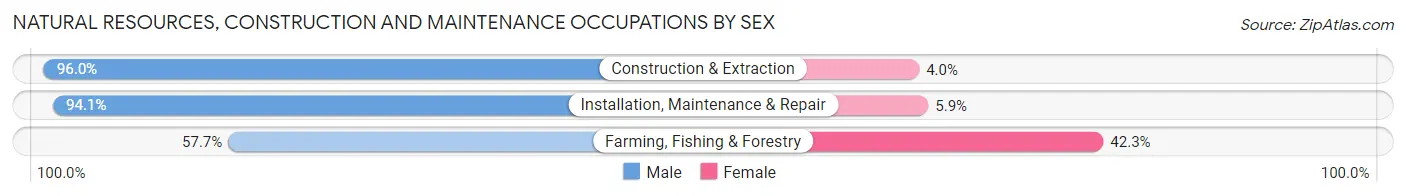
| Occupation | Male | Female |
| Farming, Fishing & Forestry | 271 (57.7%) | 199 (42.3%) |
| Construction & Extraction | 9,836 (96.0%) | 412 (4.0%) |
| Installation, Maintenance & Repair | 5,454 (94.1%) | 343 (5.9%) |
| Total (Category) | 15,561 (94.2%) | 954 (5.8%) |
| Total (Overall) | 111,042 (51.0%) | 106,877 (49.0%) |
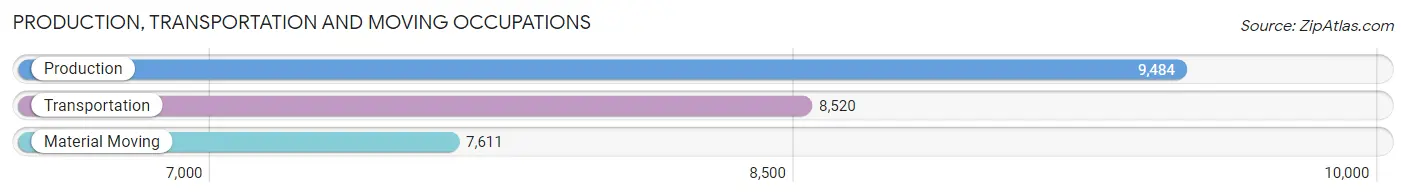
Production, Transportation and Moving Occupations
The most common Production, Transportation and Moving occupations in East Baton Rouge Parish are Production (9,484 | 4.3%), Transportation (8,520 | 3.9%), and Material Moving (7,611 | 3.5%).
Production, Transportation and Moving Occupations by Sex
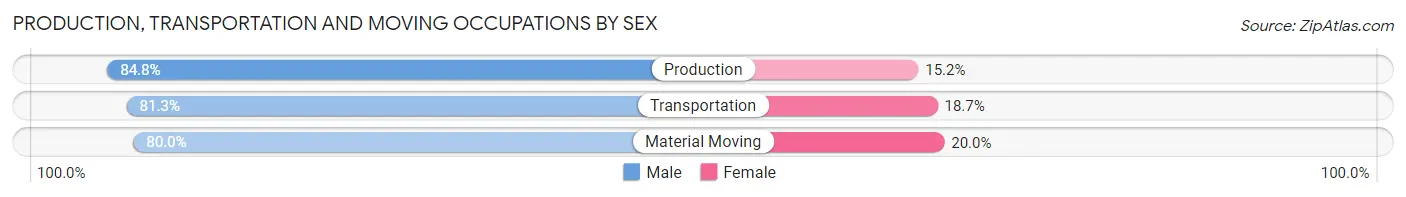
| Occupation | Male | Female |
| Production | 8,044 (84.8%) | 1,440 (15.2%) |
| Transportation | 6,925 (81.3%) | 1,595 (18.7%) |
| Material Moving | 6,092 (80.0%) | 1,519 (20.0%) |
| Total (Category) | 21,061 (82.2%) | 4,554 (17.8%) |
| Total (Overall) | 111,042 (51.0%) | 106,877 (49.0%) |
Employment Industries by Sex in East Baton Rouge Parish
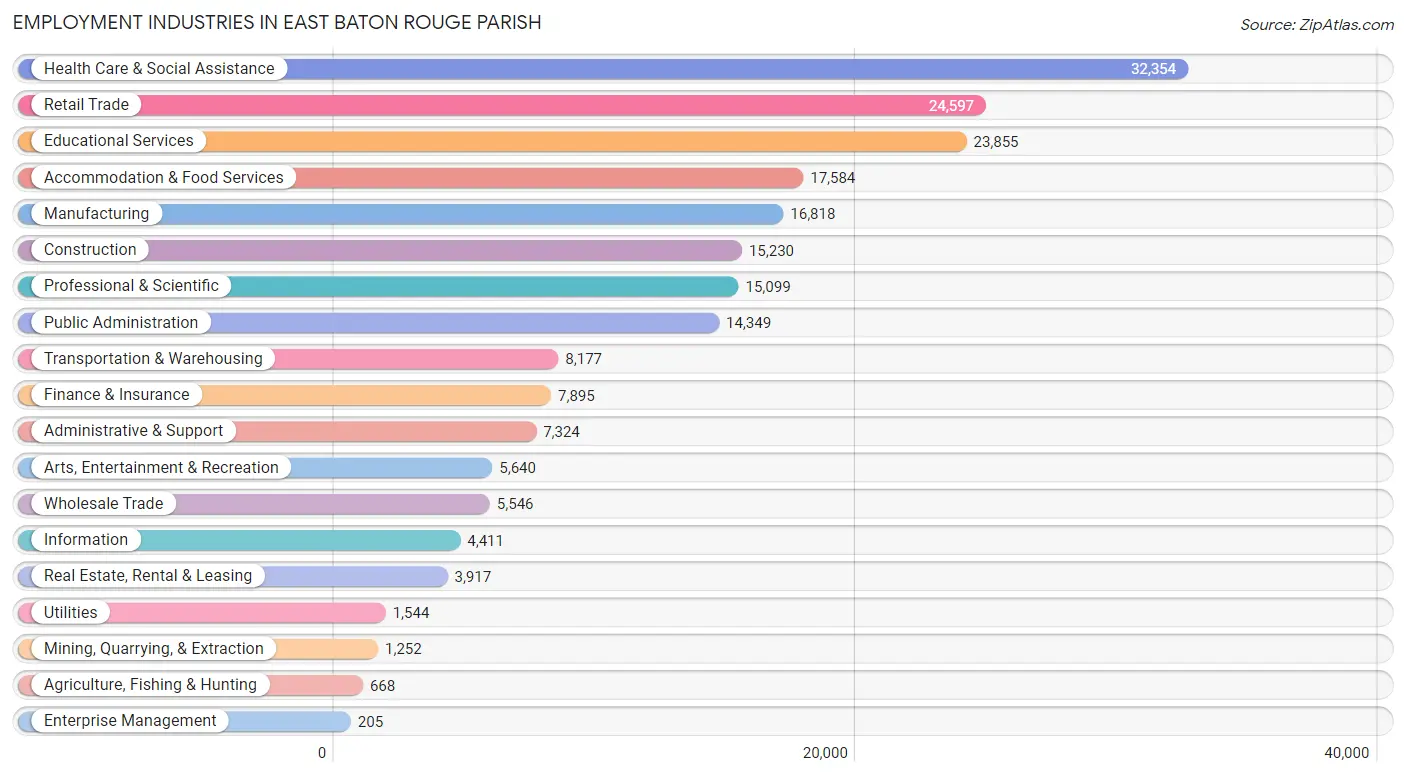
Employment Industries in East Baton Rouge Parish
The major employment industries in East Baton Rouge Parish include Health Care & Social Assistance (32,354 | 14.8%), Retail Trade (24,597 | 11.3%), Educational Services (23,855 | 11.0%), Accommodation & Food Services (17,584 | 8.1%), and Manufacturing (16,818 | 7.7%).
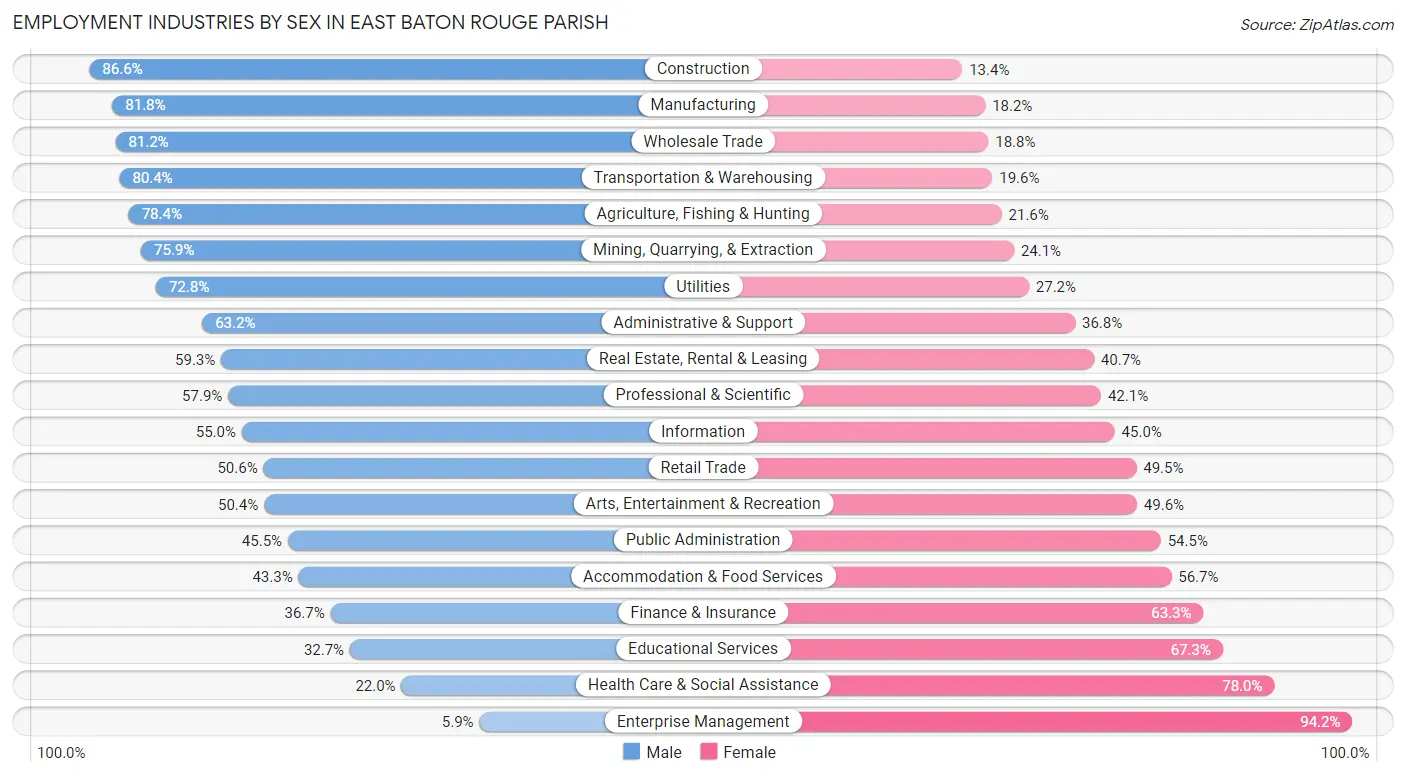
Employment Industries by Sex in East Baton Rouge Parish
The East Baton Rouge Parish industries that see more men than women are Construction (86.6%), Manufacturing (81.8%), and Wholesale Trade (81.2%), whereas the industries that tend to have a higher number of women are Enterprise Management (94.2%), Health Care & Social Assistance (78.0%), and Educational Services (67.3%).
| Industry | Male | Female |
| Agriculture, Fishing & Hunting | 524 (78.4%) | 144 (21.6%) |
| Mining, Quarrying, & Extraction | 950 (75.9%) | 302 (24.1%) |
| Construction | 13,186 (86.6%) | 2,044 (13.4%) |
| Manufacturing | 13,762 (81.8%) | 3,056 (18.2%) |
| Wholesale Trade | 4,503 (81.2%) | 1,043 (18.8%) |
| Retail Trade | 12,435 (50.5%) | 12,162 (49.4%) |
| Transportation & Warehousing | 6,571 (80.4%) | 1,606 (19.6%) |
| Utilities | 1,124 (72.8%) | 420 (27.2%) |
| Information | 2,428 (55.0%) | 1,983 (45.0%) |
| Finance & Insurance | 2,896 (36.7%) | 4,999 (63.3%) |
| Real Estate, Rental & Leasing | 2,324 (59.3%) | 1,593 (40.7%) |
| Professional & Scientific | 8,738 (57.9%) | 6,361 (42.1%) |
| Enterprise Management | 12 (5.9%) | 193 (94.2%) |
| Administrative & Support | 4,631 (63.2%) | 2,693 (36.8%) |
| Educational Services | 7,790 (32.7%) | 16,065 (67.3%) |
| Health Care & Social Assistance | 7,117 (22.0%) | 25,237 (78.0%) |
| Arts, Entertainment & Recreation | 2,844 (50.4%) | 2,796 (49.6%) |
| Accommodation & Food Services | 7,616 (43.3%) | 9,968 (56.7%) |
| Public Administration | 6,529 (45.5%) | 7,820 (54.5%) |
| Total | 111,042 (51.0%) | 106,877 (49.0%) |
Education in East Baton Rouge Parish
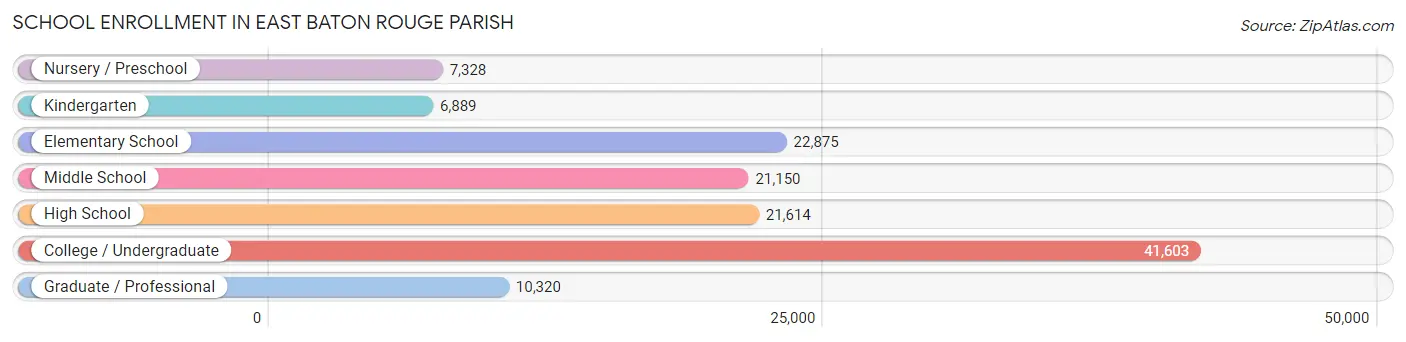
School Enrollment in East Baton Rouge Parish
The most common levels of schooling among the 131,779 students in East Baton Rouge Parish are college / undergraduate (41,603 | 31.6%), elementary school (22,875 | 17.4%), and high school (21,614 | 16.4%).
| School Level | # Students | % Students |
| Nursery / Preschool | 7,328 | 5.6% |
| Kindergarten | 6,889 | 5.2% |
| Elementary School | 22,875 | 17.4% |
| Middle School | 21,150 | 16.1% |
| High School | 21,614 | 16.4% |
| College / Undergraduate | 41,603 | 31.6% |
| Graduate / Professional | 10,320 | 7.8% |
| Total | 131,779 | 100.0% |
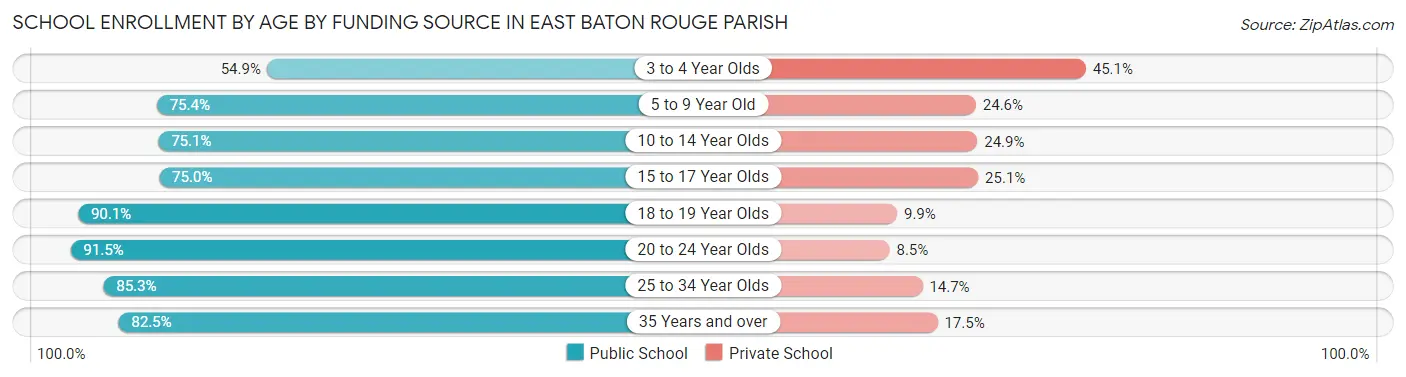
School Enrollment by Age by Funding Source in East Baton Rouge Parish
Out of a total of 131,779 students who are enrolled in schools in East Baton Rouge Parish, 26,092 (19.8%) attend a private institution, while the remaining 105,687 (80.2%) are enrolled in public schools. The age group of 3 to 4 year olds has the highest likelihood of being enrolled in private schools, with 2,717 (45.1% in the age bracket) enrolled. Conversely, the age group of 20 to 24 year olds has the lowest likelihood of being enrolled in a private school, with 23,648 (91.5% in the age bracket) attending a public institution.
| Age Bracket | Public School | Private School |
| 3 to 4 Year Olds | 3,307 (54.9%) | 2,717 (45.1%) |
| 5 to 9 Year Old | 21,212 (75.4%) | 6,927 (24.6%) |
| 10 to 14 Year Olds | 19,288 (75.1%) | 6,390 (24.9%) |
| 15 to 17 Year Olds | 12,116 (75.0%) | 4,050 (25.1%) |
| 18 to 19 Year Olds | 13,994 (90.1%) | 1,545 (9.9%) |
| 20 to 24 Year Olds | 23,648 (91.5%) | 2,207 (8.5%) |
| 25 to 34 Year Olds | 7,267 (85.3%) | 1,249 (14.7%) |
| 35 Years and over | 4,838 (82.5%) | 1,024 (17.5%) |
| Total | 105,687 (80.2%) | 26,092 (19.8%) |
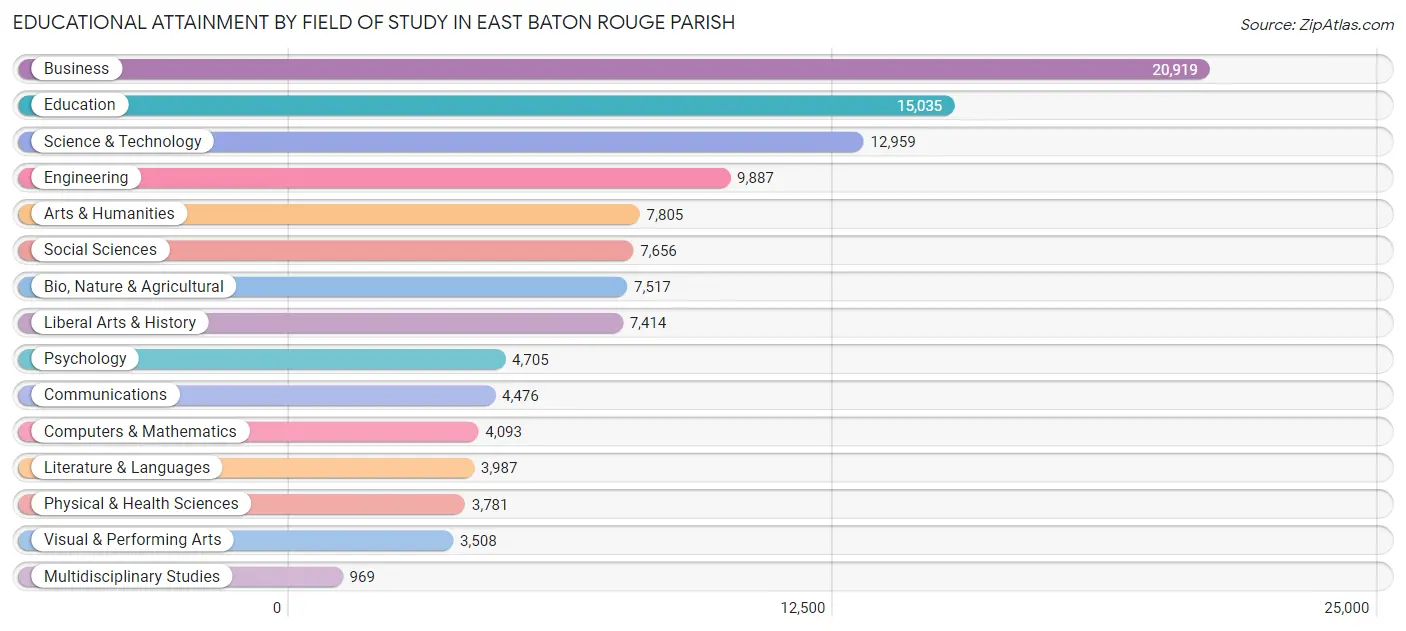
Educational Attainment by Field of Study in East Baton Rouge Parish
Business (20,919 | 18.2%), education (15,035 | 13.1%), science & technology (12,959 | 11.3%), engineering (9,887 | 8.6%), and arts & humanities (7,805 | 6.8%) are the most common fields of study among 114,711 individuals in East Baton Rouge Parish who have obtained a bachelor's degree or higher.
| Field of Study | # Graduates | % Graduates |
| Computers & Mathematics | 4,093 | 3.6% |
| Bio, Nature & Agricultural | 7,517 | 6.6% |
| Physical & Health Sciences | 3,781 | 3.3% |
| Psychology | 4,705 | 4.1% |
| Social Sciences | 7,656 | 6.7% |
| Engineering | 9,887 | 8.6% |
| Multidisciplinary Studies | 969 | 0.8% |
| Science & Technology | 12,959 | 11.3% |
| Business | 20,919 | 18.2% |
| Education | 15,035 | 13.1% |
| Literature & Languages | 3,987 | 3.5% |
| Liberal Arts & History | 7,414 | 6.5% |
| Visual & Performing Arts | 3,508 | 3.1% |
| Communications | 4,476 | 3.9% |
| Arts & Humanities | 7,805 | 6.8% |
| Total | 114,711 | 100.0% |
Transportation & Commute in East Baton Rouge Parish
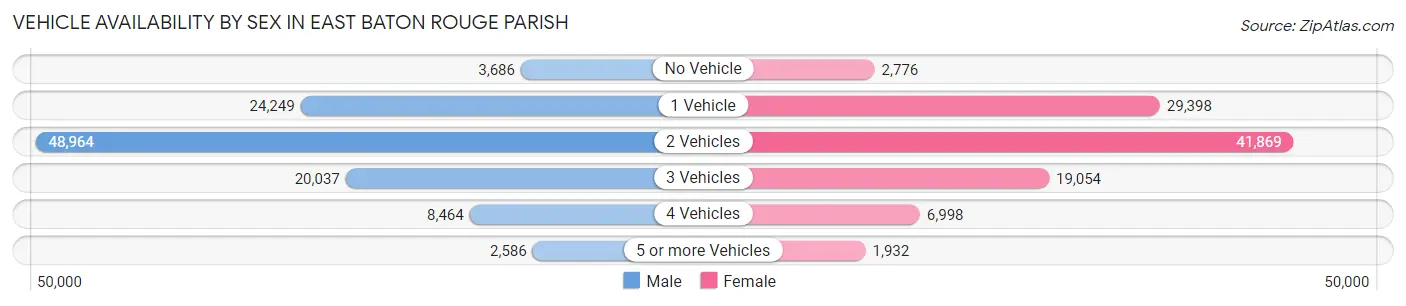
Vehicle Availability by Sex in East Baton Rouge Parish
The most prevalent vehicle ownership categories in East Baton Rouge Parish are males with 2 vehicles (48,964, accounting for 45.3%) and females with 2 vehicles (41,869, making up 48.0%).
| Vehicles Available | Male | Female |
| No Vehicle | 3,686 (3.4%) | 2,776 (2.7%) |
| 1 Vehicle | 24,249 (22.5%) | 29,398 (28.8%) |
| 2 Vehicles | 48,964 (45.3%) | 41,869 (41.0%) |
| 3 Vehicles | 20,037 (18.6%) | 19,054 (18.7%) |
| 4 Vehicles | 8,464 (7.8%) | 6,998 (6.9%) |
| 5 or more Vehicles | 2,586 (2.4%) | 1,932 (1.9%) |
| Total | 107,986 (100.0%) | 102,027 (100.0%) |
Commute Time in East Baton Rouge Parish
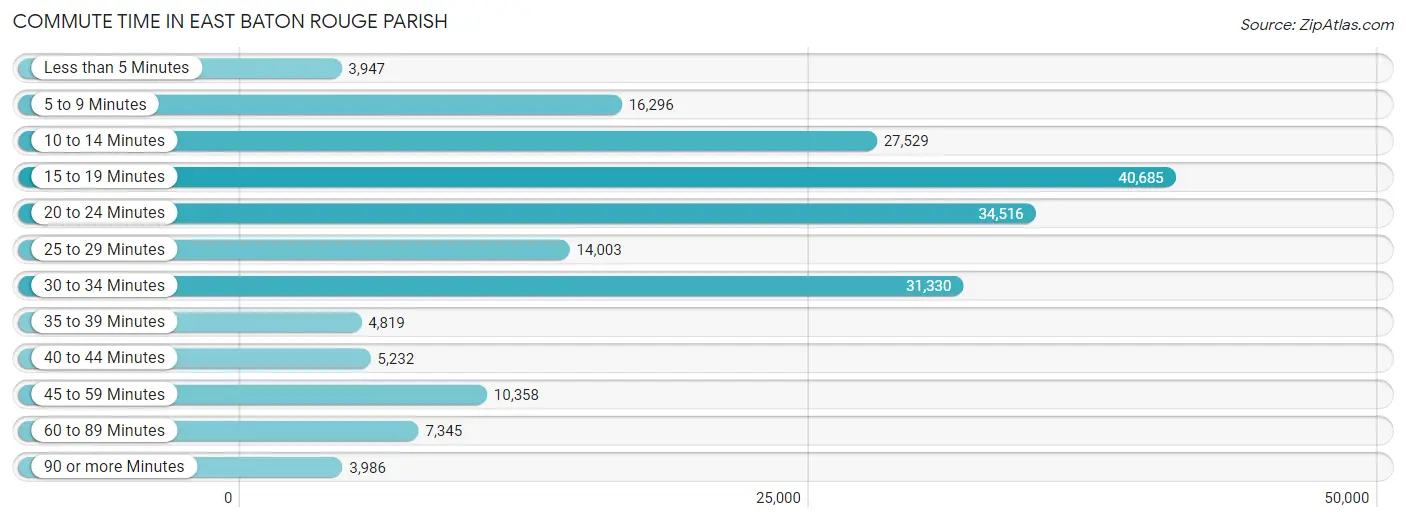
The most frequently occuring commute durations in East Baton Rouge Parish are 15 to 19 minutes (40,685 commuters, 20.3%), 20 to 24 minutes (34,516 commuters, 17.2%), and 30 to 34 minutes (31,330 commuters, 15.7%).
| Commute Time | # Commuters | % Commuters |
| Less than 5 Minutes | 3,947 | 2.0% |
| 5 to 9 Minutes | 16,296 | 8.2% |
| 10 to 14 Minutes | 27,529 | 13.8% |
| 15 to 19 Minutes | 40,685 | 20.3% |
| 20 to 24 Minutes | 34,516 | 17.2% |
| 25 to 29 Minutes | 14,003 | 7.0% |
| 30 to 34 Minutes | 31,330 | 15.7% |
| 35 to 39 Minutes | 4,819 | 2.4% |
| 40 to 44 Minutes | 5,232 | 2.6% |
| 45 to 59 Minutes | 10,358 | 5.2% |
| 60 to 89 Minutes | 7,345 | 3.7% |
| 90 or more Minutes | 3,986 | 2.0% |
Commute Time by Sex in East Baton Rouge Parish
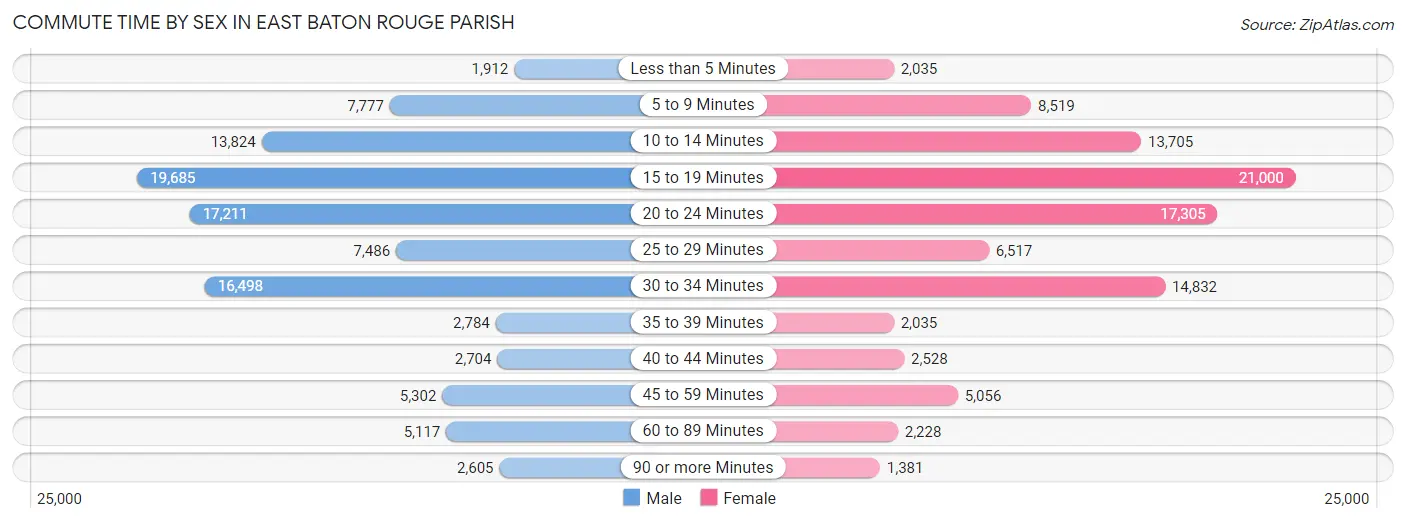
The most common commute times in East Baton Rouge Parish are 15 to 19 minutes (19,685 commuters, 19.1%) for males and 15 to 19 minutes (21,000 commuters, 21.6%) for females.
| Commute Time | Male | Female |
| Less than 5 Minutes | 1,912 (1.9%) | 2,035 (2.1%) |
| 5 to 9 Minutes | 7,777 (7.6%) | 8,519 (8.8%) |
| 10 to 14 Minutes | 13,824 (13.4%) | 13,705 (14.1%) |
| 15 to 19 Minutes | 19,685 (19.1%) | 21,000 (21.6%) |
| 20 to 24 Minutes | 17,211 (16.7%) | 17,305 (17.8%) |
| 25 to 29 Minutes | 7,486 (7.3%) | 6,517 (6.7%) |
| 30 to 34 Minutes | 16,498 (16.0%) | 14,832 (15.3%) |
| 35 to 39 Minutes | 2,784 (2.7%) | 2,035 (2.1%) |
| 40 to 44 Minutes | 2,704 (2.6%) | 2,528 (2.6%) |
| 45 to 59 Minutes | 5,302 (5.1%) | 5,056 (5.2%) |
| 60 to 89 Minutes | 5,117 (5.0%) | 2,228 (2.3%) |
| 90 or more Minutes | 2,605 (2.5%) | 1,381 (1.4%) |
Time of Departure to Work by Sex in East Baton Rouge Parish
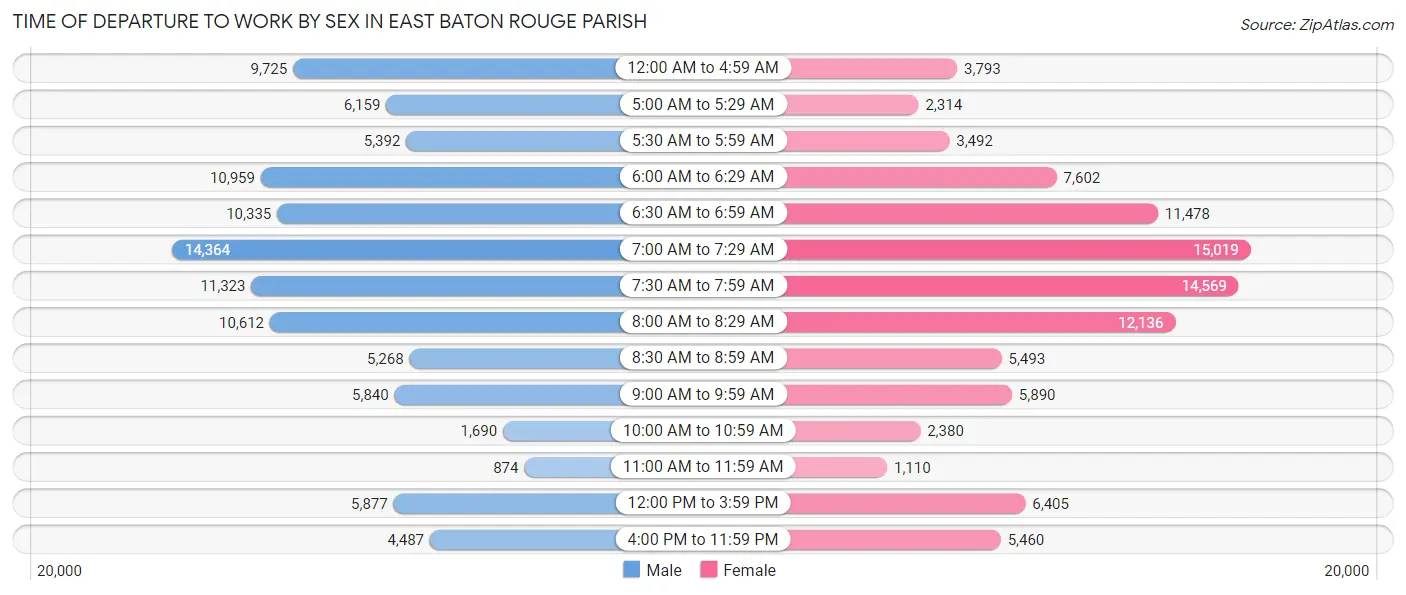
The most frequent times of departure to work in East Baton Rouge Parish are 7:00 AM to 7:29 AM (14,364, 14.0%) for males and 7:00 AM to 7:29 AM (15,019, 15.5%) for females.
| Time of Departure | Male | Female |
| 12:00 AM to 4:59 AM | 9,725 (9.5%) | 3,793 (3.9%) |
| 5:00 AM to 5:29 AM | 6,159 (6.0%) | 2,314 (2.4%) |
| 5:30 AM to 5:59 AM | 5,392 (5.2%) | 3,492 (3.6%) |
| 6:00 AM to 6:29 AM | 10,959 (10.6%) | 7,602 (7.8%) |
| 6:30 AM to 6:59 AM | 10,335 (10.0%) | 11,478 (11.8%) |
| 7:00 AM to 7:29 AM | 14,364 (14.0%) | 15,019 (15.5%) |
| 7:30 AM to 7:59 AM | 11,323 (11.0%) | 14,569 (15.0%) |
| 8:00 AM to 8:29 AM | 10,612 (10.3%) | 12,136 (12.5%) |
| 8:30 AM to 8:59 AM | 5,268 (5.1%) | 5,493 (5.7%) |
| 9:00 AM to 9:59 AM | 5,840 (5.7%) | 5,890 (6.1%) |
| 10:00 AM to 10:59 AM | 1,690 (1.6%) | 2,380 (2.5%) |
| 11:00 AM to 11:59 AM | 874 (0.9%) | 1,110 (1.1%) |
| 12:00 PM to 3:59 PM | 5,877 (5.7%) | 6,405 (6.6%) |
| 4:00 PM to 11:59 PM | 4,487 (4.4%) | 5,460 (5.6%) |
| Total | 102,905 (100.0%) | 97,141 (100.0%) |
Housing Occupancy in East Baton Rouge Parish
Occupancy by Ownership in East Baton Rouge Parish
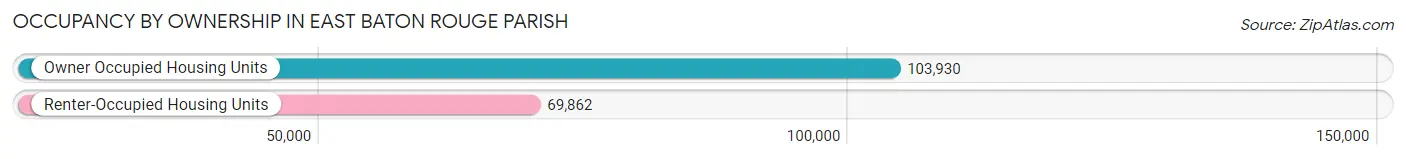
Of the total 173,792 dwellings in East Baton Rouge Parish, owner-occupied units account for 103,930 (59.8%), while renter-occupied units make up 69,862 (40.2%).
| Occupancy | # Housing Units | % Housing Units |
| Owner Occupied Housing Units | 103,930 | 59.8% |
| Renter-Occupied Housing Units | 69,862 | 40.2% |
| Total Occupied Housing Units | 173,792 | 100.0% |
Occupancy by Household Size in East Baton Rouge Parish
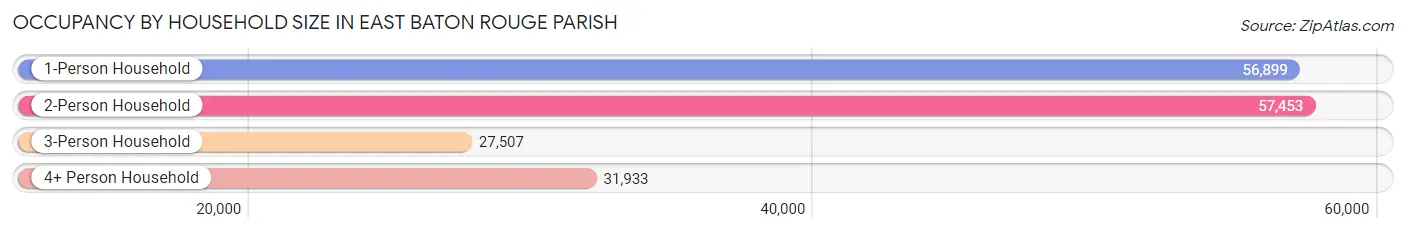
| Household Size | # Housing Units | % Housing Units |
| 1-Person Household | 56,899 | 32.7% |
| 2-Person Household | 57,453 | 33.1% |
| 3-Person Household | 27,507 | 15.8% |
| 4+ Person Household | 31,933 | 18.4% |
| Total Housing Units | 173,792 | 100.0% |
Occupancy by Ownership by Household Size in East Baton Rouge Parish
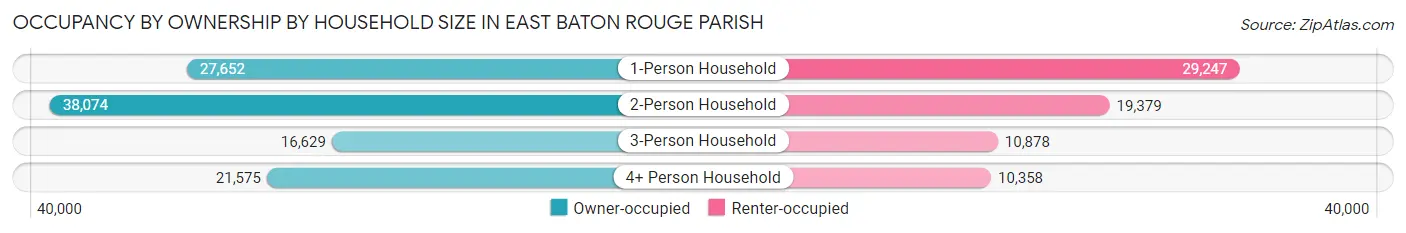
| Household Size | Owner-occupied | Renter-occupied |
| 1-Person Household | 27,652 (48.6%) | 29,247 (51.4%) |
| 2-Person Household | 38,074 (66.3%) | 19,379 (33.7%) |
| 3-Person Household | 16,629 (60.5%) | 10,878 (39.6%) |
| 4+ Person Household | 21,575 (67.6%) | 10,358 (32.4%) |
| Total Housing Units | 103,930 (59.8%) | 69,862 (40.2%) |
Occupancy by Educational Attainment in East Baton Rouge Parish
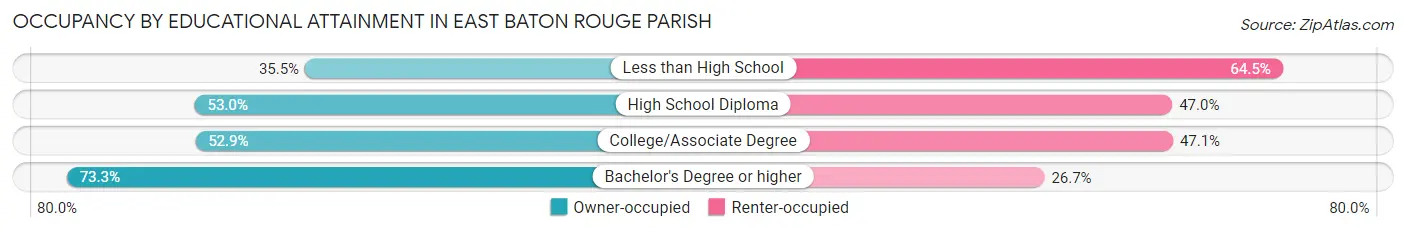
| Household Size | Owner-occupied | Renter-occupied |
| Less than High School | 4,720 (35.5%) | 8,565 (64.5%) |
| High School Diploma | 21,135 (53.0%) | 18,716 (47.0%) |
| College/Associate Degree | 26,959 (52.9%) | 23,972 (47.1%) |
| Bachelor's Degree or higher | 51,116 (73.3%) | 18,609 (26.7%) |
Occupancy by Age of Householder in East Baton Rouge Parish
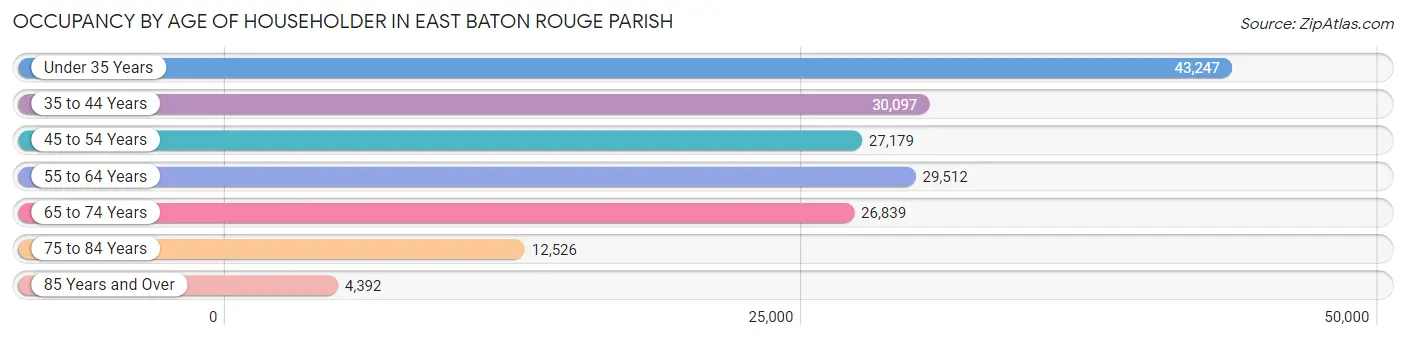
| Age Bracket | # Households | % Households |
| Under 35 Years | 43,247 | 24.9% |
| 35 to 44 Years | 30,097 | 17.3% |
| 45 to 54 Years | 27,179 | 15.6% |
| 55 to 64 Years | 29,512 | 17.0% |
| 65 to 74 Years | 26,839 | 15.4% |
| 75 to 84 Years | 12,526 | 7.2% |
| 85 Years and Over | 4,392 | 2.5% |
| Total | 173,792 | 100.0% |
Housing Finances in East Baton Rouge Parish
Median Income by Occupancy in East Baton Rouge Parish
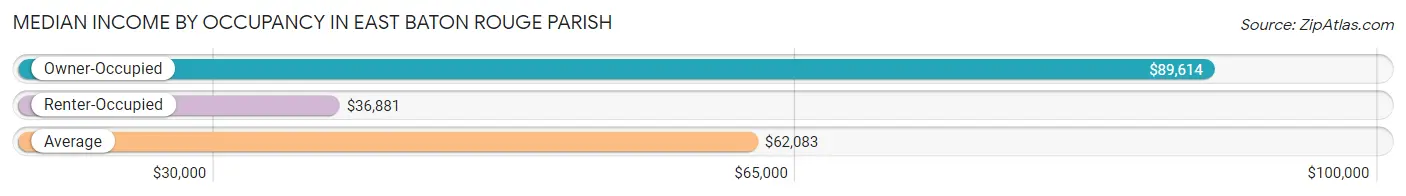
| Occupancy Type | # Households | Median Income |
| Owner-Occupied | 103,930 (59.8%) | $89,614 |
| Renter-Occupied | 69,862 (40.2%) | $36,881 |
| Average | 173,792 (100.0%) | $62,083 |
Occupancy by Householder Income Bracket in East Baton Rouge Parish
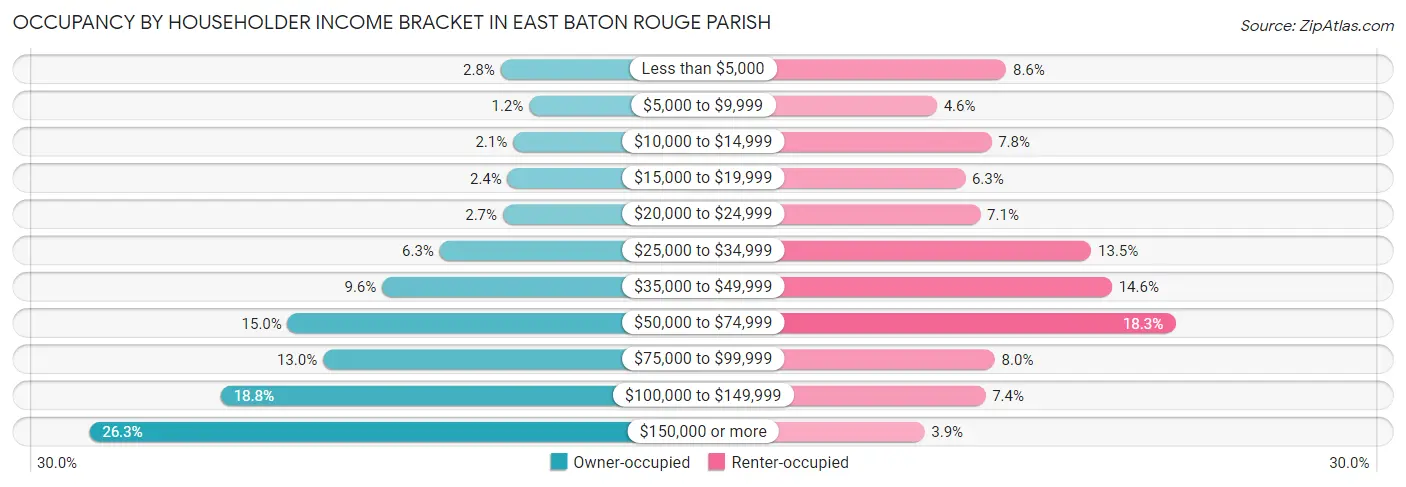
| Income Bracket | Owner-occupied | Renter-occupied |
| Less than $5,000 | 2,912 (2.8%) | 6,007 (8.6%) |
| $5,000 to $9,999 | 1,214 (1.2%) | 3,242 (4.6%) |
| $10,000 to $14,999 | 2,168 (2.1%) | 5,416 (7.7%) |
| $15,000 to $19,999 | 2,499 (2.4%) | 4,364 (6.2%) |
| $20,000 to $24,999 | 2,774 (2.7%) | 4,972 (7.1%) |
| $25,000 to $34,999 | 6,525 (6.3%) | 9,405 (13.5%) |
| $35,000 to $49,999 | 9,948 (9.6%) | 10,231 (14.6%) |
| $50,000 to $74,999 | 15,563 (15.0%) | 12,747 (18.2%) |
| $75,000 to $99,999 | 13,463 (13.0%) | 5,556 (8.0%) |
| $100,000 to $149,999 | 19,529 (18.8%) | 5,179 (7.4%) |
| $150,000 or more | 27,335 (26.3%) | 2,743 (3.9%) |
| Total | 103,930 (100.0%) | 69,862 (100.0%) |
Monthly Housing Cost Tiers in East Baton Rouge Parish
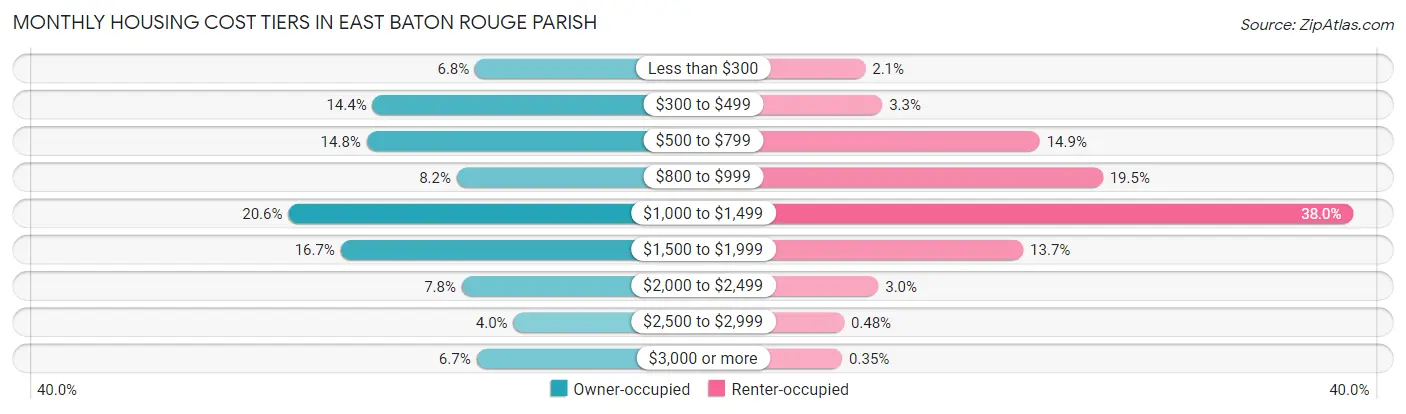
| Monthly Cost | Owner-occupied | Renter-occupied |
| Less than $300 | 7,086 (6.8%) | 1,433 (2.1%) |
| $300 to $499 | 14,948 (14.4%) | 2,308 (3.3%) |
| $500 to $799 | 15,394 (14.8%) | 10,410 (14.9%) |
| $800 to $999 | 8,490 (8.2%) | 13,653 (19.5%) |
| $1,000 to $1,499 | 21,393 (20.6%) | 26,540 (38.0%) |
| $1,500 to $1,999 | 17,376 (16.7%) | 9,554 (13.7%) |
| $2,000 to $2,499 | 8,104 (7.8%) | 2,102 (3.0%) |
| $2,500 to $2,999 | 4,160 (4.0%) | 334 (0.5%) |
| $3,000 or more | 6,979 (6.7%) | 243 (0.4%) |
| Total | 103,930 (100.0%) | 69,862 (100.0%) |
Physical Housing Characteristics in East Baton Rouge Parish
Housing Structures in East Baton Rouge Parish
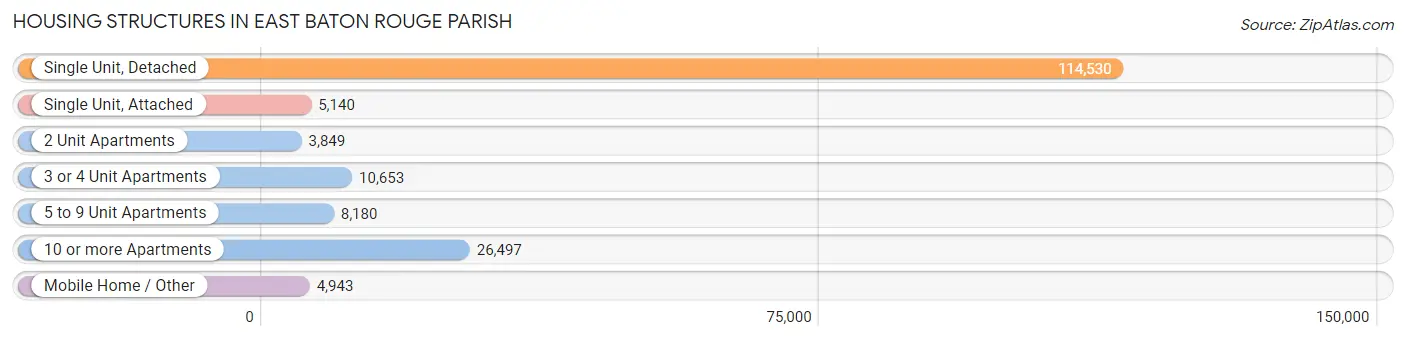
| Structure Type | # Housing Units | % Housing Units |
| Single Unit, Detached | 114,530 | 65.9% |
| Single Unit, Attached | 5,140 | 3.0% |
| 2 Unit Apartments | 3,849 | 2.2% |
| 3 or 4 Unit Apartments | 10,653 | 6.1% |
| 5 to 9 Unit Apartments | 8,180 | 4.7% |
| 10 or more Apartments | 26,497 | 15.2% |
| Mobile Home / Other | 4,943 | 2.8% |
| Total | 173,792 | 100.0% |
Housing Structures by Occupancy in East Baton Rouge Parish
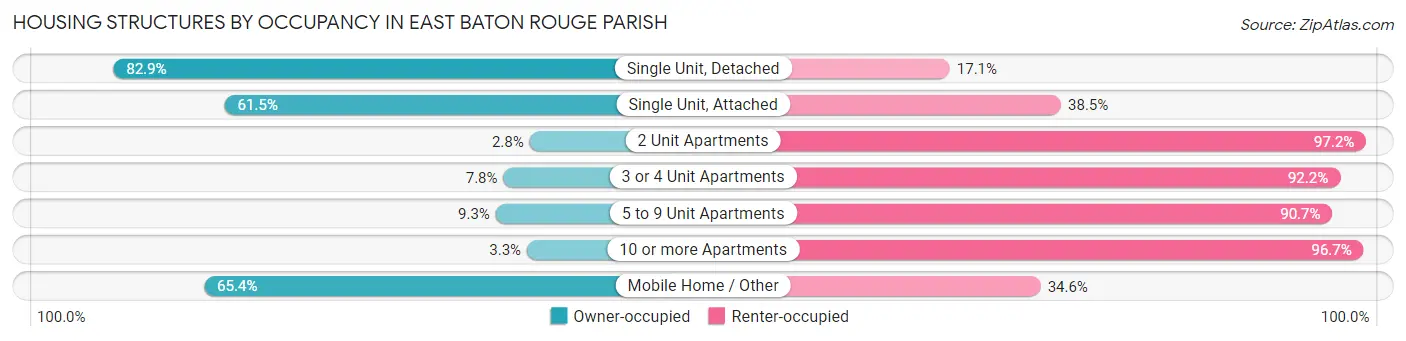
| Structure Type | Owner-occupied | Renter-occupied |
| Single Unit, Detached | 94,966 (82.9%) | 19,564 (17.1%) |
| Single Unit, Attached | 3,161 (61.5%) | 1,979 (38.5%) |
| 2 Unit Apartments | 107 (2.8%) | 3,742 (97.2%) |
| 3 or 4 Unit Apartments | 833 (7.8%) | 9,820 (92.2%) |
| 5 to 9 Unit Apartments | 761 (9.3%) | 7,419 (90.7%) |
| 10 or more Apartments | 868 (3.3%) | 25,629 (96.7%) |
| Mobile Home / Other | 3,234 (65.4%) | 1,709 (34.6%) |
| Total | 103,930 (59.8%) | 69,862 (40.2%) |
Housing Structures by Number of Rooms in East Baton Rouge Parish
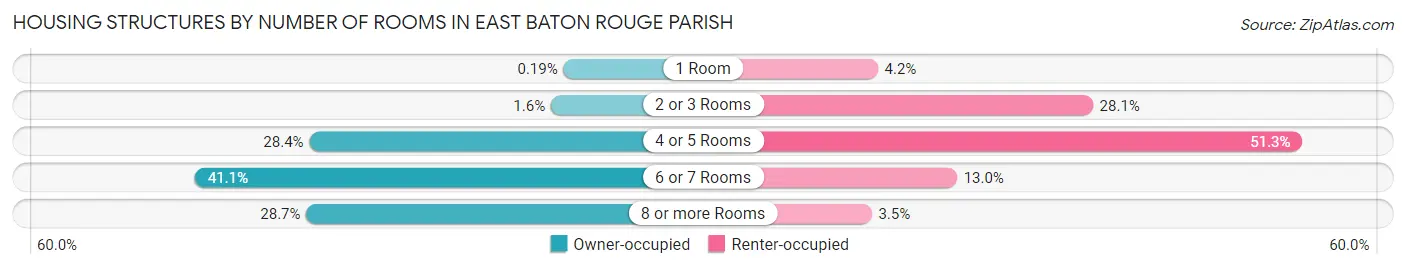
| Number of Rooms | Owner-occupied | Renter-occupied |
| 1 Room | 198 (0.2%) | 2,917 (4.2%) |
| 2 or 3 Rooms | 1,638 (1.6%) | 19,593 (28.1%) |
| 4 or 5 Rooms | 29,503 (28.4%) | 35,853 (51.3%) |
| 6 or 7 Rooms | 42,730 (41.1%) | 9,053 (13.0%) |
| 8 or more Rooms | 29,861 (28.7%) | 2,446 (3.5%) |
| Total | 103,930 (100.0%) | 69,862 (100.0%) |
Housing Structure by Heating Type in East Baton Rouge Parish
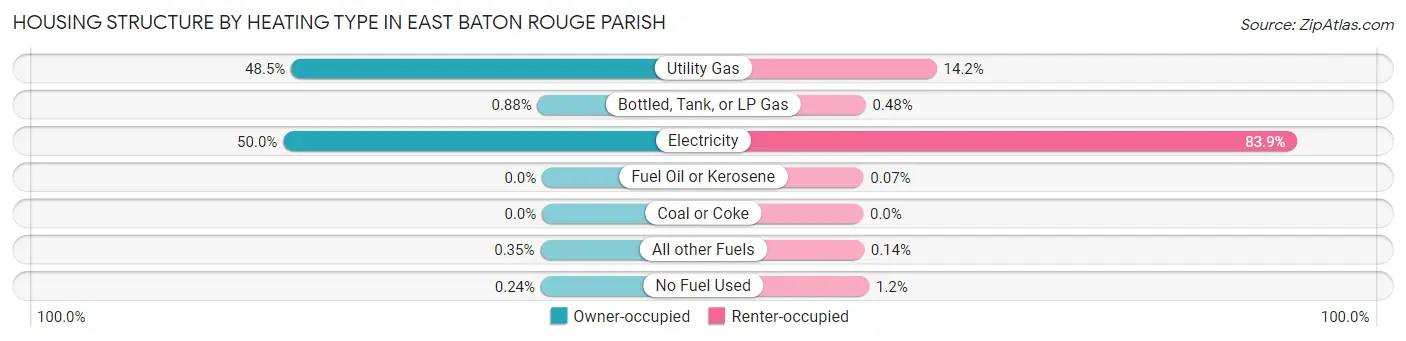
| Heating Type | Owner-occupied | Renter-occupied |
| Utility Gas | 50,391 (48.5%) | 9,935 (14.2%) |
| Bottled, Tank, or LP Gas | 918 (0.9%) | 332 (0.5%) |
| Electricity | 52,010 (50.0%) | 58,637 (83.9%) |
| Fuel Oil or Kerosene | 0 (0.0%) | 48 (0.1%) |
| Coal or Coke | 0 (0.0%) | 0 (0.0%) |
| All other Fuels | 365 (0.4%) | 101 (0.1%) |
| No Fuel Used | 246 (0.2%) | 809 (1.2%) |
| Total | 103,930 (100.0%) | 69,862 (100.0%) |
Household Vehicle Usage in East Baton Rouge Parish
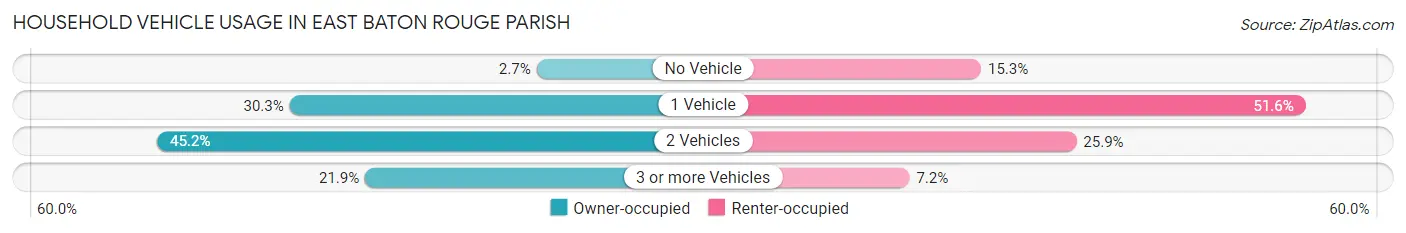
| Vehicles per Household | Owner-occupied | Renter-occupied |
| No Vehicle | 2,763 (2.7%) | 10,653 (15.2%) |
| 1 Vehicle | 31,516 (30.3%) | 36,042 (51.6%) |
| 2 Vehicles | 46,937 (45.2%) | 18,116 (25.9%) |
| 3 or more Vehicles | 22,714 (21.9%) | 5,051 (7.2%) |
| Total | 103,930 (100.0%) | 69,862 (100.0%) |
Real Estate & Mortgages in East Baton Rouge Parish
Real Estate and Mortgage Overview in East Baton Rouge Parish
| Characteristic | Without Mortgage | With Mortgage |
| Housing Units | 40,035 | 63,895 |
| Median Property Value | $207,200 | $244,800 |
| Median Household Income | $71,068 | $18,883 |
| Monthly Housing Costs | $477 | $6,814 |
| Real Estate Taxes | $1,141 | $3,289 |
Property Value by Mortgage Status in East Baton Rouge Parish
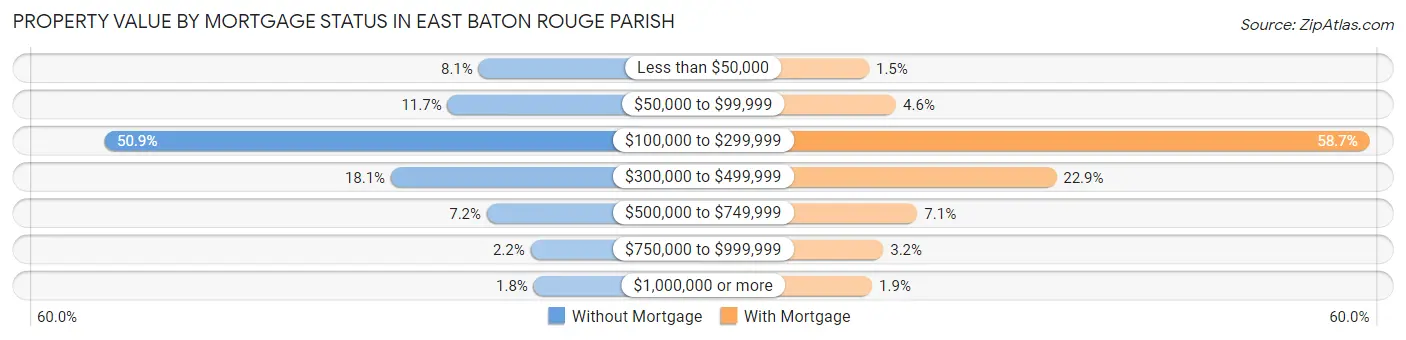
| Property Value | Without Mortgage | With Mortgage |
| Less than $50,000 | 3,246 (8.1%) | 984 (1.5%) |
| $50,000 to $99,999 | 4,672 (11.7%) | 2,967 (4.6%) |
| $100,000 to $299,999 | 20,387 (50.9%) | 37,529 (58.7%) |
| $300,000 to $499,999 | 7,260 (18.1%) | 14,655 (22.9%) |
| $500,000 to $749,999 | 2,869 (7.2%) | 4,517 (7.1%) |
| $750,000 to $999,999 | 873 (2.2%) | 2,027 (3.2%) |
| $1,000,000 or more | 728 (1.8%) | 1,216 (1.9%) |
| Total | 40,035 (100.0%) | 63,895 (100.0%) |
Household Income by Mortgage Status in East Baton Rouge Parish
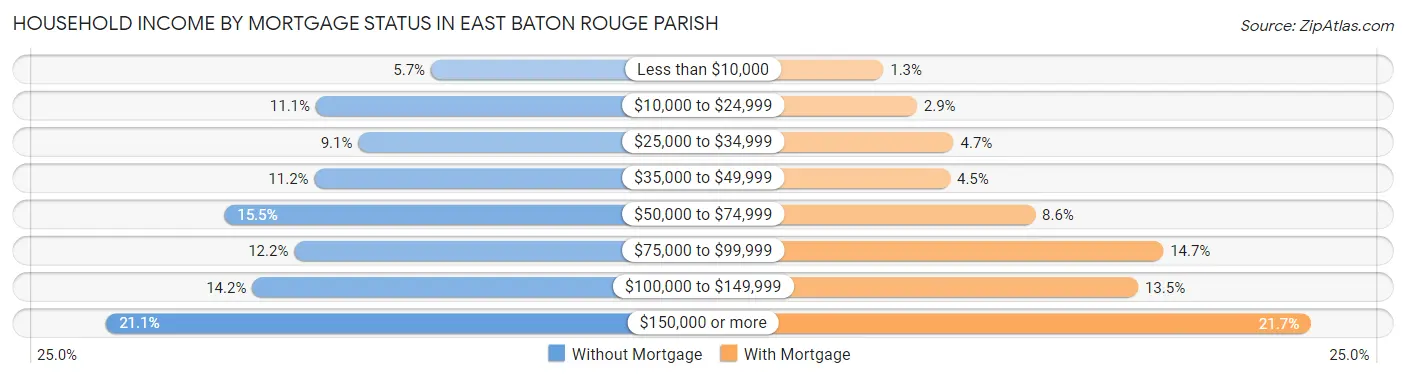
| Household Income | Without Mortgage | With Mortgage |
| Less than $10,000 | 2,262 (5.7%) | 844 (1.3%) |
| $10,000 to $24,999 | 4,455 (11.1%) | 1,864 (2.9%) |
| $25,000 to $34,999 | 3,647 (9.1%) | 2,986 (4.7%) |
| $35,000 to $49,999 | 4,482 (11.2%) | 2,878 (4.5%) |
| $50,000 to $74,999 | 6,200 (15.5%) | 5,466 (8.6%) |
| $75,000 to $99,999 | 4,870 (12.2%) | 9,363 (14.6%) |
| $100,000 to $149,999 | 5,667 (14.2%) | 8,593 (13.5%) |
| $150,000 or more | 8,452 (21.1%) | 13,862 (21.7%) |
| Total | 40,035 (100.0%) | 63,895 (100.0%) |
Property Value to Household Income Ratio in East Baton Rouge Parish
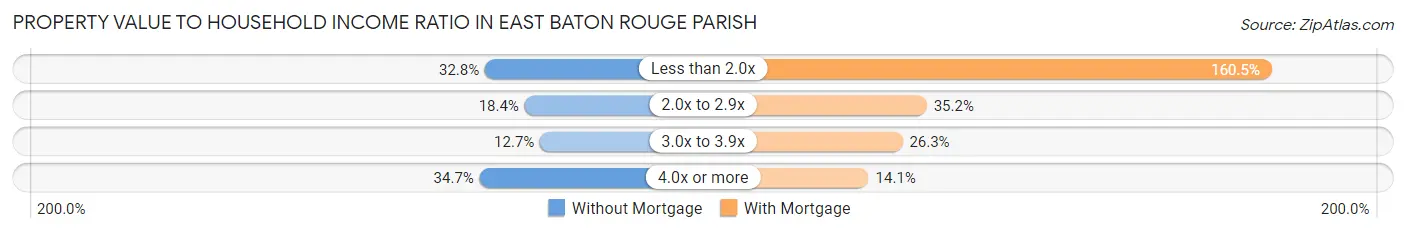
| Value-to-Income Ratio | Without Mortgage | With Mortgage |
| Less than 2.0x | 13,111 (32.8%) | 102,532 (160.5%) |
| 2.0x to 2.9x | 7,347 (18.3%) | 22,474 (35.2%) |
| 3.0x to 3.9x | 5,101 (12.7%) | 16,828 (26.3%) |
| 4.0x or more | 13,897 (34.7%) | 8,990 (14.1%) |
| Total | 40,035 (100.0%) | 63,895 (100.0%) |
Real Estate Taxes by Mortgage Status in East Baton Rouge Parish
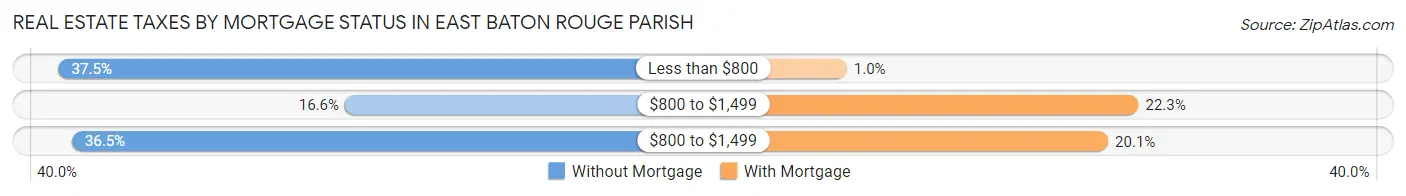
| Property Taxes | Without Mortgage | With Mortgage |
| Less than $800 | 15,017 (37.5%) | 644 (1.0%) |
| $800 to $1,499 | 6,645 (16.6%) | 14,262 (22.3%) |
| $800 to $1,499 | 14,629 (36.5%) | 12,845 (20.1%) |
| Total | 40,035 (100.0%) | 63,895 (100.0%) |
Health & Disability in East Baton Rouge Parish
Health Insurance Coverage by Age in East Baton Rouge Parish
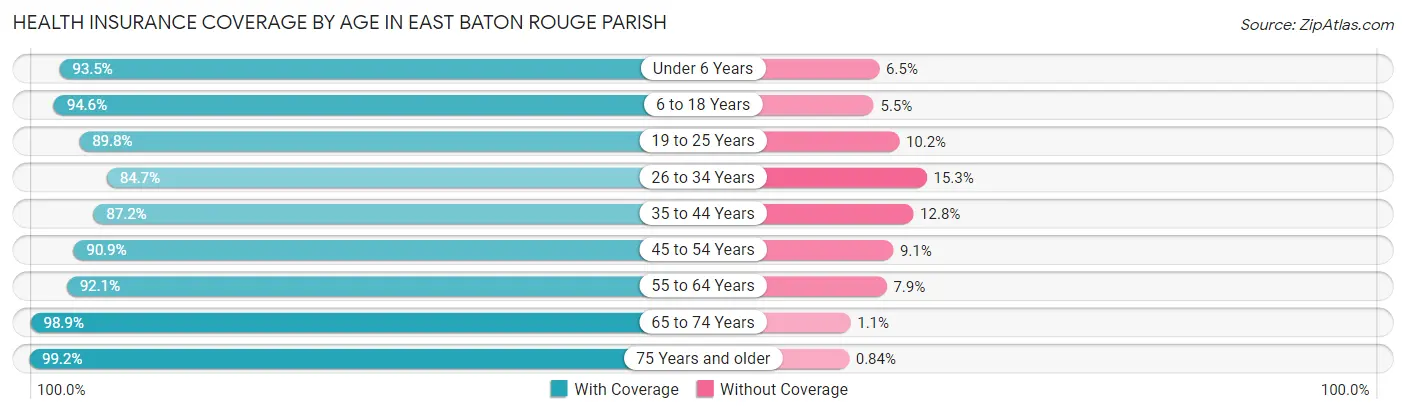
| Age Bracket | With Coverage | Without Coverage |
| Under 6 Years | 32,853 (93.5%) | 2,284 (6.5%) |
| 6 to 18 Years | 72,074 (94.6%) | 4,158 (5.4%) |
| 19 to 25 Years | 57,807 (89.8%) | 6,560 (10.2%) |
| 26 to 34 Years | 47,461 (84.7%) | 8,601 (15.3%) |
| 35 to 44 Years | 48,087 (87.2%) | 7,085 (12.8%) |
| 45 to 54 Years | 42,961 (90.9%) | 4,293 (9.1%) |
| 55 to 64 Years | 47,537 (92.1%) | 4,053 (7.9%) |
| 65 to 74 Years | 40,198 (98.9%) | 455 (1.1%) |
| 75 Years and older | 24,427 (99.2%) | 208 (0.8%) |
| Total | 413,405 (91.6%) | 37,697 (8.4%) |
Health Insurance Coverage by Citizenship Status in East Baton Rouge Parish
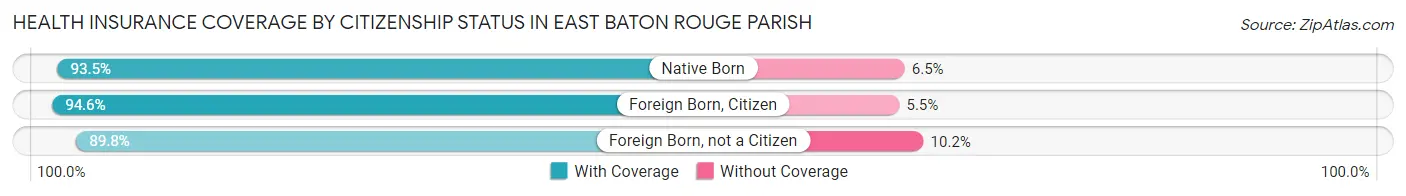
| Citizenship Status | With Coverage | Without Coverage |
| Native Born | 32,853 (93.5%) | 2,284 (6.5%) |
| Foreign Born, Citizen | 72,074 (94.6%) | 4,158 (5.4%) |
| Foreign Born, not a Citizen | 57,807 (89.8%) | 6,560 (10.2%) |
Health Insurance Coverage by Household Income in East Baton Rouge Parish
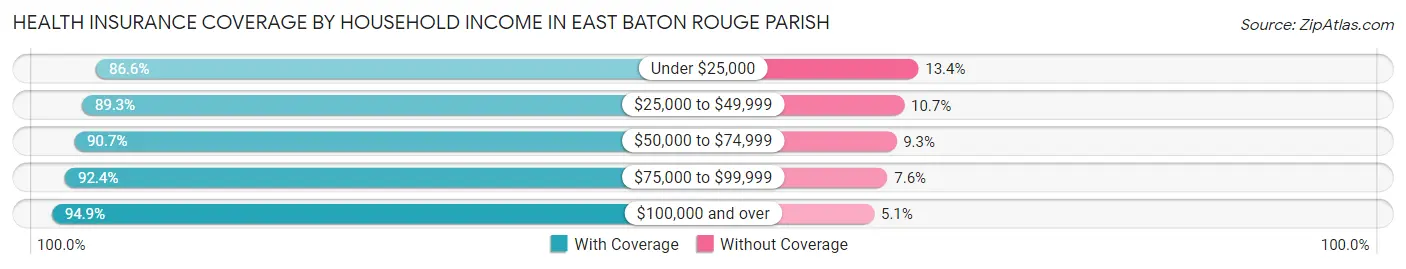
| Household Income | With Coverage | Without Coverage |
| Under $25,000 | 61,248 (86.6%) | 9,468 (13.4%) |
| $25,000 to $49,999 | 74,190 (89.3%) | 8,915 (10.7%) |
| $50,000 to $74,999 | 60,000 (90.7%) | 6,120 (9.3%) |
| $75,000 to $99,999 | 48,082 (92.4%) | 3,951 (7.6%) |
| $100,000 and over | 160,504 (94.9%) | 8,624 (5.1%) |
Public vs Private Health Insurance Coverage by Age in East Baton Rouge Parish
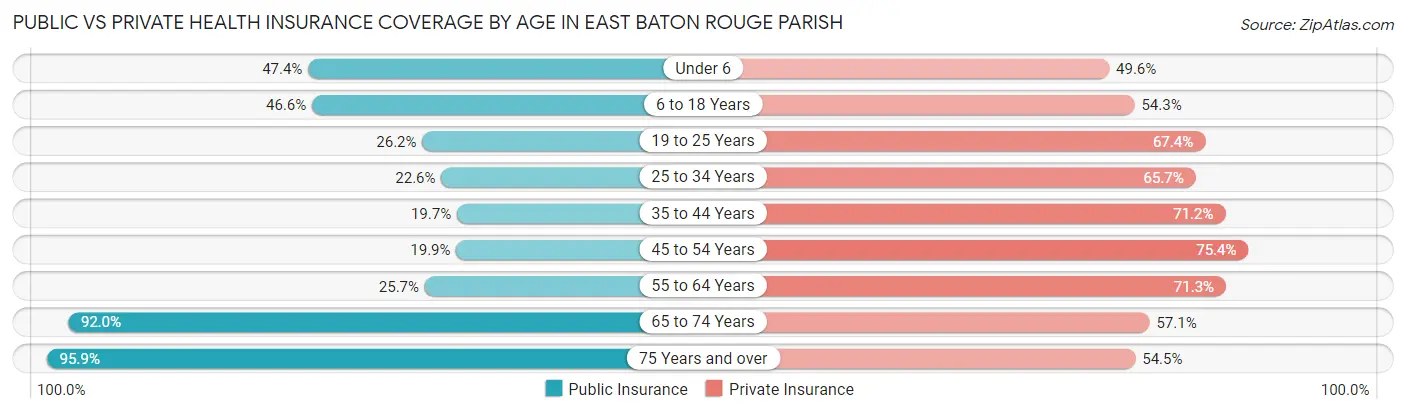
| Age Bracket | Public Insurance | Private Insurance |
| Under 6 | 16,640 (47.4%) | 17,434 (49.6%) |
| 6 to 18 Years | 35,550 (46.6%) | 41,418 (54.3%) |
| 19 to 25 Years | 16,843 (26.2%) | 43,389 (67.4%) |
| 25 to 34 Years | 12,695 (22.6%) | 36,814 (65.7%) |
| 35 to 44 Years | 10,893 (19.7%) | 39,272 (71.2%) |
| 45 to 54 Years | 9,385 (19.9%) | 35,650 (75.4%) |
| 55 to 64 Years | 13,257 (25.7%) | 36,778 (71.3%) |
| 65 to 74 Years | 37,394 (92.0%) | 23,215 (57.1%) |
| 75 Years and over | 23,630 (95.9%) | 13,421 (54.5%) |
| Total | 176,287 (39.1%) | 287,391 (63.7%) |
Disability Status by Sex by Age in East Baton Rouge Parish
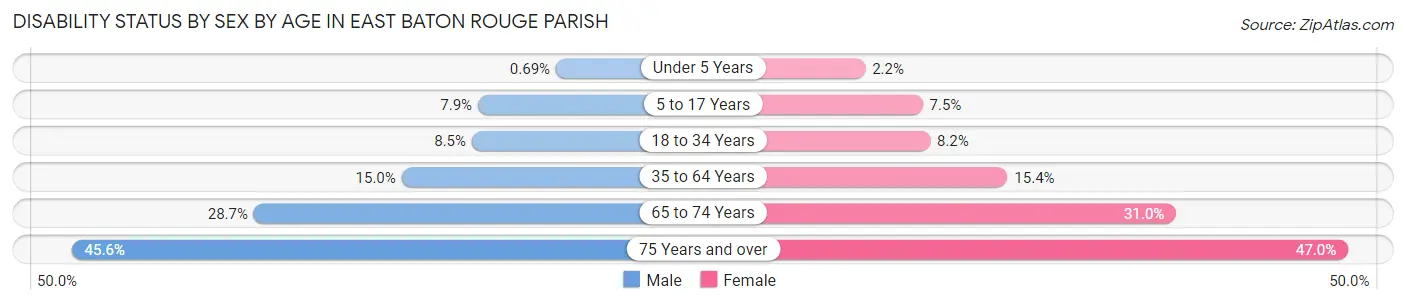
| Age Bracket | Male | Female |
| Under 5 Years | 99 (0.7%) | 301 (2.2%) |
| 5 to 17 Years | 2,946 (7.9%) | 2,680 (7.5%) |
| 18 to 34 Years | 5,386 (8.5%) | 5,505 (8.2%) |
| 35 to 64 Years | 10,991 (15.0%) | 12,417 (15.4%) |
| 65 to 74 Years | 5,259 (28.7%) | 6,934 (31.0%) |
| 75 Years and over | 4,372 (45.6%) | 7,072 (47.0%) |
Disability Class by Sex by Age in East Baton Rouge Parish
Disability Class: Hearing Difficulty
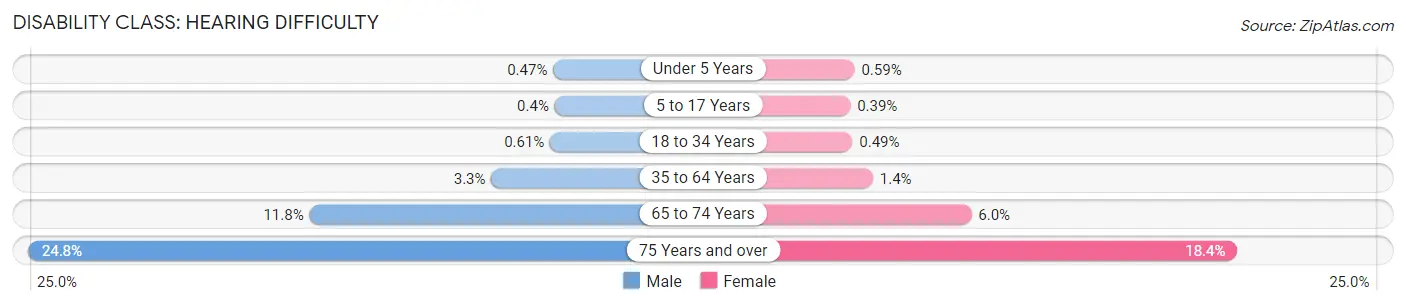
| Age Bracket | Male | Female |
| Under 5 Years | 68 (0.5%) | 82 (0.6%) |
| 5 to 17 Years | 148 (0.4%) | 139 (0.4%) |
| 18 to 34 Years | 387 (0.6%) | 328 (0.5%) |
| 35 to 64 Years | 2,445 (3.3%) | 1,167 (1.4%) |
| 65 to 74 Years | 2,157 (11.8%) | 1,342 (6.0%) |
| 75 Years and over | 2,376 (24.8%) | 2,762 (18.3%) |
Disability Class: Vision Difficulty
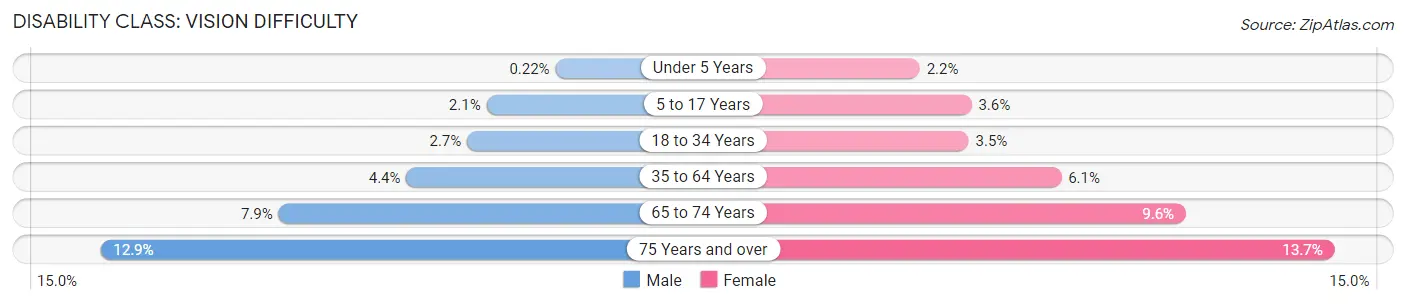
| Age Bracket | Male | Female |
| Under 5 Years | 31 (0.2%) | 301 (2.2%) |
| 5 to 17 Years | 795 (2.1%) | 1,289 (3.6%) |
| 18 to 34 Years | 1,704 (2.7%) | 2,376 (3.5%) |
| 35 to 64 Years | 3,199 (4.4%) | 4,940 (6.1%) |
| 65 to 74 Years | 1,452 (7.9%) | 2,141 (9.6%) |
| 75 Years and over | 1,235 (12.9%) | 2,066 (13.7%) |
Disability Class: Cognitive Difficulty
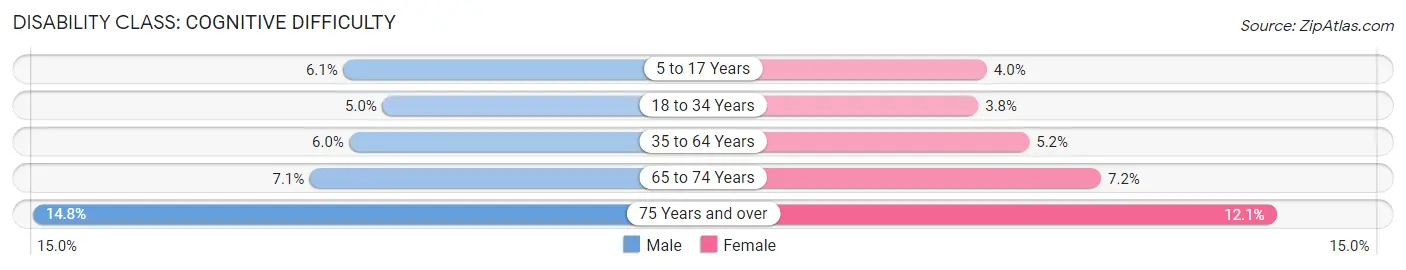
| Age Bracket | Male | Female |
| 5 to 17 Years | 2,274 (6.1%) | 1,443 (4.0%) |
| 18 to 34 Years | 3,192 (5.0%) | 2,553 (3.8%) |
| 35 to 64 Years | 4,357 (5.9%) | 4,220 (5.2%) |
| 65 to 74 Years | 1,290 (7.0%) | 1,614 (7.2%) |
| 75 Years and over | 1,415 (14.8%) | 1,821 (12.1%) |
Disability Class: Ambulatory Difficulty
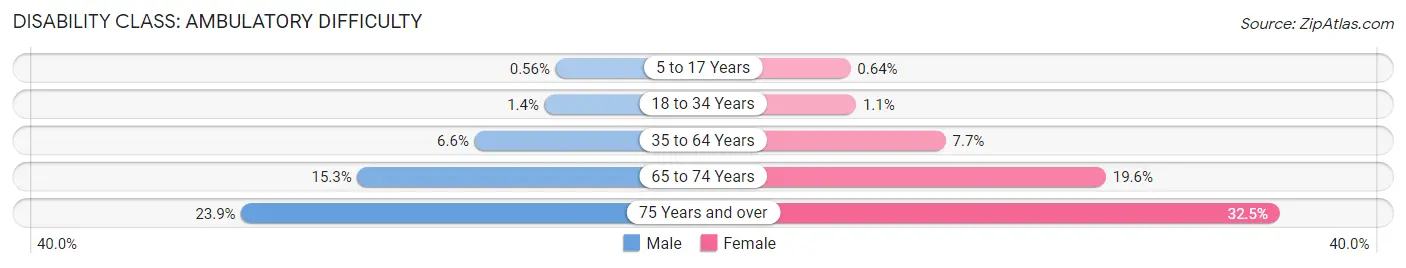
| Age Bracket | Male | Female |
| 5 to 17 Years | 207 (0.6%) | 230 (0.6%) |
| 18 to 34 Years | 876 (1.4%) | 704 (1.1%) |
| 35 to 64 Years | 4,814 (6.6%) | 6,230 (7.7%) |
| 65 to 74 Years | 2,797 (15.3%) | 4,379 (19.6%) |
| 75 Years and over | 2,290 (23.9%) | 4,896 (32.5%) |
Disability Class: Self-Care Difficulty
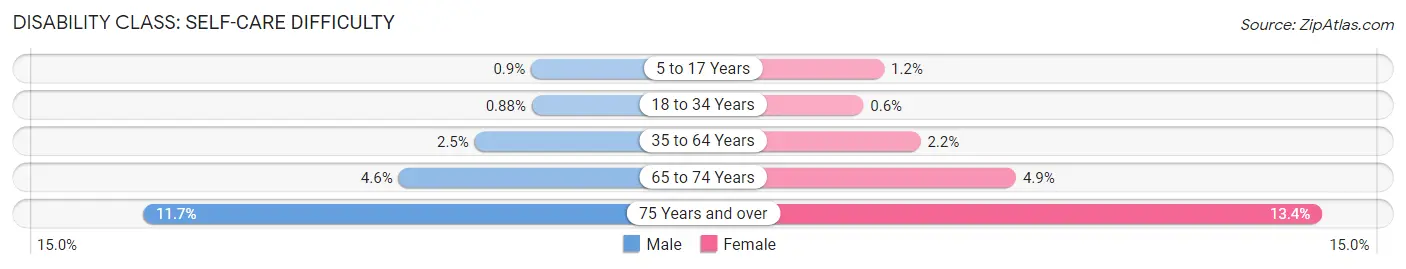
| Age Bracket | Male | Female |
| 5 to 17 Years | 334 (0.9%) | 420 (1.2%) |
| 18 to 34 Years | 556 (0.9%) | 403 (0.6%) |
| 35 to 64 Years | 1,808 (2.5%) | 1,767 (2.2%) |
| 65 to 74 Years | 840 (4.6%) | 1,084 (4.9%) |
| 75 Years and over | 1,121 (11.7%) | 2,012 (13.4%) |
Technology Access in East Baton Rouge Parish
Computing Device Access in East Baton Rouge Parish
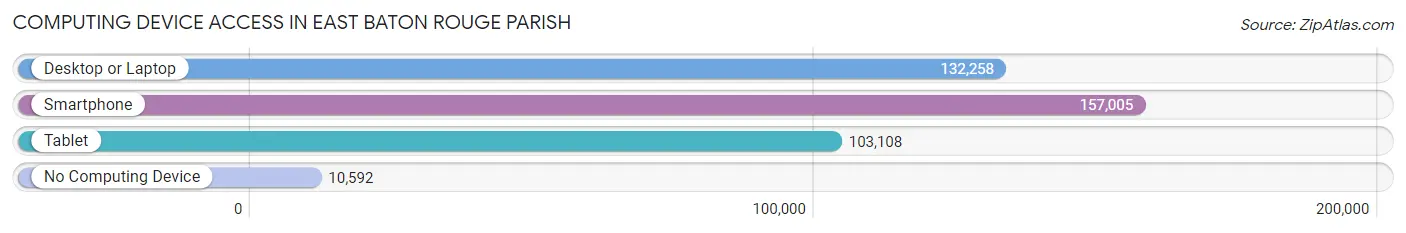
| Device Type | # Households | % Households |
| Desktop or Laptop | 132,258 | 76.1% |
| Smartphone | 157,005 | 90.3% |
| Tablet | 103,108 | 59.3% |
| No Computing Device | 10,592 | 6.1% |
| Total | 173,792 | 100.0% |
Internet Access in East Baton Rouge Parish
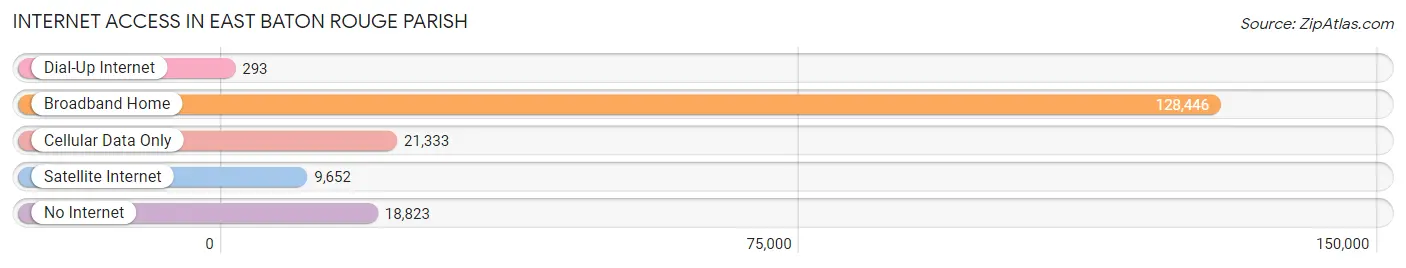
| Internet Type | # Households | % Households |
| Dial-Up Internet | 293 | 0.2% |
| Broadband Home | 128,446 | 73.9% |
| Cellular Data Only | 21,333 | 12.3% |
| Satellite Internet | 9,652 | 5.6% |
| No Internet | 18,823 | 10.8% |
| Total | 173,792 | 100.0% |
East Baton Rouge Parish Summary
East Baton Rouge Parish, Louisiana is located in the southeastern part of the state and is the most populous parish in the state. It is bordered by the Mississippi River to the east, the Amite River to the west, and the Tangipahoa River to the north. The parish seat is the city of Baton Rouge, which is also the state capital.
Geography
East Baton Rouge Parish covers an area of 576 square miles and is located in the southeastern part of the state. It is bordered by the Mississippi River to the east, the Amite River to the west, and the Tangipahoa River to the north. The parish is divided into two distinct regions: the northern region is mostly rural and agricultural, while the southern region is more urban and industrialized. The parish is home to several lakes, including Lake Maurepas, Lake Pontchartrain, and Lake St. John.
The parish is home to several parks, including the Baton Rouge Zoo, the Louisiana State University campus, and the Louisiana State Capitol. The parish is also home to several historic sites, including the Old State Capitol, the Old Governor's Mansion, and the Old Arsenal.
History
East Baton Rouge Parish was established in 1810, when the Louisiana Territory was divided into parishes. The parish was named after the French explorer Pierre Le Moyne d'Iberville, who founded the city of Baton Rouge in 1699.
The parish was originally a rural area, but it began to develop rapidly in the late 19th century with the arrival of the railroad. The city of Baton Rouge became the state capital in 1879, and the parish experienced a population boom in the early 20th century.
The parish was the site of several major civil rights protests in the 1960s, including the 1963 March on Washington and the 1965 Selma to Montgomery march. The parish was also the site of the 1968 assassination of civil rights leader Dr. Martin Luther King Jr.
Economy
East Baton Rouge Parish is home to a diverse economy. The largest employers in the parish are the state government, Louisiana State University, and the Baton Rouge Metropolitan Airport. Other major employers include the petrochemical industry, healthcare, and education.
The parish is also home to several major shopping centers, including the Mall of Louisiana, the Cortana Mall, and the Perkins Rowe Shopping Center.
Demographics
As of the 2010 census, East Baton Rouge Parish had a population of 440,171. The racial makeup of the parish was 57.2% African American, 37.3% White, 2.2% Asian, 0.7% Native American, and 2.6% from other races.
The median household income in the parish was $45,945, and the median family income was $54,828. The per capita income was $25,945. The poverty rate was 22.3%.
Conclusion
East Baton Rouge Parish is a diverse and vibrant parish located in the southeastern part of Louisiana. It is home to a diverse economy, with the state government, Louisiana State University, and the petrochemical industry being the largest employers. The parish is also home to several historic sites, parks, and shopping centers. The population of the parish is largely African American, with a median household income of $45,945 and a poverty rate of 22.3%.
Common Questions
What is the Total Population of East Baton Rouge Parish?
Total Population of East Baton Rouge Parish is 454,369.
What is the Total Male Population of East Baton Rouge Parish?
Total Male Population of East Baton Rouge Parish is 217,767.
What is the Total Female Population of East Baton Rouge Parish?
Total Female Population of East Baton Rouge Parish is 236,602.
What is the Ratio of Males per 100 Females in East Baton Rouge Parish?
There are 92.04 Males per 100 Females in East Baton Rouge Parish.
What is the Ratio of Females per 100 Males in East Baton Rouge Parish?
There are 108.65 Females per 100 Males in East Baton Rouge Parish.
What is the Median Population Age in East Baton Rouge Parish?
Median Population Age in East Baton Rouge Parish is 34.0 Years.
What is the Average Family Size in East Baton Rouge Parish
Average Family Size in East Baton Rouge Parish is 3.3 People.
What is the Average Household Size in East Baton Rouge Parish
Average Household Size in East Baton Rouge Parish is 2.5 People.
What is Per Capita Income in East Baton Rouge Parish?
Per Capita income in East Baton Rouge Parish is $37,540.
What is the Median Family Income in East Baton Rouge Parish?
Median Family Income in East Baton Rouge Parish is $82,355.
What is the Median Household income in East Baton Rouge Parish?
Median Household Income in East Baton Rouge Parish is $62,083.
What is Income or Wage Gap in East Baton Rouge Parish?
Income or Wage Gap in East Baton Rouge Parish is 35.4%.
Women in East Baton Rouge Parish earn 64.6 cents for every dollar earned by a man.
What is Family Income Deficit in East Baton Rouge Parish?
Family Income Deficit in East Baton Rouge Parish is $11,222.
Families that are below poverty line in East Baton Rouge Parish earn $11,222 less on average than the poverty threshold level.
What is Inequality or Gini Index in East Baton Rouge Parish?
Inequality or Gini Index in East Baton Rouge Parish is 0.51.
How Large is the Labor Force in East Baton Rouge Parish?
There are 234,747 People in the Labor Forcein in East Baton Rouge Parish.
What is the Percentage of People in the Labor Force in East Baton Rouge Parish?
64.4% of People are in the Labor Force in East Baton Rouge Parish.
What is the Unemployment Rate in East Baton Rouge Parish?
Unemployment Rate in East Baton Rouge Parish is 7.1%.