De Soto Parish, LA
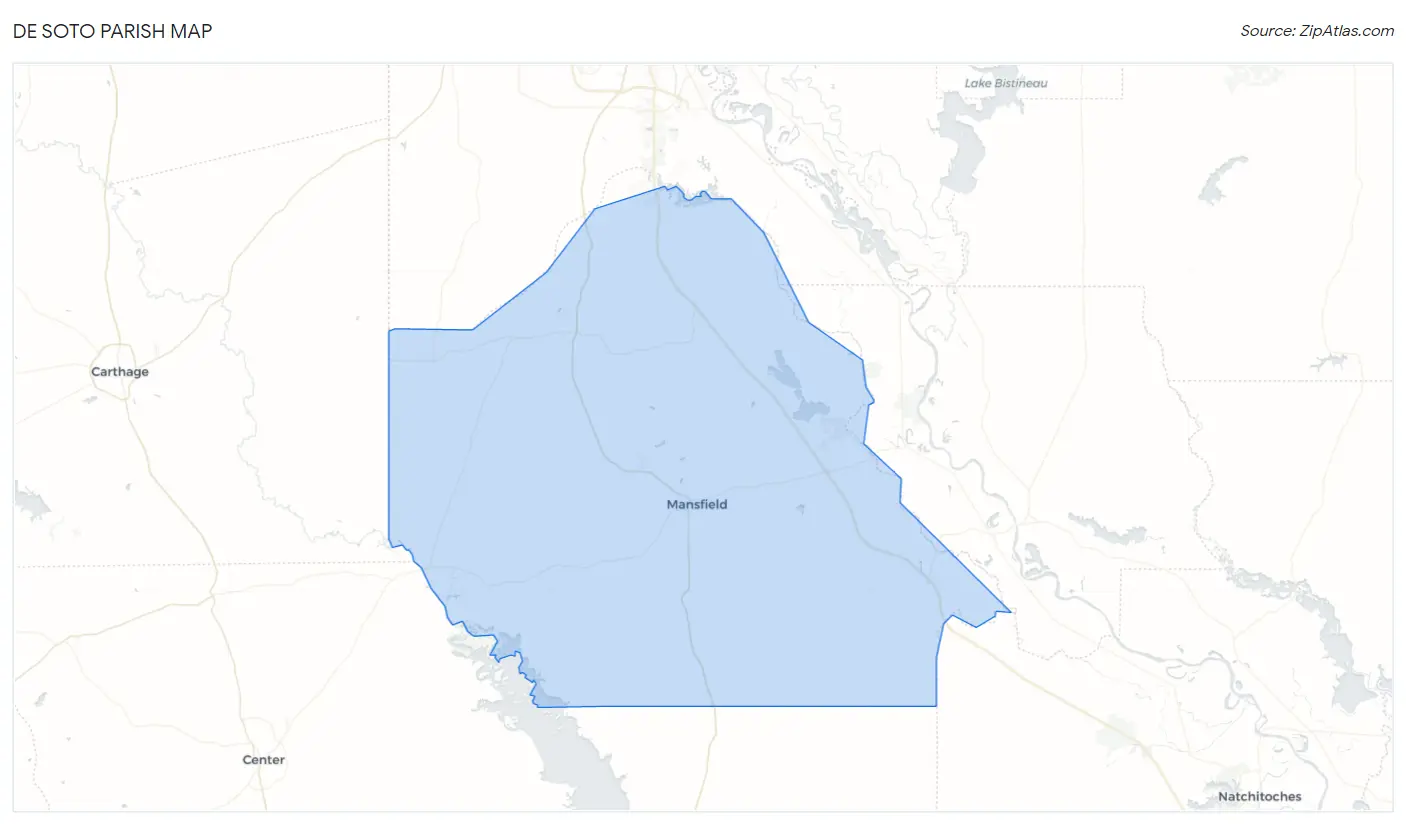
De Soto Parish Map
De Soto Parish Overview
26,821
TOTAL POPULATION
13,130
MALE POPULATION
13,691
FEMALE POPULATION
95.90
MALES / 100 FEMALES
104.27
FEMALES / 100 MALES
39.3
MEDIAN AGE
3.1
AVG FAMILY SIZE
2.6
AVG HOUSEHOLD SIZE
$28,772
PER CAPITA INCOME
$59,472
AVG FAMILY INCOME
$49,807
AVG HOUSEHOLD INCOME
44.0%
WAGE / INCOME GAP [ % ]
56.0¢/ $1
WAGE / INCOME GAP [ $ ]
$10,165
FAMILY INCOME DEFICIT
0.49
INEQUALITY / GINI INDEX
11,133
LABOR FORCE [ PEOPLE ]
52.4%
PERCENT IN LABOR FORCE
6.9%
UNEMPLOYMENT RATE
De Soto Parish Area Codes
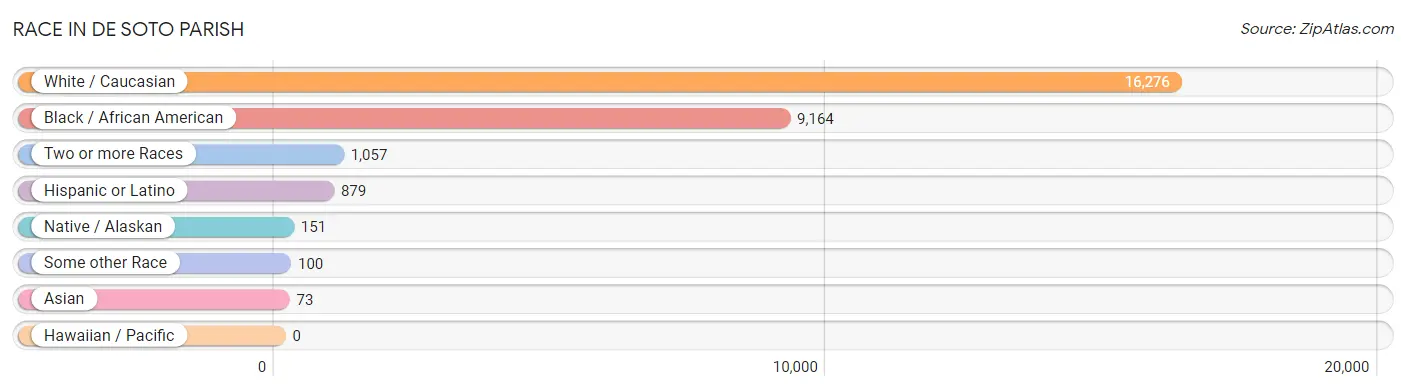
Race in De Soto Parish
The most populous races in De Soto Parish are White / Caucasian (16,276 | 60.7%), Black / African American (9,164 | 34.2%), and Two or more Races (1,057 | 3.9%).
| Race | # Population | % Population |
| Asian | 73 | 0.3% |
| Black / African American | 9,164 | 34.2% |
| Hawaiian / Pacific | 0 | 0.0% |
| Hispanic or Latino | 879 | 3.3% |
| Native / Alaskan | 151 | 0.6% |
| White / Caucasian | 16,276 | 60.7% |
| Two or more Races | 1,057 | 3.9% |
| Some other Race | 100 | 0.4% |
| Total | 26,821 | 100.0% |
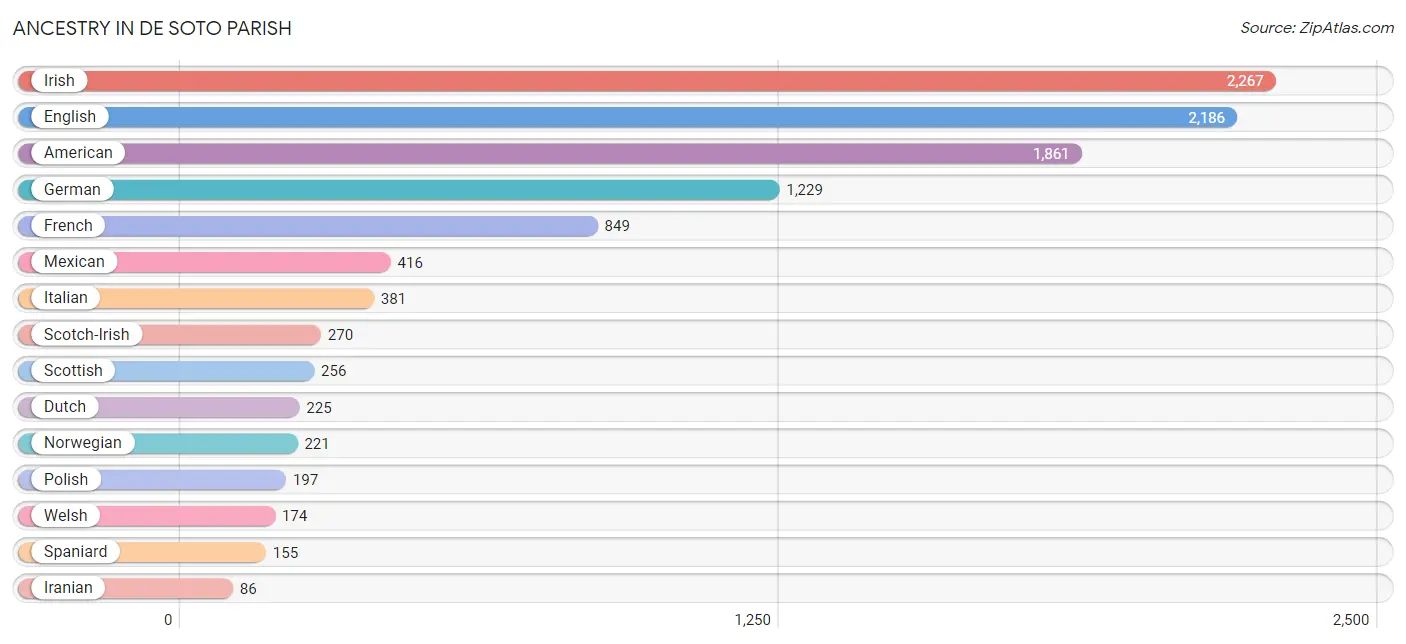
Ancestry in De Soto Parish
The most populous ancestries reported in De Soto Parish are Irish (2,267 | 8.5%), English (2,186 | 8.2%), American (1,861 | 6.9%), German (1,229 | 4.6%), and French (849 | 3.2%), together accounting for 31.3% of all De Soto Parish residents.
| Ancestry | # Population | % Population |
| African | 15 | 0.1% |
| American | 1,861 | 6.9% |
| Apache | 21 | 0.1% |
| Arab | 5 | 0.0% |
| Belgian | 6 | 0.0% |
| Blackfeet | 1 | 0.0% |
| Brazilian | 9 | 0.0% |
| British | 50 | 0.2% |
| Burmese | 5 | 0.0% |
| Cajun | 52 | 0.2% |
| Cherokee | 66 | 0.3% |
| Chickasaw | 1 | 0.0% |
| Choctaw | 67 | 0.3% |
| Creek | 12 | 0.0% |
| Czech | 25 | 0.1% |
| Czechoslovakian | 34 | 0.1% |
| Danish | 1 | 0.0% |
| Dutch | 225 | 0.8% |
| Eastern European | 26 | 0.1% |
| English | 2,186 | 8.2% |
| European | 85 | 0.3% |
| French | 849 | 3.2% |
| French Canadian | 19 | 0.1% |
| German | 1,229 | 4.6% |
| Greek | 19 | 0.1% |
| Haitian | 57 | 0.2% |
| Indian (Asian) | 5 | 0.0% |
| Iranian | 86 | 0.3% |
| Irish | 2,267 | 8.5% |
| Italian | 381 | 1.4% |
| Korean | 9 | 0.0% |
| Mexican | 416 | 1.5% |
| Navajo | 6 | 0.0% |
| Norwegian | 221 | 0.8% |
| Pakistani | 18 | 0.1% |
| Peruvian | 40 | 0.2% |
| Polish | 197 | 0.7% |
| Portuguese | 3 | 0.0% |
| Puerto Rican | 12 | 0.0% |
| Romanian | 8 | 0.0% |
| Scandinavian | 73 | 0.3% |
| Scotch-Irish | 270 | 1.0% |
| Scottish | 256 | 0.9% |
| Seminole | 1 | 0.0% |
| South American | 40 | 0.2% |
| Spaniard | 155 | 0.6% |
| Spanish | 41 | 0.2% |
| Sri Lankan | 46 | 0.2% |
| Subsaharan African | 15 | 0.1% |
| Swedish | 11 | 0.0% |
| Swiss | 21 | 0.1% |
| Syrian | 5 | 0.0% |
| Ukrainian | 18 | 0.1% |
| Welsh | 174 | 0.6% |
| West Indian | 3 | 0.0% |
| Yugoslavian | 1 | 0.0% | View All 56 Rows |
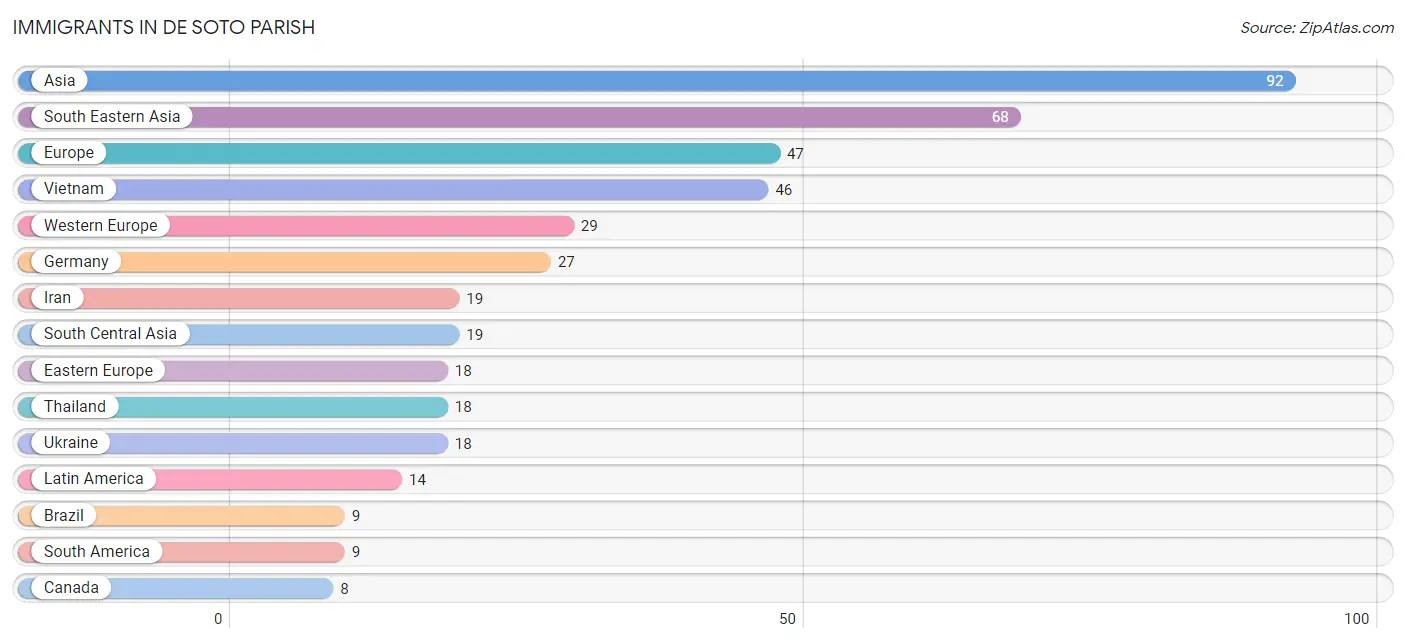
Immigrants in De Soto Parish
The most numerous immigrant groups reported in De Soto Parish came from Asia (92 | 0.3%), South Eastern Asia (68 | 0.3%), Europe (47 | 0.2%), Vietnam (46 | 0.2%), and Western Europe (29 | 0.1%), together accounting for 1.1% of all De Soto Parish residents.
| Immigration Origin | # Population | % Population |
| Asia | 92 | 0.3% |
| Brazil | 9 | 0.0% |
| Canada | 8 | 0.0% |
| Caribbean | 5 | 0.0% |
| China | 5 | 0.0% |
| Dominica | 5 | 0.0% |
| Eastern Asia | 5 | 0.0% |
| Eastern Europe | 18 | 0.1% |
| Europe | 47 | 0.2% |
| France | 2 | 0.0% |
| Germany | 27 | 0.1% |
| Iran | 19 | 0.1% |
| Latin America | 14 | 0.1% |
| Philippines | 4 | 0.0% |
| South America | 9 | 0.0% |
| South Central Asia | 19 | 0.1% |
| South Eastern Asia | 68 | 0.3% |
| Thailand | 18 | 0.1% |
| Ukraine | 18 | 0.1% |
| Vietnam | 46 | 0.2% |
| Western Europe | 29 | 0.1% | View All 21 Rows |
Sex and Age in De Soto Parish
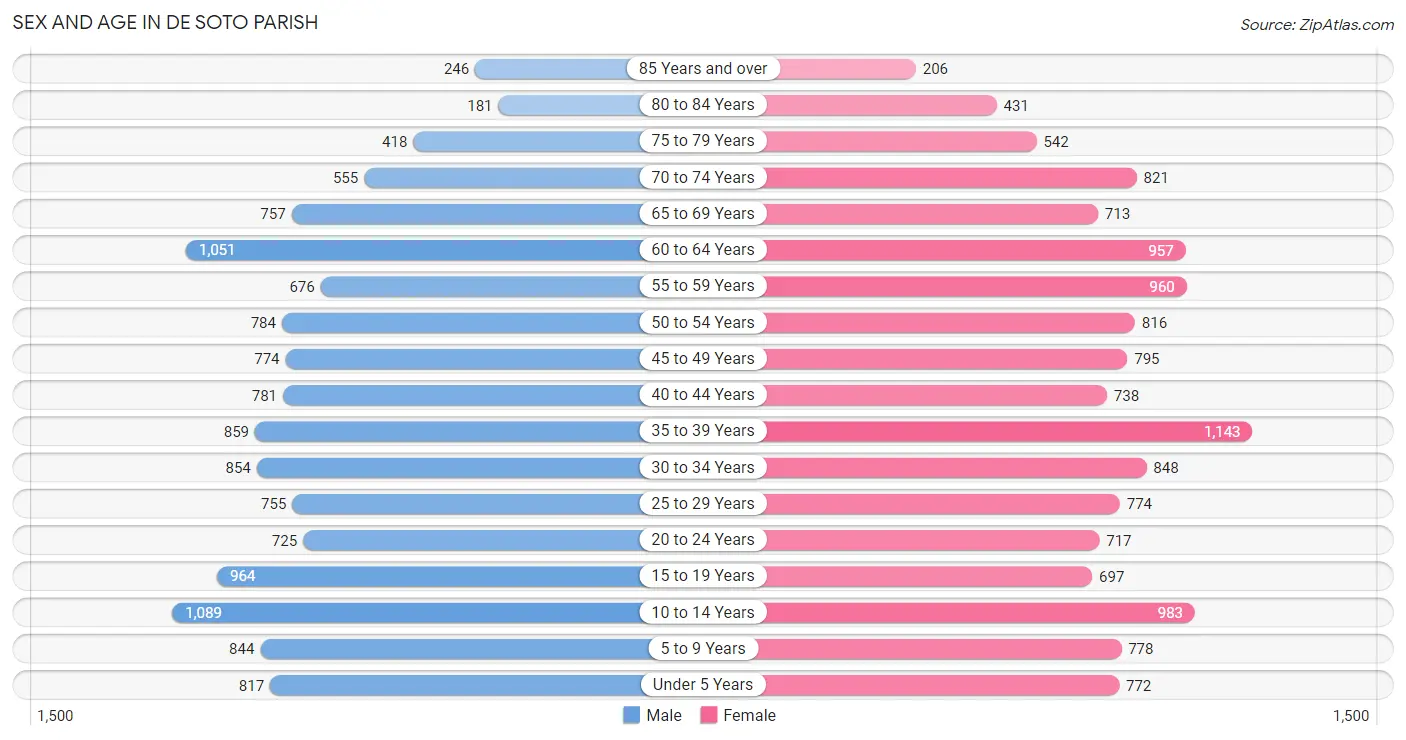
Sex and Age in De Soto Parish
The most populous age groups in De Soto Parish are 10 to 14 Years (1,089 | 8.3%) for men and 35 to 39 Years (1,143 | 8.4%) for women.
| Age Bracket | Male | Female |
| Under 5 Years | 817 (6.2%) | 772 (5.6%) |
| 5 to 9 Years | 844 (6.4%) | 778 (5.7%) |
| 10 to 14 Years | 1,089 (8.3%) | 983 (7.2%) |
| 15 to 19 Years | 964 (7.3%) | 697 (5.1%) |
| 20 to 24 Years | 725 (5.5%) | 717 (5.2%) |
| 25 to 29 Years | 755 (5.8%) | 774 (5.7%) |
| 30 to 34 Years | 854 (6.5%) | 848 (6.2%) |
| 35 to 39 Years | 859 (6.5%) | 1,143 (8.4%) |
| 40 to 44 Years | 781 (5.9%) | 738 (5.4%) |
| 45 to 49 Years | 774 (5.9%) | 795 (5.8%) |
| 50 to 54 Years | 784 (6.0%) | 816 (6.0%) |
| 55 to 59 Years | 676 (5.1%) | 960 (7.0%) |
| 60 to 64 Years | 1,051 (8.0%) | 957 (7.0%) |
| 65 to 69 Years | 757 (5.8%) | 713 (5.2%) |
| 70 to 74 Years | 555 (4.2%) | 821 (6.0%) |
| 75 to 79 Years | 418 (3.2%) | 542 (4.0%) |
| 80 to 84 Years | 181 (1.4%) | 431 (3.2%) |
| 85 Years and over | 246 (1.9%) | 206 (1.5%) |
| Total | 13,130 (100.0%) | 13,691 (100.0%) |
Families and Households in De Soto Parish
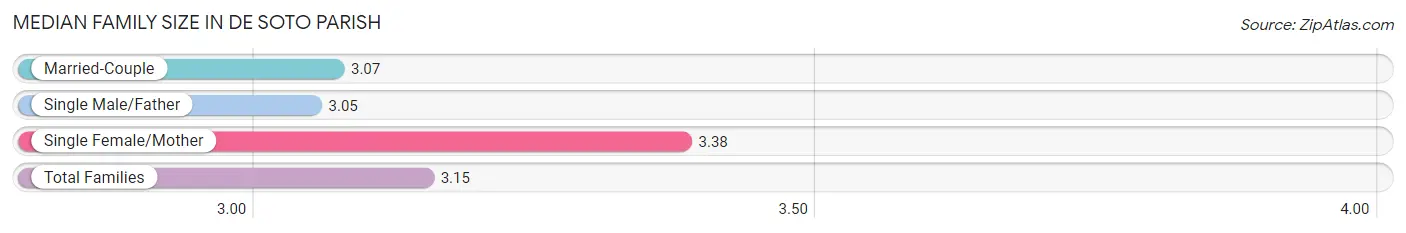
Median Family Size in De Soto Parish
The median family size in De Soto Parish is 3.15 persons per family, with single female/mother families (1,902 | 26.7%) accounting for the largest median family size of 3.38 persons per family. On the other hand, single male/father families (584 | 8.2%) represent the smallest median family size with 3.05 persons per family.
| Family Type | # Families | Family Size |
| Married-Couple | 4,644 (65.1%) | 3.07 |
| Single Male/Father | 584 (8.2%) | 3.05 |
| Single Female/Mother | 1,902 (26.7%) | 3.38 |
| Total Families | 7,130 (100.0%) | 3.15 |
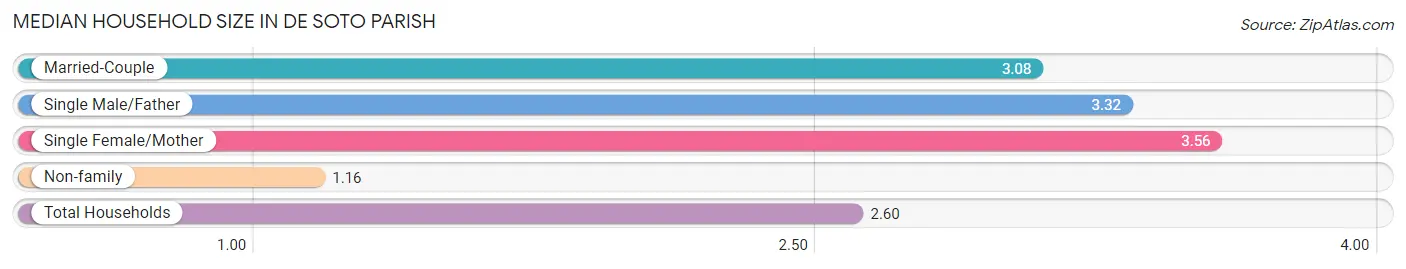
Median Household Size in De Soto Parish
The median household size in De Soto Parish is 2.60 persons per household, with single female/mother households (1,902 | 18.6%) accounting for the largest median household size of 3.56 persons per household. non-family households (3,105 | 30.3%) represent the smallest median household size with 1.16 persons per household.
| Household Type | # Households | Household Size |
| Married-Couple | 4,644 (45.4%) | 3.08 |
| Single Male/Father | 584 (5.7%) | 3.32 |
| Single Female/Mother | 1,902 (18.6%) | 3.56 |
| Non-family | 3,105 (30.3%) | 1.16 |
| Total Households | 10,235 (100.0%) | 2.60 |
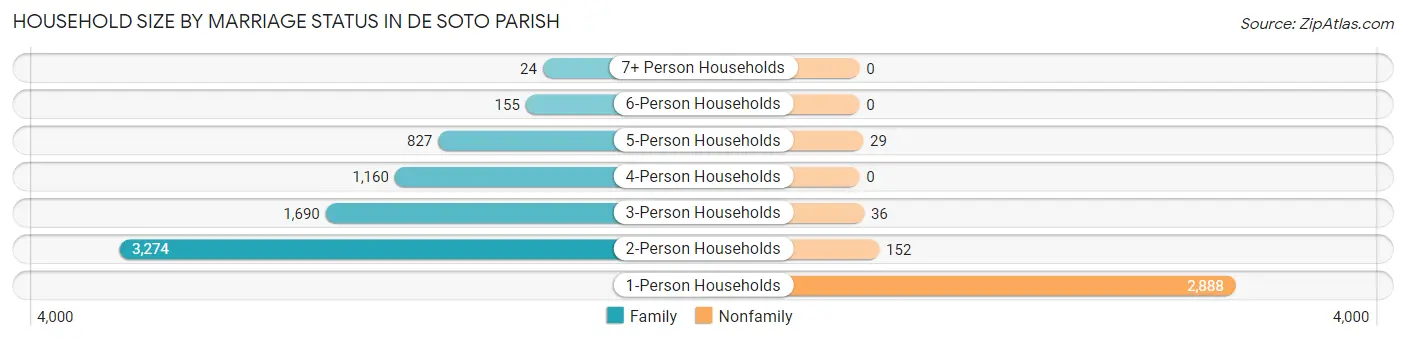
Household Size by Marriage Status in De Soto Parish
Out of a total of 10,235 households in De Soto Parish, 7,130 (69.7%) are family households, while 3,105 (30.3%) are nonfamily households. The most numerous type of family households are 2-person households, comprising 3,274, and the most common type of nonfamily households are 1-person households, comprising 2,888.
| Household Size | Family Households | Nonfamily Households |
| 1-Person Households | - | 2,888 (28.2%) |
| 2-Person Households | 3,274 (32.0%) | 152 (1.5%) |
| 3-Person Households | 1,690 (16.5%) | 36 (0.4%) |
| 4-Person Households | 1,160 (11.3%) | 0 (0.0%) |
| 5-Person Households | 827 (8.1%) | 29 (0.3%) |
| 6-Person Households | 155 (1.5%) | 0 (0.0%) |
| 7+ Person Households | 24 (0.2%) | 0 (0.0%) |
| Total | 7,130 (69.7%) | 3,105 (30.3%) |
Female Fertility in De Soto Parish
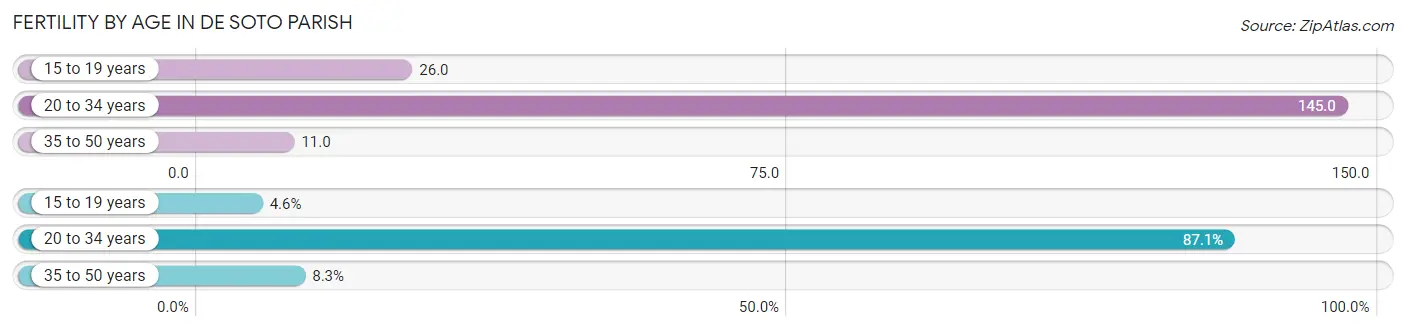
Fertility by Age in De Soto Parish
Average fertility rate in De Soto Parish is 66.0 births per 1,000 women. Women in the age bracket of 20 to 34 years have the highest fertility rate with 145.0 births per 1,000 women. Women in the age bracket of 20 to 34 years acount for 87.1% of all women with births.
| Age Bracket | Women with Births | Births / 1,000 Women |
| 15 to 19 years | 18 (4.6%) | 26.0 |
| 20 to 34 years | 338 (87.1%) | 145.0 |
| 35 to 50 years | 32 (8.3%) | 11.0 |
| Total | 388 (100.0%) | 66.0 |
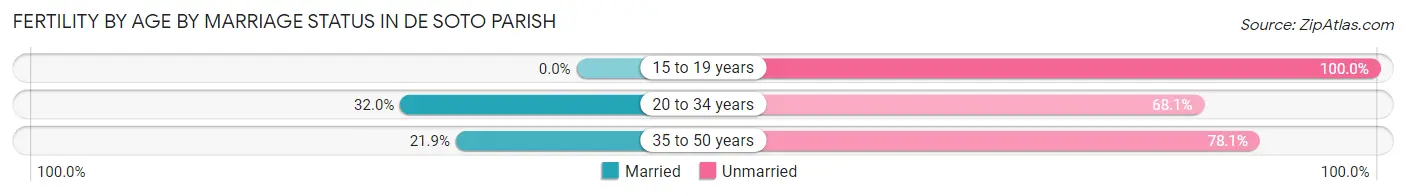
Fertility by Age by Marriage Status in De Soto Parish
29.6% of women with births (388) in De Soto Parish are married. The highest percentage of unmarried women with births falls into 15 to 19 years age bracket with 100.0% of them unmarried at the time of birth, while the lowest percentage of unmarried women with births belong to 20 to 34 years age bracket with 68.0% of them unmarried.
| Age Bracket | Married | Unmarried |
| 15 to 19 years | 0 (0.0%) | 18 (100.0%) |
| 20 to 34 years | 108 (32.0%) | 230 (68.0%) |
| 35 to 50 years | 7 (21.9%) | 25 (78.1%) |
| Total | 115 (29.6%) | 273 (70.4%) |
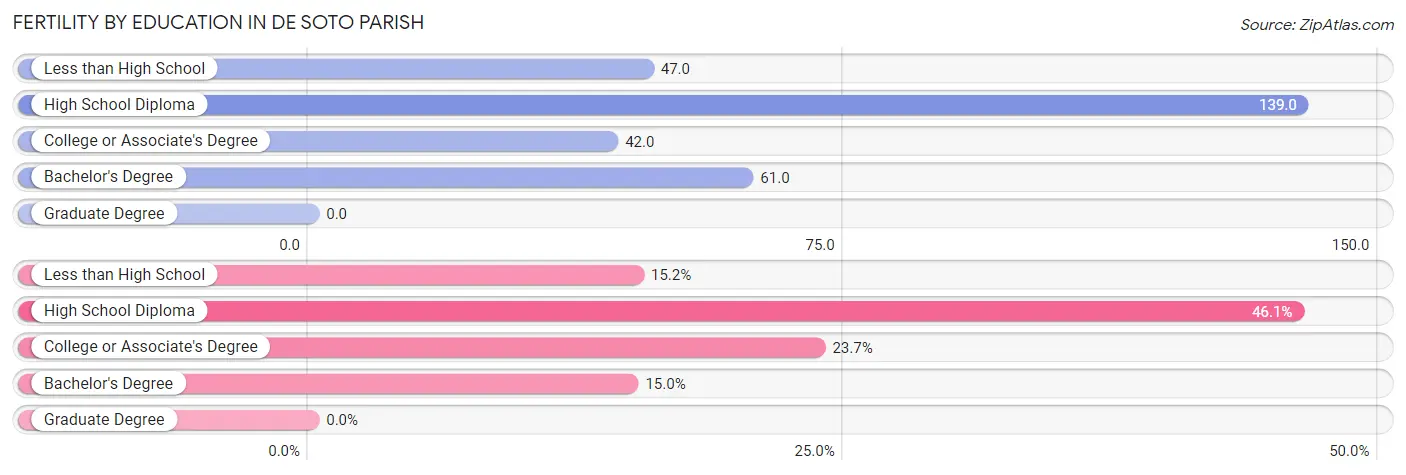
Fertility by Education in De Soto Parish
| Educational Attainment | Women with Births | Births / 1,000 Women |
| Less than High School | 59 (15.2%) | 47.0 |
| High School Diploma | 179 (46.1%) | 139.0 |
| College or Associate's Degree | 92 (23.7%) | 42.0 |
| Bachelor's Degree | 58 (14.9%) | 61.0 |
| Graduate Degree | 0 (0.0%) | 0.0 |
| Total | 388 (100.0%) | 66.0 |
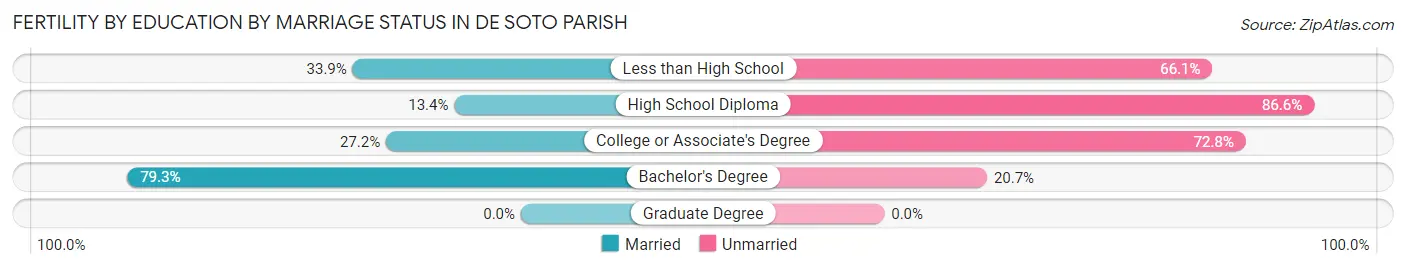
Fertility by Education by Marriage Status in De Soto Parish
70.4% of women with births in De Soto Parish are unmarried. Women with the educational attainment of bachelor's degree are most likely to be married with 79.3% of them married at childbirth, while women with the educational attainment of high school diploma are least likely to be married with 86.6% of them unmarried at childbirth.
| Educational Attainment | Married | Unmarried |
| Less than High School | 20 (33.9%) | 39 (66.1%) |
| High School Diploma | 24 (13.4%) | 155 (86.6%) |
| College or Associate's Degree | 25 (27.2%) | 67 (72.8%) |
| Bachelor's Degree | 46 (79.3%) | 12 (20.7%) |
| Graduate Degree | 0 (0.0%) | 0 (0.0%) |
| Total | 115 (29.6%) | 273 (70.4%) |
Income in De Soto Parish
Income Overview in De Soto Parish
Per Capita Income in De Soto Parish is $28,772, while median incomes of families and households are $59,472 and $49,807 respectively.
| Characteristic | Number | Measure |
| Per Capita Income | 26,821 | $28,772 |
| Median Family Income | 7,130 | $59,472 |
| Mean Family Income | 7,130 | $83,327 |
| Median Household Income | 10,235 | $49,807 |
| Mean Household Income | 10,235 | $72,336 |
| Income Deficit | 7,130 | $10,165 |
| Wage / Income Gap (%) | 26,821 | 44.04% |
| Wage / Income Gap ($) | 26,821 | 55.96¢ per $1 |
| Gini / Inequality Index | 26,821 | 0.49 |
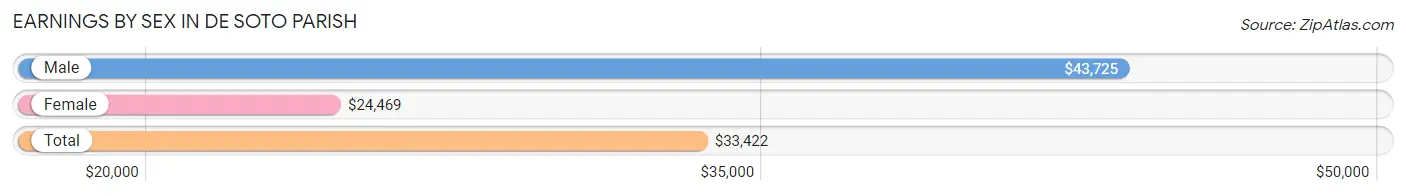
Earnings by Sex in De Soto Parish
Average Earnings in De Soto Parish are $33,422, $43,725 for men and $24,469 for women, a difference of 44.0%.
| Sex | Number | Average Earnings |
| Male | 5,943 (51.0%) | $43,725 |
| Female | 5,701 (49.0%) | $24,469 |
| Total | 11,644 (100.0%) | $33,422 |
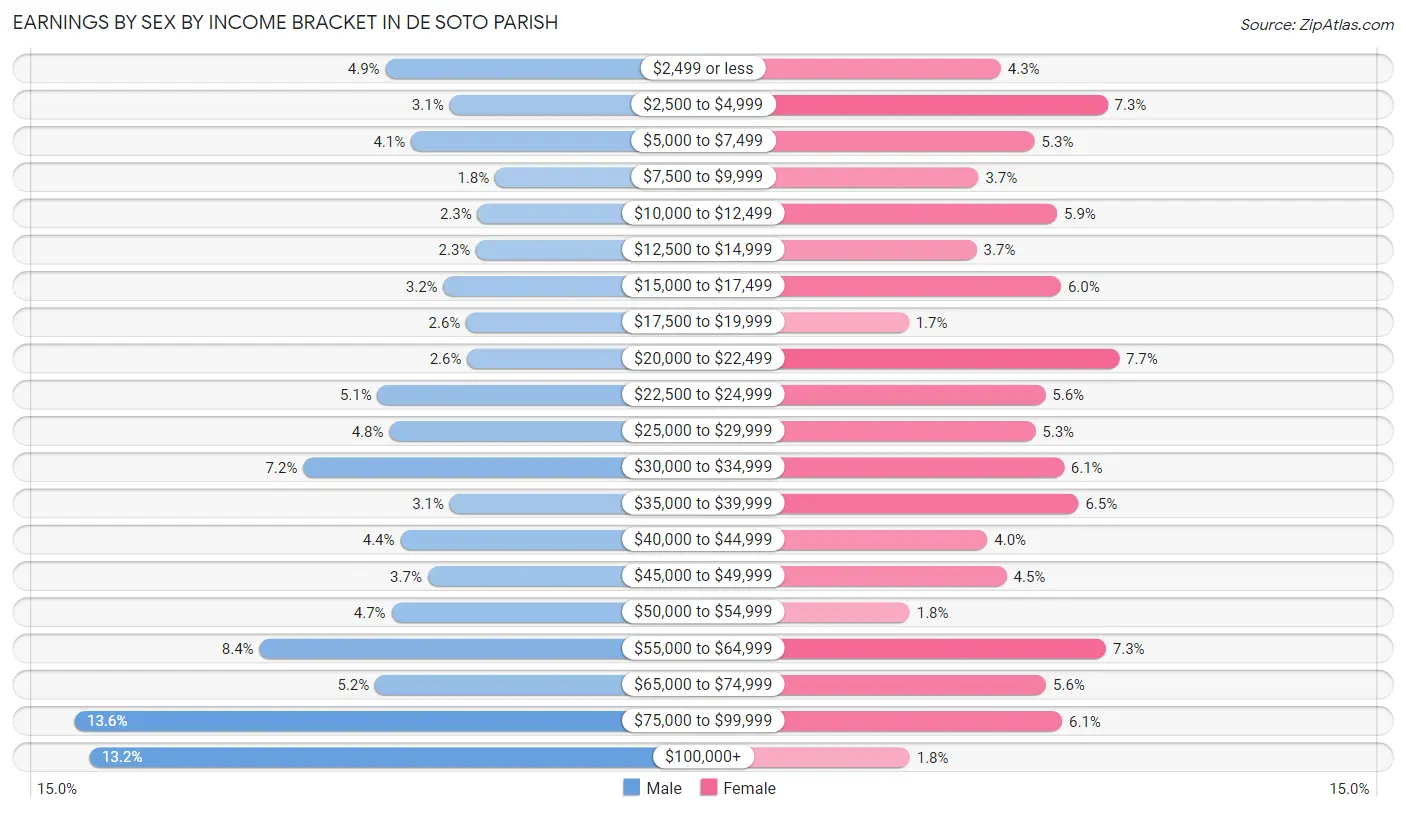
Earnings by Sex by Income Bracket in De Soto Parish
The most common earnings brackets in De Soto Parish are $75,000 to $99,999 for men (809 | 13.6%) and $20,000 to $22,499 for women (436 | 7.6%).
| Income | Male | Female |
| $2,499 or less | 289 (4.9%) | 247 (4.3%) |
| $2,500 to $4,999 | 182 (3.1%) | 418 (7.3%) |
| $5,000 to $7,499 | 246 (4.1%) | 301 (5.3%) |
| $7,500 to $9,999 | 106 (1.8%) | 211 (3.7%) |
| $10,000 to $12,499 | 135 (2.3%) | 337 (5.9%) |
| $12,500 to $14,999 | 137 (2.3%) | 208 (3.6%) |
| $15,000 to $17,499 | 192 (3.2%) | 343 (6.0%) |
| $17,500 to $19,999 | 154 (2.6%) | 99 (1.7%) |
| $20,000 to $22,499 | 152 (2.6%) | 436 (7.6%) |
| $22,500 to $24,999 | 302 (5.1%) | 318 (5.6%) |
| $25,000 to $29,999 | 282 (4.8%) | 302 (5.3%) |
| $30,000 to $34,999 | 426 (7.2%) | 348 (6.1%) |
| $35,000 to $39,999 | 181 (3.0%) | 371 (6.5%) |
| $40,000 to $44,999 | 264 (4.4%) | 225 (4.0%) |
| $45,000 to $49,999 | 218 (3.7%) | 256 (4.5%) |
| $50,000 to $54,999 | 279 (4.7%) | 101 (1.8%) |
| $55,000 to $64,999 | 499 (8.4%) | 415 (7.3%) |
| $65,000 to $74,999 | 306 (5.1%) | 319 (5.6%) |
| $75,000 to $99,999 | 809 (13.6%) | 345 (6.0%) |
| $100,000+ | 784 (13.2%) | 101 (1.8%) |
| Total | 5,943 (100.0%) | 5,701 (100.0%) |
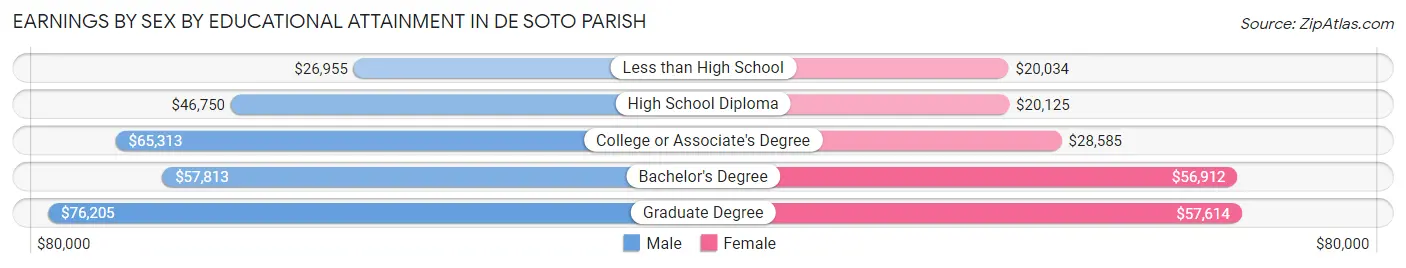
Earnings by Sex by Educational Attainment in De Soto Parish
Average earnings in De Soto Parish are $51,131 for men and $28,164 for women, a difference of 44.9%. Men with an educational attainment of graduate degree enjoy the highest average annual earnings of $76,205, while those with less than high school education earn the least with $26,955. Women with an educational attainment of graduate degree earn the most with the average annual earnings of $57,614, while those with less than high school education have the smallest earnings of $20,034.
| Educational Attainment | Male Income | Female Income |
| Less than High School | $26,955 | $20,034 |
| High School Diploma | $46,750 | $20,125 |
| College or Associate's Degree | $65,313 | $28,585 |
| Bachelor's Degree | $57,813 | $56,912 |
| Graduate Degree | $76,205 | $57,614 |
| Total | $51,131 | $28,164 |
Family Income in De Soto Parish
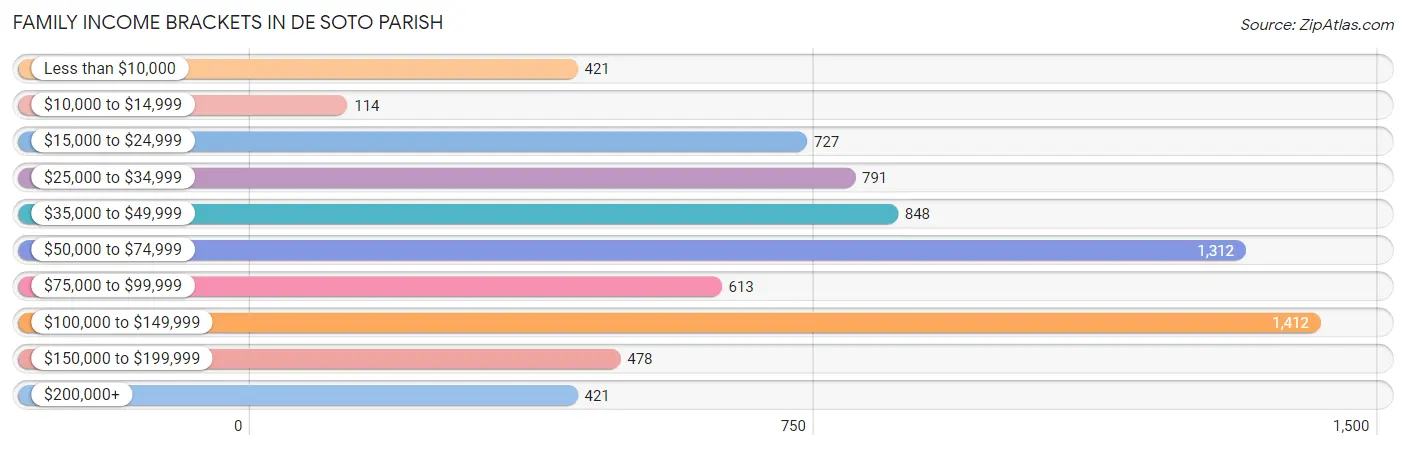
Family Income Brackets in De Soto Parish
According to the De Soto Parish family income data, there are 1,412 families falling into the $100,000 to $149,999 income range, which is the most common income bracket and makes up 19.8% of all families. Conversely, the $10,000 to $14,999 income bracket is the least frequent group with only 114 families (1.6%) belonging to this category.
| Income Bracket | # Families | % Families |
| Less than $10,000 | 421 | 5.9% |
| $10,000 to $14,999 | 114 | 1.6% |
| $15,000 to $24,999 | 727 | 10.2% |
| $25,000 to $34,999 | 791 | 11.1% |
| $35,000 to $49,999 | 848 | 11.9% |
| $50,000 to $74,999 | 1,312 | 18.4% |
| $75,000 to $99,999 | 613 | 8.6% |
| $100,000 to $149,999 | 1,412 | 19.8% |
| $150,000 to $199,999 | 478 | 6.7% |
| $200,000+ | 421 | 5.9% |
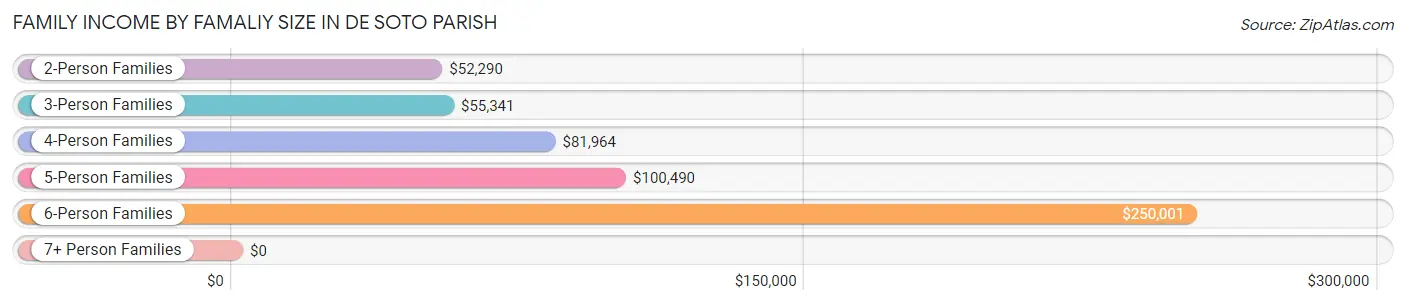
Family Income by Famaliy Size in De Soto Parish
6-person families (99 | 1.4%) account for the highest median family income in De Soto Parish with $250,001 per family, while 6-person families (99 | 1.4%) have the highest median income of $41,667 per family member.
| Income Bracket | # Families | Median Income |
| 2-Person Families | 3,340 (46.8%) | $52,290 |
| 3-Person Families | 1,754 (24.6%) | $55,341 |
| 4-Person Families | 1,243 (17.4%) | $81,964 |
| 5-Person Families | 670 (9.4%) | $100,490 |
| 6-Person Families | 99 (1.4%) | $250,001 |
| 7+ Person Families | 24 (0.3%) | $0 |
| Total | 7,130 (100.0%) | $59,472 |
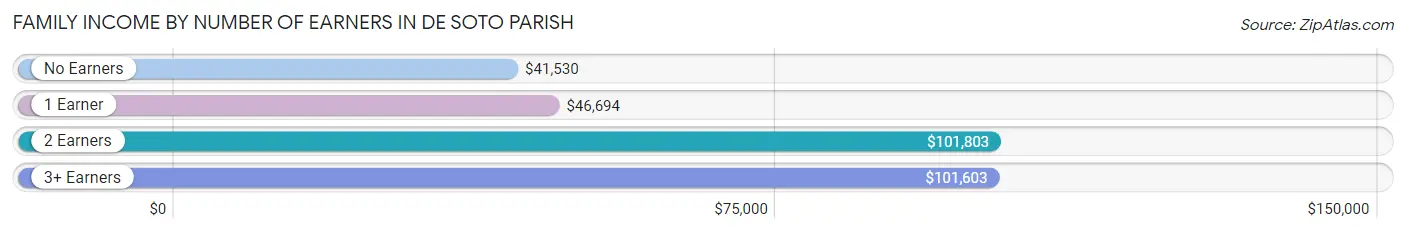
Family Income by Number of Earners in De Soto Parish
The median family income in De Soto Parish is $59,472, with families comprising 2 earners (2,565) having the highest median family income of $101,803, while families with no earners (1,375) have the lowest median family income of $41,530, accounting for 36.0% and 19.3% of families, respectively.
| Number of Earners | # Families | Median Income |
| No Earners | 1,375 (19.3%) | $41,530 |
| 1 Earner | 2,762 (38.7%) | $46,694 |
| 2 Earners | 2,565 (36.0%) | $101,803 |
| 3+ Earners | 428 (6.0%) | $101,603 |
| Total | 7,130 (100.0%) | $59,472 |
Household Income in De Soto Parish
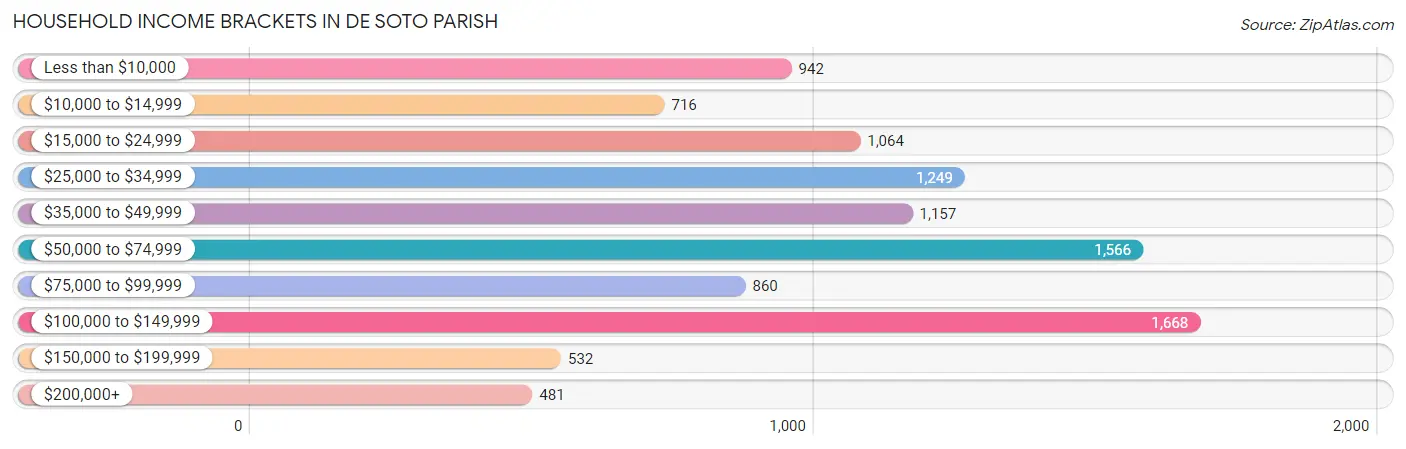
Household Income Brackets in De Soto Parish
With 1,668 households falling in the category, the $100,000 to $149,999 income range is the most frequent in De Soto Parish, accounting for 16.3% of all households. In contrast, only 481 households (4.7%) fall into the $200,000+ income bracket, making it the least populous group.
| Income Bracket | # Households | % Households |
| Less than $10,000 | 942 | 9.2% |
| $10,000 to $14,999 | 716 | 7.0% |
| $15,000 to $24,999 | 1,064 | 10.4% |
| $25,000 to $34,999 | 1,249 | 12.2% |
| $35,000 to $49,999 | 1,157 | 11.3% |
| $50,000 to $74,999 | 1,566 | 15.3% |
| $75,000 to $99,999 | 860 | 8.4% |
| $100,000 to $149,999 | 1,668 | 16.3% |
| $150,000 to $199,999 | 532 | 5.2% |
| $200,000+ | 481 | 4.7% |
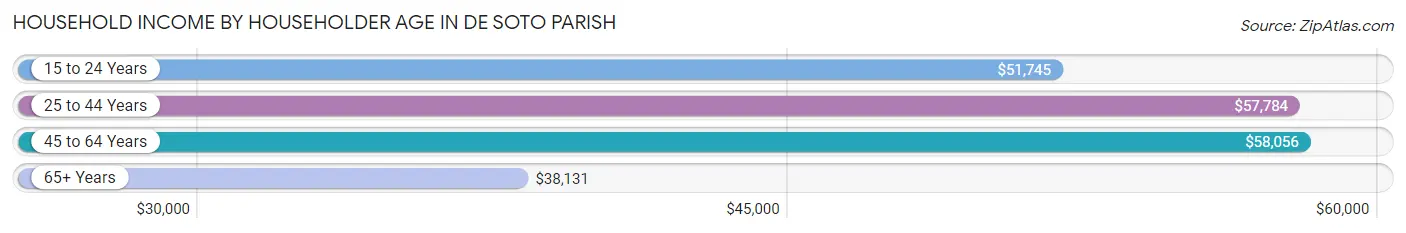
Household Income by Householder Age in De Soto Parish
The median household income in De Soto Parish is $49,807, with the highest median household income of $58,056 found in the 45 to 64 years age bracket for the primary householder. A total of 3,782 households (36.9%) fall into this category. Meanwhile, the 65+ years age bracket for the primary householder has the lowest median household income of $38,131, with 3,238 households (31.6%) in this group.
| Income Bracket | # Households | Median Income |
| 15 to 24 Years | 218 (2.1%) | $51,745 |
| 25 to 44 Years | 2,997 (29.3%) | $57,784 |
| 45 to 64 Years | 3,782 (36.9%) | $58,056 |
| 65+ Years | 3,238 (31.6%) | $38,131 |
| Total | 10,235 (100.0%) | $49,807 |
Poverty in De Soto Parish
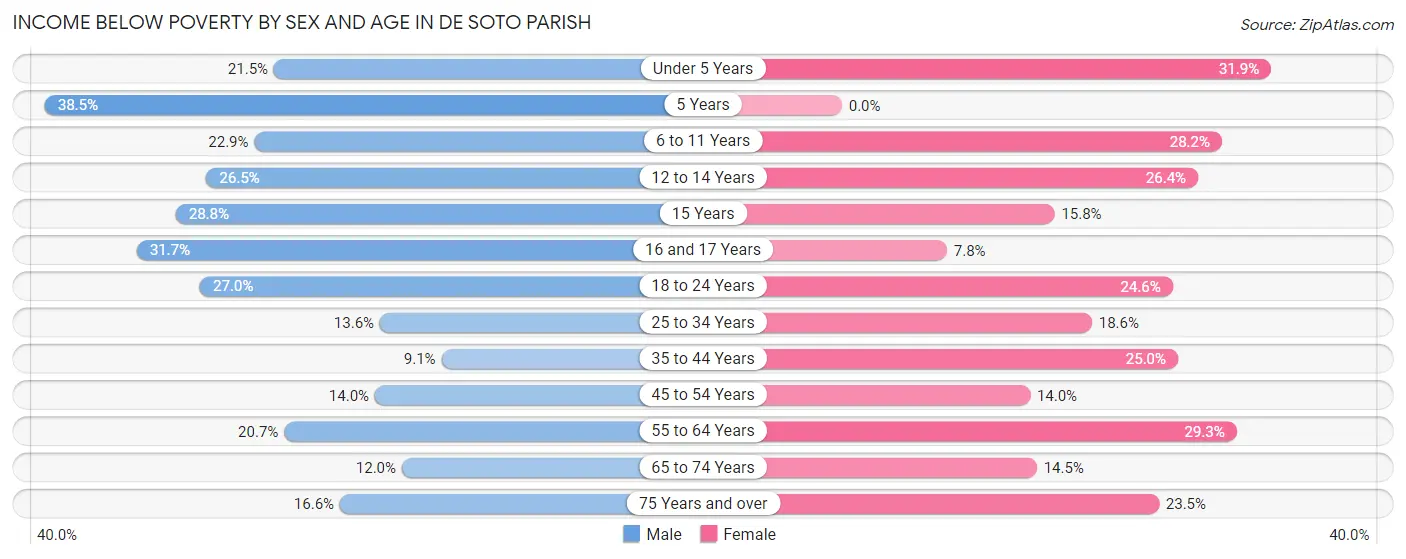
Income Below Poverty by Sex and Age in De Soto Parish
With 18.3% poverty level for males and 22.1% for females among the residents of De Soto Parish, 5 year old males and under 5 year old females are the most vulnerable to poverty, with 87 males (38.5%) and 246 females (31.9%) in their respective age groups living below the poverty level.
| Age Bracket | Male | Female |
| Under 5 Years | 173 (21.5%) | 246 (31.9%) |
| 5 Years | 87 (38.5%) | 0 (0.0%) |
| 6 to 11 Years | 254 (22.9%) | 303 (28.2%) |
| 12 to 14 Years | 159 (26.5%) | 138 (26.4%) |
| 15 Years | 61 (28.8%) | 12 (15.8%) |
| 16 and 17 Years | 140 (31.7%) | 29 (7.8%) |
| 18 to 24 Years | 271 (27.0%) | 237 (24.6%) |
| 25 to 34 Years | 216 (13.6%) | 301 (18.6%) |
| 35 to 44 Years | 146 (9.0%) | 469 (24.9%) |
| 45 to 54 Years | 215 (14.0%) | 224 (14.0%) |
| 55 to 64 Years | 358 (20.7%) | 561 (29.3%) |
| 65 to 74 Years | 157 (12.0%) | 218 (14.5%) |
| 75 Years and over | 139 (16.6%) | 267 (23.5%) |
| Total | 2,376 (18.3%) | 3,005 (22.1%) |
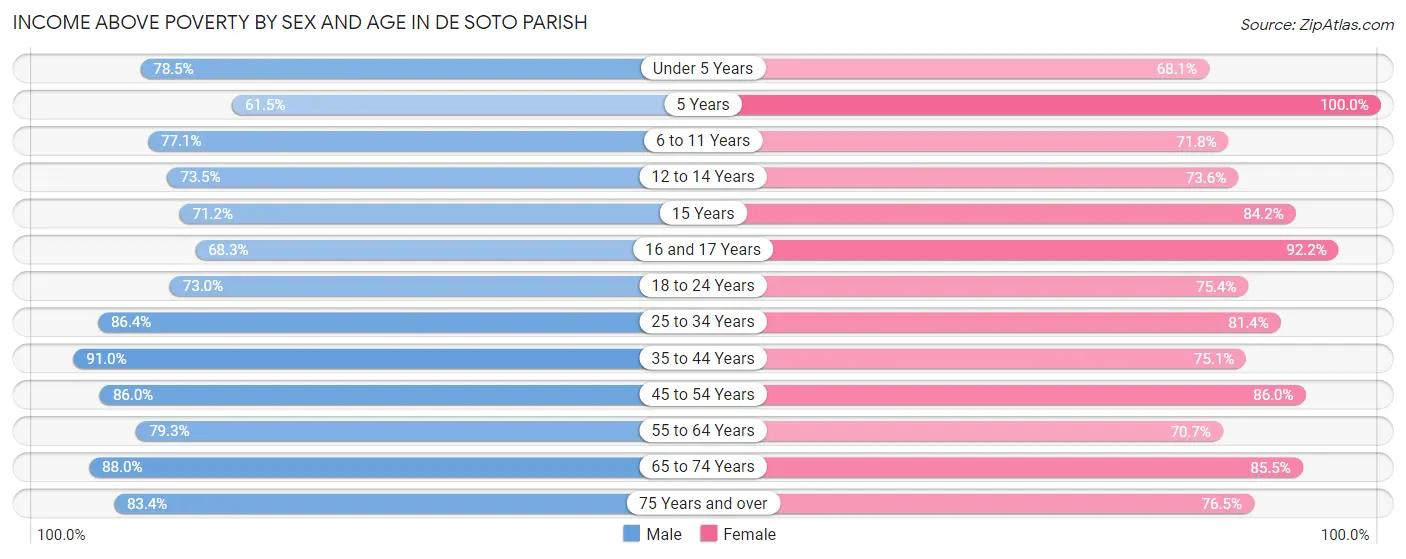
Income Above Poverty by Sex and Age in De Soto Parish
According to the poverty statistics in De Soto Parish, males aged 35 to 44 years and females aged 5 years are the age groups that are most secure financially, with 90.9% of males and 100.0% of females in these age groups living above the poverty line.
| Age Bracket | Male | Female |
| Under 5 Years | 632 (78.5%) | 526 (68.1%) |
| 5 Years | 139 (61.5%) | 165 (100.0%) |
| 6 to 11 Years | 853 (77.1%) | 771 (71.8%) |
| 12 to 14 Years | 441 (73.5%) | 384 (73.6%) |
| 15 Years | 151 (71.2%) | 64 (84.2%) |
| 16 and 17 Years | 302 (68.3%) | 343 (92.2%) |
| 18 to 24 Years | 734 (73.0%) | 728 (75.4%) |
| 25 to 34 Years | 1,370 (86.4%) | 1,321 (81.4%) |
| 35 to 44 Years | 1,468 (90.9%) | 1,411 (75.0%) |
| 45 to 54 Years | 1,322 (86.0%) | 1,379 (86.0%) |
| 55 to 64 Years | 1,369 (79.3%) | 1,353 (70.7%) |
| 65 to 74 Years | 1,152 (88.0%) | 1,289 (85.5%) |
| 75 Years and over | 699 (83.4%) | 867 (76.5%) |
| Total | 10,632 (81.7%) | 10,601 (77.9%) |
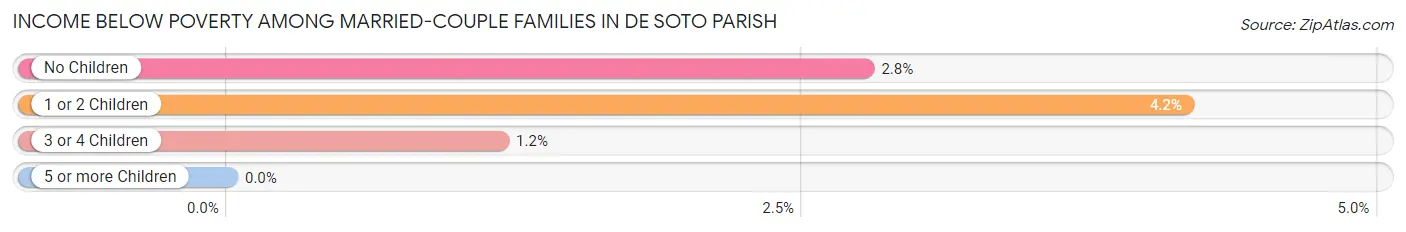
Income Below Poverty Among Married-Couple Families in De Soto Parish
The poverty statistics for married-couple families in De Soto Parish show that 3.1% or 146 of the total 4,644 families live below the poverty line. Families with 1 or 2 children have the highest poverty rate of 4.2%, comprising of 68 families. On the other hand, families with 3 or 4 children have the lowest poverty rate of 1.2%, which includes 4 families.
| Children | Above Poverty | Below Poverty |
| No Children | 2,597 (97.2%) | 74 (2.8%) |
| 1 or 2 Children | 1,567 (95.8%) | 68 (4.2%) |
| 3 or 4 Children | 334 (98.8%) | 4 (1.2%) |
| 5 or more Children | 0 (0.0%) | 0 (0.0%) |
| Total | 4,498 (96.9%) | 146 (3.1%) |
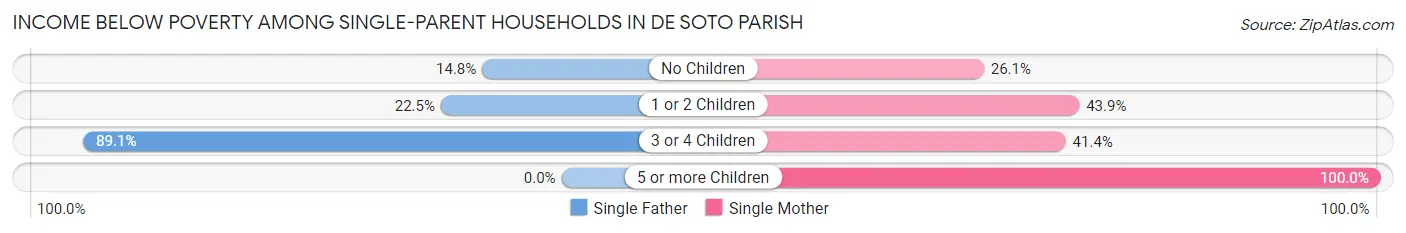
Income Below Poverty Among Single-Parent Households in De Soto Parish
According to the poverty data in De Soto Parish, 30.5% or 178 single-father households and 37.2% or 708 single-mother households are living below the poverty line. Among single-father households, those with 3 or 4 children have the highest poverty rate, with 98 households (89.1%) experiencing poverty. Likewise, among single-mother households, those with 5 or more children have the highest poverty rate, with 11 households (100.0%) falling below the poverty line.
| Children | Single Father | Single Mother |
| No Children | 51 (14.8%) | 190 (26.1%) |
| 1 or 2 Children | 29 (22.5%) | 452 (43.9%) |
| 3 or 4 Children | 98 (89.1%) | 55 (41.3%) |
| 5 or more Children | 0 (0.0%) | 11 (100.0%) |
| Total | 178 (30.5%) | 708 (37.2%) |
Income Below Poverty Among Married-Couple vs Single-Parent Households in De Soto Parish
The poverty data for De Soto Parish shows that 146 of the married-couple family households (3.1%) and 886 of the single-parent households (35.6%) are living below the poverty level. Within the married-couple family households, those with 1 or 2 children have the highest poverty rate, with 68 households (4.2%) falling below the poverty line. Among the single-parent households, those with 5 or more children have the highest poverty rate, with 11 household (100.0%) living below poverty.
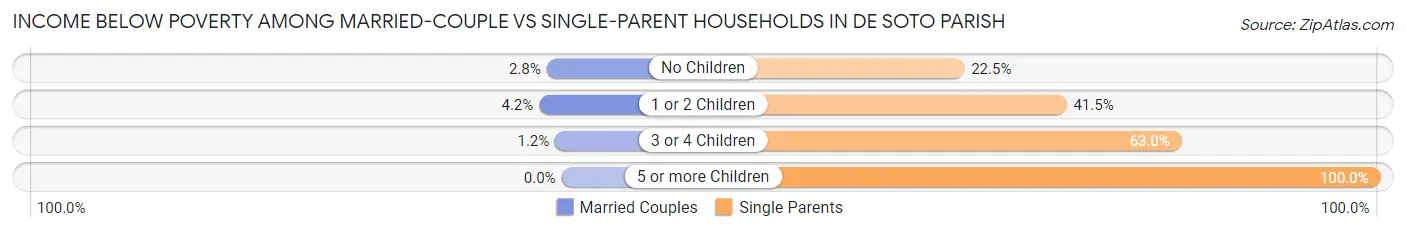
| Children | Married-Couple Families | Single-Parent Households |
| No Children | 74 (2.8%) | 241 (22.5%) |
| 1 or 2 Children | 68 (4.2%) | 481 (41.5%) |
| 3 or 4 Children | 4 (1.2%) | 153 (63.0%) |
| 5 or more Children | 0 (0.0%) | 11 (100.0%) |
| Total | 146 (3.1%) | 886 (35.6%) |
Employment Characteristics in De Soto Parish
Employment by Class of Employer in De Soto Parish
Among the 10,193 employed individuals in De Soto Parish, private company employees (6,702 | 65.7%), local government employees (958 | 9.4%), and not-for-profit organizations (829 | 8.1%) make up the most common classes of employment.
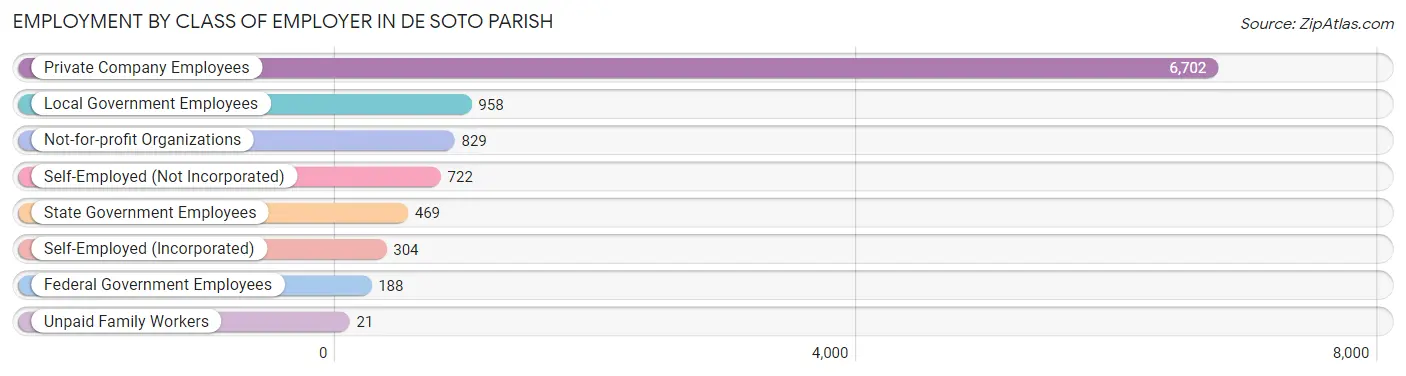
| Employer Class | # Employees | % Employees |
| Private Company Employees | 6,702 | 65.7% |
| Self-Employed (Incorporated) | 304 | 3.0% |
| Self-Employed (Not Incorporated) | 722 | 7.1% |
| Not-for-profit Organizations | 829 | 8.1% |
| Local Government Employees | 958 | 9.4% |
| State Government Employees | 469 | 4.6% |
| Federal Government Employees | 188 | 1.8% |
| Unpaid Family Workers | 21 | 0.2% |
| Total | 10,193 | 100.0% |
Employment Status by Age in De Soto Parish
According to the labor force statistics for De Soto Parish, out of the total population over 16 years of age (21,247), 52.4% or 11,133 individuals are in the labor force, with 6.9% or 768 of them unemployed. The age group with the highest labor force participation rate is 30 to 34 years, with 86.7% or 1,476 individuals in the labor force. Within the labor force, the 16 to 19 years age range has the highest percentage of unemployed individuals, with 43.7% or 173 of them being unemployed.
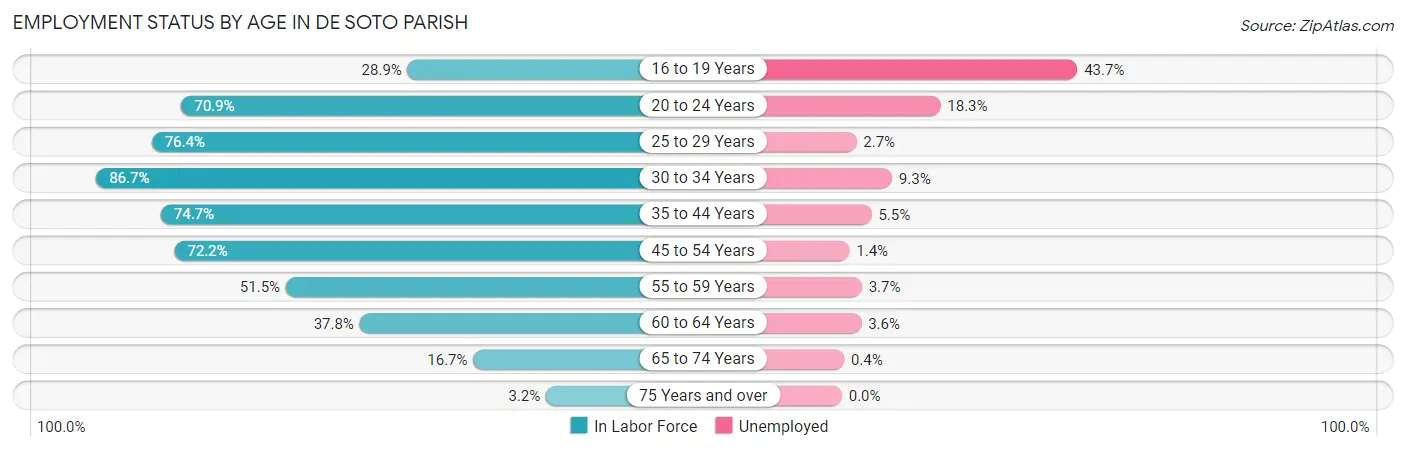
| Age Bracket | In Labor Force | Unemployed |
| 16 to 19 Years | 396 (28.9%) | 173 (43.7%) |
| 20 to 24 Years | 1,022 (70.9%) | 187 (18.3%) |
| 25 to 29 Years | 1,168 (76.4%) | 32 (2.7%) |
| 30 to 34 Years | 1,476 (86.7%) | 137 (9.3%) |
| 35 to 44 Years | 2,630 (74.7%) | 145 (5.5%) |
| 45 to 54 Years | 2,288 (72.2%) | 32 (1.4%) |
| 55 to 59 Years | 843 (51.5%) | 31 (3.7%) |
| 60 to 64 Years | 759 (37.8%) | 27 (3.6%) |
| 65 to 74 Years | 475 (16.7%) | 2 (0.4%) |
| 75 Years and over | 65 (3.2%) | 0 (0.0%) |
| Total | 11,133 (52.4%) | 768 (6.9%) |
Employment Status by Educational Attainment in De Soto Parish
According to labor force statistics for De Soto Parish, 67.6% of individuals (9,170) out of the total population between 25 and 64 years of age (13,565) are in the labor force, with 4.4% or 403 of them being unemployed. The group with the highest labor force participation rate are those with the educational attainment of bachelor's degree or higher, with 79.9% or 1,830 individuals in the labor force. Within the labor force, individuals with less than high school education have the highest percentage of unemployment, with 13.7% or 174 of them being unemployed.
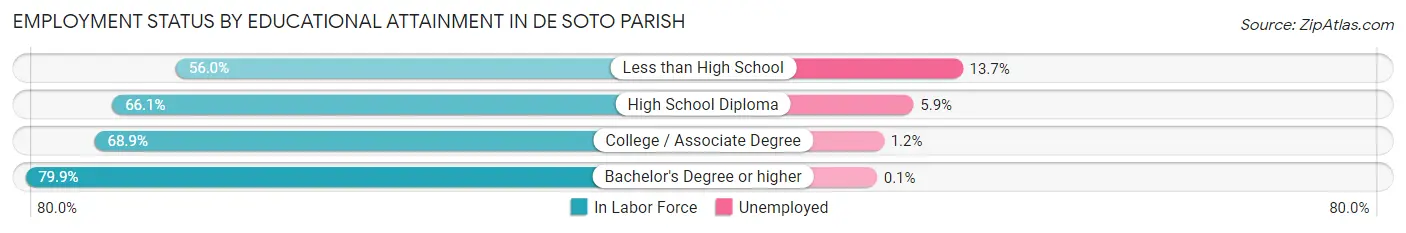
| Educational Attainment | In Labor Force | Unemployed |
| Less than High School | 1,271 (56.0%) | 311 (13.7%) |
| High School Diploma | 3,298 (66.1%) | 294 (5.9%) |
| College / Associate Degree | 2,766 (68.9%) | 48 (1.2%) |
| Bachelor's Degree or higher | 1,830 (79.9%) | 2 (0.1%) |
| Total | 9,170 (67.6%) | 597 (4.4%) |
Employment Occupations by Sex in De Soto Parish
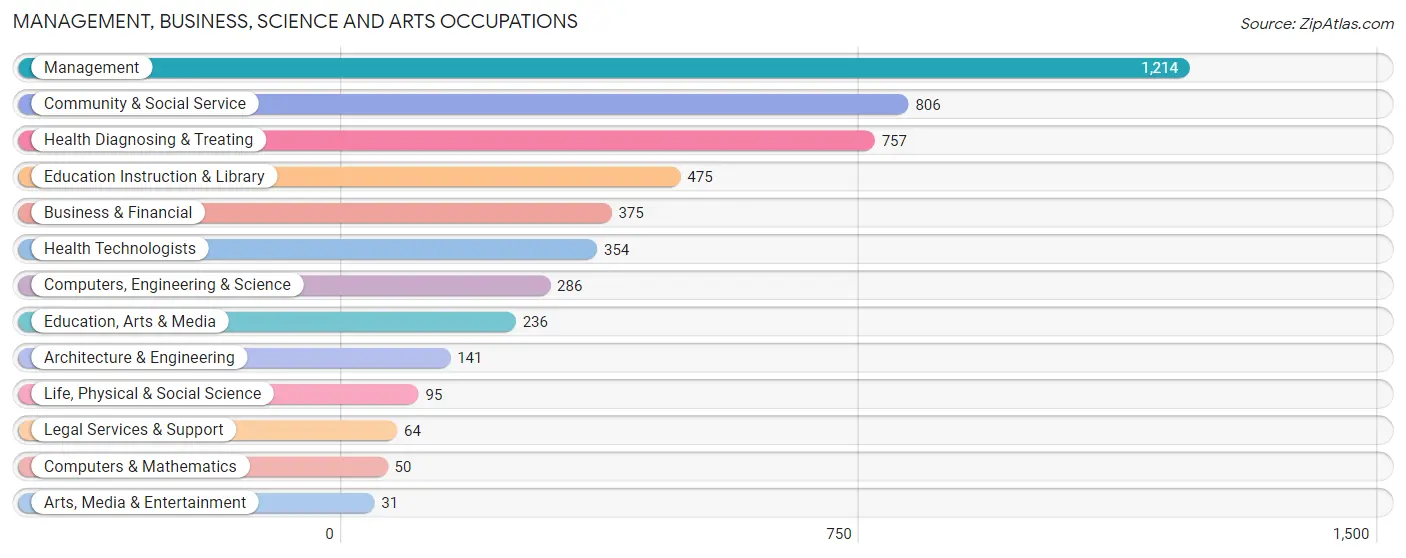
Management, Business, Science and Arts Occupations
The most common Management, Business, Science and Arts occupations in De Soto Parish are Management (1,214 | 11.7%), Community & Social Service (806 | 7.8%), Health Diagnosing & Treating (757 | 7.3%), Education Instruction & Library (475 | 4.6%), and Business & Financial (375 | 3.6%).
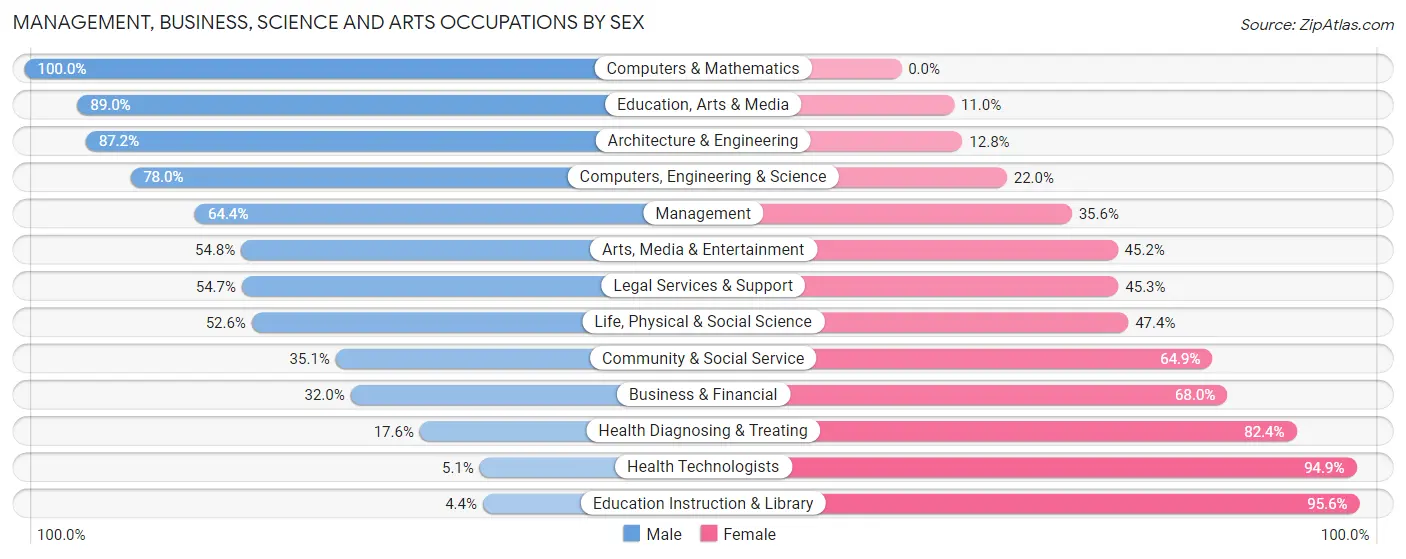
Management, Business, Science and Arts Occupations by Sex
Within the Management, Business, Science and Arts occupations in De Soto Parish, the most male-oriented occupations are Computers & Mathematics (100.0%), Education, Arts & Media (89.0%), and Architecture & Engineering (87.2%), while the most female-oriented occupations are Education Instruction & Library (95.6%), Health Technologists (94.9%), and Health Diagnosing & Treating (82.4%).
| Occupation | Male | Female |
| Management | 782 (64.4%) | 432 (35.6%) |
| Business & Financial | 120 (32.0%) | 255 (68.0%) |
| Computers, Engineering & Science | 223 (78.0%) | 63 (22.0%) |
| Computers & Mathematics | 50 (100.0%) | 0 (0.0%) |
| Architecture & Engineering | 123 (87.2%) | 18 (12.8%) |
| Life, Physical & Social Science | 50 (52.6%) | 45 (47.4%) |
| Community & Social Service | 283 (35.1%) | 523 (64.9%) |
| Education, Arts & Media | 210 (89.0%) | 26 (11.0%) |
| Legal Services & Support | 35 (54.7%) | 29 (45.3%) |
| Education Instruction & Library | 21 (4.4%) | 454 (95.6%) |
| Arts, Media & Entertainment | 17 (54.8%) | 14 (45.2%) |
| Health Diagnosing & Treating | 133 (17.6%) | 624 (82.4%) |
| Health Technologists | 18 (5.1%) | 336 (94.9%) |
| Total (Category) | 1,541 (44.8%) | 1,897 (55.2%) |
| Total (Overall) | 5,455 (52.7%) | 4,887 (47.2%) |
Services Occupations
The most common Services occupations in De Soto Parish are Food Preparation & Serving (474 | 4.6%), Cleaning & Maintenance (413 | 4.0%), Healthcare Support (280 | 2.7%), Security & Protection (246 | 2.4%), and Personal Care & Service (215 | 2.1%).

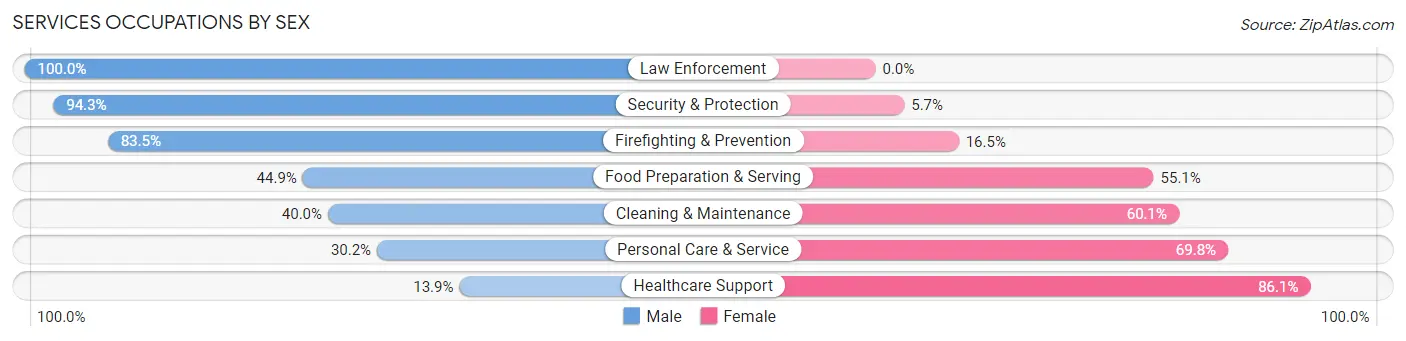
Services Occupations by Sex
Within the Services occupations in De Soto Parish, the most male-oriented occupations are Law Enforcement (100.0%), Security & Protection (94.3%), and Firefighting & Prevention (83.5%), while the most female-oriented occupations are Healthcare Support (86.1%), Personal Care & Service (69.8%), and Cleaning & Maintenance (60.1%).
| Occupation | Male | Female |
| Healthcare Support | 39 (13.9%) | 241 (86.1%) |
| Security & Protection | 232 (94.3%) | 14 (5.7%) |
| Firefighting & Prevention | 71 (83.5%) | 14 (16.5%) |
| Law Enforcement | 161 (100.0%) | 0 (0.0%) |
| Food Preparation & Serving | 213 (44.9%) | 261 (55.1%) |
| Cleaning & Maintenance | 165 (40.0%) | 248 (60.1%) |
| Personal Care & Service | 65 (30.2%) | 150 (69.8%) |
| Total (Category) | 714 (43.9%) | 914 (56.1%) |
| Total (Overall) | 5,455 (52.7%) | 4,887 (47.2%) |
Sales and Office Occupations
The most common Sales and Office occupations in De Soto Parish are Sales & Related (1,032 | 10.0%), and Office & Administration (969 | 9.4%).

Sales and Office Occupations by Sex

| Occupation | Male | Female |
| Sales & Related | 175 (17.0%) | 857 (83.0%) |
| Office & Administration | 155 (16.0%) | 814 (84.0%) |
| Total (Category) | 330 (16.5%) | 1,671 (83.5%) |
| Total (Overall) | 5,455 (52.7%) | 4,887 (47.2%) |
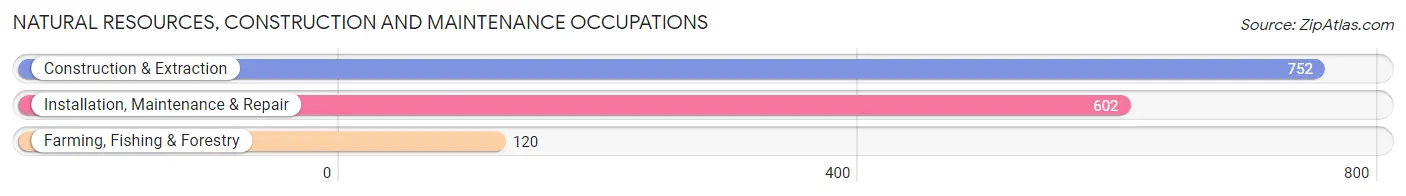
Natural Resources, Construction and Maintenance Occupations
The most common Natural Resources, Construction and Maintenance occupations in De Soto Parish are Construction & Extraction (752 | 7.3%), Installation, Maintenance & Repair (602 | 5.8%), and Farming, Fishing & Forestry (120 | 1.2%).
Natural Resources, Construction and Maintenance Occupations by Sex
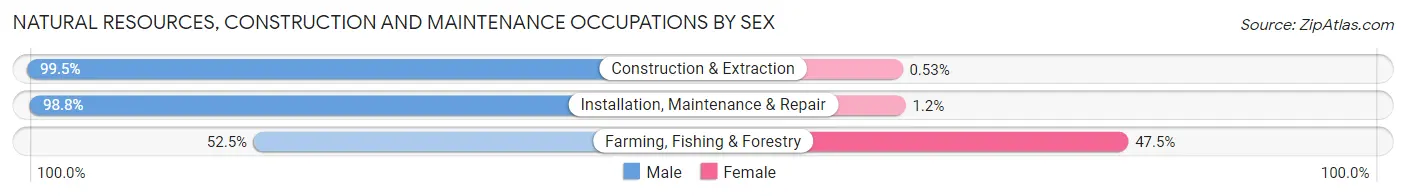
| Occupation | Male | Female |
| Farming, Fishing & Forestry | 63 (52.5%) | 57 (47.5%) |
| Construction & Extraction | 748 (99.5%) | 4 (0.5%) |
| Installation, Maintenance & Repair | 595 (98.8%) | 7 (1.2%) |
| Total (Category) | 1,406 (95.4%) | 68 (4.6%) |
| Total (Overall) | 5,455 (52.7%) | 4,887 (47.2%) |
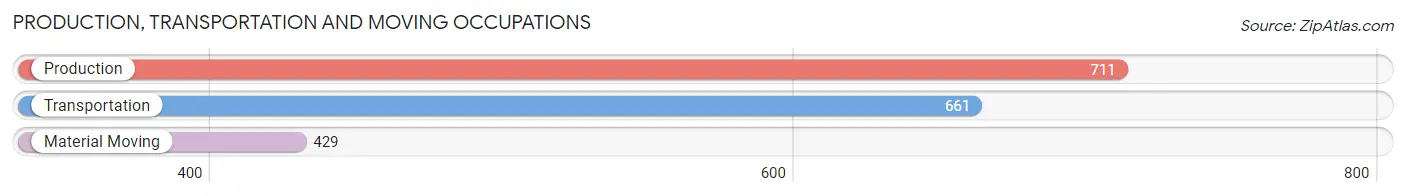
Production, Transportation and Moving Occupations
The most common Production, Transportation and Moving occupations in De Soto Parish are Production (711 | 6.9%), Transportation (661 | 6.4%), and Material Moving (429 | 4.2%).
Production, Transportation and Moving Occupations by Sex
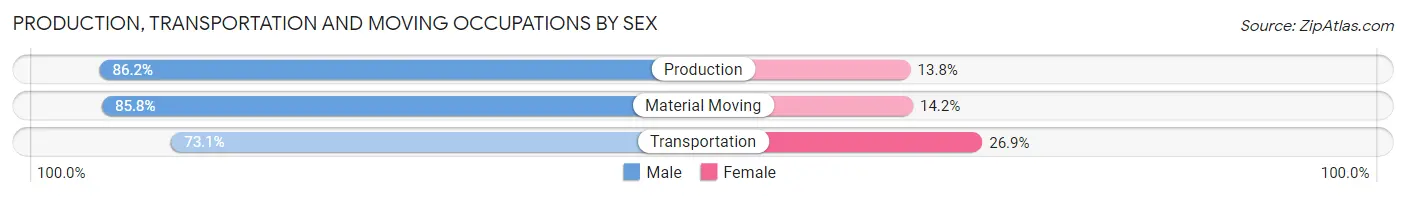
| Occupation | Male | Female |
| Production | 613 (86.2%) | 98 (13.8%) |
| Transportation | 483 (73.1%) | 178 (26.9%) |
| Material Moving | 368 (85.8%) | 61 (14.2%) |
| Total (Category) | 1,464 (81.3%) | 337 (18.7%) |
| Total (Overall) | 5,455 (52.7%) | 4,887 (47.2%) |
Employment Industries by Sex in De Soto Parish
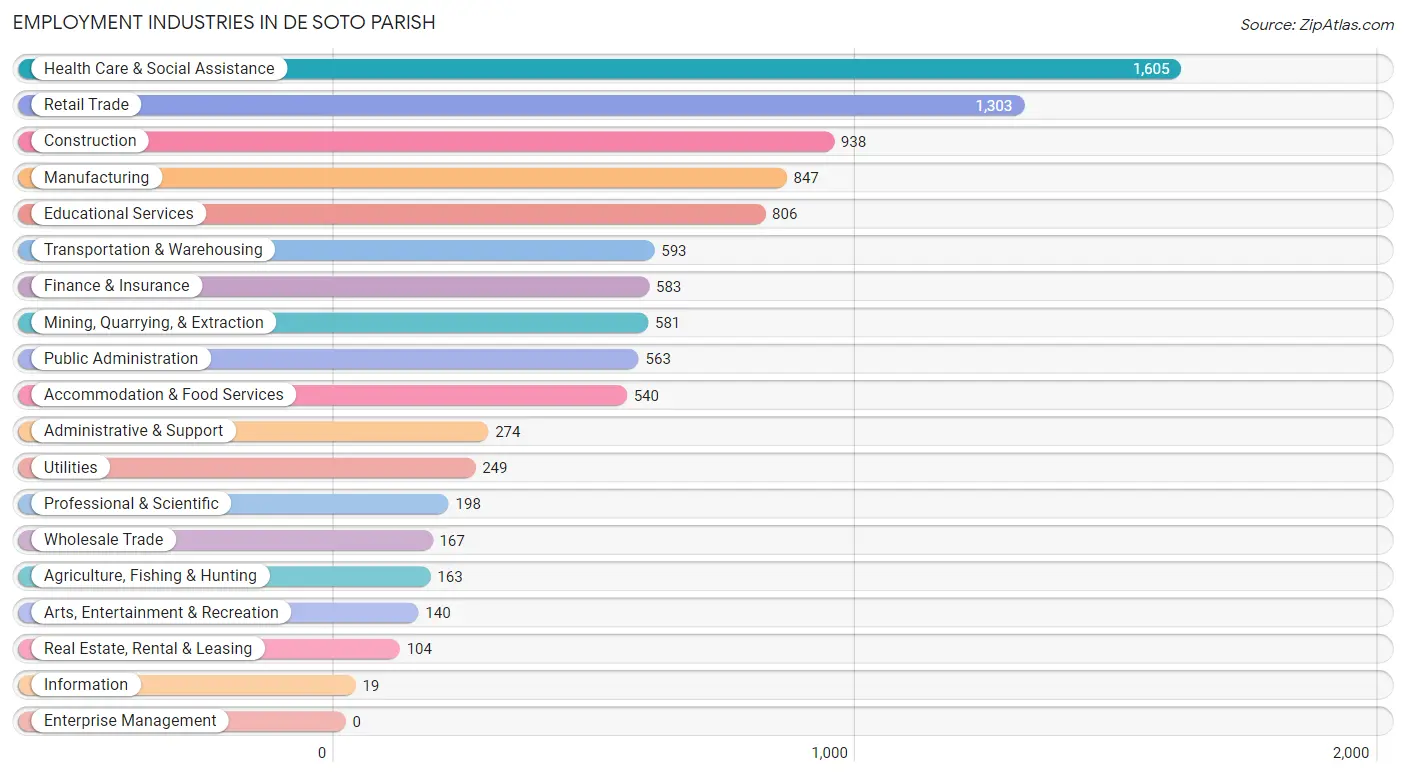
Employment Industries in De Soto Parish
The major employment industries in De Soto Parish include Health Care & Social Assistance (1,605 | 15.5%), Retail Trade (1,303 | 12.6%), Construction (938 | 9.1%), Manufacturing (847 | 8.2%), and Educational Services (806 | 7.8%).
Employment Industries by Sex in De Soto Parish
The De Soto Parish industries that see more men than women are Construction (93.8%), Manufacturing (91.7%), and Mining, Quarrying, & Extraction (90.9%), whereas the industries that tend to have a higher number of women are Real Estate, Rental & Leasing (88.5%), Educational Services (86.0%), and Health Care & Social Assistance (78.7%).
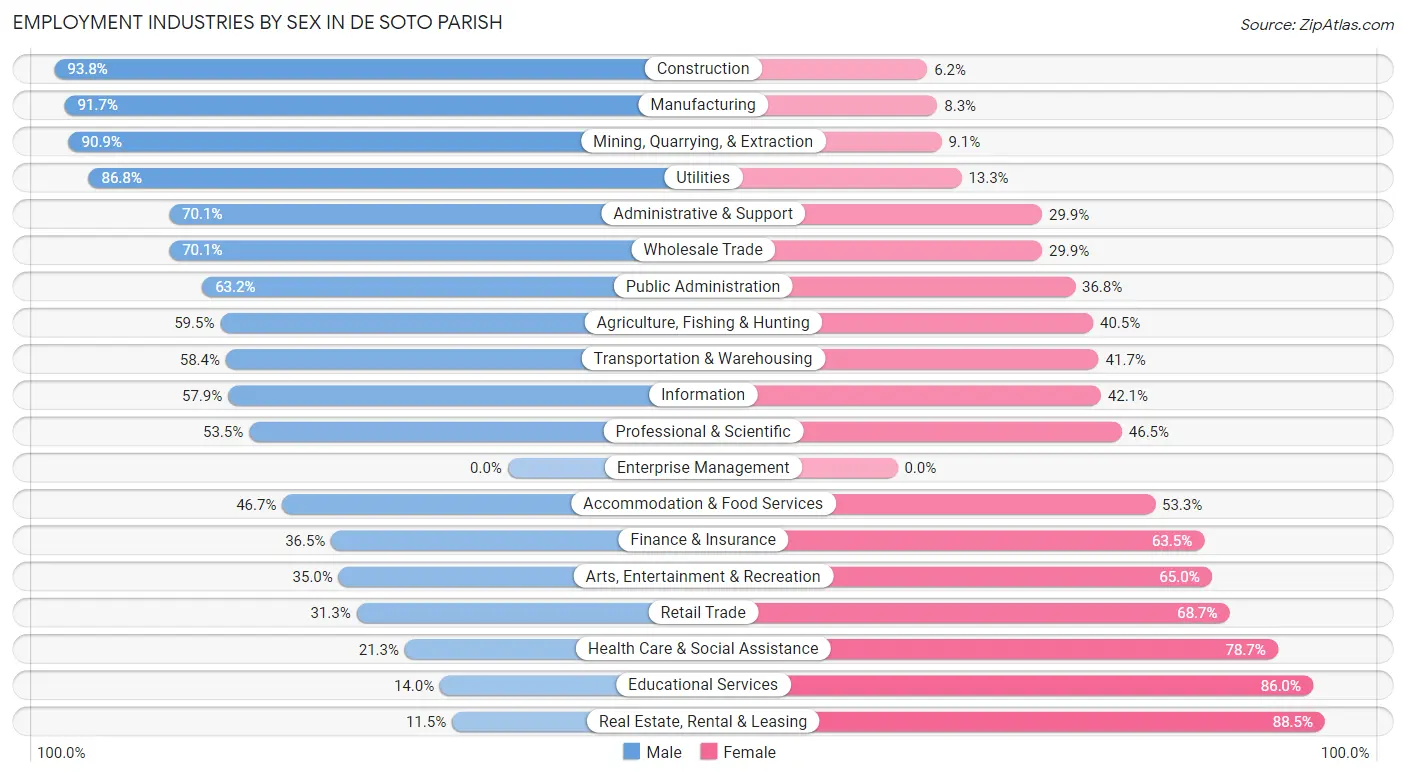
| Industry | Male | Female |
| Agriculture, Fishing & Hunting | 97 (59.5%) | 66 (40.5%) |
| Mining, Quarrying, & Extraction | 528 (90.9%) | 53 (9.1%) |
| Construction | 880 (93.8%) | 58 (6.2%) |
| Manufacturing | 777 (91.7%) | 70 (8.3%) |
| Wholesale Trade | 117 (70.1%) | 50 (29.9%) |
| Retail Trade | 408 (31.3%) | 895 (68.7%) |
| Transportation & Warehousing | 346 (58.4%) | 247 (41.6%) |
| Utilities | 216 (86.8%) | 33 (13.3%) |
| Information | 11 (57.9%) | 8 (42.1%) |
| Finance & Insurance | 213 (36.5%) | 370 (63.5%) |
| Real Estate, Rental & Leasing | 12 (11.5%) | 92 (88.5%) |
| Professional & Scientific | 106 (53.5%) | 92 (46.5%) |
| Enterprise Management | 0 (0.0%) | 0 (0.0%) |
| Administrative & Support | 192 (70.1%) | 82 (29.9%) |
| Educational Services | 113 (14.0%) | 693 (86.0%) |
| Health Care & Social Assistance | 342 (21.3%) | 1,263 (78.7%) |
| Arts, Entertainment & Recreation | 49 (35.0%) | 91 (65.0%) |
| Accommodation & Food Services | 252 (46.7%) | 288 (53.3%) |
| Public Administration | 356 (63.2%) | 207 (36.8%) |
| Total | 5,455 (52.7%) | 4,887 (47.2%) |
Education in De Soto Parish
School Enrollment in De Soto Parish
The most common levels of schooling among the 6,382 students in De Soto Parish are middle school (1,785 | 28.0%), high school (1,533 | 24.0%), and elementary school (1,216 | 19.1%).
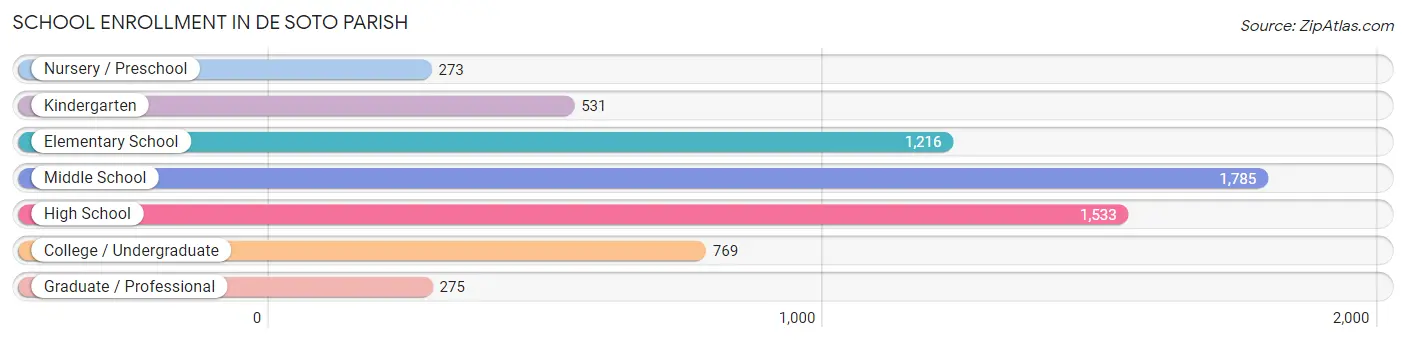
| School Level | # Students | % Students |
| Nursery / Preschool | 273 | 4.3% |
| Kindergarten | 531 | 8.3% |
| Elementary School | 1,216 | 19.1% |
| Middle School | 1,785 | 28.0% |
| High School | 1,533 | 24.0% |
| College / Undergraduate | 769 | 12.0% |
| Graduate / Professional | 275 | 4.3% |
| Total | 6,382 | 100.0% |
School Enrollment by Age by Funding Source in De Soto Parish
Out of a total of 6,382 students who are enrolled in schools in De Soto Parish, 913 (14.3%) attend a private institution, while the remaining 5,469 (85.7%) are enrolled in public schools. The age group of 3 to 4 year olds has the highest likelihood of being enrolled in private schools, with 83 (38.1% in the age bracket) enrolled. Conversely, the age group of 18 to 19 year olds has the lowest likelihood of being enrolled in a private school, with 363 (98.6% in the age bracket) attending a public institution.
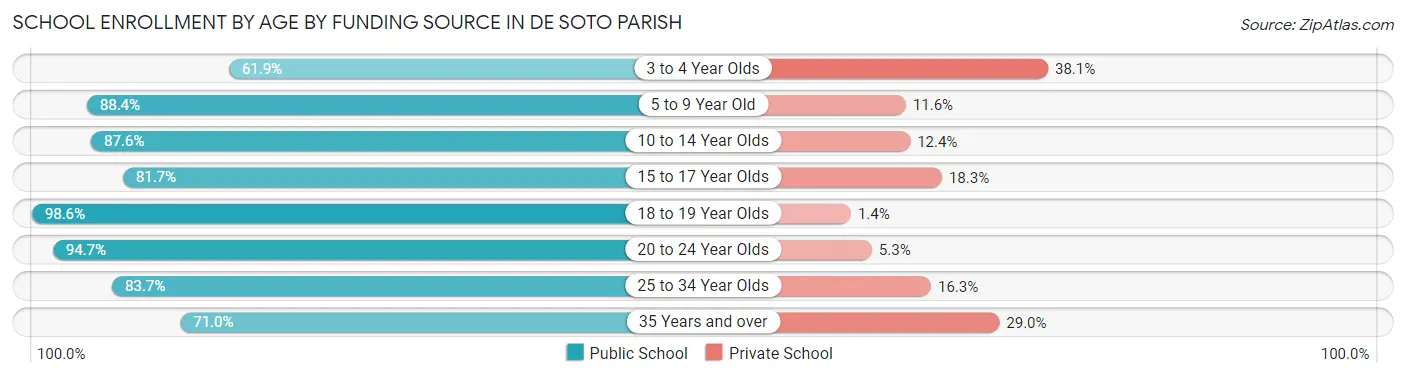
| Age Bracket | Public School | Private School |
| 3 to 4 Year Olds | 135 (61.9%) | 83 (38.1%) |
| 5 to 9 Year Old | 1,425 (88.4%) | 187 (11.6%) |
| 10 to 14 Year Olds | 1,761 (87.6%) | 249 (12.4%) |
| 15 to 17 Year Olds | 901 (81.7%) | 202 (18.3%) |
| 18 to 19 Year Olds | 363 (98.6%) | 5 (1.4%) |
| 20 to 24 Year Olds | 396 (94.7%) | 22 (5.3%) |
| 25 to 34 Year Olds | 180 (83.7%) | 35 (16.3%) |
| 35 Years and over | 311 (71.0%) | 127 (29.0%) |
| Total | 5,469 (85.7%) | 913 (14.3%) |
Educational Attainment by Field of Study in De Soto Parish
Education (705 | 21.8%), science & technology (528 | 16.4%), business (468 | 14.5%), arts & humanities (269 | 8.3%), and bio, nature & agricultural (230 | 7.1%) are the most common fields of study among 3,230 individuals in De Soto Parish who have obtained a bachelor's degree or higher.
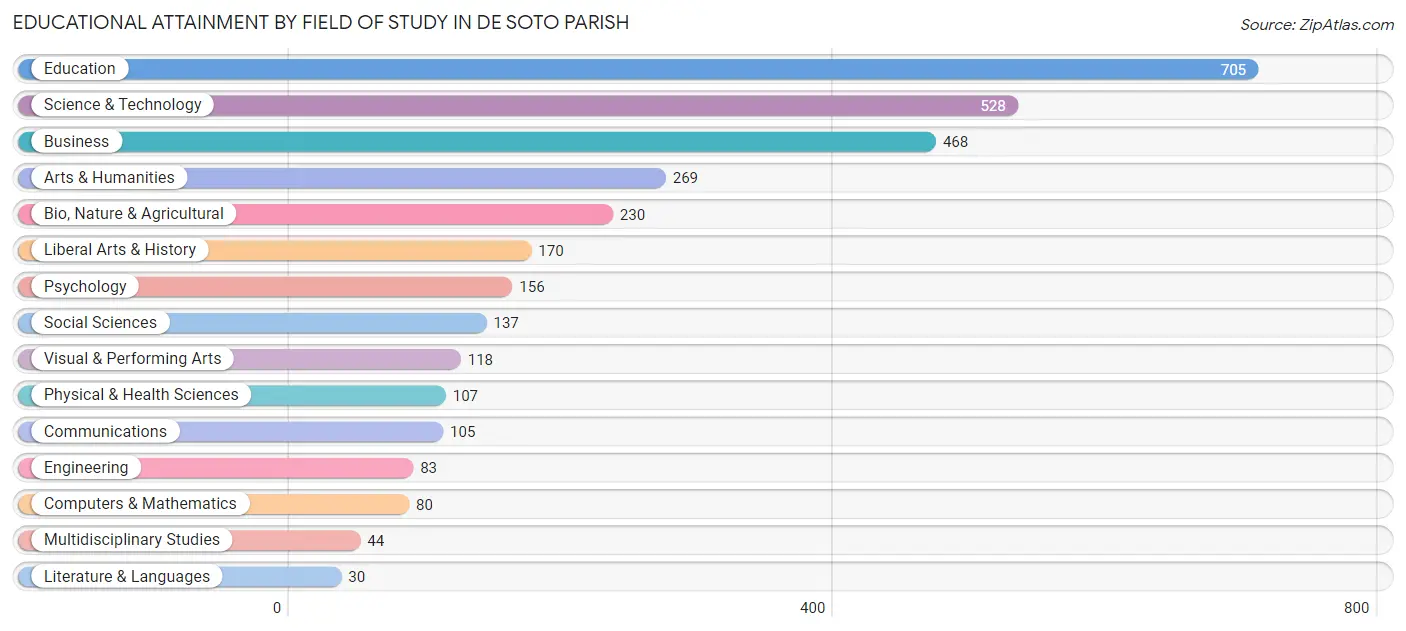
| Field of Study | # Graduates | % Graduates |
| Computers & Mathematics | 80 | 2.5% |
| Bio, Nature & Agricultural | 230 | 7.1% |
| Physical & Health Sciences | 107 | 3.3% |
| Psychology | 156 | 4.8% |
| Social Sciences | 137 | 4.2% |
| Engineering | 83 | 2.6% |
| Multidisciplinary Studies | 44 | 1.4% |
| Science & Technology | 528 | 16.4% |
| Business | 468 | 14.5% |
| Education | 705 | 21.8% |
| Literature & Languages | 30 | 0.9% |
| Liberal Arts & History | 170 | 5.3% |
| Visual & Performing Arts | 118 | 3.6% |
| Communications | 105 | 3.3% |
| Arts & Humanities | 269 | 8.3% |
| Total | 3,230 | 100.0% |
Transportation & Commute in De Soto Parish
Vehicle Availability by Sex in De Soto Parish
The most prevalent vehicle ownership categories in De Soto Parish are males with 2 vehicles (2,335, accounting for 43.2%) and females with 2 vehicles (1,778, making up 48.8%).
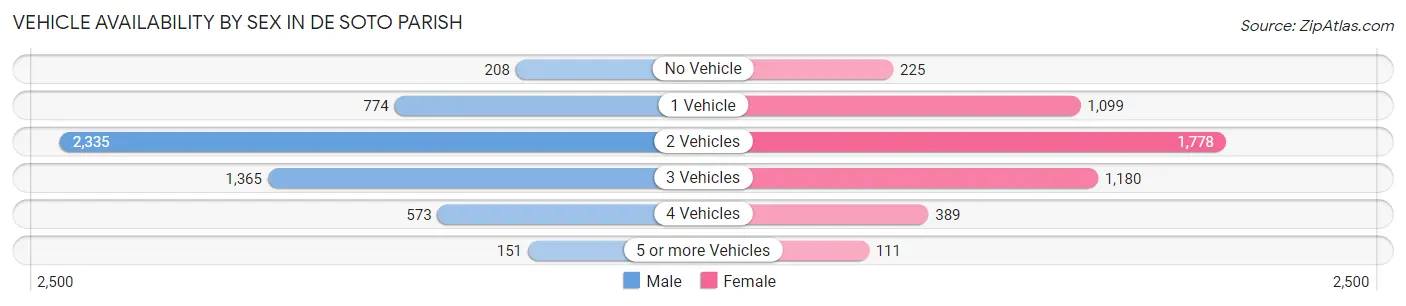
| Vehicles Available | Male | Female |
| No Vehicle | 208 (3.8%) | 225 (4.7%) |
| 1 Vehicle | 774 (14.3%) | 1,099 (23.0%) |
| 2 Vehicles | 2,335 (43.2%) | 1,778 (37.2%) |
| 3 Vehicles | 1,365 (25.3%) | 1,180 (24.7%) |
| 4 Vehicles | 573 (10.6%) | 389 (8.1%) |
| 5 or more Vehicles | 151 (2.8%) | 111 (2.3%) |
| Total | 5,406 (100.0%) | 4,782 (100.0%) |
Commute Time in De Soto Parish
The most frequently occuring commute durations in De Soto Parish are 30 to 34 minutes (2,002 commuters, 20.1%), 25 to 29 minutes (1,249 commuters, 12.6%), and 5 to 9 minutes (1,216 commuters, 12.2%).
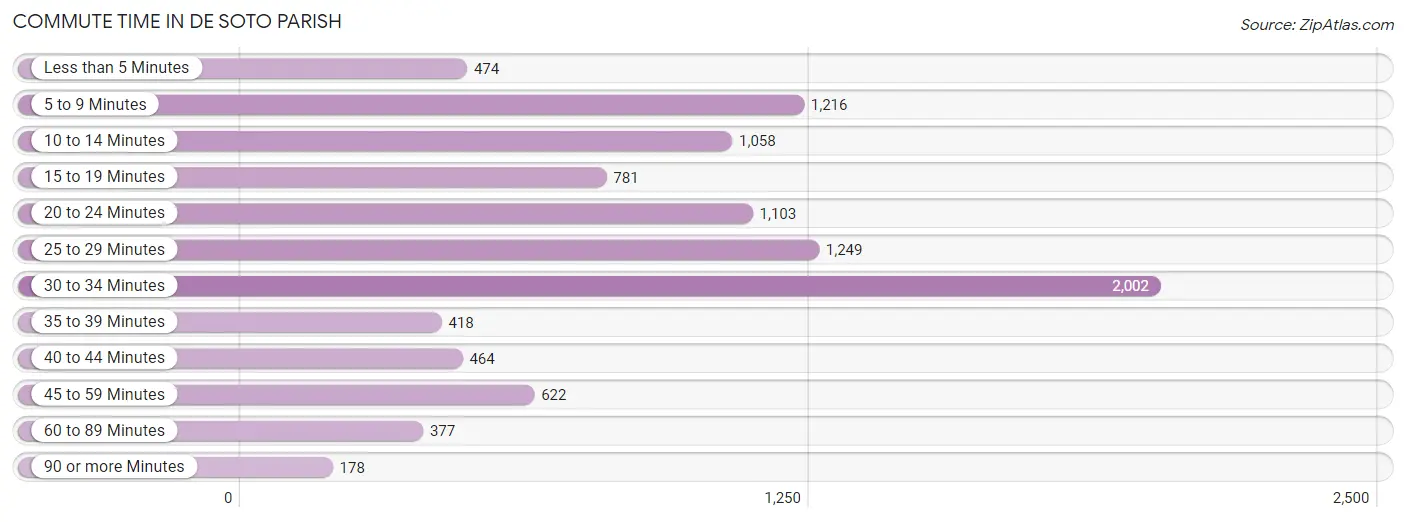
| Commute Time | # Commuters | % Commuters |
| Less than 5 Minutes | 474 | 4.8% |
| 5 to 9 Minutes | 1,216 | 12.2% |
| 10 to 14 Minutes | 1,058 | 10.6% |
| 15 to 19 Minutes | 781 | 7.9% |
| 20 to 24 Minutes | 1,103 | 11.1% |
| 25 to 29 Minutes | 1,249 | 12.6% |
| 30 to 34 Minutes | 2,002 | 20.1% |
| 35 to 39 Minutes | 418 | 4.2% |
| 40 to 44 Minutes | 464 | 4.7% |
| 45 to 59 Minutes | 622 | 6.3% |
| 60 to 89 Minutes | 377 | 3.8% |
| 90 or more Minutes | 178 | 1.8% |
Commute Time by Sex in De Soto Parish
The most common commute times in De Soto Parish are 30 to 34 minutes (1,186 commuters, 22.5%) for males and 30 to 34 minutes (816 commuters, 17.5%) for females.
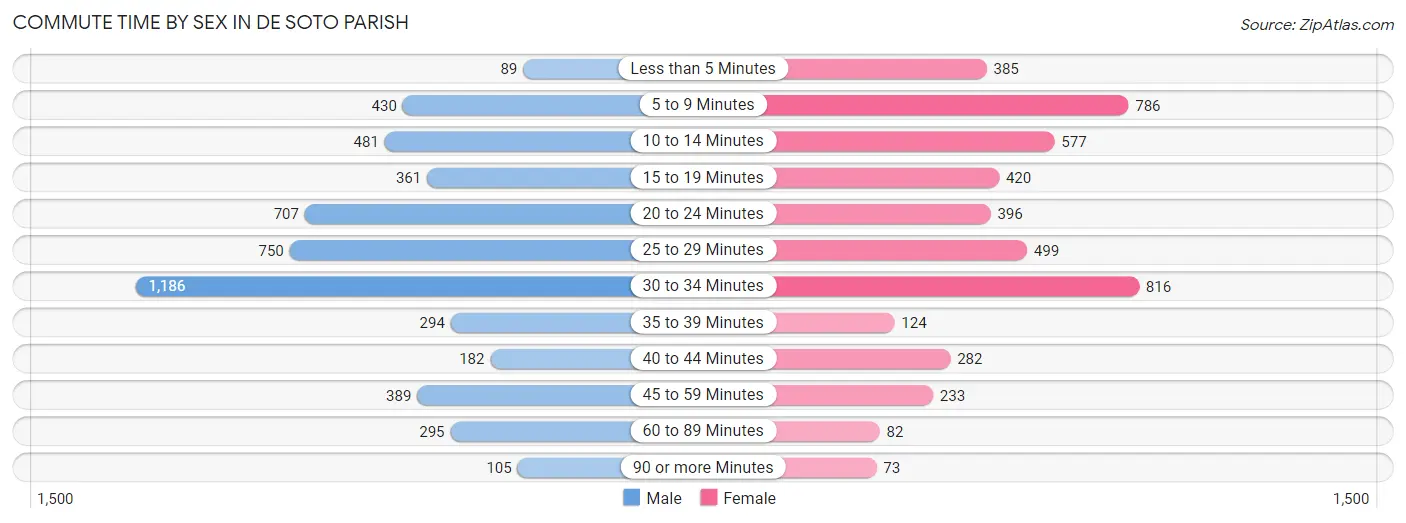
| Commute Time | Male | Female |
| Less than 5 Minutes | 89 (1.7%) | 385 (8.2%) |
| 5 to 9 Minutes | 430 (8.2%) | 786 (16.8%) |
| 10 to 14 Minutes | 481 (9.1%) | 577 (12.3%) |
| 15 to 19 Minutes | 361 (6.9%) | 420 (9.0%) |
| 20 to 24 Minutes | 707 (13.4%) | 396 (8.5%) |
| 25 to 29 Minutes | 750 (14.2%) | 499 (10.7%) |
| 30 to 34 Minutes | 1,186 (22.5%) | 816 (17.5%) |
| 35 to 39 Minutes | 294 (5.6%) | 124 (2.6%) |
| 40 to 44 Minutes | 182 (3.5%) | 282 (6.0%) |
| 45 to 59 Minutes | 389 (7.4%) | 233 (5.0%) |
| 60 to 89 Minutes | 295 (5.6%) | 82 (1.8%) |
| 90 or more Minutes | 105 (2.0%) | 73 (1.6%) |
Time of Departure to Work by Sex in De Soto Parish
The most frequent times of departure to work in De Soto Parish are 6:00 AM to 6:29 AM (899, 17.1%) for males and 7:00 AM to 7:29 AM (915, 19.6%) for females.
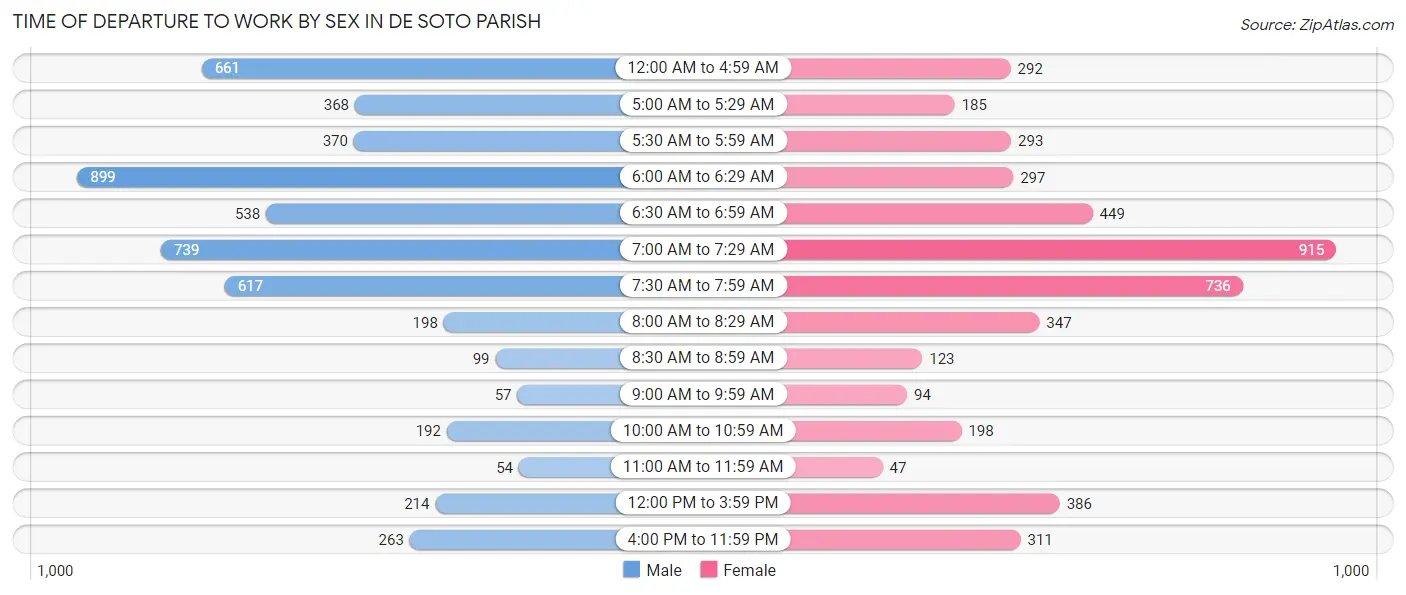
| Time of Departure | Male | Female |
| 12:00 AM to 4:59 AM | 661 (12.6%) | 292 (6.2%) |
| 5:00 AM to 5:29 AM | 368 (7.0%) | 185 (4.0%) |
| 5:30 AM to 5:59 AM | 370 (7.0%) | 293 (6.3%) |
| 6:00 AM to 6:29 AM | 899 (17.1%) | 297 (6.4%) |
| 6:30 AM to 6:59 AM | 538 (10.2%) | 449 (9.6%) |
| 7:00 AM to 7:29 AM | 739 (14.0%) | 915 (19.6%) |
| 7:30 AM to 7:59 AM | 617 (11.7%) | 736 (15.8%) |
| 8:00 AM to 8:29 AM | 198 (3.8%) | 347 (7.4%) |
| 8:30 AM to 8:59 AM | 99 (1.9%) | 123 (2.6%) |
| 9:00 AM to 9:59 AM | 57 (1.1%) | 94 (2.0%) |
| 10:00 AM to 10:59 AM | 192 (3.6%) | 198 (4.2%) |
| 11:00 AM to 11:59 AM | 54 (1.0%) | 47 (1.0%) |
| 12:00 PM to 3:59 PM | 214 (4.1%) | 386 (8.3%) |
| 4:00 PM to 11:59 PM | 263 (5.0%) | 311 (6.7%) |
| Total | 5,269 (100.0%) | 4,673 (100.0%) |
Housing Occupancy in De Soto Parish
Occupancy by Ownership in De Soto Parish
Of the total 10,235 dwellings in De Soto Parish, owner-occupied units account for 7,663 (74.9%), while renter-occupied units make up 2,572 (25.1%).
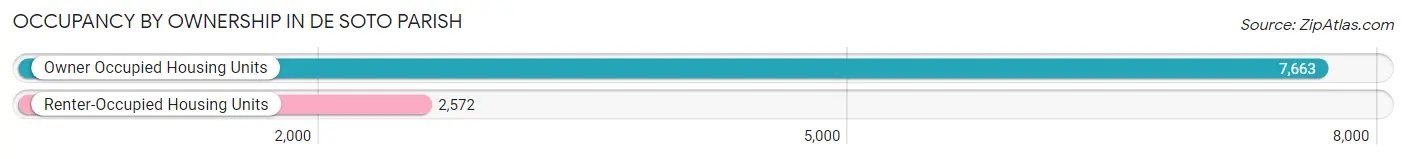
| Occupancy | # Housing Units | % Housing Units |
| Owner Occupied Housing Units | 7,663 | 74.9% |
| Renter-Occupied Housing Units | 2,572 | 25.1% |
| Total Occupied Housing Units | 10,235 | 100.0% |
Occupancy by Household Size in De Soto Parish
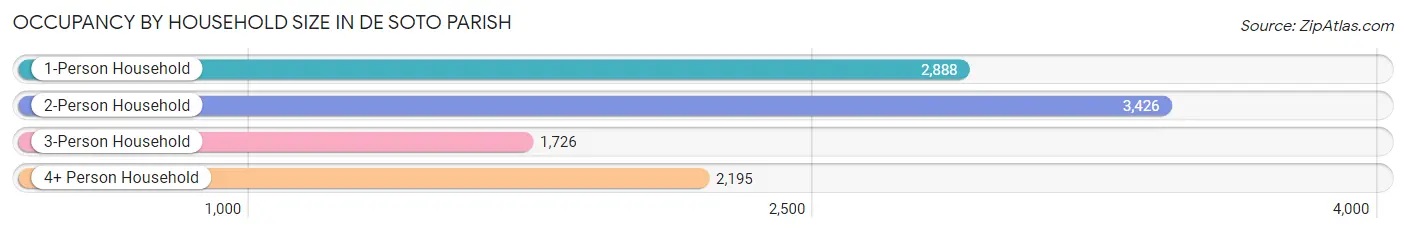
| Household Size | # Housing Units | % Housing Units |
| 1-Person Household | 2,888 | 28.2% |
| 2-Person Household | 3,426 | 33.5% |
| 3-Person Household | 1,726 | 16.9% |
| 4+ Person Household | 2,195 | 21.4% |
| Total Housing Units | 10,235 | 100.0% |
Occupancy by Ownership by Household Size in De Soto Parish
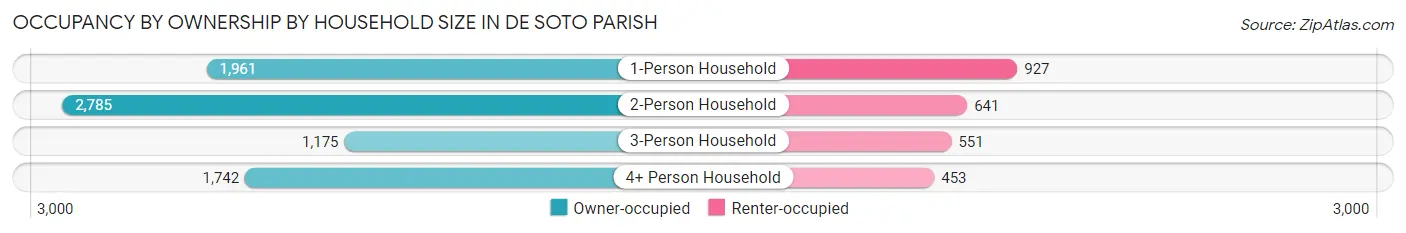
| Household Size | Owner-occupied | Renter-occupied |
| 1-Person Household | 1,961 (67.9%) | 927 (32.1%) |
| 2-Person Household | 2,785 (81.3%) | 641 (18.7%) |
| 3-Person Household | 1,175 (68.1%) | 551 (31.9%) |
| 4+ Person Household | 1,742 (79.4%) | 453 (20.6%) |
| Total Housing Units | 7,663 (74.9%) | 2,572 (25.1%) |
Occupancy by Educational Attainment in De Soto Parish
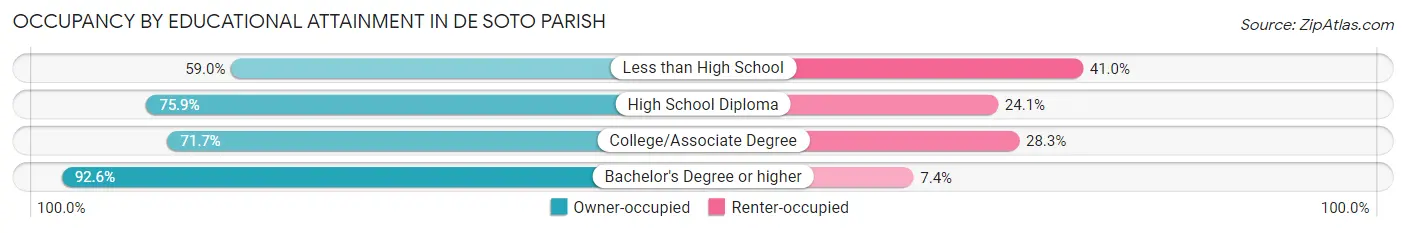
| Household Size | Owner-occupied | Renter-occupied |
| Less than High School | 1,026 (59.0%) | 712 (41.0%) |
| High School Diploma | 2,844 (75.9%) | 905 (24.1%) |
| College/Associate Degree | 2,070 (71.7%) | 818 (28.3%) |
| Bachelor's Degree or higher | 1,723 (92.6%) | 137 (7.4%) |
Occupancy by Age of Householder in De Soto Parish
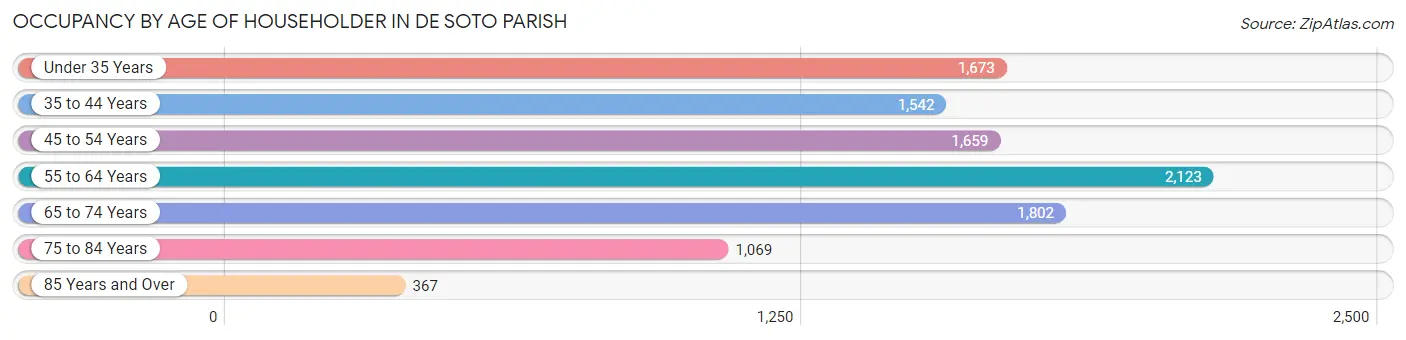
| Age Bracket | # Households | % Households |
| Under 35 Years | 1,673 | 16.4% |
| 35 to 44 Years | 1,542 | 15.1% |
| 45 to 54 Years | 1,659 | 16.2% |
| 55 to 64 Years | 2,123 | 20.7% |
| 65 to 74 Years | 1,802 | 17.6% |
| 75 to 84 Years | 1,069 | 10.4% |
| 85 Years and Over | 367 | 3.6% |
| Total | 10,235 | 100.0% |
Housing Finances in De Soto Parish
Median Income by Occupancy in De Soto Parish
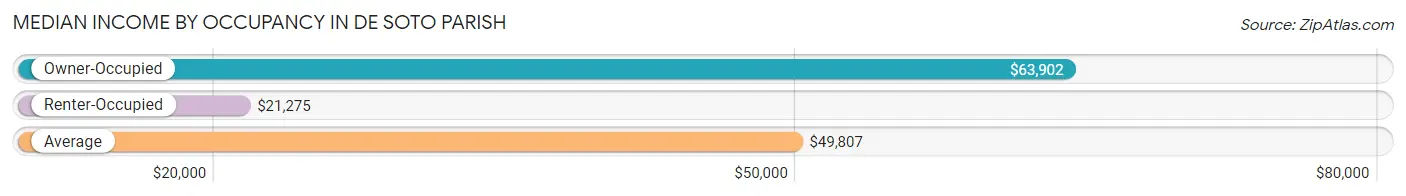
| Occupancy Type | # Households | Median Income |
| Owner-Occupied | 7,663 (74.9%) | $63,902 |
| Renter-Occupied | 2,572 (25.1%) | $21,275 |
| Average | 10,235 (100.0%) | $49,807 |
Occupancy by Householder Income Bracket in De Soto Parish
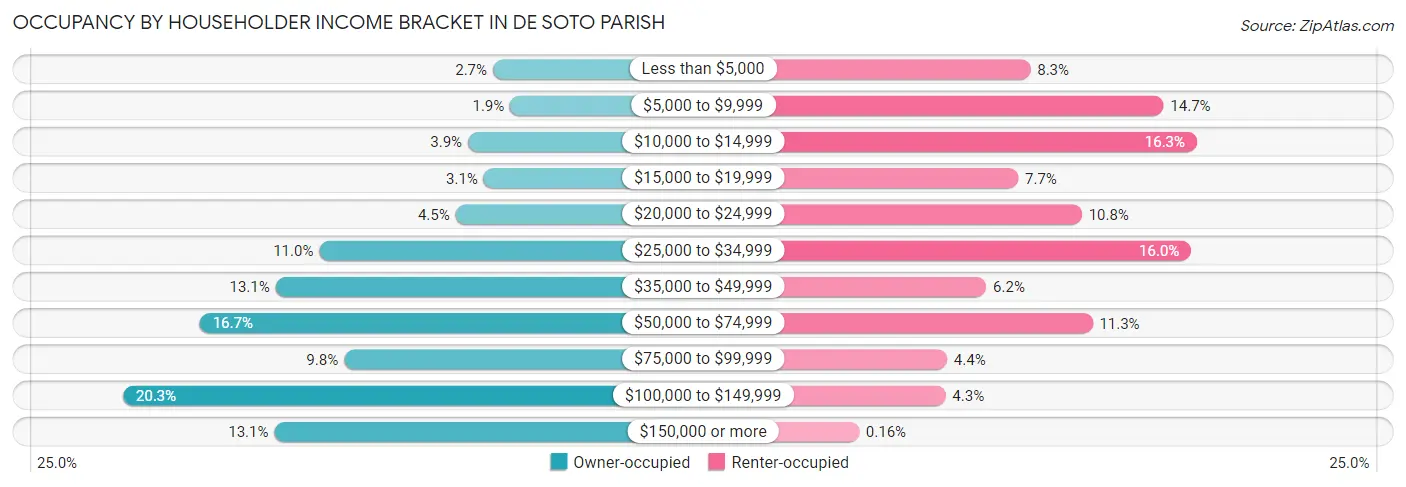
| Income Bracket | Owner-occupied | Renter-occupied |
| Less than $5,000 | 207 (2.7%) | 214 (8.3%) |
| $5,000 to $9,999 | 144 (1.9%) | 377 (14.7%) |
| $10,000 to $14,999 | 298 (3.9%) | 418 (16.3%) |
| $15,000 to $19,999 | 241 (3.1%) | 199 (7.7%) |
| $20,000 to $24,999 | 343 (4.5%) | 277 (10.8%) |
| $25,000 to $34,999 | 841 (11.0%) | 411 (16.0%) |
| $35,000 to $49,999 | 1,000 (13.1%) | 160 (6.2%) |
| $50,000 to $74,999 | 1,277 (16.7%) | 290 (11.3%) |
| $75,000 to $99,999 | 750 (9.8%) | 112 (4.3%) |
| $100,000 to $149,999 | 1,557 (20.3%) | 110 (4.3%) |
| $150,000 or more | 1,005 (13.1%) | 4 (0.2%) |
| Total | 7,663 (100.0%) | 2,572 (100.0%) |
Monthly Housing Cost Tiers in De Soto Parish
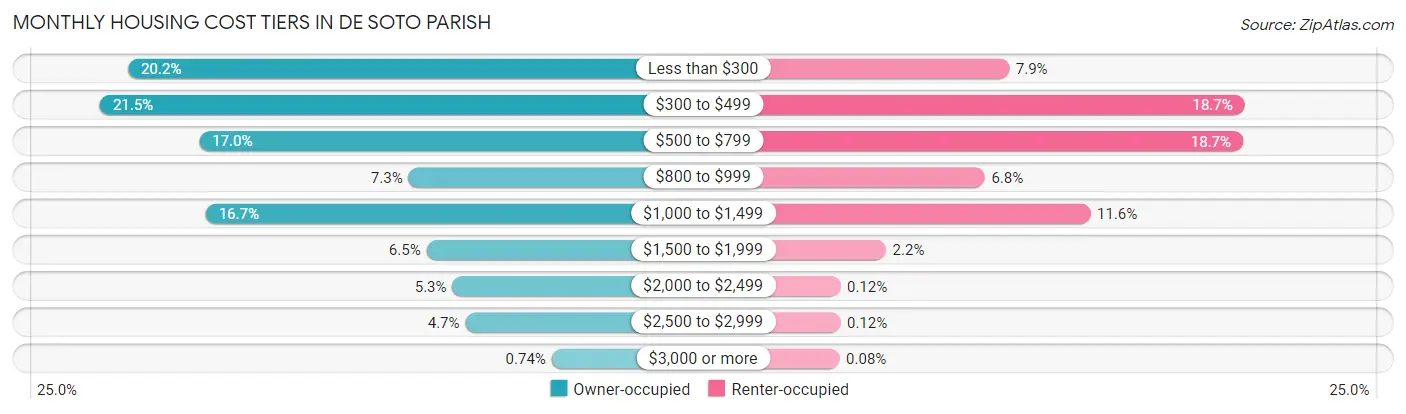
| Monthly Cost | Owner-occupied | Renter-occupied |
| Less than $300 | 1,551 (20.2%) | 203 (7.9%) |
| $300 to $499 | 1,650 (21.5%) | 482 (18.7%) |
| $500 to $799 | 1,300 (17.0%) | 480 (18.7%) |
| $800 to $999 | 562 (7.3%) | 174 (6.8%) |
| $1,000 to $1,499 | 1,277 (16.7%) | 299 (11.6%) |
| $1,500 to $1,999 | 498 (6.5%) | 57 (2.2%) |
| $2,000 to $2,499 | 407 (5.3%) | 3 (0.1%) |
| $2,500 to $2,999 | 361 (4.7%) | 3 (0.1%) |
| $3,000 or more | 57 (0.7%) | 2 (0.1%) |
| Total | 7,663 (100.0%) | 2,572 (100.0%) |
Physical Housing Characteristics in De Soto Parish
Housing Structures in De Soto Parish
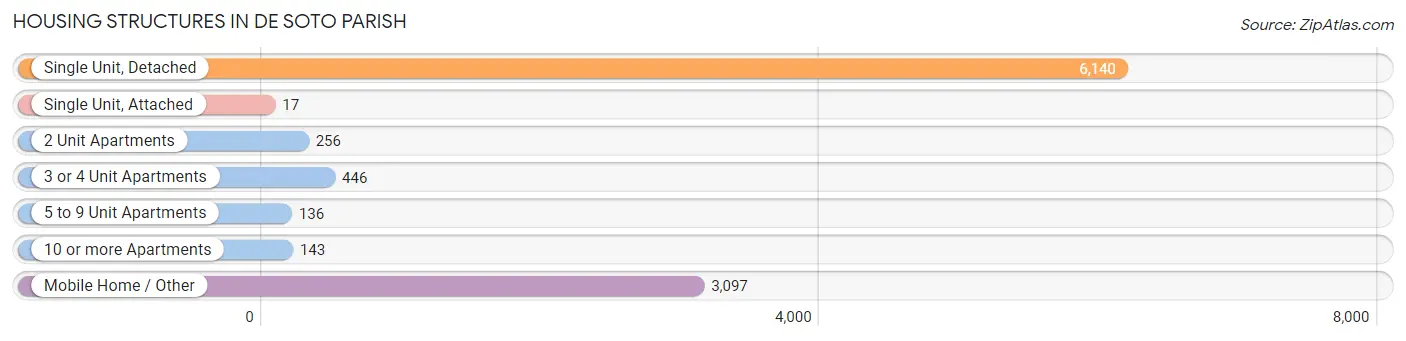
| Structure Type | # Housing Units | % Housing Units |
| Single Unit, Detached | 6,140 | 60.0% |
| Single Unit, Attached | 17 | 0.2% |
| 2 Unit Apartments | 256 | 2.5% |
| 3 or 4 Unit Apartments | 446 | 4.4% |
| 5 to 9 Unit Apartments | 136 | 1.3% |
| 10 or more Apartments | 143 | 1.4% |
| Mobile Home / Other | 3,097 | 30.3% |
| Total | 10,235 | 100.0% |
Housing Structures by Occupancy in De Soto Parish
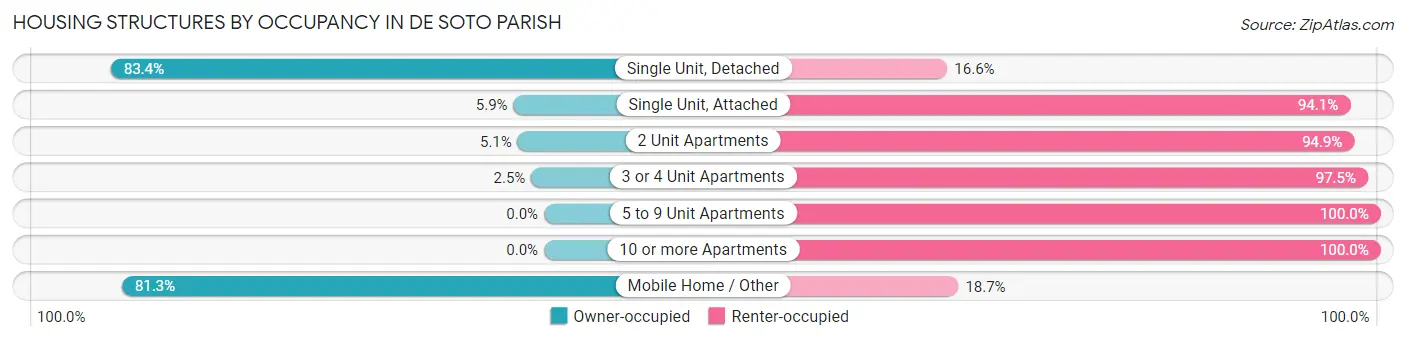
| Structure Type | Owner-occupied | Renter-occupied |
| Single Unit, Detached | 5,121 (83.4%) | 1,019 (16.6%) |
| Single Unit, Attached | 1 (5.9%) | 16 (94.1%) |
| 2 Unit Apartments | 13 (5.1%) | 243 (94.9%) |
| 3 or 4 Unit Apartments | 11 (2.5%) | 435 (97.5%) |
| 5 to 9 Unit Apartments | 0 (0.0%) | 136 (100.0%) |
| 10 or more Apartments | 0 (0.0%) | 143 (100.0%) |
| Mobile Home / Other | 2,517 (81.3%) | 580 (18.7%) |
| Total | 7,663 (74.9%) | 2,572 (25.1%) |
Housing Structures by Number of Rooms in De Soto Parish
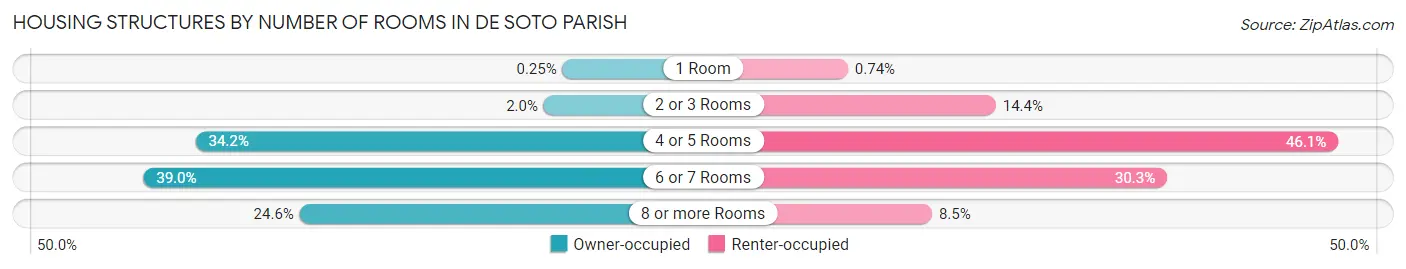
| Number of Rooms | Owner-occupied | Renter-occupied |
| 1 Room | 19 (0.3%) | 19 (0.7%) |
| 2 or 3 Rooms | 152 (2.0%) | 371 (14.4%) |
| 4 or 5 Rooms | 2,620 (34.2%) | 1,185 (46.1%) |
| 6 or 7 Rooms | 2,990 (39.0%) | 778 (30.2%) |
| 8 or more Rooms | 1,882 (24.6%) | 219 (8.5%) |
| Total | 7,663 (100.0%) | 2,572 (100.0%) |
Housing Structure by Heating Type in De Soto Parish
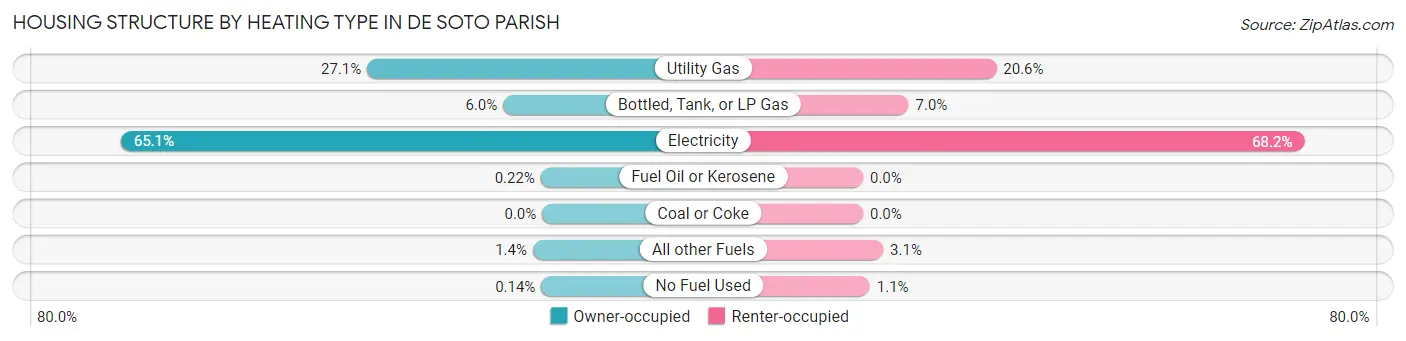
| Heating Type | Owner-occupied | Renter-occupied |
| Utility Gas | 2,073 (27.1%) | 530 (20.6%) |
| Bottled, Tank, or LP Gas | 462 (6.0%) | 181 (7.0%) |
| Electricity | 4,990 (65.1%) | 1,754 (68.2%) |
| Fuel Oil or Kerosene | 17 (0.2%) | 0 (0.0%) |
| Coal or Coke | 0 (0.0%) | 0 (0.0%) |
| All other Fuels | 110 (1.4%) | 80 (3.1%) |
| No Fuel Used | 11 (0.1%) | 27 (1.1%) |
| Total | 7,663 (100.0%) | 2,572 (100.0%) |
Household Vehicle Usage in De Soto Parish
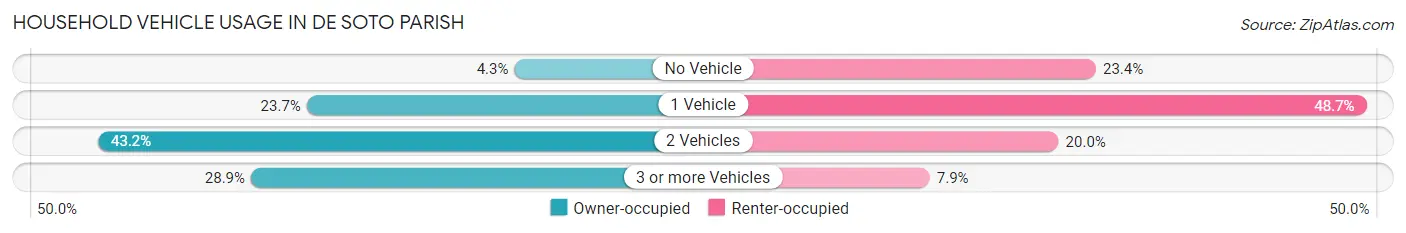
| Vehicles per Household | Owner-occupied | Renter-occupied |
| No Vehicle | 329 (4.3%) | 603 (23.4%) |
| 1 Vehicle | 1,814 (23.7%) | 1,252 (48.7%) |
| 2 Vehicles | 3,307 (43.2%) | 513 (20.0%) |
| 3 or more Vehicles | 2,213 (28.9%) | 204 (7.9%) |
| Total | 7,663 (100.0%) | 2,572 (100.0%) |
Real Estate & Mortgages in De Soto Parish
Real Estate and Mortgage Overview in De Soto Parish
| Characteristic | Without Mortgage | With Mortgage |
| Housing Units | 4,075 | 3,588 |
| Median Property Value | $99,500 | $168,800 |
| Median Household Income | $49,051 | $688 |
| Monthly Housing Costs | $343 | $57 |
| Real Estate Taxes | $256 | $1,159 |
Property Value by Mortgage Status in De Soto Parish
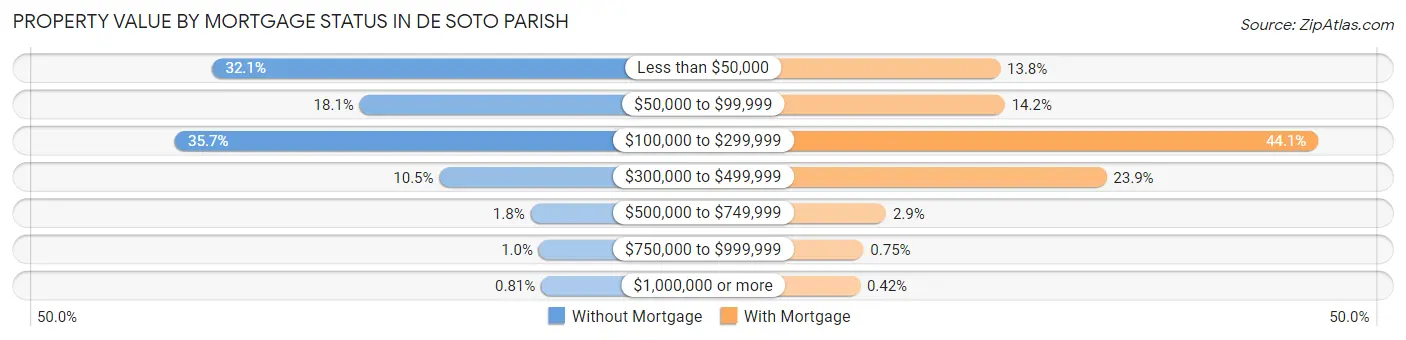
| Property Value | Without Mortgage | With Mortgage |
| Less than $50,000 | 1,308 (32.1%) | 494 (13.8%) |
| $50,000 to $99,999 | 737 (18.1%) | 510 (14.2%) |
| $100,000 to $299,999 | 1,453 (35.7%) | 1,581 (44.1%) |
| $300,000 to $499,999 | 428 (10.5%) | 857 (23.9%) |
| $500,000 to $749,999 | 74 (1.8%) | 104 (2.9%) |
| $750,000 to $999,999 | 42 (1.0%) | 27 (0.7%) |
| $1,000,000 or more | 33 (0.8%) | 15 (0.4%) |
| Total | 4,075 (100.0%) | 3,588 (100.0%) |
Household Income by Mortgage Status in De Soto Parish
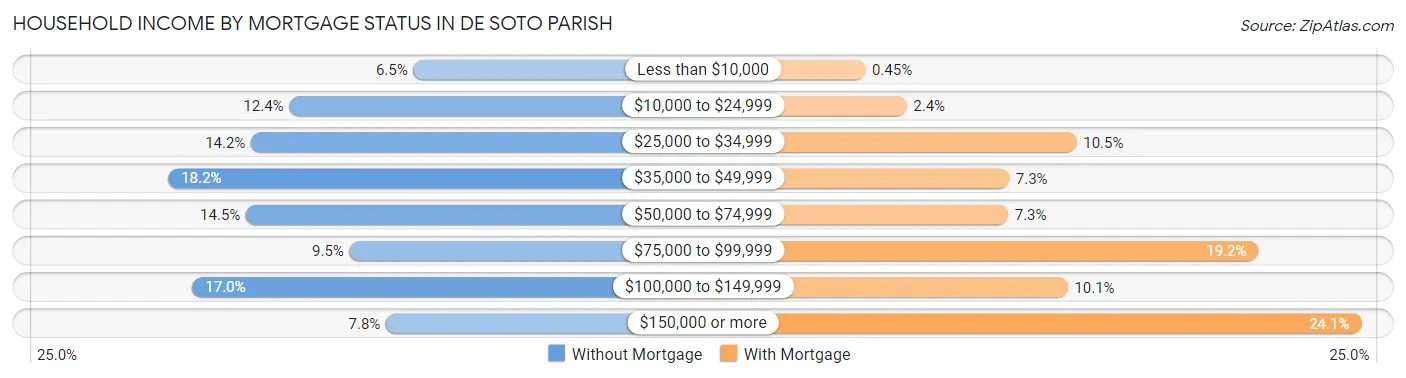
| Household Income | Without Mortgage | With Mortgage |
| Less than $10,000 | 264 (6.5%) | 16 (0.4%) |
| $10,000 to $24,999 | 505 (12.4%) | 87 (2.4%) |
| $25,000 to $34,999 | 579 (14.2%) | 377 (10.5%) |
| $35,000 to $49,999 | 740 (18.2%) | 262 (7.3%) |
| $50,000 to $74,999 | 589 (14.4%) | 260 (7.2%) |
| $75,000 to $99,999 | 388 (9.5%) | 688 (19.2%) |
| $100,000 to $149,999 | 693 (17.0%) | 362 (10.1%) |
| $150,000 or more | 317 (7.8%) | 864 (24.1%) |
| Total | 4,075 (100.0%) | 3,588 (100.0%) |
Property Value to Household Income Ratio in De Soto Parish
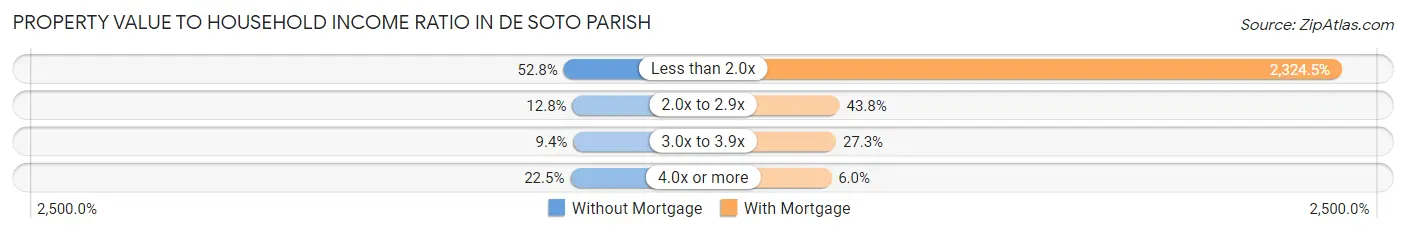
| Value-to-Income Ratio | Without Mortgage | With Mortgage |
| Less than 2.0x | 2,152 (52.8%) | 83,404 (2,324.5%) |
| 2.0x to 2.9x | 522 (12.8%) | 1,573 (43.8%) |
| 3.0x to 3.9x | 381 (9.3%) | 981 (27.3%) |
| 4.0x or more | 918 (22.5%) | 216 (6.0%) |
| Total | 4,075 (100.0%) | 3,588 (100.0%) |
Real Estate Taxes by Mortgage Status in De Soto Parish
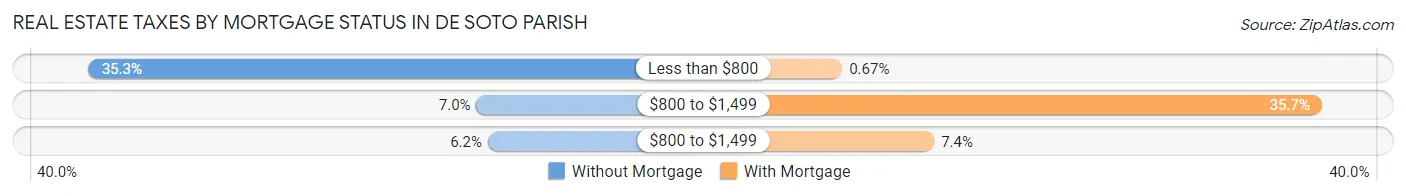
| Property Taxes | Without Mortgage | With Mortgage |
| Less than $800 | 1,439 (35.3%) | 24 (0.7%) |
| $800 to $1,499 | 285 (7.0%) | 1,281 (35.7%) |
| $800 to $1,499 | 251 (6.2%) | 265 (7.4%) |
| Total | 4,075 (100.0%) | 3,588 (100.0%) |
Health & Disability in De Soto Parish
Health Insurance Coverage by Age in De Soto Parish
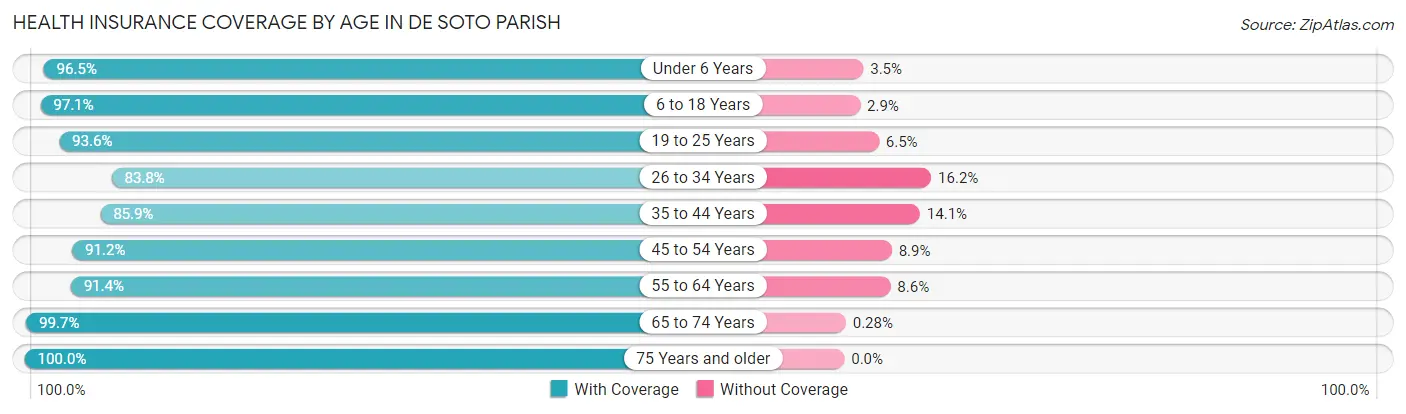
| Age Bracket | With Coverage | Without Coverage |
| Under 6 Years | 1,910 (96.5%) | 70 (3.5%) |
| 6 to 18 Years | 4,595 (97.1%) | 139 (2.9%) |
| 19 to 25 Years | 1,887 (93.5%) | 130 (6.5%) |
| 26 to 34 Years | 2,369 (83.8%) | 458 (16.2%) |
| 35 to 44 Years | 2,992 (85.9%) | 491 (14.1%) |
| 45 to 54 Years | 2,862 (91.1%) | 278 (8.8%) |
| 55 to 64 Years | 3,328 (91.4%) | 313 (8.6%) |
| 65 to 74 Years | 2,808 (99.7%) | 8 (0.3%) |
| 75 Years and older | 1,972 (100.0%) | 0 (0.0%) |
| Total | 24,723 (92.9%) | 1,887 (7.1%) |
Health Insurance Coverage by Citizenship Status in De Soto Parish

| Citizenship Status | With Coverage | Without Coverage |
| Native Born | 1,910 (96.5%) | 70 (3.5%) |
| Foreign Born, Citizen | 4,595 (97.1%) | 139 (2.9%) |
| Foreign Born, not a Citizen | 1,887 (93.5%) | 130 (6.5%) |
Health Insurance Coverage by Household Income in De Soto Parish
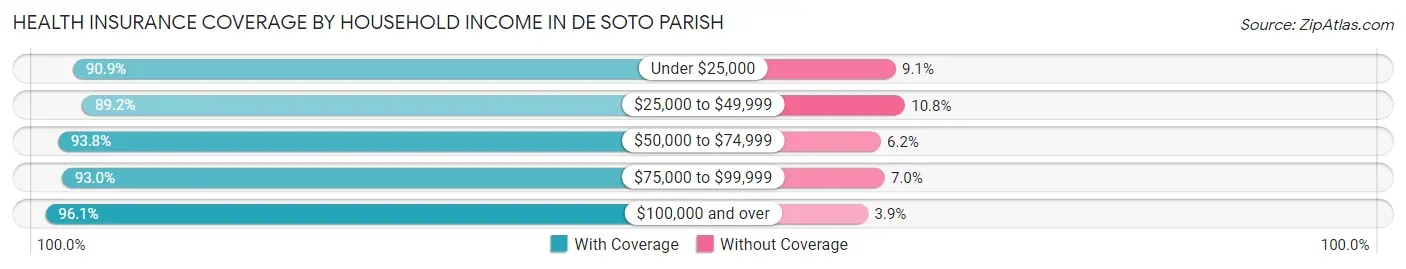
| Household Income | With Coverage | Without Coverage |
| Under $25,000 | 4,628 (90.9%) | 461 (9.1%) |
| $25,000 to $49,999 | 5,290 (89.2%) | 639 (10.8%) |
| $50,000 to $74,999 | 4,450 (93.8%) | 296 (6.2%) |
| $75,000 to $99,999 | 2,107 (93.0%) | 158 (7.0%) |
| $100,000 and over | 8,228 (96.1%) | 333 (3.9%) |
Public vs Private Health Insurance Coverage by Age in De Soto Parish
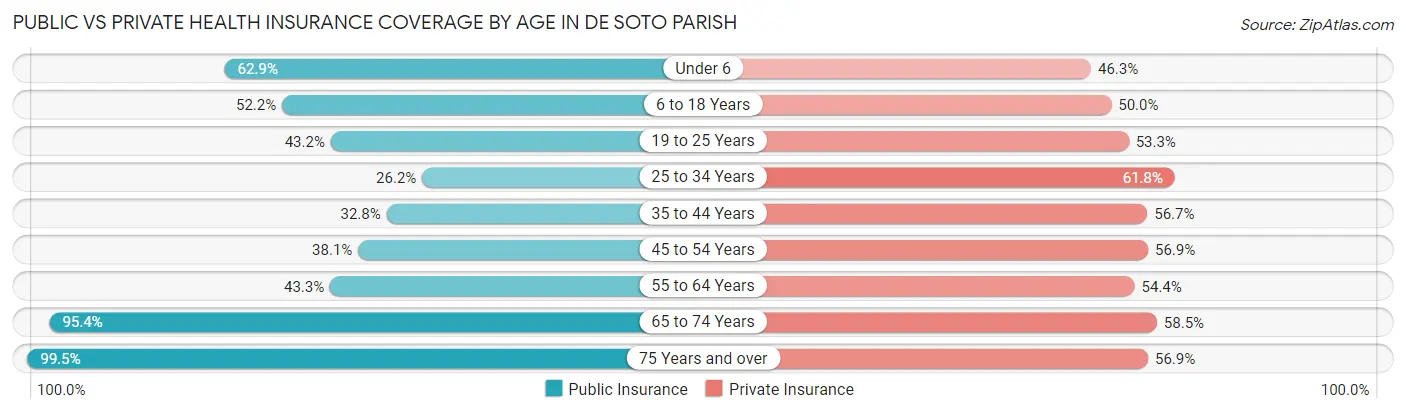
| Age Bracket | Public Insurance | Private Insurance |
| Under 6 | 1,245 (62.9%) | 916 (46.3%) |
| 6 to 18 Years | 2,472 (52.2%) | 2,368 (50.0%) |
| 19 to 25 Years | 871 (43.2%) | 1,074 (53.2%) |
| 25 to 34 Years | 741 (26.2%) | 1,747 (61.8%) |
| 35 to 44 Years | 1,143 (32.8%) | 1,975 (56.7%) |
| 45 to 54 Years | 1,196 (38.1%) | 1,785 (56.9%) |
| 55 to 64 Years | 1,577 (43.3%) | 1,979 (54.3%) |
| 65 to 74 Years | 2,686 (95.4%) | 1,647 (58.5%) |
| 75 Years and over | 1,962 (99.5%) | 1,121 (56.9%) |
| Total | 13,893 (52.2%) | 14,612 (54.9%) |
Disability Status by Sex by Age in De Soto Parish
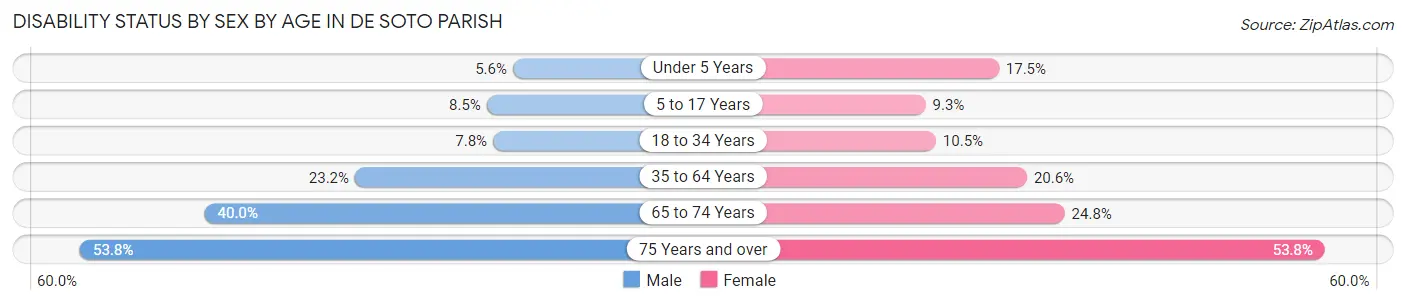
| Age Bracket | Male | Female |
| Under 5 Years | 46 (5.6%) | 135 (17.5%) |
| 5 to 17 Years | 221 (8.5%) | 206 (9.3%) |
| 18 to 34 Years | 203 (7.8%) | 271 (10.5%) |
| 35 to 64 Years | 1,130 (23.2%) | 1,113 (20.6%) |
| 65 to 74 Years | 523 (40.0%) | 374 (24.8%) |
| 75 Years and over | 451 (53.8%) | 610 (53.8%) |
Disability Class by Sex by Age in De Soto Parish
Disability Class: Hearing Difficulty
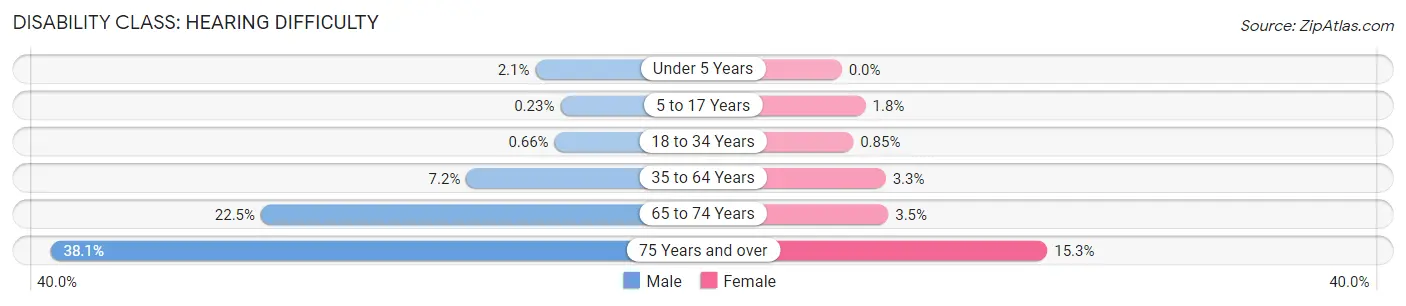
| Age Bracket | Male | Female |
| Under 5 Years | 17 (2.1%) | 0 (0.0%) |
| 5 to 17 Years | 6 (0.2%) | 39 (1.8%) |
| 18 to 34 Years | 17 (0.7%) | 22 (0.9%) |
| 35 to 64 Years | 351 (7.2%) | 176 (3.3%) |
| 65 to 74 Years | 294 (22.5%) | 52 (3.5%) |
| 75 Years and over | 319 (38.1%) | 173 (15.3%) |
Disability Class: Vision Difficulty
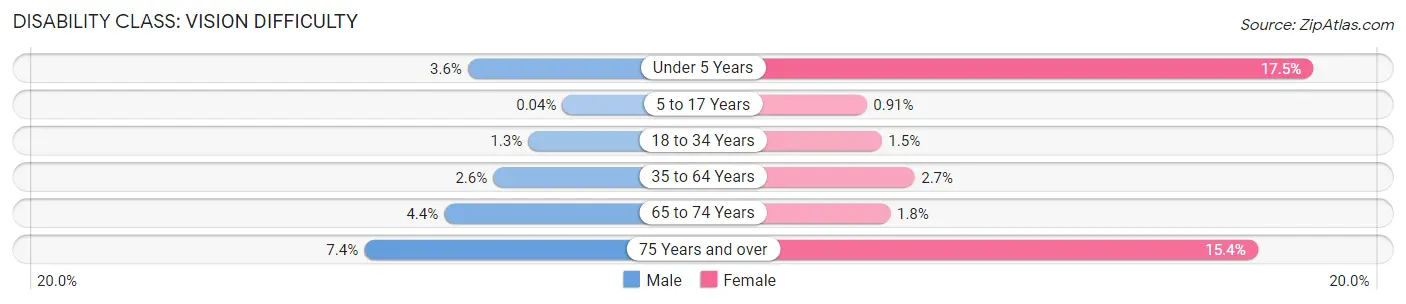
| Age Bracket | Male | Female |
| Under 5 Years | 29 (3.5%) | 135 (17.5%) |
| 5 to 17 Years | 1 (0.0%) | 20 (0.9%) |
| 18 to 34 Years | 34 (1.3%) | 38 (1.5%) |
| 35 to 64 Years | 127 (2.6%) | 145 (2.7%) |
| 65 to 74 Years | 58 (4.4%) | 27 (1.8%) |
| 75 Years and over | 62 (7.4%) | 175 (15.4%) |
Disability Class: Cognitive Difficulty
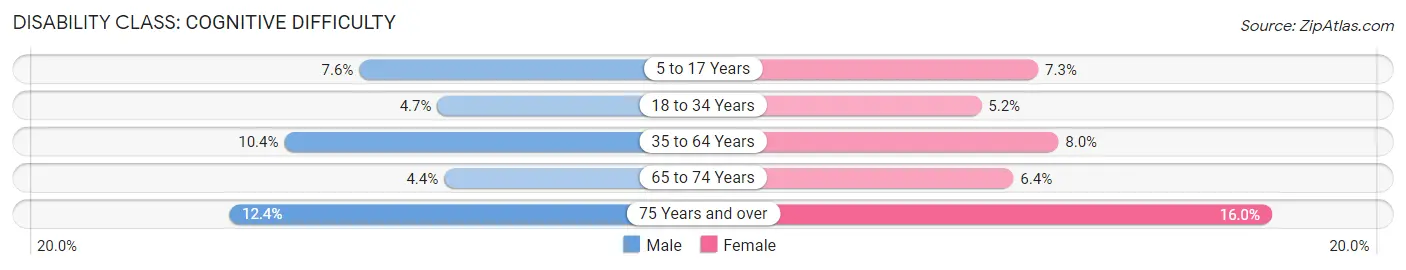
| Age Bracket | Male | Female |
| 5 to 17 Years | 196 (7.6%) | 161 (7.3%) |
| 18 to 34 Years | 121 (4.7%) | 134 (5.2%) |
| 35 to 64 Years | 504 (10.4%) | 434 (8.0%) |
| 65 to 74 Years | 58 (4.4%) | 96 (6.4%) |
| 75 Years and over | 104 (12.4%) | 181 (16.0%) |
Disability Class: Ambulatory Difficulty
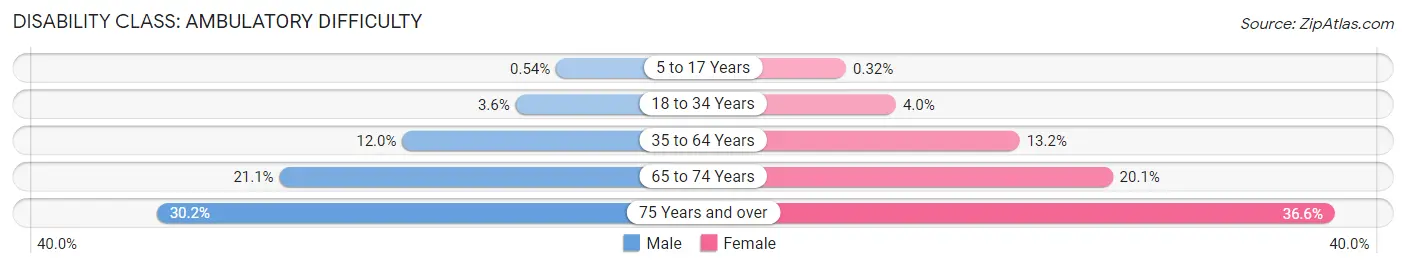
| Age Bracket | Male | Female |
| 5 to 17 Years | 14 (0.5%) | 7 (0.3%) |
| 18 to 34 Years | 92 (3.5%) | 104 (4.0%) |
| 35 to 64 Years | 582 (12.0%) | 713 (13.2%) |
| 65 to 74 Years | 276 (21.1%) | 303 (20.1%) |
| 75 Years and over | 253 (30.2%) | 415 (36.6%) |
Disability Class: Self-Care Difficulty
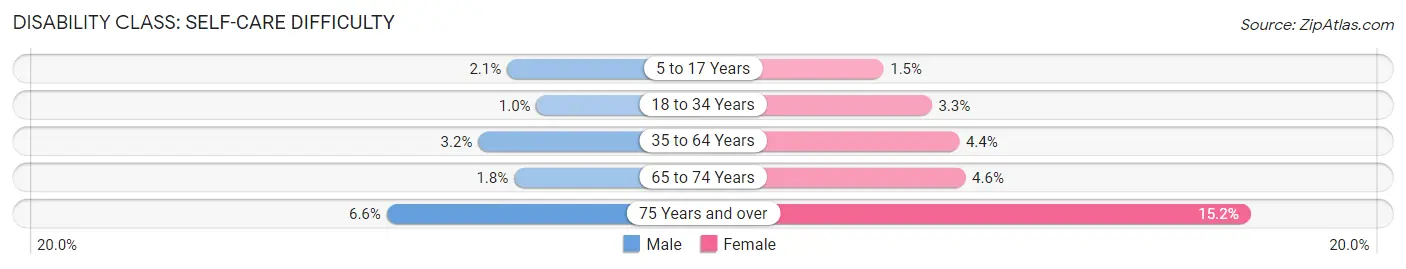
| Age Bracket | Male | Female |
| 5 to 17 Years | 54 (2.1%) | 34 (1.5%) |
| 18 to 34 Years | 26 (1.0%) | 86 (3.3%) |
| 35 to 64 Years | 154 (3.2%) | 235 (4.3%) |
| 65 to 74 Years | 24 (1.8%) | 69 (4.6%) |
| 75 Years and over | 55 (6.6%) | 172 (15.2%) |
Technology Access in De Soto Parish
Computing Device Access in De Soto Parish
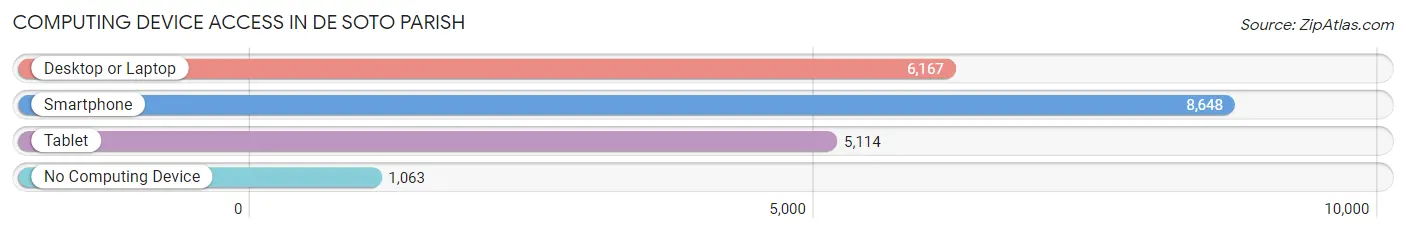
| Device Type | # Households | % Households |
| Desktop or Laptop | 6,167 | 60.3% |
| Smartphone | 8,648 | 84.5% |
| Tablet | 5,114 | 50.0% |
| No Computing Device | 1,063 | 10.4% |
| Total | 10,235 | 100.0% |
Internet Access in De Soto Parish
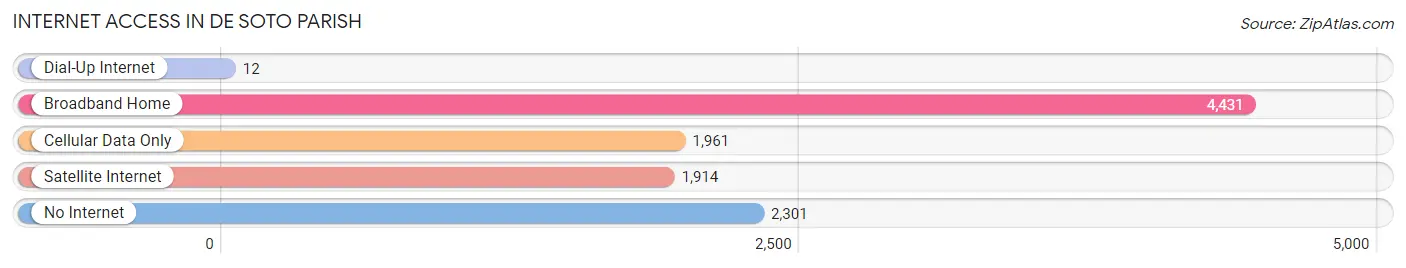
| Internet Type | # Households | % Households |
| Dial-Up Internet | 12 | 0.1% |
| Broadband Home | 4,431 | 43.3% |
| Cellular Data Only | 1,961 | 19.2% |
| Satellite Internet | 1,914 | 18.7% |
| No Internet | 2,301 | 22.5% |
| Total | 10,235 | 100.0% |
De Soto Parish Summary
De Soto Parish is located in the northwestern corner of Louisiana, and is part of the Shreveport-Bossier City Metropolitan Statistical Area. The parish was created in 1843 and named after Spanish explorer Hernando de Soto. It covers an area of 810 square miles and has a population of 26,656 as of the 2010 census.
Geography
De Soto Parish is located in the northwestern corner of Louisiana, and is bordered by Caddo Parish to the east, Red River Parish to the north, Natchitoches Parish to the west, and Sabine Parish to the south. The parish is located in the Ark-La-Tex region, which is the area where the states of Arkansas, Louisiana, and Texas meet. The parish is mostly rural, with the majority of the land being used for agriculture. The parish is home to the Kisatchie National Forest, which covers over 600,000 acres and is the only national forest in Louisiana.
The parish is divided into two distinct regions: the Red River Valley and the Kisatchie Hills. The Red River Valley is located in the eastern part of the parish and is characterized by flat, fertile land. The Kisatchie Hills are located in the western part of the parish and are characterized by rolling hills and forests. The highest point in the parish is located in the Kisatchie Hills, at an elevation of 545 feet.
The parish is home to several bodies of water, including the Red River, which forms the northern border of the parish, and the Sabine River, which forms the southern border. Other bodies of water in the parish include Lake Bistineau, Lake Claiborne, and Lake D’Arbonne.
Economy
The economy of De Soto Parish is largely based on agriculture. The parish is home to several large farms, which produce cotton, soybeans, corn, and other crops. The parish is also home to several timber companies, which harvest timber from the Kisatchie National Forest.
The parish is also home to several manufacturing companies, which produce a variety of products, including furniture, paper products, and chemicals. The parish is also home to several oil and gas companies, which produce oil and natural gas from the many oil and gas fields in the parish.
Demographics
As of the 2010 census, the population of De Soto Parish was 26,656. The racial makeup of the parish was 79.3% White, 17.7% African American, 0.4% Native American, 0.3% Asian, 0.1% Pacific Islander, 1.2% from other races, and 1.1% from two or more races. Hispanic or Latino of any race were 3.2% of the population.
The median income for a household in the parish was $37,945, and the median income for a family was $45,945. The per capita income for the parish was $18,945. About 17.2% of families and 21.2% of the population were below the poverty line, including 28.2% of those under age 18 and 16.2% of those age 65 or over.
De Soto Parish is served by the De Soto Parish School District, which consists of seven elementary schools, two middle schools, and two high schools. The parish is also home to several private schools, including the De Soto Christian Academy and the De Soto Montessori School. The parish is also home to Northwestern State University, which is located in Natchitoches.
Common Questions
What is the Total Population of De Soto Parish?
Total Population of De Soto Parish is 26,821.
What is the Total Male Population of De Soto Parish?
Total Male Population of De Soto Parish is 13,130.
What is the Total Female Population of De Soto Parish?
Total Female Population of De Soto Parish is 13,691.
What is the Ratio of Males per 100 Females in De Soto Parish?
There are 95.90 Males per 100 Females in De Soto Parish.
What is the Ratio of Females per 100 Males in De Soto Parish?
There are 104.27 Females per 100 Males in De Soto Parish.
What is the Median Population Age in De Soto Parish?
Median Population Age in De Soto Parish is 39.3 Years.
What is the Average Family Size in De Soto Parish
Average Family Size in De Soto Parish is 3.1 People.
What is the Average Household Size in De Soto Parish
Average Household Size in De Soto Parish is 2.6 People.
What is Per Capita Income in De Soto Parish?
Per Capita income in De Soto Parish is $28,772.
What is the Median Family Income in De Soto Parish?
Median Family Income in De Soto Parish is $59,472.
What is the Median Household income in De Soto Parish?
Median Household Income in De Soto Parish is $49,807.
What is Income or Wage Gap in De Soto Parish?
Income or Wage Gap in De Soto Parish is 44.0%.
Women in De Soto Parish earn 56.0 cents for every dollar earned by a man.
What is Family Income Deficit in De Soto Parish?
Family Income Deficit in De Soto Parish is $10,165.
Families that are below poverty line in De Soto Parish earn $10,165 less on average than the poverty threshold level.
What is Inequality or Gini Index in De Soto Parish?
Inequality or Gini Index in De Soto Parish is 0.49.
How Large is the Labor Force in De Soto Parish?
There are 11,133 People in the Labor Forcein in De Soto Parish.
What is the Percentage of People in the Labor Force in De Soto Parish?
52.4% of People are in the Labor Force in De Soto Parish.
What is the Unemployment Rate in De Soto Parish?
Unemployment Rate in De Soto Parish is 6.9%.