Concordia Parish, LA
Concordia Parish Map
Concordia Parish Overview
18,677
TOTAL POPULATION
9,298
MALE POPULATION
9,379
FEMALE POPULATION
99.14
MALES / 100 FEMALES
100.87
FEMALES / 100 MALES
37.8
MEDIAN AGE
3.6
AVG FAMILY SIZE
2.8
AVG HOUSEHOLD SIZE
$21,941
PER CAPITA INCOME
$53,260
AVG FAMILY INCOME
$38,929
AVG HOUSEHOLD INCOME
39.0%
WAGE / INCOME GAP [ % ]
61.0¢/ $1
WAGE / INCOME GAP [ $ ]
$11,895
FAMILY INCOME DEFICIT
0.49
INEQUALITY / GINI INDEX
6,196
LABOR FORCE [ PEOPLE ]
41.7%
PERCENT IN LABOR FORCE
12.0%
UNEMPLOYMENT RATE
Concordia Parish Area Codes
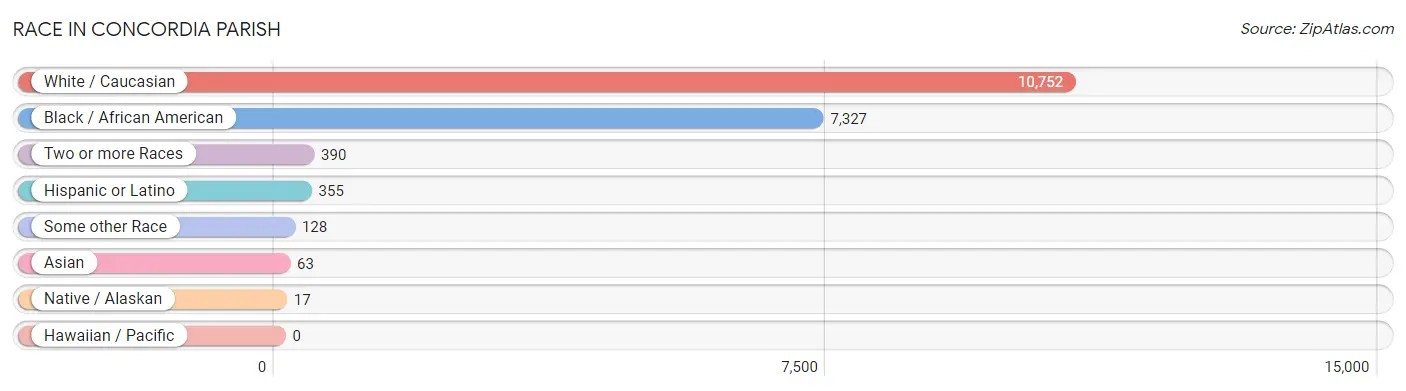
Race in Concordia Parish
The most populous races in Concordia Parish are White / Caucasian (10,752 | 57.6%), Black / African American (7,327 | 39.2%), and Two or more Races (390 | 2.1%).
| Race | # Population | % Population |
| Asian | 63 | 0.3% |
| Black / African American | 7,327 | 39.2% |
| Hawaiian / Pacific | 0 | 0.0% |
| Hispanic or Latino | 355 | 1.9% |
| Native / Alaskan | 17 | 0.1% |
| White / Caucasian | 10,752 | 57.6% |
| Two or more Races | 390 | 2.1% |
| Some other Race | 128 | 0.7% |
| Total | 18,677 | 100.0% |
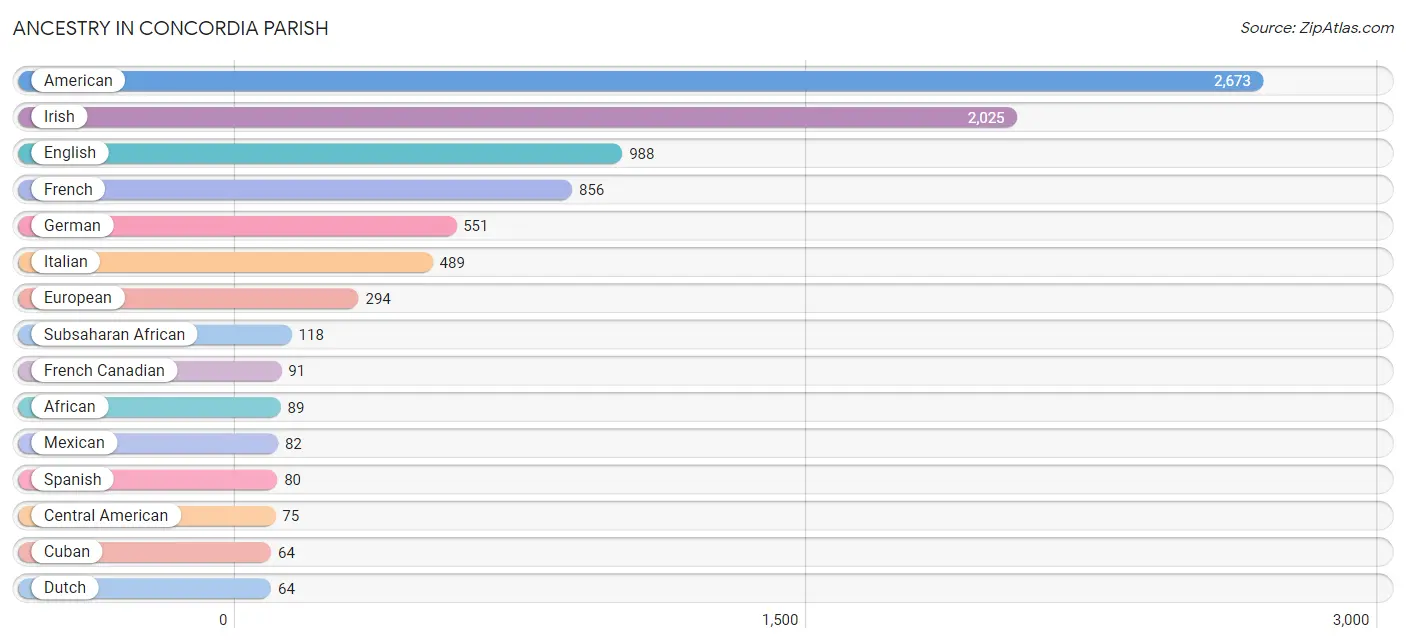
Ancestry in Concordia Parish
The most populous ancestries reported in Concordia Parish are American (2,673 | 14.3%), Irish (2,025 | 10.8%), English (988 | 5.3%), French (856 | 4.6%), and German (551 | 2.9%), together accounting for 38.0% of all Concordia Parish residents.
| Ancestry | # Population | % Population |
| African | 89 | 0.5% |
| American | 2,673 | 14.3% |
| Arab | 9 | 0.1% |
| Belgian | 4 | 0.0% |
| Blackfeet | 1 | 0.0% |
| British | 39 | 0.2% |
| Cajun | 31 | 0.2% |
| Central American | 75 | 0.4% |
| Choctaw | 12 | 0.1% |
| Cuban | 64 | 0.3% |
| Dutch | 64 | 0.3% |
| Eastern European | 18 | 0.1% |
| English | 988 | 5.3% |
| European | 294 | 1.6% |
| French | 856 | 4.6% |
| French Canadian | 91 | 0.5% |
| German | 551 | 2.9% |
| Greek | 6 | 0.0% |
| Guatemalan | 11 | 0.1% |
| Haitian | 17 | 0.1% |
| Honduran | 19 | 0.1% |
| Irish | 2,025 | 10.8% |
| Italian | 489 | 2.6% |
| Korean | 6 | 0.0% |
| Lebanese | 9 | 0.1% |
| Mexican | 82 | 0.4% |
| Nicaraguan | 12 | 0.1% |
| Nigerian | 21 | 0.1% |
| Puerto Rican | 14 | 0.1% |
| Salvadoran | 33 | 0.2% |
| Samoan | 7 | 0.0% |
| Scandinavian | 15 | 0.1% |
| Scotch-Irish | 34 | 0.2% |
| Scottish | 49 | 0.3% |
| Sioux | 16 | 0.1% |
| Spaniard | 4 | 0.0% |
| Spanish | 80 | 0.4% |
| Sri Lankan | 1 | 0.0% |
| Subsaharan African | 118 | 0.6% |
| Swiss | 13 | 0.1% |
| Thai | 40 | 0.2% |
| Vietnamese | 2 | 0.0% |
| Welsh | 46 | 0.3% | View All 43 Rows |
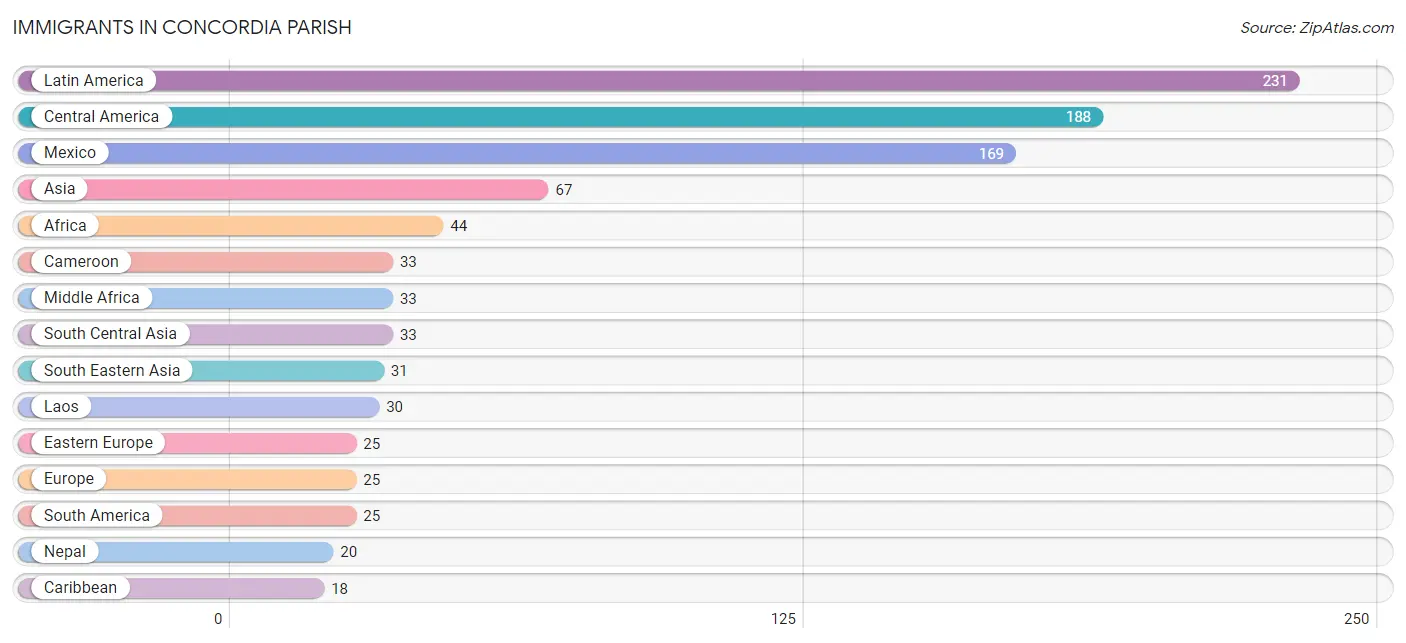
Immigrants in Concordia Parish
The most numerous immigrant groups reported in Concordia Parish came from Latin America (231 | 1.2%), Central America (188 | 1.0%), Mexico (169 | 0.9%), Asia (67 | 0.4%), and Africa (44 | 0.2%), together accounting for 3.7% of all Concordia Parish residents.
| Immigration Origin | # Population | % Population |
| Africa | 44 | 0.2% |
| Asia | 67 | 0.4% |
| Bangladesh | 2 | 0.0% |
| Brazil | 11 | 0.1% |
| Cameroon | 33 | 0.2% |
| Caribbean | 18 | 0.1% |
| Central America | 188 | 1.0% |
| Colombia | 13 | 0.1% |
| Cuba | 1 | 0.0% |
| Eastern Europe | 25 | 0.1% |
| El Salvador | 11 | 0.1% |
| Europe | 25 | 0.1% |
| Haiti | 17 | 0.1% |
| Honduras | 8 | 0.0% |
| India | 11 | 0.1% |
| Laos | 30 | 0.2% |
| Latin America | 231 | 1.2% |
| Lebanon | 2 | 0.0% |
| Mexico | 169 | 0.9% |
| Middle Africa | 33 | 0.2% |
| Nepal | 20 | 0.1% |
| North Macedonia | 14 | 0.1% |
| Peru | 1 | 0.0% |
| Russia | 11 | 0.1% |
| South America | 25 | 0.1% |
| South Central Asia | 33 | 0.2% |
| South Eastern Asia | 31 | 0.2% |
| Turkey | 1 | 0.0% |
| Vietnam | 1 | 0.0% |
| Western Asia | 3 | 0.0% | View All 30 Rows |
Sex and Age in Concordia Parish
Sex and Age in Concordia Parish
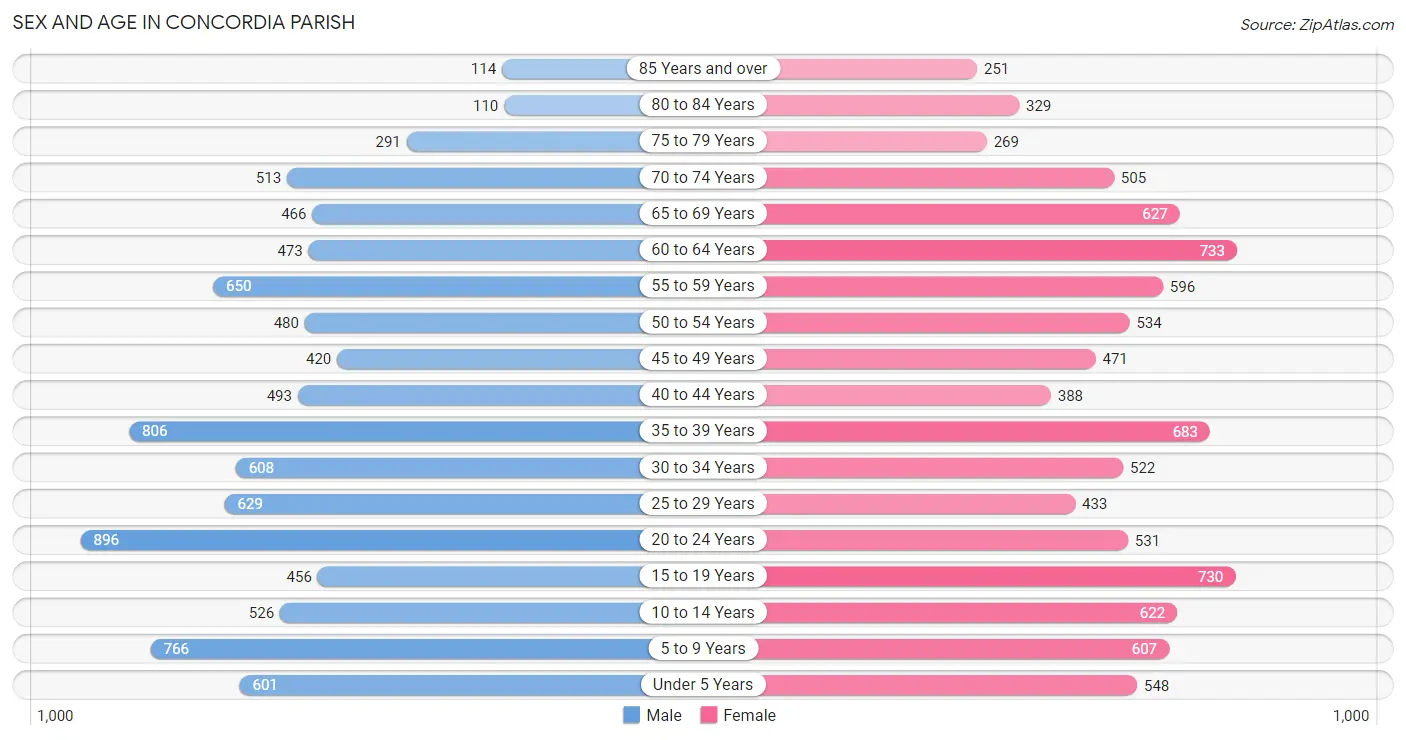
The most populous age groups in Concordia Parish are 20 to 24 Years (896 | 9.6%) for men and 60 to 64 Years (733 | 7.8%) for women.
| Age Bracket | Male | Female |
| Under 5 Years | 601 (6.5%) | 548 (5.8%) |
| 5 to 9 Years | 766 (8.2%) | 607 (6.5%) |
| 10 to 14 Years | 526 (5.7%) | 622 (6.6%) |
| 15 to 19 Years | 456 (4.9%) | 730 (7.8%) |
| 20 to 24 Years | 896 (9.6%) | 531 (5.7%) |
| 25 to 29 Years | 629 (6.8%) | 433 (4.6%) |
| 30 to 34 Years | 608 (6.5%) | 522 (5.6%) |
| 35 to 39 Years | 806 (8.7%) | 683 (7.3%) |
| 40 to 44 Years | 493 (5.3%) | 388 (4.1%) |
| 45 to 49 Years | 420 (4.5%) | 471 (5.0%) |
| 50 to 54 Years | 480 (5.2%) | 534 (5.7%) |
| 55 to 59 Years | 650 (7.0%) | 596 (6.4%) |
| 60 to 64 Years | 473 (5.1%) | 733 (7.8%) |
| 65 to 69 Years | 466 (5.0%) | 627 (6.7%) |
| 70 to 74 Years | 513 (5.5%) | 505 (5.4%) |
| 75 to 79 Years | 291 (3.1%) | 269 (2.9%) |
| 80 to 84 Years | 110 (1.2%) | 329 (3.5%) |
| 85 Years and over | 114 (1.2%) | 251 (2.7%) |
| Total | 9,298 (100.0%) | 9,379 (100.0%) |
Families and Households in Concordia Parish
Median Family Size in Concordia Parish
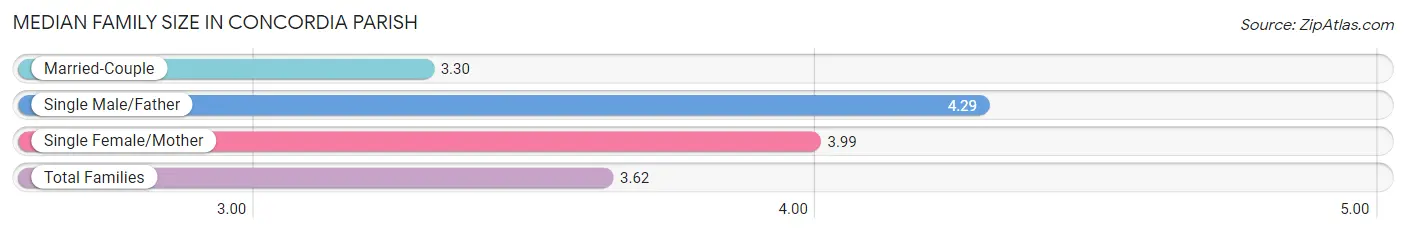
The median family size in Concordia Parish is 3.62 persons per family, with single male/father families (321 | 8.1%) accounting for the largest median family size of 4.29 persons per family. On the other hand, married-couple families (2,293 | 58.1%) represent the smallest median family size with 3.30 persons per family.
| Family Type | # Families | Family Size |
| Married-Couple | 2,293 (58.1%) | 3.30 |
| Single Male/Father | 321 (8.1%) | 4.29 |
| Single Female/Mother | 1,336 (33.8%) | 3.99 |
| Total Families | 3,950 (100.0%) | 3.62 |
Median Household Size in Concordia Parish
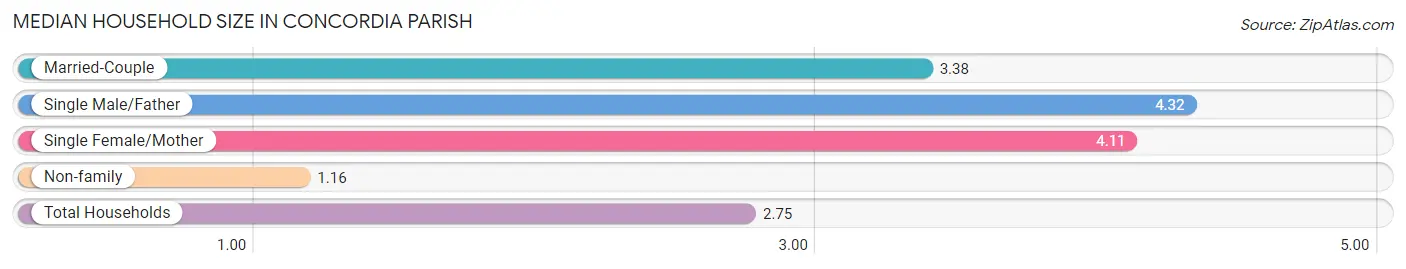
The median household size in Concordia Parish is 2.75 persons per household, with single male/father households (321 | 5.1%) accounting for the largest median household size of 4.32 persons per household. non-family households (2,352 | 37.3%) represent the smallest median household size with 1.16 persons per household.
| Household Type | # Households | Household Size |
| Married-Couple | 2,293 (36.4%) | 3.38 |
| Single Male/Father | 321 (5.1%) | 4.32 |
| Single Female/Mother | 1,336 (21.2%) | 4.11 |
| Non-family | 2,352 (37.3%) | 1.16 |
| Total Households | 6,302 (100.0%) | 2.75 |
Household Size by Marriage Status in Concordia Parish
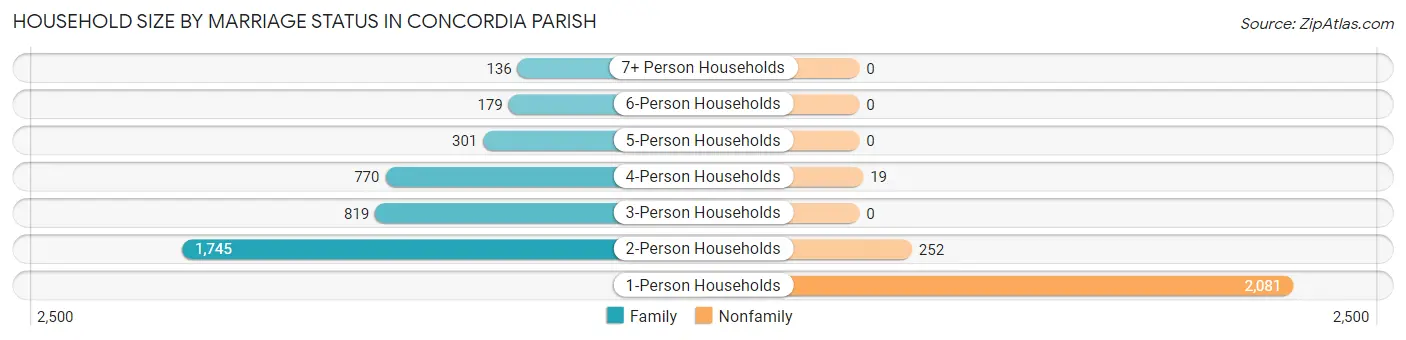
Out of a total of 6,302 households in Concordia Parish, 3,950 (62.7%) are family households, while 2,352 (37.3%) are nonfamily households. The most numerous type of family households are 2-person households, comprising 1,745, and the most common type of nonfamily households are 1-person households, comprising 2,081.
| Household Size | Family Households | Nonfamily Households |
| 1-Person Households | - | 2,081 (33.0%) |
| 2-Person Households | 1,745 (27.7%) | 252 (4.0%) |
| 3-Person Households | 819 (13.0%) | 0 (0.0%) |
| 4-Person Households | 770 (12.2%) | 19 (0.3%) |
| 5-Person Households | 301 (4.8%) | 0 (0.0%) |
| 6-Person Households | 179 (2.8%) | 0 (0.0%) |
| 7+ Person Households | 136 (2.2%) | 0 (0.0%) |
| Total | 3,950 (62.7%) | 2,352 (37.3%) |
Female Fertility in Concordia Parish
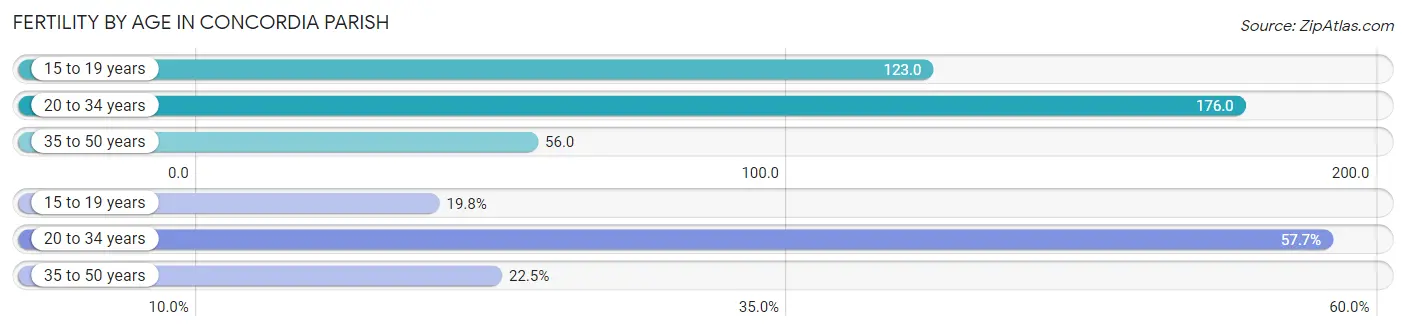
Fertility by Age in Concordia Parish
Average fertility rate in Concordia Parish is 113.0 births per 1,000 women. Women in the age bracket of 20 to 34 years have the highest fertility rate with 176.0 births per 1,000 women. Women in the age bracket of 20 to 34 years acount for 57.7% of all women with births.
| Age Bracket | Women with Births | Births / 1,000 Women |
| 15 to 19 years | 90 (19.8%) | 123.0 |
| 20 to 34 years | 262 (57.7%) | 176.0 |
| 35 to 50 years | 102 (22.5%) | 56.0 |
| Total | 454 (100.0%) | 113.0 |
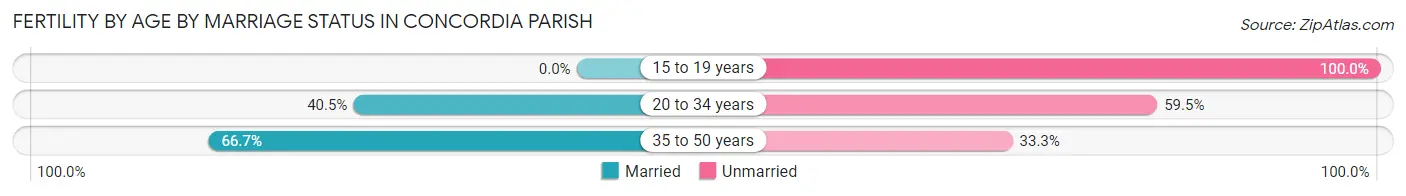
Fertility by Age by Marriage Status in Concordia Parish
38.3% of women with births (454) in Concordia Parish are married. The highest percentage of unmarried women with births falls into 15 to 19 years age bracket with 100.0% of them unmarried at the time of birth, while the lowest percentage of unmarried women with births belong to 35 to 50 years age bracket with 33.3% of them unmarried.
| Age Bracket | Married | Unmarried |
| 15 to 19 years | 0 (0.0%) | 90 (100.0%) |
| 20 to 34 years | 106 (40.5%) | 156 (59.5%) |
| 35 to 50 years | 68 (66.7%) | 34 (33.3%) |
| Total | 174 (38.3%) | 280 (61.7%) |
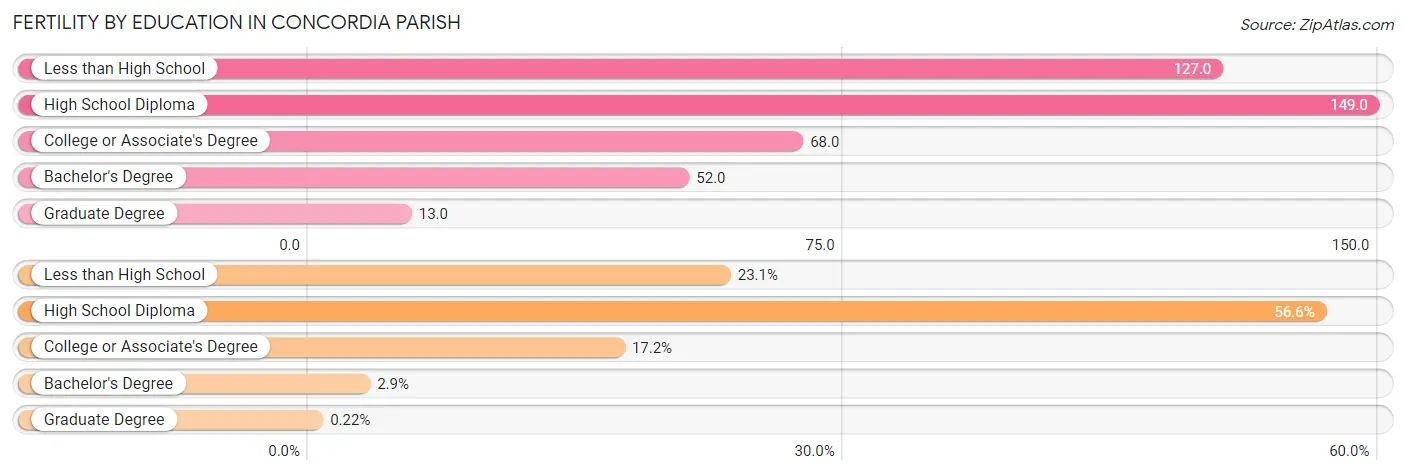
Fertility by Education in Concordia Parish
Average fertility rate in Concordia Parish is 113.0 births per 1,000 women. Women with the education attainment of high school diploma have the highest fertility rate of 149.0 births per 1,000 women, while women with the education attainment of graduate degree have the lowest fertility at 13.0 births per 1,000 women. Women with the education attainment of high school diploma represent 56.6% of all women with births.
| Educational Attainment | Women with Births | Births / 1,000 Women |
| Less than High School | 105 (23.1%) | 127.0 |
| High School Diploma | 257 (56.6%) | 149.0 |
| College or Associate's Degree | 78 (17.2%) | 68.0 |
| Bachelor's Degree | 13 (2.9%) | 52.0 |
| Graduate Degree | 1 (0.2%) | 13.0 |
| Total | 454 (100.0%) | 113.0 |
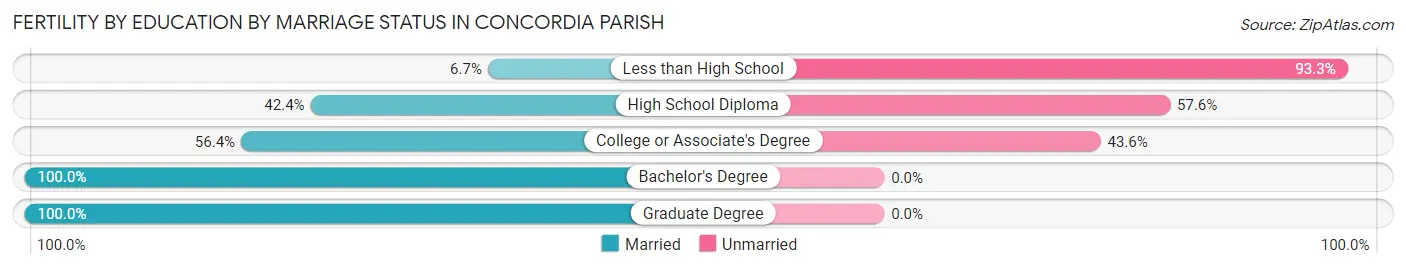
Fertility by Education by Marriage Status in Concordia Parish
61.7% of women with births in Concordia Parish are unmarried. Women with the educational attainment of bachelor's degree are most likely to be married with 100.0% of them married at childbirth, while women with the educational attainment of less than high school are least likely to be married with 93.3% of them unmarried at childbirth.
| Educational Attainment | Married | Unmarried |
| Less than High School | 7 (6.7%) | 98 (93.3%) |
| High School Diploma | 109 (42.4%) | 148 (57.6%) |
| College or Associate's Degree | 44 (56.4%) | 34 (43.6%) |
| Bachelor's Degree | 13 (100.0%) | 0 (0.0%) |
| Graduate Degree | 1 (100.0%) | 0 (0.0%) |
| Total | 174 (38.3%) | 280 (61.7%) |
Income in Concordia Parish
Income Overview in Concordia Parish
Per Capita Income in Concordia Parish is $21,941, while median incomes of families and households are $53,260 and $38,929 respectively.
| Characteristic | Number | Measure |
| Per Capita Income | 18,677 | $21,941 |
| Median Family Income | 3,950 | $53,260 |
| Mean Family Income | 3,950 | $72,101 |
| Median Household Income | 6,302 | $38,929 |
| Mean Household Income | 6,302 | $57,685 |
| Income Deficit | 3,950 | $11,895 |
| Wage / Income Gap (%) | 18,677 | 38.99% |
| Wage / Income Gap ($) | 18,677 | 61.01¢ per $1 |
| Gini / Inequality Index | 18,677 | 0.49 |
Earnings by Sex in Concordia Parish
Average Earnings in Concordia Parish are $31,160, $38,382 for men and $23,415 for women, a difference of 39.0%.
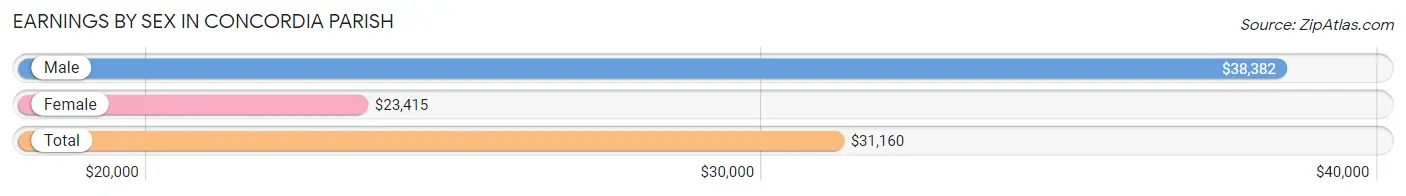
| Sex | Number | Average Earnings |
| Male | 3,220 (49.9%) | $38,382 |
| Female | 3,230 (50.1%) | $23,415 |
| Total | 6,450 (100.0%) | $31,160 |
Earnings by Sex by Income Bracket in Concordia Parish
The most common earnings brackets in Concordia Parish are $30,000 to $34,999 for men (472 | 14.7%) and $25,000 to $29,999 for women (369 | 11.4%).
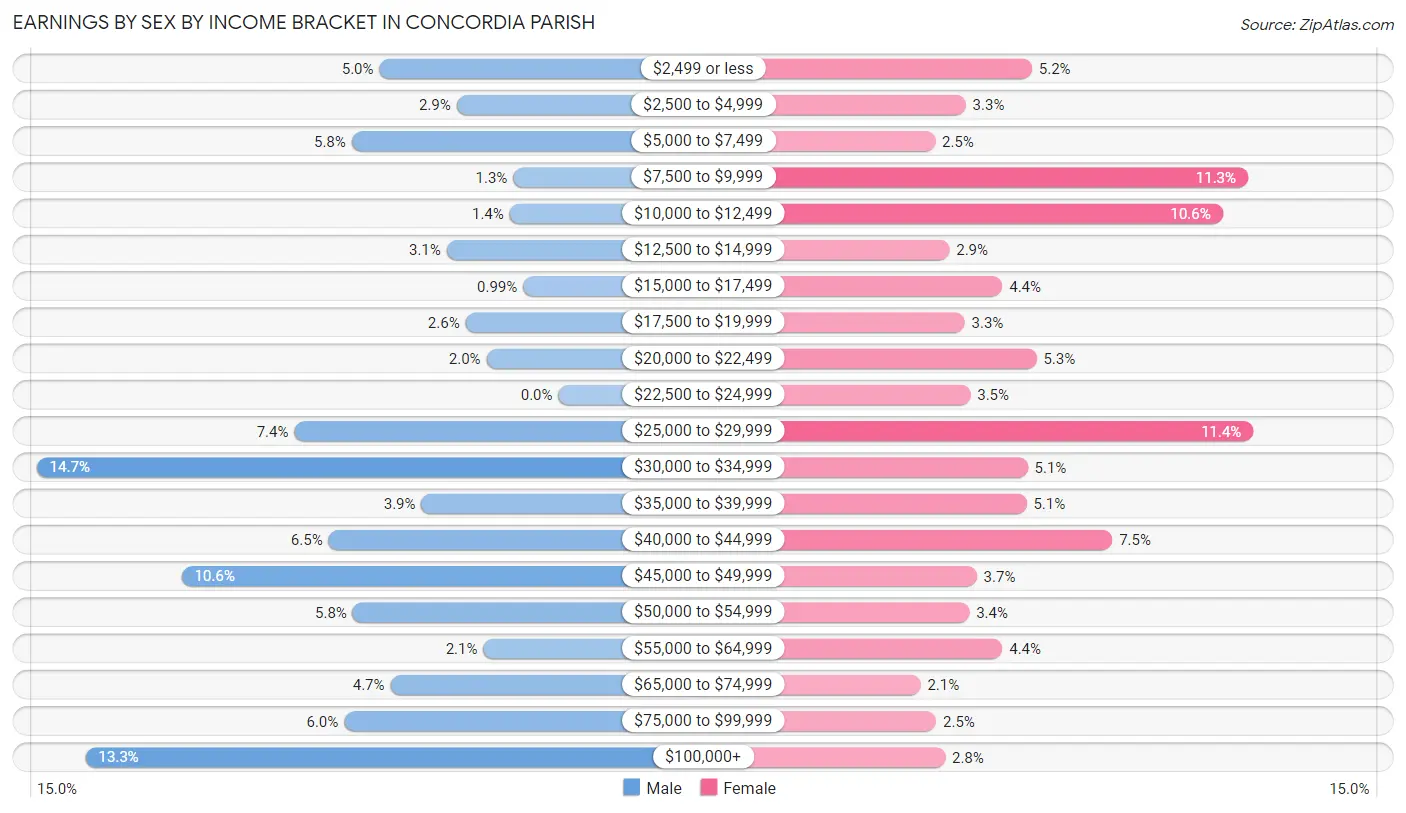
| Income | Male | Female |
| $2,499 or less | 162 (5.0%) | 168 (5.2%) |
| $2,500 to $4,999 | 92 (2.9%) | 108 (3.3%) |
| $5,000 to $7,499 | 187 (5.8%) | 80 (2.5%) |
| $7,500 to $9,999 | 41 (1.3%) | 364 (11.3%) |
| $10,000 to $12,499 | 44 (1.4%) | 341 (10.6%) |
| $12,500 to $14,999 | 101 (3.1%) | 93 (2.9%) |
| $15,000 to $17,499 | 32 (1.0%) | 141 (4.4%) |
| $17,500 to $19,999 | 84 (2.6%) | 107 (3.3%) |
| $20,000 to $22,499 | 65 (2.0%) | 172 (5.3%) |
| $22,500 to $24,999 | 0 (0.0%) | 112 (3.5%) |
| $25,000 to $29,999 | 239 (7.4%) | 369 (11.4%) |
| $30,000 to $34,999 | 472 (14.7%) | 164 (5.1%) |
| $35,000 to $39,999 | 124 (3.8%) | 163 (5.1%) |
| $40,000 to $44,999 | 208 (6.5%) | 241 (7.5%) |
| $45,000 to $49,999 | 341 (10.6%) | 118 (3.6%) |
| $50,000 to $54,999 | 186 (5.8%) | 111 (3.4%) |
| $55,000 to $64,999 | 68 (2.1%) | 141 (4.4%) |
| $65,000 to $74,999 | 152 (4.7%) | 67 (2.1%) |
| $75,000 to $99,999 | 194 (6.0%) | 81 (2.5%) |
| $100,000+ | 428 (13.3%) | 89 (2.8%) |
| Total | 3,220 (100.0%) | 3,230 (100.0%) |
Earnings by Sex by Educational Attainment in Concordia Parish
Average earnings in Concordia Parish are $38,431 for men and $25,938 for women, a difference of 32.5%. Men with an educational attainment of graduate degree enjoy the highest average annual earnings of $51,020, while those with high school diploma education earn the least with $34,156. Women with an educational attainment of graduate degree earn the most with the average annual earnings of $46,667, while those with high school diploma education have the smallest earnings of $16,971.
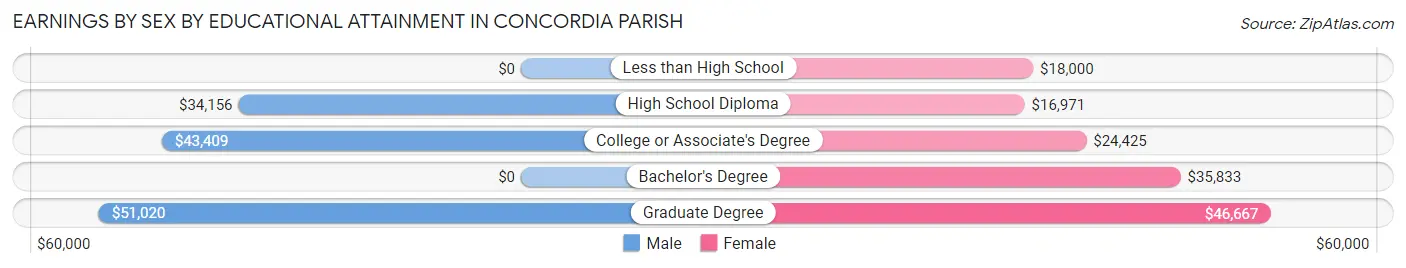
| Educational Attainment | Male Income | Female Income |
| Less than High School | - | - |
| High School Diploma | $34,156 | $16,971 |
| College or Associate's Degree | $43,409 | $24,425 |
| Bachelor's Degree | - | - |
| Graduate Degree | $51,020 | $46,667 |
| Total | $38,431 | $25,938 |
Family Income in Concordia Parish
Family Income Brackets in Concordia Parish
According to the Concordia Parish family income data, there are 683 families falling into the $50,000 to $74,999 income range, which is the most common income bracket and makes up 17.3% of all families. Conversely, the $150,000 to $199,999 income bracket is the least frequent group with only 198 families (5.0%) belonging to this category.
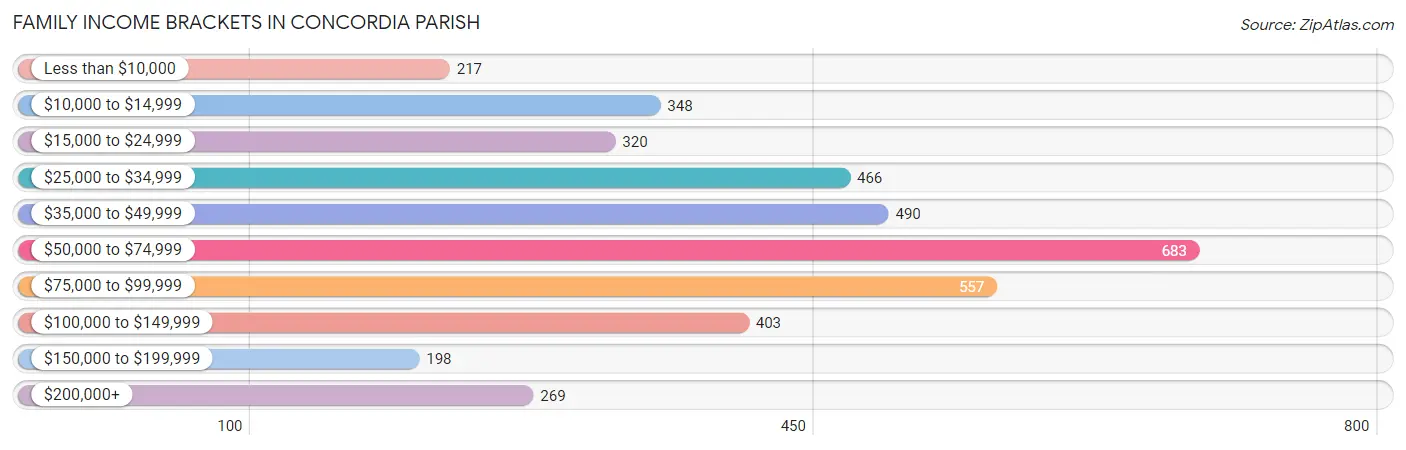
| Income Bracket | # Families | % Families |
| Less than $10,000 | 217 | 5.5% |
| $10,000 to $14,999 | 348 | 8.8% |
| $15,000 to $24,999 | 320 | 8.1% |
| $25,000 to $34,999 | 466 | 11.8% |
| $35,000 to $49,999 | 490 | 12.4% |
| $50,000 to $74,999 | 683 | 17.3% |
| $75,000 to $99,999 | 557 | 14.1% |
| $100,000 to $149,999 | 403 | 10.2% |
| $150,000 to $199,999 | 198 | 5.0% |
| $200,000+ | 269 | 6.8% |
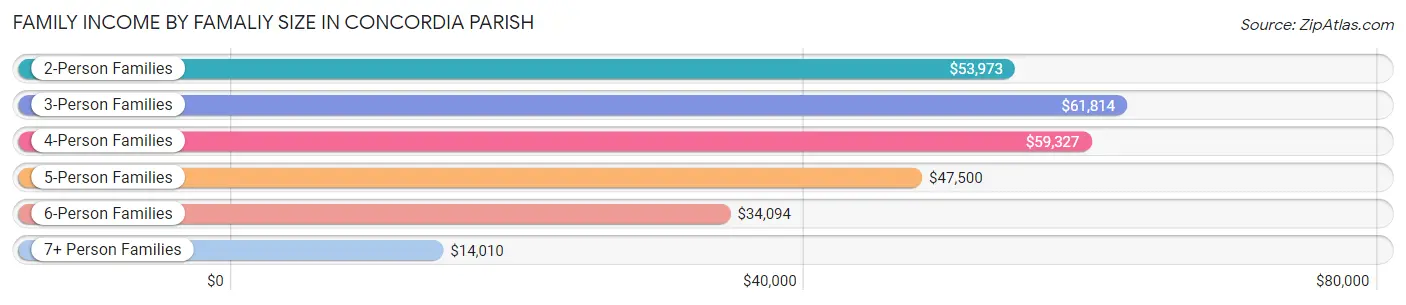
Family Income by Famaliy Size in Concordia Parish
3-person families (964 | 24.4%) account for the highest median family income in Concordia Parish with $61,814 per family, while 2-person families (1,844 | 46.7%) have the highest median income of $26,986 per family member.
| Income Bracket | # Families | Median Income |
| 2-Person Families | 1,844 (46.7%) | $53,973 |
| 3-Person Families | 964 (24.4%) | $61,814 |
| 4-Person Families | 531 (13.4%) | $59,327 |
| 5-Person Families | 296 (7.5%) | $47,500 |
| 6-Person Families | 179 (4.5%) | $34,094 |
| 7+ Person Families | 136 (3.4%) | $14,010 |
| Total | 3,950 (100.0%) | $53,260 |
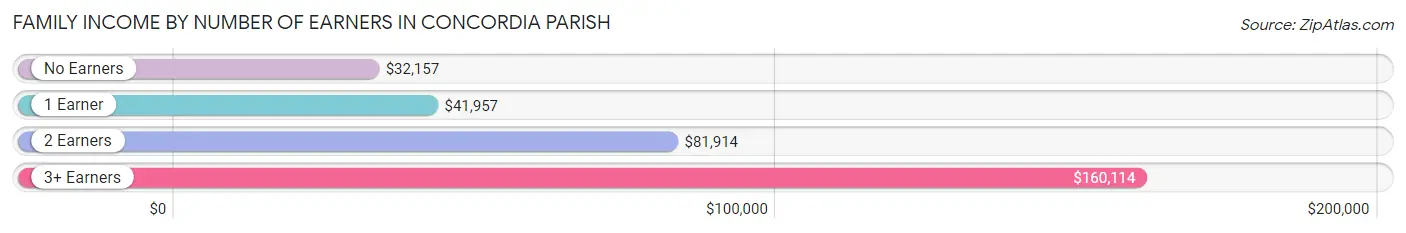
Family Income by Number of Earners in Concordia Parish
The median family income in Concordia Parish is $53,260, with families comprising 3+ earners (108) having the highest median family income of $160,114, while families with no earners (915) have the lowest median family income of $32,157, accounting for 2.7% and 23.2% of families, respectively.
| Number of Earners | # Families | Median Income |
| No Earners | 915 (23.2%) | $32,157 |
| 1 Earner | 1,668 (42.2%) | $41,957 |
| 2 Earners | 1,259 (31.9%) | $81,914 |
| 3+ Earners | 108 (2.7%) | $160,114 |
| Total | 3,950 (100.0%) | $53,260 |
Household Income in Concordia Parish
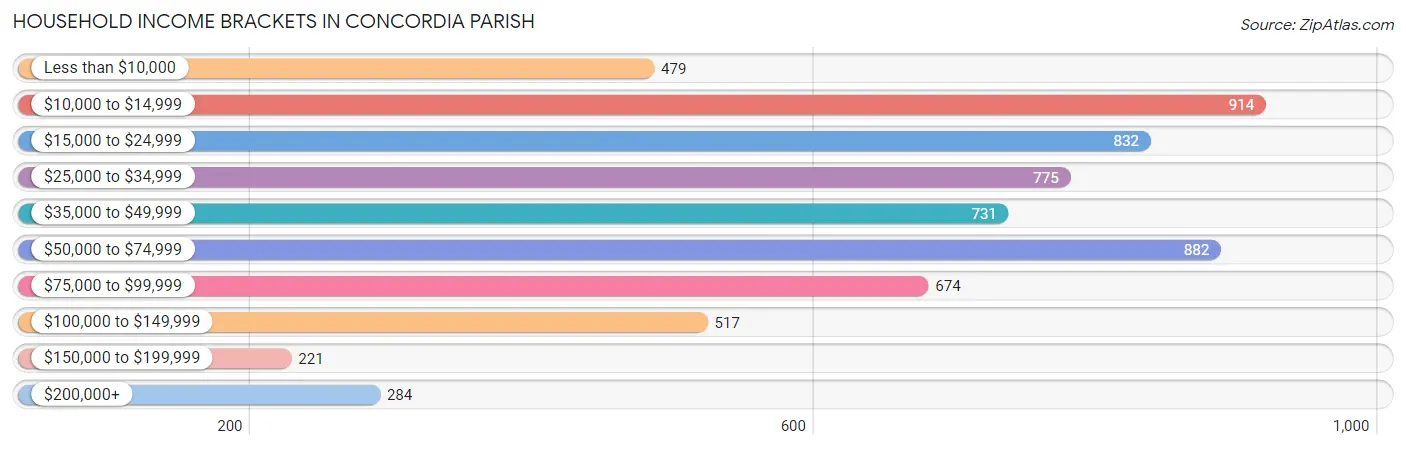
Household Income Brackets in Concordia Parish
With 914 households falling in the category, the $10,000 to $14,999 income range is the most frequent in Concordia Parish, accounting for 14.5% of all households. In contrast, only 221 households (3.5%) fall into the $150,000 to $199,999 income bracket, making it the least populous group.
| Income Bracket | # Households | % Households |
| Less than $10,000 | 479 | 7.6% |
| $10,000 to $14,999 | 914 | 14.5% |
| $15,000 to $24,999 | 832 | 13.2% |
| $25,000 to $34,999 | 775 | 12.3% |
| $35,000 to $49,999 | 731 | 11.6% |
| $50,000 to $74,999 | 882 | 14.0% |
| $75,000 to $99,999 | 674 | 10.7% |
| $100,000 to $149,999 | 517 | 8.2% |
| $150,000 to $199,999 | 221 | 3.5% |
| $200,000+ | 284 | 4.5% |
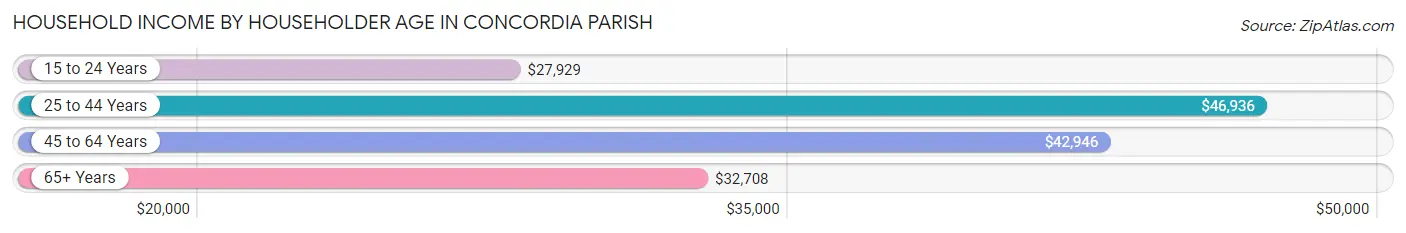
Household Income by Householder Age in Concordia Parish
The median household income in Concordia Parish is $38,929, with the highest median household income of $46,936 found in the 25 to 44 years age bracket for the primary householder. A total of 1,547 households (24.5%) fall into this category. Meanwhile, the 15 to 24 years age bracket for the primary householder has the lowest median household income of $27,929, with 164 households (2.6%) in this group.
| Income Bracket | # Households | Median Income |
| 15 to 24 Years | 164 (2.6%) | $27,929 |
| 25 to 44 Years | 1,547 (24.5%) | $46,936 |
| 45 to 64 Years | 2,133 (33.9%) | $42,946 |
| 65+ Years | 2,458 (39.0%) | $32,708 |
| Total | 6,302 (100.0%) | $38,929 |
Poverty in Concordia Parish
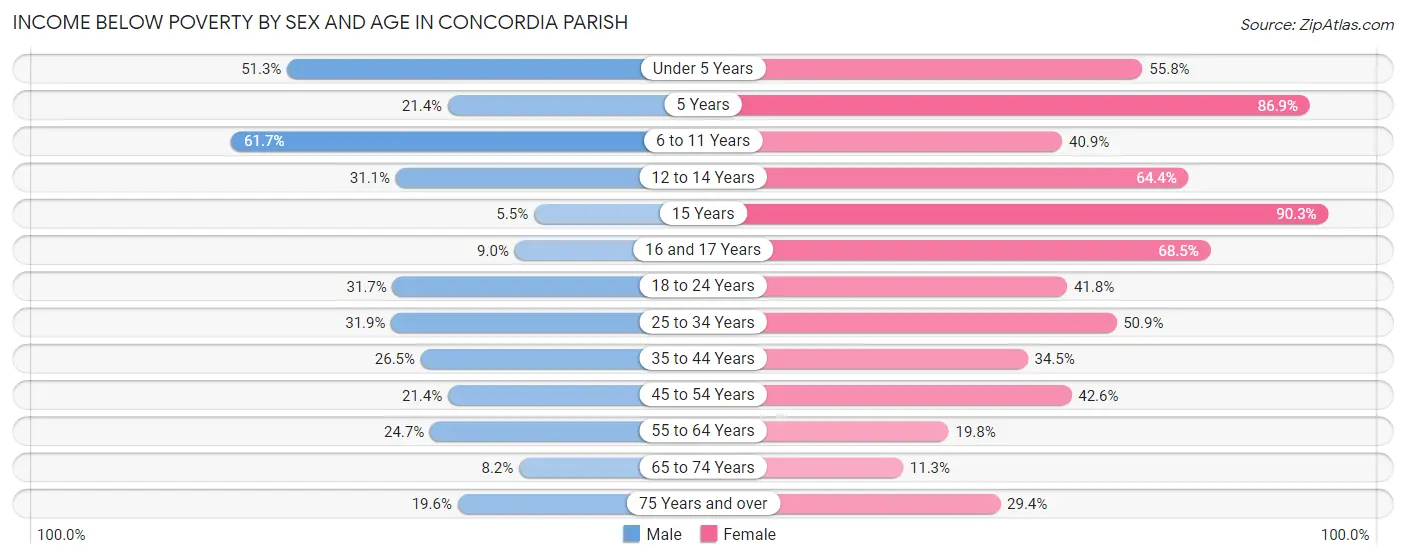
Income Below Poverty by Sex and Age in Concordia Parish
With 29.3% poverty level for males and 37.9% for females among the residents of Concordia Parish, 6 to 11 year old males and 15 year old females are the most vulnerable to poverty, with 542 males (61.7%) and 84 females (90.3%) in their respective age groups living below the poverty level.
| Age Bracket | Male | Female |
| Under 5 Years | 305 (51.3%) | 303 (55.8%) |
| 5 Years | 12 (21.4%) | 86 (86.9%) |
| 6 to 11 Years | 542 (61.7%) | 296 (40.9%) |
| 12 to 14 Years | 106 (31.1%) | 251 (64.4%) |
| 15 Years | 3 (5.4%) | 84 (90.3%) |
| 16 and 17 Years | 23 (9.0%) | 243 (68.4%) |
| 18 to 24 Years | 276 (31.7%) | 329 (41.8%) |
| 25 to 34 Years | 243 (31.9%) | 486 (50.9%) |
| 35 to 44 Years | 256 (26.5%) | 365 (34.5%) |
| 45 to 54 Years | 170 (21.4%) | 428 (42.6%) |
| 55 to 64 Years | 261 (24.7%) | 253 (19.8%) |
| 65 to 74 Years | 79 (8.2%) | 127 (11.3%) |
| 75 Years and over | 97 (19.6%) | 240 (29.4%) |
| Total | 2,373 (29.3%) | 3,491 (37.9%) |
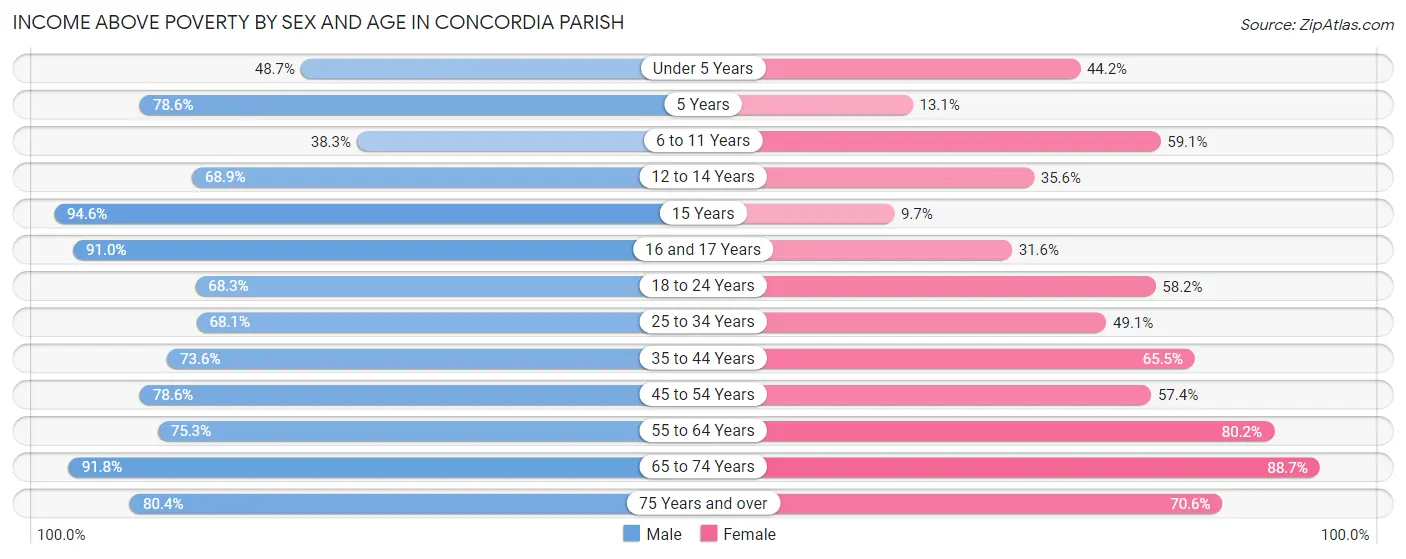
Income Above Poverty by Sex and Age in Concordia Parish
According to the poverty statistics in Concordia Parish, males aged 15 years and females aged 65 to 74 years are the age groups that are most secure financially, with 94.6% of males and 88.7% of females in these age groups living above the poverty line.
| Age Bracket | Male | Female |
| Under 5 Years | 290 (48.7%) | 240 (44.2%) |
| 5 Years | 44 (78.6%) | 13 (13.1%) |
| 6 to 11 Years | 337 (38.3%) | 428 (59.1%) |
| 12 to 14 Years | 235 (68.9%) | 139 (35.6%) |
| 15 Years | 52 (94.6%) | 9 (9.7%) |
| 16 and 17 Years | 232 (91.0%) | 112 (31.6%) |
| 18 to 24 Years | 595 (68.3%) | 458 (58.2%) |
| 25 to 34 Years | 518 (68.1%) | 468 (49.1%) |
| 35 to 44 Years | 712 (73.6%) | 694 (65.5%) |
| 45 to 54 Years | 624 (78.6%) | 577 (57.4%) |
| 55 to 64 Years | 794 (75.3%) | 1,024 (80.2%) |
| 65 to 74 Years | 883 (91.8%) | 994 (88.7%) |
| 75 Years and over | 398 (80.4%) | 577 (70.6%) |
| Total | 5,714 (70.7%) | 5,733 (62.2%) |
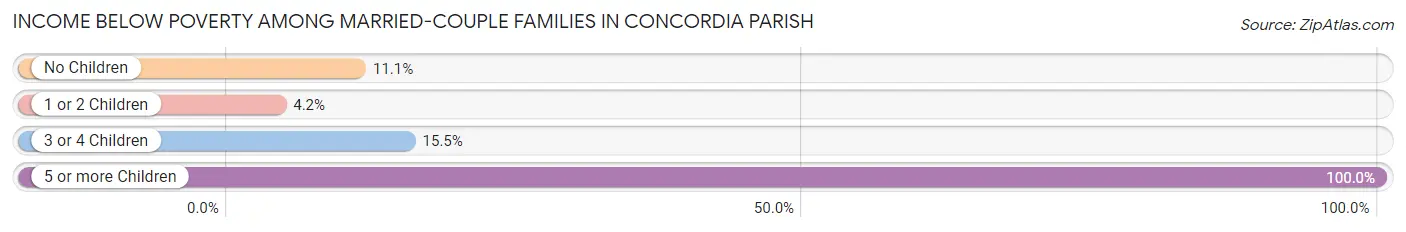
Income Below Poverty Among Married-Couple Families in Concordia Parish
The poverty statistics for married-couple families in Concordia Parish show that 9.5% or 218 of the total 2,293 families live below the poverty line. Families with 5 or more children have the highest poverty rate of 100.0%, comprising of 7 families. On the other hand, families with 1 or 2 children have the lowest poverty rate of 4.2%, which includes 29 families.
| Children | Above Poverty | Below Poverty |
| No Children | 1,332 (88.9%) | 167 (11.1%) |
| 1 or 2 Children | 661 (95.8%) | 29 (4.2%) |
| 3 or 4 Children | 82 (84.5%) | 15 (15.5%) |
| 5 or more Children | 0 (0.0%) | 7 (100.0%) |
| Total | 2,075 (90.5%) | 218 (9.5%) |
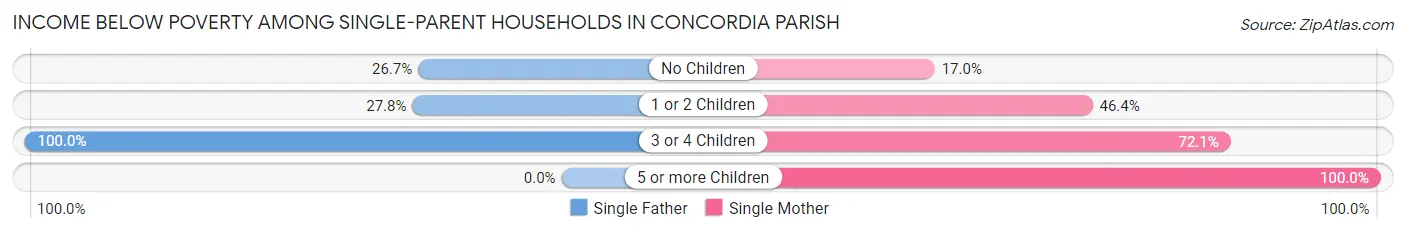
Income Below Poverty Among Single-Parent Households in Concordia Parish
According to the poverty data in Concordia Parish, 57.3% or 184 single-father households and 44.8% or 598 single-mother households are living below the poverty line. Among single-father households, those with 3 or 4 children have the highest poverty rate, with 133 households (100.0%) experiencing poverty. Likewise, among single-mother households, those with 5 or more children have the highest poverty rate, with 108 households (100.0%) falling below the poverty line.
| Children | Single Father | Single Mother |
| No Children | 31 (26.7%) | 76 (17.0%) |
| 1 or 2 Children | 20 (27.8%) | 267 (46.4%) |
| 3 or 4 Children | 133 (100.0%) | 147 (72.1%) |
| 5 or more Children | 0 (0.0%) | 108 (100.0%) |
| Total | 184 (57.3%) | 598 (44.8%) |
Income Below Poverty Among Married-Couple vs Single-Parent Households in Concordia Parish
The poverty data for Concordia Parish shows that 218 of the married-couple family households (9.5%) and 782 of the single-parent households (47.2%) are living below the poverty level. Within the married-couple family households, those with 5 or more children have the highest poverty rate, with 7 households (100.0%) falling below the poverty line. Among the single-parent households, those with 5 or more children have the highest poverty rate, with 108 household (100.0%) living below poverty.
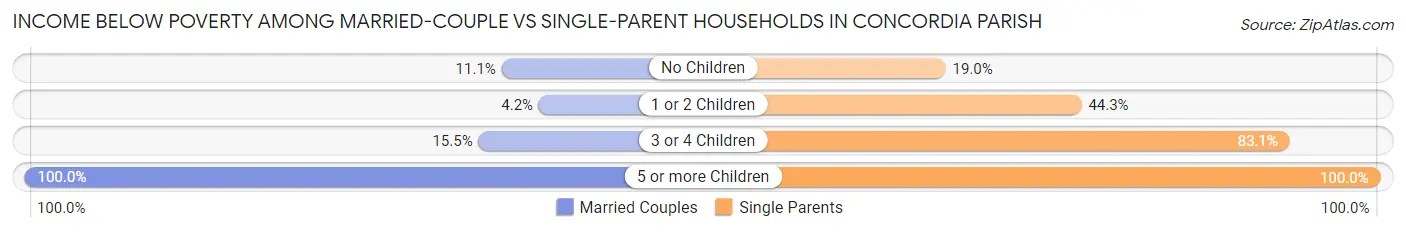
| Children | Married-Couple Families | Single-Parent Households |
| No Children | 167 (11.1%) | 107 (19.0%) |
| 1 or 2 Children | 29 (4.2%) | 287 (44.3%) |
| 3 or 4 Children | 15 (15.5%) | 280 (83.1%) |
| 5 or more Children | 7 (100.0%) | 108 (100.0%) |
| Total | 218 (9.5%) | 782 (47.2%) |
Employment Characteristics in Concordia Parish
Employment by Class of Employer in Concordia Parish
Among the 5,287 employed individuals in Concordia Parish, private company employees (3,556 | 67.3%), local government employees (766 | 14.5%), and self-employed (not incorporated) (473 | 8.9%) make up the most common classes of employment.
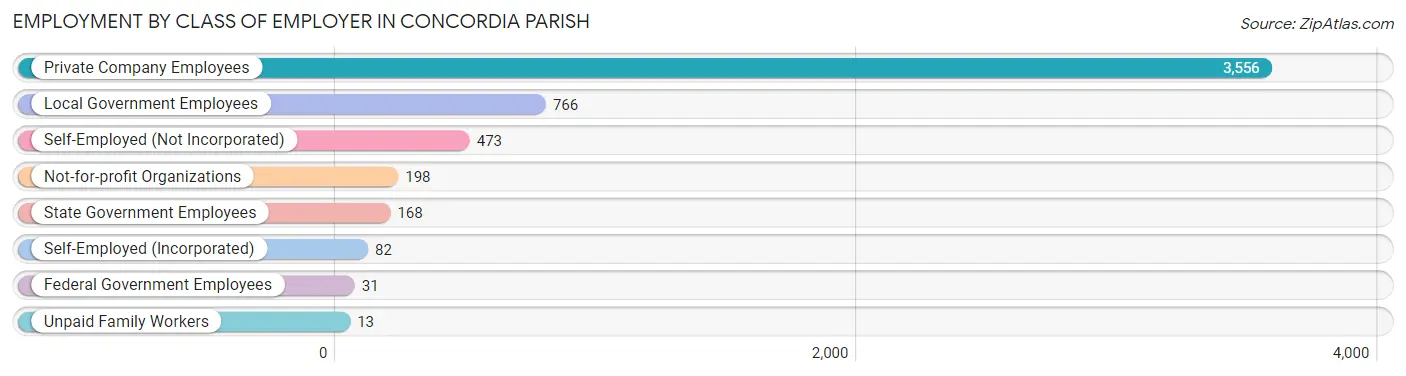
| Employer Class | # Employees | % Employees |
| Private Company Employees | 3,556 | 67.3% |
| Self-Employed (Incorporated) | 82 | 1.5% |
| Self-Employed (Not Incorporated) | 473 | 8.9% |
| Not-for-profit Organizations | 198 | 3.7% |
| Local Government Employees | 766 | 14.5% |
| State Government Employees | 168 | 3.2% |
| Federal Government Employees | 31 | 0.6% |
| Unpaid Family Workers | 13 | 0.3% |
| Total | 5,287 | 100.0% |
Employment Status by Age in Concordia Parish
According to the labor force statistics for Concordia Parish, out of the total population over 16 years of age (14,859), 41.7% or 6,196 individuals are in the labor force, with 12.0% or 744 of them unemployed. The age group with the highest labor force participation rate is 55 to 59 years, with 60.2% or 750 individuals in the labor force. Within the labor force, the 16 to 19 years age range has the highest percentage of unemployed individuals, with 78.4% or 105 of them being unemployed.
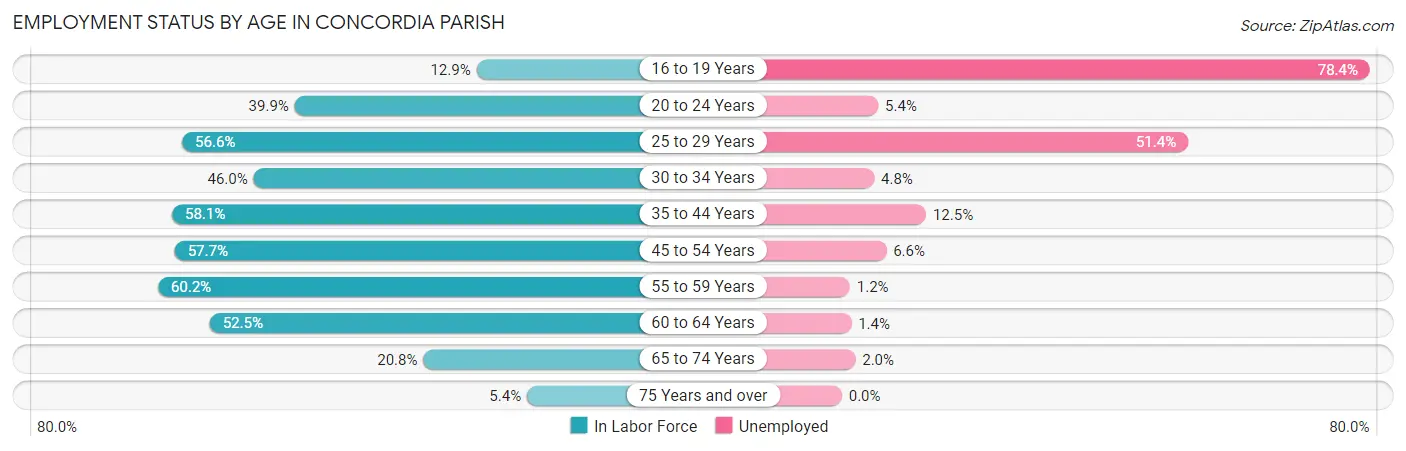
| Age Bracket | In Labor Force | Unemployed |
| 16 to 19 Years | 134 (12.9%) | 105 (78.4%) |
| 20 to 24 Years | 569 (39.9%) | 31 (5.4%) |
| 25 to 29 Years | 601 (56.6%) | 309 (51.4%) |
| 30 to 34 Years | 520 (46.0%) | 25 (4.8%) |
| 35 to 44 Years | 1,377 (58.1%) | 172 (12.5%) |
| 45 to 54 Years | 1,099 (57.7%) | 73 (6.6%) |
| 55 to 59 Years | 750 (60.2%) | 9 (1.2%) |
| 60 to 64 Years | 633 (52.5%) | 9 (1.4%) |
| 65 to 74 Years | 439 (20.8%) | 9 (2.0%) |
| 75 Years and over | 74 (5.4%) | 0 (0.0%) |
| Total | 6,196 (41.7%) | 744 (12.0%) |
Employment Status by Educational Attainment in Concordia Parish
According to labor force statistics for Concordia Parish, 55.8% of individuals (4,977) out of the total population between 25 and 64 years of age (8,919) are in the labor force, with 12.0% or 597 of them being unemployed. The group with the highest labor force participation rate are those with the educational attainment of bachelor's degree or higher, with 80.3% or 888 individuals in the labor force. Within the labor force, individuals with less than high school education have the highest percentage of unemployment, with 41.0% or 158 of them being unemployed.
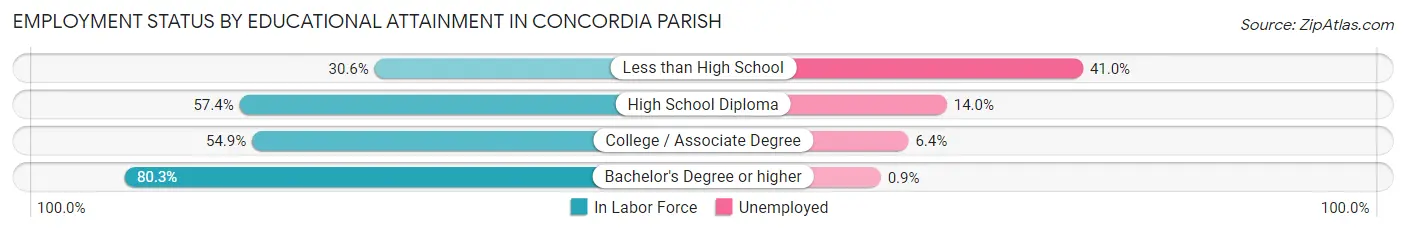
| Educational Attainment | In Labor Force | Unemployed |
| Less than High School | 386 (30.6%) | 517 (41.0%) |
| High School Diploma | 2,529 (57.4%) | 617 (14.0%) |
| College / Associate Degree | 1,179 (54.9%) | 137 (6.4%) |
| Bachelor's Degree or higher | 888 (80.3%) | 10 (0.9%) |
| Total | 4,977 (55.8%) | 1,070 (12.0%) |
Employment Occupations by Sex in Concordia Parish
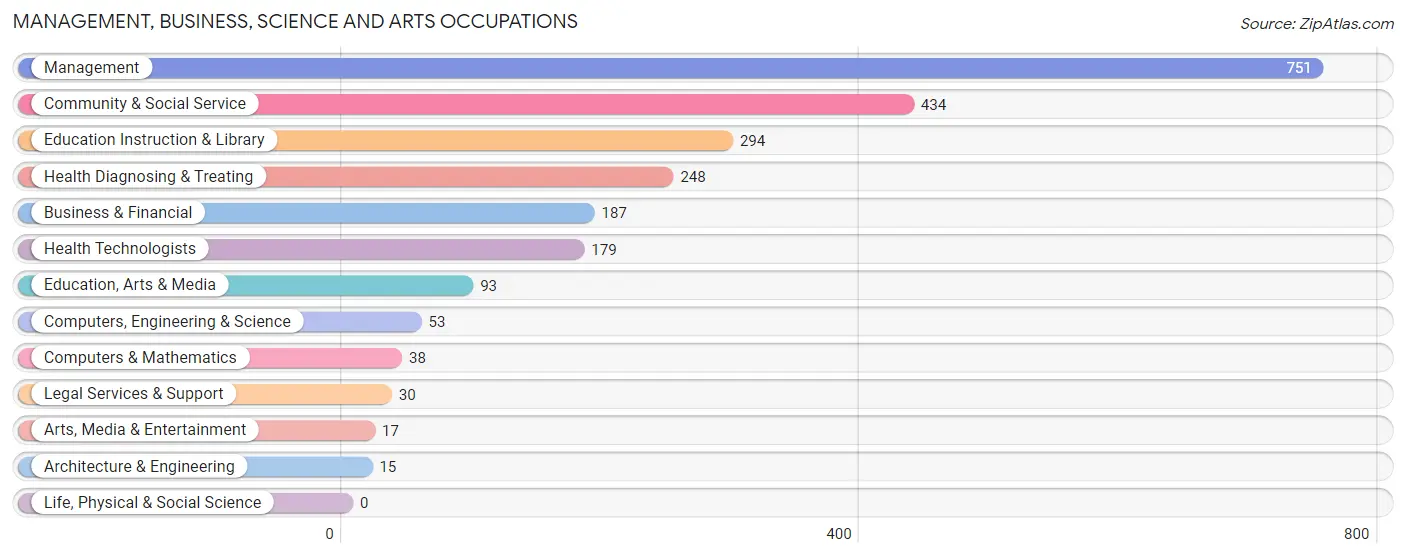
Management, Business, Science and Arts Occupations
The most common Management, Business, Science and Arts occupations in Concordia Parish are Management (751 | 13.8%), Community & Social Service (434 | 8.0%), Education Instruction & Library (294 | 5.4%), Health Diagnosing & Treating (248 | 4.5%), and Business & Financial (187 | 3.4%).
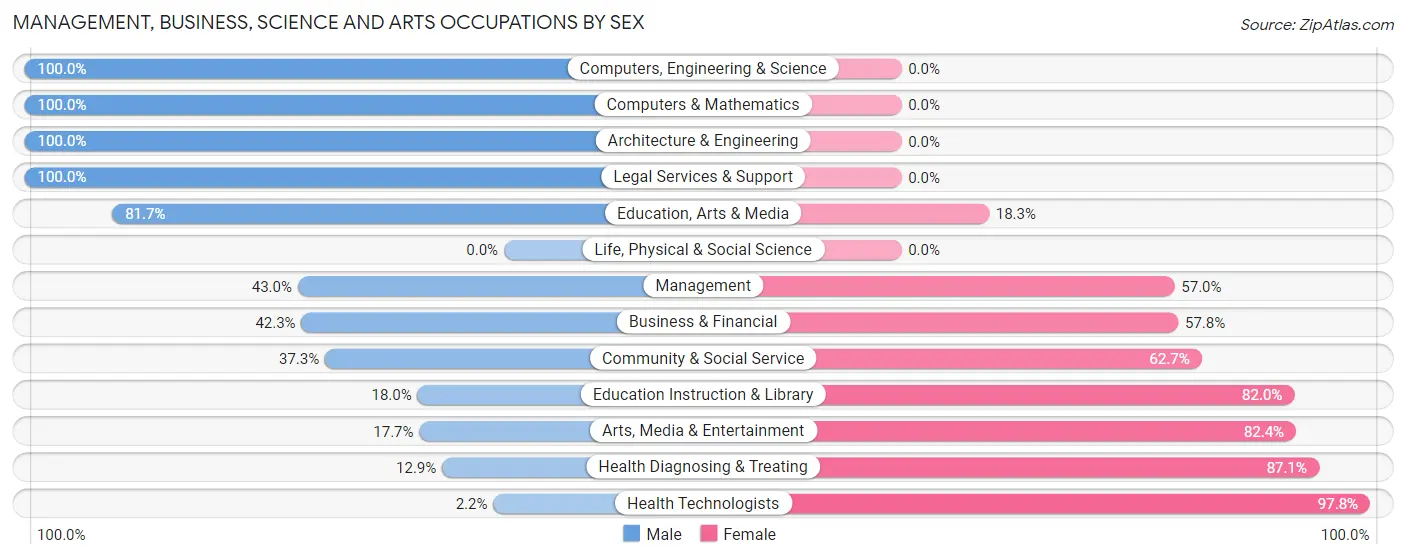
Management, Business, Science and Arts Occupations by Sex
Within the Management, Business, Science and Arts occupations in Concordia Parish, the most male-oriented occupations are Computers, Engineering & Science (100.0%), Computers & Mathematics (100.0%), and Architecture & Engineering (100.0%), while the most female-oriented occupations are Health Technologists (97.8%), Health Diagnosing & Treating (87.1%), and Arts, Media & Entertainment (82.4%).
| Occupation | Male | Female |
| Management | 323 (43.0%) | 428 (57.0%) |
| Business & Financial | 79 (42.2%) | 108 (57.8%) |
| Computers, Engineering & Science | 53 (100.0%) | 0 (0.0%) |
| Computers & Mathematics | 38 (100.0%) | 0 (0.0%) |
| Architecture & Engineering | 15 (100.0%) | 0 (0.0%) |
| Life, Physical & Social Science | 0 (0.0%) | 0 (0.0%) |
| Community & Social Service | 162 (37.3%) | 272 (62.7%) |
| Education, Arts & Media | 76 (81.7%) | 17 (18.3%) |
| Legal Services & Support | 30 (100.0%) | 0 (0.0%) |
| Education Instruction & Library | 53 (18.0%) | 241 (82.0%) |
| Arts, Media & Entertainment | 3 (17.6%) | 14 (82.4%) |
| Health Diagnosing & Treating | 32 (12.9%) | 216 (87.1%) |
| Health Technologists | 4 (2.2%) | 175 (97.8%) |
| Total (Category) | 649 (38.8%) | 1,024 (61.2%) |
| Total (Overall) | 2,654 (48.6%) | 2,801 (51.3%) |
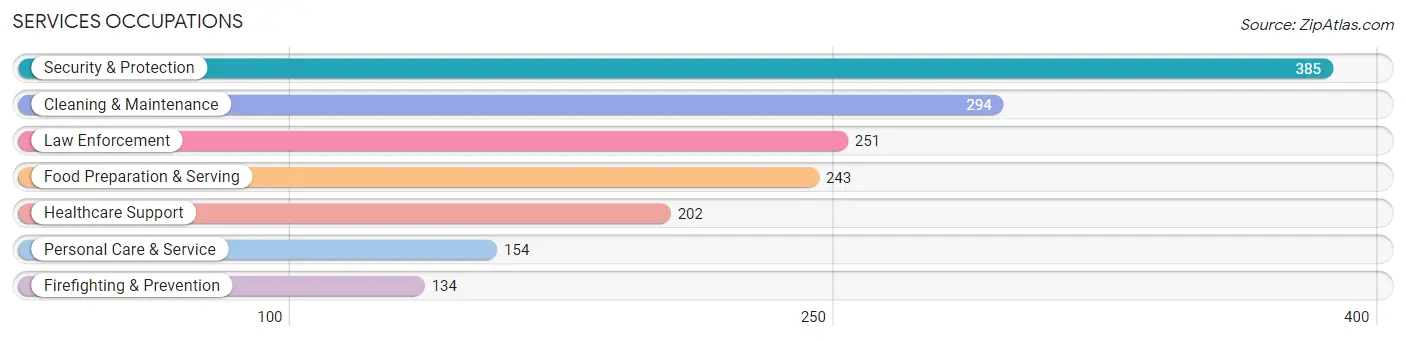
Services Occupations
The most common Services occupations in Concordia Parish are Security & Protection (385 | 7.1%), Cleaning & Maintenance (294 | 5.4%), Law Enforcement (251 | 4.6%), Food Preparation & Serving (243 | 4.4%), and Healthcare Support (202 | 3.7%).
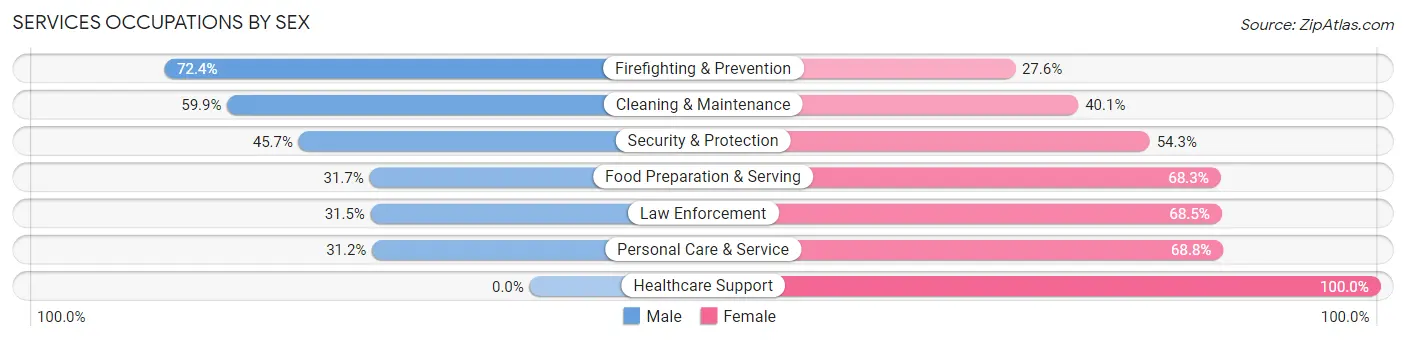
Services Occupations by Sex
Within the Services occupations in Concordia Parish, the most male-oriented occupations are Firefighting & Prevention (72.4%), Cleaning & Maintenance (59.9%), and Security & Protection (45.7%), while the most female-oriented occupations are Healthcare Support (100.0%), Personal Care & Service (68.8%), and Law Enforcement (68.5%).
| Occupation | Male | Female |
| Healthcare Support | 0 (0.0%) | 202 (100.0%) |
| Security & Protection | 176 (45.7%) | 209 (54.3%) |
| Firefighting & Prevention | 97 (72.4%) | 37 (27.6%) |
| Law Enforcement | 79 (31.5%) | 172 (68.5%) |
| Food Preparation & Serving | 77 (31.7%) | 166 (68.3%) |
| Cleaning & Maintenance | 176 (59.9%) | 118 (40.1%) |
| Personal Care & Service | 48 (31.2%) | 106 (68.8%) |
| Total (Category) | 477 (37.3%) | 801 (62.7%) |
| Total (Overall) | 2,654 (48.6%) | 2,801 (51.3%) |
Sales and Office Occupations
The most common Sales and Office occupations in Concordia Parish are Sales & Related (594 | 10.9%), and Office & Administration (504 | 9.2%).
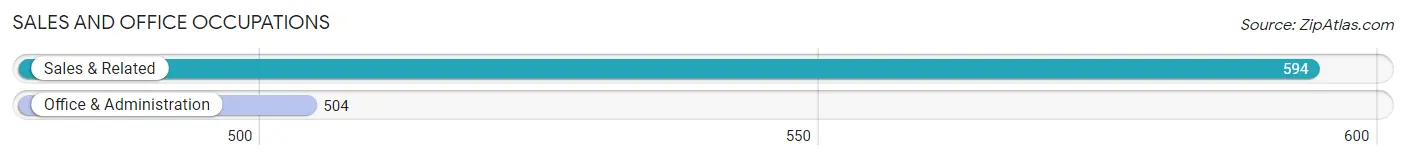
Sales and Office Occupations by Sex
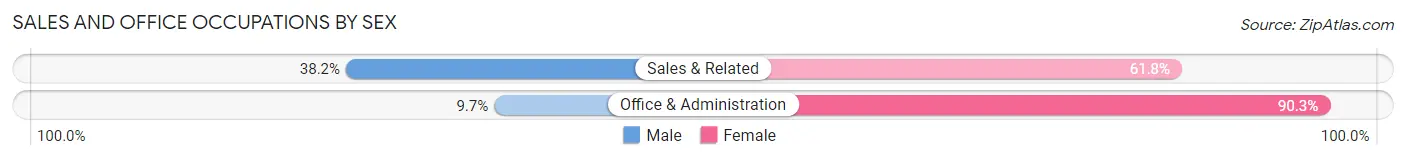
| Occupation | Male | Female |
| Sales & Related | 227 (38.2%) | 367 (61.8%) |
| Office & Administration | 49 (9.7%) | 455 (90.3%) |
| Total (Category) | 276 (25.1%) | 822 (74.9%) |
| Total (Overall) | 2,654 (48.6%) | 2,801 (51.3%) |
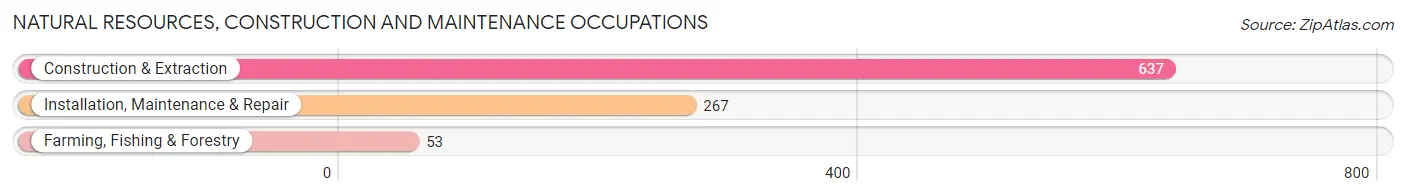
Natural Resources, Construction and Maintenance Occupations
The most common Natural Resources, Construction and Maintenance occupations in Concordia Parish are Construction & Extraction (637 | 11.7%), Installation, Maintenance & Repair (267 | 4.9%), and Farming, Fishing & Forestry (53 | 1.0%).
Natural Resources, Construction and Maintenance Occupations by Sex
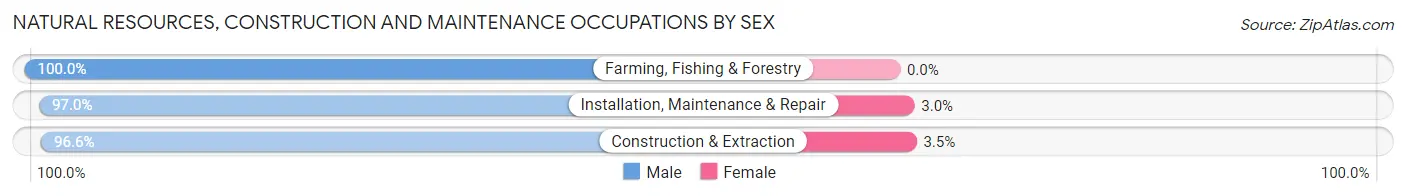
| Occupation | Male | Female |
| Farming, Fishing & Forestry | 53 (100.0%) | 0 (0.0%) |
| Construction & Extraction | 615 (96.6%) | 22 (3.5%) |
| Installation, Maintenance & Repair | 259 (97.0%) | 8 (3.0%) |
| Total (Category) | 927 (96.9%) | 30 (3.1%) |
| Total (Overall) | 2,654 (48.6%) | 2,801 (51.3%) |
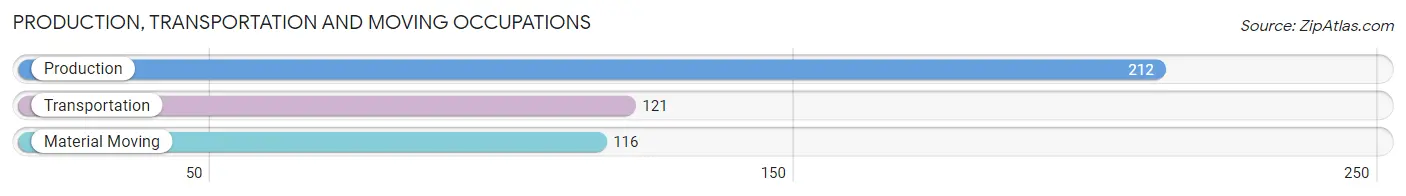
Production, Transportation and Moving Occupations
The most common Production, Transportation and Moving occupations in Concordia Parish are Production (212 | 3.9%), Transportation (121 | 2.2%), and Material Moving (116 | 2.1%).
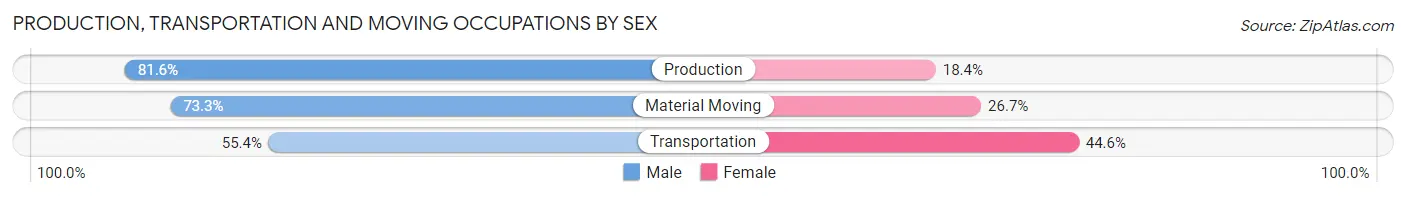
Production, Transportation and Moving Occupations by Sex
| Occupation | Male | Female |
| Production | 173 (81.6%) | 39 (18.4%) |
| Transportation | 67 (55.4%) | 54 (44.6%) |
| Material Moving | 85 (73.3%) | 31 (26.7%) |
| Total (Category) | 325 (72.4%) | 124 (27.6%) |
| Total (Overall) | 2,654 (48.6%) | 2,801 (51.3%) |
Employment Industries by Sex in Concordia Parish
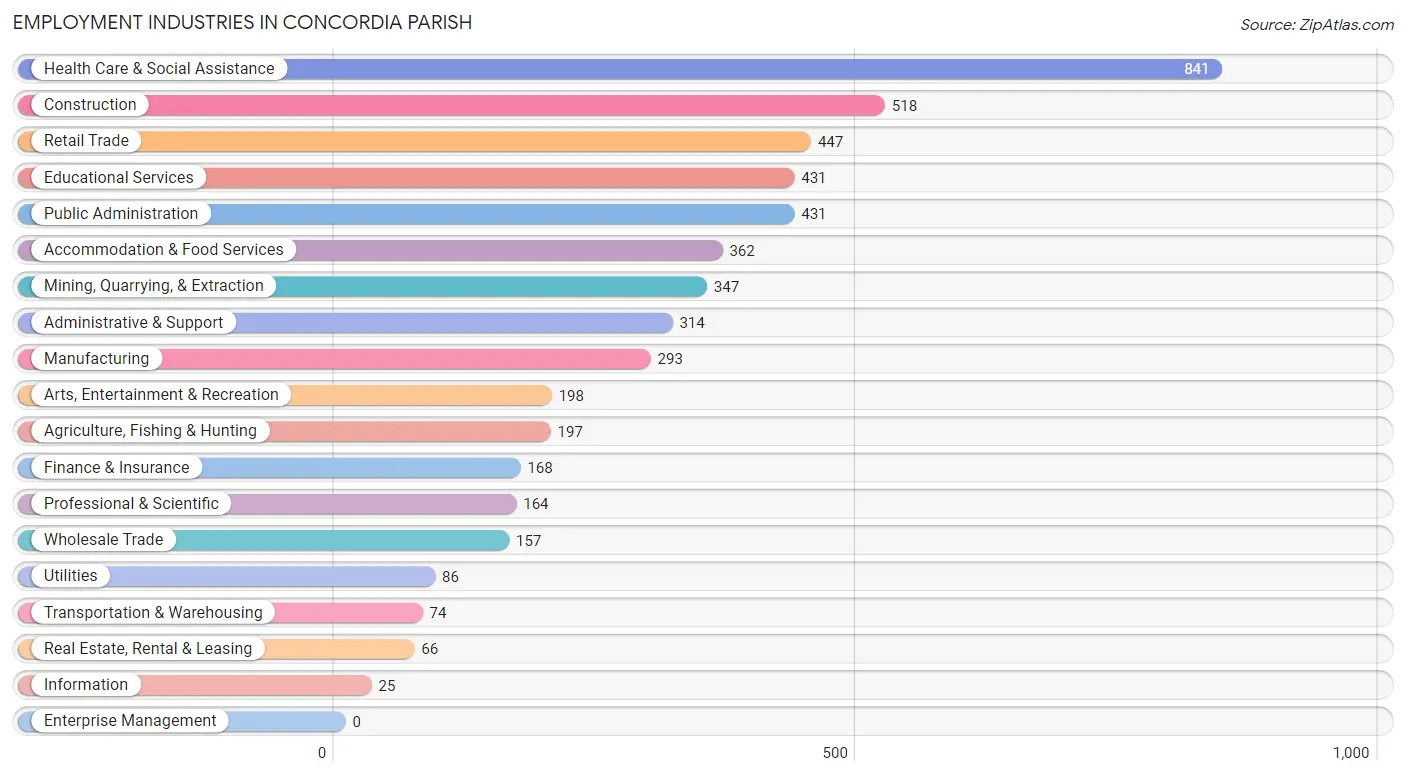
Employment Industries in Concordia Parish
The major employment industries in Concordia Parish include Health Care & Social Assistance (841 | 15.4%), Construction (518 | 9.5%), Retail Trade (447 | 8.2%), Educational Services (431 | 7.9%), and Public Administration (431 | 7.9%).
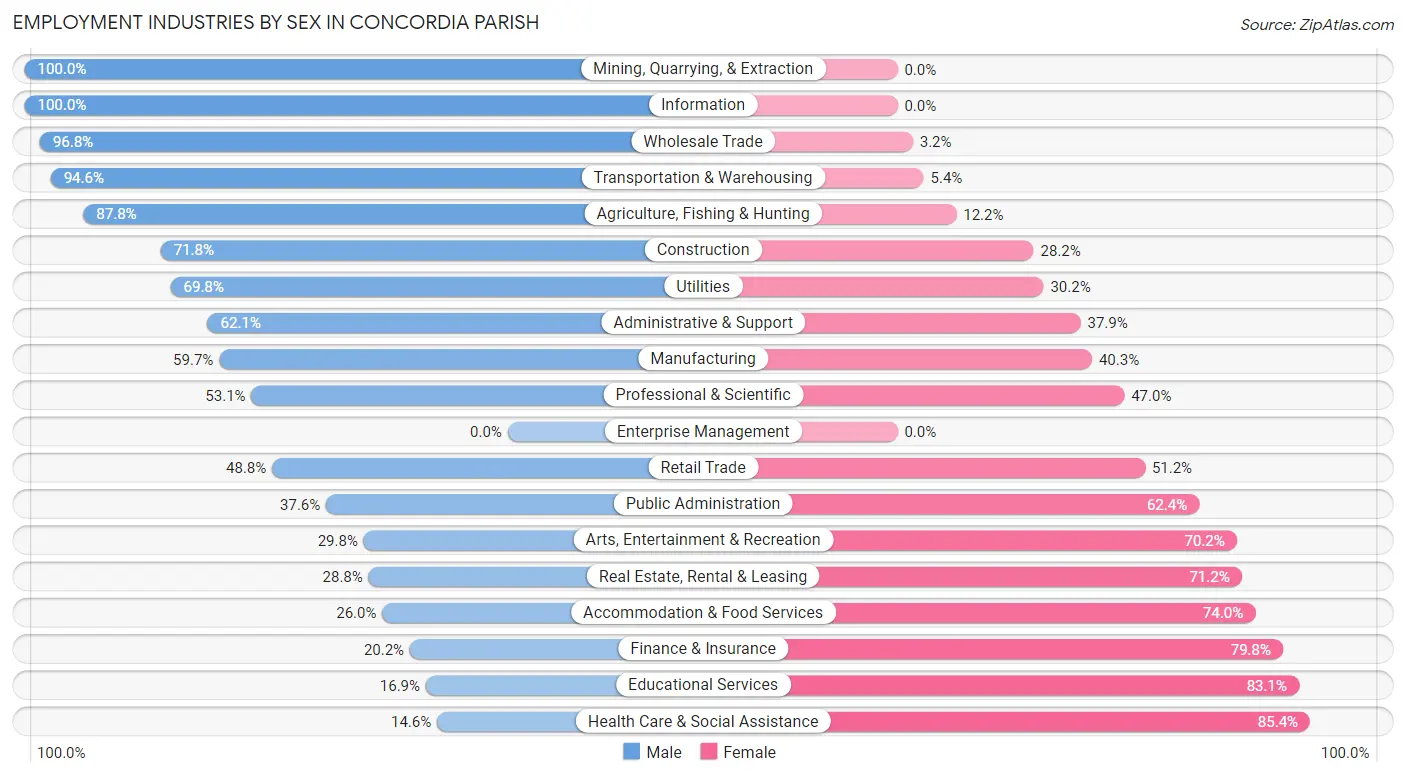
Employment Industries by Sex in Concordia Parish
The Concordia Parish industries that see more men than women are Mining, Quarrying, & Extraction (100.0%), Information (100.0%), and Wholesale Trade (96.8%), whereas the industries that tend to have a higher number of women are Health Care & Social Assistance (85.4%), Educational Services (83.1%), and Finance & Insurance (79.8%).
| Industry | Male | Female |
| Agriculture, Fishing & Hunting | 173 (87.8%) | 24 (12.2%) |
| Mining, Quarrying, & Extraction | 347 (100.0%) | 0 (0.0%) |
| Construction | 372 (71.8%) | 146 (28.2%) |
| Manufacturing | 175 (59.7%) | 118 (40.3%) |
| Wholesale Trade | 152 (96.8%) | 5 (3.2%) |
| Retail Trade | 218 (48.8%) | 229 (51.2%) |
| Transportation & Warehousing | 70 (94.6%) | 4 (5.4%) |
| Utilities | 60 (69.8%) | 26 (30.2%) |
| Information | 25 (100.0%) | 0 (0.0%) |
| Finance & Insurance | 34 (20.2%) | 134 (79.8%) |
| Real Estate, Rental & Leasing | 19 (28.8%) | 47 (71.2%) |
| Professional & Scientific | 87 (53.0%) | 77 (46.9%) |
| Enterprise Management | 0 (0.0%) | 0 (0.0%) |
| Administrative & Support | 195 (62.1%) | 119 (37.9%) |
| Educational Services | 73 (16.9%) | 358 (83.1%) |
| Health Care & Social Assistance | 123 (14.6%) | 718 (85.4%) |
| Arts, Entertainment & Recreation | 59 (29.8%) | 139 (70.2%) |
| Accommodation & Food Services | 94 (26.0%) | 268 (74.0%) |
| Public Administration | 162 (37.6%) | 269 (62.4%) |
| Total | 2,654 (48.6%) | 2,801 (51.3%) |
Education in Concordia Parish
School Enrollment in Concordia Parish
The most common levels of schooling among the 4,329 students in Concordia Parish are elementary school (1,213 | 28.0%), high school (1,123 | 25.9%), and middle school (863 | 19.9%).
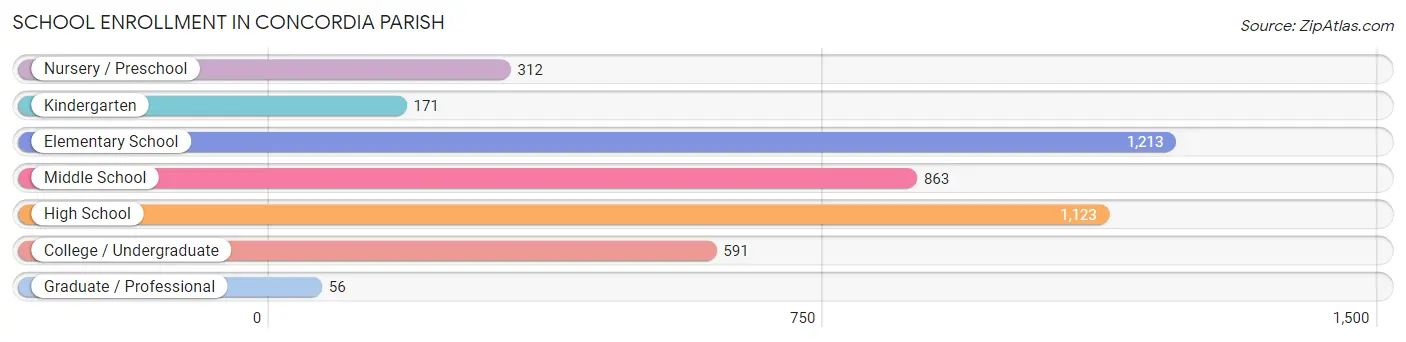
| School Level | # Students | % Students |
| Nursery / Preschool | 312 | 7.2% |
| Kindergarten | 171 | 4.0% |
| Elementary School | 1,213 | 28.0% |
| Middle School | 863 | 19.9% |
| High School | 1,123 | 25.9% |
| College / Undergraduate | 591 | 13.7% |
| Graduate / Professional | 56 | 1.3% |
| Total | 4,329 | 100.0% |
School Enrollment by Age by Funding Source in Concordia Parish
Out of a total of 4,329 students who are enrolled in schools in Concordia Parish, 212 (4.9%) attend a private institution, while the remaining 4,117 (95.1%) are enrolled in public schools. The age group of 35 years and over has the highest likelihood of being enrolled in private schools, with 44 (38.6% in the age bracket) enrolled. Conversely, the age group of 10 to 14 year olds has the lowest likelihood of being enrolled in a private school, with 1,082 (99.3% in the age bracket) attending a public institution.
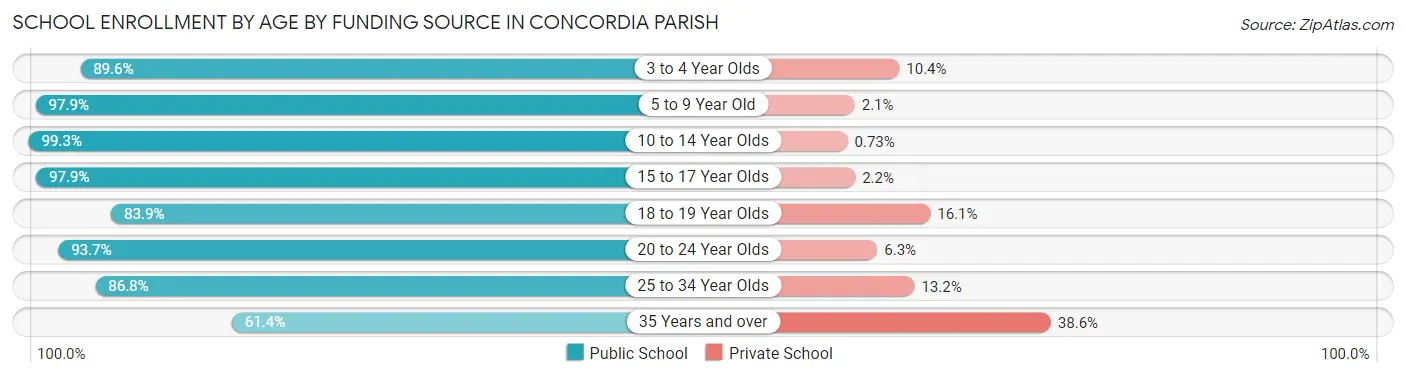
| Age Bracket | Public School | Private School |
| 3 to 4 Year Olds | 268 (89.6%) | 31 (10.4%) |
| 5 to 9 Year Old | 1,323 (97.9%) | 28 (2.1%) |
| 10 to 14 Year Olds | 1,082 (99.3%) | 8 (0.7%) |
| 15 to 17 Year Olds | 727 (97.9%) | 16 (2.1%) |
| 18 to 19 Year Olds | 234 (83.9%) | 45 (16.1%) |
| 20 to 24 Year Olds | 254 (93.7%) | 17 (6.3%) |
| 25 to 34 Year Olds | 158 (86.8%) | 24 (13.2%) |
| 35 Years and over | 70 (61.4%) | 44 (38.6%) |
| Total | 4,117 (95.1%) | 212 (4.9%) |
Educational Attainment by Field of Study in Concordia Parish
Education (499 | 21.1%), business (459 | 19.4%), science & technology (344 | 14.6%), liberal arts & history (299 | 12.7%), and bio, nature & agricultural (166 | 7.0%) are the most common fields of study among 2,363 individuals in Concordia Parish who have obtained a bachelor's degree or higher.
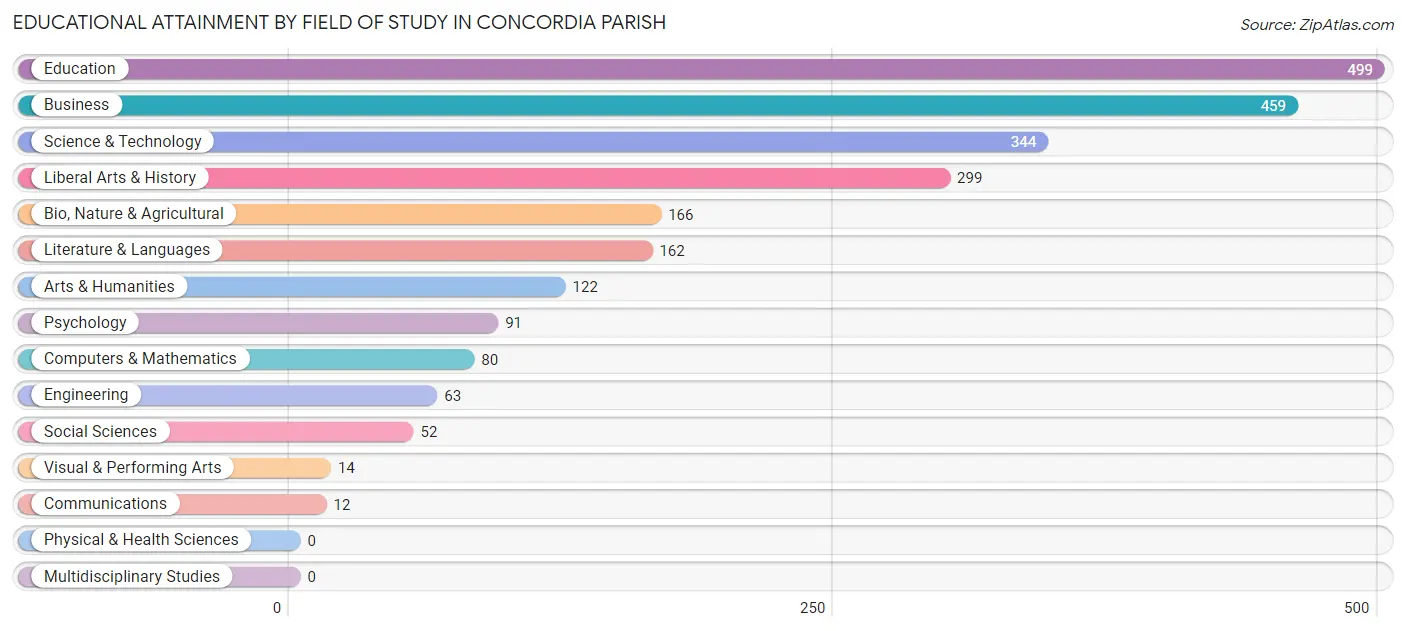
| Field of Study | # Graduates | % Graduates |
| Computers & Mathematics | 80 | 3.4% |
| Bio, Nature & Agricultural | 166 | 7.0% |
| Physical & Health Sciences | 0 | 0.0% |
| Psychology | 91 | 3.8% |
| Social Sciences | 52 | 2.2% |
| Engineering | 63 | 2.7% |
| Multidisciplinary Studies | 0 | 0.0% |
| Science & Technology | 344 | 14.6% |
| Business | 459 | 19.4% |
| Education | 499 | 21.1% |
| Literature & Languages | 162 | 6.9% |
| Liberal Arts & History | 299 | 12.7% |
| Visual & Performing Arts | 14 | 0.6% |
| Communications | 12 | 0.5% |
| Arts & Humanities | 122 | 5.2% |
| Total | 2,363 | 100.0% |
Transportation & Commute in Concordia Parish
Vehicle Availability by Sex in Concordia Parish
The most prevalent vehicle ownership categories in Concordia Parish are males with 2 vehicles (1,387, accounting for 52.9%) and females with 2 vehicles (1,149, making up 52.1%).
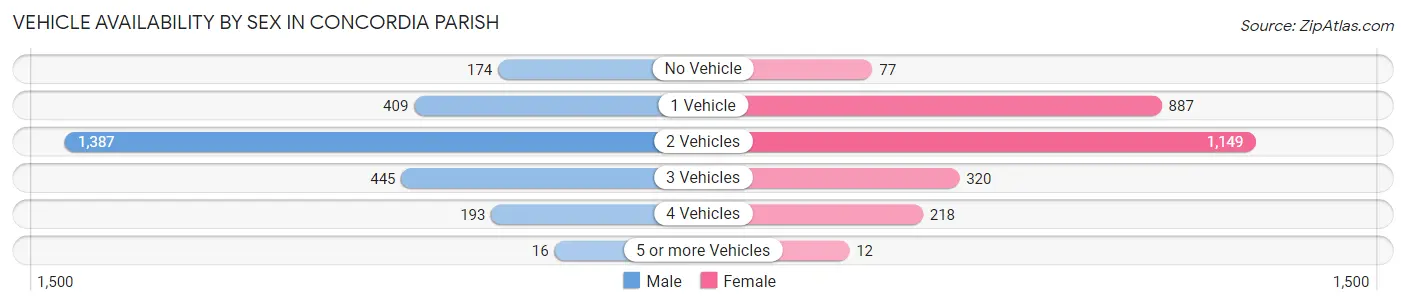
| Vehicles Available | Male | Female |
| No Vehicle | 174 (6.6%) | 77 (2.9%) |
| 1 Vehicle | 409 (15.6%) | 887 (33.3%) |
| 2 Vehicles | 1,387 (52.9%) | 1,149 (43.1%) |
| 3 Vehicles | 445 (17.0%) | 320 (12.0%) |
| 4 Vehicles | 193 (7.4%) | 218 (8.2%) |
| 5 or more Vehicles | 16 (0.6%) | 12 (0.4%) |
| Total | 2,624 (100.0%) | 2,663 (100.0%) |
Commute Time in Concordia Parish
The most frequently occuring commute durations in Concordia Parish are 10 to 14 minutes (1,081 commuters, 20.8%), 15 to 19 minutes (1,061 commuters, 20.4%), and 30 to 34 minutes (741 commuters, 14.3%).
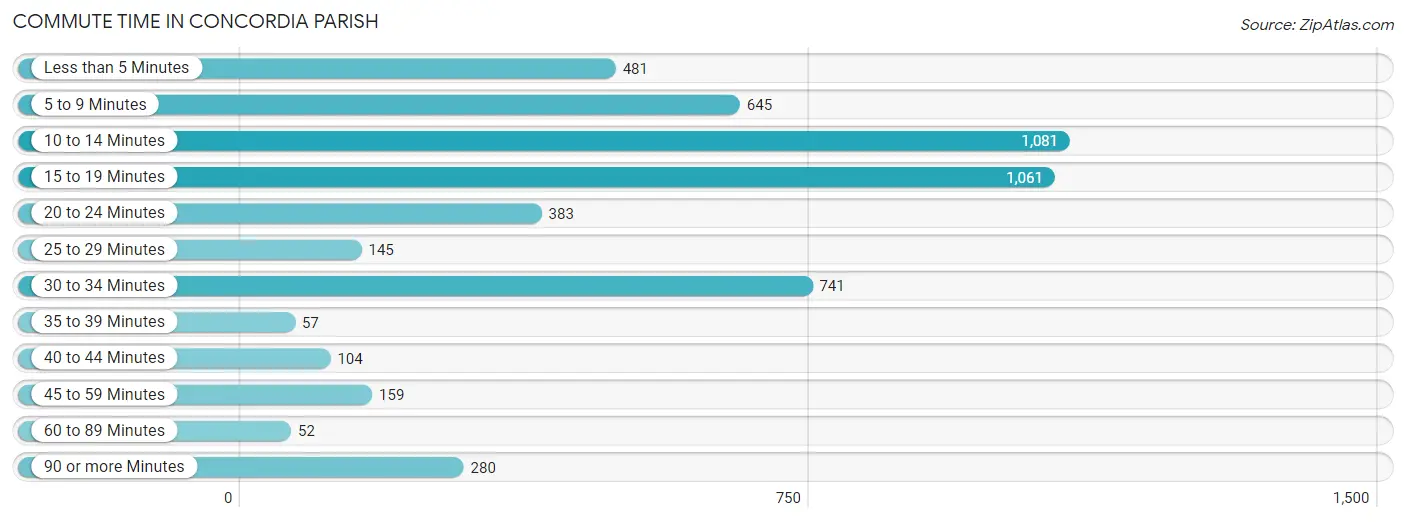
| Commute Time | # Commuters | % Commuters |
| Less than 5 Minutes | 481 | 9.3% |
| 5 to 9 Minutes | 645 | 12.4% |
| 10 to 14 Minutes | 1,081 | 20.8% |
| 15 to 19 Minutes | 1,061 | 20.4% |
| 20 to 24 Minutes | 383 | 7.4% |
| 25 to 29 Minutes | 145 | 2.8% |
| 30 to 34 Minutes | 741 | 14.3% |
| 35 to 39 Minutes | 57 | 1.1% |
| 40 to 44 Minutes | 104 | 2.0% |
| 45 to 59 Minutes | 159 | 3.1% |
| 60 to 89 Minutes | 52 | 1.0% |
| 90 or more Minutes | 280 | 5.4% |
Commute Time by Sex in Concordia Parish
The most common commute times in Concordia Parish are 15 to 19 minutes (554 commuters, 21.4%) for males and 10 to 14 minutes (554 commuters, 21.3%) for females.
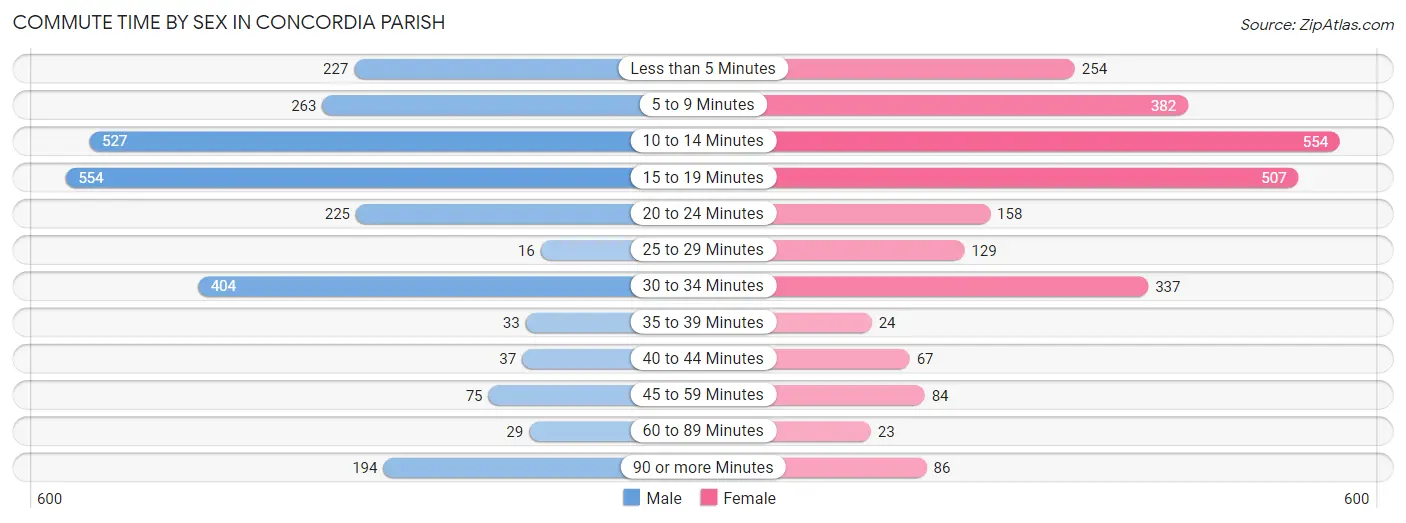
| Commute Time | Male | Female |
| Less than 5 Minutes | 227 (8.8%) | 254 (9.8%) |
| 5 to 9 Minutes | 263 (10.2%) | 382 (14.7%) |
| 10 to 14 Minutes | 527 (20.4%) | 554 (21.3%) |
| 15 to 19 Minutes | 554 (21.4%) | 507 (19.5%) |
| 20 to 24 Minutes | 225 (8.7%) | 158 (6.1%) |
| 25 to 29 Minutes | 16 (0.6%) | 129 (5.0%) |
| 30 to 34 Minutes | 404 (15.6%) | 337 (12.9%) |
| 35 to 39 Minutes | 33 (1.3%) | 24 (0.9%) |
| 40 to 44 Minutes | 37 (1.4%) | 67 (2.6%) |
| 45 to 59 Minutes | 75 (2.9%) | 84 (3.2%) |
| 60 to 89 Minutes | 29 (1.1%) | 23 (0.9%) |
| 90 or more Minutes | 194 (7.5%) | 86 (3.3%) |
Time of Departure to Work by Sex in Concordia Parish
The most frequent times of departure to work in Concordia Parish are 7:00 AM to 7:29 AM (521, 20.2%) for males and 7:30 AM to 7:59 AM (541, 20.8%) for females.
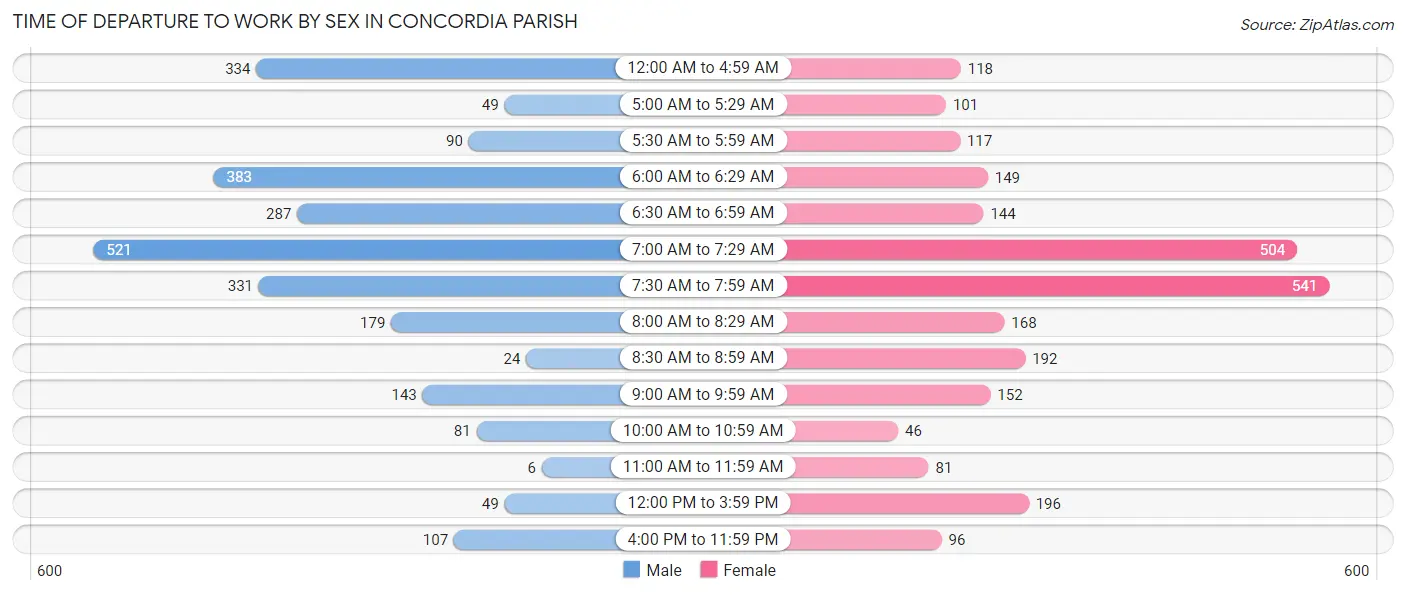
| Time of Departure | Male | Female |
| 12:00 AM to 4:59 AM | 334 (12.9%) | 118 (4.5%) |
| 5:00 AM to 5:29 AM | 49 (1.9%) | 101 (3.9%) |
| 5:30 AM to 5:59 AM | 90 (3.5%) | 117 (4.5%) |
| 6:00 AM to 6:29 AM | 383 (14.8%) | 149 (5.7%) |
| 6:30 AM to 6:59 AM | 287 (11.1%) | 144 (5.5%) |
| 7:00 AM to 7:29 AM | 521 (20.2%) | 504 (19.4%) |
| 7:30 AM to 7:59 AM | 331 (12.8%) | 541 (20.8%) |
| 8:00 AM to 8:29 AM | 179 (6.9%) | 168 (6.5%) |
| 8:30 AM to 8:59 AM | 24 (0.9%) | 192 (7.4%) |
| 9:00 AM to 9:59 AM | 143 (5.5%) | 152 (5.8%) |
| 10:00 AM to 10:59 AM | 81 (3.1%) | 46 (1.8%) |
| 11:00 AM to 11:59 AM | 6 (0.2%) | 81 (3.1%) |
| 12:00 PM to 3:59 PM | 49 (1.9%) | 196 (7.5%) |
| 4:00 PM to 11:59 PM | 107 (4.1%) | 96 (3.7%) |
| Total | 2,584 (100.0%) | 2,605 (100.0%) |
Housing Occupancy in Concordia Parish
Occupancy by Ownership in Concordia Parish
Of the total 6,302 dwellings in Concordia Parish, owner-occupied units account for 4,585 (72.8%), while renter-occupied units make up 1,717 (27.3%).
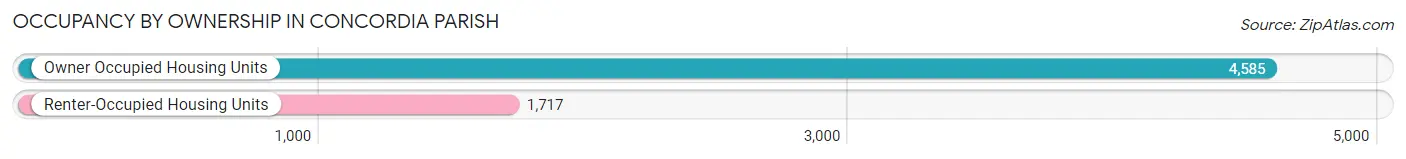
| Occupancy | # Housing Units | % Housing Units |
| Owner Occupied Housing Units | 4,585 | 72.8% |
| Renter-Occupied Housing Units | 1,717 | 27.3% |
| Total Occupied Housing Units | 6,302 | 100.0% |
Occupancy by Household Size in Concordia Parish
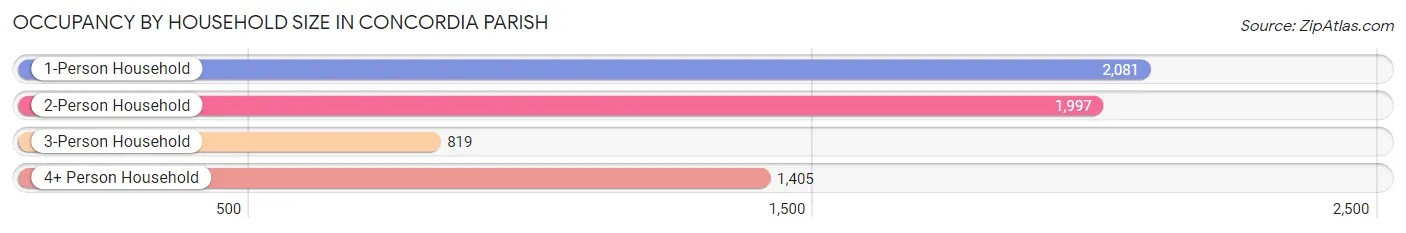
| Household Size | # Housing Units | % Housing Units |
| 1-Person Household | 2,081 | 33.0% |
| 2-Person Household | 1,997 | 31.7% |
| 3-Person Household | 819 | 13.0% |
| 4+ Person Household | 1,405 | 22.3% |
| Total Housing Units | 6,302 | 100.0% |
Occupancy by Ownership by Household Size in Concordia Parish
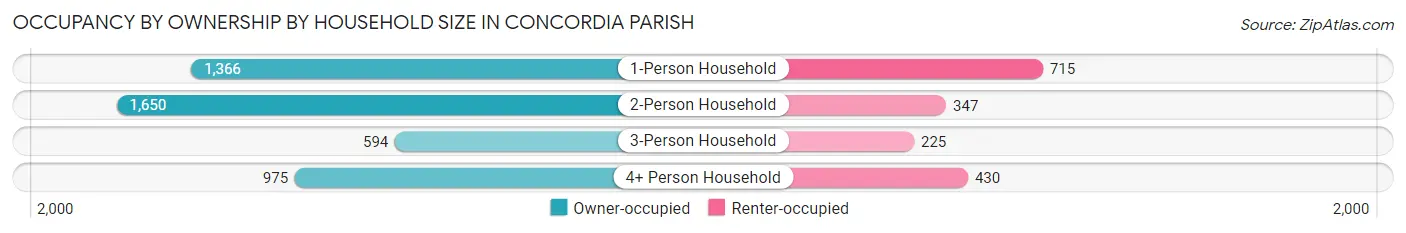
| Household Size | Owner-occupied | Renter-occupied |
| 1-Person Household | 1,366 (65.6%) | 715 (34.4%) |
| 2-Person Household | 1,650 (82.6%) | 347 (17.4%) |
| 3-Person Household | 594 (72.5%) | 225 (27.5%) |
| 4+ Person Household | 975 (69.4%) | 430 (30.6%) |
| Total Housing Units | 4,585 (72.8%) | 1,717 (27.3%) |
Occupancy by Educational Attainment in Concordia Parish
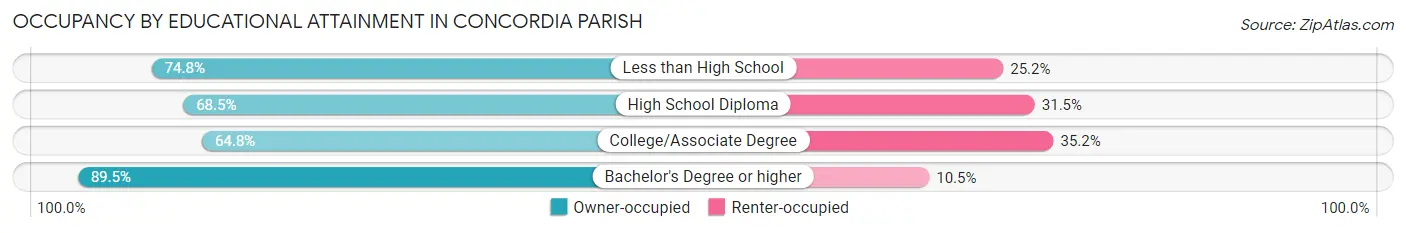
| Household Size | Owner-occupied | Renter-occupied |
| Less than High School | 552 (74.8%) | 186 (25.2%) |
| High School Diploma | 1,821 (68.5%) | 836 (31.5%) |
| College/Associate Degree | 1,023 (64.8%) | 555 (35.2%) |
| Bachelor's Degree or higher | 1,189 (89.5%) | 140 (10.5%) |
Occupancy by Age of Householder in Concordia Parish
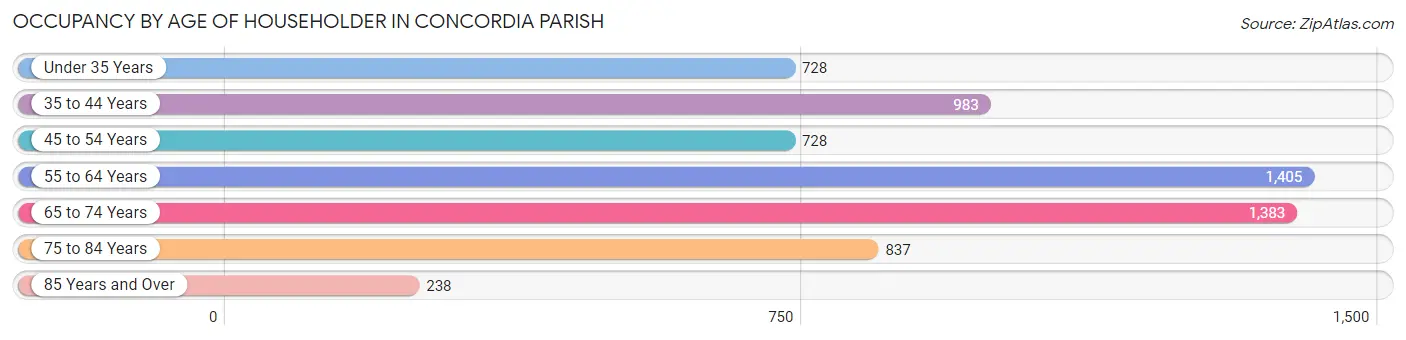
| Age Bracket | # Households | % Households |
| Under 35 Years | 728 | 11.6% |
| 35 to 44 Years | 983 | 15.6% |
| 45 to 54 Years | 728 | 11.6% |
| 55 to 64 Years | 1,405 | 22.3% |
| 65 to 74 Years | 1,383 | 22.0% |
| 75 to 84 Years | 837 | 13.3% |
| 85 Years and Over | 238 | 3.8% |
| Total | 6,302 | 100.0% |
Housing Finances in Concordia Parish
Median Income by Occupancy in Concordia Parish
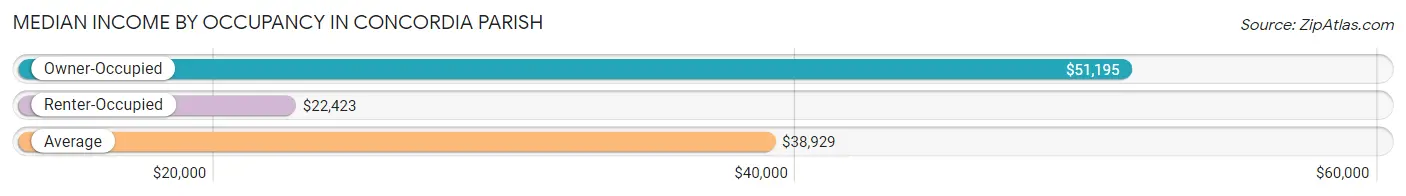
| Occupancy Type | # Households | Median Income |
| Owner-Occupied | 4,585 (72.8%) | $51,195 |
| Renter-Occupied | 1,717 (27.3%) | $22,423 |
| Average | 6,302 (100.0%) | $38,929 |
Occupancy by Householder Income Bracket in Concordia Parish
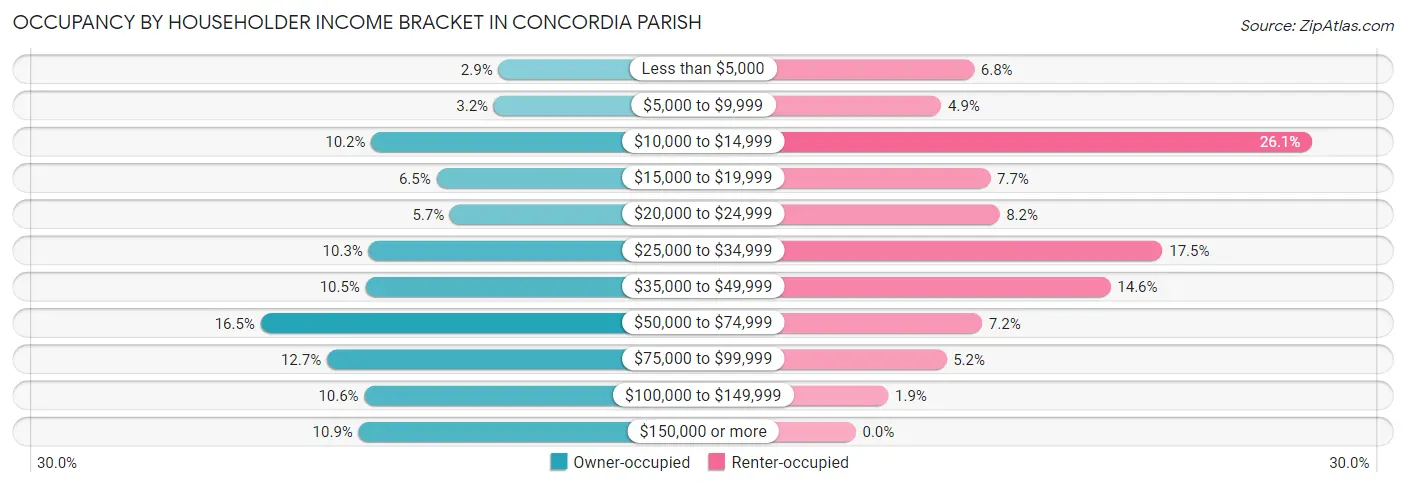
| Income Bracket | Owner-occupied | Renter-occupied |
| Less than $5,000 | 134 (2.9%) | 116 (6.8%) |
| $5,000 to $9,999 | 146 (3.2%) | 84 (4.9%) |
| $10,000 to $14,999 | 467 (10.2%) | 448 (26.1%) |
| $15,000 to $19,999 | 296 (6.5%) | 132 (7.7%) |
| $20,000 to $24,999 | 261 (5.7%) | 141 (8.2%) |
| $25,000 to $34,999 | 474 (10.3%) | 301 (17.5%) |
| $35,000 to $49,999 | 482 (10.5%) | 250 (14.6%) |
| $50,000 to $74,999 | 757 (16.5%) | 124 (7.2%) |
| $75,000 to $99,999 | 583 (12.7%) | 89 (5.2%) |
| $100,000 to $149,999 | 485 (10.6%) | 32 (1.9%) |
| $150,000 or more | 500 (10.9%) | 0 (0.0%) |
| Total | 4,585 (100.0%) | 1,717 (100.0%) |
Monthly Housing Cost Tiers in Concordia Parish
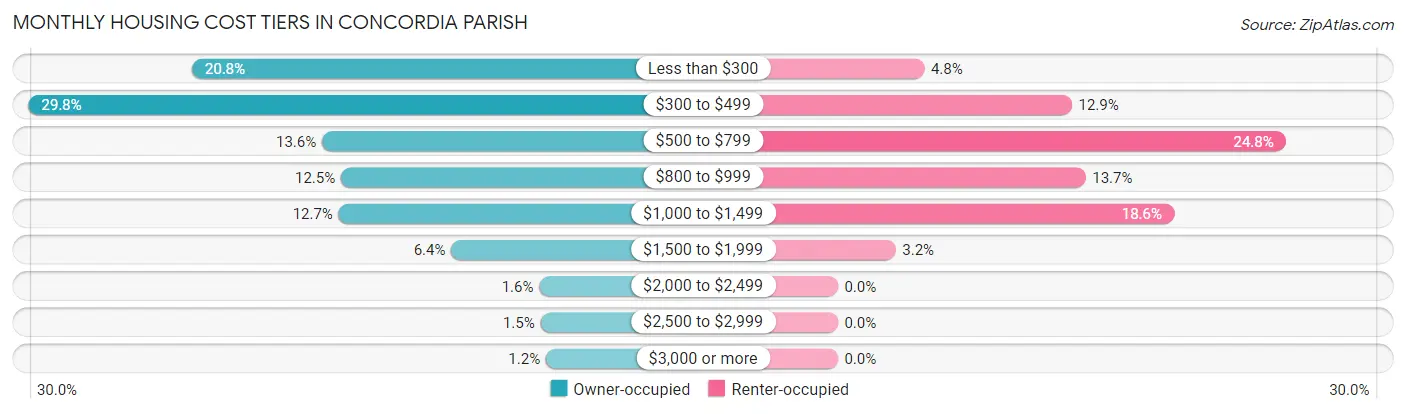
| Monthly Cost | Owner-occupied | Renter-occupied |
| Less than $300 | 952 (20.8%) | 82 (4.8%) |
| $300 to $499 | 1,366 (29.8%) | 222 (12.9%) |
| $500 to $799 | 622 (13.6%) | 425 (24.7%) |
| $800 to $999 | 574 (12.5%) | 235 (13.7%) |
| $1,000 to $1,499 | 580 (12.7%) | 319 (18.6%) |
| $1,500 to $1,999 | 295 (6.4%) | 55 (3.2%) |
| $2,000 to $2,499 | 72 (1.6%) | 0 (0.0%) |
| $2,500 to $2,999 | 69 (1.5%) | 0 (0.0%) |
| $3,000 or more | 55 (1.2%) | 0 (0.0%) |
| Total | 4,585 (100.0%) | 1,717 (100.0%) |
Physical Housing Characteristics in Concordia Parish
Housing Structures in Concordia Parish
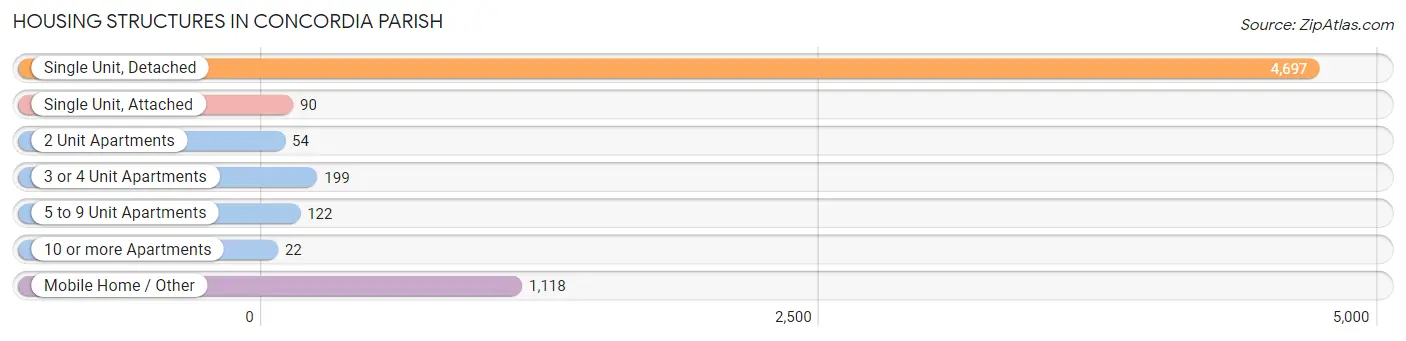
| Structure Type | # Housing Units | % Housing Units |
| Single Unit, Detached | 4,697 | 74.5% |
| Single Unit, Attached | 90 | 1.4% |
| 2 Unit Apartments | 54 | 0.9% |
| 3 or 4 Unit Apartments | 199 | 3.2% |
| 5 to 9 Unit Apartments | 122 | 1.9% |
| 10 or more Apartments | 22 | 0.4% |
| Mobile Home / Other | 1,118 | 17.7% |
| Total | 6,302 | 100.0% |
Housing Structures by Occupancy in Concordia Parish
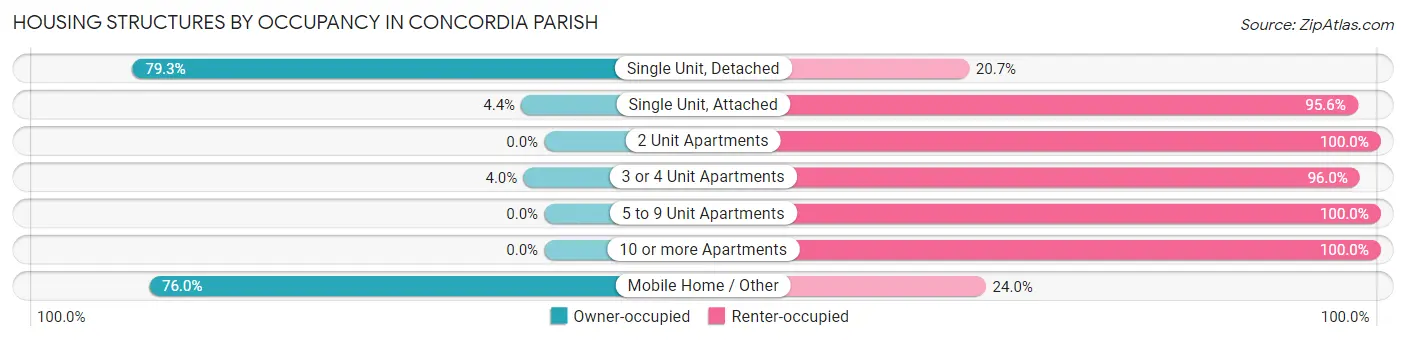
| Structure Type | Owner-occupied | Renter-occupied |
| Single Unit, Detached | 3,723 (79.3%) | 974 (20.7%) |
| Single Unit, Attached | 4 (4.4%) | 86 (95.6%) |
| 2 Unit Apartments | 0 (0.0%) | 54 (100.0%) |
| 3 or 4 Unit Apartments | 8 (4.0%) | 191 (96.0%) |
| 5 to 9 Unit Apartments | 0 (0.0%) | 122 (100.0%) |
| 10 or more Apartments | 0 (0.0%) | 22 (100.0%) |
| Mobile Home / Other | 850 (76.0%) | 268 (24.0%) |
| Total | 4,585 (72.8%) | 1,717 (27.3%) |
Housing Structures by Number of Rooms in Concordia Parish
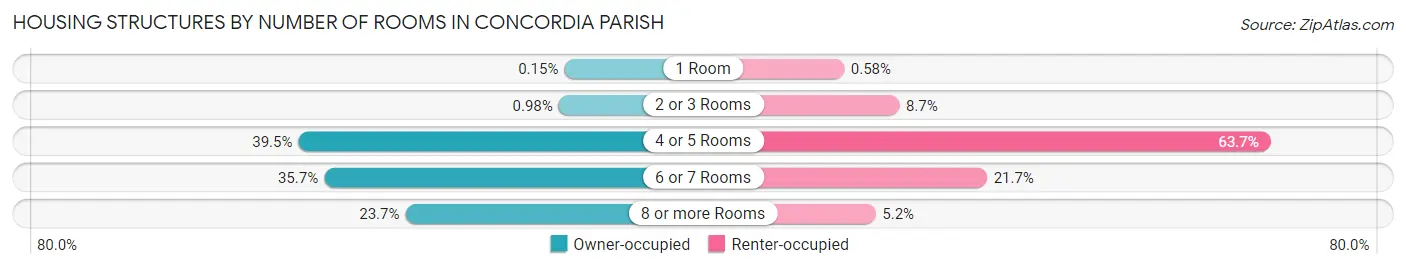
| Number of Rooms | Owner-occupied | Renter-occupied |
| 1 Room | 7 (0.2%) | 10 (0.6%) |
| 2 or 3 Rooms | 45 (1.0%) | 150 (8.7%) |
| 4 or 5 Rooms | 1,811 (39.5%) | 1,094 (63.7%) |
| 6 or 7 Rooms | 1,637 (35.7%) | 373 (21.7%) |
| 8 or more Rooms | 1,085 (23.7%) | 90 (5.2%) |
| Total | 4,585 (100.0%) | 1,717 (100.0%) |
Housing Structure by Heating Type in Concordia Parish
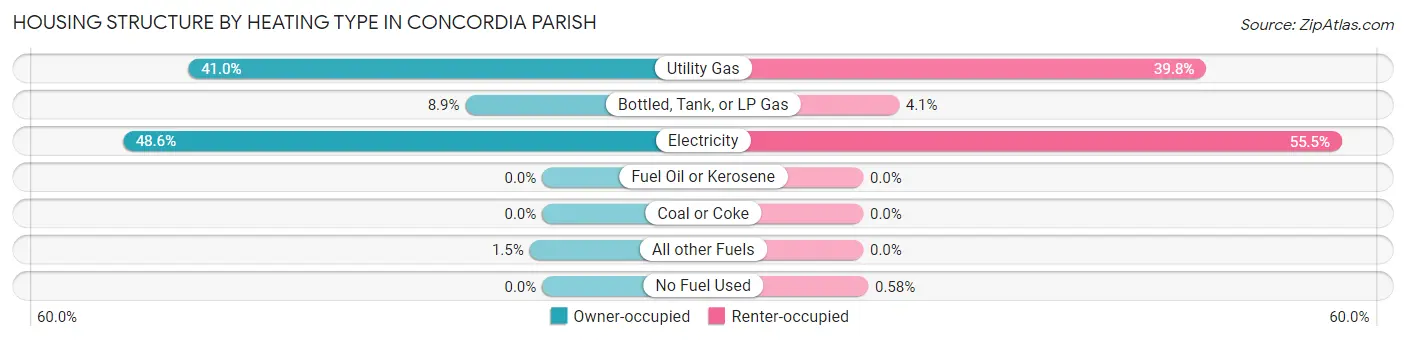
| Heating Type | Owner-occupied | Renter-occupied |
| Utility Gas | 1,881 (41.0%) | 683 (39.8%) |
| Bottled, Tank, or LP Gas | 408 (8.9%) | 71 (4.1%) |
| Electricity | 2,229 (48.6%) | 953 (55.5%) |
| Fuel Oil or Kerosene | 0 (0.0%) | 0 (0.0%) |
| Coal or Coke | 0 (0.0%) | 0 (0.0%) |
| All other Fuels | 67 (1.5%) | 0 (0.0%) |
| No Fuel Used | 0 (0.0%) | 10 (0.6%) |
| Total | 4,585 (100.0%) | 1,717 (100.0%) |
Household Vehicle Usage in Concordia Parish
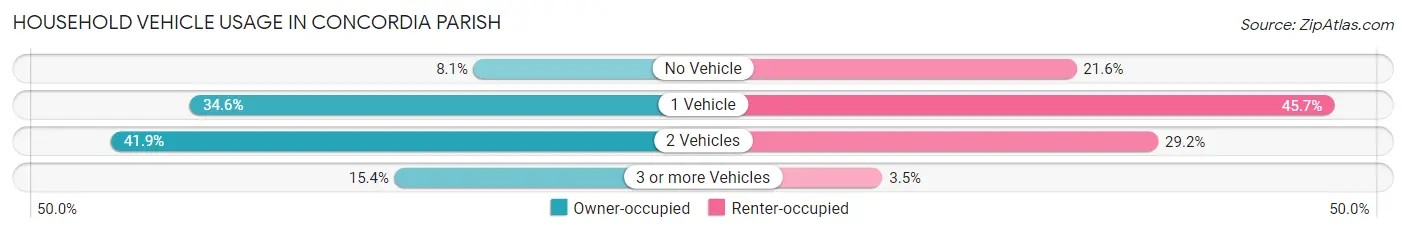
| Vehicles per Household | Owner-occupied | Renter-occupied |
| No Vehicle | 370 (8.1%) | 371 (21.6%) |
| 1 Vehicle | 1,584 (34.5%) | 784 (45.7%) |
| 2 Vehicles | 1,923 (41.9%) | 502 (29.2%) |
| 3 or more Vehicles | 708 (15.4%) | 60 (3.5%) |
| Total | 4,585 (100.0%) | 1,717 (100.0%) |
Real Estate & Mortgages in Concordia Parish
Real Estate and Mortgage Overview in Concordia Parish
| Characteristic | Without Mortgage | With Mortgage |
| Housing Units | 2,758 | 1,827 |
| Median Property Value | $77,900 | $124,400 |
| Median Household Income | $45,543 | $372 |
| Monthly Housing Costs | $348 | $55 |
| Real Estate Taxes | $199 | $447 |
Property Value by Mortgage Status in Concordia Parish
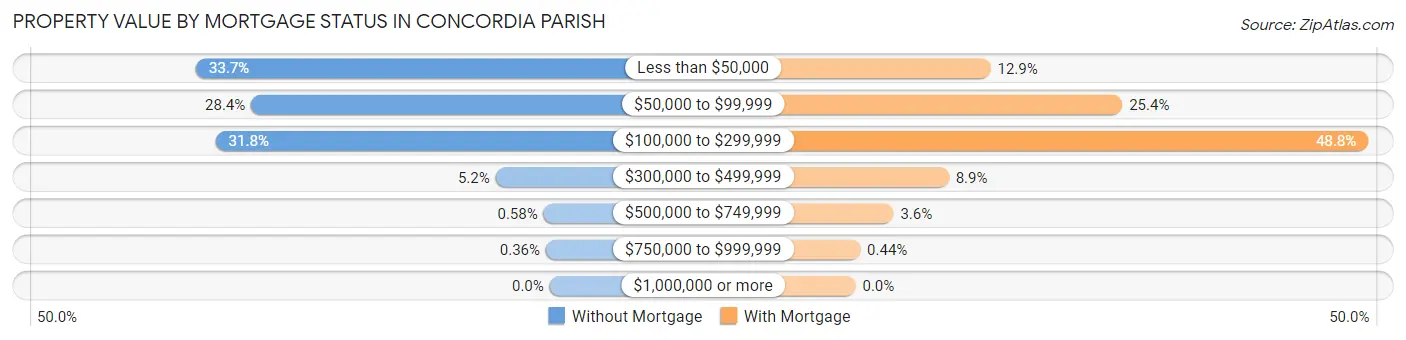
| Property Value | Without Mortgage | With Mortgage |
| Less than $50,000 | 929 (33.7%) | 235 (12.9%) |
| $50,000 to $99,999 | 784 (28.4%) | 464 (25.4%) |
| $100,000 to $299,999 | 877 (31.8%) | 892 (48.8%) |
| $300,000 to $499,999 | 142 (5.1%) | 162 (8.9%) |
| $500,000 to $749,999 | 16 (0.6%) | 66 (3.6%) |
| $750,000 to $999,999 | 10 (0.4%) | 8 (0.4%) |
| $1,000,000 or more | 0 (0.0%) | 0 (0.0%) |
| Total | 2,758 (100.0%) | 1,827 (100.0%) |
Household Income by Mortgage Status in Concordia Parish
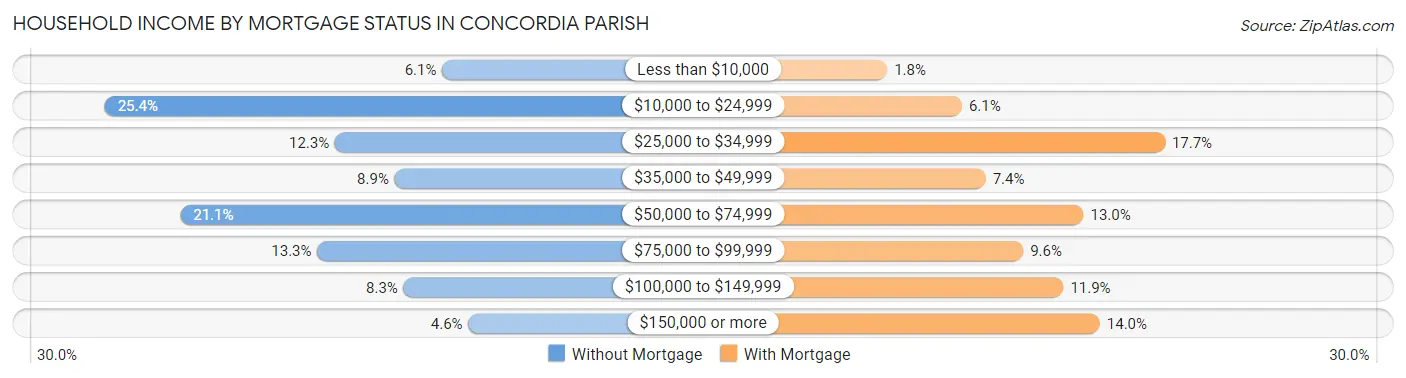
| Household Income | Without Mortgage | With Mortgage |
| Less than $10,000 | 169 (6.1%) | 33 (1.8%) |
| $10,000 to $24,999 | 701 (25.4%) | 111 (6.1%) |
| $25,000 to $34,999 | 338 (12.3%) | 323 (17.7%) |
| $35,000 to $49,999 | 244 (8.8%) | 136 (7.4%) |
| $50,000 to $74,999 | 582 (21.1%) | 238 (13.0%) |
| $75,000 to $99,999 | 366 (13.3%) | 175 (9.6%) |
| $100,000 to $149,999 | 230 (8.3%) | 217 (11.9%) |
| $150,000 or more | 128 (4.6%) | 255 (14.0%) |
| Total | 2,758 (100.0%) | 1,827 (100.0%) |
Property Value to Household Income Ratio in Concordia Parish
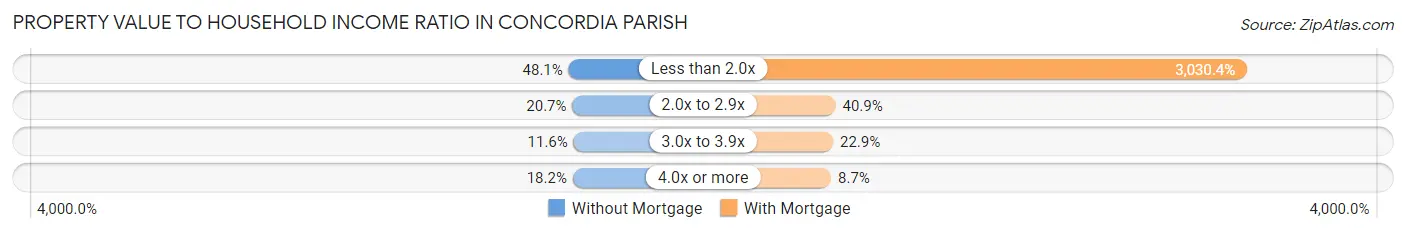
| Value-to-Income Ratio | Without Mortgage | With Mortgage |
| Less than 2.0x | 1,327 (48.1%) | 55,365 (3,030.4%) |
| 2.0x to 2.9x | 570 (20.7%) | 748 (40.9%) |
| 3.0x to 3.9x | 320 (11.6%) | 418 (22.9%) |
| 4.0x or more | 503 (18.2%) | 158 (8.6%) |
| Total | 2,758 (100.0%) | 1,827 (100.0%) |
Real Estate Taxes by Mortgage Status in Concordia Parish
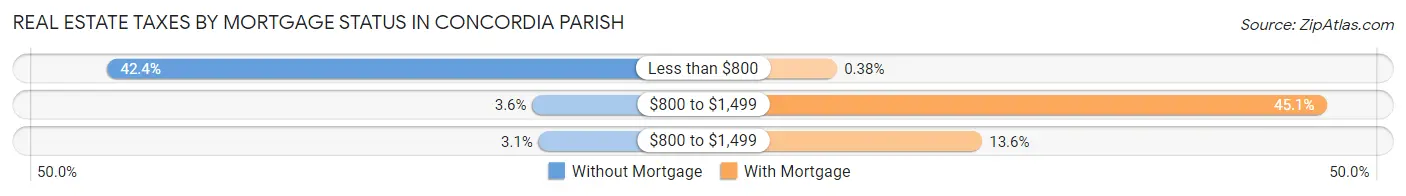
| Property Taxes | Without Mortgage | With Mortgage |
| Less than $800 | 1,170 (42.4%) | 7 (0.4%) |
| $800 to $1,499 | 100 (3.6%) | 823 (45.1%) |
| $800 to $1,499 | 84 (3.0%) | 249 (13.6%) |
| Total | 2,758 (100.0%) | 1,827 (100.0%) |
Health & Disability in Concordia Parish
Health Insurance Coverage by Age in Concordia Parish
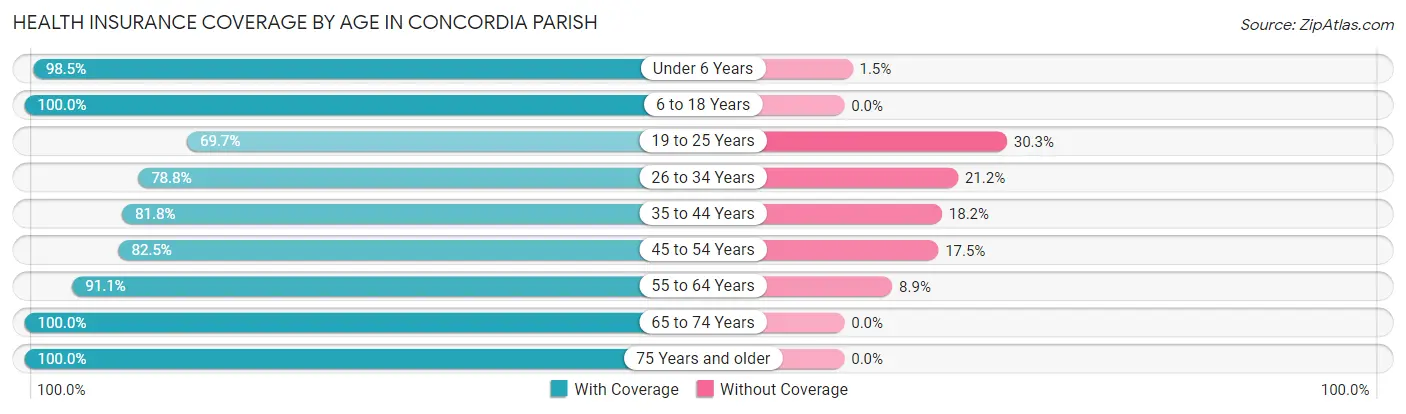
| Age Bracket | With Coverage | Without Coverage |
| Under 6 Years | 1,284 (98.5%) | 20 (1.5%) |
| 6 to 18 Years | 3,316 (100.0%) | 0 (0.0%) |
| 19 to 25 Years | 1,106 (69.7%) | 481 (30.3%) |
| 26 to 34 Years | 1,256 (78.8%) | 338 (21.2%) |
| 35 to 44 Years | 1,658 (81.8%) | 369 (18.2%) |
| 45 to 54 Years | 1,484 (82.5%) | 315 (17.5%) |
| 55 to 64 Years | 2,124 (91.1%) | 208 (8.9%) |
| 65 to 74 Years | 2,083 (100.0%) | 0 (0.0%) |
| 75 Years and older | 1,312 (100.0%) | 0 (0.0%) |
| Total | 15,623 (90.0%) | 1,731 (10.0%) |
Health Insurance Coverage by Citizenship Status in Concordia Parish
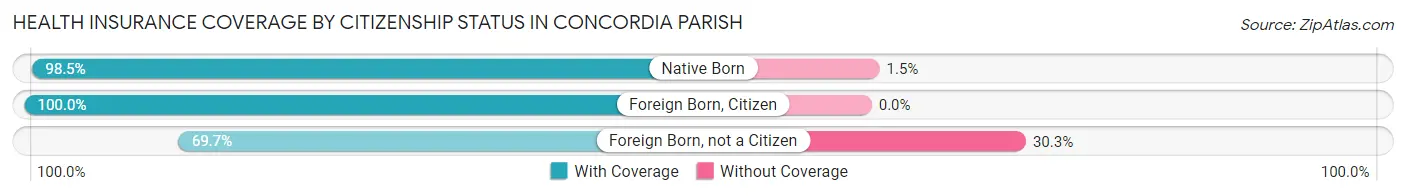
| Citizenship Status | With Coverage | Without Coverage |
| Native Born | 1,284 (98.5%) | 20 (1.5%) |
| Foreign Born, Citizen | 3,316 (100.0%) | 0 (0.0%) |
| Foreign Born, not a Citizen | 1,106 (69.7%) | 481 (30.3%) |
Health Insurance Coverage by Household Income in Concordia Parish
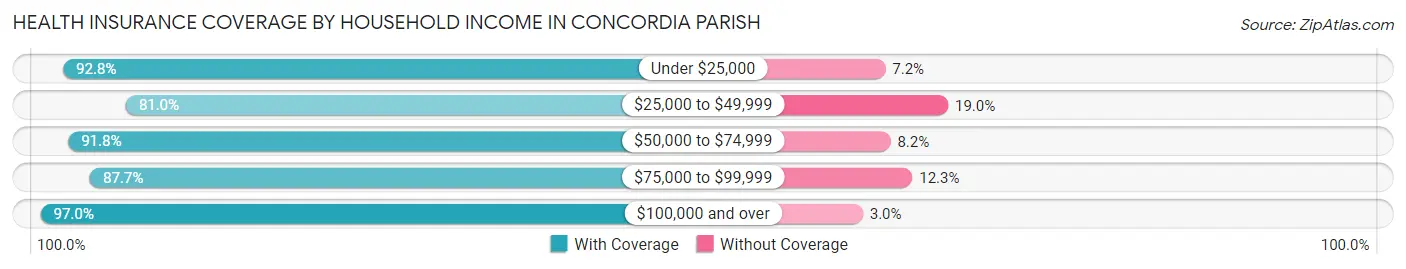
| Household Income | With Coverage | Without Coverage |
| Under $25,000 | 4,680 (92.8%) | 364 (7.2%) |
| $25,000 to $49,999 | 3,327 (81.0%) | 779 (19.0%) |
| $50,000 to $74,999 | 2,245 (91.8%) | 200 (8.2%) |
| $75,000 to $99,999 | 2,037 (87.7%) | 285 (12.3%) |
| $100,000 and over | 3,332 (97.0%) | 103 (3.0%) |
Public vs Private Health Insurance Coverage by Age in Concordia Parish
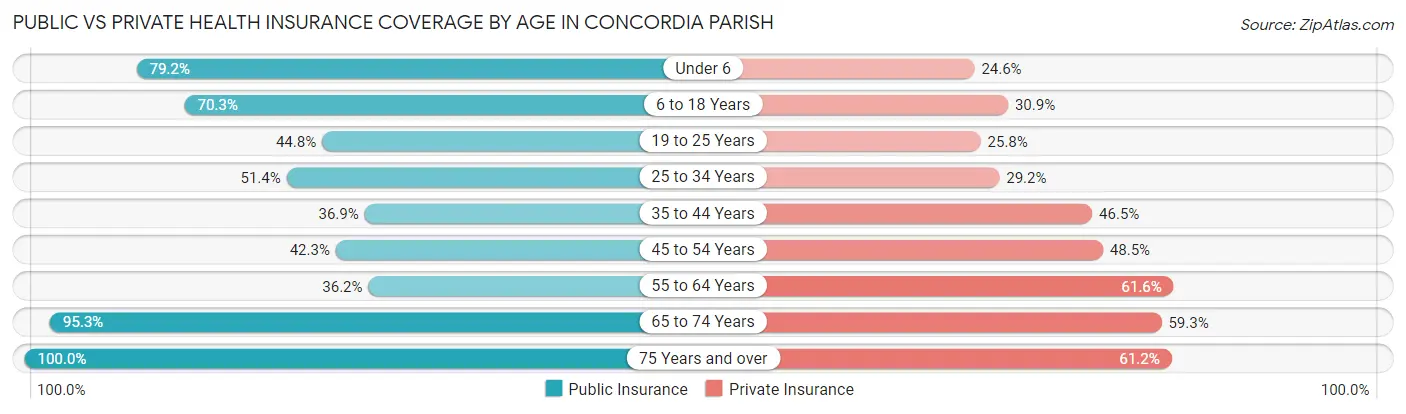
| Age Bracket | Public Insurance | Private Insurance |
| Under 6 | 1,033 (79.2%) | 321 (24.6%) |
| 6 to 18 Years | 2,331 (70.3%) | 1,023 (30.8%) |
| 19 to 25 Years | 711 (44.8%) | 409 (25.8%) |
| 25 to 34 Years | 819 (51.4%) | 466 (29.2%) |
| 35 to 44 Years | 748 (36.9%) | 942 (46.5%) |
| 45 to 54 Years | 760 (42.2%) | 872 (48.5%) |
| 55 to 64 Years | 844 (36.2%) | 1,436 (61.6%) |
| 65 to 74 Years | 1,985 (95.3%) | 1,236 (59.3%) |
| 75 Years and over | 1,312 (100.0%) | 803 (61.2%) |
| Total | 10,543 (60.8%) | 7,508 (43.3%) |
Disability Status by Sex by Age in Concordia Parish
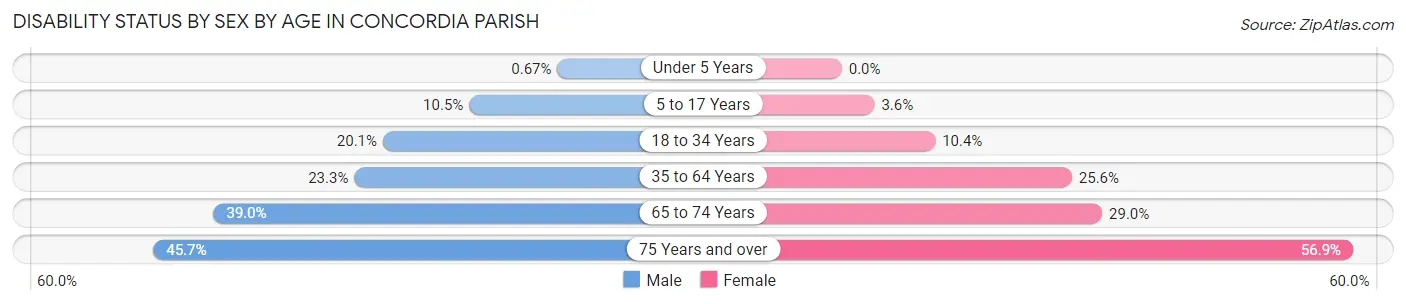
| Age Bracket | Male | Female |
| Under 5 Years | 4 (0.7%) | 0 (0.0%) |
| 5 to 17 Years | 168 (10.5%) | 61 (3.6%) |
| 18 to 34 Years | 328 (20.1%) | 181 (10.4%) |
| 35 to 64 Years | 656 (23.3%) | 856 (25.6%) |
| 65 to 74 Years | 375 (39.0%) | 325 (29.0%) |
| 75 Years and over | 226 (45.7%) | 465 (56.9%) |
Disability Class by Sex by Age in Concordia Parish
Disability Class: Hearing Difficulty
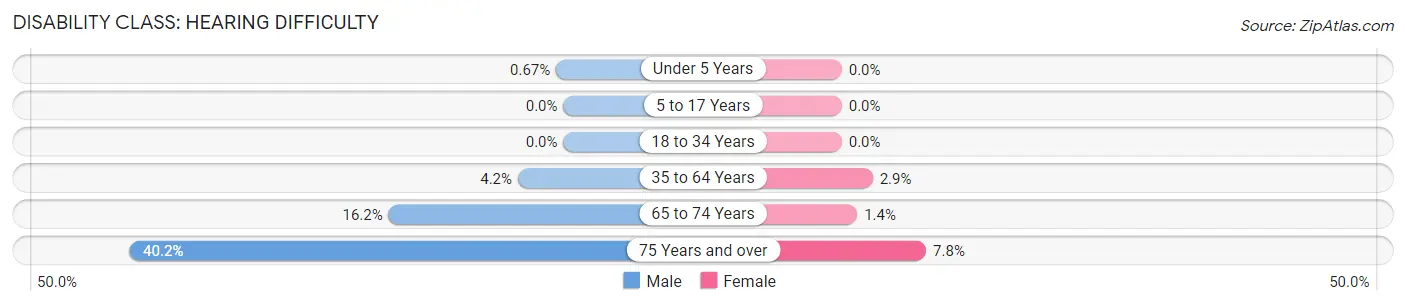
| Age Bracket | Male | Female |
| Under 5 Years | 4 (0.7%) | 0 (0.0%) |
| 5 to 17 Years | 0 (0.0%) | 0 (0.0%) |
| 18 to 34 Years | 0 (0.0%) | 0 (0.0%) |
| 35 to 64 Years | 119 (4.2%) | 96 (2.9%) |
| 65 to 74 Years | 156 (16.2%) | 16 (1.4%) |
| 75 Years and over | 199 (40.2%) | 64 (7.8%) |
Disability Class: Vision Difficulty
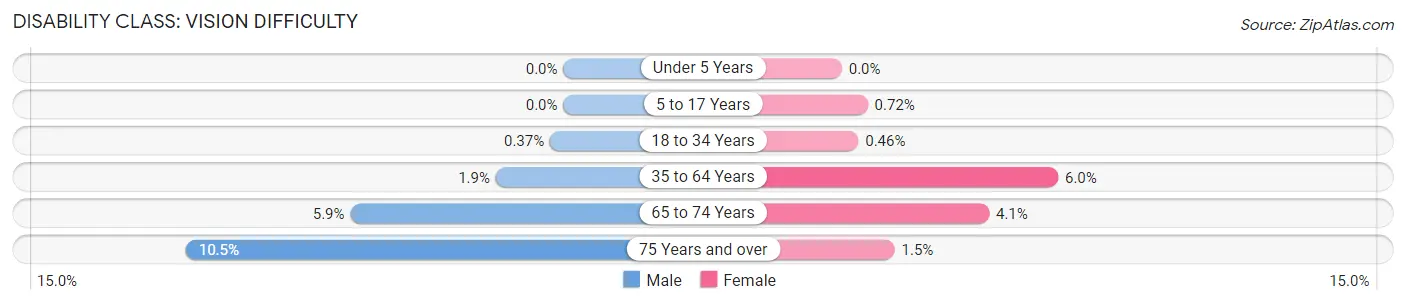
| Age Bracket | Male | Female |
| Under 5 Years | 0 (0.0%) | 0 (0.0%) |
| 5 to 17 Years | 0 (0.0%) | 12 (0.7%) |
| 18 to 34 Years | 6 (0.4%) | 8 (0.5%) |
| 35 to 64 Years | 53 (1.9%) | 201 (6.0%) |
| 65 to 74 Years | 57 (5.9%) | 46 (4.1%) |
| 75 Years and over | 52 (10.5%) | 12 (1.5%) |
Disability Class: Cognitive Difficulty
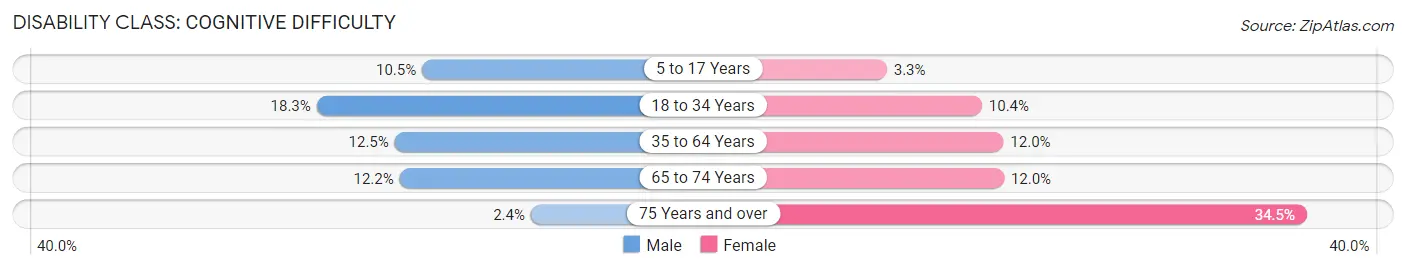
| Age Bracket | Male | Female |
| 5 to 17 Years | 168 (10.5%) | 56 (3.3%) |
| 18 to 34 Years | 299 (18.3%) | 181 (10.4%) |
| 35 to 64 Years | 353 (12.5%) | 401 (12.0%) |
| 65 to 74 Years | 117 (12.2%) | 135 (12.0%) |
| 75 Years and over | 12 (2.4%) | 282 (34.5%) |
Disability Class: Ambulatory Difficulty
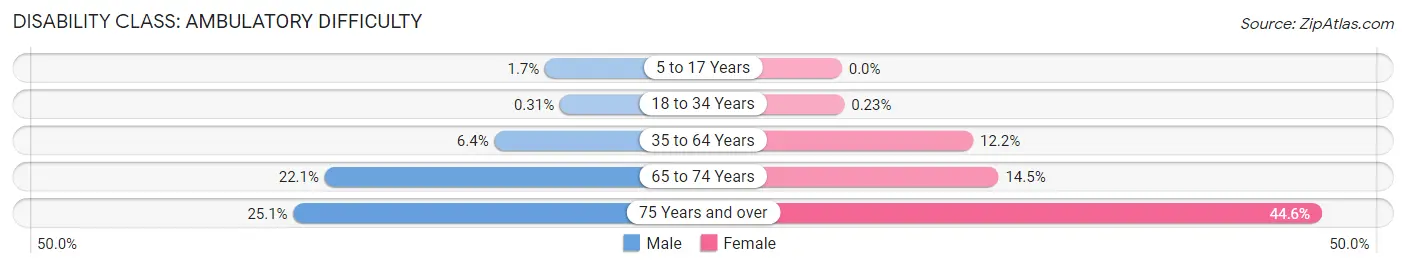
| Age Bracket | Male | Female |
| 5 to 17 Years | 27 (1.7%) | 0 (0.0%) |
| 18 to 34 Years | 5 (0.3%) | 4 (0.2%) |
| 35 to 64 Years | 180 (6.4%) | 407 (12.2%) |
| 65 to 74 Years | 213 (22.1%) | 163 (14.5%) |
| 75 Years and over | 124 (25.1%) | 364 (44.6%) |
Disability Class: Self-Care Difficulty
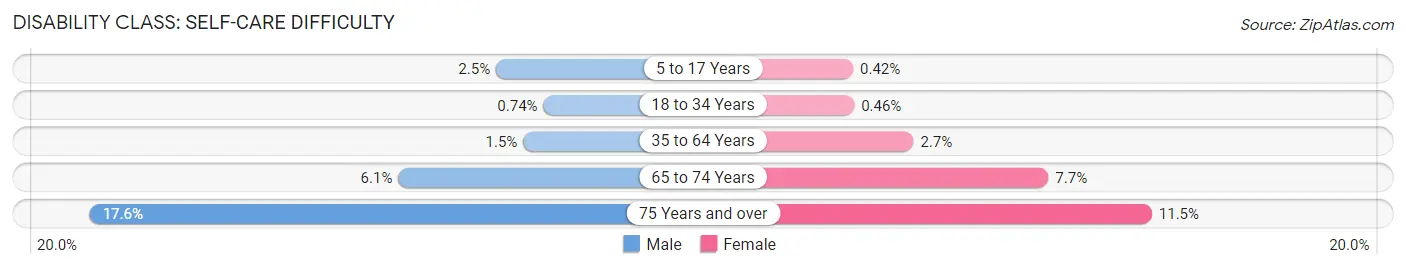
| Age Bracket | Male | Female |
| 5 to 17 Years | 40 (2.5%) | 7 (0.4%) |
| 18 to 34 Years | 12 (0.7%) | 8 (0.5%) |
| 35 to 64 Years | 42 (1.5%) | 89 (2.7%) |
| 65 to 74 Years | 59 (6.1%) | 86 (7.7%) |
| 75 Years and over | 87 (17.6%) | 94 (11.5%) |
Technology Access in Concordia Parish
Computing Device Access in Concordia Parish
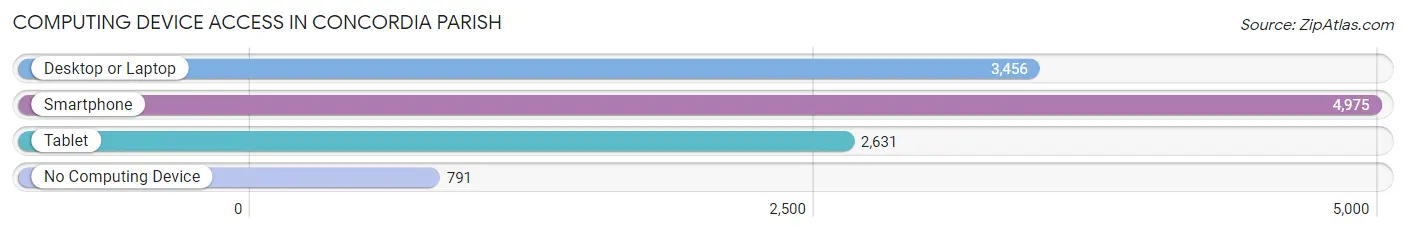
| Device Type | # Households | % Households |
| Desktop or Laptop | 3,456 | 54.8% |
| Smartphone | 4,975 | 78.9% |
| Tablet | 2,631 | 41.7% |
| No Computing Device | 791 | 12.6% |
| Total | 6,302 | 100.0% |
Internet Access in Concordia Parish
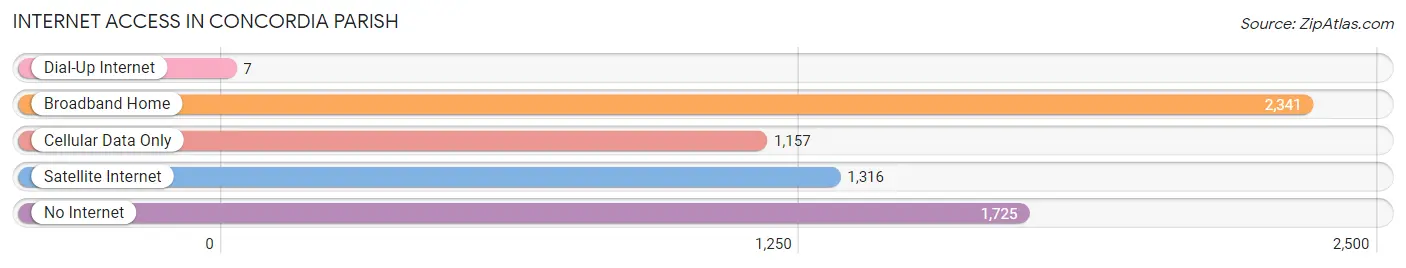
| Internet Type | # Households | % Households |
| Dial-Up Internet | 7 | 0.1% |
| Broadband Home | 2,341 | 37.1% |
| Cellular Data Only | 1,157 | 18.4% |
| Satellite Internet | 1,316 | 20.9% |
| No Internet | 1,725 | 27.4% |
| Total | 6,302 | 100.0% |
Concordia Parish Summary
Concordia Parish is a parish located in the northeastern corner of the state of Louisiana. It is bordered by the Mississippi River to the east, the Tensas River to the south, and the Ouachita River to the west. The parish seat is Ferriday, and the largest city is Vidalia. The parish was created in 1807 and named for the Roman goddess of harmony, Concordia.
Geography
Concordia Parish is located in the northeastern corner of Louisiana, and is bordered by the Mississippi River to the east, the Tensas River to the south, and the Ouachita River to the west. The parish has a total area of 845 square miles, of which 830 square miles is land and 15 square miles is water. The terrain is mostly flat, with some rolling hills in the northern part of the parish. The highest point in the parish is located in the northern part of the parish, at an elevation of about 200 feet.
The parish is divided into two distinct regions: the Delta region in the south and the uplands in the north. The Delta region is characterized by flat, alluvial soils and is home to the majority of the parish’s population. The uplands region is characterized by rolling hills and is home to the majority of the parish’s timberland.
The parish is home to several bodies of water, including the Mississippi River, the Tensas River, the Ouachita River, Lake Concordia, and Lake St. Joseph.
Demographics
As of the 2010 census, the population of Concordia Parish was 20,822. The racial makeup of the parish was 57.3% White, 40.2% African American, 0.3% Native American, 0.3% Asian, 0.2% from other races, and 1.9% from two or more races. Hispanic or Latino of any race were 1.3% of the population.
The median income for a household in the parish was $30,945, and the median income for a family was $37,945. The per capita income for the parish was $15,945. About 22.2% of families and 25.7% of the population were below the poverty line, including 36.2% of those under age 18 and 18.2% of those age 65 or over.
Economy
The economy of Concordia Parish is largely based on agriculture and timber. The parish is home to several large timber companies, including Weyerhaeuser, International Paper, and Georgia-Pacific. Agriculture is also an important part of the economy, with the main crops being cotton, soybeans, corn, and wheat.
The parish is also home to several manufacturing companies, including a paper mill, a furniture factory, and a plastics plant. The parish is also home to several oil and gas companies, as well as several chemical plants.
The parish is home to several tourist attractions, including the Natchez Trace Parkway, the Ferriday Museum, and the Concordia Parish Museum. The parish is also home to several festivals, including the Vidalia Onion Festival and the Ferriday Catfish Festival.
Conclusion
Concordia Parish is a rural parish located in the northeastern corner of Louisiana. It is bordered by the Mississippi River to the east, the Tensas River to the south, and the Ouachita River to the west. The parish has a total area of 845 square miles, and is divided into two distinct regions: the Delta region in the south and the uplands in the north. The population of the parish was 20,822 as of the 2010 census. The economy of the parish is largely based on agriculture and timber, and the parish is home to several tourist attractions and festivals.
Common Questions
What is the Total Population of Concordia Parish?
Total Population of Concordia Parish is 18,677.
What is the Total Male Population of Concordia Parish?
Total Male Population of Concordia Parish is 9,298.
What is the Total Female Population of Concordia Parish?
Total Female Population of Concordia Parish is 9,379.
What is the Ratio of Males per 100 Females in Concordia Parish?
There are 99.14 Males per 100 Females in Concordia Parish.
What is the Ratio of Females per 100 Males in Concordia Parish?
There are 100.87 Females per 100 Males in Concordia Parish.
What is the Median Population Age in Concordia Parish?
Median Population Age in Concordia Parish is 37.8 Years.
What is the Average Family Size in Concordia Parish
Average Family Size in Concordia Parish is 3.6 People.
What is the Average Household Size in Concordia Parish
Average Household Size in Concordia Parish is 2.8 People.
What is Per Capita Income in Concordia Parish?
Per Capita income in Concordia Parish is $21,941.
What is the Median Family Income in Concordia Parish?
Median Family Income in Concordia Parish is $53,260.
What is the Median Household income in Concordia Parish?
Median Household Income in Concordia Parish is $38,929.
What is Income or Wage Gap in Concordia Parish?
Income or Wage Gap in Concordia Parish is 39.0%.
Women in Concordia Parish earn 61.0 cents for every dollar earned by a man.
What is Family Income Deficit in Concordia Parish?
Family Income Deficit in Concordia Parish is $11,895.
Families that are below poverty line in Concordia Parish earn $11,895 less on average than the poverty threshold level.
What is Inequality or Gini Index in Concordia Parish?
Inequality or Gini Index in Concordia Parish is 0.49.
How Large is the Labor Force in Concordia Parish?
There are 6,196 People in the Labor Forcein in Concordia Parish.
What is the Percentage of People in the Labor Force in Concordia Parish?
41.7% of People are in the Labor Force in Concordia Parish.
What is the Unemployment Rate in Concordia Parish?
Unemployment Rate in Concordia Parish is 12.0%.