Catahoula Parish, LA
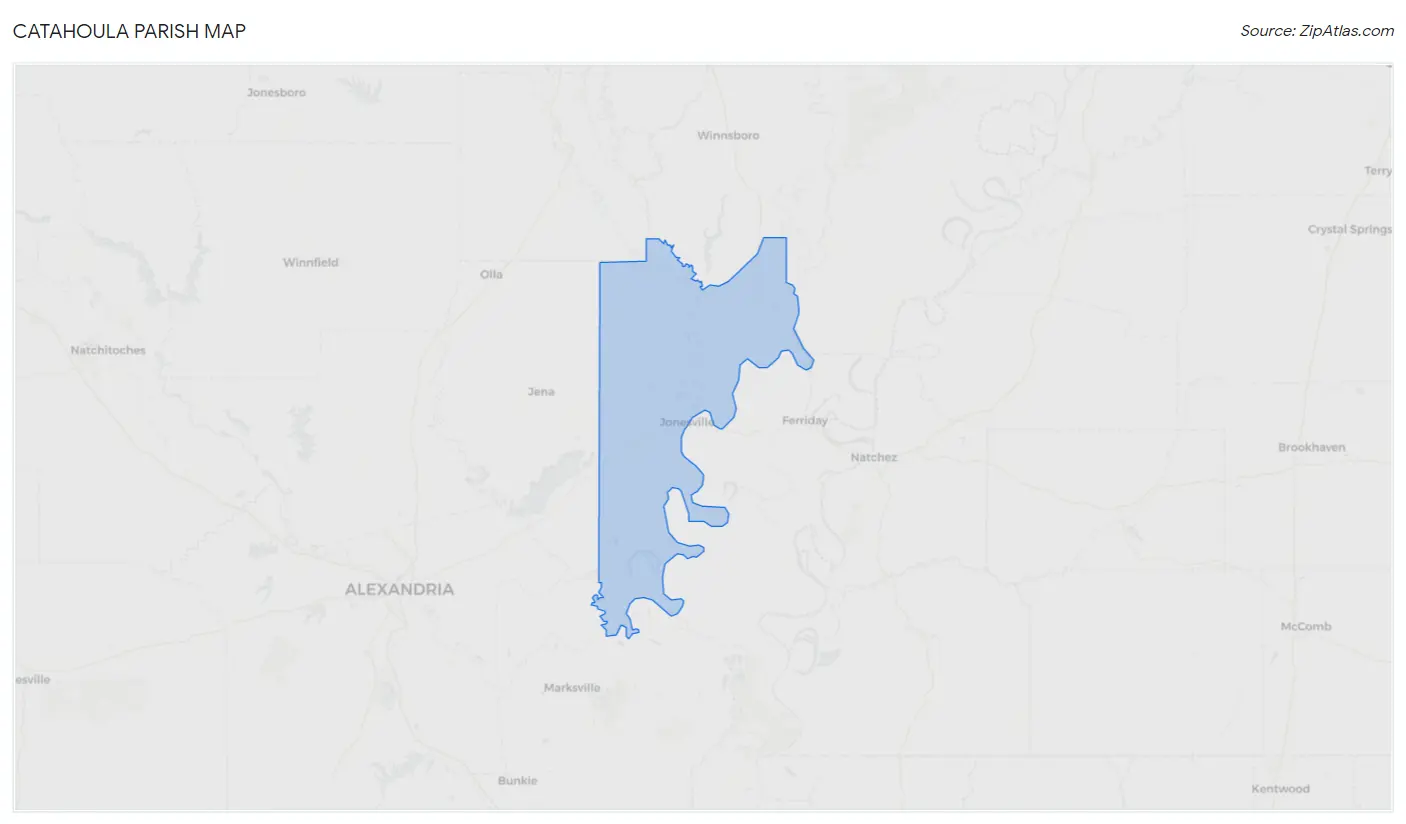
Catahoula Parish Map
Catahoula Parish Overview
8,895
TOTAL POPULATION
4,655
MALE POPULATION
4,240
FEMALE POPULATION
109.79
MALES / 100 FEMALES
91.08
FEMALES / 100 MALES
38.8
MEDIAN AGE
3.0
AVG FAMILY SIZE
2.5
AVG HOUSEHOLD SIZE
$24,910
PER CAPITA INCOME
$63,792
AVG FAMILY INCOME
$48,259
AVG HOUSEHOLD INCOME
28.3%
WAGE / INCOME GAP [ % ]
71.7¢/ $1
WAGE / INCOME GAP [ $ ]
0.46
INEQUALITY / GINI INDEX
3,132
LABOR FORCE [ PEOPLE ]
43.6%
PERCENT IN LABOR FORCE
6.5%
UNEMPLOYMENT RATE
Catahoula Parish Area Codes
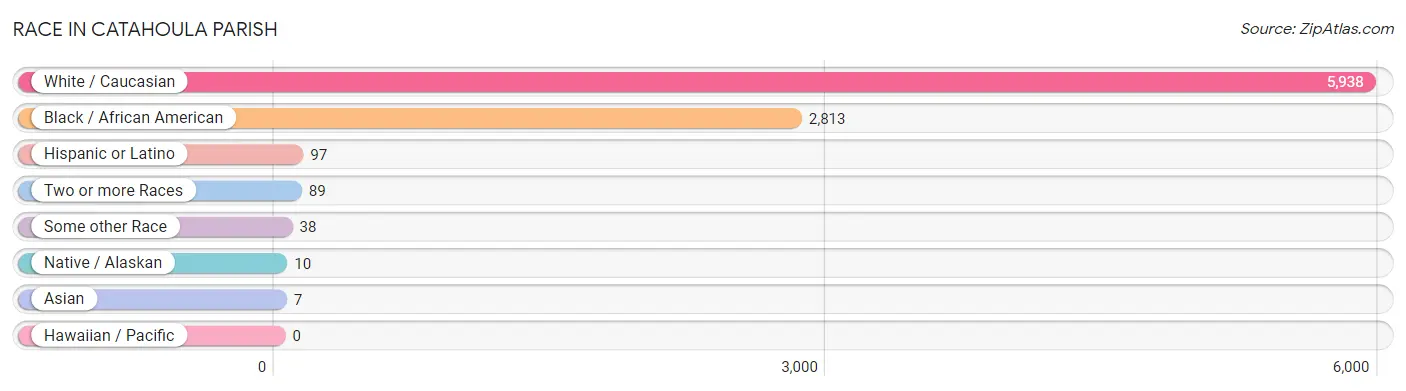
Race in Catahoula Parish
The most populous races in Catahoula Parish are White / Caucasian (5,938 | 66.8%), Black / African American (2,813 | 31.6%), and Hispanic or Latino (97 | 1.1%).
| Race | # Population | % Population |
| Asian | 7 | 0.1% |
| Black / African American | 2,813 | 31.6% |
| Hawaiian / Pacific | 0 | 0.0% |
| Hispanic or Latino | 97 | 1.1% |
| Native / Alaskan | 10 | 0.1% |
| White / Caucasian | 5,938 | 66.8% |
| Two or more Races | 89 | 1.0% |
| Some other Race | 38 | 0.4% |
| Total | 8,895 | 100.0% |
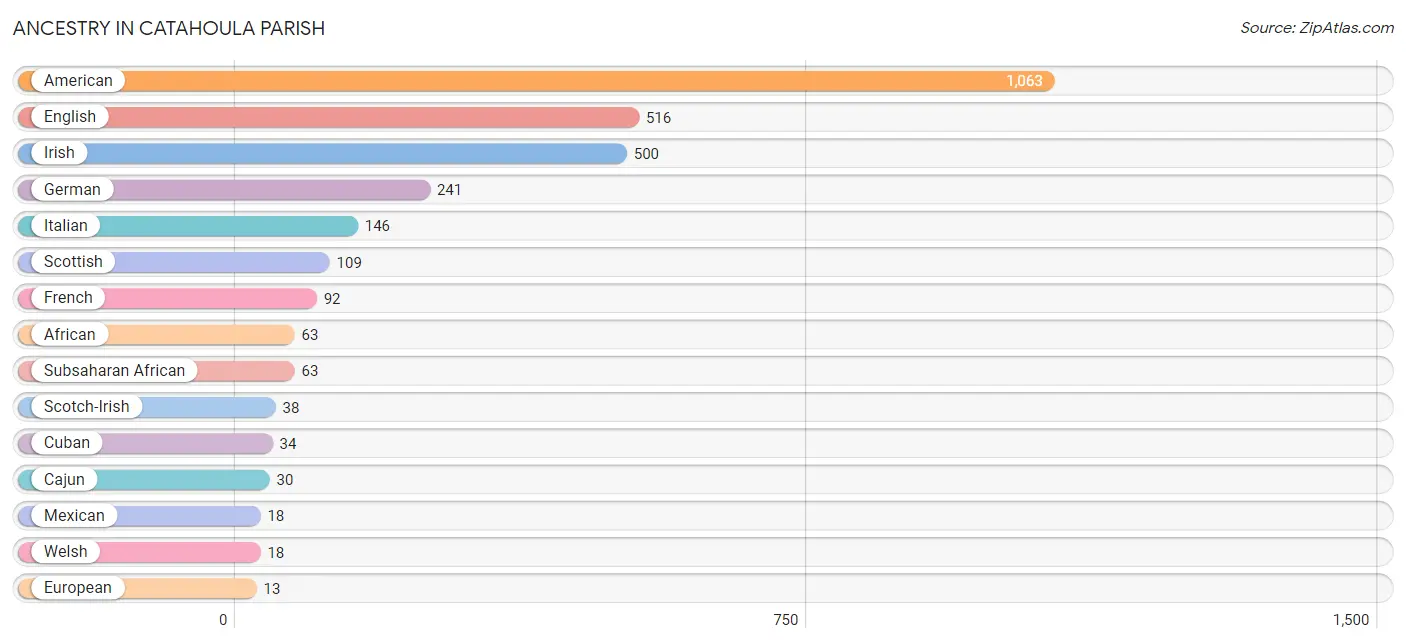
Ancestry in Catahoula Parish
The most populous ancestries reported in Catahoula Parish are American (1,063 | 11.9%), English (516 | 5.8%), Irish (500 | 5.6%), German (241 | 2.7%), and Italian (146 | 1.6%), together accounting for 27.7% of all Catahoula Parish residents.
| Ancestry | # Population | % Population |
| African | 63 | 0.7% |
| American | 1,063 | 11.9% |
| British | 7 | 0.1% |
| Cajun | 30 | 0.3% |
| Central American | 10 | 0.1% |
| Colombian | 9 | 0.1% |
| Cuban | 34 | 0.4% |
| Dutch | 8 | 0.1% |
| English | 516 | 5.8% |
| European | 13 | 0.2% |
| French | 92 | 1.0% |
| French Canadian | 10 | 0.1% |
| German | 241 | 2.7% |
| Honduran | 10 | 0.1% |
| Irish | 500 | 5.6% |
| Italian | 146 | 1.6% |
| Korean | 7 | 0.1% |
| Mexican | 18 | 0.2% |
| Navajo | 5 | 0.1% |
| Norwegian | 5 | 0.1% |
| Puerto Rican | 10 | 0.1% |
| Scotch-Irish | 38 | 0.4% |
| Scottish | 109 | 1.2% |
| South American | 9 | 0.1% |
| Spanish | 9 | 0.1% |
| Subsaharan African | 63 | 0.7% |
| Welsh | 18 | 0.2% | View All 27 Rows |
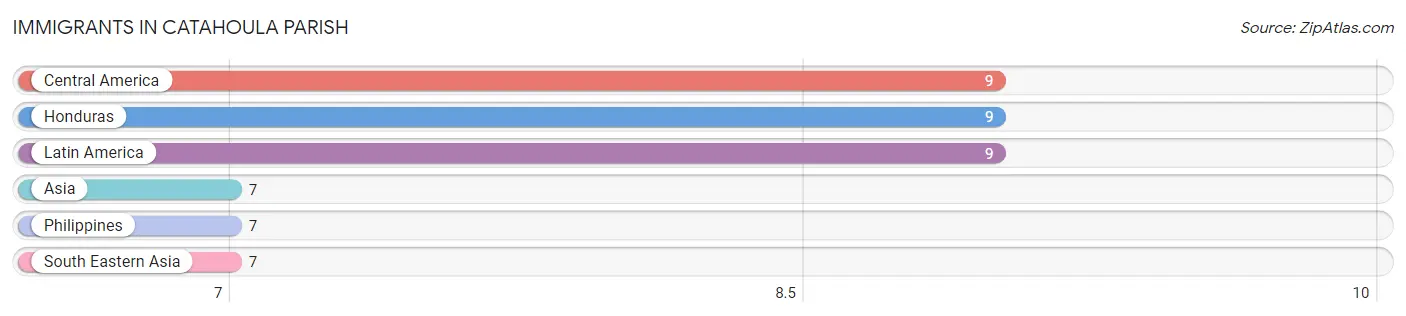
Immigrants in Catahoula Parish
The most numerous immigrant groups reported in Catahoula Parish came from Central America (9 | 0.1%), Honduras (9 | 0.1%), Latin America (9 | 0.1%), Asia (7 | 0.1%), and Philippines (7 | 0.1%), together accounting for 0.5% of all Catahoula Parish residents.
| Immigration Origin | # Population | % Population |
| Asia | 7 | 0.1% |
| Central America | 9 | 0.1% |
| Honduras | 9 | 0.1% |
| Latin America | 9 | 0.1% |
| Philippines | 7 | 0.1% |
| South Eastern Asia | 7 | 0.1% | View All 6 Rows |
Sex and Age in Catahoula Parish
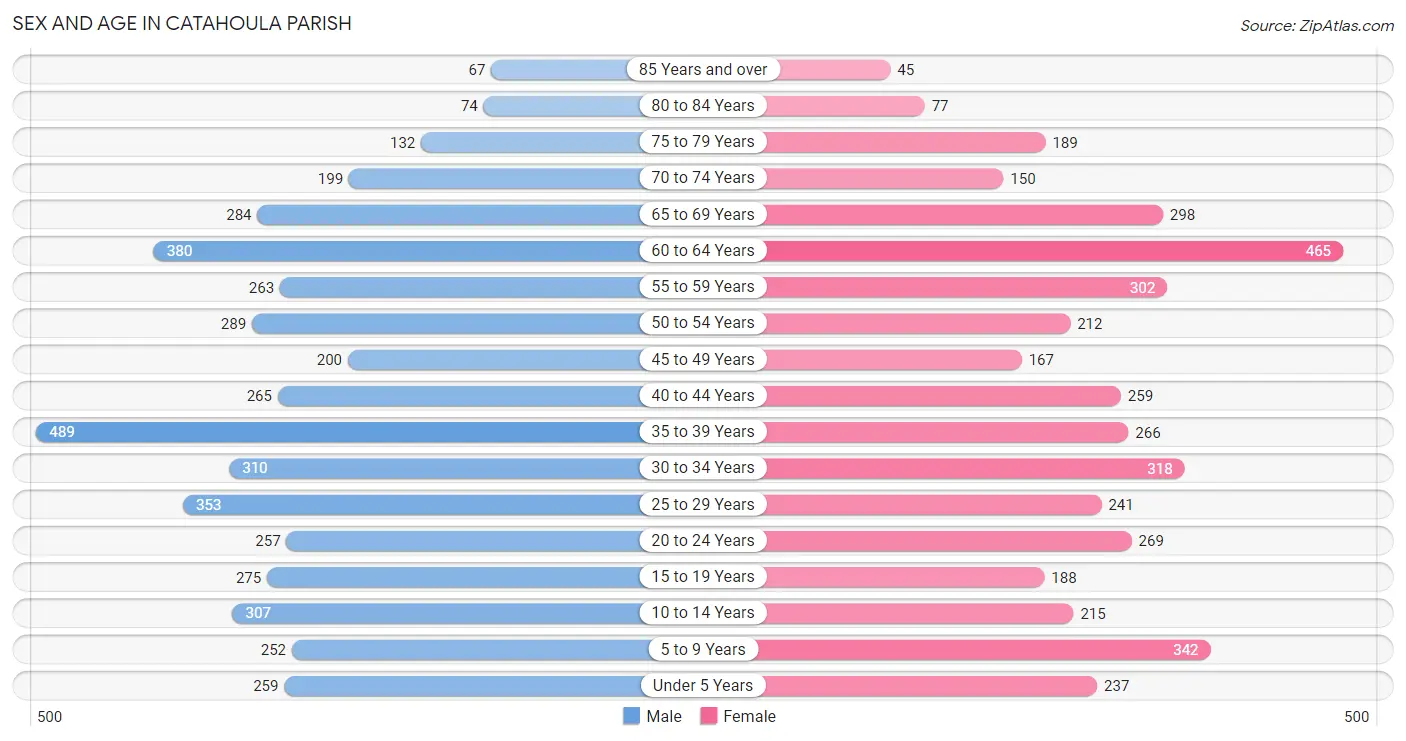
Sex and Age in Catahoula Parish
The most populous age groups in Catahoula Parish are 35 to 39 Years (489 | 10.5%) for men and 60 to 64 Years (465 | 11.0%) for women.
| Age Bracket | Male | Female |
| Under 5 Years | 259 (5.6%) | 237 (5.6%) |
| 5 to 9 Years | 252 (5.4%) | 342 (8.1%) |
| 10 to 14 Years | 307 (6.6%) | 215 (5.1%) |
| 15 to 19 Years | 275 (5.9%) | 188 (4.4%) |
| 20 to 24 Years | 257 (5.5%) | 269 (6.3%) |
| 25 to 29 Years | 353 (7.6%) | 241 (5.7%) |
| 30 to 34 Years | 310 (6.7%) | 318 (7.5%) |
| 35 to 39 Years | 489 (10.5%) | 266 (6.3%) |
| 40 to 44 Years | 265 (5.7%) | 259 (6.1%) |
| 45 to 49 Years | 200 (4.3%) | 167 (3.9%) |
| 50 to 54 Years | 289 (6.2%) | 212 (5.0%) |
| 55 to 59 Years | 263 (5.7%) | 302 (7.1%) |
| 60 to 64 Years | 380 (8.2%) | 465 (11.0%) |
| 65 to 69 Years | 284 (6.1%) | 298 (7.0%) |
| 70 to 74 Years | 199 (4.3%) | 150 (3.5%) |
| 75 to 79 Years | 132 (2.8%) | 189 (4.5%) |
| 80 to 84 Years | 74 (1.6%) | 77 (1.8%) |
| 85 Years and over | 67 (1.4%) | 45 (1.1%) |
| Total | 4,655 (100.0%) | 4,240 (100.0%) |
Families and Households in Catahoula Parish
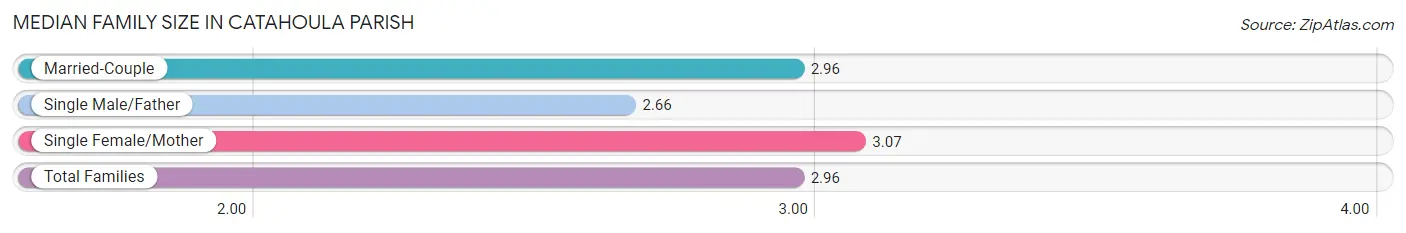
Median Family Size in Catahoula Parish
The median family size in Catahoula Parish is 2.96 persons per family, with single female/mother families (459 | 20.7%) accounting for the largest median family size of 3.07 persons per family. On the other hand, single male/father families (153 | 6.9%) represent the smallest median family size with 2.66 persons per family.
| Family Type | # Families | Family Size |
| Married-Couple | 1,609 (72.4%) | 2.96 |
| Single Male/Father | 153 (6.9%) | 2.66 |
| Single Female/Mother | 459 (20.7%) | 3.07 |
| Total Families | 2,221 (100.0%) | 2.96 |
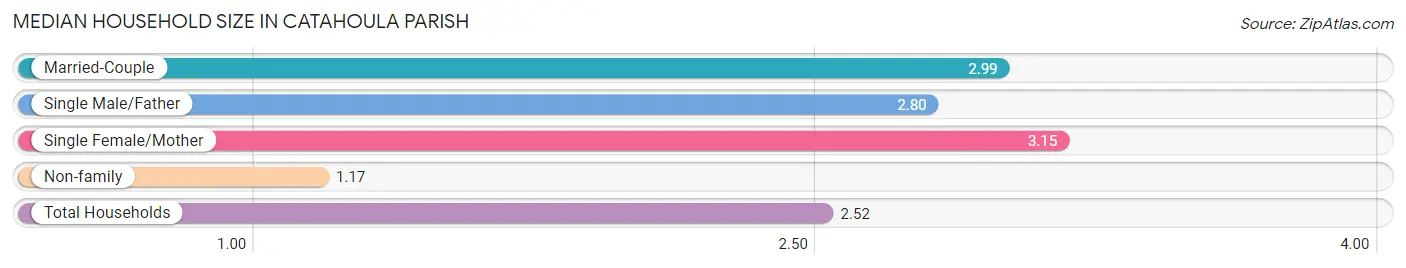
Median Household Size in Catahoula Parish
The median household size in Catahoula Parish is 2.52 persons per household, with single female/mother households (459 | 15.1%) accounting for the largest median household size of 3.15 persons per household. non-family households (809 | 26.7%) represent the smallest median household size with 1.17 persons per household.
| Household Type | # Households | Household Size |
| Married-Couple | 1,609 (53.1%) | 2.99 |
| Single Male/Father | 153 (5.1%) | 2.80 |
| Single Female/Mother | 459 (15.1%) | 3.15 |
| Non-family | 809 (26.7%) | 1.17 |
| Total Households | 3,030 (100.0%) | 2.52 |
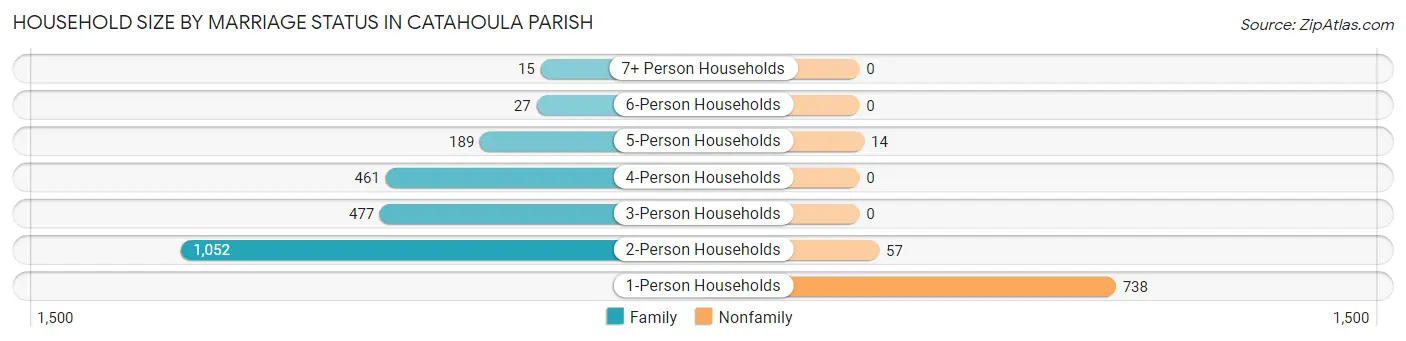
Household Size by Marriage Status in Catahoula Parish
Out of a total of 3,030 households in Catahoula Parish, 2,221 (73.3%) are family households, while 809 (26.7%) are nonfamily households. The most numerous type of family households are 2-person households, comprising 1,052, and the most common type of nonfamily households are 1-person households, comprising 738.
| Household Size | Family Households | Nonfamily Households |
| 1-Person Households | - | 738 (24.4%) |
| 2-Person Households | 1,052 (34.7%) | 57 (1.9%) |
| 3-Person Households | 477 (15.7%) | 0 (0.0%) |
| 4-Person Households | 461 (15.2%) | 0 (0.0%) |
| 5-Person Households | 189 (6.2%) | 14 (0.5%) |
| 6-Person Households | 27 (0.9%) | 0 (0.0%) |
| 7+ Person Households | 15 (0.5%) | 0 (0.0%) |
| Total | 2,221 (73.3%) | 809 (26.7%) |
Female Fertility in Catahoula Parish
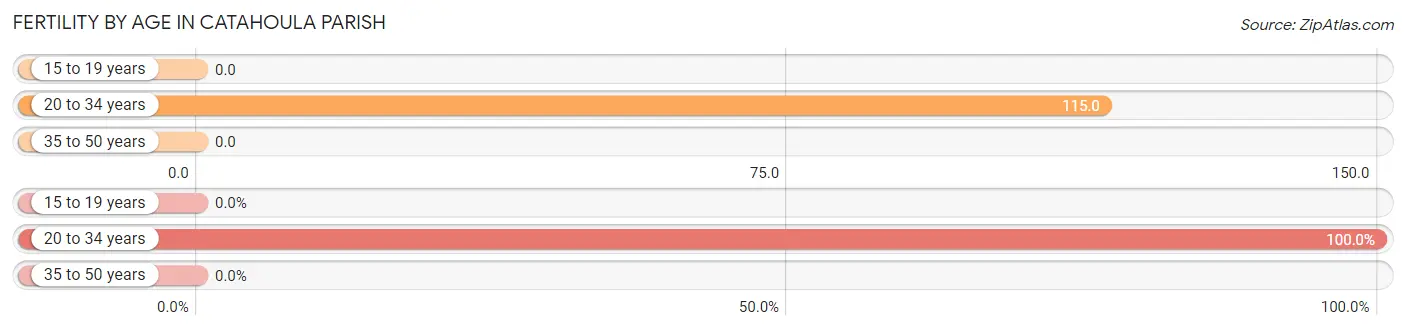
Fertility by Age in Catahoula Parish
Average fertility rate in Catahoula Parish is 56.0 births per 1,000 women. Women in the age bracket of 20 to 34 years have the highest fertility rate with 115.0 births per 1,000 women. Women in the age bracket of 20 to 34 years acount for 100.0% of all women with births.
| Age Bracket | Women with Births | Births / 1,000 Women |
| 15 to 19 years | 0 (0.0%) | 0.0 |
| 20 to 34 years | 95 (100.0%) | 115.0 |
| 35 to 50 years | 0 (0.0%) | 0.0 |
| Total | 95 (100.0%) | 56.0 |
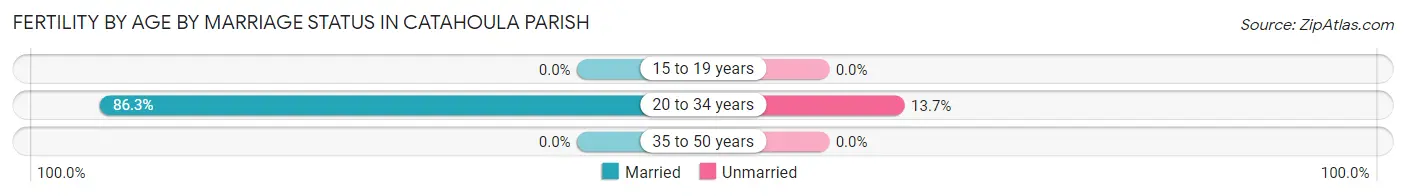
Fertility by Age by Marriage Status in Catahoula Parish
86.3% of women with births (95) in Catahoula Parish are married. The highest percentage of unmarried women with births falls into 20 to 34 years age bracket with 13.7% of them unmarried at the time of birth, while the lowest percentage of unmarried women with births belong to 20 to 34 years age bracket with 13.7% of them unmarried.
| Age Bracket | Married | Unmarried |
| 15 to 19 years | 0 (0.0%) | 0 (0.0%) |
| 20 to 34 years | 82 (86.3%) | 13 (13.7%) |
| 35 to 50 years | 0 (0.0%) | 0 (0.0%) |
| Total | 82 (86.3%) | 13 (13.7%) |
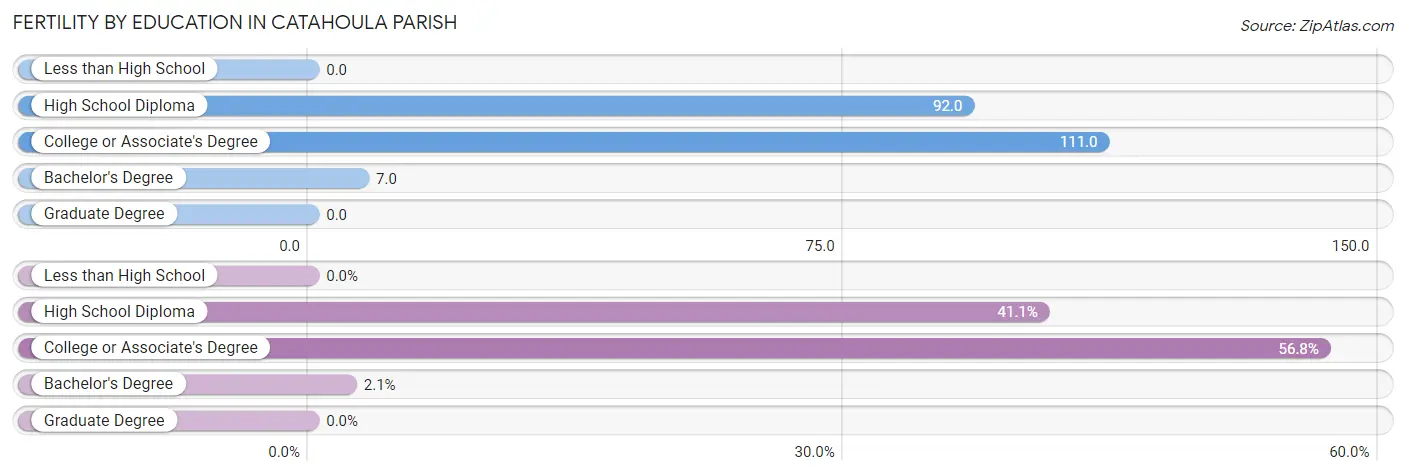
Fertility by Education in Catahoula Parish
| Educational Attainment | Women with Births | Births / 1,000 Women |
| Less than High School | 0 (0.0%) | 0.0 |
| High School Diploma | 39 (41.0%) | 92.0 |
| College or Associate's Degree | 54 (56.8%) | 111.0 |
| Bachelor's Degree | 2 (2.1%) | 7.0 |
| Graduate Degree | 0 (0.0%) | 0.0 |
| Total | 95 (100.0%) | 56.0 |
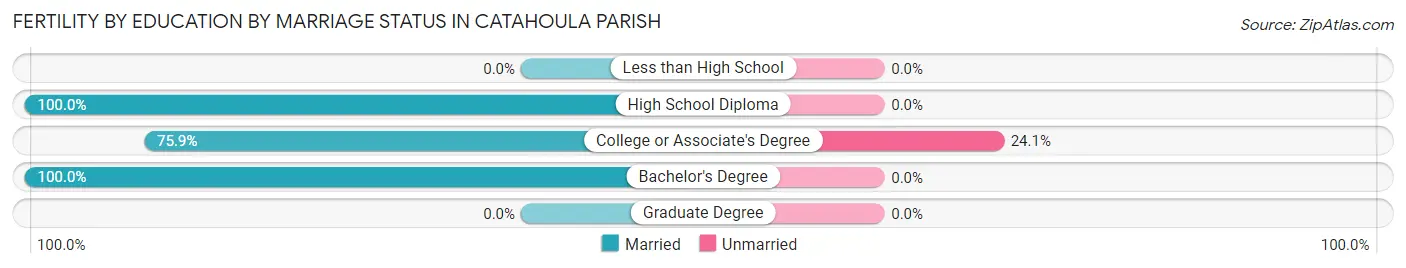
Fertility by Education by Marriage Status in Catahoula Parish
13.7% of women with births in Catahoula Parish are unmarried. Women with the educational attainment of high school diploma are most likely to be married with 100.0% of them married at childbirth, while women with the educational attainment of college or associate's degree are least likely to be married with 24.1% of them unmarried at childbirth.
| Educational Attainment | Married | Unmarried |
| Less than High School | 0 (0.0%) | 0 (0.0%) |
| High School Diploma | 39 (100.0%) | 0 (0.0%) |
| College or Associate's Degree | 41 (75.9%) | 13 (24.1%) |
| Bachelor's Degree | 2 (100.0%) | 0 (0.0%) |
| Graduate Degree | 0 (0.0%) | 0 (0.0%) |
| Total | 82 (86.3%) | 13 (13.7%) |
Income in Catahoula Parish
Income Overview in Catahoula Parish
Per Capita Income in Catahoula Parish is $24,910, while median incomes of families and households are $63,792 and $48,259 respectively.
| Characteristic | Number | Measure |
| Per Capita Income | 8,895 | $24,910 |
| Median Family Income | 2,221 | $63,792 |
| Mean Family Income | 2,221 | $75,738 |
| Median Household Income | 3,030 | $48,259 |
| Mean Household Income | 3,030 | $66,583 |
| Income Deficit | 2,221 | $0 |
| Wage / Income Gap (%) | 8,895 | 28.29% |
| Wage / Income Gap ($) | 8,895 | 71.71¢ per $1 |
| Gini / Inequality Index | 8,895 | 0.46 |
Earnings by Sex in Catahoula Parish
Average Earnings in Catahoula Parish are $32,614, $40,016 for men and $28,694 for women, a difference of 28.3%.
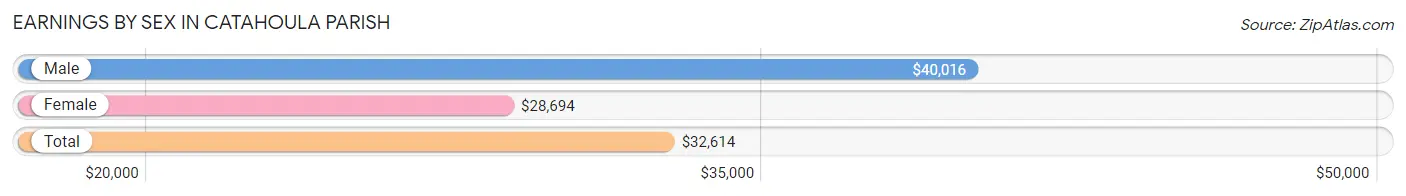
| Sex | Number | Average Earnings |
| Male | 1,968 (52.5%) | $40,016 |
| Female | 1,777 (47.4%) | $28,694 |
| Total | 3,745 (100.0%) | $32,614 |
Earnings by Sex by Income Bracket in Catahoula Parish
The most common earnings brackets in Catahoula Parish are $100,000+ for men (283 | 14.4%) and $30,000 to $34,999 for women (170 | 9.6%).
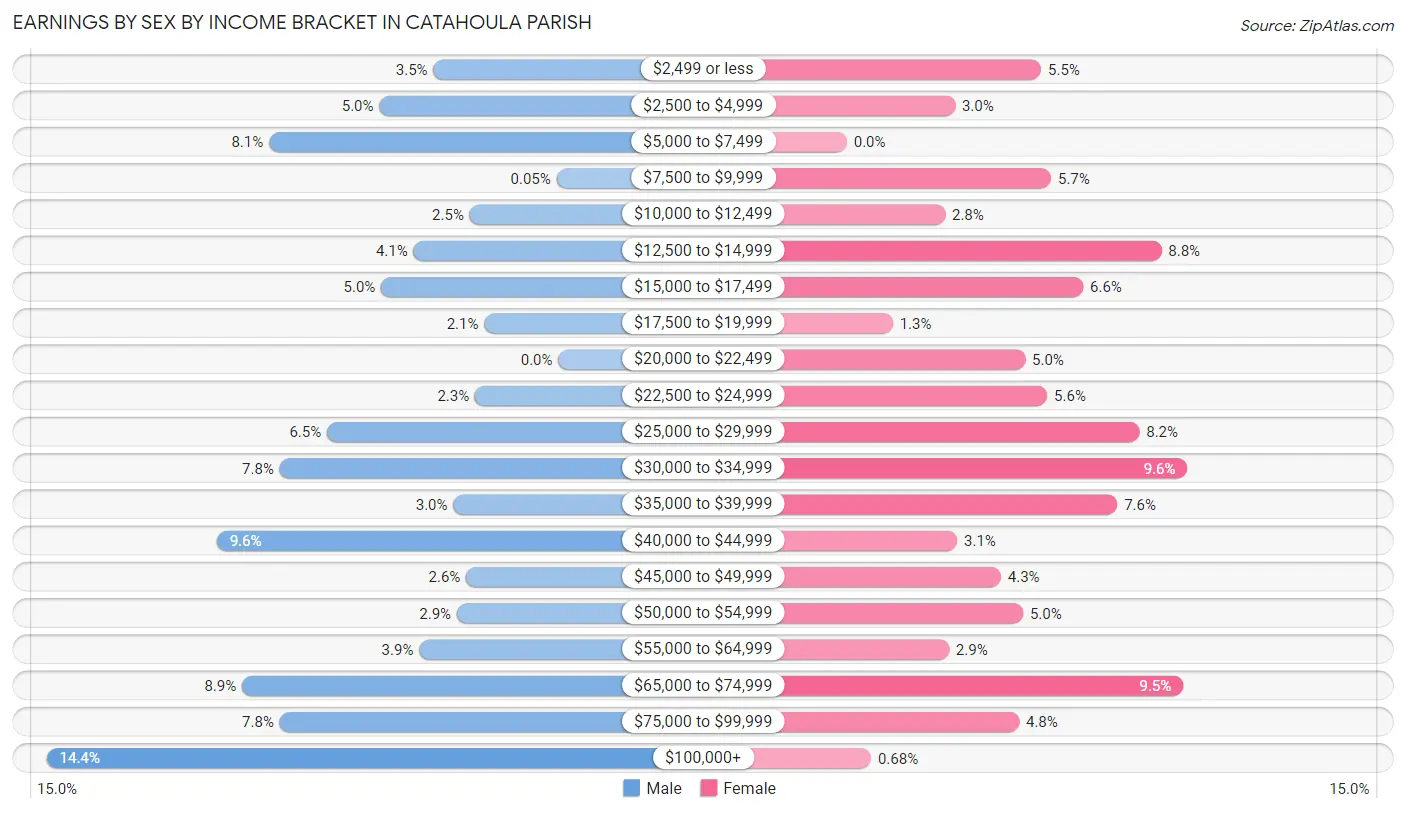
| Income | Male | Female |
| $2,499 or less | 69 (3.5%) | 97 (5.5%) |
| $2,500 to $4,999 | 99 (5.0%) | 54 (3.0%) |
| $5,000 to $7,499 | 160 (8.1%) | 0 (0.0%) |
| $7,500 to $9,999 | 1 (0.1%) | 102 (5.7%) |
| $10,000 to $12,499 | 49 (2.5%) | 49 (2.8%) |
| $12,500 to $14,999 | 80 (4.1%) | 157 (8.8%) |
| $15,000 to $17,499 | 98 (5.0%) | 118 (6.6%) |
| $17,500 to $19,999 | 41 (2.1%) | 23 (1.3%) |
| $20,000 to $22,499 | 0 (0.0%) | 89 (5.0%) |
| $22,500 to $24,999 | 46 (2.3%) | 100 (5.6%) |
| $25,000 to $29,999 | 128 (6.5%) | 146 (8.2%) |
| $30,000 to $34,999 | 154 (7.8%) | 170 (9.6%) |
| $35,000 to $39,999 | 58 (2.9%) | 135 (7.6%) |
| $40,000 to $44,999 | 189 (9.6%) | 55 (3.1%) |
| $45,000 to $49,999 | 51 (2.6%) | 77 (4.3%) |
| $50,000 to $54,999 | 56 (2.9%) | 88 (5.0%) |
| $55,000 to $64,999 | 77 (3.9%) | 51 (2.9%) |
| $65,000 to $74,999 | 175 (8.9%) | 168 (9.5%) |
| $75,000 to $99,999 | 154 (7.8%) | 86 (4.8%) |
| $100,000+ | 283 (14.4%) | 12 (0.7%) |
| Total | 1,968 (100.0%) | 1,777 (100.0%) |
Earnings by Sex by Educational Attainment in Catahoula Parish
Average earnings in Catahoula Parish are $42,075 for men and $31,667 for women, a difference of 24.7%. Men with an educational attainment of graduate degree enjoy the highest average annual earnings of $66,000, while those with less than high school education earn the least with $22,610. Women with an educational attainment of bachelor's degree earn the most with the average annual earnings of $52,011, while those with high school diploma education have the smallest earnings of $15,385.
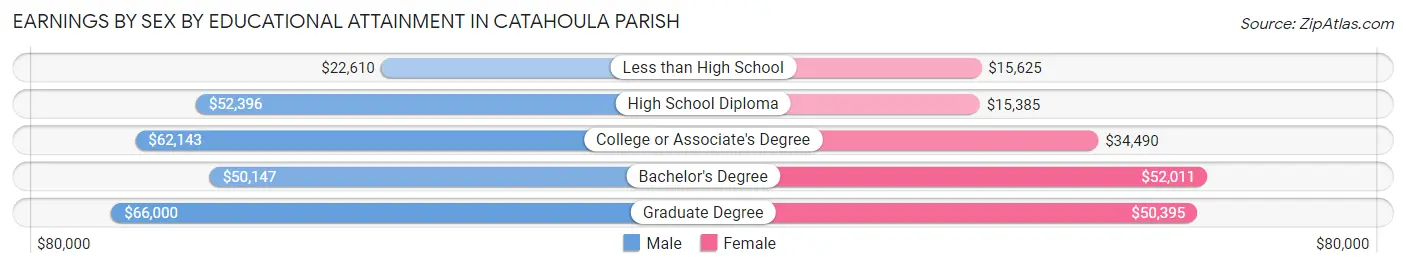
| Educational Attainment | Male Income | Female Income |
| Less than High School | $22,610 | $15,625 |
| High School Diploma | $52,396 | $15,385 |
| College or Associate's Degree | $62,143 | $34,490 |
| Bachelor's Degree | $50,147 | $52,011 |
| Graduate Degree | $66,000 | $50,395 |
| Total | $42,075 | $31,667 |
Family Income in Catahoula Parish
Family Income Brackets in Catahoula Parish
According to the Catahoula Parish family income data, there are 475 families falling into the $50,000 to $74,999 income range, which is the most common income bracket and makes up 21.4% of all families. Conversely, the $10,000 to $14,999 income bracket is the least frequent group with only 80 families (3.6%) belonging to this category.
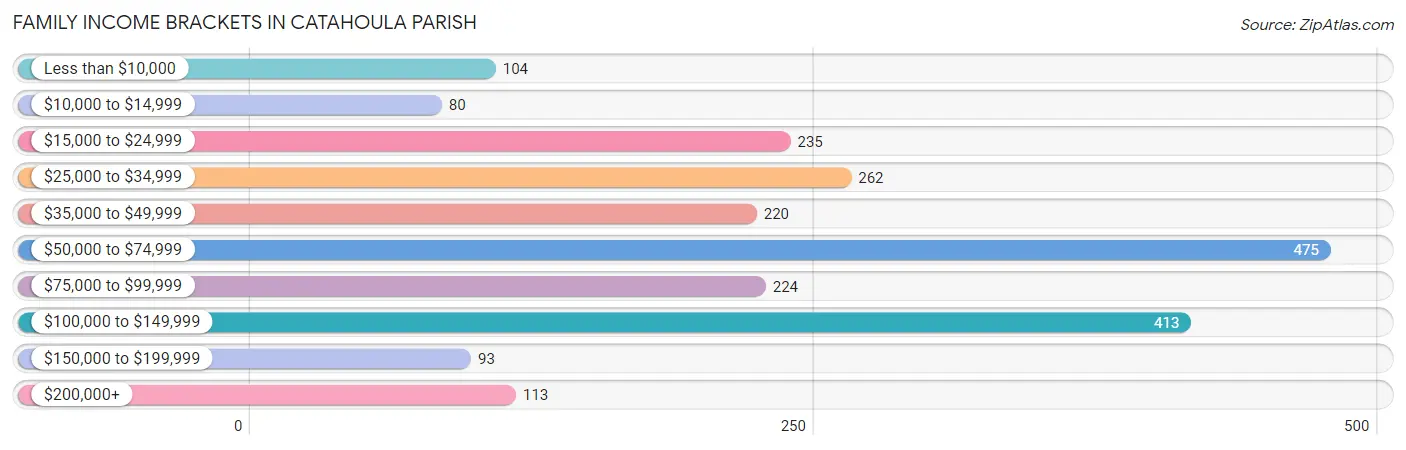
| Income Bracket | # Families | % Families |
| Less than $10,000 | 104 | 4.7% |
| $10,000 to $14,999 | 80 | 3.6% |
| $15,000 to $24,999 | 235 | 10.6% |
| $25,000 to $34,999 | 262 | 11.8% |
| $35,000 to $49,999 | 220 | 9.9% |
| $50,000 to $74,999 | 475 | 21.4% |
| $75,000 to $99,999 | 224 | 10.1% |
| $100,000 to $149,999 | 413 | 18.6% |
| $150,000 to $199,999 | 93 | 4.2% |
| $200,000+ | 113 | 5.1% |
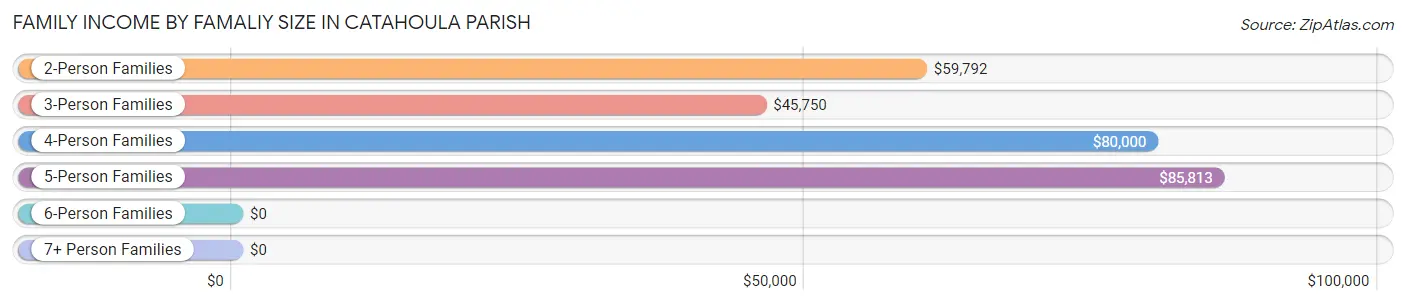
Family Income by Famaliy Size in Catahoula Parish
5-person families (203 | 9.1%) account for the highest median family income in Catahoula Parish with $85,813 per family, while 2-person families (1,115 | 50.2%) have the highest median income of $29,896 per family member.
| Income Bracket | # Families | Median Income |
| 2-Person Families | 1,115 (50.2%) | $59,792 |
| 3-Person Families | 455 (20.5%) | $45,750 |
| 4-Person Families | 420 (18.9%) | $80,000 |
| 5-Person Families | 203 (9.1%) | $85,813 |
| 6-Person Families | 13 (0.6%) | $0 |
| 7+ Person Families | 15 (0.7%) | $0 |
| Total | 2,221 (100.0%) | $63,792 |
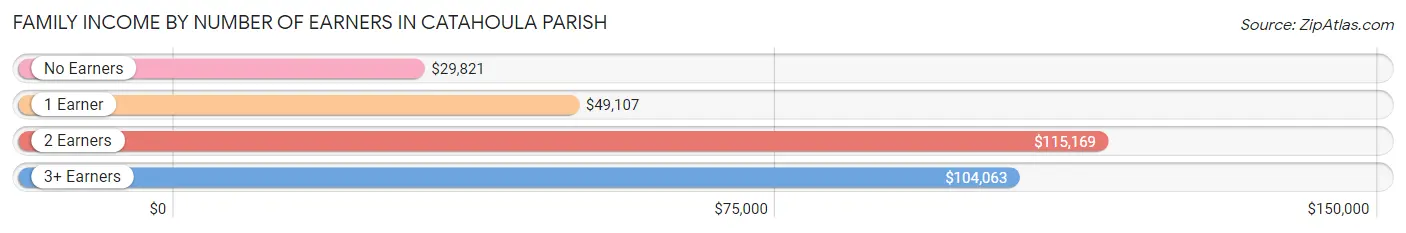
Family Income by Number of Earners in Catahoula Parish
The median family income in Catahoula Parish is $63,792, with families comprising 2 earners (635) having the highest median family income of $115,169, while families with no earners (460) have the lowest median family income of $29,821, accounting for 28.6% and 20.7% of families, respectively.
| Number of Earners | # Families | Median Income |
| No Earners | 460 (20.7%) | $29,821 |
| 1 Earner | 977 (44.0%) | $49,107 |
| 2 Earners | 635 (28.6%) | $115,169 |
| 3+ Earners | 149 (6.7%) | $104,063 |
| Total | 2,221 (100.0%) | $63,792 |
Household Income in Catahoula Parish
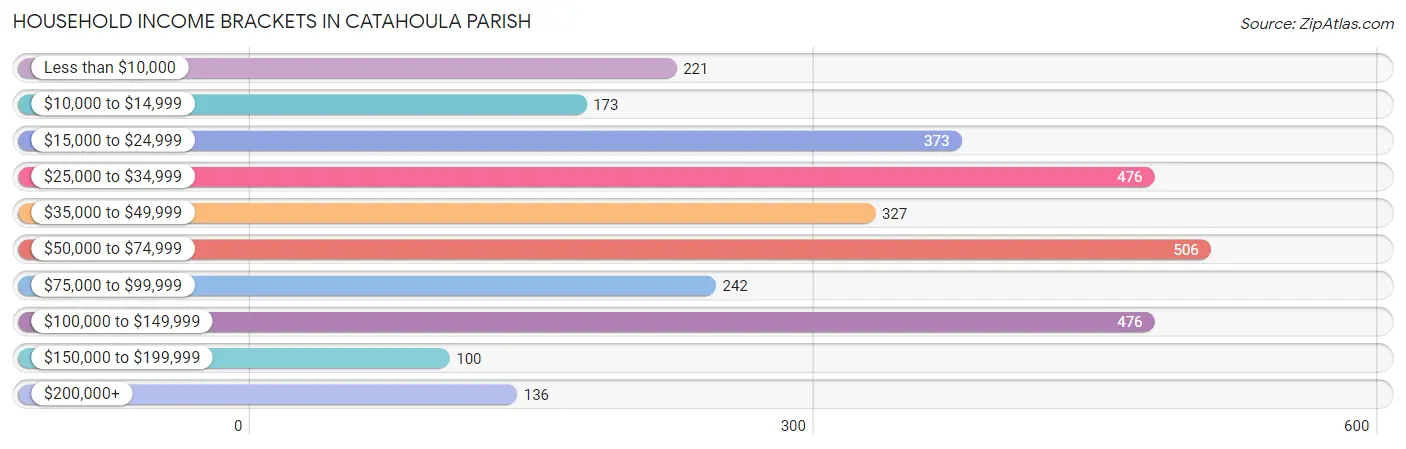
Household Income Brackets in Catahoula Parish
With 506 households falling in the category, the $50,000 to $74,999 income range is the most frequent in Catahoula Parish, accounting for 16.7% of all households. In contrast, only 100 households (3.3%) fall into the $150,000 to $199,999 income bracket, making it the least populous group.
| Income Bracket | # Households | % Households |
| Less than $10,000 | 221 | 7.3% |
| $10,000 to $14,999 | 173 | 5.7% |
| $15,000 to $24,999 | 373 | 12.3% |
| $25,000 to $34,999 | 476 | 15.7% |
| $35,000 to $49,999 | 327 | 10.8% |
| $50,000 to $74,999 | 506 | 16.7% |
| $75,000 to $99,999 | 242 | 8.0% |
| $100,000 to $149,999 | 476 | 15.7% |
| $150,000 to $199,999 | 100 | 3.3% |
| $200,000+ | 136 | 4.5% |
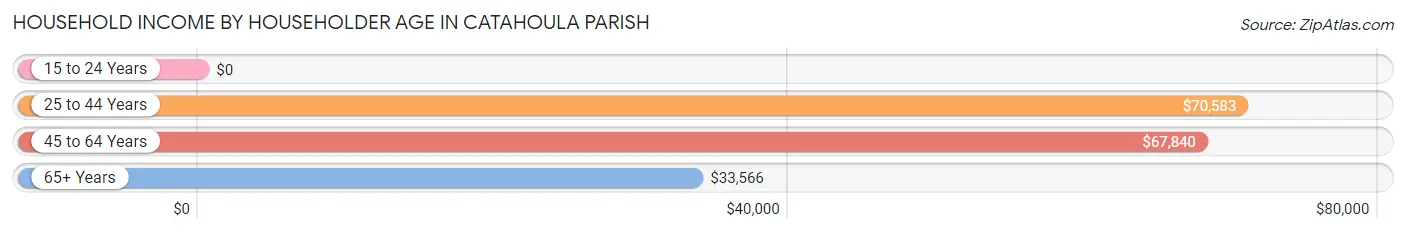
Household Income by Householder Age in Catahoula Parish
The median household income in Catahoula Parish is $48,259, with the highest median household income of $70,583 found in the 25 to 44 years age bracket for the primary householder. A total of 827 households (27.3%) fall into this category. Meanwhile, the 15 to 24 years age bracket for the primary householder has the lowest median household income of $0, with 141 households (4.6%) in this group.
| Income Bracket | # Households | Median Income |
| 15 to 24 Years | 141 (4.6%) | $0 |
| 25 to 44 Years | 827 (27.3%) | $70,583 |
| 45 to 64 Years | 1,093 (36.1%) | $67,840 |
| 65+ Years | 969 (32.0%) | $33,566 |
| Total | 3,030 (100.0%) | $48,259 |
Poverty in Catahoula Parish
Income Below Poverty by Sex and Age in Catahoula Parish
With 21.2% poverty level for males and 27.6% for females among the residents of Catahoula Parish, 15 year old males and under 5 year old females are the most vulnerable to poverty, with 28 males (100.0%) and 173 females (73.0%) in their respective age groups living below the poverty level.
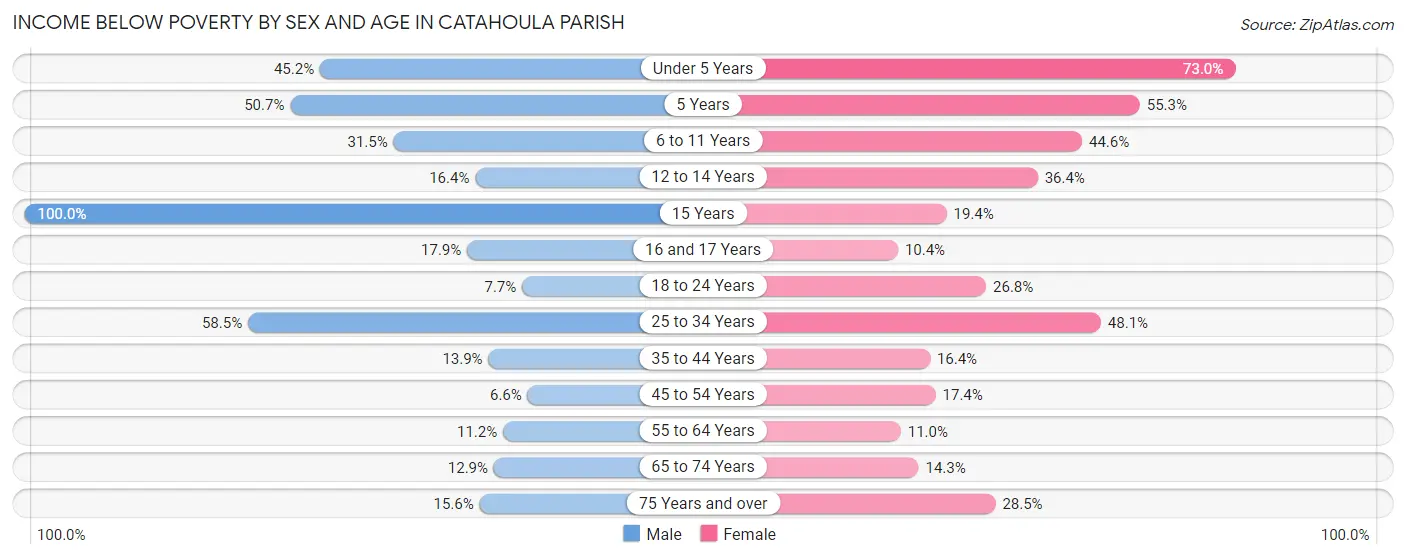
| Age Bracket | Male | Female |
| Under 5 Years | 117 (45.2%) | 173 (73.0%) |
| 5 Years | 73 (50.7%) | 26 (55.3%) |
| 6 to 11 Years | 58 (31.5%) | 165 (44.6%) |
| 12 to 14 Years | 35 (16.4%) | 44 (36.4%) |
| 15 Years | 28 (100.0%) | 14 (19.4%) |
| 16 and 17 Years | 25 (17.9%) | 10 (10.4%) |
| 18 to 24 Years | 16 (7.7%) | 75 (26.8%) |
| 25 to 34 Years | 144 (58.5%) | 253 (48.1%) |
| 35 to 44 Years | 61 (13.9%) | 80 (16.4%) |
| 45 to 54 Years | 24 (6.6%) | 66 (17.4%) |
| 55 to 64 Years | 62 (11.2%) | 84 (11.0%) |
| 65 to 74 Years | 61 (12.9%) | 62 (14.2%) |
| 75 Years and over | 40 (15.6%) | 77 (28.5%) |
| Total | 744 (21.2%) | 1,129 (27.6%) |
Income Above Poverty by Sex and Age in Catahoula Parish
According to the poverty statistics in Catahoula Parish, males aged 45 to 54 years and females aged 16 and 17 years are the age groups that are most secure financially, with 93.4% of males and 89.6% of females in these age groups living above the poverty line.
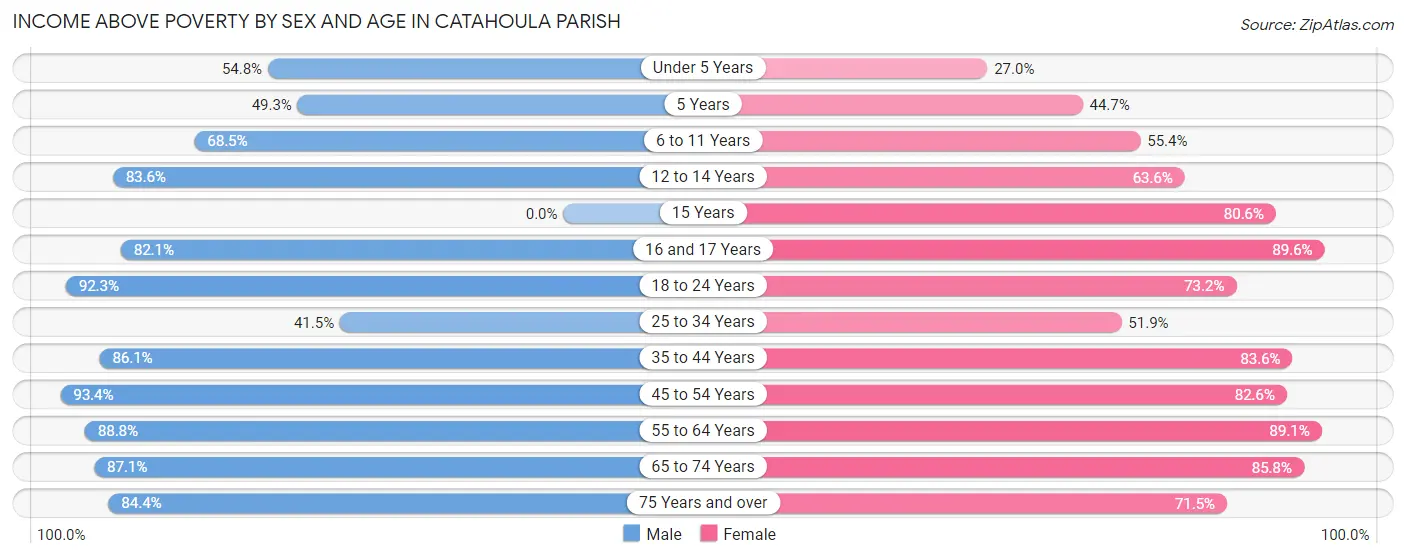
| Age Bracket | Male | Female |
| Under 5 Years | 142 (54.8%) | 64 (27.0%) |
| 5 Years | 71 (49.3%) | 21 (44.7%) |
| 6 to 11 Years | 126 (68.5%) | 205 (55.4%) |
| 12 to 14 Years | 179 (83.6%) | 77 (63.6%) |
| 15 Years | 0 (0.0%) | 58 (80.6%) |
| 16 and 17 Years | 115 (82.1%) | 86 (89.6%) |
| 18 to 24 Years | 193 (92.3%) | 205 (73.2%) |
| 25 to 34 Years | 102 (41.5%) | 273 (51.9%) |
| 35 to 44 Years | 378 (86.1%) | 409 (83.6%) |
| 45 to 54 Years | 338 (93.4%) | 313 (82.6%) |
| 55 to 64 Years | 492 (88.8%) | 683 (89.0%) |
| 65 to 74 Years | 412 (87.1%) | 373 (85.8%) |
| 75 Years and over | 217 (84.4%) | 193 (71.5%) |
| Total | 2,765 (78.8%) | 2,960 (72.4%) |
Income Below Poverty Among Married-Couple Families in Catahoula Parish
The poverty statistics for married-couple families in Catahoula Parish show that 8.1% or 131 of the total 1,609 families live below the poverty line. Families with 3 or 4 children have the highest poverty rate of 31.1%, comprising of 56 families. On the other hand, families with no children have the lowest poverty rate of 3.8%, which includes 37 families.
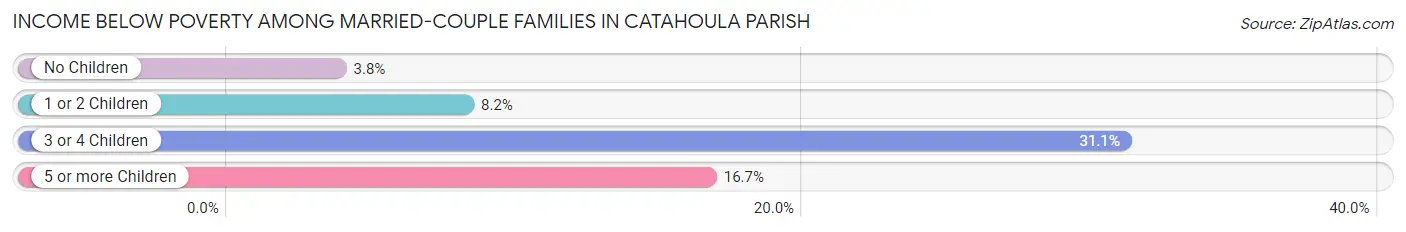
| Children | Above Poverty | Below Poverty |
| No Children | 942 (96.2%) | 37 (3.8%) |
| 1 or 2 Children | 402 (91.8%) | 36 (8.2%) |
| 3 or 4 Children | 124 (68.9%) | 56 (31.1%) |
| 5 or more Children | 10 (83.3%) | 2 (16.7%) |
| Total | 1,478 (91.9%) | 131 (8.1%) |
Income Below Poverty Among Single-Parent Households in Catahoula Parish
According to the poverty data in Catahoula Parish, 20.3% or 31 single-father households and 55.1% or 253 single-mother households are living below the poverty line. Among single-father households, those with no children have the highest poverty rate, with 21 households (40.4%) experiencing poverty. Likewise, among single-mother households, those with 3 or 4 children have the highest poverty rate, with 47 households (100.0%) falling below the poverty line.
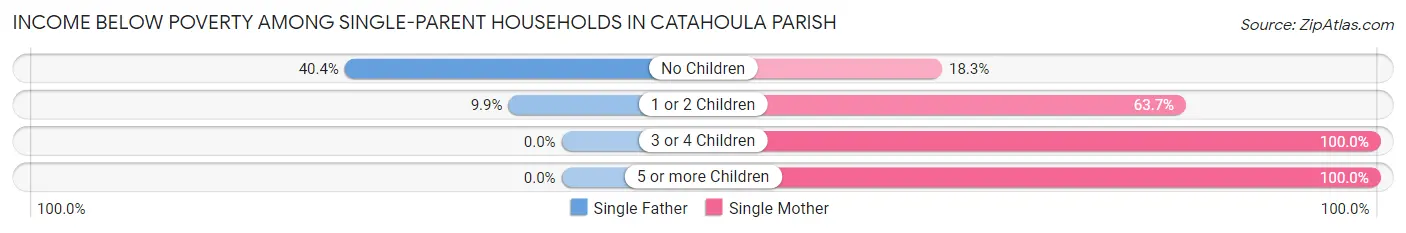
| Children | Single Father | Single Mother |
| No Children | 21 (40.4%) | 24 (18.3%) |
| 1 or 2 Children | 10 (9.9%) | 174 (63.7%) |
| 3 or 4 Children | 0 (0.0%) | 47 (100.0%) |
| 5 or more Children | 0 (0.0%) | 8 (100.0%) |
| Total | 31 (20.3%) | 253 (55.1%) |
Income Below Poverty Among Married-Couple vs Single-Parent Households in Catahoula Parish
The poverty data for Catahoula Parish shows that 131 of the married-couple family households (8.1%) and 284 of the single-parent households (46.4%) are living below the poverty level. Within the married-couple family households, those with 3 or 4 children have the highest poverty rate, with 56 households (31.1%) falling below the poverty line. Among the single-parent households, those with 3 or 4 children have the highest poverty rate, with 47 household (100.0%) living below poverty.
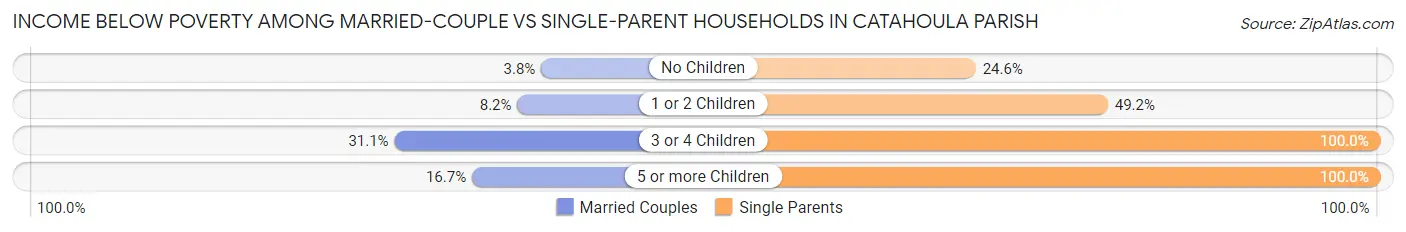
| Children | Married-Couple Families | Single-Parent Households |
| No Children | 37 (3.8%) | 45 (24.6%) |
| 1 or 2 Children | 36 (8.2%) | 184 (49.2%) |
| 3 or 4 Children | 56 (31.1%) | 47 (100.0%) |
| 5 or more Children | 2 (16.7%) | 8 (100.0%) |
| Total | 131 (8.1%) | 284 (46.4%) |
Employment Characteristics in Catahoula Parish
Employment by Class of Employer in Catahoula Parish
Among the 2,877 employed individuals in Catahoula Parish, private company employees (1,611 | 56.0%), local government employees (555 | 19.3%), and self-employed (not incorporated) (288 | 10.0%) make up the most common classes of employment.
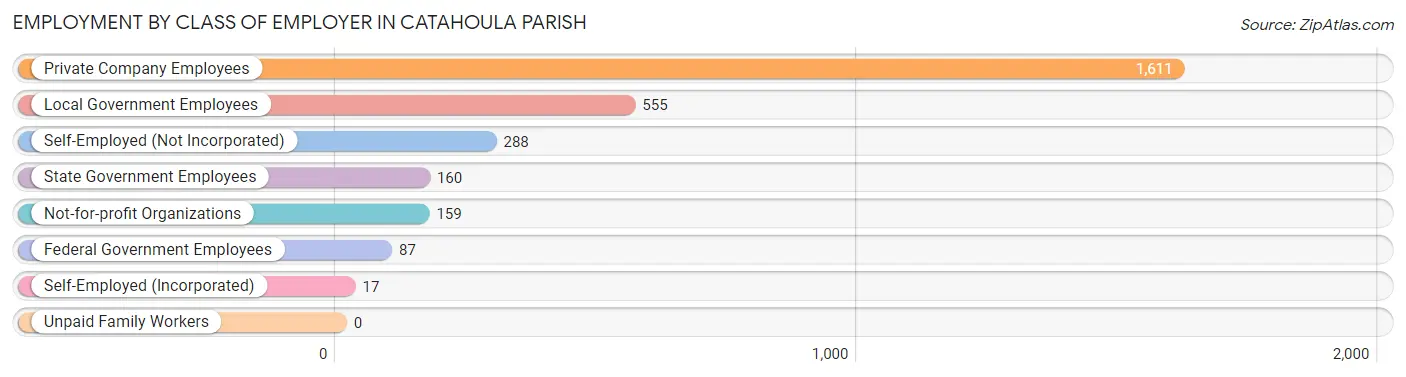
| Employer Class | # Employees | % Employees |
| Private Company Employees | 1,611 | 56.0% |
| Self-Employed (Incorporated) | 17 | 0.6% |
| Self-Employed (Not Incorporated) | 288 | 10.0% |
| Not-for-profit Organizations | 159 | 5.5% |
| Local Government Employees | 555 | 19.3% |
| State Government Employees | 160 | 5.6% |
| Federal Government Employees | 87 | 3.0% |
| Unpaid Family Workers | 0 | 0.0% |
| Total | 2,877 | 100.0% |
Employment Status by Age in Catahoula Parish
According to the labor force statistics for Catahoula Parish, out of the total population over 16 years of age (7,183), 43.6% or 3,132 individuals are in the labor force, with 6.5% or 204 of them unemployed. The age group with the highest labor force participation rate is 55 to 59 years, with 68.5% or 387 individuals in the labor force. Within the labor force, the 30 to 34 years age range has the highest percentage of unemployed individuals, with 18.3% or 64 of them being unemployed.
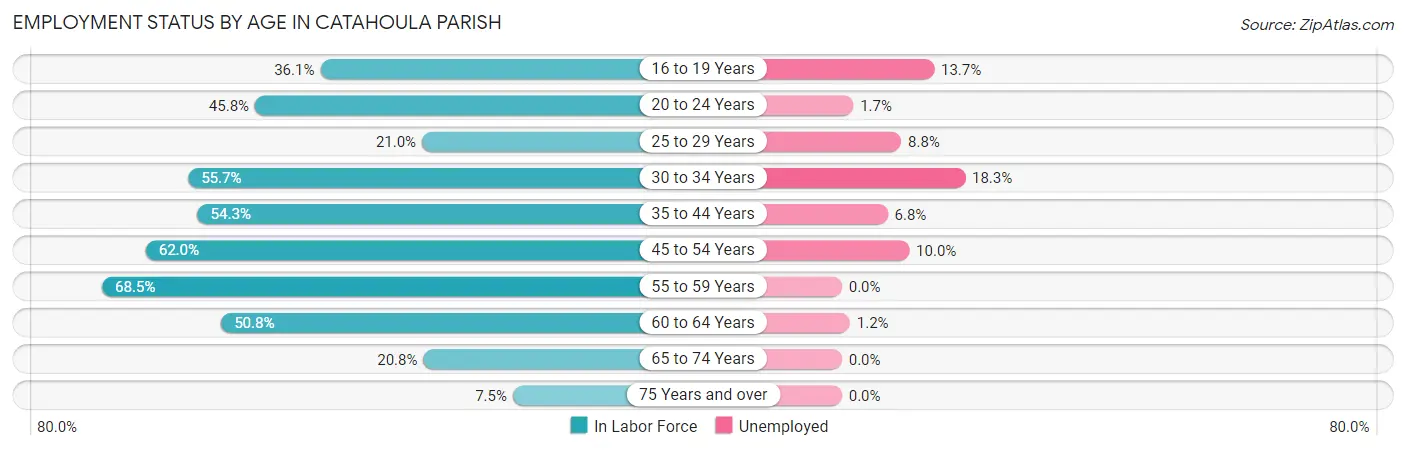
| Age Bracket | In Labor Force | Unemployed |
| 16 to 19 Years | 131 (36.1%) | 18 (13.7%) |
| 20 to 24 Years | 241 (45.8%) | 4 (1.7%) |
| 25 to 29 Years | 125 (21.0%) | 11 (8.8%) |
| 30 to 34 Years | 350 (55.7%) | 64 (18.3%) |
| 35 to 44 Years | 694 (54.3%) | 47 (6.8%) |
| 45 to 54 Years | 538 (62.0%) | 54 (10.0%) |
| 55 to 59 Years | 387 (68.5%) | 0 (0.0%) |
| 60 to 64 Years | 429 (50.8%) | 5 (1.2%) |
| 65 to 74 Years | 194 (20.8%) | 0 (0.0%) |
| 75 Years and over | 44 (7.5%) | 0 (0.0%) |
| Total | 3,132 (43.6%) | 204 (6.5%) |
Employment Status by Educational Attainment in Catahoula Parish
According to labor force statistics for Catahoula Parish, 52.8% of individuals (2,523) out of the total population between 25 and 64 years of age (4,779) are in the labor force, with 7.2% or 182 of them being unemployed. The group with the highest labor force participation rate are those with the educational attainment of bachelor's degree or higher, with 69.3% or 580 individuals in the labor force. Within the labor force, individuals with college / associate degree education have the highest percentage of unemployment, with 12.4% or 65 of them being unemployed.
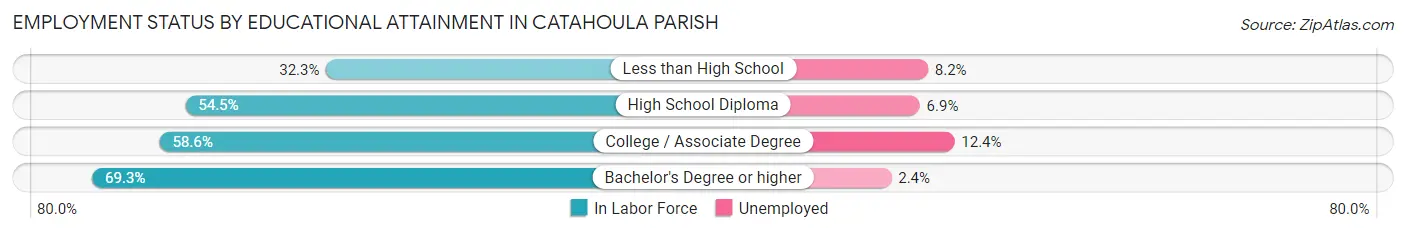
| Educational Attainment | In Labor Force | Unemployed |
| Less than High School | 354 (32.3%) | 90 (8.2%) |
| High School Diploma | 1,064 (54.5%) | 135 (6.9%) |
| College / Associate Degree | 524 (58.6%) | 111 (12.4%) |
| Bachelor's Degree or higher | 580 (69.3%) | 20 (2.4%) |
| Total | 2,523 (52.8%) | 344 (7.2%) |
Employment Occupations by Sex in Catahoula Parish
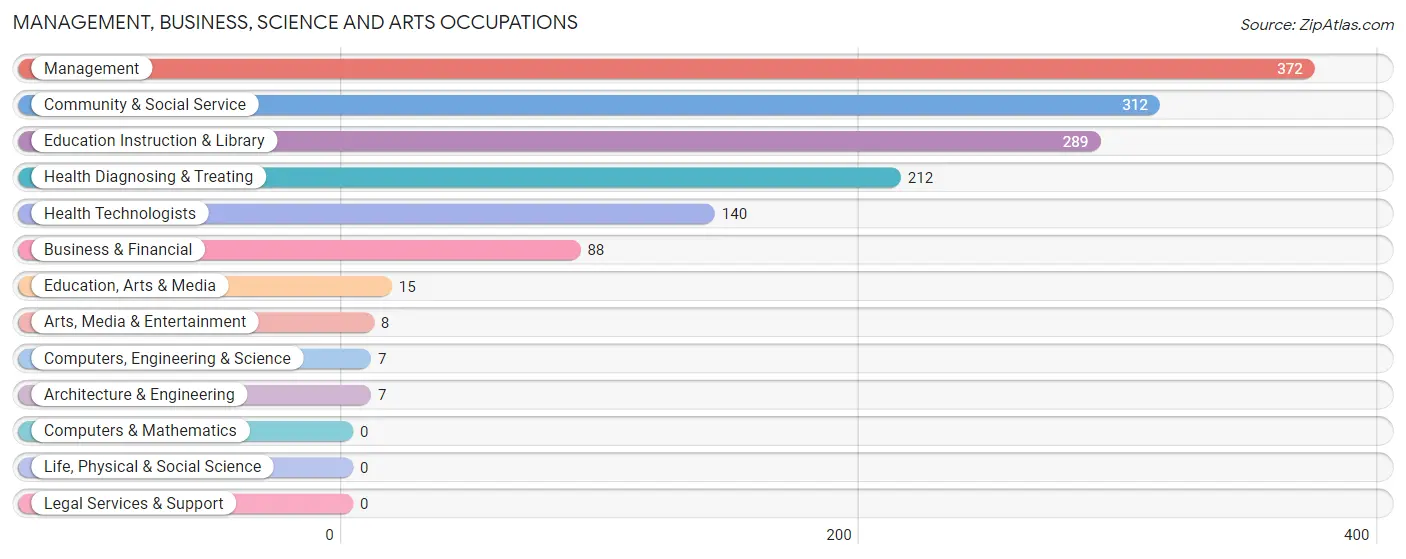
Management, Business, Science and Arts Occupations
The most common Management, Business, Science and Arts occupations in Catahoula Parish are Management (372 | 12.7%), Community & Social Service (312 | 10.7%), Education Instruction & Library (289 | 9.9%), Health Diagnosing & Treating (212 | 7.2%), and Health Technologists (140 | 4.8%).
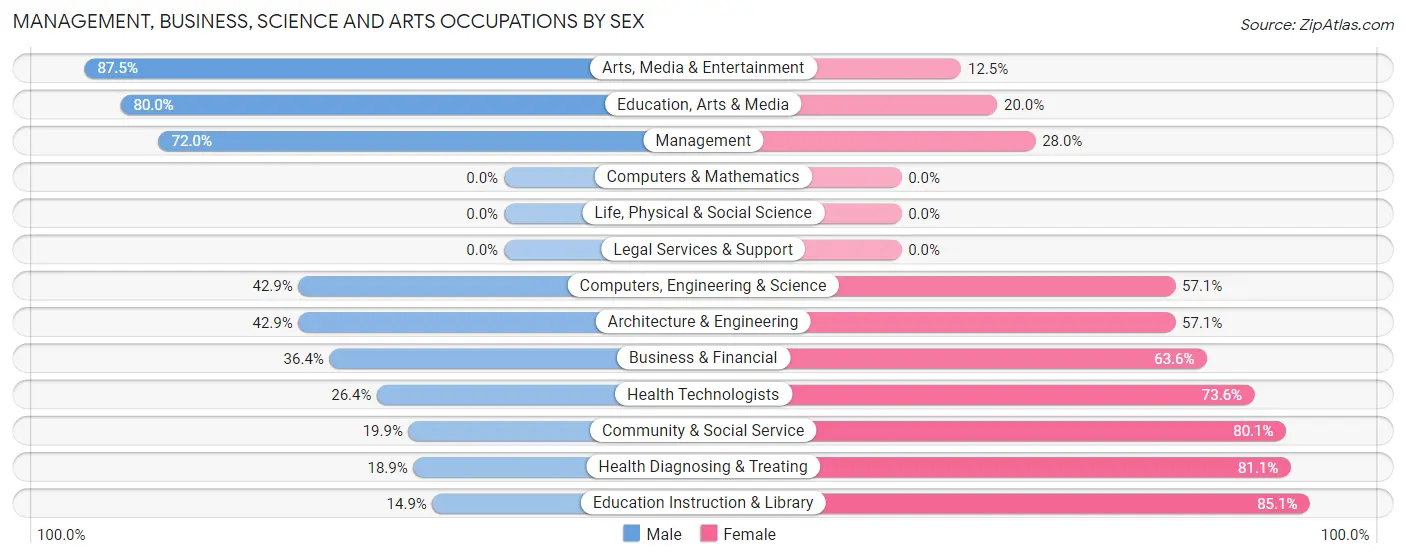
Management, Business, Science and Arts Occupations by Sex
Within the Management, Business, Science and Arts occupations in Catahoula Parish, the most male-oriented occupations are Arts, Media & Entertainment (87.5%), Education, Arts & Media (80.0%), and Management (72.0%), while the most female-oriented occupations are Education Instruction & Library (85.1%), Health Diagnosing & Treating (81.1%), and Community & Social Service (80.1%).
| Occupation | Male | Female |
| Management | 268 (72.0%) | 104 (28.0%) |
| Business & Financial | 32 (36.4%) | 56 (63.6%) |
| Computers, Engineering & Science | 3 (42.9%) | 4 (57.1%) |
| Computers & Mathematics | 0 (0.0%) | 0 (0.0%) |
| Architecture & Engineering | 3 (42.9%) | 4 (57.1%) |
| Life, Physical & Social Science | 0 (0.0%) | 0 (0.0%) |
| Community & Social Service | 62 (19.9%) | 250 (80.1%) |
| Education, Arts & Media | 12 (80.0%) | 3 (20.0%) |
| Legal Services & Support | 0 (0.0%) | 0 (0.0%) |
| Education Instruction & Library | 43 (14.9%) | 246 (85.1%) |
| Arts, Media & Entertainment | 7 (87.5%) | 1 (12.5%) |
| Health Diagnosing & Treating | 40 (18.9%) | 172 (81.1%) |
| Health Technologists | 37 (26.4%) | 103 (73.6%) |
| Total (Category) | 405 (40.9%) | 586 (59.1%) |
| Total (Overall) | 1,402 (47.9%) | 1,526 (52.1%) |
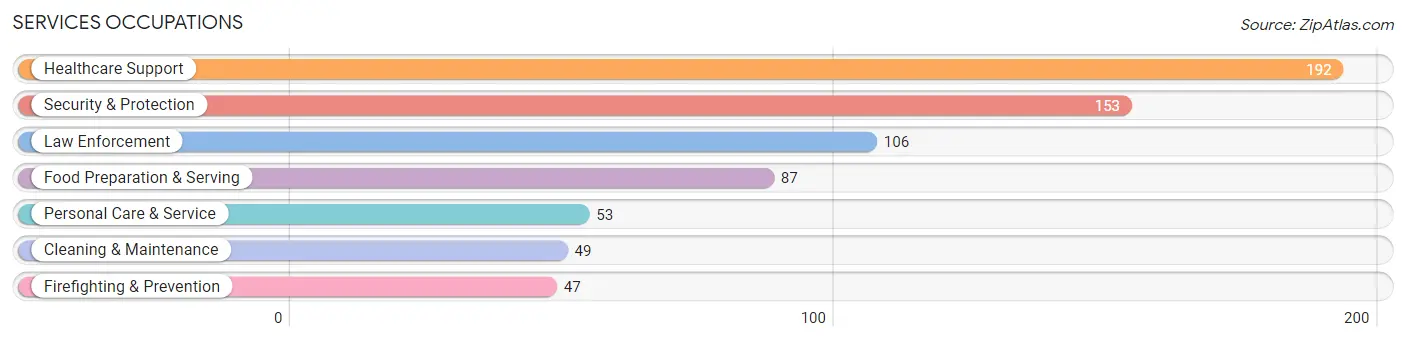
Services Occupations
The most common Services occupations in Catahoula Parish are Healthcare Support (192 | 6.6%), Security & Protection (153 | 5.2%), Law Enforcement (106 | 3.6%), Food Preparation & Serving (87 | 3.0%), and Personal Care & Service (53 | 1.8%).
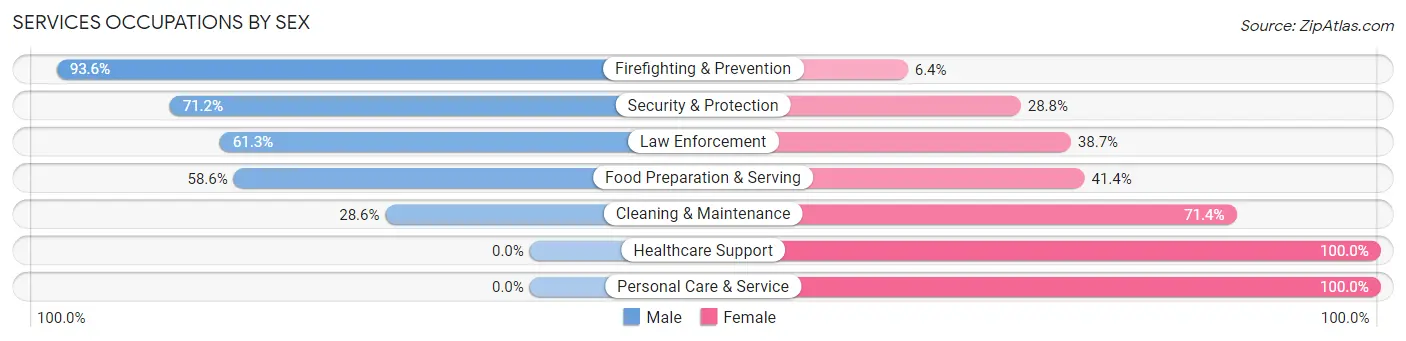
Services Occupations by Sex
Within the Services occupations in Catahoula Parish, the most male-oriented occupations are Firefighting & Prevention (93.6%), Security & Protection (71.2%), and Law Enforcement (61.3%), while the most female-oriented occupations are Healthcare Support (100.0%), Personal Care & Service (100.0%), and Cleaning & Maintenance (71.4%).
| Occupation | Male | Female |
| Healthcare Support | 0 (0.0%) | 192 (100.0%) |
| Security & Protection | 109 (71.2%) | 44 (28.8%) |
| Firefighting & Prevention | 44 (93.6%) | 3 (6.4%) |
| Law Enforcement | 65 (61.3%) | 41 (38.7%) |
| Food Preparation & Serving | 51 (58.6%) | 36 (41.4%) |
| Cleaning & Maintenance | 14 (28.6%) | 35 (71.4%) |
| Personal Care & Service | 0 (0.0%) | 53 (100.0%) |
| Total (Category) | 174 (32.6%) | 360 (67.4%) |
| Total (Overall) | 1,402 (47.9%) | 1,526 (52.1%) |
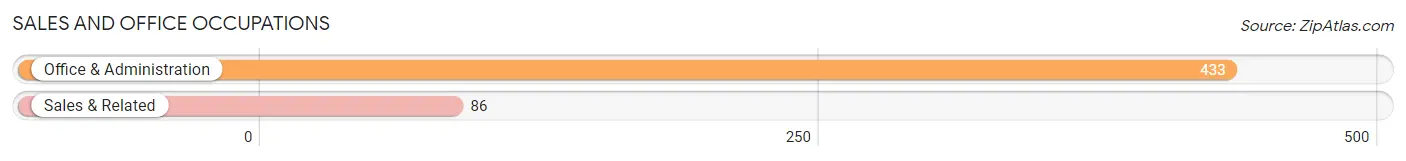
Sales and Office Occupations
The most common Sales and Office occupations in Catahoula Parish are Office & Administration (433 | 14.8%), and Sales & Related (86 | 2.9%).
Sales and Office Occupations by Sex
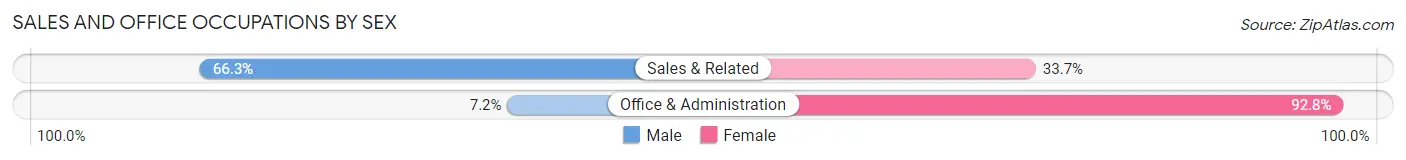
| Occupation | Male | Female |
| Sales & Related | 57 (66.3%) | 29 (33.7%) |
| Office & Administration | 31 (7.2%) | 402 (92.8%) |
| Total (Category) | 88 (17.0%) | 431 (83.0%) |
| Total (Overall) | 1,402 (47.9%) | 1,526 (52.1%) |
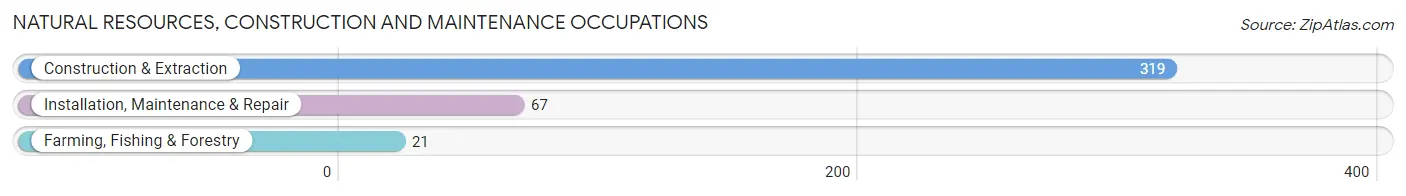
Natural Resources, Construction and Maintenance Occupations
The most common Natural Resources, Construction and Maintenance occupations in Catahoula Parish are Construction & Extraction (319 | 10.9%), Installation, Maintenance & Repair (67 | 2.3%), and Farming, Fishing & Forestry (21 | 0.7%).
Natural Resources, Construction and Maintenance Occupations by Sex
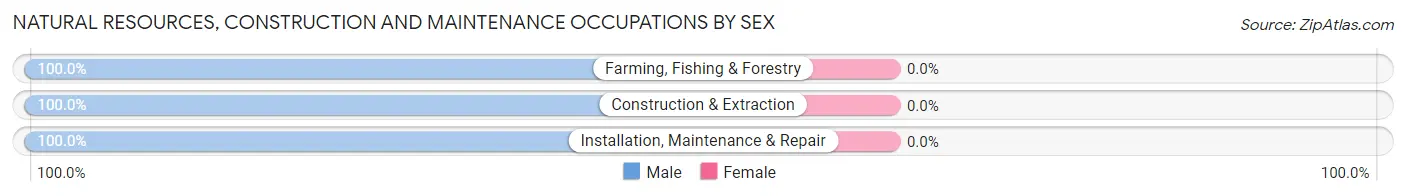
| Occupation | Male | Female |
| Farming, Fishing & Forestry | 21 (100.0%) | 0 (0.0%) |
| Construction & Extraction | 319 (100.0%) | 0 (0.0%) |
| Installation, Maintenance & Repair | 67 (100.0%) | 0 (0.0%) |
| Total (Category) | 407 (100.0%) | 0 (0.0%) |
| Total (Overall) | 1,402 (47.9%) | 1,526 (52.1%) |
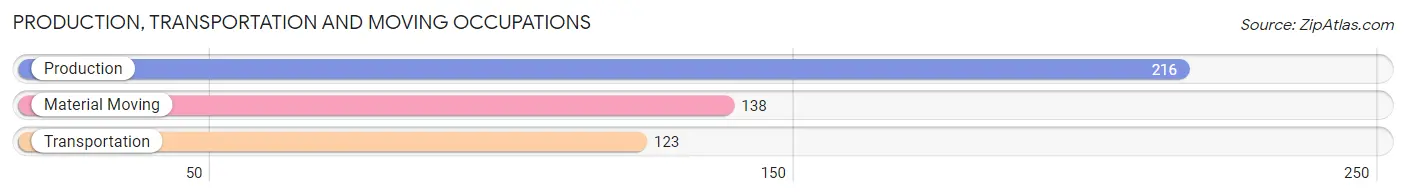
Production, Transportation and Moving Occupations
The most common Production, Transportation and Moving occupations in Catahoula Parish are Production (216 | 7.4%), Material Moving (138 | 4.7%), and Transportation (123 | 4.2%).
Production, Transportation and Moving Occupations by Sex
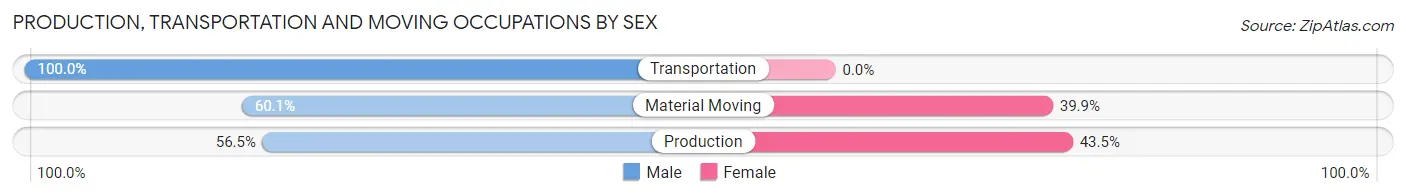
| Occupation | Male | Female |
| Production | 122 (56.5%) | 94 (43.5%) |
| Transportation | 123 (100.0%) | 0 (0.0%) |
| Material Moving | 83 (60.1%) | 55 (39.9%) |
| Total (Category) | 328 (68.8%) | 149 (31.2%) |
| Total (Overall) | 1,402 (47.9%) | 1,526 (52.1%) |
Employment Industries by Sex in Catahoula Parish
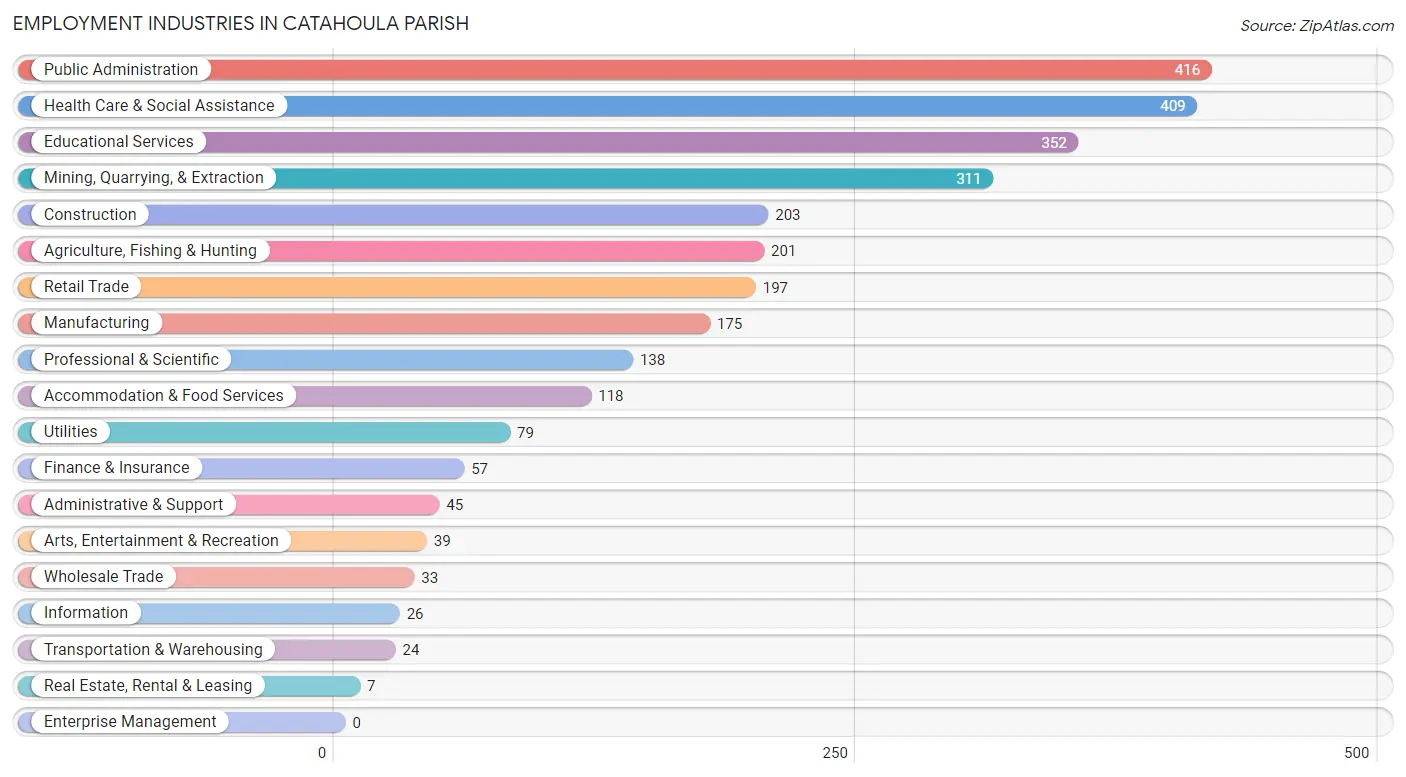
Employment Industries in Catahoula Parish
The major employment industries in Catahoula Parish include Public Administration (416 | 14.2%), Health Care & Social Assistance (409 | 14.0%), Educational Services (352 | 12.0%), Mining, Quarrying, & Extraction (311 | 10.6%), and Construction (203 | 6.9%).
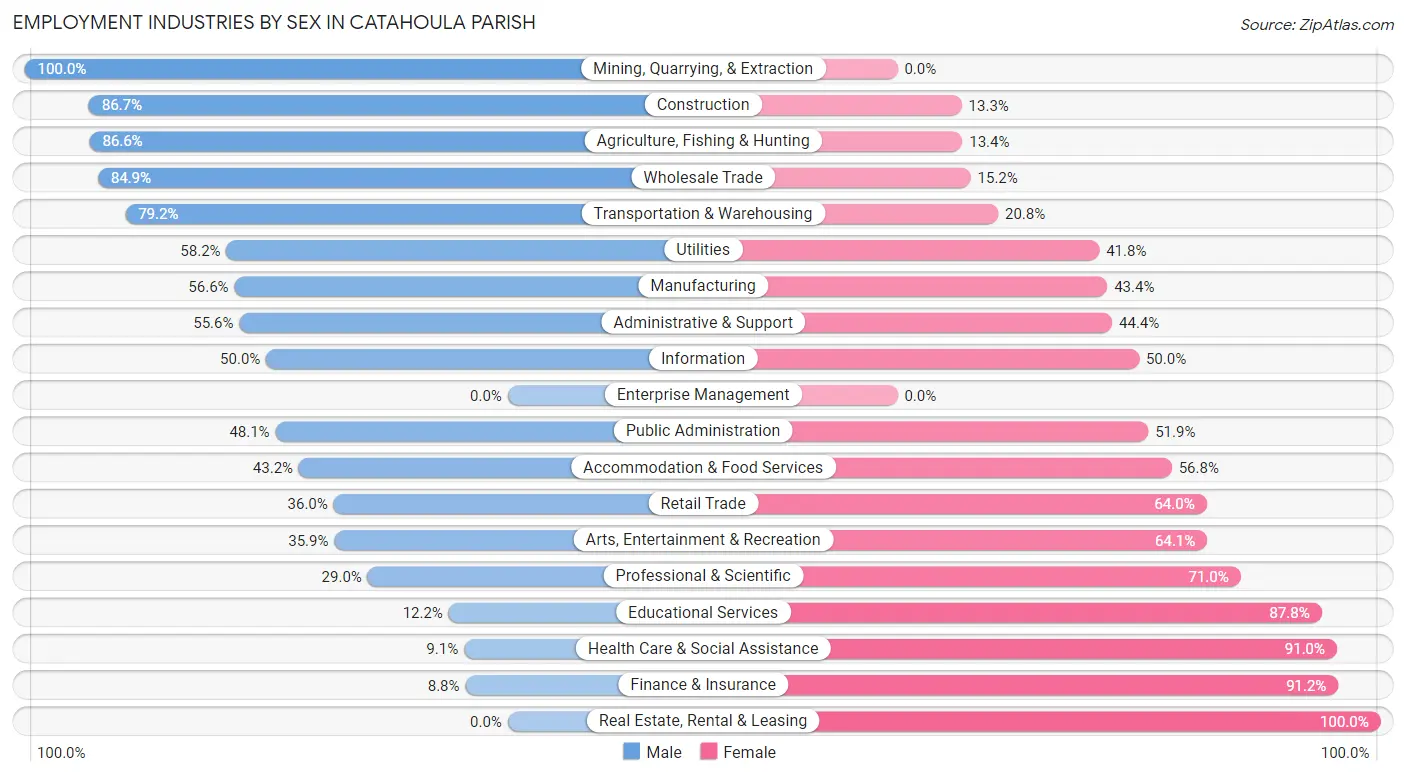
Employment Industries by Sex in Catahoula Parish
The Catahoula Parish industries that see more men than women are Mining, Quarrying, & Extraction (100.0%), Construction (86.7%), and Agriculture, Fishing & Hunting (86.6%), whereas the industries that tend to have a higher number of women are Real Estate, Rental & Leasing (100.0%), Finance & Insurance (91.2%), and Health Care & Social Assistance (90.9%).
| Industry | Male | Female |
| Agriculture, Fishing & Hunting | 174 (86.6%) | 27 (13.4%) |
| Mining, Quarrying, & Extraction | 311 (100.0%) | 0 (0.0%) |
| Construction | 176 (86.7%) | 27 (13.3%) |
| Manufacturing | 99 (56.6%) | 76 (43.4%) |
| Wholesale Trade | 28 (84.9%) | 5 (15.1%) |
| Retail Trade | 71 (36.0%) | 126 (64.0%) |
| Transportation & Warehousing | 19 (79.2%) | 5 (20.8%) |
| Utilities | 46 (58.2%) | 33 (41.8%) |
| Information | 13 (50.0%) | 13 (50.0%) |
| Finance & Insurance | 5 (8.8%) | 52 (91.2%) |
| Real Estate, Rental & Leasing | 0 (0.0%) | 7 (100.0%) |
| Professional & Scientific | 40 (29.0%) | 98 (71.0%) |
| Enterprise Management | 0 (0.0%) | 0 (0.0%) |
| Administrative & Support | 25 (55.6%) | 20 (44.4%) |
| Educational Services | 43 (12.2%) | 309 (87.8%) |
| Health Care & Social Assistance | 37 (9.0%) | 372 (90.9%) |
| Arts, Entertainment & Recreation | 14 (35.9%) | 25 (64.1%) |
| Accommodation & Food Services | 51 (43.2%) | 67 (56.8%) |
| Public Administration | 200 (48.1%) | 216 (51.9%) |
| Total | 1,402 (47.9%) | 1,526 (52.1%) |
Education in Catahoula Parish
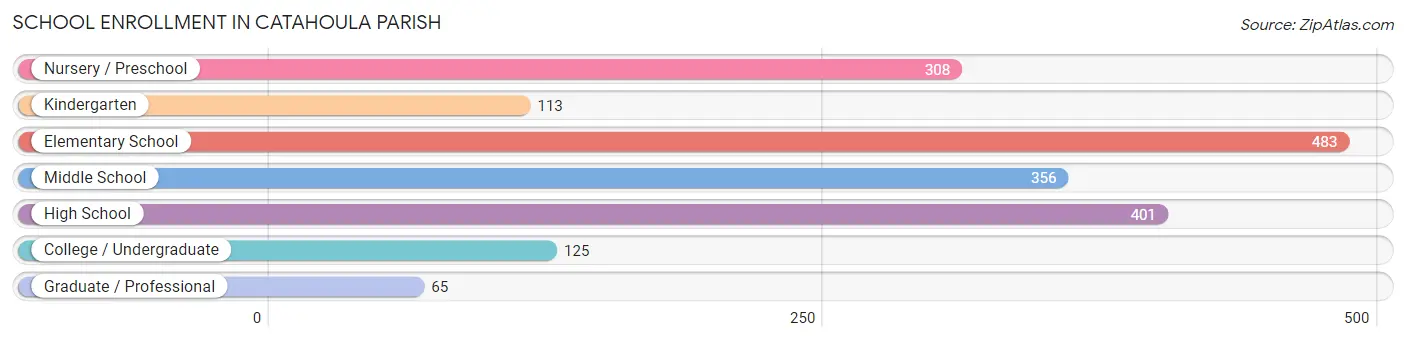
School Enrollment in Catahoula Parish
The most common levels of schooling among the 1,851 students in Catahoula Parish are elementary school (483 | 26.1%), high school (401 | 21.7%), and middle school (356 | 19.2%).
| School Level | # Students | % Students |
| Nursery / Preschool | 308 | 16.6% |
| Kindergarten | 113 | 6.1% |
| Elementary School | 483 | 26.1% |
| Middle School | 356 | 19.2% |
| High School | 401 | 21.7% |
| College / Undergraduate | 125 | 6.8% |
| Graduate / Professional | 65 | 3.5% |
| Total | 1,851 | 100.0% |
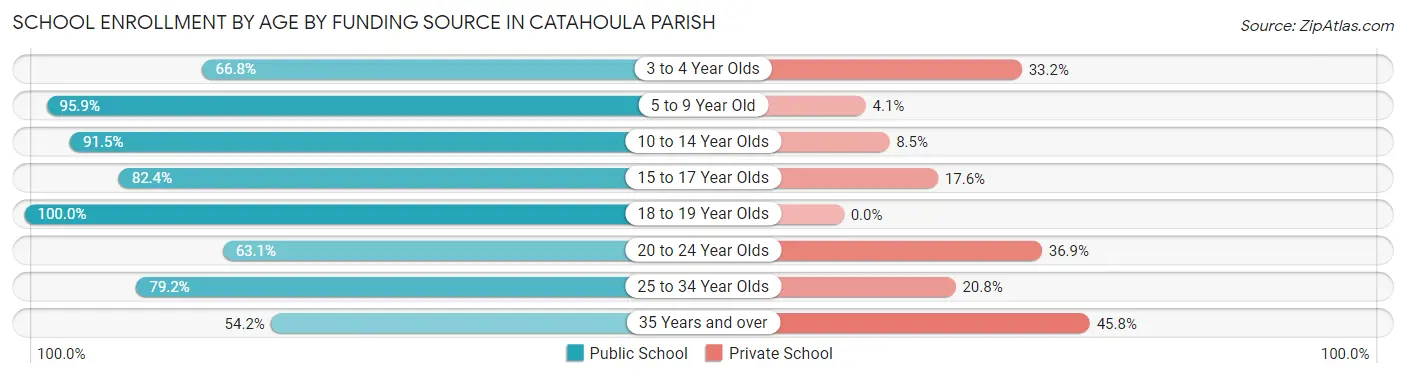
School Enrollment by Age by Funding Source in Catahoula Parish
Out of a total of 1,851 students who are enrolled in schools in Catahoula Parish, 263 (14.2%) attend a private institution, while the remaining 1,588 (85.8%) are enrolled in public schools. The age group of 35 years and over has the highest likelihood of being enrolled in private schools, with 22 (45.8% in the age bracket) enrolled. Conversely, the age group of 18 to 19 year olds has the lowest likelihood of being enrolled in a private school, with 21 (100.0% in the age bracket) attending a public institution.
| Age Bracket | Public School | Private School |
| 3 to 4 Year Olds | 139 (66.8%) | 69 (33.2%) |
| 5 to 9 Year Old | 563 (95.9%) | 24 (4.1%) |
| 10 to 14 Year Olds | 453 (91.5%) | 42 (8.5%) |
| 15 to 17 Year Olds | 277 (82.4%) | 59 (17.6%) |
| 18 to 19 Year Olds | 21 (100.0%) | 0 (0.0%) |
| 20 to 24 Year Olds | 53 (63.1%) | 31 (36.9%) |
| 25 to 34 Year Olds | 57 (79.2%) | 15 (20.8%) |
| 35 Years and over | 26 (54.2%) | 22 (45.8%) |
| Total | 1,588 (85.8%) | 263 (14.2%) |
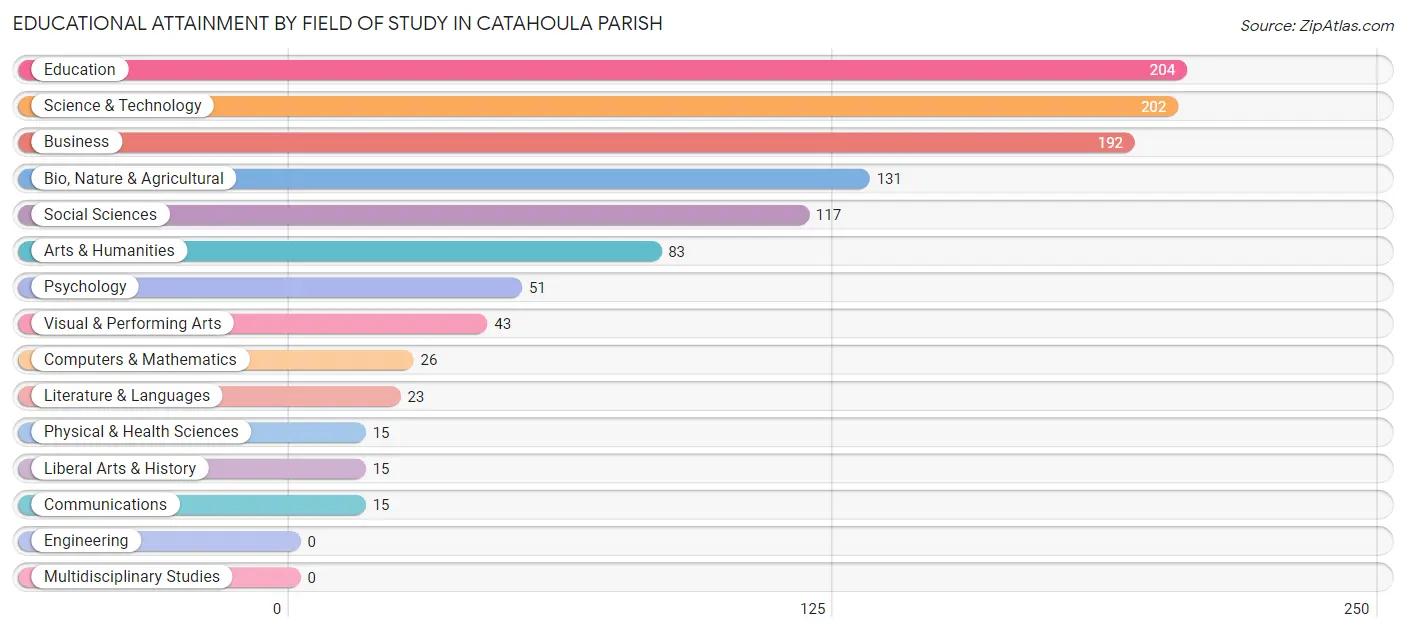
Educational Attainment by Field of Study in Catahoula Parish
Education (204 | 18.3%), science & technology (202 | 18.1%), business (192 | 17.2%), bio, nature & agricultural (131 | 11.7%), and social sciences (117 | 10.5%) are the most common fields of study among 1,117 individuals in Catahoula Parish who have obtained a bachelor's degree or higher.
| Field of Study | # Graduates | % Graduates |
| Computers & Mathematics | 26 | 2.3% |
| Bio, Nature & Agricultural | 131 | 11.7% |
| Physical & Health Sciences | 15 | 1.3% |
| Psychology | 51 | 4.6% |
| Social Sciences | 117 | 10.5% |
| Engineering | 0 | 0.0% |
| Multidisciplinary Studies | 0 | 0.0% |
| Science & Technology | 202 | 18.1% |
| Business | 192 | 17.2% |
| Education | 204 | 18.3% |
| Literature & Languages | 23 | 2.1% |
| Liberal Arts & History | 15 | 1.3% |
| Visual & Performing Arts | 43 | 3.8% |
| Communications | 15 | 1.3% |
| Arts & Humanities | 83 | 7.4% |
| Total | 1,117 | 100.0% |
Transportation & Commute in Catahoula Parish
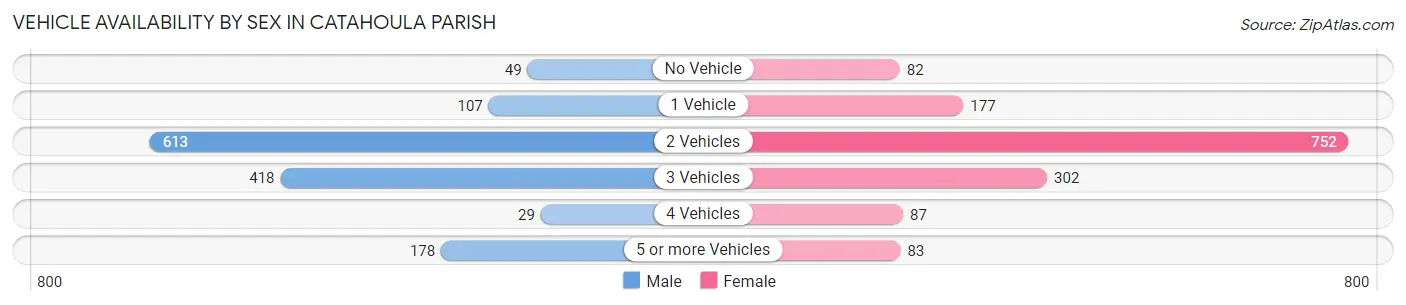
Vehicle Availability by Sex in Catahoula Parish
The most prevalent vehicle ownership categories in Catahoula Parish are males with 2 vehicles (613, accounting for 44.0%) and females with 2 vehicles (752, making up 41.3%).
| Vehicles Available | Male | Female |
| No Vehicle | 49 (3.5%) | 82 (5.5%) |
| 1 Vehicle | 107 (7.7%) | 177 (11.9%) |
| 2 Vehicles | 613 (44.0%) | 752 (50.7%) |
| 3 Vehicles | 418 (30.0%) | 302 (20.4%) |
| 4 Vehicles | 29 (2.1%) | 87 (5.9%) |
| 5 or more Vehicles | 178 (12.8%) | 83 (5.6%) |
| Total | 1,394 (100.0%) | 1,483 (100.0%) |
Commute Time in Catahoula Parish
The most frequently occuring commute durations in Catahoula Parish are 30 to 34 minutes (602 commuters, 23.1%), 15 to 19 minutes (348 commuters, 13.3%), and 10 to 14 minutes (328 commuters, 12.6%).
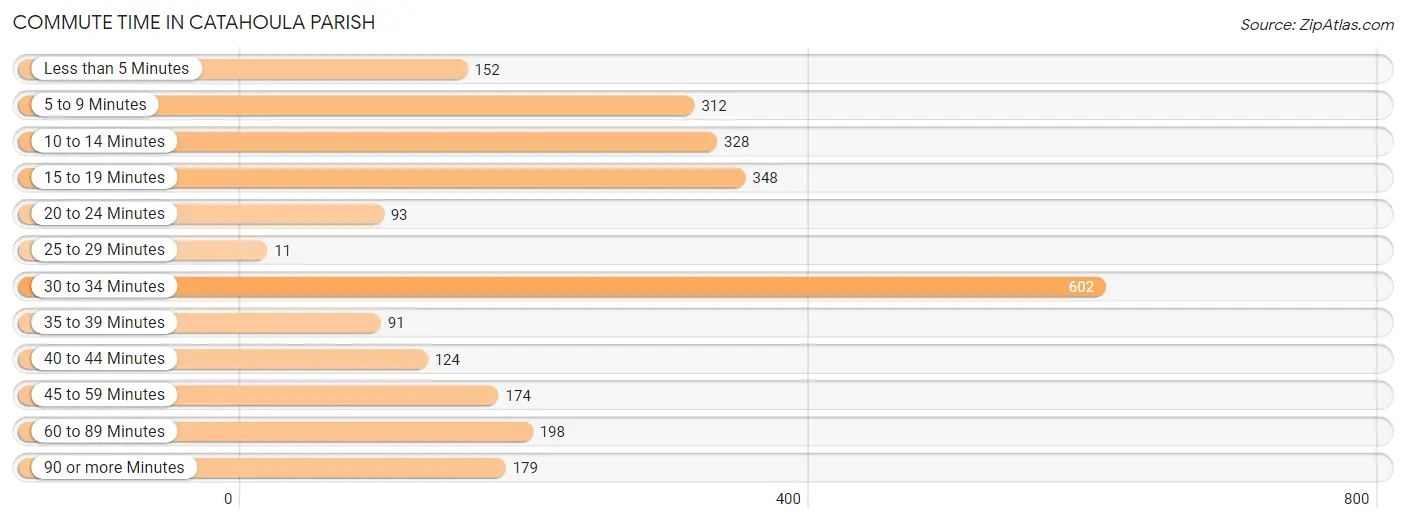
| Commute Time | # Commuters | % Commuters |
| Less than 5 Minutes | 152 | 5.8% |
| 5 to 9 Minutes | 312 | 11.9% |
| 10 to 14 Minutes | 328 | 12.6% |
| 15 to 19 Minutes | 348 | 13.3% |
| 20 to 24 Minutes | 93 | 3.6% |
| 25 to 29 Minutes | 11 | 0.4% |
| 30 to 34 Minutes | 602 | 23.1% |
| 35 to 39 Minutes | 91 | 3.5% |
| 40 to 44 Minutes | 124 | 4.8% |
| 45 to 59 Minutes | 174 | 6.7% |
| 60 to 89 Minutes | 198 | 7.6% |
| 90 or more Minutes | 179 | 6.9% |
Commute Time by Sex in Catahoula Parish
The most common commute times in Catahoula Parish are 30 to 34 minutes (245 commuters, 20.5%) for males and 30 to 34 minutes (357 commuters, 25.2%) for females.
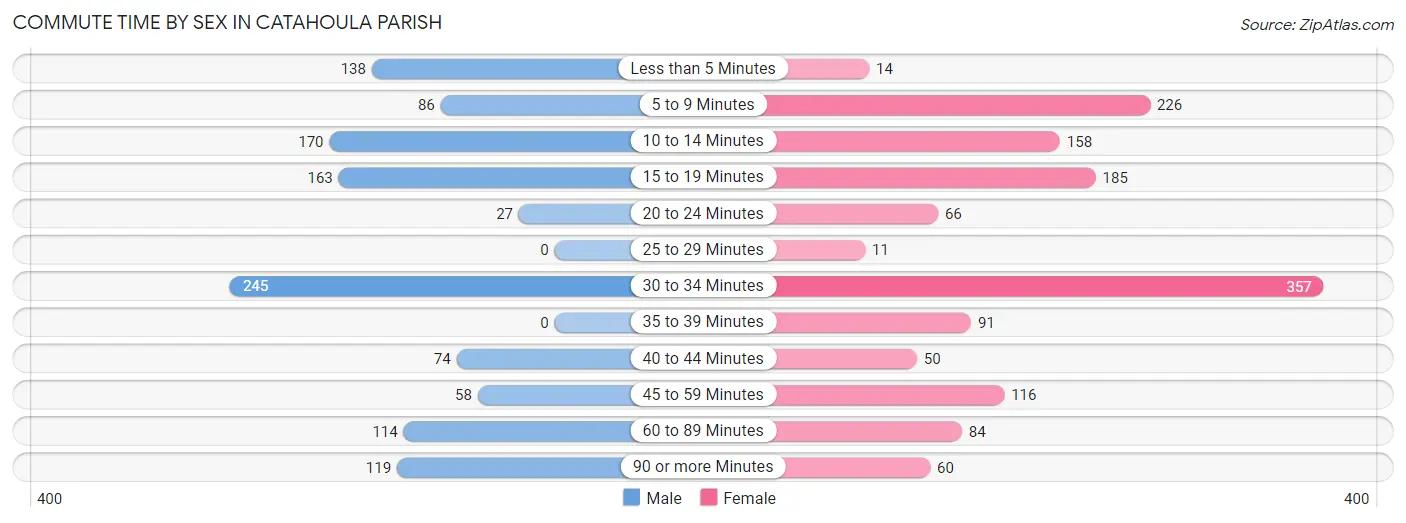
| Commute Time | Male | Female |
| Less than 5 Minutes | 138 (11.6%) | 14 (1.0%) |
| 5 to 9 Minutes | 86 (7.2%) | 226 (15.9%) |
| 10 to 14 Minutes | 170 (14.2%) | 158 (11.1%) |
| 15 to 19 Minutes | 163 (13.7%) | 185 (13.1%) |
| 20 to 24 Minutes | 27 (2.3%) | 66 (4.6%) |
| 25 to 29 Minutes | 0 (0.0%) | 11 (0.8%) |
| 30 to 34 Minutes | 245 (20.5%) | 357 (25.2%) |
| 35 to 39 Minutes | 0 (0.0%) | 91 (6.4%) |
| 40 to 44 Minutes | 74 (6.2%) | 50 (3.5%) |
| 45 to 59 Minutes | 58 (4.9%) | 116 (8.2%) |
| 60 to 89 Minutes | 114 (9.6%) | 84 (5.9%) |
| 90 or more Minutes | 119 (10.0%) | 60 (4.2%) |
Time of Departure to Work by Sex in Catahoula Parish
The most frequent times of departure to work in Catahoula Parish are 6:00 AM to 6:29 AM (179, 15.0%) for males and 7:00 AM to 7:29 AM (342, 24.1%) for females.
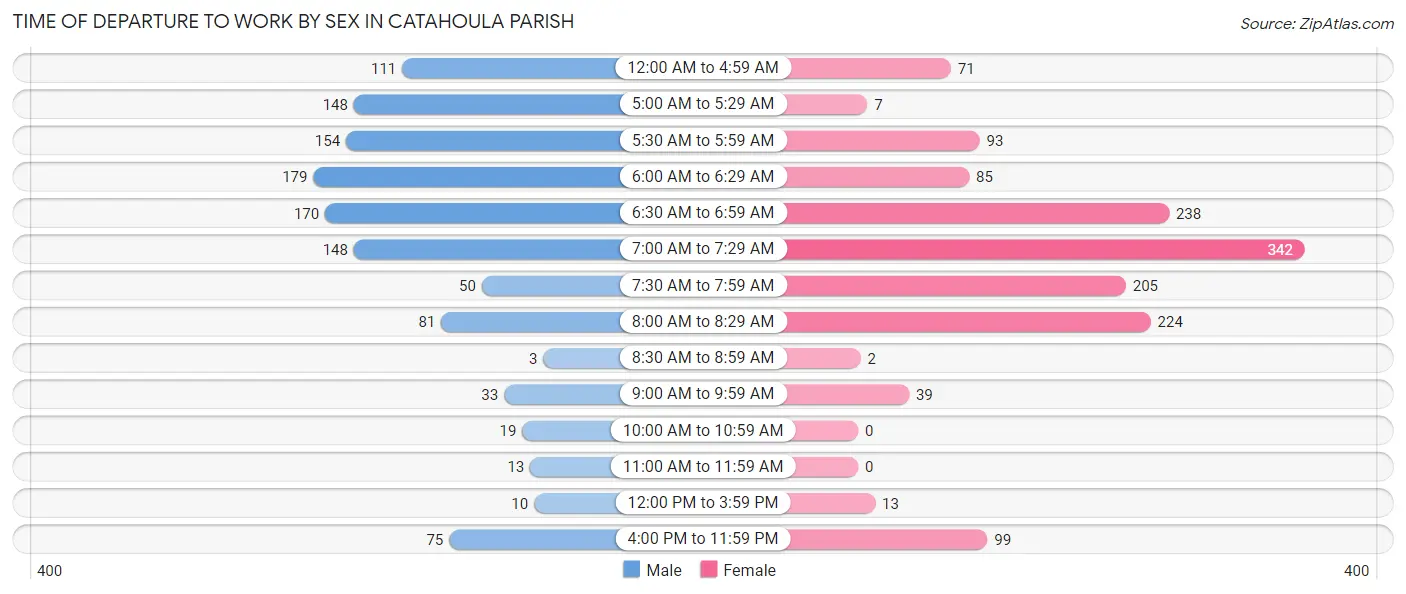
| Time of Departure | Male | Female |
| 12:00 AM to 4:59 AM | 111 (9.3%) | 71 (5.0%) |
| 5:00 AM to 5:29 AM | 148 (12.4%) | 7 (0.5%) |
| 5:30 AM to 5:59 AM | 154 (12.9%) | 93 (6.6%) |
| 6:00 AM to 6:29 AM | 179 (15.0%) | 85 (6.0%) |
| 6:30 AM to 6:59 AM | 170 (14.2%) | 238 (16.8%) |
| 7:00 AM to 7:29 AM | 148 (12.4%) | 342 (24.1%) |
| 7:30 AM to 7:59 AM | 50 (4.2%) | 205 (14.5%) |
| 8:00 AM to 8:29 AM | 81 (6.8%) | 224 (15.8%) |
| 8:30 AM to 8:59 AM | 3 (0.3%) | 2 (0.1%) |
| 9:00 AM to 9:59 AM | 33 (2.8%) | 39 (2.8%) |
| 10:00 AM to 10:59 AM | 19 (1.6%) | 0 (0.0%) |
| 11:00 AM to 11:59 AM | 13 (1.1%) | 0 (0.0%) |
| 12:00 PM to 3:59 PM | 10 (0.8%) | 13 (0.9%) |
| 4:00 PM to 11:59 PM | 75 (6.3%) | 99 (7.0%) |
| Total | 1,194 (100.0%) | 1,418 (100.0%) |
Housing Occupancy in Catahoula Parish
Occupancy by Ownership in Catahoula Parish
Of the total 3,030 dwellings in Catahoula Parish, owner-occupied units account for 2,355 (77.7%), while renter-occupied units make up 675 (22.3%).
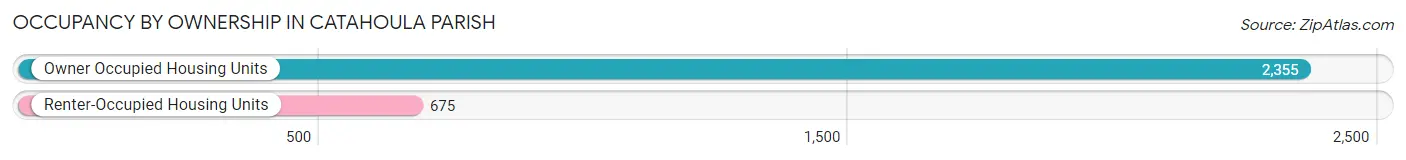
| Occupancy | # Housing Units | % Housing Units |
| Owner Occupied Housing Units | 2,355 | 77.7% |
| Renter-Occupied Housing Units | 675 | 22.3% |
| Total Occupied Housing Units | 3,030 | 100.0% |
Occupancy by Household Size in Catahoula Parish
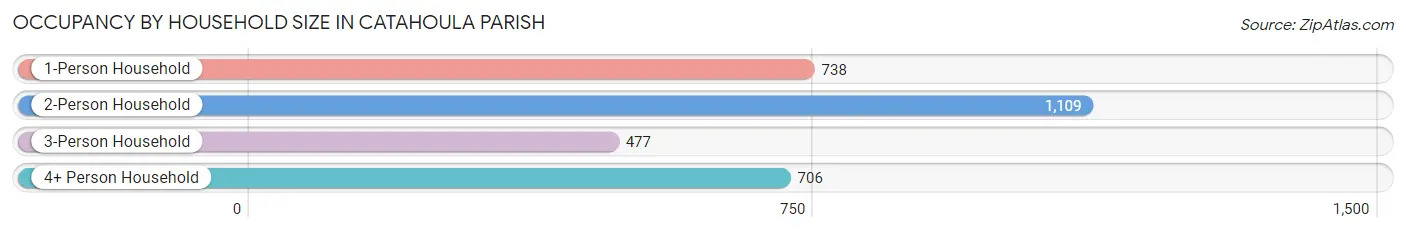
| Household Size | # Housing Units | % Housing Units |
| 1-Person Household | 738 | 24.4% |
| 2-Person Household | 1,109 | 36.6% |
| 3-Person Household | 477 | 15.7% |
| 4+ Person Household | 706 | 23.3% |
| Total Housing Units | 3,030 | 100.0% |
Occupancy by Ownership by Household Size in Catahoula Parish
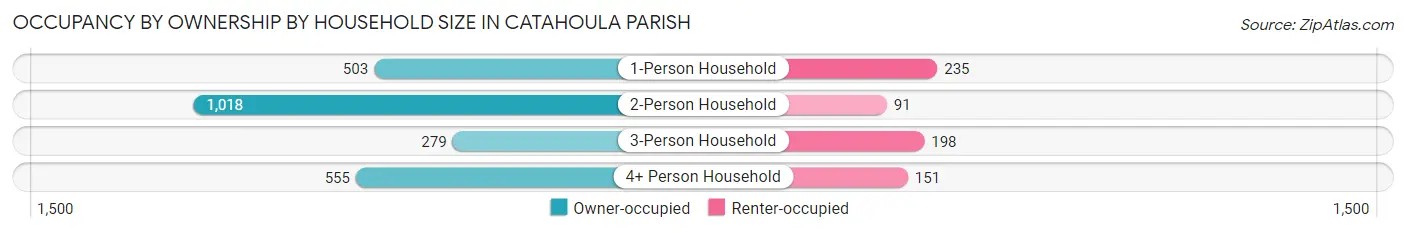
| Household Size | Owner-occupied | Renter-occupied |
| 1-Person Household | 503 (68.2%) | 235 (31.8%) |
| 2-Person Household | 1,018 (91.8%) | 91 (8.2%) |
| 3-Person Household | 279 (58.5%) | 198 (41.5%) |
| 4+ Person Household | 555 (78.6%) | 151 (21.4%) |
| Total Housing Units | 2,355 (77.7%) | 675 (22.3%) |
Occupancy by Educational Attainment in Catahoula Parish
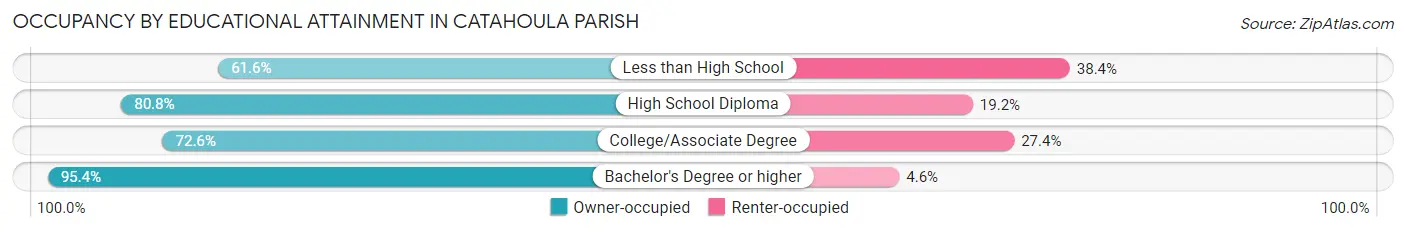
| Household Size | Owner-occupied | Renter-occupied |
| Less than High School | 401 (61.6%) | 250 (38.4%) |
| High School Diploma | 910 (80.8%) | 216 (19.2%) |
| College/Associate Degree | 483 (72.6%) | 182 (27.4%) |
| Bachelor's Degree or higher | 561 (95.4%) | 27 (4.6%) |
Occupancy by Age of Householder in Catahoula Parish
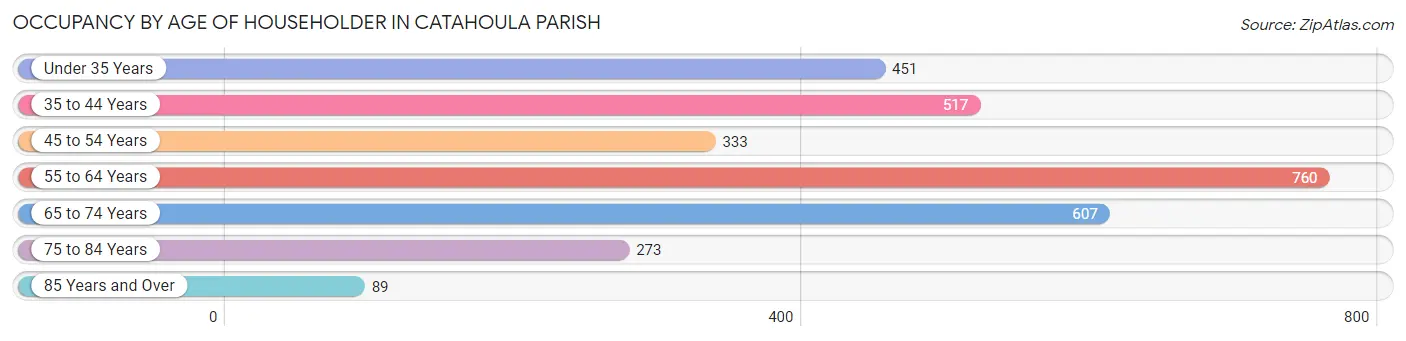
| Age Bracket | # Households | % Households |
| Under 35 Years | 451 | 14.9% |
| 35 to 44 Years | 517 | 17.1% |
| 45 to 54 Years | 333 | 11.0% |
| 55 to 64 Years | 760 | 25.1% |
| 65 to 74 Years | 607 | 20.0% |
| 75 to 84 Years | 273 | 9.0% |
| 85 Years and Over | 89 | 2.9% |
| Total | 3,030 | 100.0% |
Housing Finances in Catahoula Parish
Median Income by Occupancy in Catahoula Parish
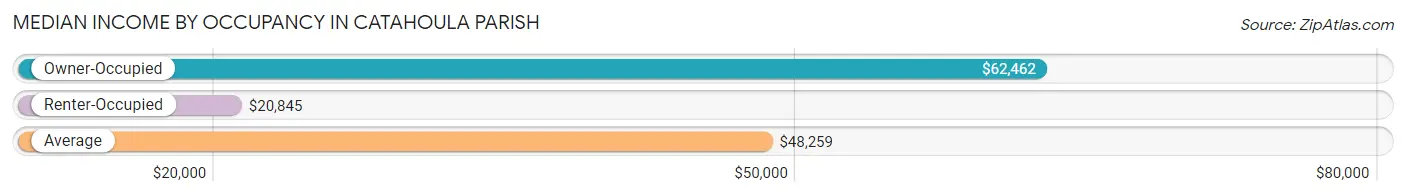
| Occupancy Type | # Households | Median Income |
| Owner-Occupied | 2,355 (77.7%) | $62,462 |
| Renter-Occupied | 675 (22.3%) | $20,845 |
| Average | 3,030 (100.0%) | $48,259 |
Occupancy by Householder Income Bracket in Catahoula Parish
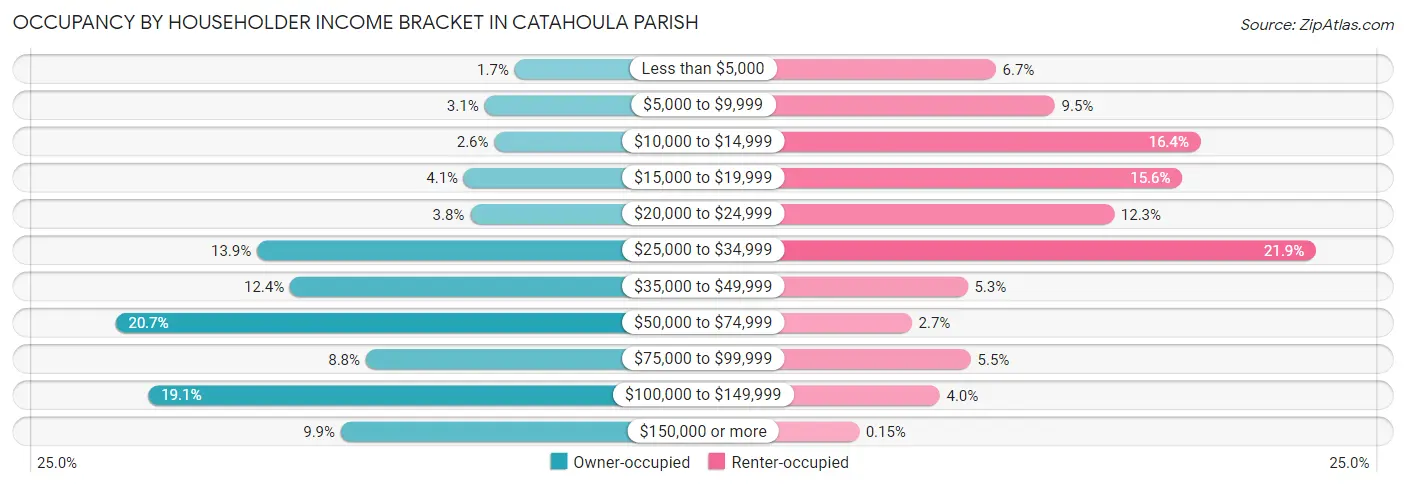
| Income Bracket | Owner-occupied | Renter-occupied |
| Less than $5,000 | 39 (1.7%) | 45 (6.7%) |
| $5,000 to $9,999 | 73 (3.1%) | 64 (9.5%) |
| $10,000 to $14,999 | 62 (2.6%) | 111 (16.4%) |
| $15,000 to $19,999 | 96 (4.1%) | 105 (15.6%) |
| $20,000 to $24,999 | 89 (3.8%) | 83 (12.3%) |
| $25,000 to $34,999 | 328 (13.9%) | 148 (21.9%) |
| $35,000 to $49,999 | 291 (12.4%) | 36 (5.3%) |
| $50,000 to $74,999 | 487 (20.7%) | 18 (2.7%) |
| $75,000 to $99,999 | 206 (8.7%) | 37 (5.5%) |
| $100,000 to $149,999 | 450 (19.1%) | 27 (4.0%) |
| $150,000 or more | 234 (9.9%) | 1 (0.2%) |
| Total | 2,355 (100.0%) | 675 (100.0%) |
Monthly Housing Cost Tiers in Catahoula Parish
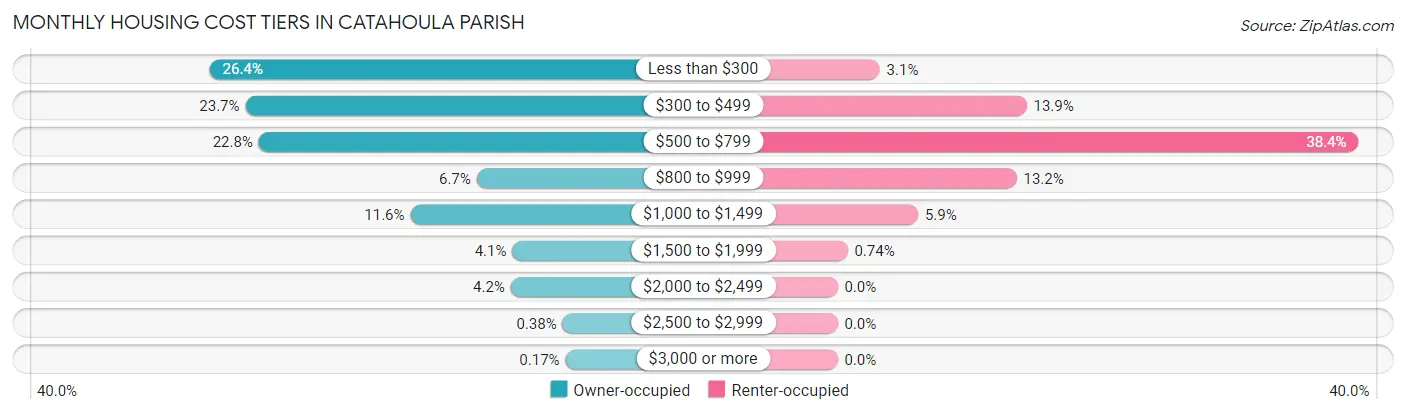
| Monthly Cost | Owner-occupied | Renter-occupied |
| Less than $300 | 621 (26.4%) | 21 (3.1%) |
| $300 to $499 | 559 (23.7%) | 94 (13.9%) |
| $500 to $799 | 536 (22.8%) | 259 (38.4%) |
| $800 to $999 | 158 (6.7%) | 89 (13.2%) |
| $1,000 to $1,499 | 273 (11.6%) | 40 (5.9%) |
| $1,500 to $1,999 | 96 (4.1%) | 5 (0.7%) |
| $2,000 to $2,499 | 99 (4.2%) | 0 (0.0%) |
| $2,500 to $2,999 | 9 (0.4%) | 0 (0.0%) |
| $3,000 or more | 4 (0.2%) | 0 (0.0%) |
| Total | 2,355 (100.0%) | 675 (100.0%) |
Physical Housing Characteristics in Catahoula Parish
Housing Structures in Catahoula Parish
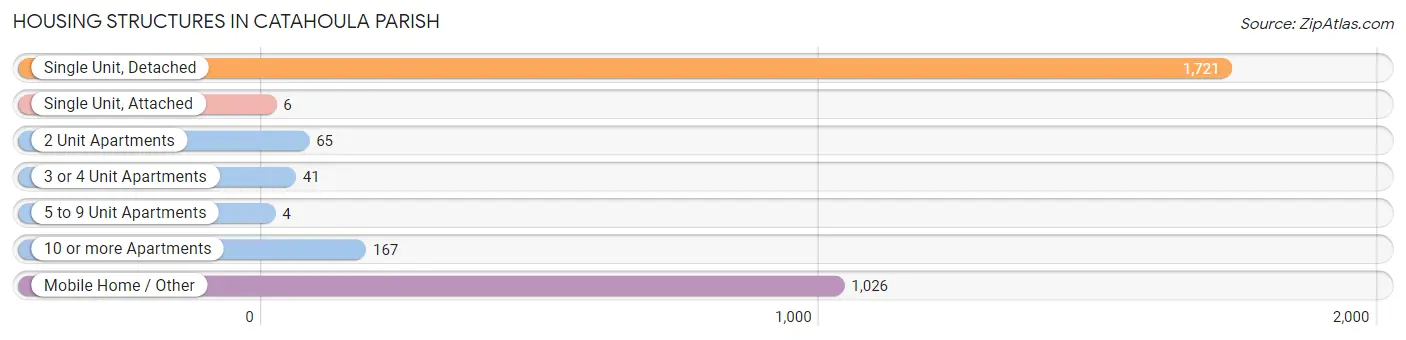
| Structure Type | # Housing Units | % Housing Units |
| Single Unit, Detached | 1,721 | 56.8% |
| Single Unit, Attached | 6 | 0.2% |
| 2 Unit Apartments | 65 | 2.1% |
| 3 or 4 Unit Apartments | 41 | 1.3% |
| 5 to 9 Unit Apartments | 4 | 0.1% |
| 10 or more Apartments | 167 | 5.5% |
| Mobile Home / Other | 1,026 | 33.9% |
| Total | 3,030 | 100.0% |
Housing Structures by Occupancy in Catahoula Parish
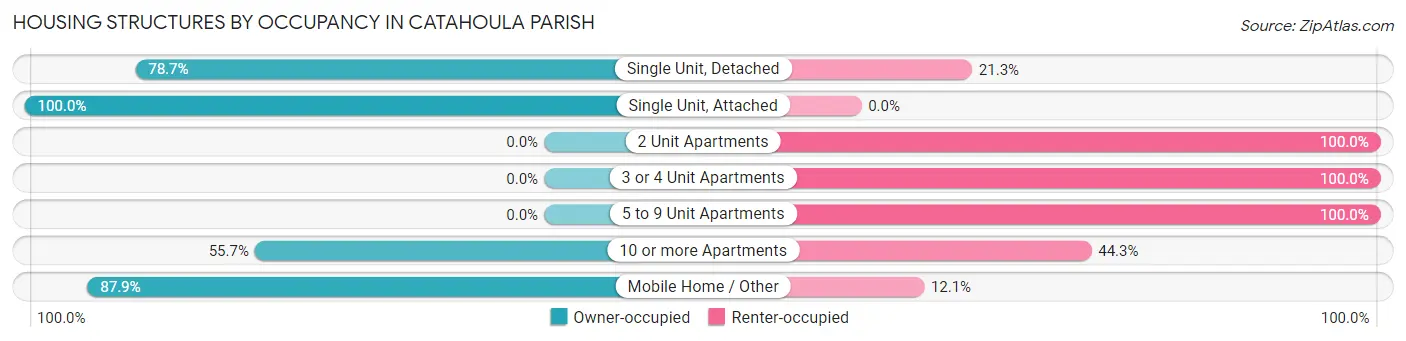
| Structure Type | Owner-occupied | Renter-occupied |
| Single Unit, Detached | 1,354 (78.7%) | 367 (21.3%) |
| Single Unit, Attached | 6 (100.0%) | 0 (0.0%) |
| 2 Unit Apartments | 0 (0.0%) | 65 (100.0%) |
| 3 or 4 Unit Apartments | 0 (0.0%) | 41 (100.0%) |
| 5 to 9 Unit Apartments | 0 (0.0%) | 4 (100.0%) |
| 10 or more Apartments | 93 (55.7%) | 74 (44.3%) |
| Mobile Home / Other | 902 (87.9%) | 124 (12.1%) |
| Total | 2,355 (77.7%) | 675 (22.3%) |
Housing Structures by Number of Rooms in Catahoula Parish
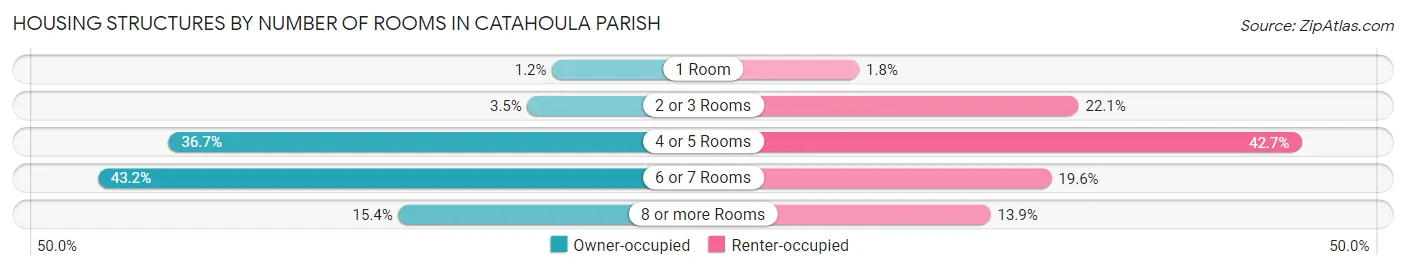
| Number of Rooms | Owner-occupied | Renter-occupied |
| 1 Room | 28 (1.2%) | 12 (1.8%) |
| 2 or 3 Rooms | 82 (3.5%) | 149 (22.1%) |
| 4 or 5 Rooms | 864 (36.7%) | 288 (42.7%) |
| 6 or 7 Rooms | 1,018 (43.2%) | 132 (19.6%) |
| 8 or more Rooms | 363 (15.4%) | 94 (13.9%) |
| Total | 2,355 (100.0%) | 675 (100.0%) |
Housing Structure by Heating Type in Catahoula Parish
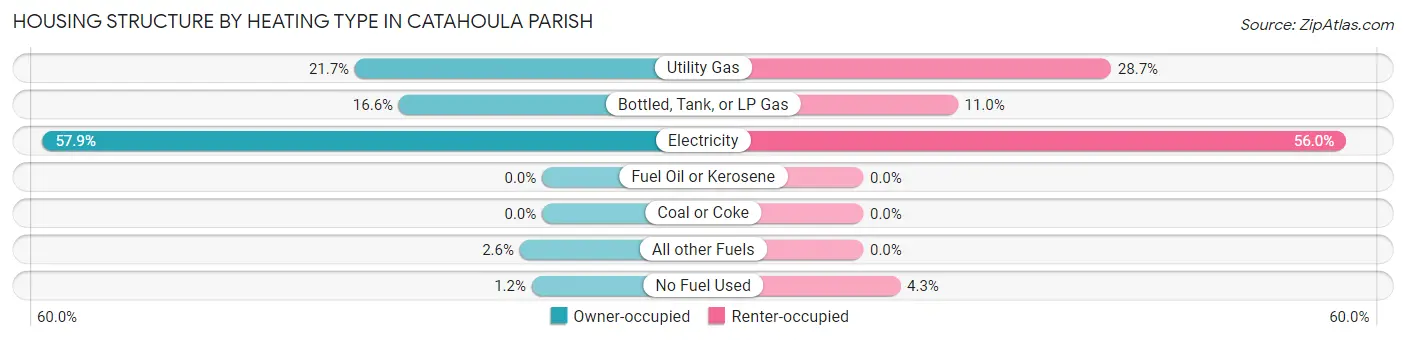
| Heating Type | Owner-occupied | Renter-occupied |
| Utility Gas | 511 (21.7%) | 194 (28.7%) |
| Bottled, Tank, or LP Gas | 391 (16.6%) | 74 (11.0%) |
| Electricity | 1,364 (57.9%) | 378 (56.0%) |
| Fuel Oil or Kerosene | 0 (0.0%) | 0 (0.0%) |
| Coal or Coke | 0 (0.0%) | 0 (0.0%) |
| All other Fuels | 61 (2.6%) | 0 (0.0%) |
| No Fuel Used | 28 (1.2%) | 29 (4.3%) |
| Total | 2,355 (100.0%) | 675 (100.0%) |
Household Vehicle Usage in Catahoula Parish
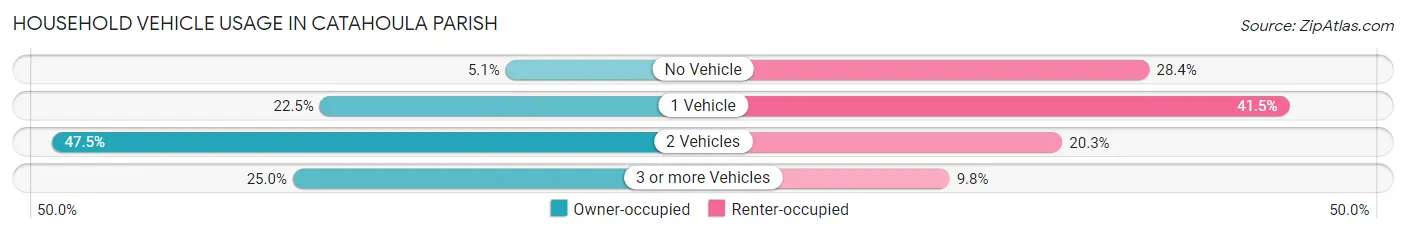
| Vehicles per Household | Owner-occupied | Renter-occupied |
| No Vehicle | 120 (5.1%) | 192 (28.4%) |
| 1 Vehicle | 529 (22.5%) | 280 (41.5%) |
| 2 Vehicles | 1,118 (47.5%) | 137 (20.3%) |
| 3 or more Vehicles | 588 (25.0%) | 66 (9.8%) |
| Total | 2,355 (100.0%) | 675 (100.0%) |
Real Estate & Mortgages in Catahoula Parish
Real Estate and Mortgage Overview in Catahoula Parish
| Characteristic | Without Mortgage | With Mortgage |
| Housing Units | 1,688 | 667 |
| Median Property Value | $85,900 | $125,800 |
| Median Household Income | $53,810 | $120 |
| Monthly Housing Costs | $372 | $4 |
| Real Estate Taxes | $226 | $281 |
Property Value by Mortgage Status in Catahoula Parish
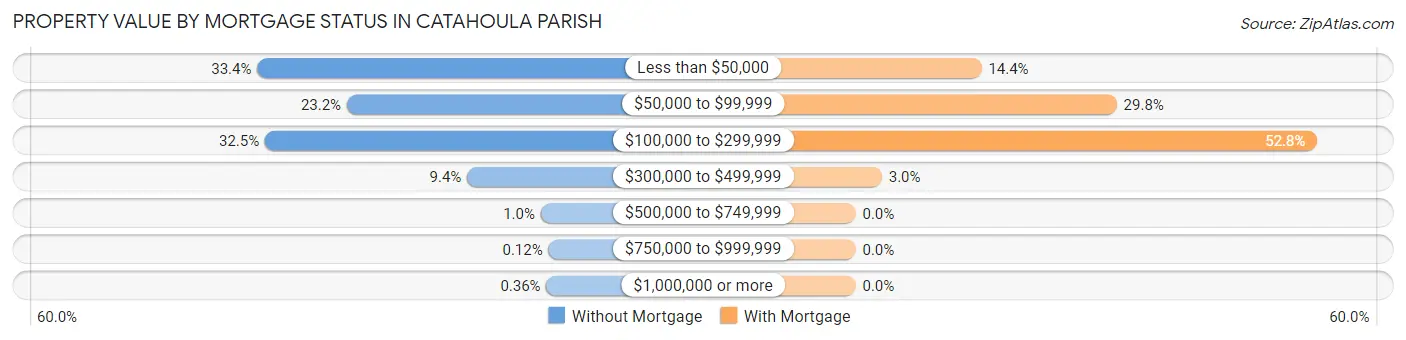
| Property Value | Without Mortgage | With Mortgage |
| Less than $50,000 | 564 (33.4%) | 96 (14.4%) |
| $50,000 to $99,999 | 391 (23.2%) | 199 (29.8%) |
| $100,000 to $299,999 | 549 (32.5%) | 352 (52.8%) |
| $300,000 to $499,999 | 159 (9.4%) | 20 (3.0%) |
| $500,000 to $749,999 | 17 (1.0%) | 0 (0.0%) |
| $750,000 to $999,999 | 2 (0.1%) | 0 (0.0%) |
| $1,000,000 or more | 6 (0.4%) | 0 (0.0%) |
| Total | 1,688 (100.0%) | 667 (100.0%) |
Household Income by Mortgage Status in Catahoula Parish
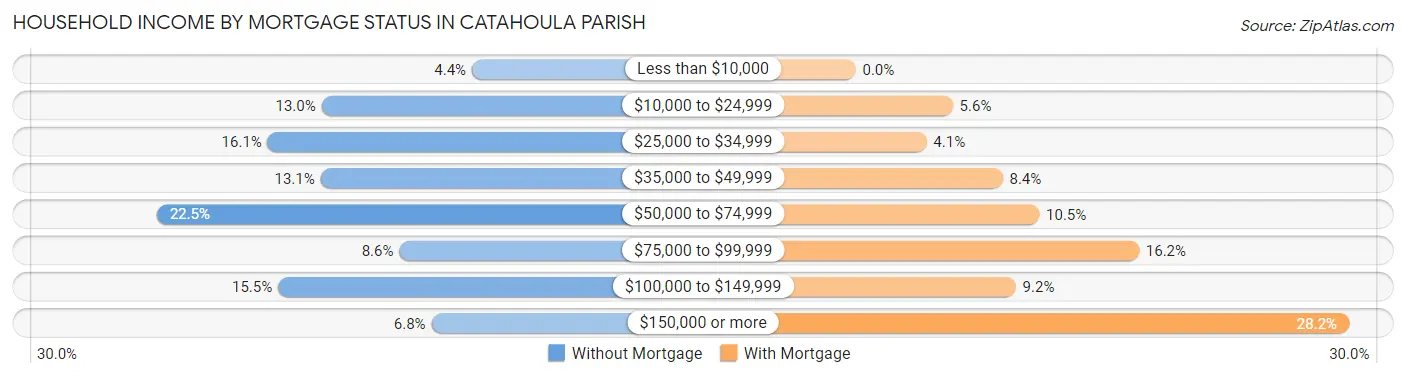
| Household Income | Without Mortgage | With Mortgage |
| Less than $10,000 | 75 (4.4%) | 0 (0.0%) |
| $10,000 to $24,999 | 220 (13.0%) | 37 (5.6%) |
| $25,000 to $34,999 | 272 (16.1%) | 27 (4.1%) |
| $35,000 to $49,999 | 221 (13.1%) | 56 (8.4%) |
| $50,000 to $74,999 | 379 (22.5%) | 70 (10.5%) |
| $75,000 to $99,999 | 145 (8.6%) | 108 (16.2%) |
| $100,000 to $149,999 | 262 (15.5%) | 61 (9.1%) |
| $150,000 or more | 114 (6.8%) | 188 (28.2%) |
| Total | 1,688 (100.0%) | 667 (100.0%) |
Property Value to Household Income Ratio in Catahoula Parish
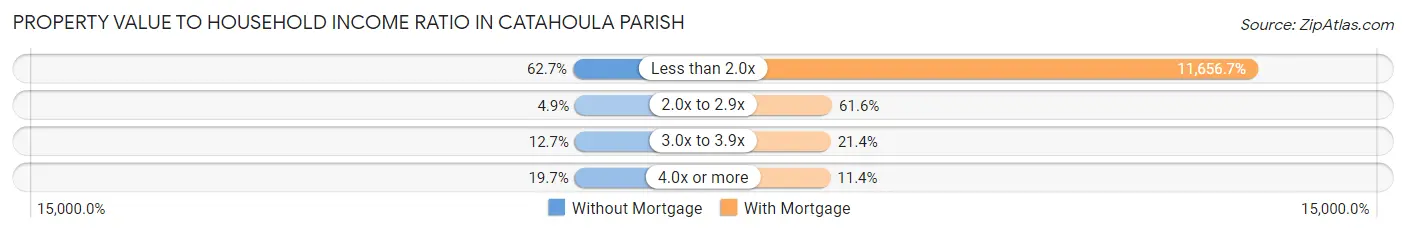
| Value-to-Income Ratio | Without Mortgage | With Mortgage |
| Less than 2.0x | 1,058 (62.7%) | 77,750 (11,656.7%) |
| 2.0x to 2.9x | 82 (4.9%) | 411 (61.6%) |
| 3.0x to 3.9x | 215 (12.7%) | 143 (21.4%) |
| 4.0x or more | 333 (19.7%) | 76 (11.4%) |
| Total | 1,688 (100.0%) | 667 (100.0%) |
Real Estate Taxes by Mortgage Status in Catahoula Parish
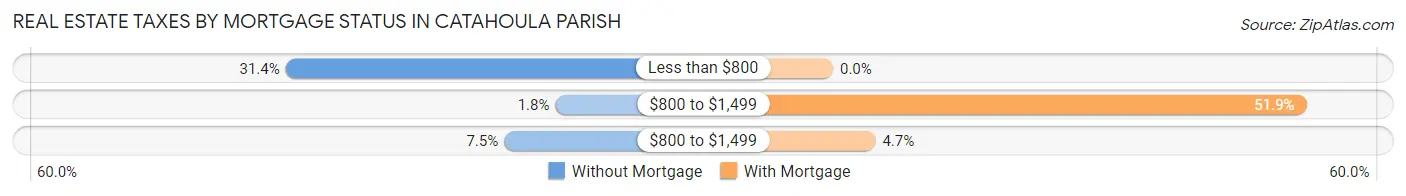
| Property Taxes | Without Mortgage | With Mortgage |
| Less than $800 | 530 (31.4%) | 0 (0.0%) |
| $800 to $1,499 | 31 (1.8%) | 346 (51.9%) |
| $800 to $1,499 | 126 (7.5%) | 31 (4.6%) |
| Total | 1,688 (100.0%) | 667 (100.0%) |
Health & Disability in Catahoula Parish
Health Insurance Coverage by Age in Catahoula Parish
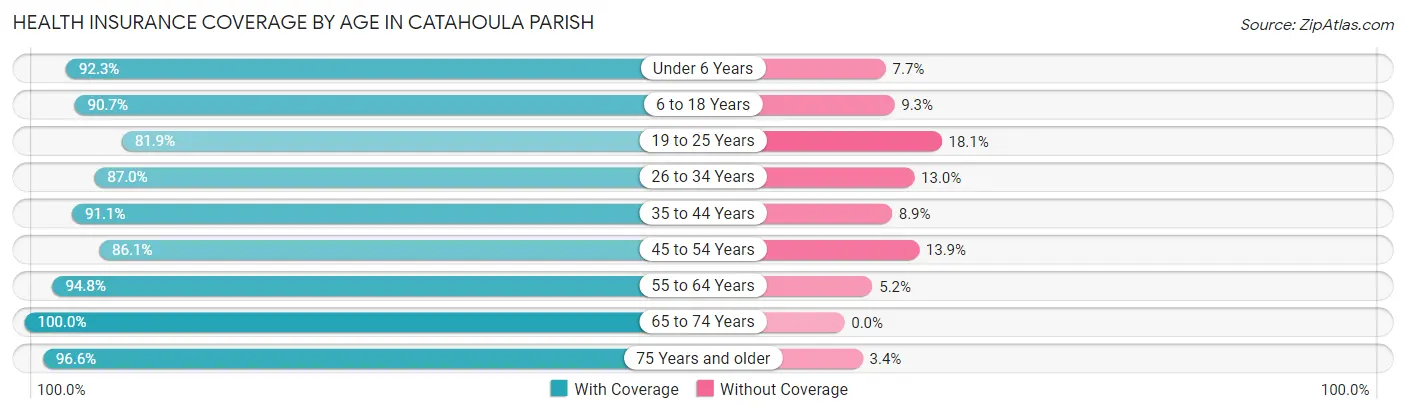
| Age Bracket | With Coverage | Without Coverage |
| Under 6 Years | 634 (92.3%) | 53 (7.7%) |
| 6 to 18 Years | 1,167 (90.7%) | 120 (9.3%) |
| 19 to 25 Years | 420 (81.9%) | 93 (18.1%) |
| 26 to 34 Years | 628 (87.0%) | 94 (13.0%) |
| 35 to 44 Years | 844 (91.1%) | 82 (8.9%) |
| 45 to 54 Years | 638 (86.1%) | 103 (13.9%) |
| 55 to 64 Years | 1,252 (94.8%) | 69 (5.2%) |
| 65 to 74 Years | 908 (100.0%) | 0 (0.0%) |
| 75 Years and older | 509 (96.6%) | 18 (3.4%) |
| Total | 7,000 (91.7%) | 632 (8.3%) |
Health Insurance Coverage by Citizenship Status in Catahoula Parish

| Citizenship Status | With Coverage | Without Coverage |
| Native Born | 634 (92.3%) | 53 (7.7%) |
| Foreign Born, Citizen | 1,167 (90.7%) | 120 (9.3%) |
| Foreign Born, not a Citizen | 420 (81.9%) | 93 (18.1%) |
Health Insurance Coverage by Household Income in Catahoula Parish
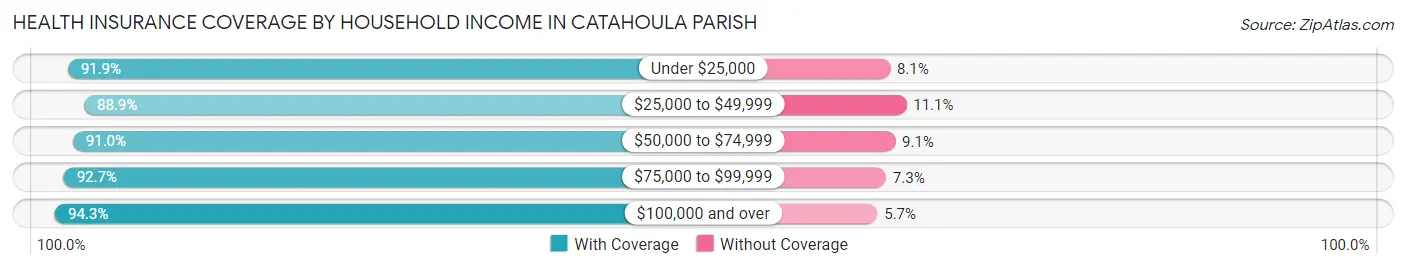
| Household Income | With Coverage | Without Coverage |
| Under $25,000 | 1,295 (91.9%) | 114 (8.1%) |
| $25,000 to $49,999 | 1,786 (88.9%) | 224 (11.1%) |
| $50,000 to $74,999 | 1,126 (90.9%) | 112 (9.0%) |
| $75,000 to $99,999 | 695 (92.7%) | 55 (7.3%) |
| $100,000 and over | 2,098 (94.3%) | 127 (5.7%) |
Public vs Private Health Insurance Coverage by Age in Catahoula Parish
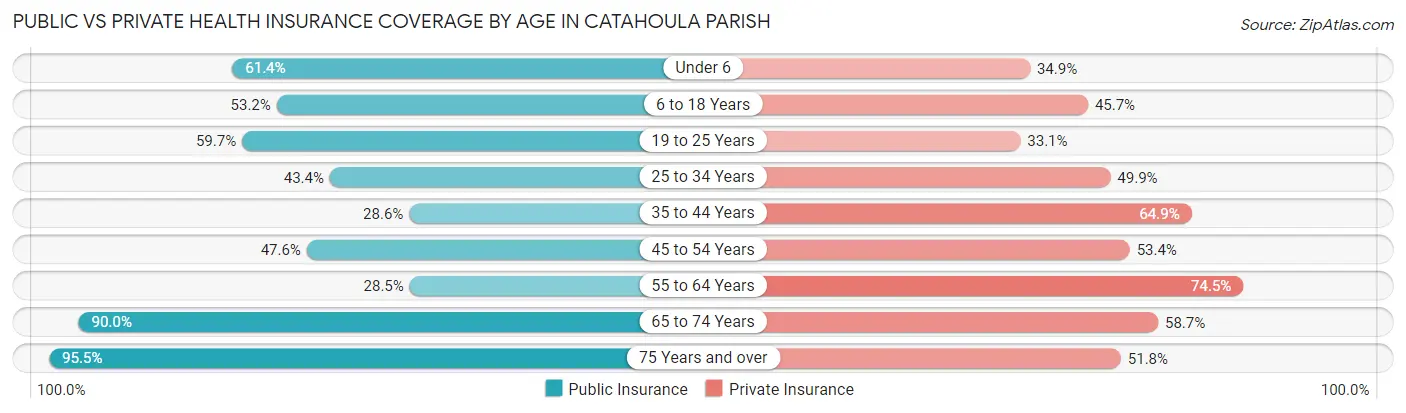
| Age Bracket | Public Insurance | Private Insurance |
| Under 6 | 422 (61.4%) | 240 (34.9%) |
| 6 to 18 Years | 685 (53.2%) | 588 (45.7%) |
| 19 to 25 Years | 306 (59.7%) | 170 (33.1%) |
| 25 to 34 Years | 313 (43.3%) | 360 (49.9%) |
| 35 to 44 Years | 265 (28.6%) | 601 (64.9%) |
| 45 to 54 Years | 353 (47.6%) | 396 (53.4%) |
| 55 to 64 Years | 377 (28.5%) | 984 (74.5%) |
| 65 to 74 Years | 817 (90.0%) | 533 (58.7%) |
| 75 Years and over | 503 (95.5%) | 273 (51.8%) |
| Total | 4,041 (52.9%) | 4,145 (54.3%) |
Disability Status by Sex by Age in Catahoula Parish
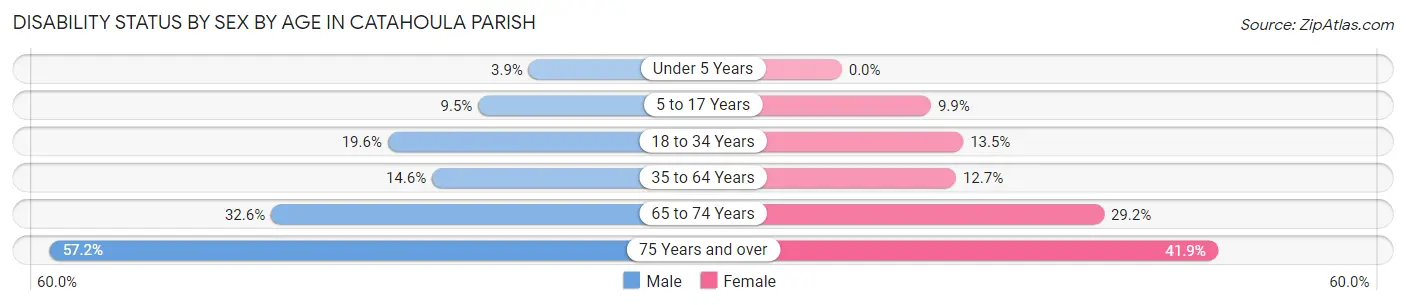
| Age Bracket | Male | Female |
| Under 5 Years | 10 (3.9%) | 0 (0.0%) |
| 5 to 17 Years | 69 (9.5%) | 72 (9.9%) |
| 18 to 34 Years | 89 (19.6%) | 109 (13.5%) |
| 35 to 64 Years | 198 (14.6%) | 208 (12.7%) |
| 65 to 74 Years | 154 (32.6%) | 127 (29.2%) |
| 75 Years and over | 147 (57.2%) | 113 (41.8%) |
Disability Class by Sex by Age in Catahoula Parish
Disability Class: Hearing Difficulty
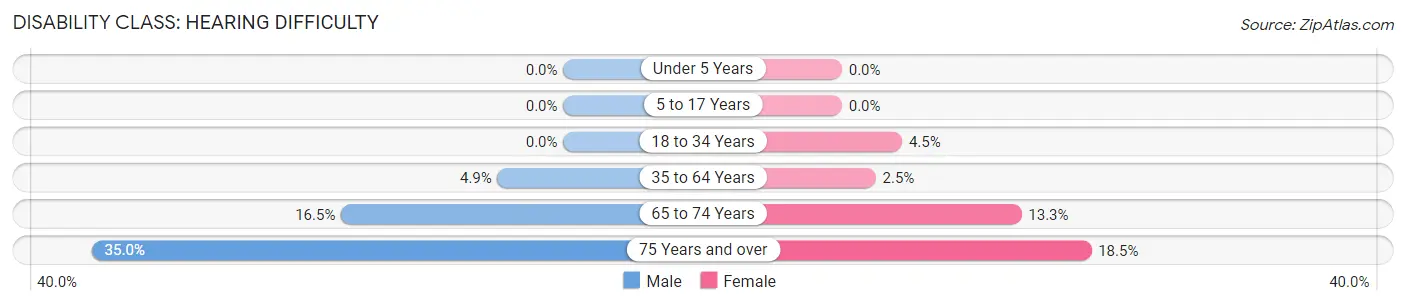
| Age Bracket | Male | Female |
| Under 5 Years | 0 (0.0%) | 0 (0.0%) |
| 5 to 17 Years | 0 (0.0%) | 0 (0.0%) |
| 18 to 34 Years | 0 (0.0%) | 36 (4.5%) |
| 35 to 64 Years | 66 (4.9%) | 41 (2.5%) |
| 65 to 74 Years | 78 (16.5%) | 58 (13.3%) |
| 75 Years and over | 90 (35.0%) | 50 (18.5%) |
Disability Class: Vision Difficulty
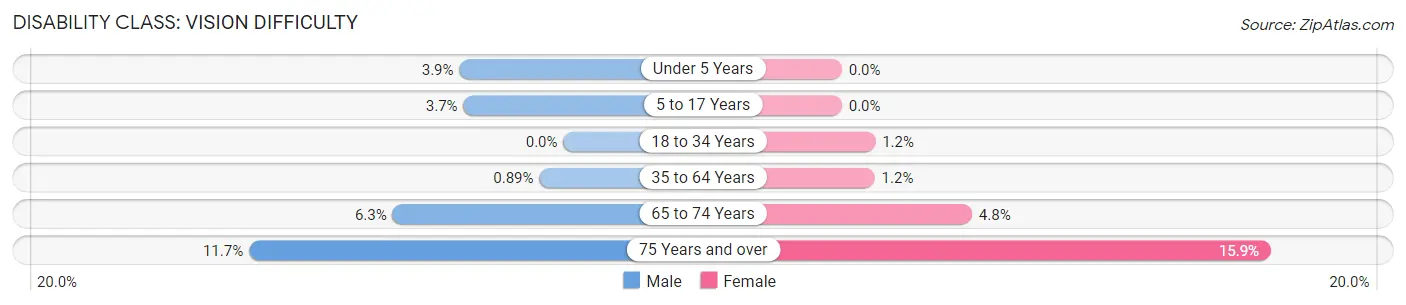
| Age Bracket | Male | Female |
| Under 5 Years | 10 (3.9%) | 0 (0.0%) |
| 5 to 17 Years | 27 (3.7%) | 0 (0.0%) |
| 18 to 34 Years | 0 (0.0%) | 10 (1.2%) |
| 35 to 64 Years | 12 (0.9%) | 20 (1.2%) |
| 65 to 74 Years | 30 (6.3%) | 21 (4.8%) |
| 75 Years and over | 30 (11.7%) | 43 (15.9%) |
Disability Class: Cognitive Difficulty
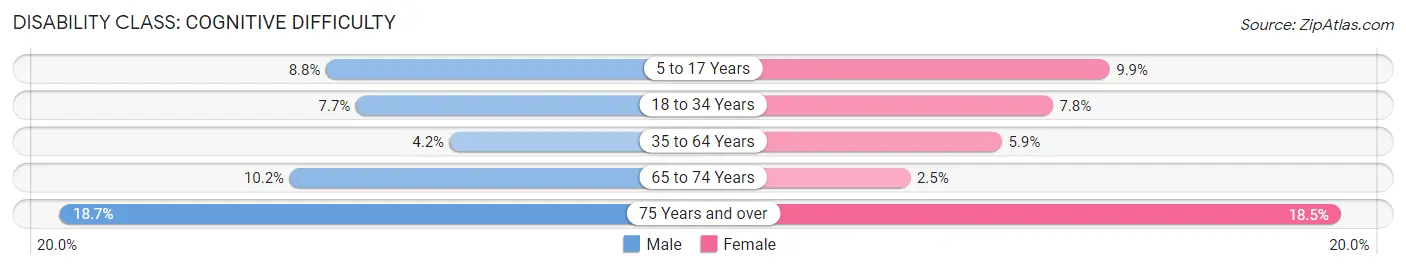
| Age Bracket | Male | Female |
| 5 to 17 Years | 64 (8.8%) | 72 (9.9%) |
| 18 to 34 Years | 35 (7.7%) | 63 (7.8%) |
| 35 to 64 Years | 57 (4.2%) | 97 (5.9%) |
| 65 to 74 Years | 48 (10.2%) | 11 (2.5%) |
| 75 Years and over | 48 (18.7%) | 50 (18.5%) |
Disability Class: Ambulatory Difficulty
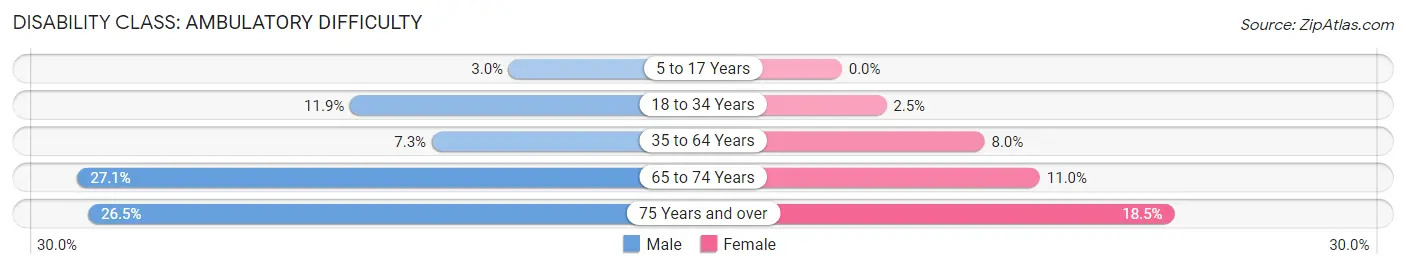
| Age Bracket | Male | Female |
| 5 to 17 Years | 22 (3.0%) | 0 (0.0%) |
| 18 to 34 Years | 54 (11.9%) | 20 (2.5%) |
| 35 to 64 Years | 99 (7.3%) | 130 (8.0%) |
| 65 to 74 Years | 128 (27.1%) | 48 (11.0%) |
| 75 Years and over | 68 (26.5%) | 50 (18.5%) |
Disability Class: Self-Care Difficulty
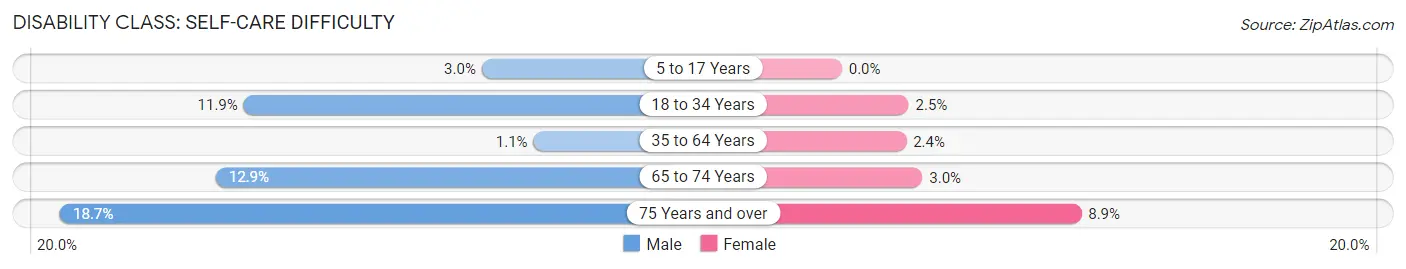
| Age Bracket | Male | Female |
| 5 to 17 Years | 22 (3.0%) | 0 (0.0%) |
| 18 to 34 Years | 54 (11.9%) | 20 (2.5%) |
| 35 to 64 Years | 15 (1.1%) | 39 (2.4%) |
| 65 to 74 Years | 61 (12.9%) | 13 (3.0%) |
| 75 Years and over | 48 (18.7%) | 24 (8.9%) |
Technology Access in Catahoula Parish
Computing Device Access in Catahoula Parish
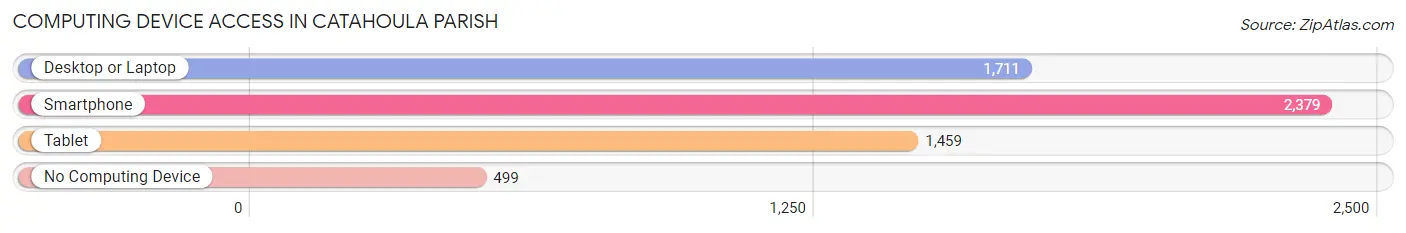
| Device Type | # Households | % Households |
| Desktop or Laptop | 1,711 | 56.5% |
| Smartphone | 2,379 | 78.5% |
| Tablet | 1,459 | 48.1% |
| No Computing Device | 499 | 16.5% |
| Total | 3,030 | 100.0% |
Internet Access in Catahoula Parish
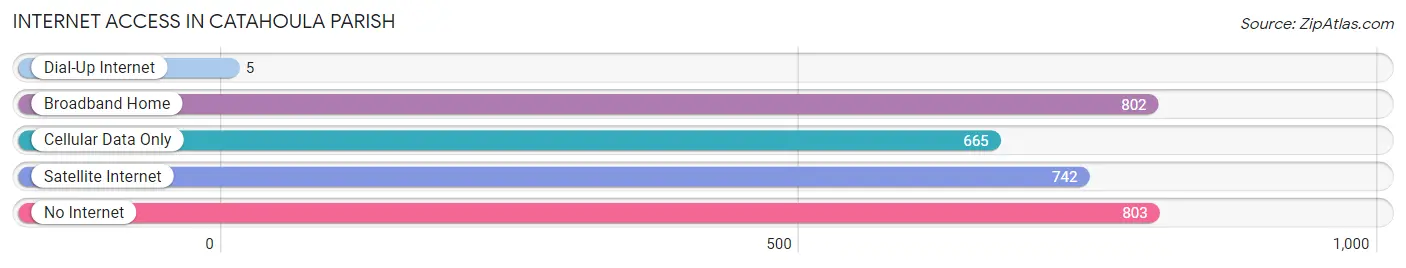
| Internet Type | # Households | % Households |
| Dial-Up Internet | 5 | 0.2% |
| Broadband Home | 802 | 26.5% |
| Cellular Data Only | 665 | 22.0% |
| Satellite Internet | 742 | 24.5% |
| No Internet | 803 | 26.5% |
| Total | 3,030 | 100.0% |
Catahoula Parish Summary
Catahoula Parish is located in the northeastern part of Louisiana, and is bordered by Franklin, LaSalle, Concordia, and Winn Parishes. It is named after the Catahoula Native American tribe, which inhabited the area prior to European settlement. The parish seat is Harrisonburg, and the largest city is Jonesville. The parish has a total area of 845 square miles, and a population of 10,914 as of the 2010 census.
Geography
Catahoula Parish is located in the northeastern part of Louisiana, and is bordered by Franklin, LaSalle, Concordia, and Winn Parishes. It is named after the Catahoula Native American tribe, which inhabited the area prior to European settlement. The parish seat is Harrisonburg, and the largest city is Jonesville. The parish has a total area of 845 square miles, and a population of 10,914 as of the 2010 census.
The terrain of Catahoula Parish is mostly flat, with some rolling hills in the northern part of the parish. The parish is drained by the Ouachita River, which forms the western boundary of the parish. The parish is also home to several small lakes, including Lake Catahoula, Lake D'Arbonne, and Lake Bruin.
History
Catahoula Parish was established in 1808, and was named after the Catahoula Native American tribe, which inhabited the area prior to European settlement. The parish was originally part of the larger Ouachita Parish, but was split off in 1808.
The parish was largely rural until the early 20th century, when the timber industry began to boom in the area. This led to the development of several small towns, including Harrisonburg, Jonesville, and Sicily Island.
Economy
Catahoula Parish is largely rural, and the economy is largely based on agriculture and timber. The parish is home to several large timber companies, including Weyerhaeuser and International Paper. The timber industry is the largest employer in the parish, and is responsible for the majority of the jobs in the area.
The parish is also home to several small businesses, including restaurants, retail stores, and service providers. The parish is also home to several small manufacturing companies, including a furniture factory and a paper mill.
Demographics
As of the 2010 census, Catahoula Parish had a population of 10,914. The racial makeup of the parish was 79.3% White, 18.2% African American, 0.5% Native American, 0.3% Asian, 0.1% Pacific Islander, 0.7% from other races, and 1.0% from two or more races. Hispanic or Latino of any race were 1.7% of the population.
The median income for a household in the parish was $30,938, and the median income for a family was $37,917. The per capita income for the parish was $15,945. About 19.2% of families and 24.2% of the population were below the poverty line, including 33.3% of those under age 18 and 18.2% of those age 65 or over.
Common Questions
What is the Total Population of Catahoula Parish?
Total Population of Catahoula Parish is 8,895.
What is the Total Male Population of Catahoula Parish?
Total Male Population of Catahoula Parish is 4,655.
What is the Total Female Population of Catahoula Parish?
Total Female Population of Catahoula Parish is 4,240.
What is the Ratio of Males per 100 Females in Catahoula Parish?
There are 109.79 Males per 100 Females in Catahoula Parish.
What is the Ratio of Females per 100 Males in Catahoula Parish?
There are 91.08 Females per 100 Males in Catahoula Parish.
What is the Median Population Age in Catahoula Parish?
Median Population Age in Catahoula Parish is 38.8 Years.
What is the Average Family Size in Catahoula Parish
Average Family Size in Catahoula Parish is 3.0 People.
What is the Average Household Size in Catahoula Parish
Average Household Size in Catahoula Parish is 2.5 People.
What is Per Capita Income in Catahoula Parish?
Per Capita income in Catahoula Parish is $24,910.
What is the Median Family Income in Catahoula Parish?
Median Family Income in Catahoula Parish is $63,792.
What is the Median Household income in Catahoula Parish?
Median Household Income in Catahoula Parish is $48,259.
What is Income or Wage Gap in Catahoula Parish?
Income or Wage Gap in Catahoula Parish is 28.3%.
Women in Catahoula Parish earn 71.7 cents for every dollar earned by a man.
What is Inequality or Gini Index in Catahoula Parish?
Inequality or Gini Index in Catahoula Parish is 0.46.
How Large is the Labor Force in Catahoula Parish?
There are 3,132 People in the Labor Forcein in Catahoula Parish.
What is the Percentage of People in the Labor Force in Catahoula Parish?
43.6% of People are in the Labor Force in Catahoula Parish.
What is the Unemployment Rate in Catahoula Parish?
Unemployment Rate in Catahoula Parish is 6.5%.