Caldwell Parish, LA
Caldwell Parish Map
Caldwell Parish Overview
9,658
TOTAL POPULATION
5,100
MALE POPULATION
4,558
FEMALE POPULATION
111.89
MALES / 100 FEMALES
89.37
FEMALES / 100 MALES
40.2
MEDIAN AGE
3.2
AVG FAMILY SIZE
2.7
AVG HOUSEHOLD SIZE
$28,491
PER CAPITA INCOME
$67,383
AVG FAMILY INCOME
$45,707
AVG HOUSEHOLD INCOME
21.4%
WAGE / INCOME GAP [ % ]
78.6¢/ $1
WAGE / INCOME GAP [ $ ]
0.53
INEQUALITY / GINI INDEX
3,626
LABOR FORCE [ PEOPLE ]
47.3%
PERCENT IN LABOR FORCE
12.9%
UNEMPLOYMENT RATE
Caldwell Parish Area Codes
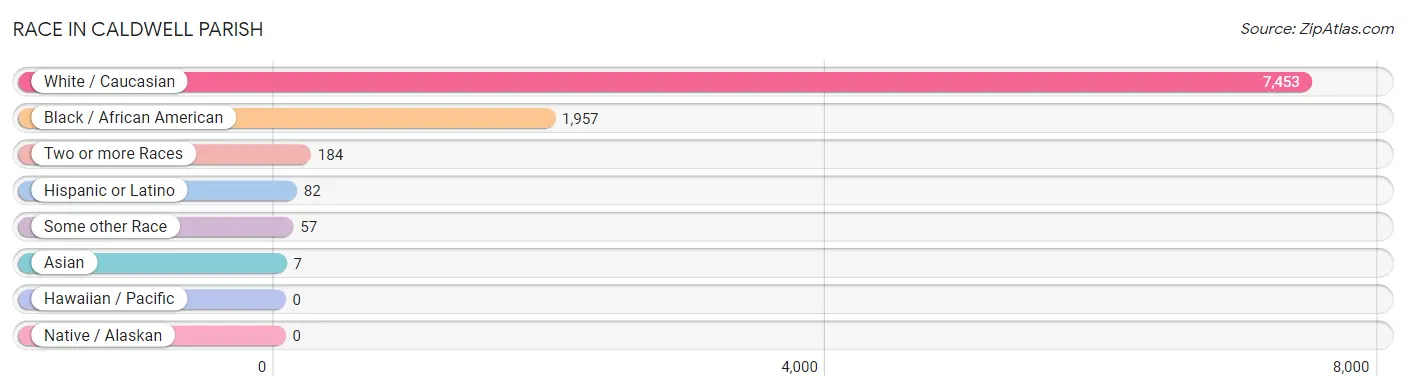
Race in Caldwell Parish
The most populous races in Caldwell Parish are White / Caucasian (7,453 | 77.2%), Black / African American (1,957 | 20.3%), and Two or more Races (184 | 1.9%).
| Race | # Population | % Population |
| Asian | 7 | 0.1% |
| Black / African American | 1,957 | 20.3% |
| Hawaiian / Pacific | 0 | 0.0% |
| Hispanic or Latino | 82 | 0.9% |
| Native / Alaskan | 0 | 0.0% |
| White / Caucasian | 7,453 | 77.2% |
| Two or more Races | 184 | 1.9% |
| Some other Race | 57 | 0.6% |
| Total | 9,658 | 100.0% |
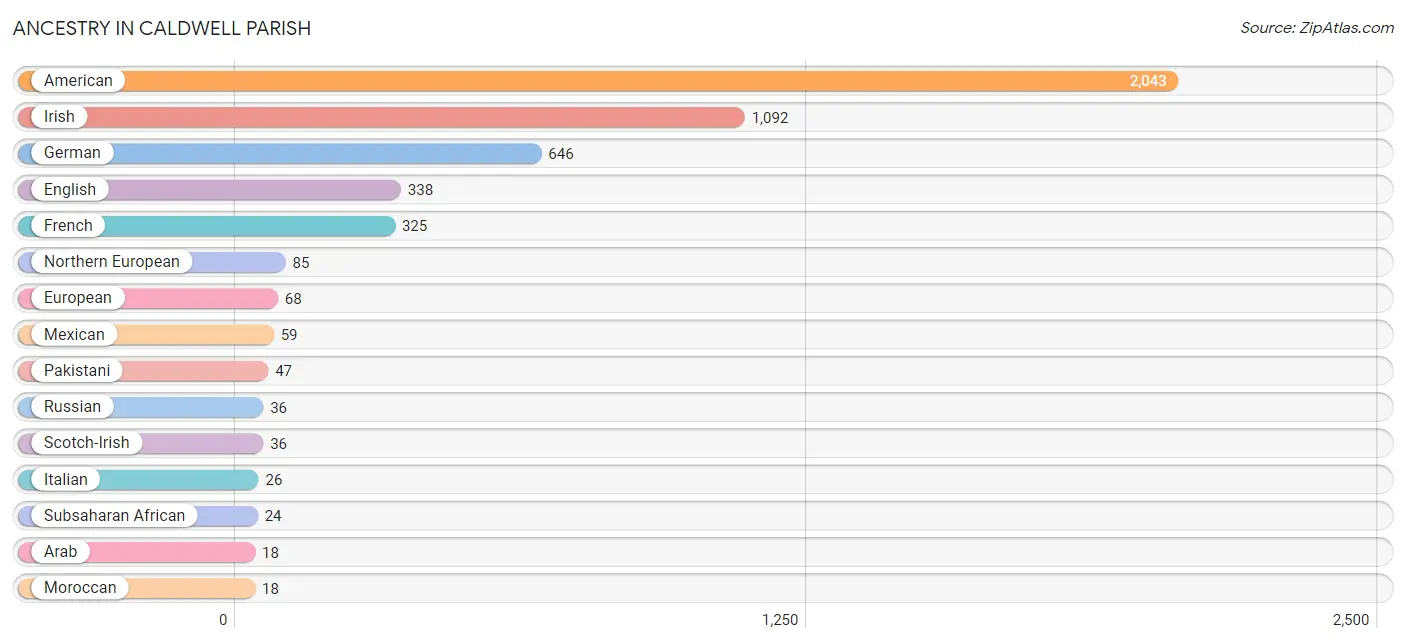
Ancestry in Caldwell Parish
The most populous ancestries reported in Caldwell Parish are American (2,043 | 21.1%), Irish (1,092 | 11.3%), German (646 | 6.7%), English (338 | 3.5%), and French (325 | 3.4%), together accounting for 46.0% of all Caldwell Parish residents.
| Ancestry | # Population | % Population |
| African | 6 | 0.1% |
| American | 2,043 | 21.1% |
| Arab | 18 | 0.2% |
| Belgian | 15 | 0.2% |
| Bhutanese | 6 | 0.1% |
| British | 9 | 0.1% |
| Cherokee | 1 | 0.0% |
| Czech | 1 | 0.0% |
| Dutch | 16 | 0.2% |
| English | 338 | 3.5% |
| European | 68 | 0.7% |
| French | 325 | 3.4% |
| German | 646 | 6.7% |
| Greek | 14 | 0.1% |
| Guamanian / Chamorro | 7 | 0.1% |
| Hungarian | 11 | 0.1% |
| Irish | 1,092 | 11.3% |
| Italian | 26 | 0.3% |
| Jamaican | 9 | 0.1% |
| Korean | 5 | 0.1% |
| Mexican | 59 | 0.6% |
| Moroccan | 18 | 0.2% |
| Nigerian | 18 | 0.2% |
| Northern European | 85 | 0.9% |
| Pakistani | 47 | 0.5% |
| Polish | 5 | 0.1% |
| Russian | 36 | 0.4% |
| Scotch-Irish | 36 | 0.4% |
| Scottish | 10 | 0.1% |
| Spaniard | 14 | 0.1% |
| Subsaharan African | 24 | 0.3% | View All 31 Rows |
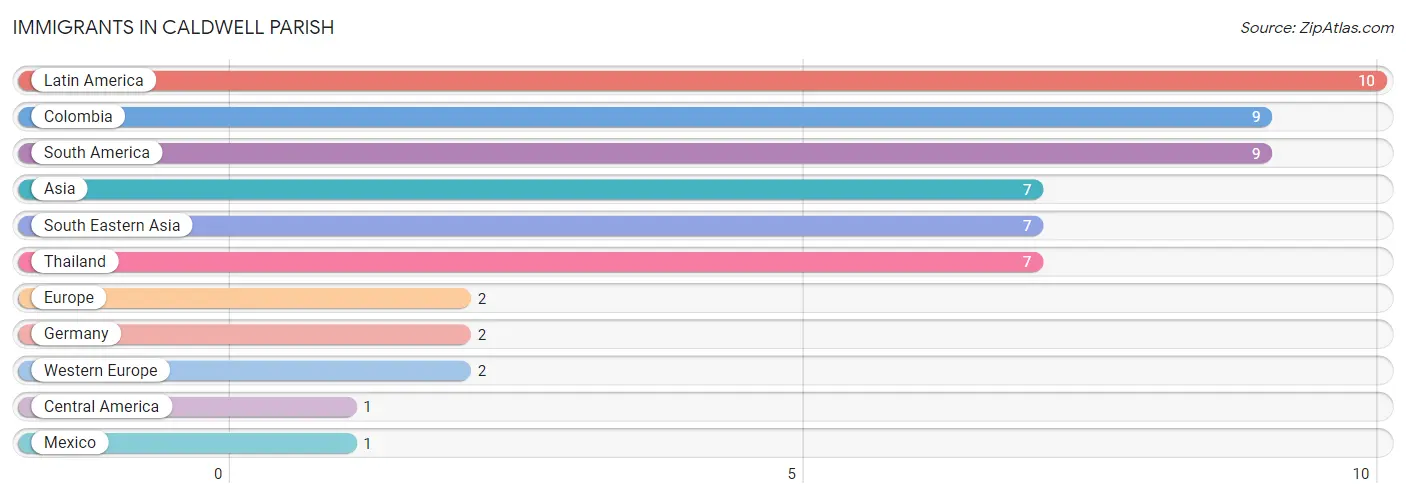
Immigrants in Caldwell Parish
The most numerous immigrant groups reported in Caldwell Parish came from Latin America (10 | 0.1%), Colombia (9 | 0.1%), South America (9 | 0.1%), Asia (7 | 0.1%), and South Eastern Asia (7 | 0.1%), together accounting for 0.4% of all Caldwell Parish residents.
| Immigration Origin | # Population | % Population |
| Asia | 7 | 0.1% |
| Central America | 1 | 0.0% |
| Colombia | 9 | 0.1% |
| Europe | 2 | 0.0% |
| Germany | 2 | 0.0% |
| Latin America | 10 | 0.1% |
| Mexico | 1 | 0.0% |
| South America | 9 | 0.1% |
| South Eastern Asia | 7 | 0.1% |
| Thailand | 7 | 0.1% |
| Western Europe | 2 | 0.0% | View All 11 Rows |
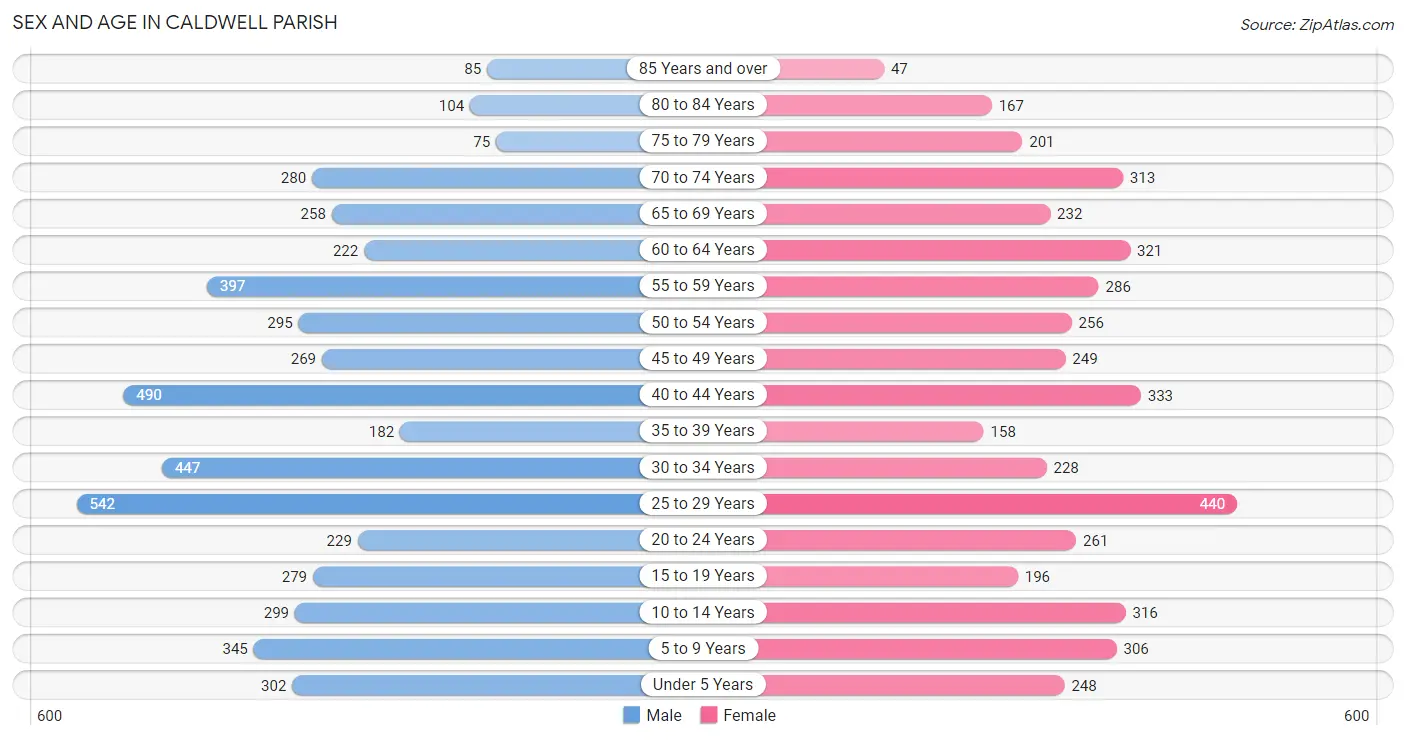
Sex and Age in Caldwell Parish
Sex and Age in Caldwell Parish
The most populous age groups in Caldwell Parish are 25 to 29 Years (542 | 10.6%) for men and 25 to 29 Years (440 | 9.7%) for women.
| Age Bracket | Male | Female |
| Under 5 Years | 302 (5.9%) | 248 (5.4%) |
| 5 to 9 Years | 345 (6.8%) | 306 (6.7%) |
| 10 to 14 Years | 299 (5.9%) | 316 (6.9%) |
| 15 to 19 Years | 279 (5.5%) | 196 (4.3%) |
| 20 to 24 Years | 229 (4.5%) | 261 (5.7%) |
| 25 to 29 Years | 542 (10.6%) | 440 (9.7%) |
| 30 to 34 Years | 447 (8.8%) | 228 (5.0%) |
| 35 to 39 Years | 182 (3.6%) | 158 (3.5%) |
| 40 to 44 Years | 490 (9.6%) | 333 (7.3%) |
| 45 to 49 Years | 269 (5.3%) | 249 (5.5%) |
| 50 to 54 Years | 295 (5.8%) | 256 (5.6%) |
| 55 to 59 Years | 397 (7.8%) | 286 (6.3%) |
| 60 to 64 Years | 222 (4.3%) | 321 (7.0%) |
| 65 to 69 Years | 258 (5.1%) | 232 (5.1%) |
| 70 to 74 Years | 280 (5.5%) | 313 (6.9%) |
| 75 to 79 Years | 75 (1.5%) | 201 (4.4%) |
| 80 to 84 Years | 104 (2.0%) | 167 (3.7%) |
| 85 Years and over | 85 (1.7%) | 47 (1.0%) |
| Total | 5,100 (100.0%) | 4,558 (100.0%) |
Families and Households in Caldwell Parish
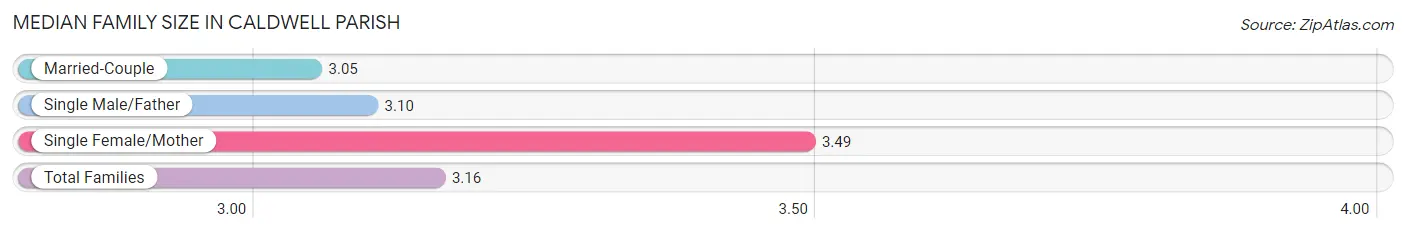
Median Family Size in Caldwell Parish
The median family size in Caldwell Parish is 3.16 persons per family, with single female/mother families (612 | 25.0%) accounting for the largest median family size of 3.49 persons per family. On the other hand, married-couple families (1,594 | 65.1%) represent the smallest median family size with 3.05 persons per family.
| Family Type | # Families | Family Size |
| Married-Couple | 1,594 (65.1%) | 3.05 |
| Single Male/Father | 243 (9.9%) | 3.10 |
| Single Female/Mother | 612 (25.0%) | 3.49 |
| Total Families | 2,449 (100.0%) | 3.16 |
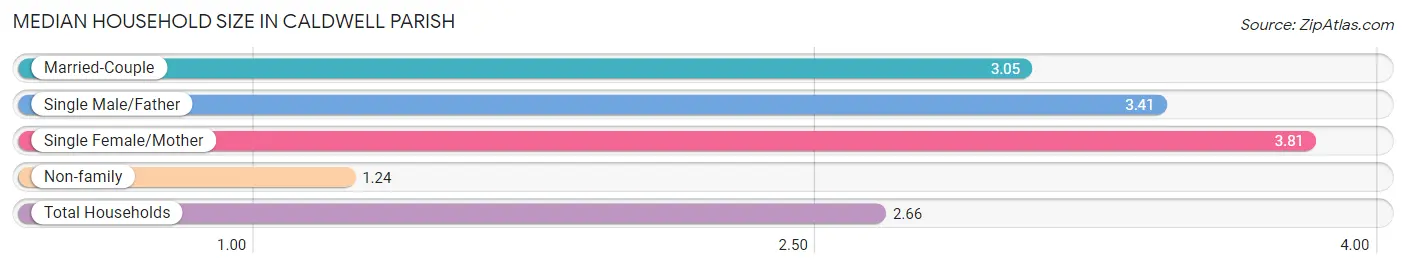
Median Household Size in Caldwell Parish
The median household size in Caldwell Parish is 2.66 persons per household, with single female/mother households (612 | 17.4%) accounting for the largest median household size of 3.81 persons per household. non-family households (1,072 | 30.4%) represent the smallest median household size with 1.24 persons per household.
| Household Type | # Households | Household Size |
| Married-Couple | 1,594 (45.3%) | 3.05 |
| Single Male/Father | 243 (6.9%) | 3.41 |
| Single Female/Mother | 612 (17.4%) | 3.81 |
| Non-family | 1,072 (30.4%) | 1.24 |
| Total Households | 3,521 (100.0%) | 2.66 |
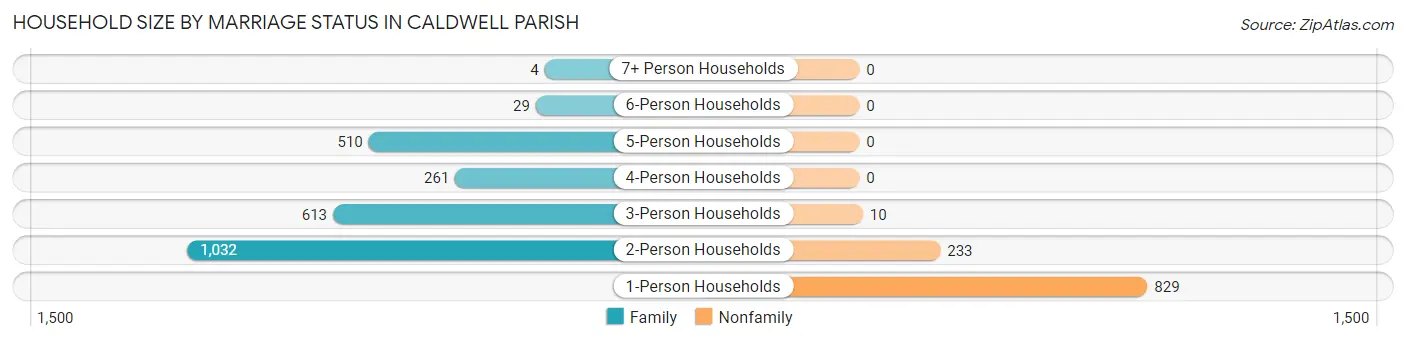
Household Size by Marriage Status in Caldwell Parish
Out of a total of 3,521 households in Caldwell Parish, 2,449 (69.6%) are family households, while 1,072 (30.4%) are nonfamily households. The most numerous type of family households are 2-person households, comprising 1,032, and the most common type of nonfamily households are 1-person households, comprising 829.
| Household Size | Family Households | Nonfamily Households |
| 1-Person Households | - | 829 (23.5%) |
| 2-Person Households | 1,032 (29.3%) | 233 (6.6%) |
| 3-Person Households | 613 (17.4%) | 10 (0.3%) |
| 4-Person Households | 261 (7.4%) | 0 (0.0%) |
| 5-Person Households | 510 (14.5%) | 0 (0.0%) |
| 6-Person Households | 29 (0.8%) | 0 (0.0%) |
| 7+ Person Households | 4 (0.1%) | 0 (0.0%) |
| Total | 2,449 (69.6%) | 1,072 (30.4%) |
Female Fertility in Caldwell Parish
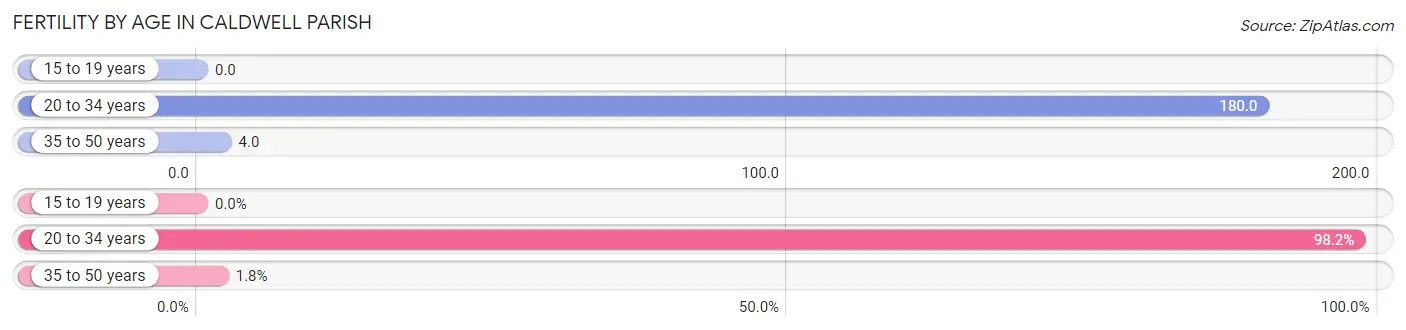
Fertility by Age in Caldwell Parish
Average fertility rate in Caldwell Parish is 91.0 births per 1,000 women. Women in the age bracket of 20 to 34 years have the highest fertility rate with 180.0 births per 1,000 women. Women in the age bracket of 20 to 34 years acount for 98.2% of all women with births.
| Age Bracket | Women with Births | Births / 1,000 Women |
| 15 to 19 years | 0 (0.0%) | 0.0 |
| 20 to 34 years | 167 (98.2%) | 180.0 |
| 35 to 50 years | 3 (1.8%) | 4.0 |
| Total | 170 (100.0%) | 91.0 |
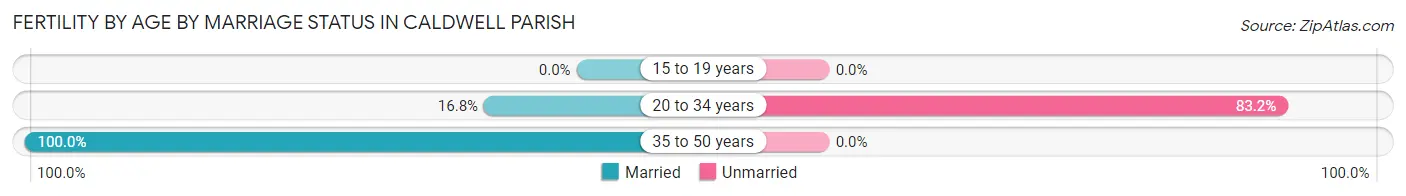
Fertility by Age by Marriage Status in Caldwell Parish
18.2% of women with births (170) in Caldwell Parish are married. The highest percentage of unmarried women with births falls into 20 to 34 years age bracket with 83.2% of them unmarried at the time of birth, while the lowest percentage of unmarried women with births belong to 35 to 50 years age bracket with 0.0% of them unmarried.
| Age Bracket | Married | Unmarried |
| 15 to 19 years | 0 (0.0%) | 0 (0.0%) |
| 20 to 34 years | 28 (16.8%) | 139 (83.2%) |
| 35 to 50 years | 3 (100.0%) | 0 (0.0%) |
| Total | 31 (18.2%) | 139 (81.8%) |
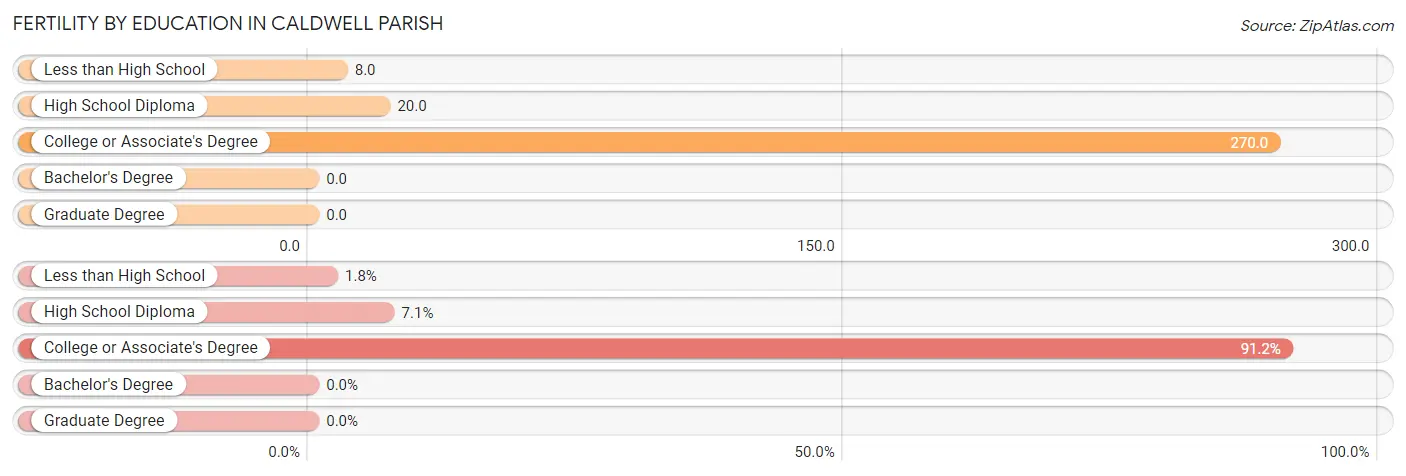
Fertility by Education in Caldwell Parish
| Educational Attainment | Women with Births | Births / 1,000 Women |
| Less than High School | 3 (1.8%) | 8.0 |
| High School Diploma | 12 (7.1%) | 20.0 |
| College or Associate's Degree | 155 (91.2%) | 270.0 |
| Bachelor's Degree | 0 (0.0%) | 0.0 |
| Graduate Degree | 0 (0.0%) | 0.0 |
| Total | 170 (100.0%) | 91.0 |
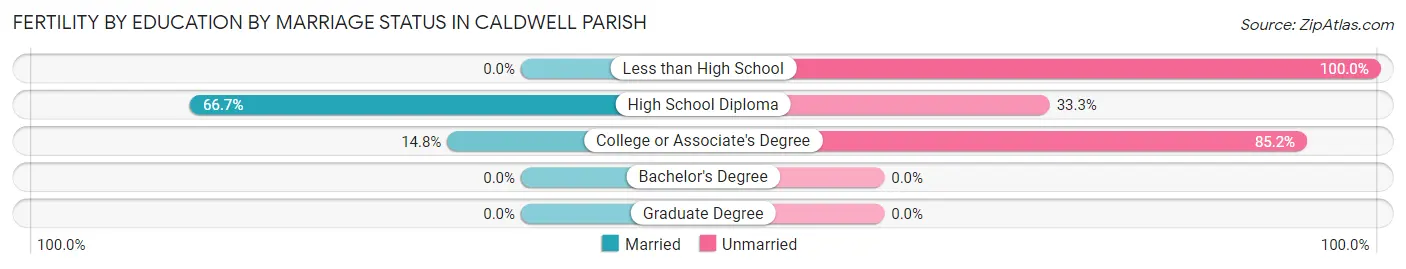
Fertility by Education by Marriage Status in Caldwell Parish
81.8% of women with births in Caldwell Parish are unmarried. Women with the educational attainment of high school diploma are most likely to be married with 66.7% of them married at childbirth, while women with the educational attainment of less than high school are least likely to be married with 100.0% of them unmarried at childbirth.
| Educational Attainment | Married | Unmarried |
| Less than High School | 0 (0.0%) | 3 (100.0%) |
| High School Diploma | 8 (66.7%) | 4 (33.3%) |
| College or Associate's Degree | 23 (14.8%) | 132 (85.2%) |
| Bachelor's Degree | 0 (0.0%) | 0 (0.0%) |
| Graduate Degree | 0 (0.0%) | 0 (0.0%) |
| Total | 31 (18.2%) | 139 (81.8%) |
Income in Caldwell Parish
Income Overview in Caldwell Parish
Per Capita Income in Caldwell Parish is $28,491, while median incomes of families and households are $67,383 and $45,707 respectively.
| Characteristic | Number | Measure |
| Per Capita Income | 9,658 | $28,491 |
| Median Family Income | 2,449 | $67,383 |
| Mean Family Income | 2,449 | $92,104 |
| Median Household Income | 3,521 | $45,707 |
| Mean Household Income | 3,521 | $75,489 |
| Income Deficit | 2,449 | $0 |
| Wage / Income Gap (%) | 9,658 | 21.41% |
| Wage / Income Gap ($) | 9,658 | 78.59¢ per $1 |
| Gini / Inequality Index | 9,658 | 0.53 |
Earnings by Sex in Caldwell Parish
Average Earnings in Caldwell Parish are $34,910, $41,786 for men and $32,838 for women, a difference of 21.4%.
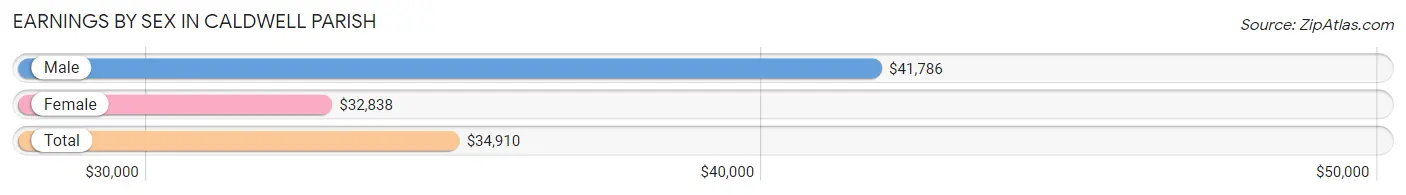
| Sex | Number | Average Earnings |
| Male | 2,304 (62.2%) | $41,786 |
| Female | 1,398 (37.8%) | $32,838 |
| Total | 3,702 (100.0%) | $34,910 |
Earnings by Sex by Income Bracket in Caldwell Parish
The most common earnings brackets in Caldwell Parish are $100,000+ for men (327 | 14.2%) and $30,000 to $34,999 for women (178 | 12.7%).
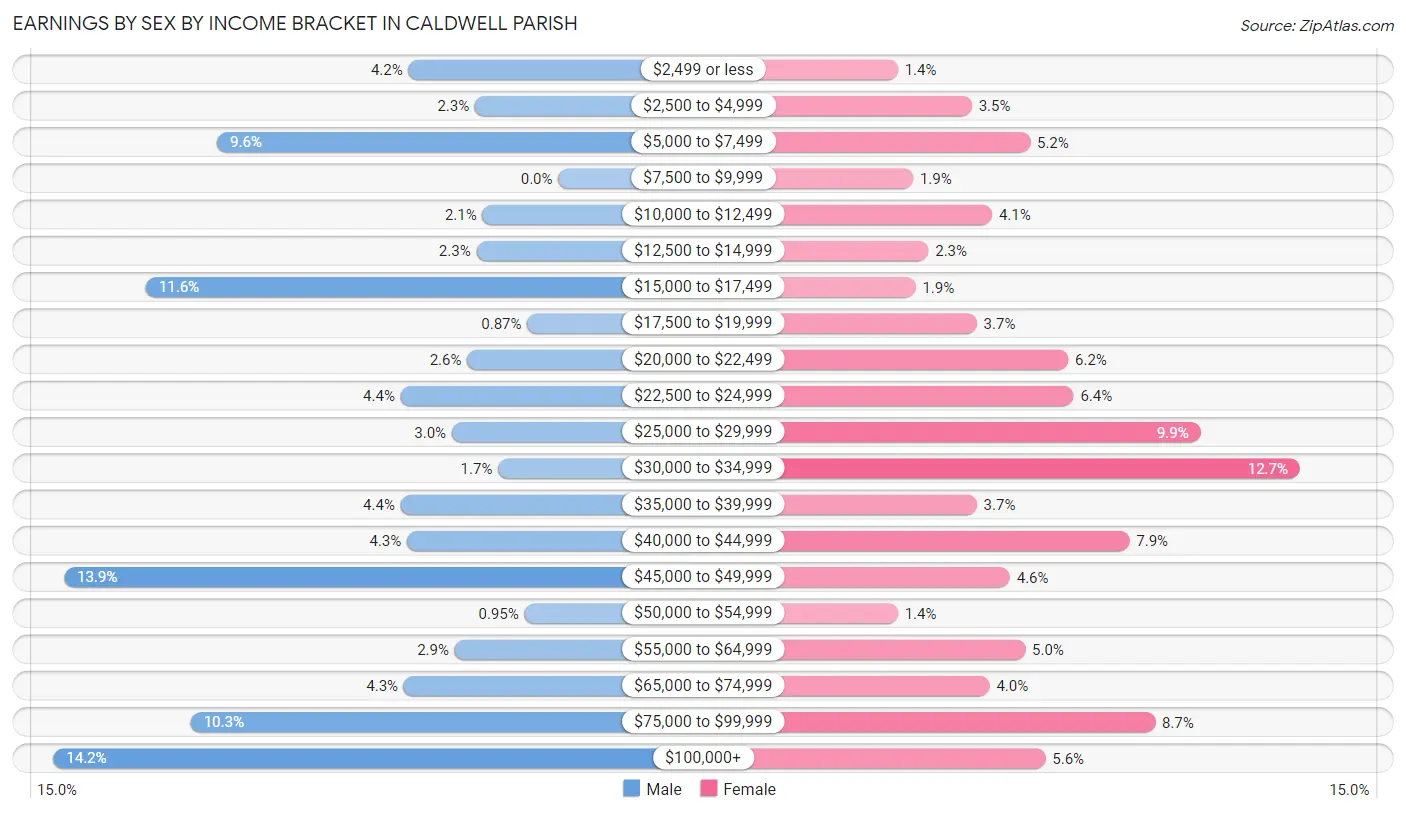
| Income | Male | Female |
| $2,499 or less | 97 (4.2%) | 20 (1.4%) |
| $2,500 to $4,999 | 54 (2.3%) | 49 (3.5%) |
| $5,000 to $7,499 | 221 (9.6%) | 72 (5.1%) |
| $7,500 to $9,999 | 0 (0.0%) | 26 (1.9%) |
| $10,000 to $12,499 | 49 (2.1%) | 57 (4.1%) |
| $12,500 to $14,999 | 53 (2.3%) | 32 (2.3%) |
| $15,000 to $17,499 | 267 (11.6%) | 27 (1.9%) |
| $17,500 to $19,999 | 20 (0.9%) | 51 (3.6%) |
| $20,000 to $22,499 | 59 (2.6%) | 87 (6.2%) |
| $22,500 to $24,999 | 102 (4.4%) | 89 (6.4%) |
| $25,000 to $29,999 | 69 (3.0%) | 139 (9.9%) |
| $30,000 to $34,999 | 39 (1.7%) | 178 (12.7%) |
| $35,000 to $39,999 | 102 (4.4%) | 51 (3.6%) |
| $40,000 to $44,999 | 98 (4.3%) | 111 (7.9%) |
| $45,000 to $49,999 | 320 (13.9%) | 64 (4.6%) |
| $50,000 to $54,999 | 22 (0.9%) | 20 (1.4%) |
| $55,000 to $64,999 | 67 (2.9%) | 70 (5.0%) |
| $65,000 to $74,999 | 100 (4.3%) | 56 (4.0%) |
| $75,000 to $99,999 | 238 (10.3%) | 121 (8.7%) |
| $100,000+ | 327 (14.2%) | 78 (5.6%) |
| Total | 2,304 (100.0%) | 1,398 (100.0%) |
Earnings by Sex by Educational Attainment in Caldwell Parish
Average earnings in Caldwell Parish are $45,217 for men and $34,079 for women, a difference of 24.6%. Men with an educational attainment of high school diploma enjoy the highest average annual earnings of $45,475, while those with college or associate's degree education earn the least with $21,250. Women with an educational attainment of college or associate's degree earn the most with the average annual earnings of $49,250, while those with graduate degree education have the smallest earnings of $22,472.
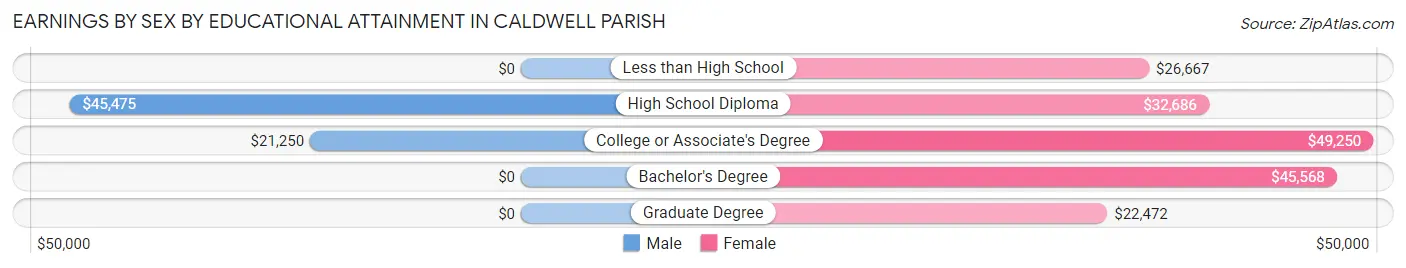
| Educational Attainment | Male Income | Female Income |
| Less than High School | - | - |
| High School Diploma | $45,475 | $32,686 |
| College or Associate's Degree | $21,250 | $49,250 |
| Bachelor's Degree | - | - |
| Graduate Degree | - | - |
| Total | $45,217 | $34,079 |
Family Income in Caldwell Parish
Family Income Brackets in Caldwell Parish
According to the Caldwell Parish family income data, there are 426 families falling into the $100,000 to $149,999 income range, which is the most common income bracket and makes up 17.4% of all families. Conversely, the $10,000 to $14,999 income bracket is the least frequent group with only 39 families (1.6%) belonging to this category.
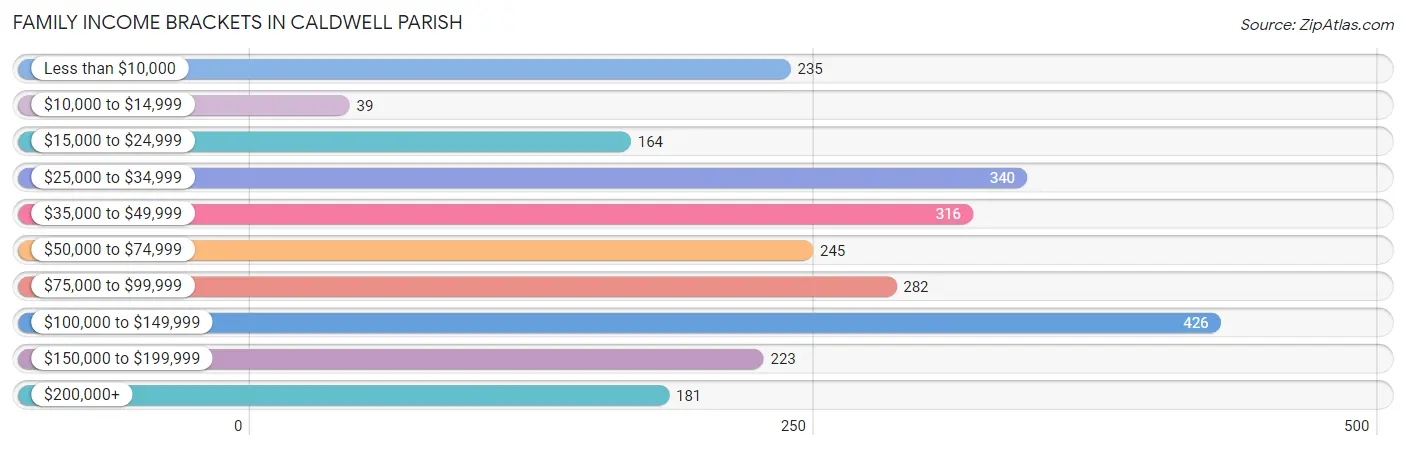
| Income Bracket | # Families | % Families |
| Less than $10,000 | 235 | 9.6% |
| $10,000 to $14,999 | 39 | 1.6% |
| $15,000 to $24,999 | 164 | 6.7% |
| $25,000 to $34,999 | 340 | 13.9% |
| $35,000 to $49,999 | 316 | 12.9% |
| $50,000 to $74,999 | 245 | 10.0% |
| $75,000 to $99,999 | 282 | 11.5% |
| $100,000 to $149,999 | 426 | 17.4% |
| $150,000 to $199,999 | 223 | 9.1% |
| $200,000+ | 181 | 7.4% |
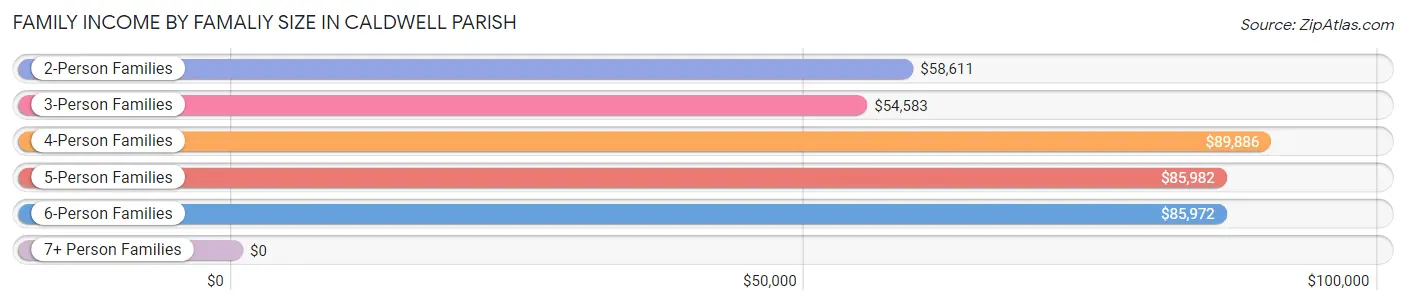
Family Income by Famaliy Size in Caldwell Parish
4-person families (365 | 14.9%) account for the highest median family income in Caldwell Parish with $89,886 per family, while 2-person families (1,120 | 45.7%) have the highest median income of $29,306 per family member.
| Income Bracket | # Families | Median Income |
| 2-Person Families | 1,120 (45.7%) | $58,611 |
| 3-Person Families | 533 (21.8%) | $54,583 |
| 4-Person Families | 365 (14.9%) | $89,886 |
| 5-Person Families | 399 (16.3%) | $85,982 |
| 6-Person Families | 28 (1.1%) | $85,972 |
| 7+ Person Families | 4 (0.2%) | $0 |
| Total | 2,449 (100.0%) | $67,383 |
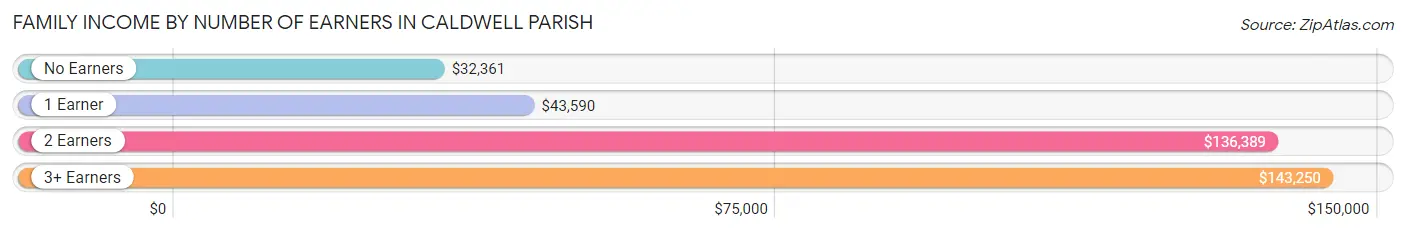
Family Income by Number of Earners in Caldwell Parish
The median family income in Caldwell Parish is $67,383, with families comprising 3+ earners (64) having the highest median family income of $143,250, while families with no earners (713) have the lowest median family income of $32,361, accounting for 2.6% and 29.1% of families, respectively.
| Number of Earners | # Families | Median Income |
| No Earners | 713 (29.1%) | $32,361 |
| 1 Earner | 872 (35.6%) | $43,590 |
| 2 Earners | 800 (32.7%) | $136,389 |
| 3+ Earners | 64 (2.6%) | $143,250 |
| Total | 2,449 (100.0%) | $67,383 |
Household Income in Caldwell Parish
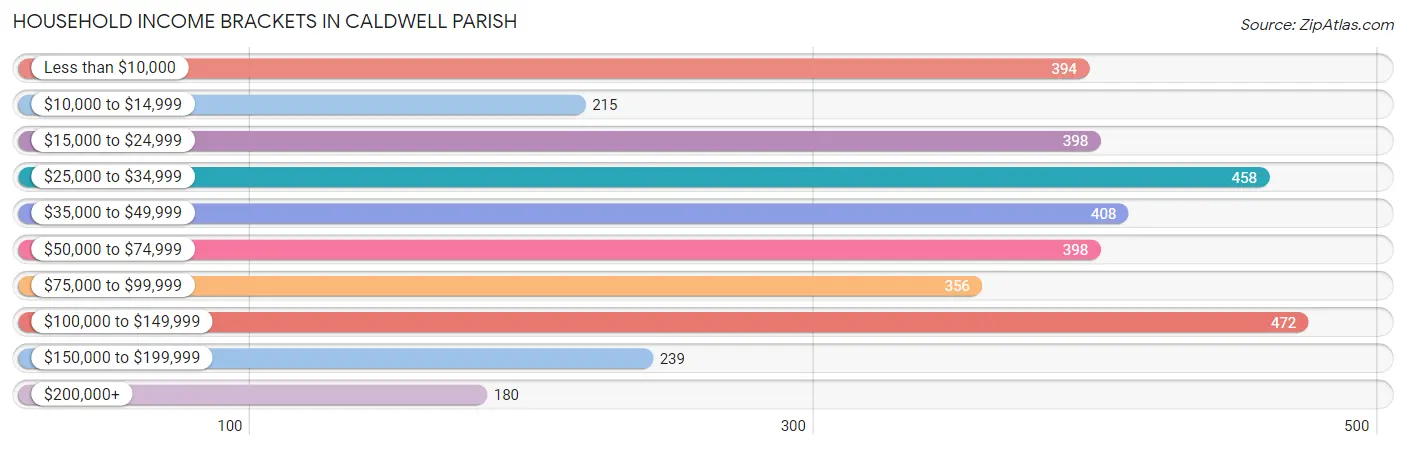
Household Income Brackets in Caldwell Parish
With 472 households falling in the category, the $100,000 to $149,999 income range is the most frequent in Caldwell Parish, accounting for 13.4% of all households. In contrast, only 180 households (5.1%) fall into the $200,000+ income bracket, making it the least populous group.
| Income Bracket | # Households | % Households |
| Less than $10,000 | 394 | 11.2% |
| $10,000 to $14,999 | 215 | 6.1% |
| $15,000 to $24,999 | 398 | 11.3% |
| $25,000 to $34,999 | 458 | 13.0% |
| $35,000 to $49,999 | 408 | 11.6% |
| $50,000 to $74,999 | 398 | 11.3% |
| $75,000 to $99,999 | 356 | 10.1% |
| $100,000 to $149,999 | 472 | 13.4% |
| $150,000 to $199,999 | 239 | 6.8% |
| $200,000+ | 180 | 5.1% |
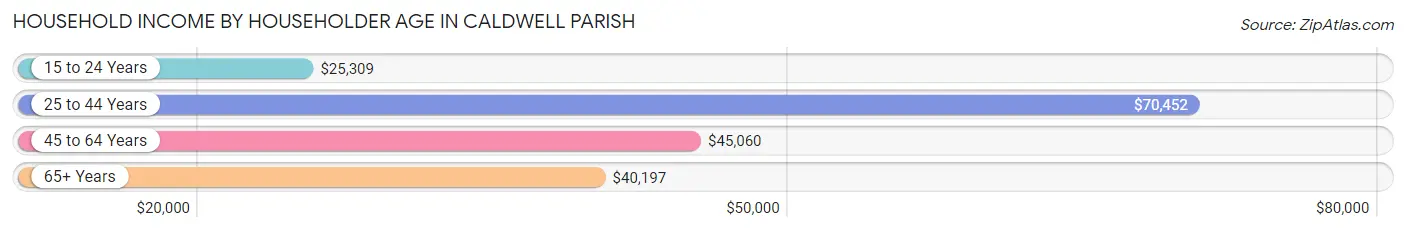
Household Income by Householder Age in Caldwell Parish
The median household income in Caldwell Parish is $45,707, with the highest median household income of $70,452 found in the 25 to 44 years age bracket for the primary householder. A total of 1,055 households (30.0%) fall into this category. Meanwhile, the 15 to 24 years age bracket for the primary householder has the lowest median household income of $25,309, with 179 households (5.1%) in this group.
| Income Bracket | # Households | Median Income |
| 15 to 24 Years | 179 (5.1%) | $25,309 |
| 25 to 44 Years | 1,055 (30.0%) | $70,452 |
| 45 to 64 Years | 1,197 (34.0%) | $45,060 |
| 65+ Years | 1,090 (31.0%) | $40,197 |
| Total | 3,521 (100.0%) | $45,707 |
Poverty in Caldwell Parish
Income Below Poverty by Sex and Age in Caldwell Parish
With 21.9% poverty level for males and 28.1% for females among the residents of Caldwell Parish, 6 to 11 year old males and under 5 year old females are the most vulnerable to poverty, with 154 males (45.0%) and 159 females (64.1%) in their respective age groups living below the poverty level.
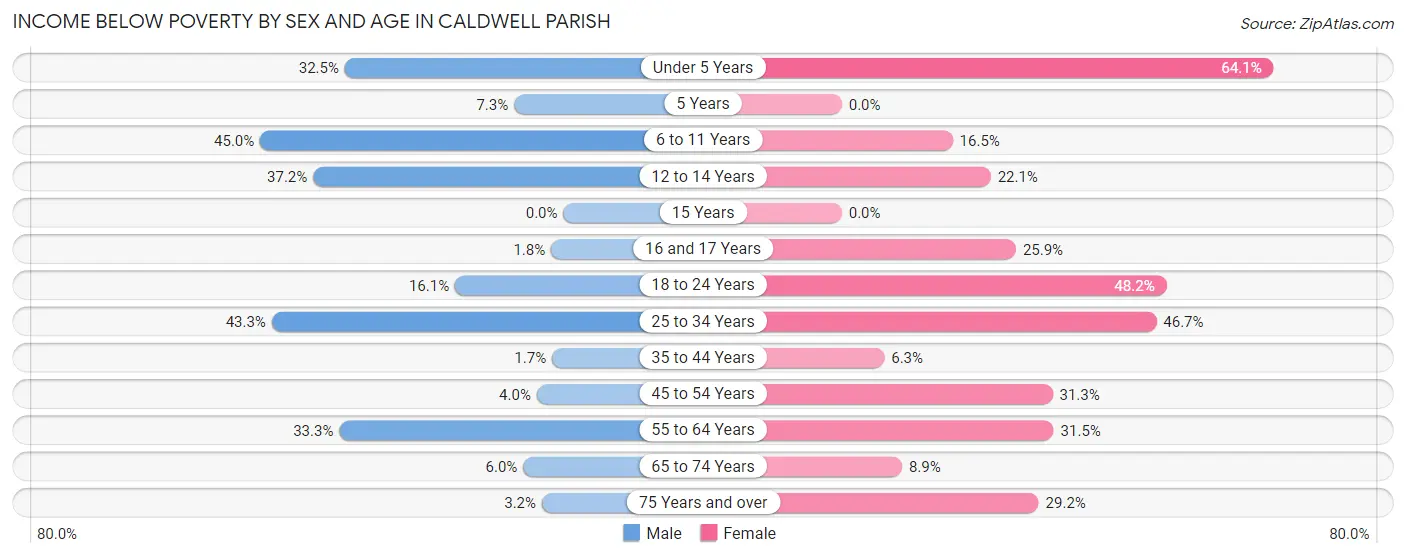
| Age Bracket | Male | Female |
| Under 5 Years | 98 (32.5%) | 159 (64.1%) |
| 5 Years | 3 (7.3%) | 0 (0.0%) |
| 6 to 11 Years | 154 (45.0%) | 54 (16.5%) |
| 12 to 14 Years | 97 (37.2%) | 42 (22.1%) |
| 15 Years | 0 (0.0%) | 0 (0.0%) |
| 16 and 17 Years | 3 (1.8%) | 15 (25.9%) |
| 18 to 24 Years | 37 (16.1%) | 148 (48.2%) |
| 25 to 34 Years | 395 (43.3%) | 312 (46.7%) |
| 35 to 44 Years | 10 (1.7%) | 31 (6.3%) |
| 45 to 54 Years | 21 (4.0%) | 158 (31.3%) |
| 55 to 64 Years | 205 (33.3%) | 190 (31.5%) |
| 65 to 74 Years | 32 (6.0%) | 48 (8.9%) |
| 75 Years and over | 8 (3.2%) | 107 (29.2%) |
| Total | 1,063 (21.9%) | 1,264 (28.1%) |
Income Above Poverty by Sex and Age in Caldwell Parish
According to the poverty statistics in Caldwell Parish, males aged 15 years and females aged 5 years are the age groups that are most secure financially, with 100.0% of males and 100.0% of females in these age groups living above the poverty line.
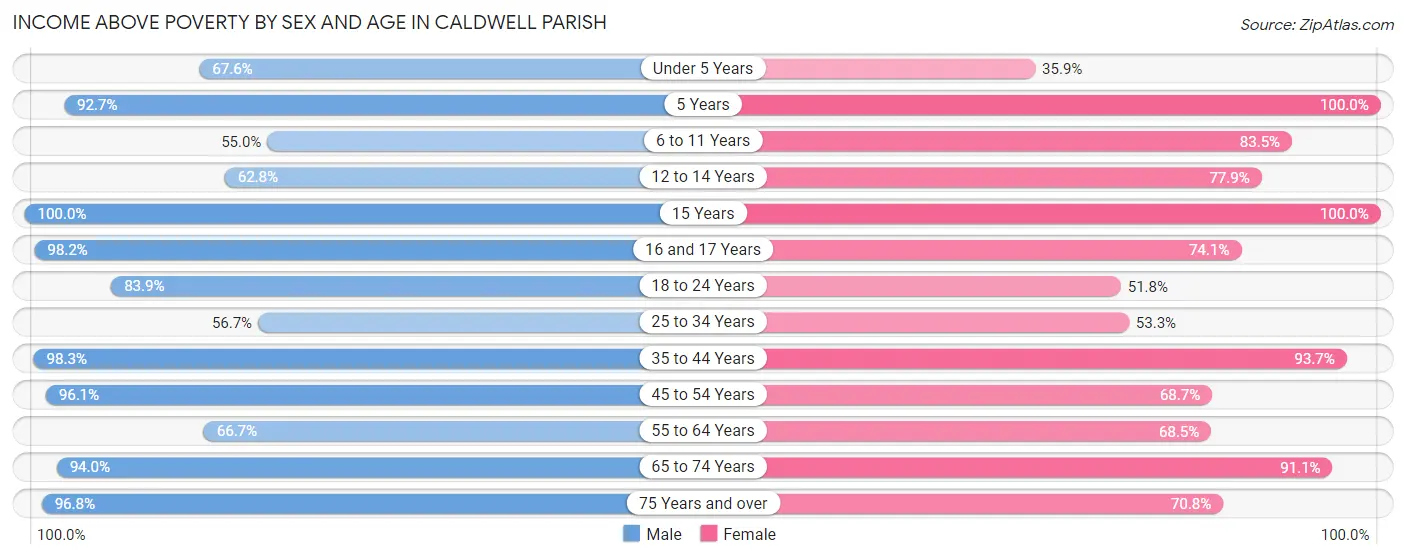
| Age Bracket | Male | Female |
| Under 5 Years | 204 (67.5%) | 89 (35.9%) |
| 5 Years | 38 (92.7%) | 104 (100.0%) |
| 6 to 11 Years | 188 (55.0%) | 274 (83.5%) |
| 12 to 14 Years | 164 (62.8%) | 148 (77.9%) |
| 15 Years | 85 (100.0%) | 92 (100.0%) |
| 16 and 17 Years | 161 (98.2%) | 43 (74.1%) |
| 18 to 24 Years | 193 (83.9%) | 159 (51.8%) |
| 25 to 34 Years | 517 (56.7%) | 356 (53.3%) |
| 35 to 44 Years | 581 (98.3%) | 460 (93.7%) |
| 45 to 54 Years | 510 (96.1%) | 347 (68.7%) |
| 55 to 64 Years | 411 (66.7%) | 414 (68.5%) |
| 65 to 74 Years | 504 (94.0%) | 489 (91.1%) |
| 75 Years and over | 243 (96.8%) | 259 (70.8%) |
| Total | 3,799 (78.1%) | 3,234 (71.9%) |
Income Below Poverty Among Married-Couple Families in Caldwell Parish
The poverty statistics for married-couple families in Caldwell Parish show that 7.3% or 116 of the total 1,594 families live below the poverty line. Families with 3 or 4 children have the highest poverty rate of 27.0%, comprising of 85 families. On the other hand, families with 5 or more children have the lowest poverty rate of 0.0%, which includes 0 families.
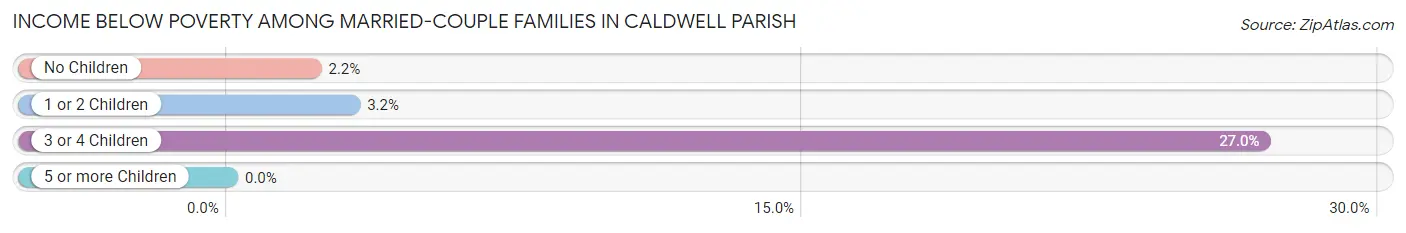
| Children | Above Poverty | Below Poverty |
| No Children | 941 (97.8%) | 21 (2.2%) |
| 1 or 2 Children | 303 (96.8%) | 10 (3.2%) |
| 3 or 4 Children | 230 (73.0%) | 85 (27.0%) |
| 5 or more Children | 4 (100.0%) | 0 (0.0%) |
| Total | 1,478 (92.7%) | 116 (7.3%) |
Income Below Poverty Among Single-Parent Households in Caldwell Parish
According to the poverty data in Caldwell Parish, 26.3% or 64 single-father households and 41.0% or 251 single-mother households are living below the poverty line. Among single-father households, those with no children have the highest poverty rate, with 36 households (40.9%) experiencing poverty. Likewise, among single-mother households, those with 3 or 4 children have the highest poverty rate, with 102 households (100.0%) falling below the poverty line.
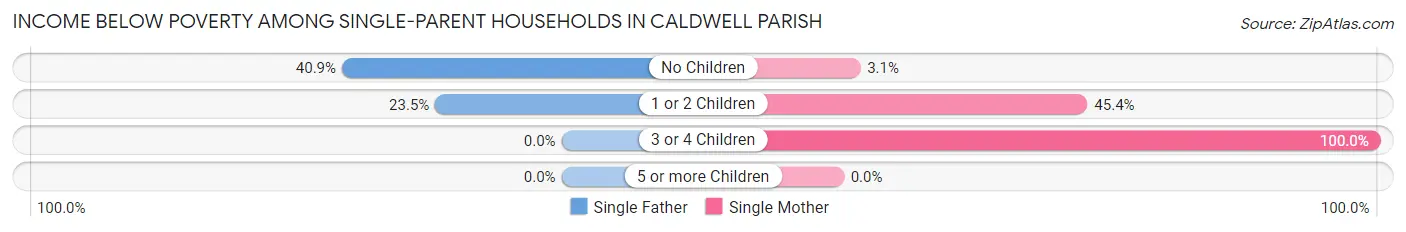
| Children | Single Father | Single Mother |
| No Children | 36 (40.9%) | 6 (3.1%) |
| 1 or 2 Children | 28 (23.5%) | 143 (45.4%) |
| 3 or 4 Children | 0 (0.0%) | 102 (100.0%) |
| 5 or more Children | 0 (0.0%) | 0 (0.0%) |
| Total | 64 (26.3%) | 251 (41.0%) |
Income Below Poverty Among Married-Couple vs Single-Parent Households in Caldwell Parish
The poverty data for Caldwell Parish shows that 116 of the married-couple family households (7.3%) and 315 of the single-parent households (36.8%) are living below the poverty level. Within the married-couple family households, those with 3 or 4 children have the highest poverty rate, with 85 households (27.0%) falling below the poverty line. Among the single-parent households, those with 3 or 4 children have the highest poverty rate, with 102 household (73.9%) living below poverty.
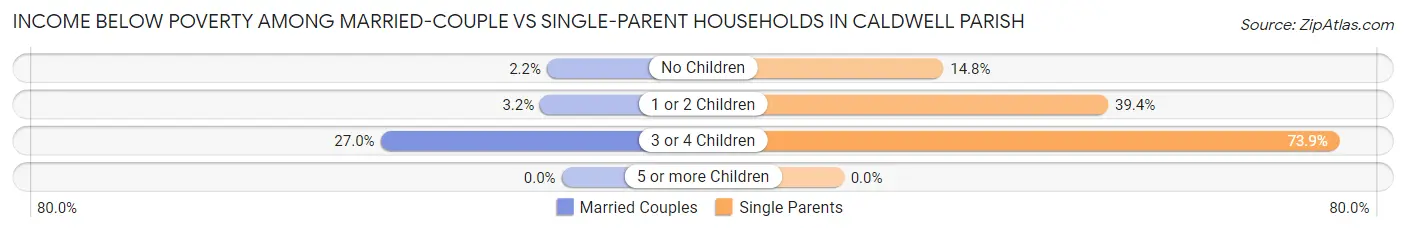
| Children | Married-Couple Families | Single-Parent Households |
| No Children | 21 (2.2%) | 42 (14.8%) |
| 1 or 2 Children | 10 (3.2%) | 171 (39.4%) |
| 3 or 4 Children | 85 (27.0%) | 102 (73.9%) |
| 5 or more Children | 0 (0.0%) | 0 (0.0%) |
| Total | 116 (7.3%) | 315 (36.8%) |
Employment Characteristics in Caldwell Parish
Employment by Class of Employer in Caldwell Parish
Among the 3,085 employed individuals in Caldwell Parish, private company employees (2,305 | 74.7%), local government employees (306 | 9.9%), and state government employees (212 | 6.9%) make up the most common classes of employment.
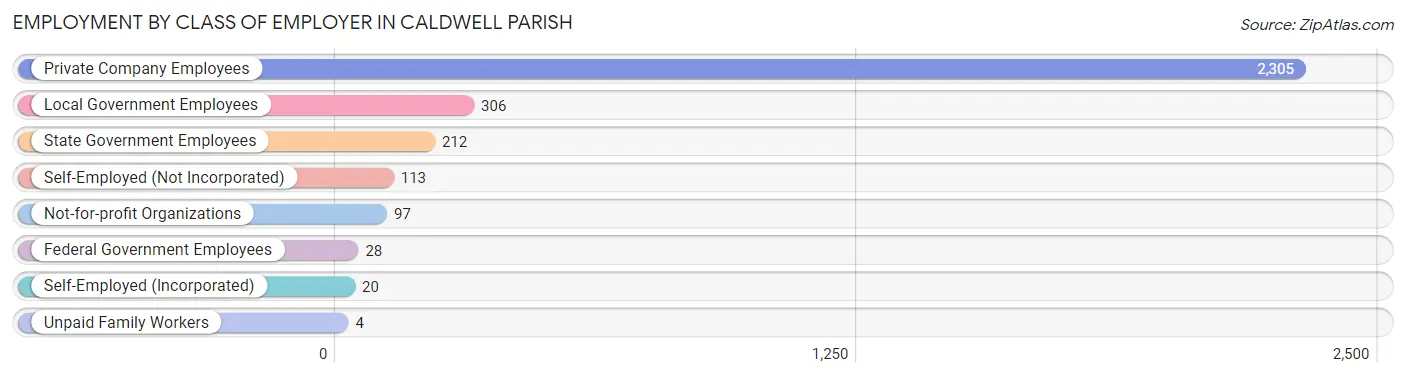
| Employer Class | # Employees | % Employees |
| Private Company Employees | 2,305 | 74.7% |
| Self-Employed (Incorporated) | 20 | 0.6% |
| Self-Employed (Not Incorporated) | 113 | 3.7% |
| Not-for-profit Organizations | 97 | 3.1% |
| Local Government Employees | 306 | 9.9% |
| State Government Employees | 212 | 6.9% |
| Federal Government Employees | 28 | 0.9% |
| Unpaid Family Workers | 4 | 0.1% |
| Total | 3,085 | 100.0% |
Employment Status by Age in Caldwell Parish
According to the labor force statistics for Caldwell Parish, out of the total population over 16 years of age (7,665), 47.3% or 3,626 individuals are in the labor force, with 12.9% or 468 of them unemployed. The age group with the highest labor force participation rate is 45 to 54 years, with 74.2% or 793 individuals in the labor force. Within the labor force, the 35 to 44 years age range has the highest percentage of unemployed individuals, with 42.3% or 311 of them being unemployed.
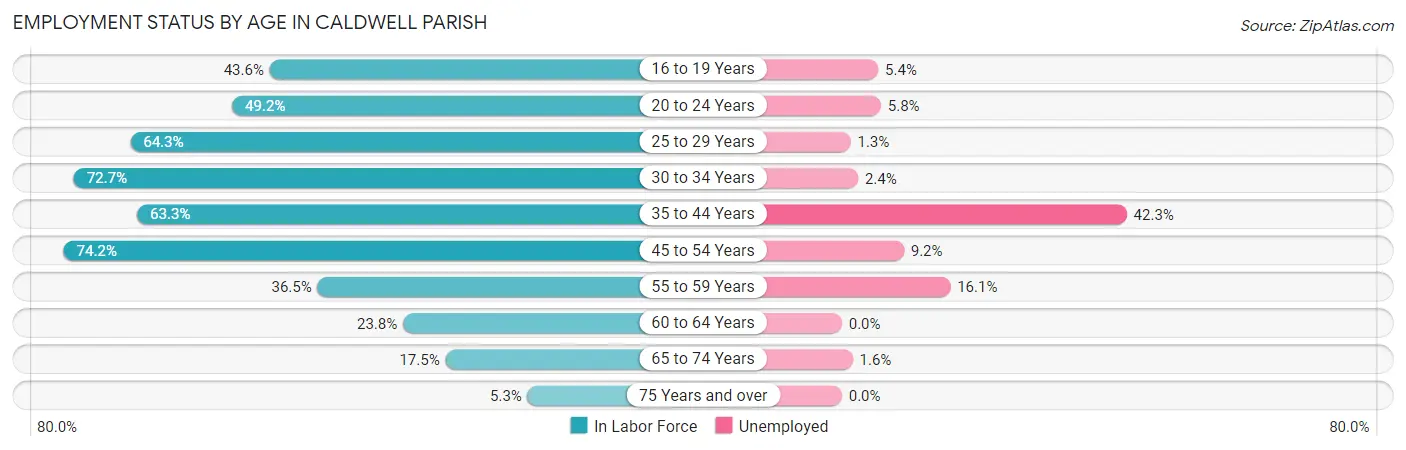
| Age Bracket | In Labor Force | Unemployed |
| 16 to 19 Years | 130 (43.6%) | 7 (5.4%) |
| 20 to 24 Years | 241 (49.2%) | 14 (5.8%) |
| 25 to 29 Years | 631 (64.3%) | 8 (1.3%) |
| 30 to 34 Years | 491 (72.7%) | 12 (2.4%) |
| 35 to 44 Years | 736 (63.3%) | 311 (42.3%) |
| 45 to 54 Years | 793 (74.2%) | 73 (9.2%) |
| 55 to 59 Years | 249 (36.5%) | 40 (16.1%) |
| 60 to 64 Years | 129 (23.8%) | 0 (0.0%) |
| 65 to 74 Years | 190 (17.5%) | 3 (1.6%) |
| 75 Years and over | 36 (5.3%) | 0 (0.0%) |
| Total | 3,626 (47.3%) | 468 (12.9%) |
Employment Status by Educational Attainment in Caldwell Parish
According to labor force statistics for Caldwell Parish, 59.2% of individuals (3,028) out of the total population between 25 and 64 years of age (5,115) are in the labor force, with 14.7% or 445 of them being unemployed. The group with the highest labor force participation rate are those with the educational attainment of bachelor's degree or higher, with 80.2% or 490 individuals in the labor force. Within the labor force, individuals with college / associate degree education have the highest percentage of unemployment, with 20.9% or 125 of them being unemployed.
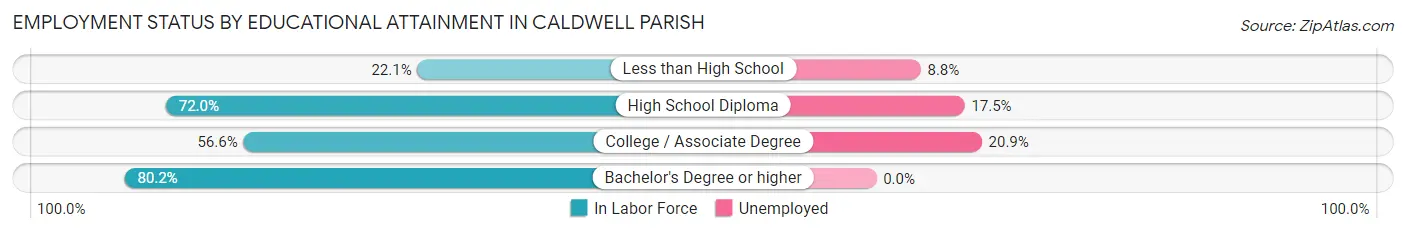
| Educational Attainment | In Labor Force | Unemployed |
| Less than High School | 240 (22.1%) | 95 (8.8%) |
| High School Diploma | 1,702 (72.0%) | 414 (17.5%) |
| College / Associate Degree | 598 (56.6%) | 221 (20.9%) |
| Bachelor's Degree or higher | 490 (80.2%) | 0 (0.0%) |
| Total | 3,028 (59.2%) | 752 (14.7%) |
Employment Occupations by Sex in Caldwell Parish
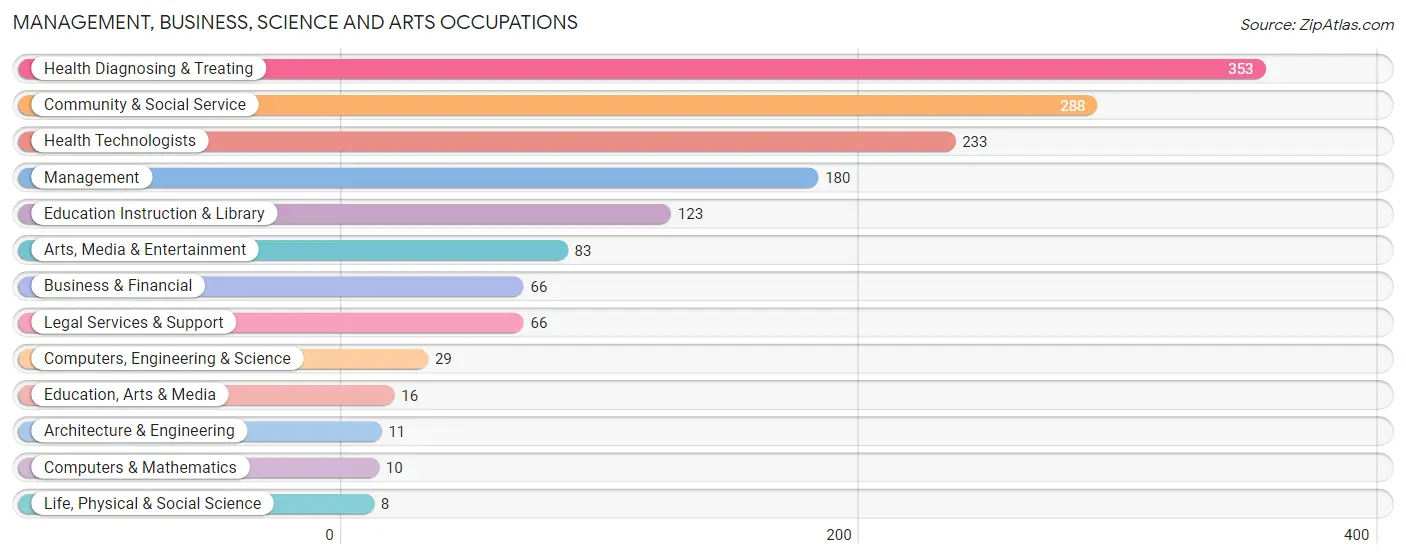
Management, Business, Science and Arts Occupations
The most common Management, Business, Science and Arts occupations in Caldwell Parish are Health Diagnosing & Treating (353 | 11.2%), Community & Social Service (288 | 9.1%), Health Technologists (233 | 7.4%), Management (180 | 5.7%), and Education Instruction & Library (123 | 3.9%).
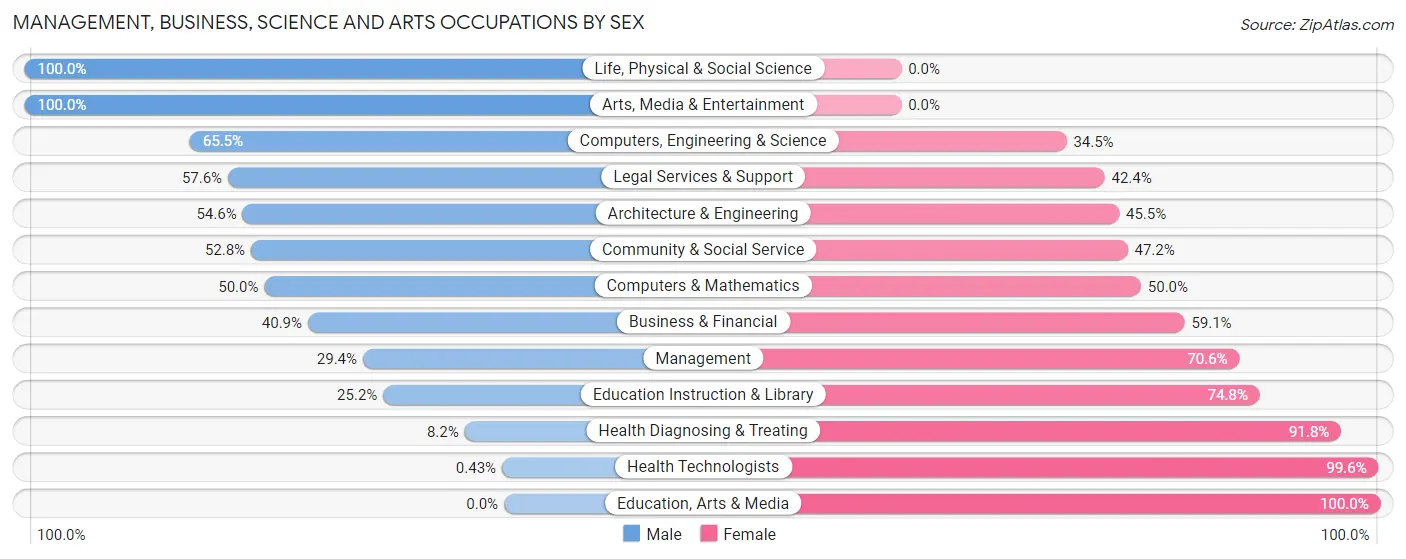
Management, Business, Science and Arts Occupations by Sex
Within the Management, Business, Science and Arts occupations in Caldwell Parish, the most male-oriented occupations are Life, Physical & Social Science (100.0%), Arts, Media & Entertainment (100.0%), and Computers, Engineering & Science (65.5%), while the most female-oriented occupations are Education, Arts & Media (100.0%), Health Technologists (99.6%), and Health Diagnosing & Treating (91.8%).
| Occupation | Male | Female |
| Management | 53 (29.4%) | 127 (70.6%) |
| Business & Financial | 27 (40.9%) | 39 (59.1%) |
| Computers, Engineering & Science | 19 (65.5%) | 10 (34.5%) |
| Computers & Mathematics | 5 (50.0%) | 5 (50.0%) |
| Architecture & Engineering | 6 (54.5%) | 5 (45.5%) |
| Life, Physical & Social Science | 8 (100.0%) | 0 (0.0%) |
| Community & Social Service | 152 (52.8%) | 136 (47.2%) |
| Education, Arts & Media | 0 (0.0%) | 16 (100.0%) |
| Legal Services & Support | 38 (57.6%) | 28 (42.4%) |
| Education Instruction & Library | 31 (25.2%) | 92 (74.8%) |
| Arts, Media & Entertainment | 83 (100.0%) | 0 (0.0%) |
| Health Diagnosing & Treating | 29 (8.2%) | 324 (91.8%) |
| Health Technologists | 1 (0.4%) | 232 (99.6%) |
| Total (Category) | 280 (30.6%) | 636 (69.4%) |
| Total (Overall) | 2,009 (63.6%) | 1,148 (36.4%) |
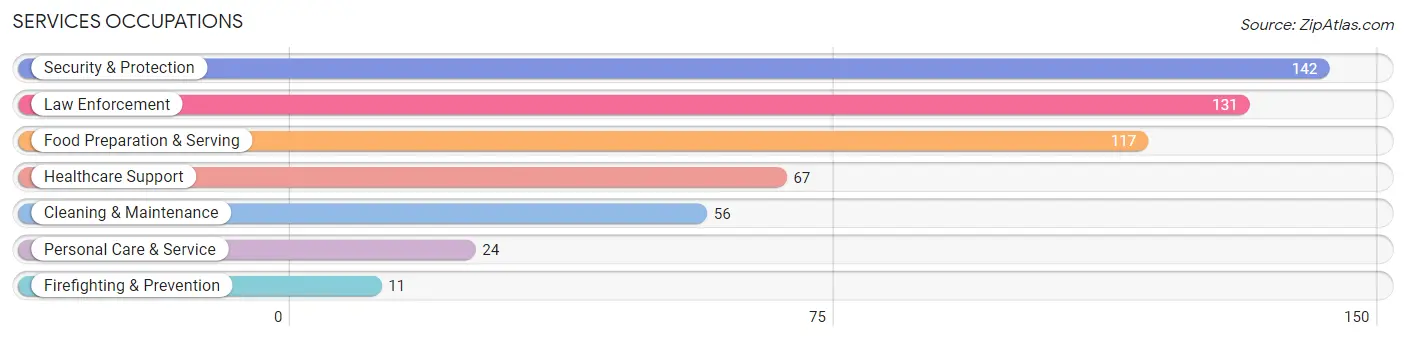
Services Occupations
The most common Services occupations in Caldwell Parish are Security & Protection (142 | 4.5%), Law Enforcement (131 | 4.2%), Food Preparation & Serving (117 | 3.7%), Healthcare Support (67 | 2.1%), and Cleaning & Maintenance (56 | 1.8%).
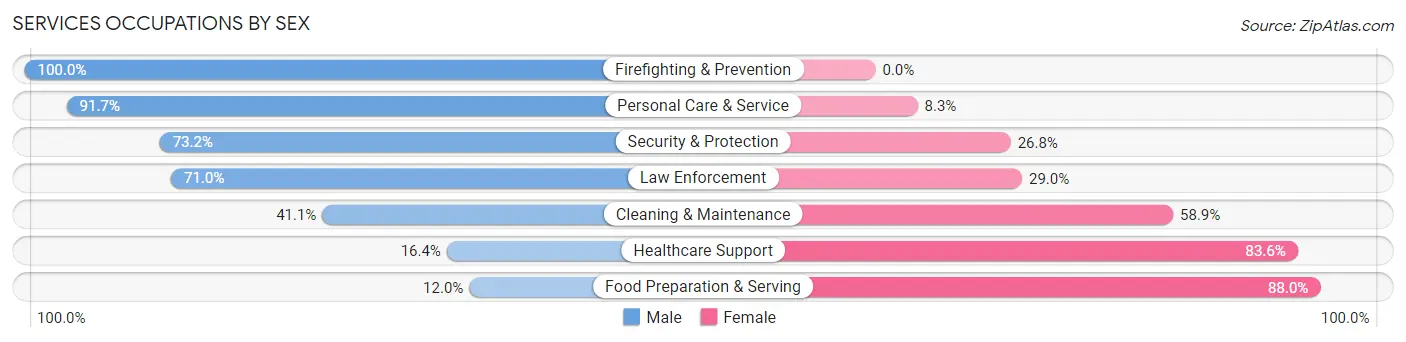
Services Occupations by Sex
Within the Services occupations in Caldwell Parish, the most male-oriented occupations are Firefighting & Prevention (100.0%), Personal Care & Service (91.7%), and Security & Protection (73.2%), while the most female-oriented occupations are Food Preparation & Serving (88.0%), Healthcare Support (83.6%), and Cleaning & Maintenance (58.9%).
| Occupation | Male | Female |
| Healthcare Support | 11 (16.4%) | 56 (83.6%) |
| Security & Protection | 104 (73.2%) | 38 (26.8%) |
| Firefighting & Prevention | 11 (100.0%) | 0 (0.0%) |
| Law Enforcement | 93 (71.0%) | 38 (29.0%) |
| Food Preparation & Serving | 14 (12.0%) | 103 (88.0%) |
| Cleaning & Maintenance | 23 (41.1%) | 33 (58.9%) |
| Personal Care & Service | 22 (91.7%) | 2 (8.3%) |
| Total (Category) | 174 (42.9%) | 232 (57.1%) |
| Total (Overall) | 2,009 (63.6%) | 1,148 (36.4%) |
Sales and Office Occupations
The most common Sales and Office occupations in Caldwell Parish are Sales & Related (217 | 6.9%), and Office & Administration (217 | 6.9%).

Sales and Office Occupations by Sex

| Occupation | Male | Female |
| Sales & Related | 164 (75.6%) | 53 (24.4%) |
| Office & Administration | 24 (11.1%) | 193 (88.9%) |
| Total (Category) | 188 (43.3%) | 246 (56.7%) |
| Total (Overall) | 2,009 (63.6%) | 1,148 (36.4%) |
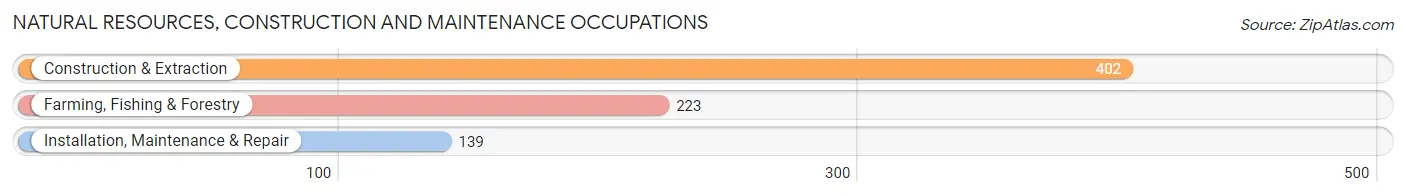
Natural Resources, Construction and Maintenance Occupations
The most common Natural Resources, Construction and Maintenance occupations in Caldwell Parish are Construction & Extraction (402 | 12.7%), Farming, Fishing & Forestry (223 | 7.1%), and Installation, Maintenance & Repair (139 | 4.4%).
Natural Resources, Construction and Maintenance Occupations by Sex
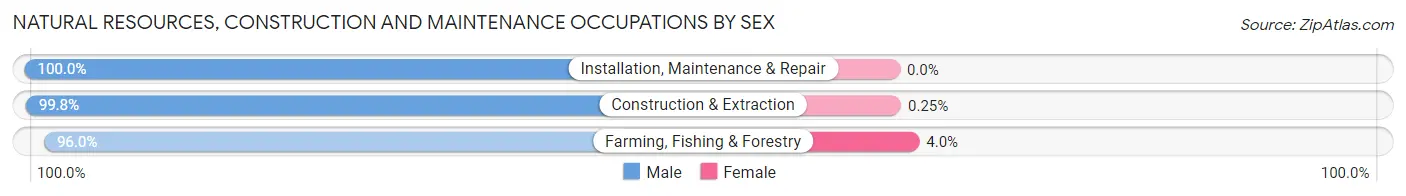
| Occupation | Male | Female |
| Farming, Fishing & Forestry | 214 (96.0%) | 9 (4.0%) |
| Construction & Extraction | 401 (99.8%) | 1 (0.3%) |
| Installation, Maintenance & Repair | 139 (100.0%) | 0 (0.0%) |
| Total (Category) | 754 (98.7%) | 10 (1.3%) |
| Total (Overall) | 2,009 (63.6%) | 1,148 (36.4%) |
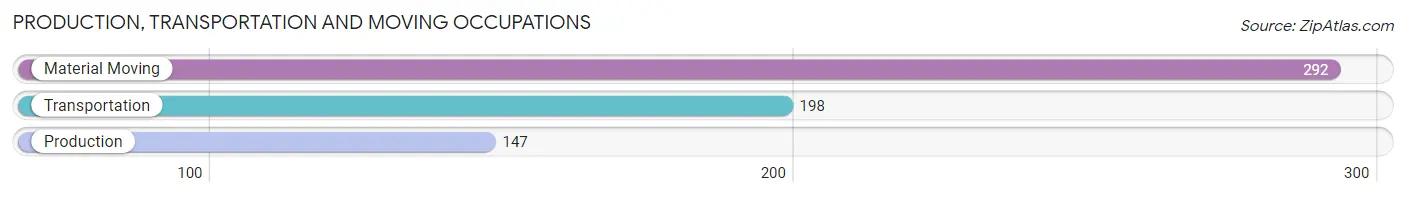
Production, Transportation and Moving Occupations
The most common Production, Transportation and Moving occupations in Caldwell Parish are Material Moving (292 | 9.2%), Transportation (198 | 6.3%), and Production (147 | 4.7%).
Production, Transportation and Moving Occupations by Sex
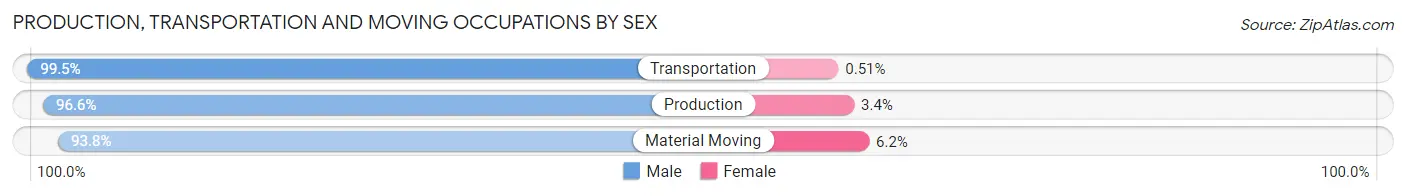
| Occupation | Male | Female |
| Production | 142 (96.6%) | 5 (3.4%) |
| Transportation | 197 (99.5%) | 1 (0.5%) |
| Material Moving | 274 (93.8%) | 18 (6.2%) |
| Total (Category) | 613 (96.2%) | 24 (3.8%) |
| Total (Overall) | 2,009 (63.6%) | 1,148 (36.4%) |
Employment Industries by Sex in Caldwell Parish
Employment Industries in Caldwell Parish
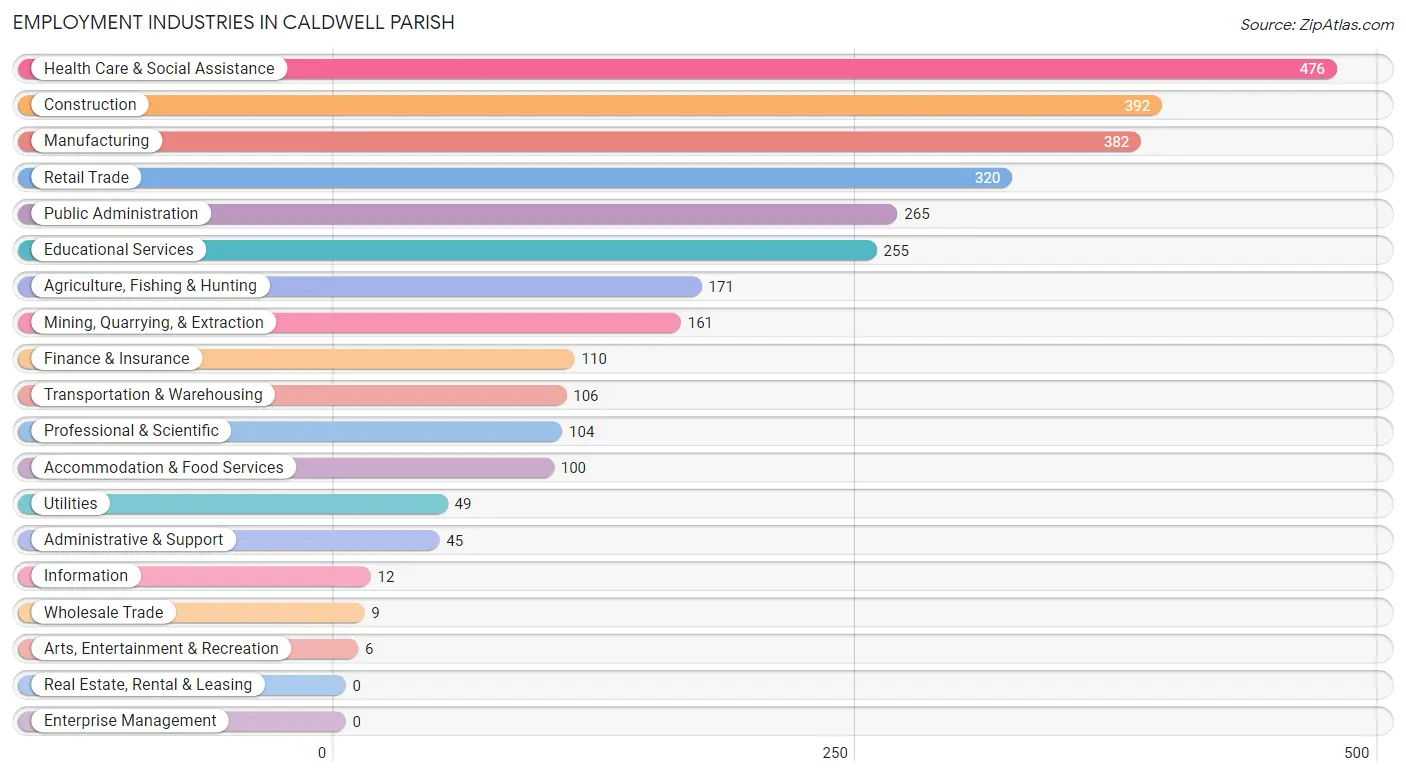
The major employment industries in Caldwell Parish include Health Care & Social Assistance (476 | 15.1%), Construction (392 | 12.4%), Manufacturing (382 | 12.1%), Retail Trade (320 | 10.1%), and Public Administration (265 | 8.4%).
Employment Industries by Sex in Caldwell Parish
The Caldwell Parish industries that see more men than women are Mining, Quarrying, & Extraction (100.0%), Utilities (100.0%), and Arts, Entertainment & Recreation (100.0%), whereas the industries that tend to have a higher number of women are Health Care & Social Assistance (91.8%), Accommodation & Food Services (87.0%), and Finance & Insurance (84.6%).
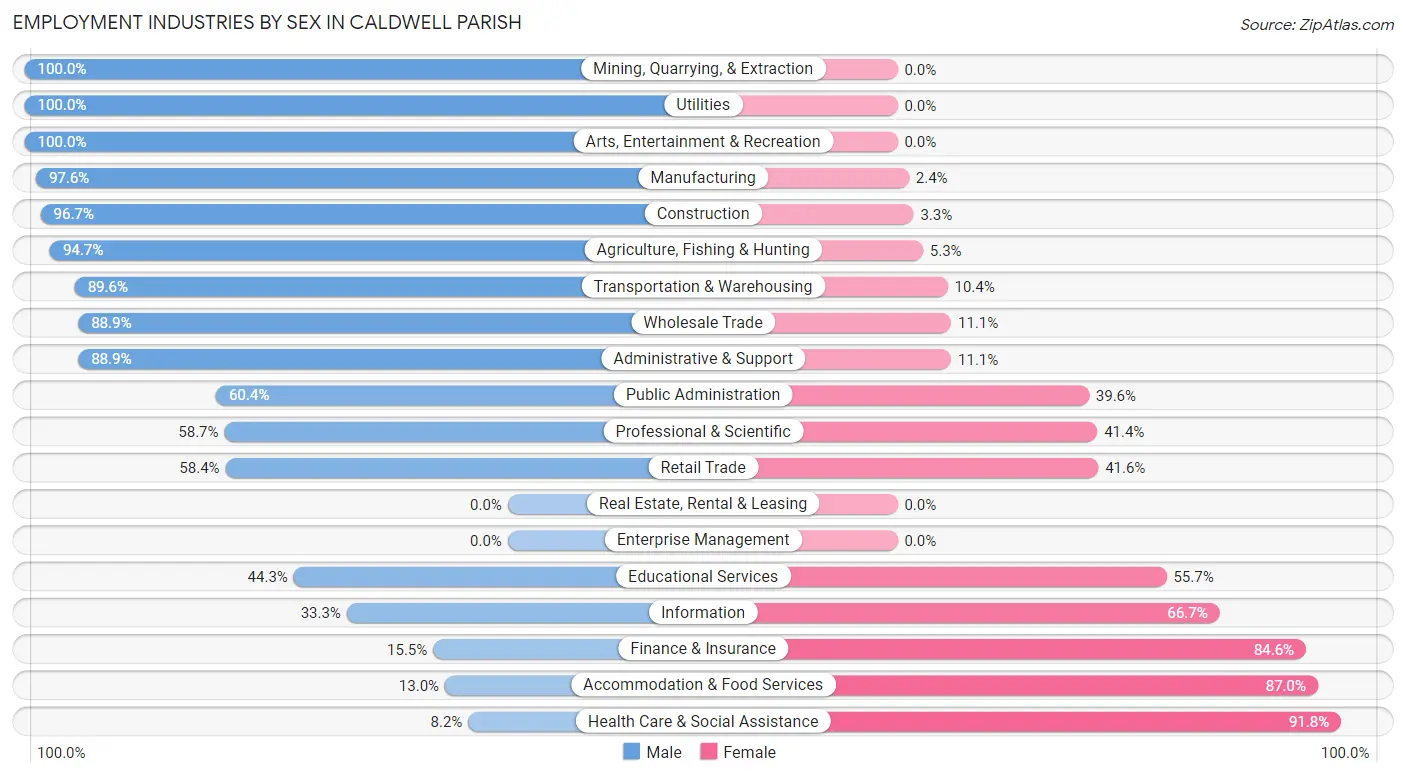
| Industry | Male | Female |
| Agriculture, Fishing & Hunting | 162 (94.7%) | 9 (5.3%) |
| Mining, Quarrying, & Extraction | 161 (100.0%) | 0 (0.0%) |
| Construction | 379 (96.7%) | 13 (3.3%) |
| Manufacturing | 373 (97.6%) | 9 (2.4%) |
| Wholesale Trade | 8 (88.9%) | 1 (11.1%) |
| Retail Trade | 187 (58.4%) | 133 (41.6%) |
| Transportation & Warehousing | 95 (89.6%) | 11 (10.4%) |
| Utilities | 49 (100.0%) | 0 (0.0%) |
| Information | 4 (33.3%) | 8 (66.7%) |
| Finance & Insurance | 17 (15.4%) | 93 (84.6%) |
| Real Estate, Rental & Leasing | 0 (0.0%) | 0 (0.0%) |
| Professional & Scientific | 61 (58.7%) | 43 (41.3%) |
| Enterprise Management | 0 (0.0%) | 0 (0.0%) |
| Administrative & Support | 40 (88.9%) | 5 (11.1%) |
| Educational Services | 113 (44.3%) | 142 (55.7%) |
| Health Care & Social Assistance | 39 (8.2%) | 437 (91.8%) |
| Arts, Entertainment & Recreation | 6 (100.0%) | 0 (0.0%) |
| Accommodation & Food Services | 13 (13.0%) | 87 (87.0%) |
| Public Administration | 160 (60.4%) | 105 (39.6%) |
| Total | 2,009 (63.6%) | 1,148 (36.4%) |
Education in Caldwell Parish
School Enrollment in Caldwell Parish
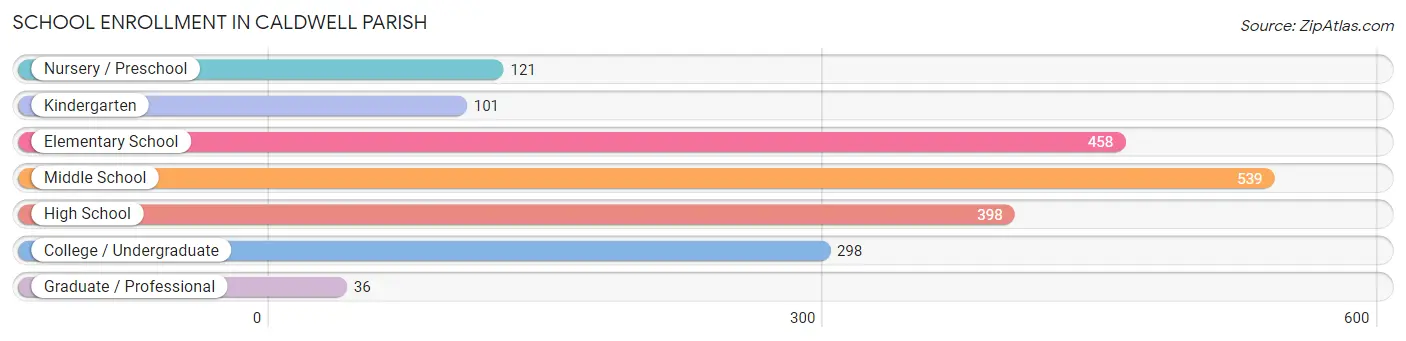
The most common levels of schooling among the 1,951 students in Caldwell Parish are middle school (539 | 27.6%), elementary school (458 | 23.5%), and high school (398 | 20.4%).
| School Level | # Students | % Students |
| Nursery / Preschool | 121 | 6.2% |
| Kindergarten | 101 | 5.2% |
| Elementary School | 458 | 23.5% |
| Middle School | 539 | 27.6% |
| High School | 398 | 20.4% |
| College / Undergraduate | 298 | 15.3% |
| Graduate / Professional | 36 | 1.8% |
| Total | 1,951 | 100.0% |
School Enrollment by Age by Funding Source in Caldwell Parish
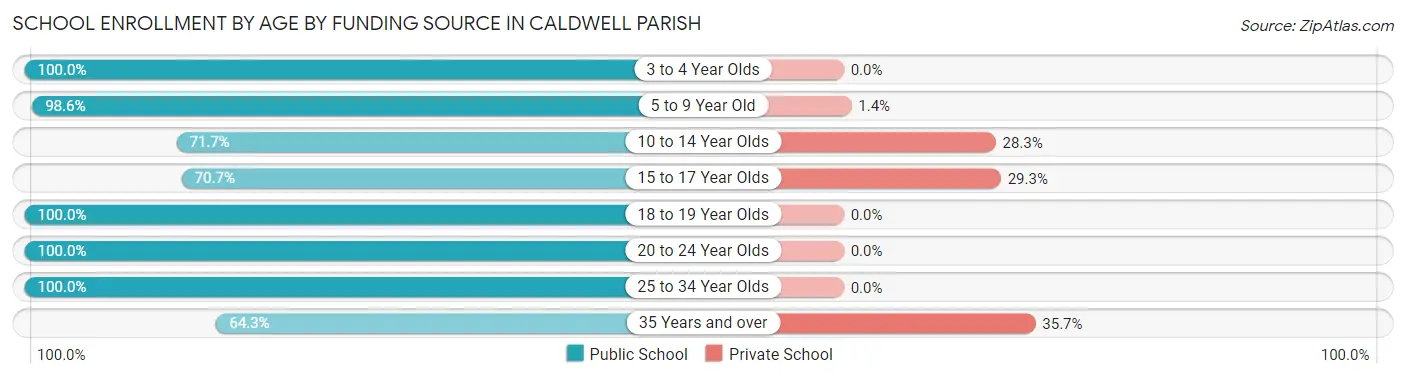
Out of a total of 1,951 students who are enrolled in schools in Caldwell Parish, 283 (14.5%) attend a private institution, while the remaining 1,668 (85.5%) are enrolled in public schools. The age group of 35 years and over has the highest likelihood of being enrolled in private schools, with 10 (35.7% in the age bracket) enrolled. Conversely, the age group of 3 to 4 year olds has the lowest likelihood of being enrolled in a private school, with 106 (100.0% in the age bracket) attending a public institution.
| Age Bracket | Public School | Private School |
| 3 to 4 Year Olds | 106 (100.0%) | 0 (0.0%) |
| 5 to 9 Year Old | 551 (98.6%) | 8 (1.4%) |
| 10 to 14 Year Olds | 441 (71.7%) | 174 (28.3%) |
| 15 to 17 Year Olds | 220 (70.7%) | 91 (29.3%) |
| 18 to 19 Year Olds | 57 (100.0%) | 0 (0.0%) |
| 20 to 24 Year Olds | 190 (100.0%) | 0 (0.0%) |
| 25 to 34 Year Olds | 85 (100.0%) | 0 (0.0%) |
| 35 Years and over | 18 (64.3%) | 10 (35.7%) |
| Total | 1,668 (85.5%) | 283 (14.5%) |
Educational Attainment by Field of Study in Caldwell Parish
Science & technology (251 | 30.1%), business (137 | 16.4%), education (136 | 16.3%), arts & humanities (93 | 11.2%), and bio, nature & agricultural (73 | 8.7%) are the most common fields of study among 834 individuals in Caldwell Parish who have obtained a bachelor's degree or higher.
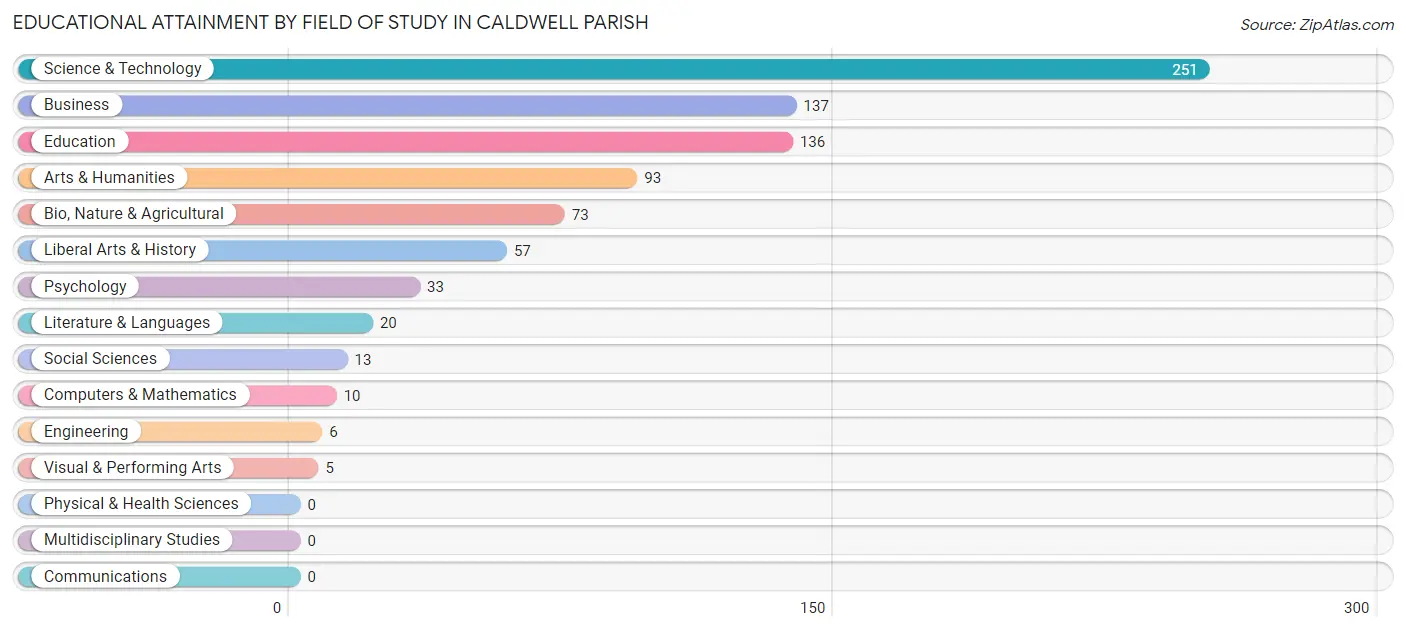
| Field of Study | # Graduates | % Graduates |
| Computers & Mathematics | 10 | 1.2% |
| Bio, Nature & Agricultural | 73 | 8.7% |
| Physical & Health Sciences | 0 | 0.0% |
| Psychology | 33 | 4.0% |
| Social Sciences | 13 | 1.6% |
| Engineering | 6 | 0.7% |
| Multidisciplinary Studies | 0 | 0.0% |
| Science & Technology | 251 | 30.1% |
| Business | 137 | 16.4% |
| Education | 136 | 16.3% |
| Literature & Languages | 20 | 2.4% |
| Liberal Arts & History | 57 | 6.8% |
| Visual & Performing Arts | 5 | 0.6% |
| Communications | 0 | 0.0% |
| Arts & Humanities | 93 | 11.2% |
| Total | 834 | 100.0% |
Transportation & Commute in Caldwell Parish
Vehicle Availability by Sex in Caldwell Parish
The most prevalent vehicle ownership categories in Caldwell Parish are males with 2 vehicles (676, accounting for 34.2%) and females with 2 vehicles (578, making up 61.0%).
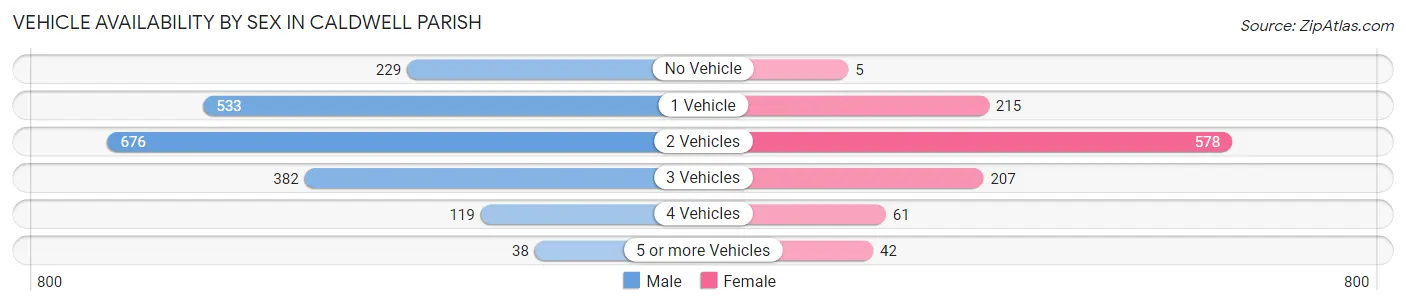
| Vehicles Available | Male | Female |
| No Vehicle | 229 (11.6%) | 5 (0.4%) |
| 1 Vehicle | 533 (27.0%) | 215 (19.4%) |
| 2 Vehicles | 676 (34.2%) | 578 (52.2%) |
| 3 Vehicles | 382 (19.3%) | 207 (18.7%) |
| 4 Vehicles | 119 (6.0%) | 61 (5.5%) |
| 5 or more Vehicles | 38 (1.9%) | 42 (3.8%) |
| Total | 1,977 (100.0%) | 1,108 (100.0%) |
Commute Time in Caldwell Parish
The most frequently occuring commute durations in Caldwell Parish are 30 to 34 minutes (448 commuters, 15.1%), 15 to 19 minutes (438 commuters, 14.8%), and 20 to 24 minutes (433 commuters, 14.6%).
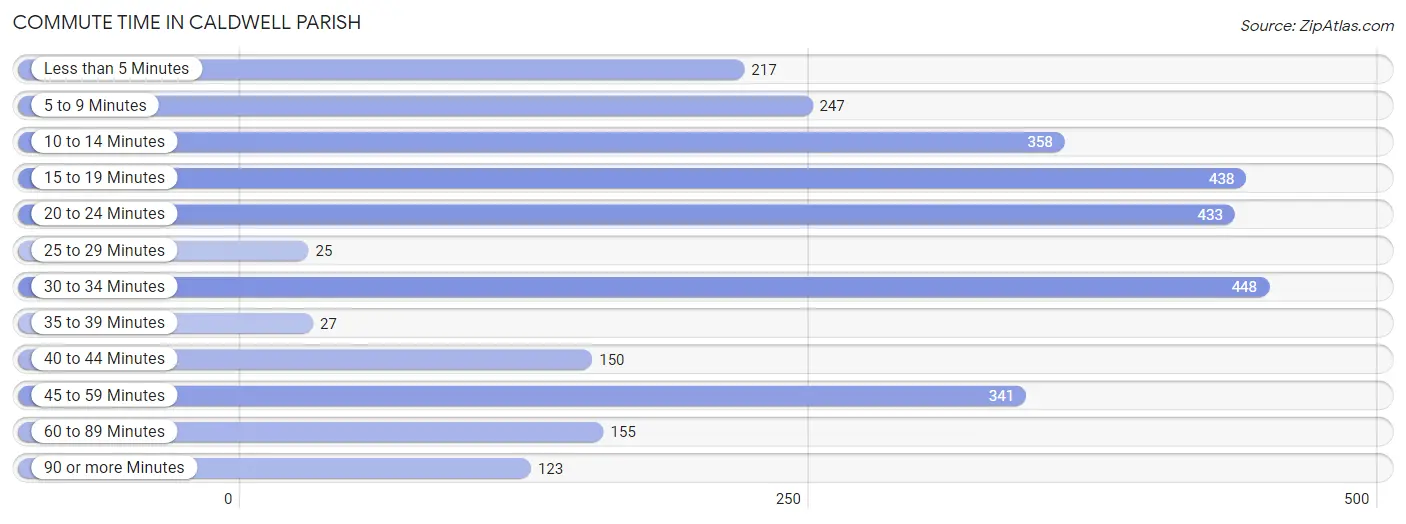
| Commute Time | # Commuters | % Commuters |
| Less than 5 Minutes | 217 | 7.3% |
| 5 to 9 Minutes | 247 | 8.3% |
| 10 to 14 Minutes | 358 | 12.1% |
| 15 to 19 Minutes | 438 | 14.8% |
| 20 to 24 Minutes | 433 | 14.6% |
| 25 to 29 Minutes | 25 | 0.8% |
| 30 to 34 Minutes | 448 | 15.1% |
| 35 to 39 Minutes | 27 | 0.9% |
| 40 to 44 Minutes | 150 | 5.1% |
| 45 to 59 Minutes | 341 | 11.5% |
| 60 to 89 Minutes | 155 | 5.2% |
| 90 or more Minutes | 123 | 4.2% |
Commute Time by Sex in Caldwell Parish
The most common commute times in Caldwell Parish are 30 to 34 minutes (428 commuters, 22.8%) for males and 20 to 24 minutes (258 commuters, 23.8%) for females.
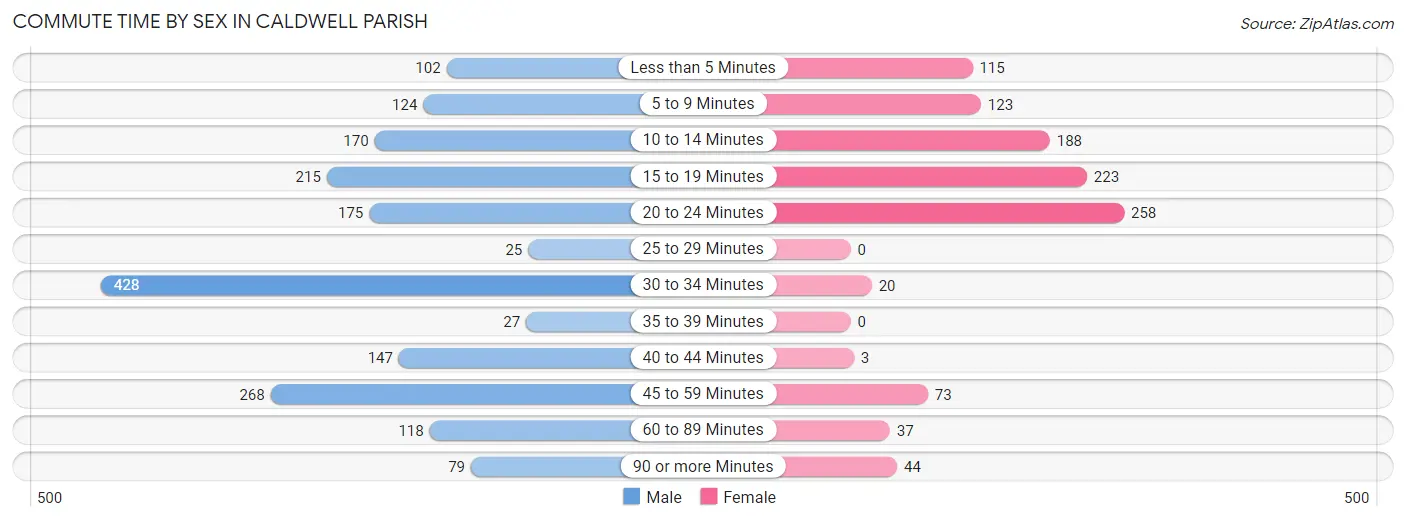
| Commute Time | Male | Female |
| Less than 5 Minutes | 102 (5.4%) | 115 (10.6%) |
| 5 to 9 Minutes | 124 (6.6%) | 123 (11.4%) |
| 10 to 14 Minutes | 170 (9.0%) | 188 (17.3%) |
| 15 to 19 Minutes | 215 (11.5%) | 223 (20.6%) |
| 20 to 24 Minutes | 175 (9.3%) | 258 (23.8%) |
| 25 to 29 Minutes | 25 (1.3%) | 0 (0.0%) |
| 30 to 34 Minutes | 428 (22.8%) | 20 (1.8%) |
| 35 to 39 Minutes | 27 (1.4%) | 0 (0.0%) |
| 40 to 44 Minutes | 147 (7.8%) | 3 (0.3%) |
| 45 to 59 Minutes | 268 (14.3%) | 73 (6.7%) |
| 60 to 89 Minutes | 118 (6.3%) | 37 (3.4%) |
| 90 or more Minutes | 79 (4.2%) | 44 (4.1%) |
Time of Departure to Work by Sex in Caldwell Parish
The most frequent times of departure to work in Caldwell Parish are 6:00 AM to 6:29 AM (652, 34.7%) for males and 7:00 AM to 7:29 AM (216, 19.9%) for females.
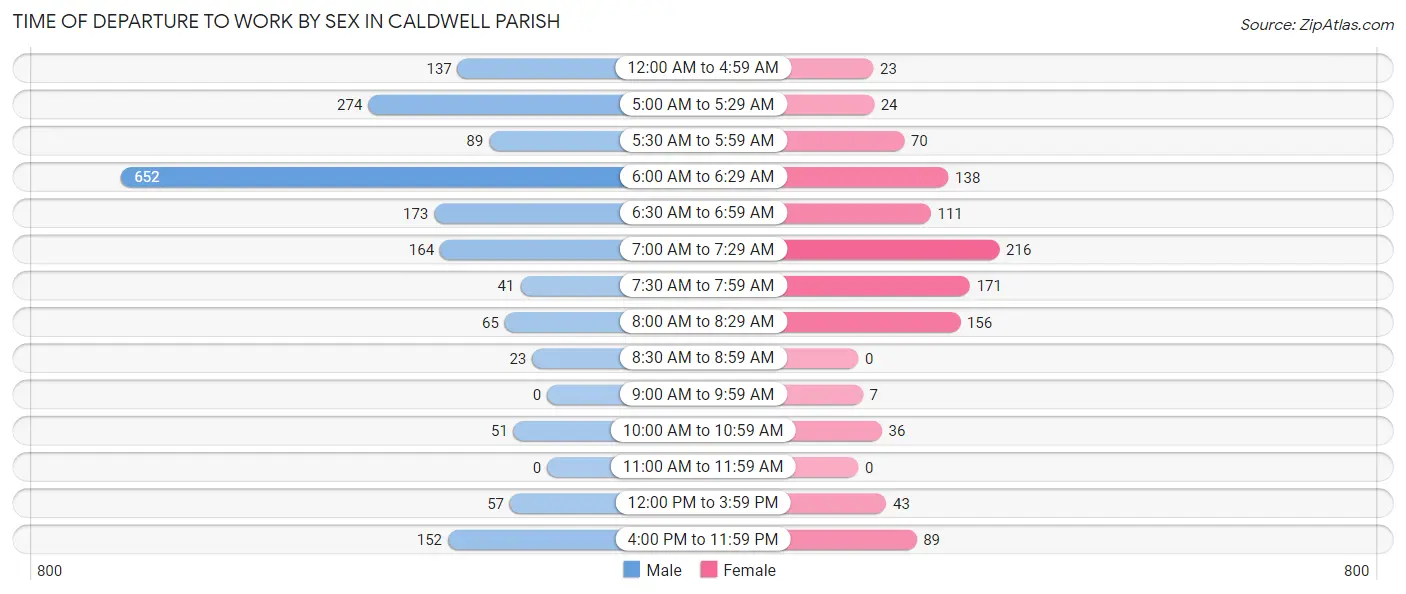
| Time of Departure | Male | Female |
| 12:00 AM to 4:59 AM | 137 (7.3%) | 23 (2.1%) |
| 5:00 AM to 5:29 AM | 274 (14.6%) | 24 (2.2%) |
| 5:30 AM to 5:59 AM | 89 (4.7%) | 70 (6.5%) |
| 6:00 AM to 6:29 AM | 652 (34.7%) | 138 (12.7%) |
| 6:30 AM to 6:59 AM | 173 (9.2%) | 111 (10.2%) |
| 7:00 AM to 7:29 AM | 164 (8.7%) | 216 (19.9%) |
| 7:30 AM to 7:59 AM | 41 (2.2%) | 171 (15.8%) |
| 8:00 AM to 8:29 AM | 65 (3.5%) | 156 (14.4%) |
| 8:30 AM to 8:59 AM | 23 (1.2%) | 0 (0.0%) |
| 9:00 AM to 9:59 AM | 0 (0.0%) | 7 (0.6%) |
| 10:00 AM to 10:59 AM | 51 (2.7%) | 36 (3.3%) |
| 11:00 AM to 11:59 AM | 0 (0.0%) | 0 (0.0%) |
| 12:00 PM to 3:59 PM | 57 (3.0%) | 43 (4.0%) |
| 4:00 PM to 11:59 PM | 152 (8.1%) | 89 (8.2%) |
| Total | 1,878 (100.0%) | 1,084 (100.0%) |
Housing Occupancy in Caldwell Parish
Occupancy by Ownership in Caldwell Parish
Of the total 3,521 dwellings in Caldwell Parish, owner-occupied units account for 2,452 (69.6%), while renter-occupied units make up 1,069 (30.4%).
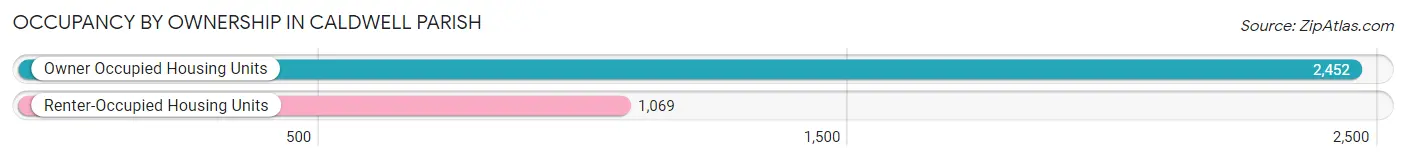
| Occupancy | # Housing Units | % Housing Units |
| Owner Occupied Housing Units | 2,452 | 69.6% |
| Renter-Occupied Housing Units | 1,069 | 30.4% |
| Total Occupied Housing Units | 3,521 | 100.0% |
Occupancy by Household Size in Caldwell Parish
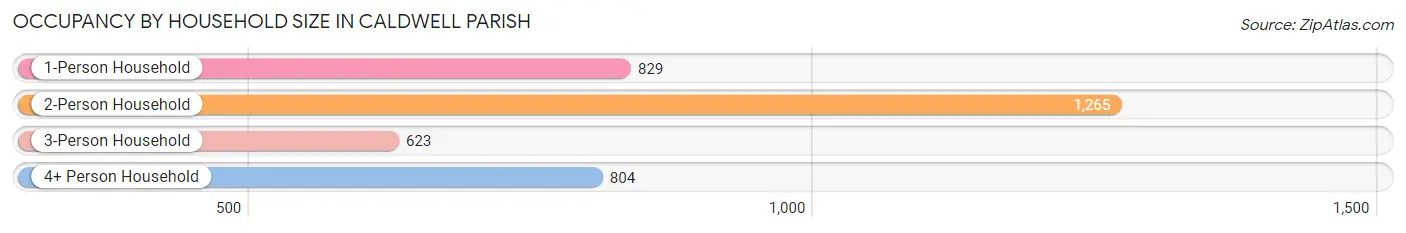
| Household Size | # Housing Units | % Housing Units |
| 1-Person Household | 829 | 23.5% |
| 2-Person Household | 1,265 | 35.9% |
| 3-Person Household | 623 | 17.7% |
| 4+ Person Household | 804 | 22.8% |
| Total Housing Units | 3,521 | 100.0% |
Occupancy by Ownership by Household Size in Caldwell Parish
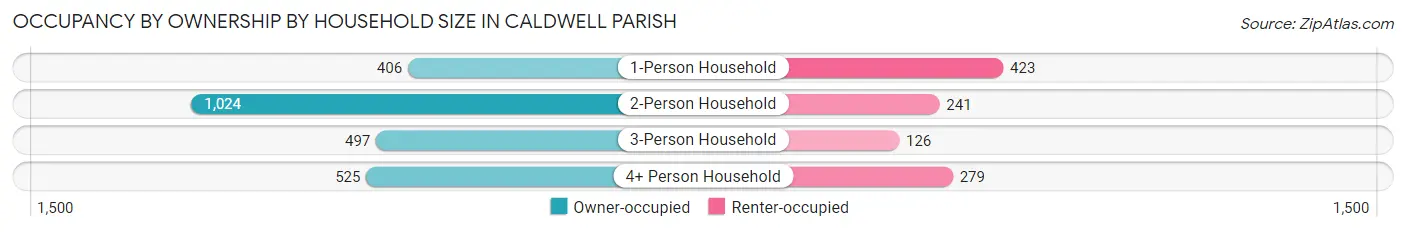
| Household Size | Owner-occupied | Renter-occupied |
| 1-Person Household | 406 (49.0%) | 423 (51.0%) |
| 2-Person Household | 1,024 (80.9%) | 241 (19.1%) |
| 3-Person Household | 497 (79.8%) | 126 (20.2%) |
| 4+ Person Household | 525 (65.3%) | 279 (34.7%) |
| Total Housing Units | 2,452 (69.6%) | 1,069 (30.4%) |
Occupancy by Educational Attainment in Caldwell Parish
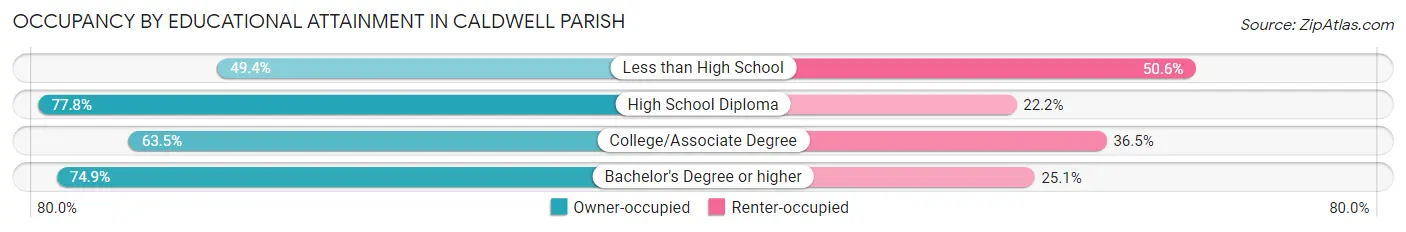
| Household Size | Owner-occupied | Renter-occupied |
| Less than High School | 253 (49.4%) | 259 (50.6%) |
| High School Diploma | 1,298 (77.8%) | 371 (22.2%) |
| College/Associate Degree | 570 (63.5%) | 328 (36.5%) |
| Bachelor's Degree or higher | 331 (74.9%) | 111 (25.1%) |
Occupancy by Age of Householder in Caldwell Parish
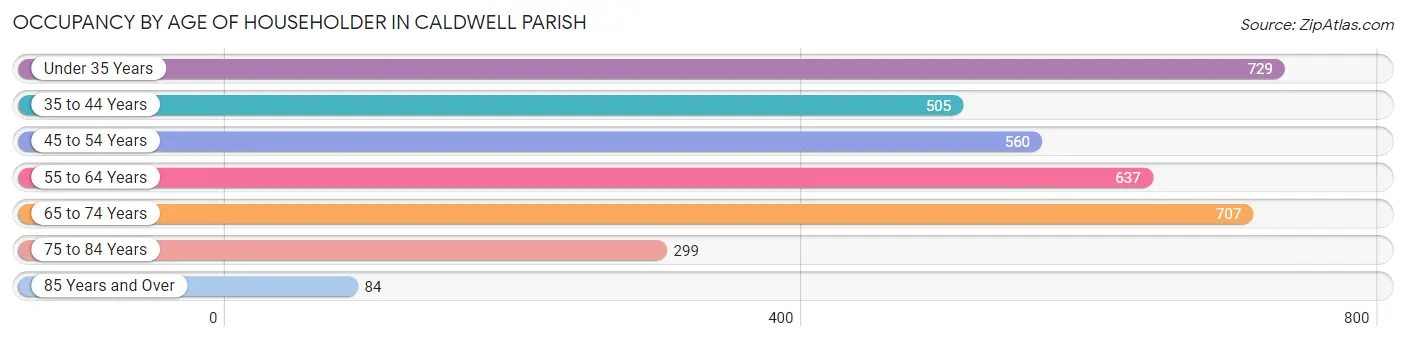
| Age Bracket | # Households | % Households |
| Under 35 Years | 729 | 20.7% |
| 35 to 44 Years | 505 | 14.3% |
| 45 to 54 Years | 560 | 15.9% |
| 55 to 64 Years | 637 | 18.1% |
| 65 to 74 Years | 707 | 20.1% |
| 75 to 84 Years | 299 | 8.5% |
| 85 Years and Over | 84 | 2.4% |
| Total | 3,521 | 100.0% |
Housing Finances in Caldwell Parish
Median Income by Occupancy in Caldwell Parish
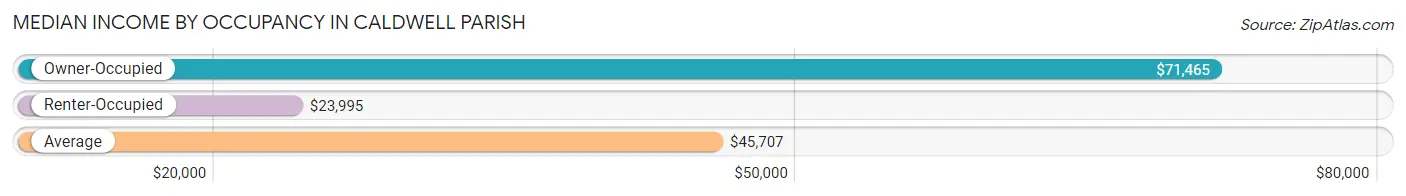
| Occupancy Type | # Households | Median Income |
| Owner-Occupied | 2,452 (69.6%) | $71,465 |
| Renter-Occupied | 1,069 (30.4%) | $23,995 |
| Average | 3,521 (100.0%) | $45,707 |
Occupancy by Householder Income Bracket in Caldwell Parish
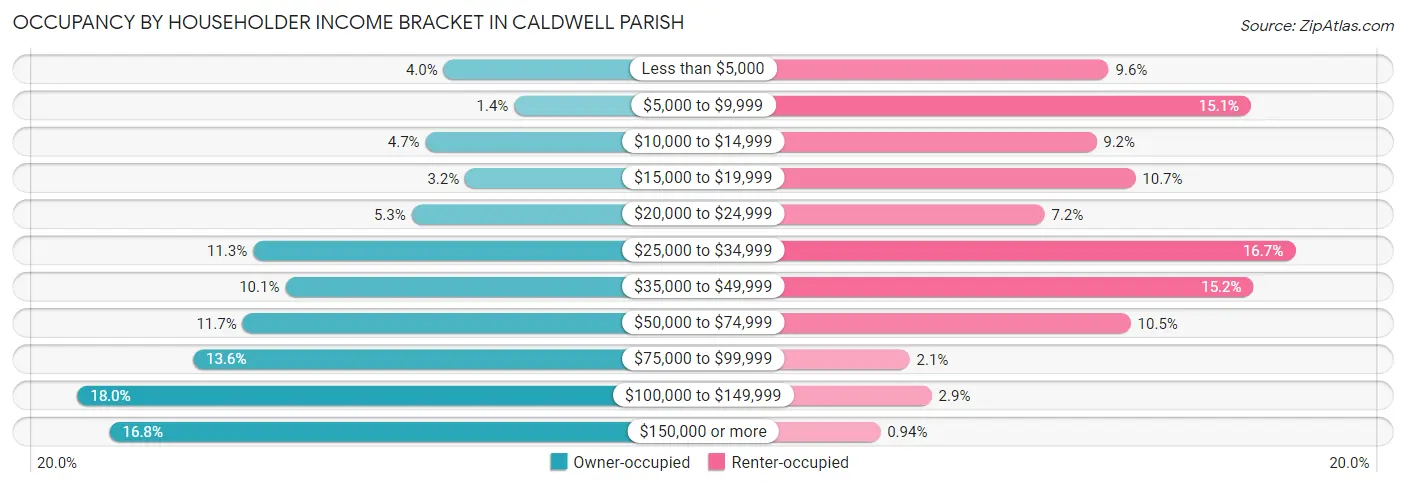
| Income Bracket | Owner-occupied | Renter-occupied |
| Less than $5,000 | 99 (4.0%) | 103 (9.6%) |
| $5,000 to $9,999 | 33 (1.3%) | 161 (15.1%) |
| $10,000 to $14,999 | 116 (4.7%) | 98 (9.2%) |
| $15,000 to $19,999 | 79 (3.2%) | 114 (10.7%) |
| $20,000 to $24,999 | 129 (5.3%) | 77 (7.2%) |
| $25,000 to $34,999 | 277 (11.3%) | 179 (16.7%) |
| $35,000 to $49,999 | 247 (10.1%) | 162 (15.1%) |
| $50,000 to $74,999 | 287 (11.7%) | 112 (10.5%) |
| $75,000 to $99,999 | 333 (13.6%) | 22 (2.1%) |
| $100,000 to $149,999 | 441 (18.0%) | 31 (2.9%) |
| $150,000 or more | 411 (16.8%) | 10 (0.9%) |
| Total | 2,452 (100.0%) | 1,069 (100.0%) |
Monthly Housing Cost Tiers in Caldwell Parish
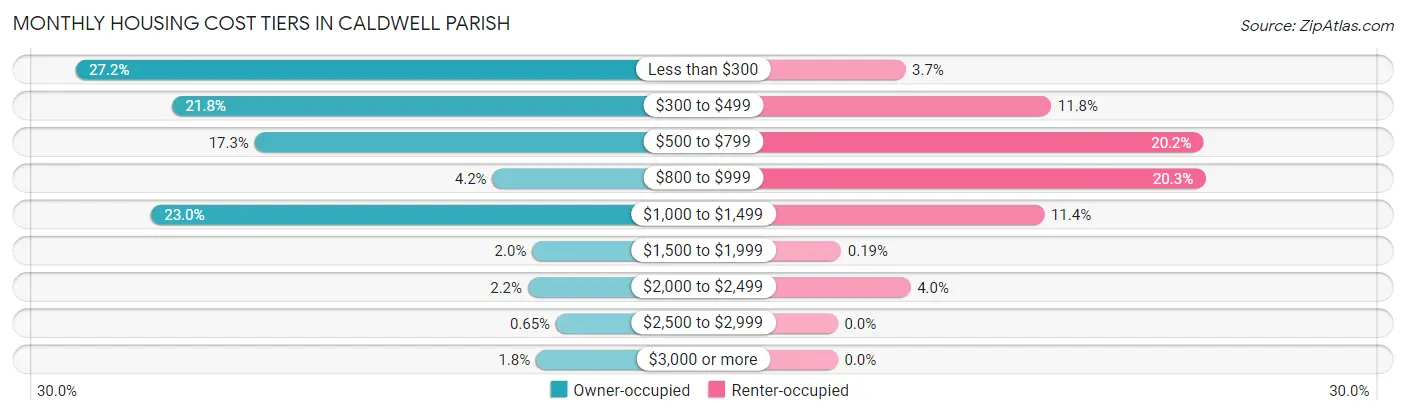
| Monthly Cost | Owner-occupied | Renter-occupied |
| Less than $300 | 666 (27.2%) | 40 (3.7%) |
| $300 to $499 | 535 (21.8%) | 126 (11.8%) |
| $500 to $799 | 424 (17.3%) | 216 (20.2%) |
| $800 to $999 | 102 (4.2%) | 217 (20.3%) |
| $1,000 to $1,499 | 564 (23.0%) | 122 (11.4%) |
| $1,500 to $1,999 | 48 (2.0%) | 2 (0.2%) |
| $2,000 to $2,499 | 54 (2.2%) | 43 (4.0%) |
| $2,500 to $2,999 | 16 (0.6%) | 0 (0.0%) |
| $3,000 or more | 43 (1.8%) | 0 (0.0%) |
| Total | 2,452 (100.0%) | 1,069 (100.0%) |
Physical Housing Characteristics in Caldwell Parish
Housing Structures in Caldwell Parish
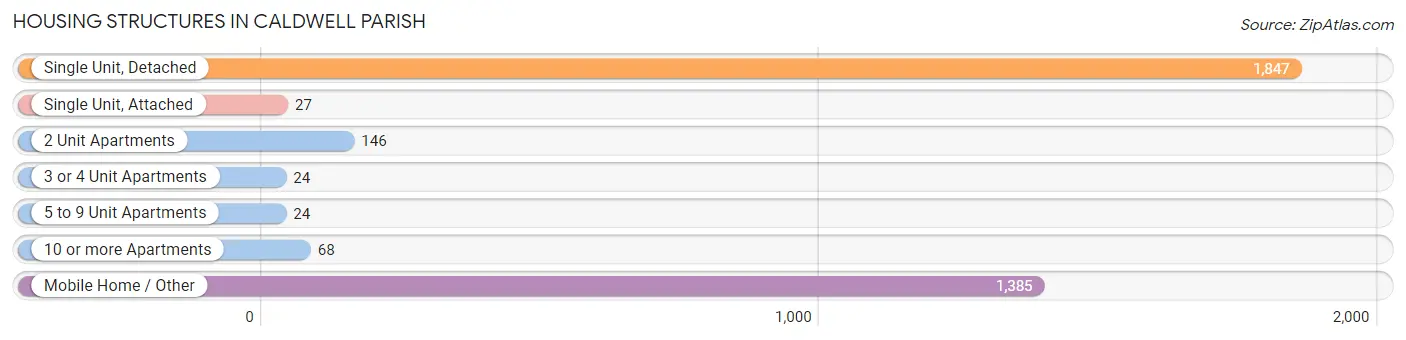
| Structure Type | # Housing Units | % Housing Units |
| Single Unit, Detached | 1,847 | 52.5% |
| Single Unit, Attached | 27 | 0.8% |
| 2 Unit Apartments | 146 | 4.2% |
| 3 or 4 Unit Apartments | 24 | 0.7% |
| 5 to 9 Unit Apartments | 24 | 0.7% |
| 10 or more Apartments | 68 | 1.9% |
| Mobile Home / Other | 1,385 | 39.3% |
| Total | 3,521 | 100.0% |
Housing Structures by Occupancy in Caldwell Parish
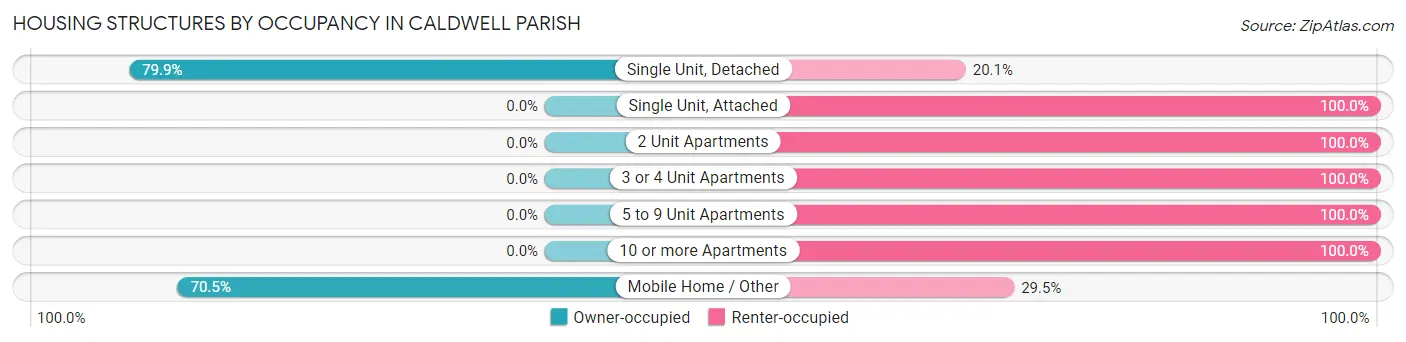
| Structure Type | Owner-occupied | Renter-occupied |
| Single Unit, Detached | 1,475 (79.9%) | 372 (20.1%) |
| Single Unit, Attached | 0 (0.0%) | 27 (100.0%) |
| 2 Unit Apartments | 0 (0.0%) | 146 (100.0%) |
| 3 or 4 Unit Apartments | 0 (0.0%) | 24 (100.0%) |
| 5 to 9 Unit Apartments | 0 (0.0%) | 24 (100.0%) |
| 10 or more Apartments | 0 (0.0%) | 68 (100.0%) |
| Mobile Home / Other | 977 (70.5%) | 408 (29.5%) |
| Total | 2,452 (69.6%) | 1,069 (30.4%) |
Housing Structures by Number of Rooms in Caldwell Parish
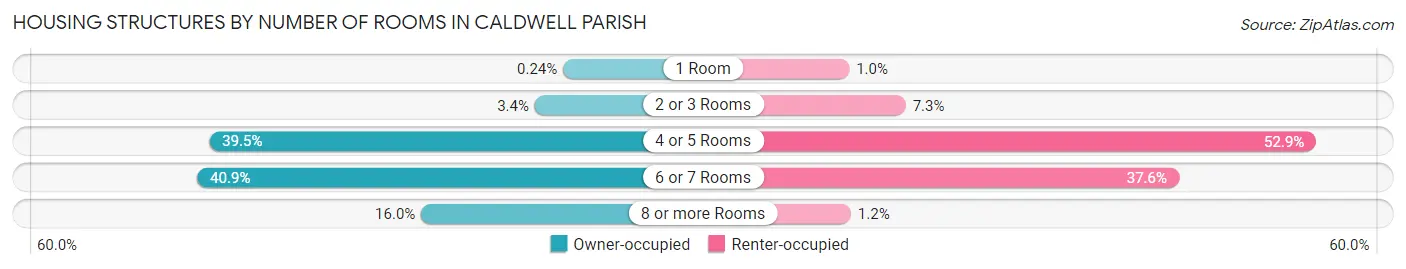
| Number of Rooms | Owner-occupied | Renter-occupied |
| 1 Room | 6 (0.2%) | 11 (1.0%) |
| 2 or 3 Rooms | 83 (3.4%) | 78 (7.3%) |
| 4 or 5 Rooms | 969 (39.5%) | 565 (52.8%) |
| 6 or 7 Rooms | 1,002 (40.9%) | 402 (37.6%) |
| 8 or more Rooms | 392 (16.0%) | 13 (1.2%) |
| Total | 2,452 (100.0%) | 1,069 (100.0%) |
Housing Structure by Heating Type in Caldwell Parish
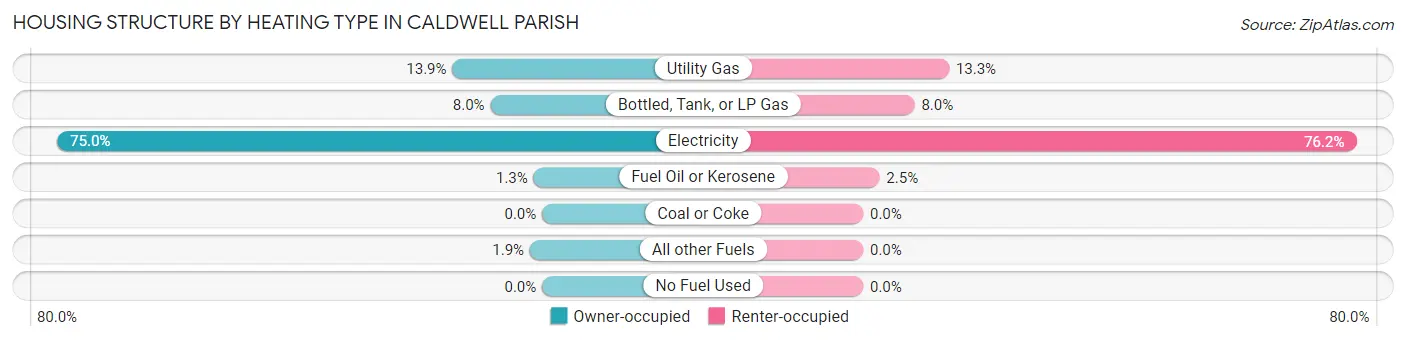
| Heating Type | Owner-occupied | Renter-occupied |
| Utility Gas | 340 (13.9%) | 142 (13.3%) |
| Bottled, Tank, or LP Gas | 196 (8.0%) | 85 (8.0%) |
| Electricity | 1,838 (75.0%) | 815 (76.2%) |
| Fuel Oil or Kerosene | 32 (1.3%) | 27 (2.5%) |
| Coal or Coke | 0 (0.0%) | 0 (0.0%) |
| All other Fuels | 46 (1.9%) | 0 (0.0%) |
| No Fuel Used | 0 (0.0%) | 0 (0.0%) |
| Total | 2,452 (100.0%) | 1,069 (100.0%) |
Household Vehicle Usage in Caldwell Parish
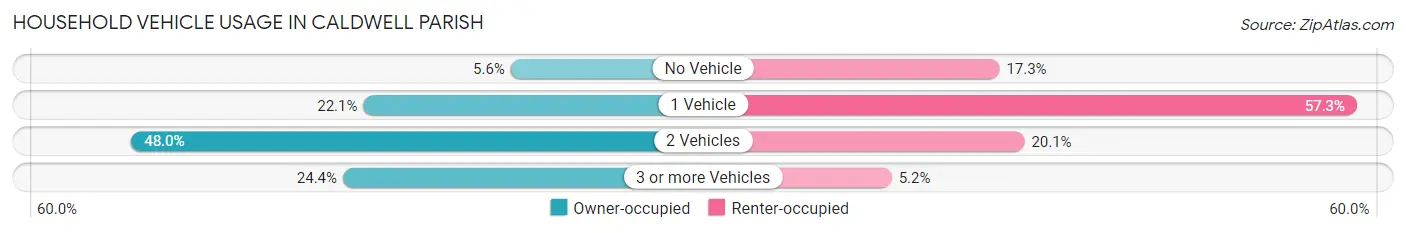
| Vehicles per Household | Owner-occupied | Renter-occupied |
| No Vehicle | 136 (5.6%) | 185 (17.3%) |
| 1 Vehicle | 541 (22.1%) | 613 (57.3%) |
| 2 Vehicles | 1,178 (48.0%) | 215 (20.1%) |
| 3 or more Vehicles | 597 (24.3%) | 56 (5.2%) |
| Total | 2,452 (100.0%) | 1,069 (100.0%) |
Real Estate & Mortgages in Caldwell Parish
Real Estate and Mortgage Overview in Caldwell Parish
| Characteristic | Without Mortgage | With Mortgage |
| Housing Units | 1,572 | 880 |
| Median Property Value | $70,800 | $164,200 |
| Median Household Income | $47,206 | $143 |
| Monthly Housing Costs | $328 | $43 |
| Real Estate Taxes | $203 | $347 |
Property Value by Mortgage Status in Caldwell Parish
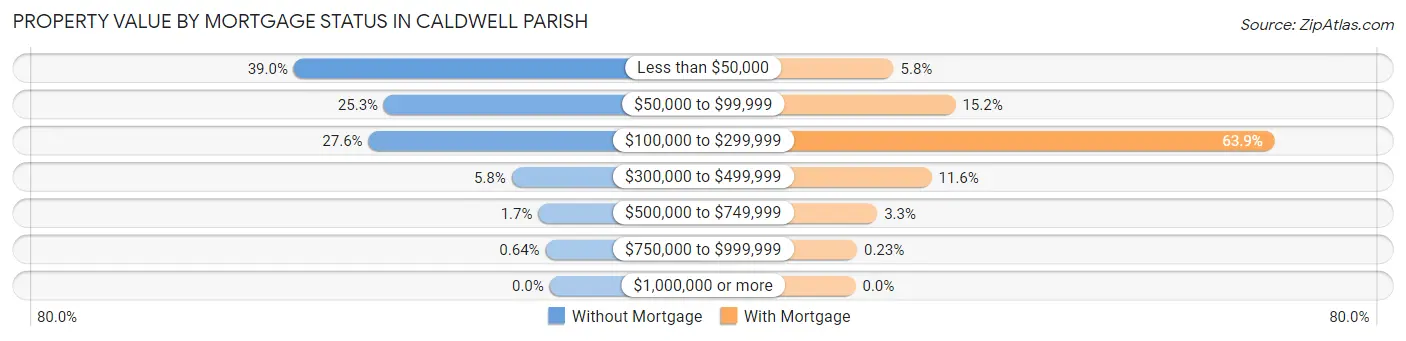
| Property Value | Without Mortgage | With Mortgage |
| Less than $50,000 | 613 (39.0%) | 51 (5.8%) |
| $50,000 to $99,999 | 397 (25.3%) | 134 (15.2%) |
| $100,000 to $299,999 | 434 (27.6%) | 562 (63.9%) |
| $300,000 to $499,999 | 91 (5.8%) | 102 (11.6%) |
| $500,000 to $749,999 | 27 (1.7%) | 29 (3.3%) |
| $750,000 to $999,999 | 10 (0.6%) | 2 (0.2%) |
| $1,000,000 or more | 0 (0.0%) | 0 (0.0%) |
| Total | 1,572 (100.0%) | 880 (100.0%) |
Household Income by Mortgage Status in Caldwell Parish
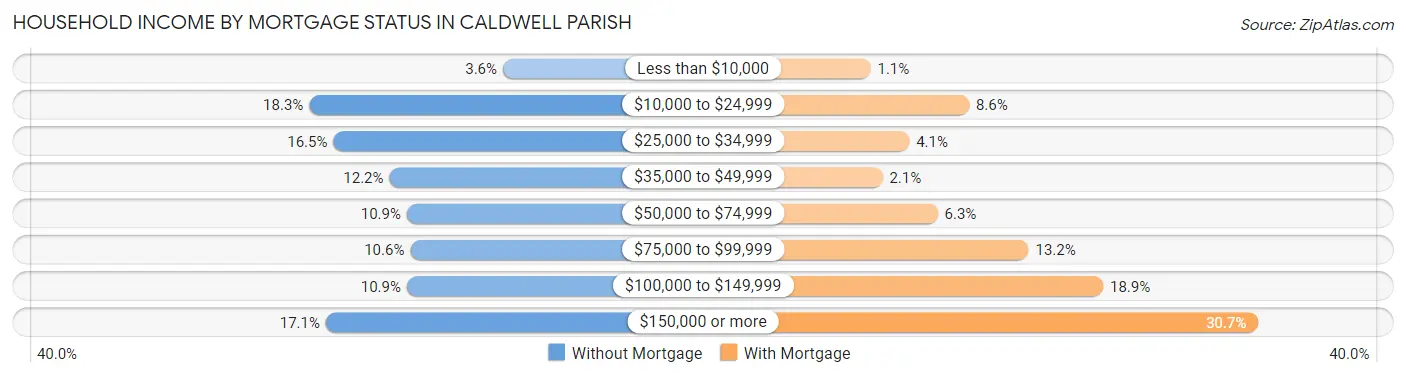
| Household Income | Without Mortgage | With Mortgage |
| Less than $10,000 | 56 (3.6%) | 10 (1.1%) |
| $10,000 to $24,999 | 288 (18.3%) | 76 (8.6%) |
| $25,000 to $34,999 | 259 (16.5%) | 36 (4.1%) |
| $35,000 to $49,999 | 192 (12.2%) | 18 (2.1%) |
| $50,000 to $74,999 | 171 (10.9%) | 55 (6.2%) |
| $75,000 to $99,999 | 167 (10.6%) | 116 (13.2%) |
| $100,000 to $149,999 | 171 (10.9%) | 166 (18.9%) |
| $150,000 or more | 268 (17.1%) | 270 (30.7%) |
| Total | 1,572 (100.0%) | 880 (100.0%) |
Property Value to Household Income Ratio in Caldwell Parish
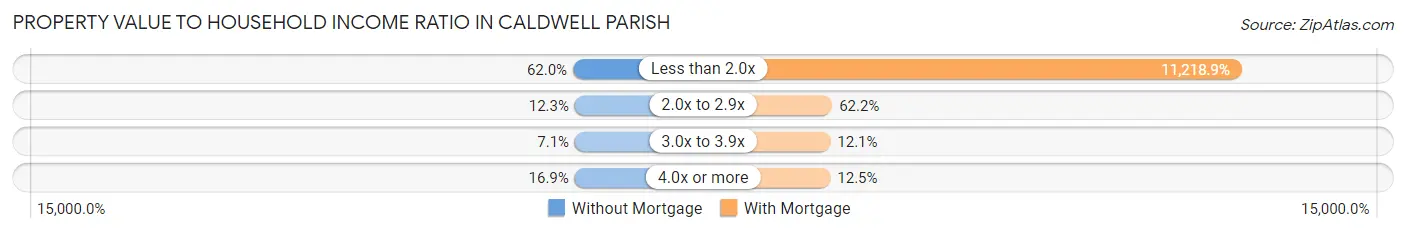
| Value-to-Income Ratio | Without Mortgage | With Mortgage |
| Less than 2.0x | 974 (62.0%) | 98,726 (11,218.9%) |
| 2.0x to 2.9x | 194 (12.3%) | 547 (62.2%) |
| 3.0x to 3.9x | 111 (7.1%) | 106 (12.0%) |
| 4.0x or more | 265 (16.9%) | 110 (12.5%) |
| Total | 1,572 (100.0%) | 880 (100.0%) |
Real Estate Taxes by Mortgage Status in Caldwell Parish
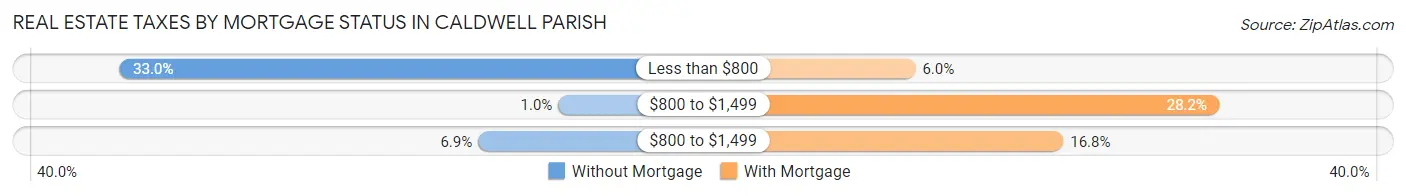
| Property Taxes | Without Mortgage | With Mortgage |
| Less than $800 | 519 (33.0%) | 53 (6.0%) |
| $800 to $1,499 | 16 (1.0%) | 248 (28.2%) |
| $800 to $1,499 | 108 (6.9%) | 148 (16.8%) |
| Total | 1,572 (100.0%) | 880 (100.0%) |
Health & Disability in Caldwell Parish
Health Insurance Coverage by Age in Caldwell Parish
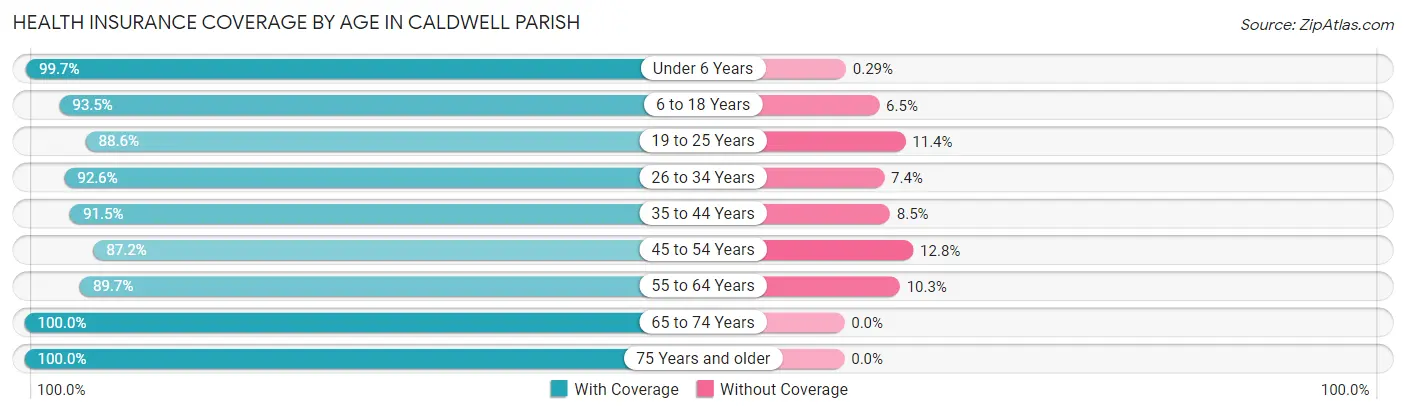
| Age Bracket | With Coverage | Without Coverage |
| Under 6 Years | 693 (99.7%) | 2 (0.3%) |
| 6 to 18 Years | 1,438 (93.5%) | 100 (6.5%) |
| 19 to 25 Years | 630 (88.6%) | 81 (11.4%) |
| 26 to 34 Years | 1,285 (92.6%) | 103 (7.4%) |
| 35 to 44 Years | 990 (91.5%) | 92 (8.5%) |
| 45 to 54 Years | 903 (87.2%) | 133 (12.8%) |
| 55 to 64 Years | 1,094 (89.7%) | 126 (10.3%) |
| 65 to 74 Years | 1,073 (100.0%) | 0 (0.0%) |
| 75 Years and older | 617 (100.0%) | 0 (0.0%) |
| Total | 8,723 (93.2%) | 637 (6.8%) |
Health Insurance Coverage by Citizenship Status in Caldwell Parish
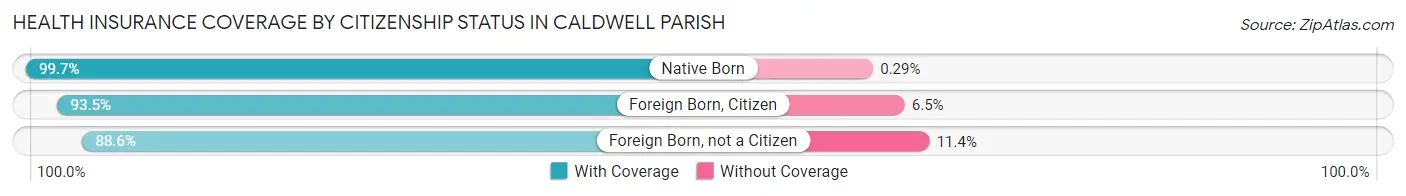
| Citizenship Status | With Coverage | Without Coverage |
| Native Born | 693 (99.7%) | 2 (0.3%) |
| Foreign Born, Citizen | 1,438 (93.5%) | 100 (6.5%) |
| Foreign Born, not a Citizen | 630 (88.6%) | 81 (11.4%) |
Health Insurance Coverage by Household Income in Caldwell Parish
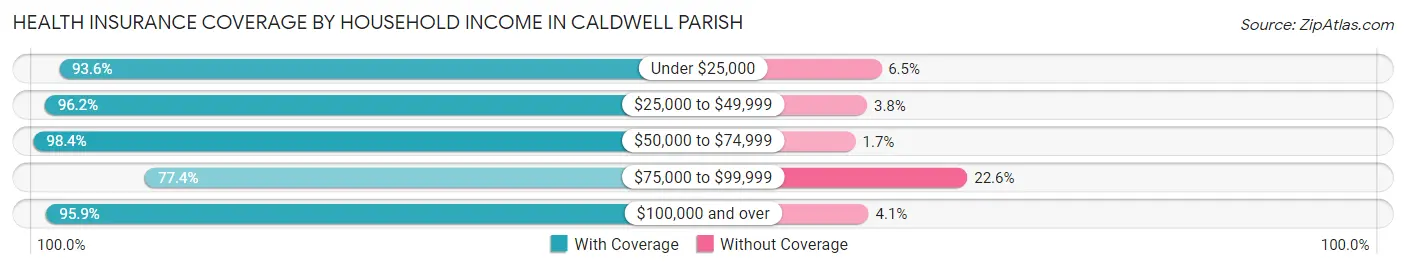
| Household Income | With Coverage | Without Coverage |
| Under $25,000 | 1,841 (93.5%) | 127 (6.5%) |
| $25,000 to $49,999 | 2,411 (96.2%) | 95 (3.8%) |
| $50,000 to $74,999 | 951 (98.4%) | 16 (1.7%) |
| $75,000 to $99,999 | 1,001 (77.4%) | 292 (22.6%) |
| $100,000 and over | 2,512 (95.9%) | 107 (4.1%) |
Public vs Private Health Insurance Coverage by Age in Caldwell Parish
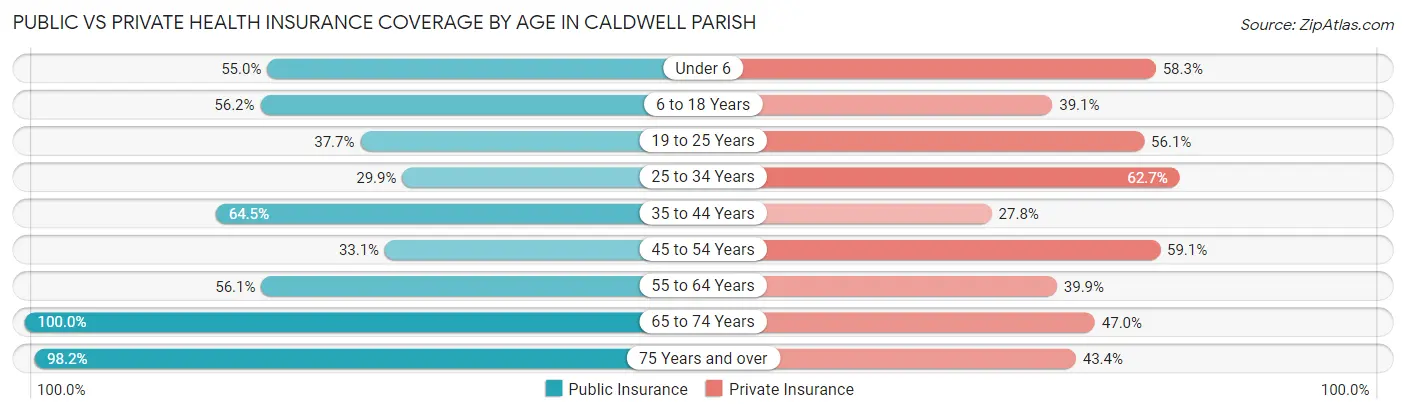
| Age Bracket | Public Insurance | Private Insurance |
| Under 6 | 382 (55.0%) | 405 (58.3%) |
| 6 to 18 Years | 865 (56.2%) | 601 (39.1%) |
| 19 to 25 Years | 268 (37.7%) | 399 (56.1%) |
| 25 to 34 Years | 415 (29.9%) | 870 (62.7%) |
| 35 to 44 Years | 698 (64.5%) | 301 (27.8%) |
| 45 to 54 Years | 343 (33.1%) | 612 (59.1%) |
| 55 to 64 Years | 684 (56.1%) | 487 (39.9%) |
| 65 to 74 Years | 1,073 (100.0%) | 504 (47.0%) |
| 75 Years and over | 606 (98.2%) | 268 (43.4%) |
| Total | 5,334 (57.0%) | 4,447 (47.5%) |
Disability Status by Sex by Age in Caldwell Parish
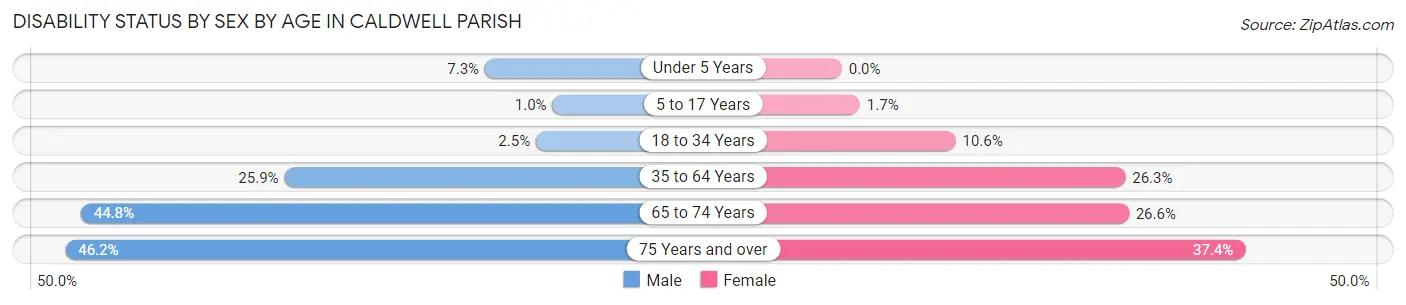
| Age Bracket | Male | Female |
| Under 5 Years | 22 (7.3%) | 0 (0.0%) |
| 5 to 17 Years | 9 (1.0%) | 13 (1.7%) |
| 18 to 34 Years | 29 (2.5%) | 103 (10.6%) |
| 35 to 64 Years | 450 (25.9%) | 421 (26.3%) |
| 65 to 74 Years | 240 (44.8%) | 143 (26.6%) |
| 75 Years and over | 116 (46.2%) | 137 (37.4%) |
Disability Class by Sex by Age in Caldwell Parish
Disability Class: Hearing Difficulty
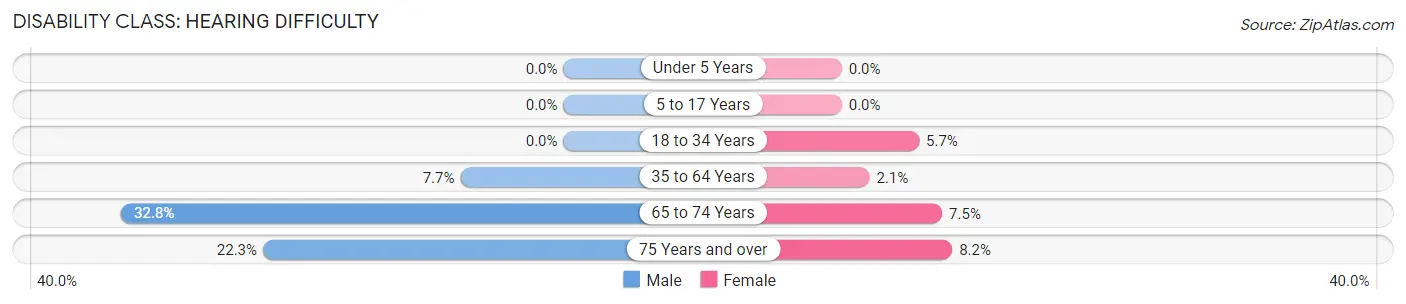
| Age Bracket | Male | Female |
| Under 5 Years | 0 (0.0%) | 0 (0.0%) |
| 5 to 17 Years | 0 (0.0%) | 0 (0.0%) |
| 18 to 34 Years | 0 (0.0%) | 56 (5.7%) |
| 35 to 64 Years | 133 (7.6%) | 33 (2.1%) |
| 65 to 74 Years | 176 (32.8%) | 40 (7.4%) |
| 75 Years and over | 56 (22.3%) | 30 (8.2%) |
Disability Class: Vision Difficulty
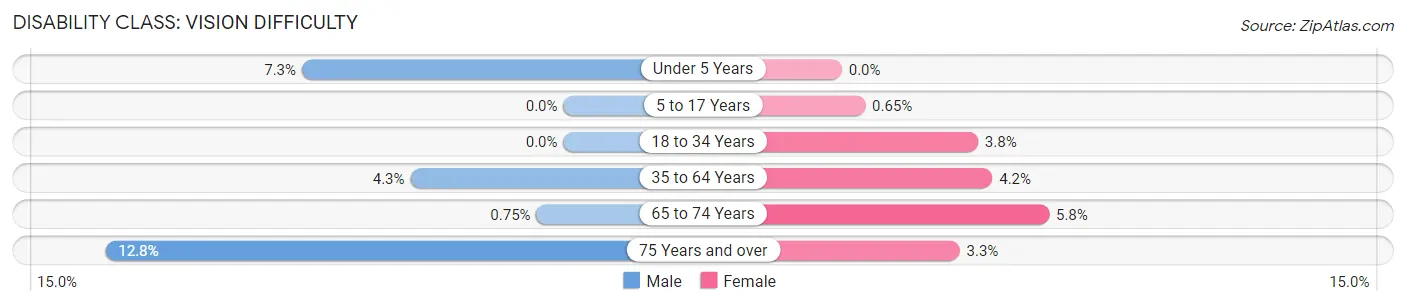
| Age Bracket | Male | Female |
| Under 5 Years | 22 (7.3%) | 0 (0.0%) |
| 5 to 17 Years | 0 (0.0%) | 5 (0.6%) |
| 18 to 34 Years | 0 (0.0%) | 37 (3.8%) |
| 35 to 64 Years | 74 (4.3%) | 67 (4.2%) |
| 65 to 74 Years | 4 (0.7%) | 31 (5.8%) |
| 75 Years and over | 32 (12.8%) | 12 (3.3%) |
Disability Class: Cognitive Difficulty
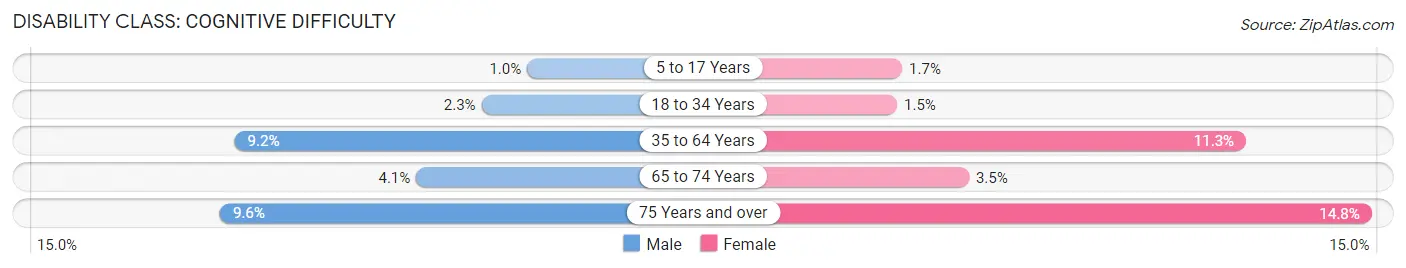
| Age Bracket | Male | Female |
| 5 to 17 Years | 9 (1.0%) | 13 (1.7%) |
| 18 to 34 Years | 26 (2.3%) | 15 (1.5%) |
| 35 to 64 Years | 159 (9.1%) | 180 (11.3%) |
| 65 to 74 Years | 22 (4.1%) | 19 (3.5%) |
| 75 Years and over | 24 (9.6%) | 54 (14.7%) |
Disability Class: Ambulatory Difficulty
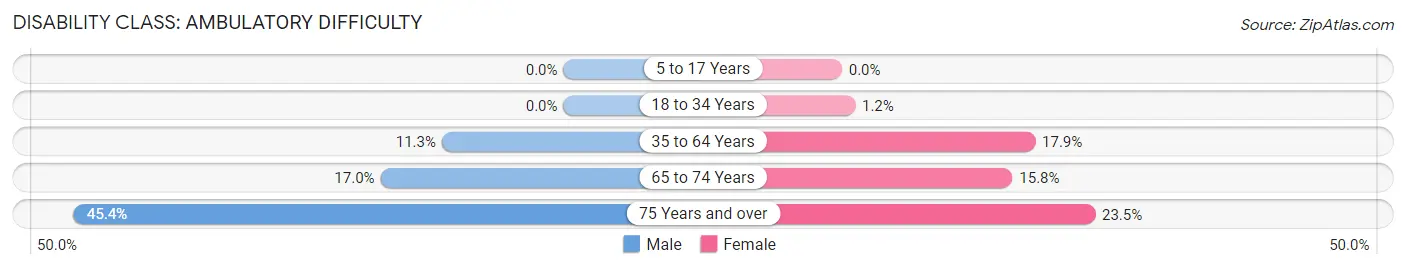
| Age Bracket | Male | Female |
| 5 to 17 Years | 0 (0.0%) | 0 (0.0%) |
| 18 to 34 Years | 0 (0.0%) | 12 (1.2%) |
| 35 to 64 Years | 196 (11.3%) | 287 (17.9%) |
| 65 to 74 Years | 91 (17.0%) | 85 (15.8%) |
| 75 Years and over | 114 (45.4%) | 86 (23.5%) |
Disability Class: Self-Care Difficulty
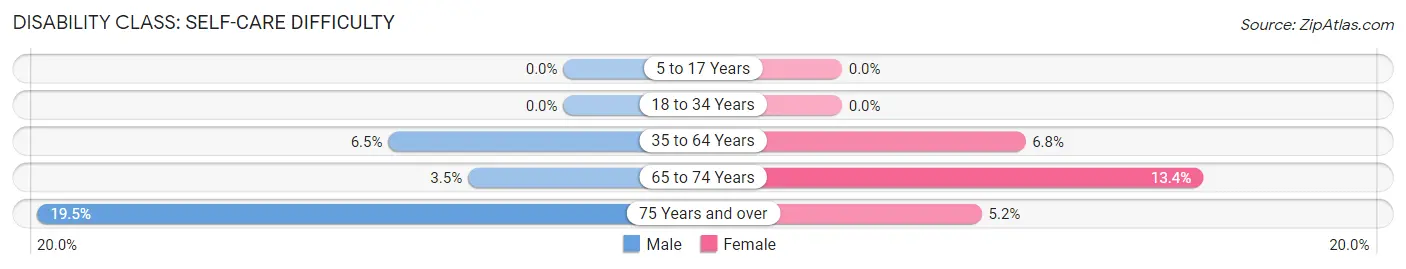
| Age Bracket | Male | Female |
| 5 to 17 Years | 0 (0.0%) | 0 (0.0%) |
| 18 to 34 Years | 0 (0.0%) | 0 (0.0%) |
| 35 to 64 Years | 113 (6.5%) | 109 (6.8%) |
| 65 to 74 Years | 19 (3.5%) | 72 (13.4%) |
| 75 Years and over | 49 (19.5%) | 19 (5.2%) |
Technology Access in Caldwell Parish
Computing Device Access in Caldwell Parish
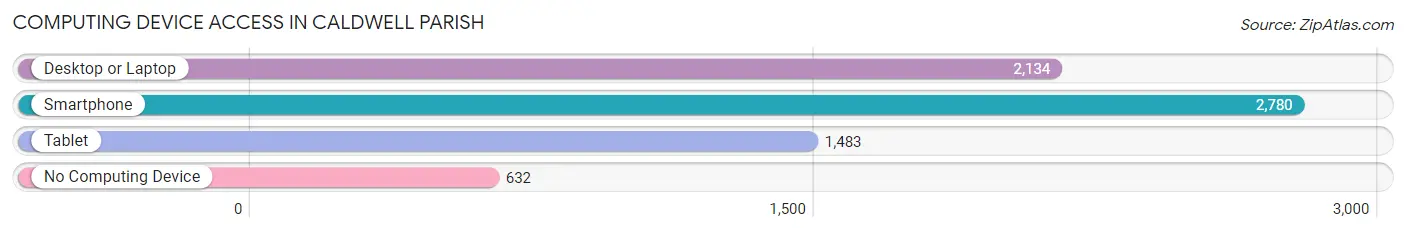
| Device Type | # Households | % Households |
| Desktop or Laptop | 2,134 | 60.6% |
| Smartphone | 2,780 | 78.9% |
| Tablet | 1,483 | 42.1% |
| No Computing Device | 632 | 17.9% |
| Total | 3,521 | 100.0% |
Internet Access in Caldwell Parish
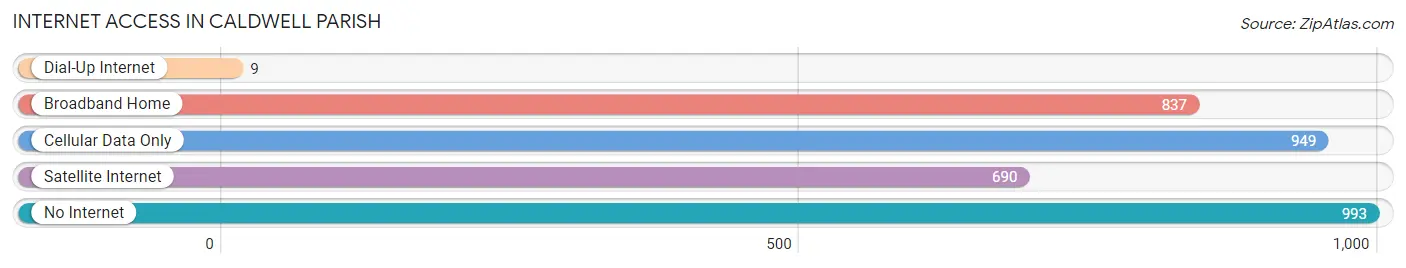
| Internet Type | # Households | % Households |
| Dial-Up Internet | 9 | 0.3% |
| Broadband Home | 837 | 23.8% |
| Cellular Data Only | 949 | 27.0% |
| Satellite Internet | 690 | 19.6% |
| No Internet | 993 | 28.2% |
| Total | 3,521 | 100.0% |
Caldwell Parish Summary
Caldwell Parish is a parish located in the northeastern part of the state of Louisiana. It is bordered by the parishes of Franklin, Jackson, Ouachita, Richland, and Tensas. The parish seat is Columbia, and the largest city is Grayson. The parish was created in 1838 and named for Matthew Caldwell, a veteran of the War of 1812.
Geography
Caldwell Parish is located in the northeastern part of Louisiana, and is bordered by the parishes of Franklin, Jackson, Ouachita, Richland, and Tensas. The parish has a total area of 545 square miles, of which 543 square miles is land and 2 square miles (0.4%) is water. The parish is located in the Central Uplands region of the state, and is characterized by rolling hills and flatlands. The parish is drained by the Ouachita River and its tributaries, including the Boeuf, Little Boeuf, and Tensas rivers.
Demographics
As of the 2010 census, there were 10,132 people, 3,845 households, and 2,717 families residing in the parish. The population density was 18.7 people per square mile. The racial makeup of the parish was 68.3% White, 30.2% African American, 0.3% Native American, 0.2% Asian, 0.1% Pacific Islander, 0.3% from other races, and 0.6% from two or more races. Hispanic or Latino of any race were 1.2% of the population.
The median income for a household in the parish was $30,945, and the median income for a family was $37,945. The per capita income for the parish was $15,845. About 19.2% of families and 23.2% of the population were below the poverty line, including 30.2% of those under age 18 and 22.2% of those age 65 or over.
Economy
Caldwell Parish is primarily a rural parish, and the economy is largely based on agriculture. The main crops grown in the parish are cotton, soybeans, corn, and wheat. Livestock production is also important, with cattle, hogs, and poultry being the main animals raised.
The parish also has a number of manufacturing and industrial businesses, including a paper mill, a wood products plant, and a chemical plant. The parish is also home to a number of oil and gas production facilities.
The parish is served by two major highways, U.S. Route 165 and Louisiana Highway 4. The nearest airport is the Monroe Regional Airport, located about 30 miles to the south.
Conclusion
Caldwell Parish is a rural parish located in the northeastern part of Louisiana. It is bordered by the parishes of Franklin, Jackson, Ouachita, Richland, and Tensas. The parish has a total area of 545 square miles, and is characterized by rolling hills and flatlands. The population of the parish was 10,132 as of the 2010 census. The economy of the parish is largely based on agriculture, with cotton, soybeans, corn, and wheat being the main crops grown. The parish also has a number of manufacturing and industrial businesses, as well as oil and gas production facilities. The parish is served by two major highways, U.S. Route 165 and Louisiana Highway 4, and the nearest airport is the Monroe Regional Airport.
Common Questions
What is the Total Population of Caldwell Parish?
Total Population of Caldwell Parish is 9,658.
What is the Total Male Population of Caldwell Parish?
Total Male Population of Caldwell Parish is 5,100.
What is the Total Female Population of Caldwell Parish?
Total Female Population of Caldwell Parish is 4,558.
What is the Ratio of Males per 100 Females in Caldwell Parish?
There are 111.89 Males per 100 Females in Caldwell Parish.
What is the Ratio of Females per 100 Males in Caldwell Parish?
There are 89.37 Females per 100 Males in Caldwell Parish.
What is the Median Population Age in Caldwell Parish?
Median Population Age in Caldwell Parish is 40.2 Years.
What is the Average Family Size in Caldwell Parish
Average Family Size in Caldwell Parish is 3.2 People.
What is the Average Household Size in Caldwell Parish
Average Household Size in Caldwell Parish is 2.7 People.
What is Per Capita Income in Caldwell Parish?
Per Capita income in Caldwell Parish is $28,491.
What is the Median Family Income in Caldwell Parish?
Median Family Income in Caldwell Parish is $67,383.
What is the Median Household income in Caldwell Parish?
Median Household Income in Caldwell Parish is $45,707.
What is Income or Wage Gap in Caldwell Parish?
Income or Wage Gap in Caldwell Parish is 21.4%.
Women in Caldwell Parish earn 78.6 cents for every dollar earned by a man.
What is Inequality or Gini Index in Caldwell Parish?
Inequality or Gini Index in Caldwell Parish is 0.53.
How Large is the Labor Force in Caldwell Parish?
There are 3,626 People in the Labor Forcein in Caldwell Parish.
What is the Percentage of People in the Labor Force in Caldwell Parish?
47.3% of People are in the Labor Force in Caldwell Parish.
What is the Unemployment Rate in Caldwell Parish?
Unemployment Rate in Caldwell Parish is 12.9%.