Calcasieu Parish, LA
Calcasieu Parish Map
Calcasieu Parish Overview
210,770
TOTAL POPULATION
103,638
MALE POPULATION
107,132
FEMALE POPULATION
96.74
MALES / 100 FEMALES
103.37
FEMALES / 100 MALES
36.7
MEDIAN AGE
3.4
AVG FAMILY SIZE
2.7
AVG HOUSEHOLD SIZE
$33,486
PER CAPITA INCOME
$79,749
AVG FAMILY INCOME
$64,370
AVG HOUSEHOLD INCOME
47.0%
WAGE / INCOME GAP [ % ]
53.0¢/ $1
WAGE / INCOME GAP [ $ ]
$10,362
FAMILY INCOME DEFICIT
0.47
INEQUALITY / GINI INDEX
97,522
LABOR FORCE [ PEOPLE ]
59.7%
PERCENT IN LABOR FORCE
5.6%
UNEMPLOYMENT RATE
Calcasieu Parish Area Codes
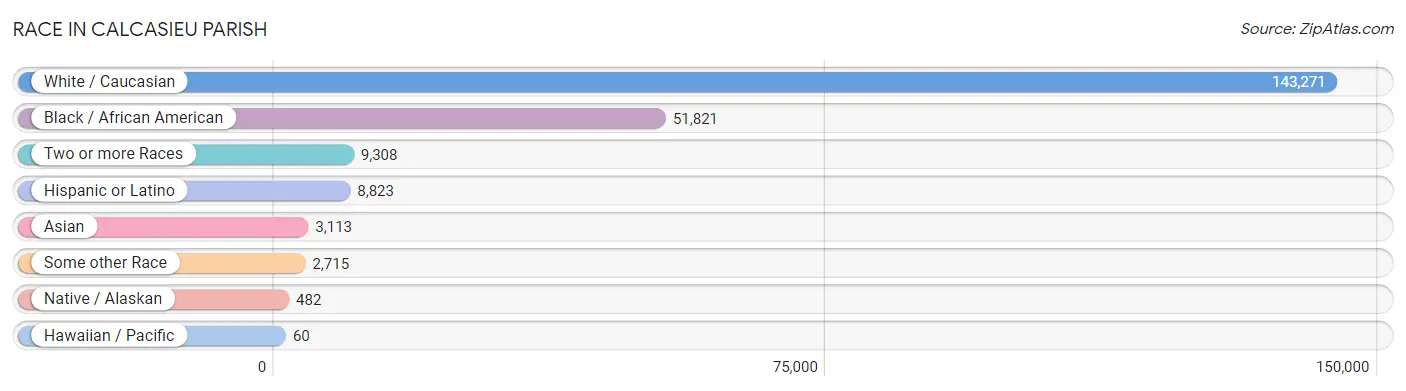
Race in Calcasieu Parish
The most populous races in Calcasieu Parish are White / Caucasian (143,271 | 68.0%), Black / African American (51,821 | 24.6%), and Two or more Races (9,308 | 4.4%).
| Race | # Population | % Population |
| Asian | 3,113 | 1.5% |
| Black / African American | 51,821 | 24.6% |
| Hawaiian / Pacific | 60 | 0.0% |
| Hispanic or Latino | 8,823 | 4.2% |
| Native / Alaskan | 482 | 0.2% |
| White / Caucasian | 143,271 | 68.0% |
| Two or more Races | 9,308 | 4.4% |
| Some other Race | 2,715 | 1.3% |
| Total | 210,770 | 100.0% |
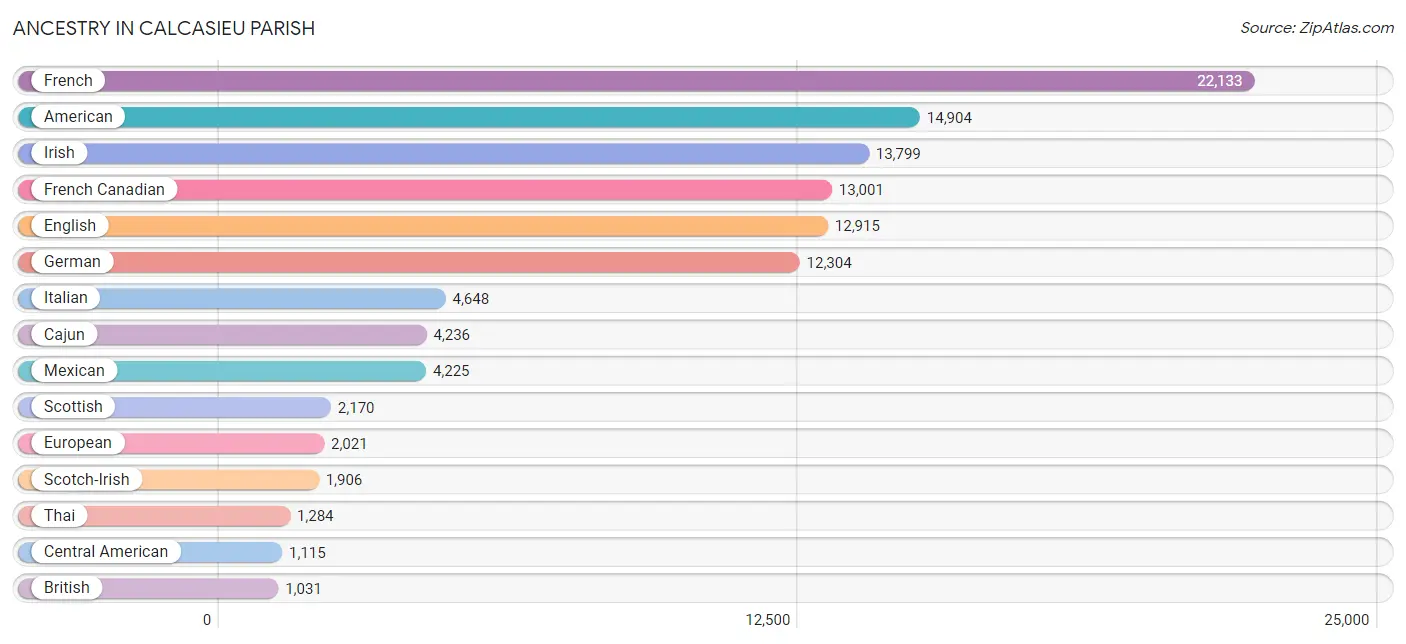
Ancestry in Calcasieu Parish
The most populous ancestries reported in Calcasieu Parish are French (22,133 | 10.5%), American (14,904 | 7.1%), Irish (13,799 | 6.6%), French Canadian (13,001 | 6.2%), and English (12,915 | 6.1%), together accounting for 36.4% of all Calcasieu Parish residents.
| Ancestry | # Population | % Population |
| African | 711 | 0.3% |
| American | 14,904 | 7.1% |
| Apache | 30 | 0.0% |
| Arab | 573 | 0.3% |
| Austrian | 80 | 0.0% |
| Bangladeshi | 38 | 0.0% |
| Basque | 7 | 0.0% |
| Belgian | 67 | 0.0% |
| Bermudan | 106 | 0.1% |
| Bhutanese | 296 | 0.1% |
| Blackfeet | 272 | 0.1% |
| Bolivian | 17 | 0.0% |
| Brazilian | 78 | 0.0% |
| British | 1,031 | 0.5% |
| British West Indian | 447 | 0.2% |
| Bulgarian | 5 | 0.0% |
| Burmese | 52 | 0.0% |
| Cajun | 4,236 | 2.0% |
| Canadian | 232 | 0.1% |
| Celtic | 21 | 0.0% |
| Central American | 1,115 | 0.5% |
| Cherokee | 236 | 0.1% |
| Chilean | 52 | 0.0% |
| Choctaw | 424 | 0.2% |
| Colombian | 291 | 0.1% |
| Comanche | 14 | 0.0% |
| Costa Rican | 5 | 0.0% |
| Croatian | 6 | 0.0% |
| Cuban | 287 | 0.1% |
| Czech | 215 | 0.1% |
| Czechoslovakian | 33 | 0.0% |
| Danish | 88 | 0.0% |
| Dutch | 792 | 0.4% |
| Eastern European | 69 | 0.0% |
| Egyptian | 21 | 0.0% |
| English | 12,915 | 6.1% |
| European | 2,021 | 1.0% |
| Filipino | 36 | 0.0% |
| Finnish | 125 | 0.1% |
| French | 22,133 | 10.5% |
| French American Indian | 143 | 0.1% |
| French Canadian | 13,001 | 6.2% |
| German | 12,304 | 5.8% |
| Ghanaian | 18 | 0.0% |
| Greek | 238 | 0.1% |
| Guamanian / Chamorro | 31 | 0.0% |
| Guatemalan | 164 | 0.1% |
| Guyanese | 20 | 0.0% |
| Haitian | 150 | 0.1% |
| Honduran | 782 | 0.4% |
| Houma | 71 | 0.0% |
| Hungarian | 67 | 0.0% |
| Indian (Asian) | 139 | 0.1% |
| Irish | 13,799 | 6.6% |
| Iroquois | 6 | 0.0% |
| Israeli | 508 | 0.2% |
| Italian | 4,648 | 2.2% |
| Jamaican | 86 | 0.0% |
| Japanese | 189 | 0.1% |
| Korean | 248 | 0.1% |
| Laotian | 5 | 0.0% |
| Lebanese | 292 | 0.1% |
| Macedonian | 38 | 0.0% |
| Malaysian | 73 | 0.0% |
| Mexican | 4,225 | 2.0% |
| Mexican American Indian | 26 | 0.0% |
| Native Hawaiian | 50 | 0.0% |
| Navajo | 60 | 0.0% |
| Nicaraguan | 24 | 0.0% |
| Nigerian | 190 | 0.1% |
| Northern European | 162 | 0.1% |
| Norwegian | 572 | 0.3% |
| Pakistani | 68 | 0.0% |
| Palestinian | 115 | 0.1% |
| Panamanian | 71 | 0.0% |
| Pennsylvania German | 27 | 0.0% |
| Peruvian | 98 | 0.1% |
| Polish | 708 | 0.3% |
| Portuguese | 222 | 0.1% |
| Puerto Rican | 510 | 0.2% |
| Romanian | 267 | 0.1% |
| Russian | 107 | 0.1% |
| Salvadoran | 69 | 0.0% |
| Samoan | 89 | 0.0% |
| Scandinavian | 150 | 0.1% |
| Scotch-Irish | 1,906 | 0.9% |
| Scottish | 2,170 | 1.0% |
| Seminole | 12 | 0.0% |
| Sioux | 100 | 0.1% |
| South American | 718 | 0.3% |
| South American Indian | 33 | 0.0% |
| Spaniard | 470 | 0.2% |
| Spanish | 765 | 0.4% |
| Sri Lankan | 415 | 0.2% |
| Subsaharan African | 930 | 0.4% |
| Swedish | 755 | 0.4% |
| Swiss | 66 | 0.0% |
| Syrian | 40 | 0.0% |
| Thai | 1,284 | 0.6% |
| Trinidadian and Tobagonian | 130 | 0.1% |
| Turkish | 95 | 0.1% |
| Ukrainian | 21 | 0.0% |
| Uruguayan | 11 | 0.0% |
| Venezuelan | 188 | 0.1% |
| Vietnamese | 14 | 0.0% |
| Welsh | 380 | 0.2% |
| West Indian | 10 | 0.0% | View All 107 Rows |
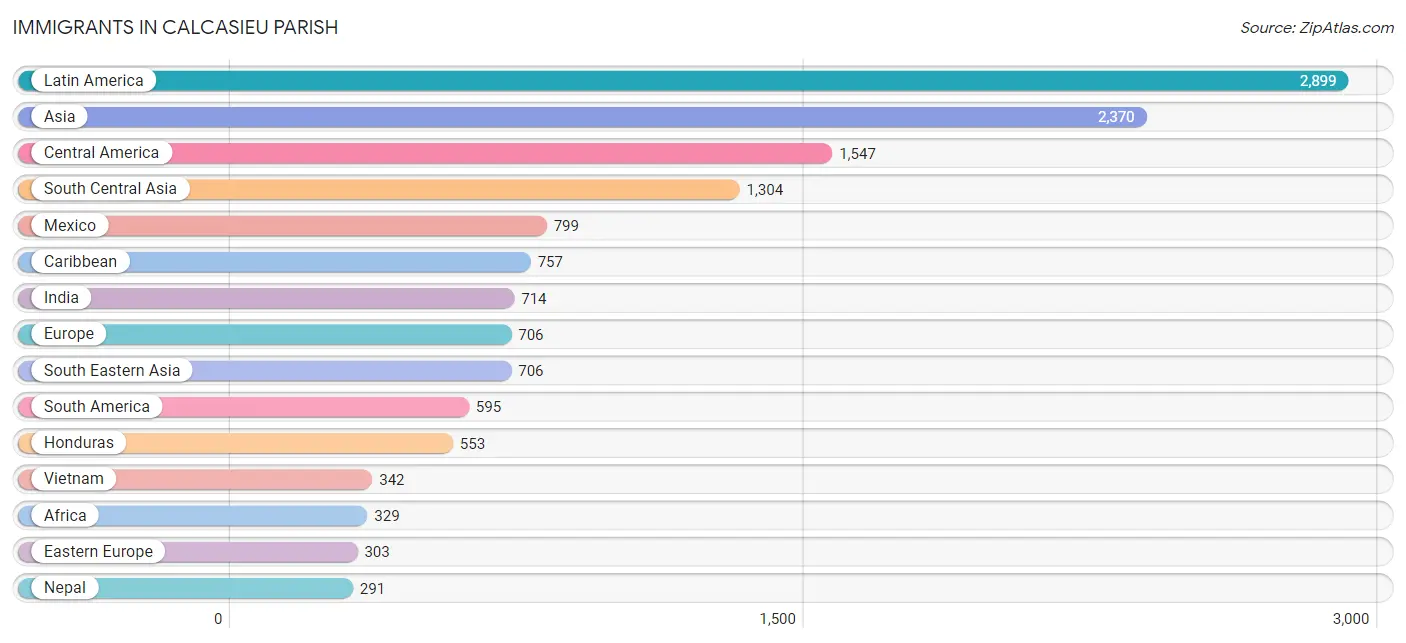
Immigrants in Calcasieu Parish
The most numerous immigrant groups reported in Calcasieu Parish came from Latin America (2,899 | 1.4%), Asia (2,370 | 1.1%), Central America (1,547 | 0.7%), South Central Asia (1,304 | 0.6%), and Mexico (799 | 0.4%), together accounting for 4.2% of all Calcasieu Parish residents.
| Immigration Origin | # Population | % Population |
| Africa | 329 | 0.2% |
| Asia | 2,370 | 1.1% |
| Bangladesh | 30 | 0.0% |
| Belgium | 18 | 0.0% |
| Brazil | 53 | 0.0% |
| Bulgaria | 5 | 0.0% |
| Cambodia | 189 | 0.1% |
| Canada | 111 | 0.1% |
| Caribbean | 757 | 0.4% |
| Central America | 1,547 | 0.7% |
| Chile | 12 | 0.0% |
| China | 143 | 0.1% |
| Colombia | 212 | 0.1% |
| Costa Rica | 27 | 0.0% |
| Cuba | 122 | 0.1% |
| Dominican Republic | 225 | 0.1% |
| Eastern Africa | 13 | 0.0% |
| Eastern Asia | 208 | 0.1% |
| Eastern Europe | 303 | 0.1% |
| Egypt | 21 | 0.0% |
| El Salvador | 22 | 0.0% |
| England | 104 | 0.1% |
| Europe | 706 | 0.3% |
| France | 13 | 0.0% |
| Germany | 59 | 0.0% |
| Ghana | 18 | 0.0% |
| Greece | 24 | 0.0% |
| Guatemala | 69 | 0.0% |
| Guyana | 20 | 0.0% |
| Haiti | 171 | 0.1% |
| Honduras | 553 | 0.3% |
| Hungary | 19 | 0.0% |
| India | 714 | 0.3% |
| Ireland | 7 | 0.0% |
| Italy | 7 | 0.0% |
| Jamaica | 48 | 0.0% |
| Japan | 35 | 0.0% |
| Jordan | 50 | 0.0% |
| Korea | 30 | 0.0% |
| Laos | 52 | 0.0% |
| Latin America | 2,899 | 1.4% |
| Mexico | 799 | 0.4% |
| Nepal | 291 | 0.1% |
| Netherlands | 21 | 0.0% |
| Nicaragua | 24 | 0.0% |
| Nigeria | 257 | 0.1% |
| North Macedonia | 38 | 0.0% |
| Northern Africa | 41 | 0.0% |
| Northern Europe | 132 | 0.1% |
| Oceania | 41 | 0.0% |
| Pakistan | 254 | 0.1% |
| Panama | 53 | 0.0% |
| Peru | 107 | 0.1% |
| Philippines | 65 | 0.0% |
| Poland | 5 | 0.0% |
| Portugal | 12 | 0.0% |
| Romania | 224 | 0.1% |
| Saudi Arabia | 23 | 0.0% |
| South America | 595 | 0.3% |
| South Central Asia | 1,304 | 0.6% |
| South Eastern Asia | 706 | 0.3% |
| Southern Europe | 160 | 0.1% |
| Spain | 117 | 0.1% |
| Taiwan | 89 | 0.0% |
| Thailand | 58 | 0.0% |
| Trinidad and Tobago | 20 | 0.0% |
| Turkey | 36 | 0.0% |
| Ukraine | 12 | 0.0% |
| Uruguay | 11 | 0.0% |
| Venezuela | 159 | 0.1% |
| Vietnam | 342 | 0.2% |
| Western Africa | 275 | 0.1% |
| Western Asia | 128 | 0.1% |
| Western Europe | 111 | 0.1% | View All 74 Rows |
Sex and Age in Calcasieu Parish
Sex and Age in Calcasieu Parish
The most populous age groups in Calcasieu Parish are 10 to 14 Years (7,807 | 7.5%) for men and 10 to 14 Years (7,751 | 7.2%) for women.
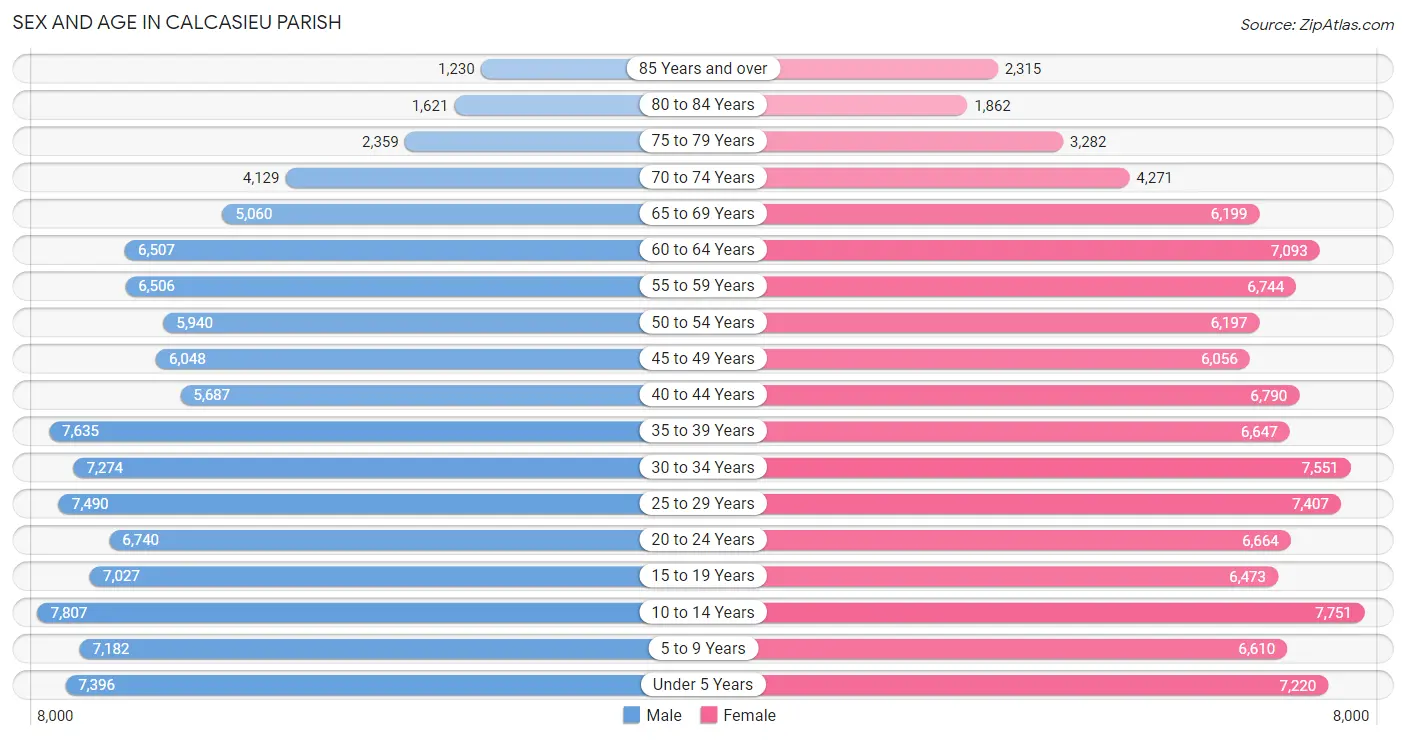
| Age Bracket | Male | Female |
| Under 5 Years | 7,396 (7.1%) | 7,220 (6.7%) |
| 5 to 9 Years | 7,182 (6.9%) | 6,610 (6.2%) |
| 10 to 14 Years | 7,807 (7.5%) | 7,751 (7.2%) |
| 15 to 19 Years | 7,027 (6.8%) | 6,473 (6.0%) |
| 20 to 24 Years | 6,740 (6.5%) | 6,664 (6.2%) |
| 25 to 29 Years | 7,490 (7.2%) | 7,407 (6.9%) |
| 30 to 34 Years | 7,274 (7.0%) | 7,551 (7.0%) |
| 35 to 39 Years | 7,635 (7.4%) | 6,647 (6.2%) |
| 40 to 44 Years | 5,687 (5.5%) | 6,790 (6.3%) |
| 45 to 49 Years | 6,048 (5.8%) | 6,056 (5.7%) |
| 50 to 54 Years | 5,940 (5.7%) | 6,197 (5.8%) |
| 55 to 59 Years | 6,506 (6.3%) | 6,744 (6.3%) |
| 60 to 64 Years | 6,507 (6.3%) | 7,093 (6.6%) |
| 65 to 69 Years | 5,060 (4.9%) | 6,199 (5.8%) |
| 70 to 74 Years | 4,129 (4.0%) | 4,271 (4.0%) |
| 75 to 79 Years | 2,359 (2.3%) | 3,282 (3.1%) |
| 80 to 84 Years | 1,621 (1.6%) | 1,862 (1.7%) |
| 85 Years and over | 1,230 (1.2%) | 2,315 (2.2%) |
| Total | 103,638 (100.0%) | 107,132 (100.0%) |
Families and Households in Calcasieu Parish
Median Family Size in Calcasieu Parish
The median family size in Calcasieu Parish is 3.39 persons per family, with single female/mother families (10,929 | 21.7%) accounting for the largest median family size of 3.62 persons per family. On the other hand, single male/father families (3,024 | 6.0%) represent the smallest median family size with 3.29 persons per family.
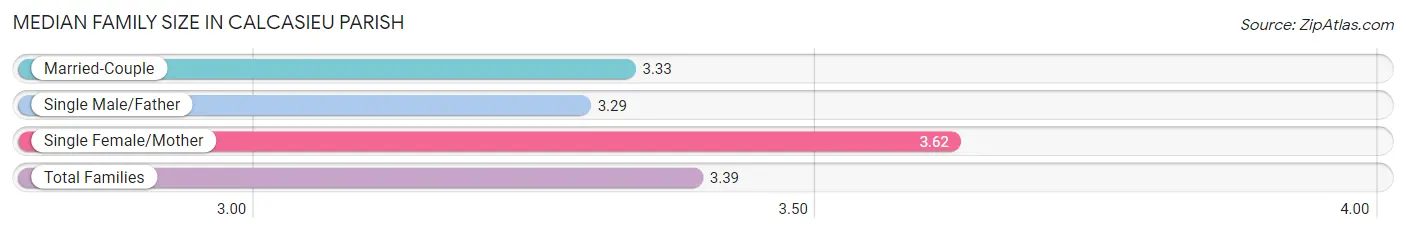
| Family Type | # Families | Family Size |
| Married-Couple | 36,296 (72.2%) | 3.33 |
| Single Male/Father | 3,024 (6.0%) | 3.29 |
| Single Female/Mother | 10,929 (21.7%) | 3.62 |
| Total Families | 50,249 (100.0%) | 3.39 |
Median Household Size in Calcasieu Parish
The median household size in Calcasieu Parish is 2.70 persons per household, with single female/mother households (10,929 | 14.2%) accounting for the largest median household size of 3.76 persons per household. non-family households (26,604 | 34.6%) represent the smallest median household size with 1.26 persons per household.
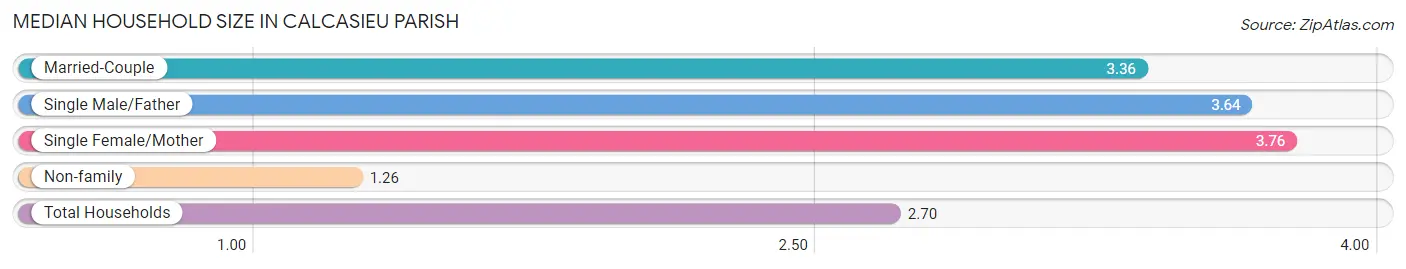
| Household Type | # Households | Household Size |
| Married-Couple | 36,296 (47.2%) | 3.36 |
| Single Male/Father | 3,024 (3.9%) | 3.64 |
| Single Female/Mother | 10,929 (14.2%) | 3.76 |
| Non-family | 26,604 (34.6%) | 1.26 |
| Total Households | 76,853 (100.0%) | 2.70 |
Household Size by Marriage Status in Calcasieu Parish
Out of a total of 76,853 households in Calcasieu Parish, 50,249 (65.4%) are family households, while 26,604 (34.6%) are nonfamily households. The most numerous type of family households are 2-person households, comprising 22,215, and the most common type of nonfamily households are 1-person households, comprising 21,191.
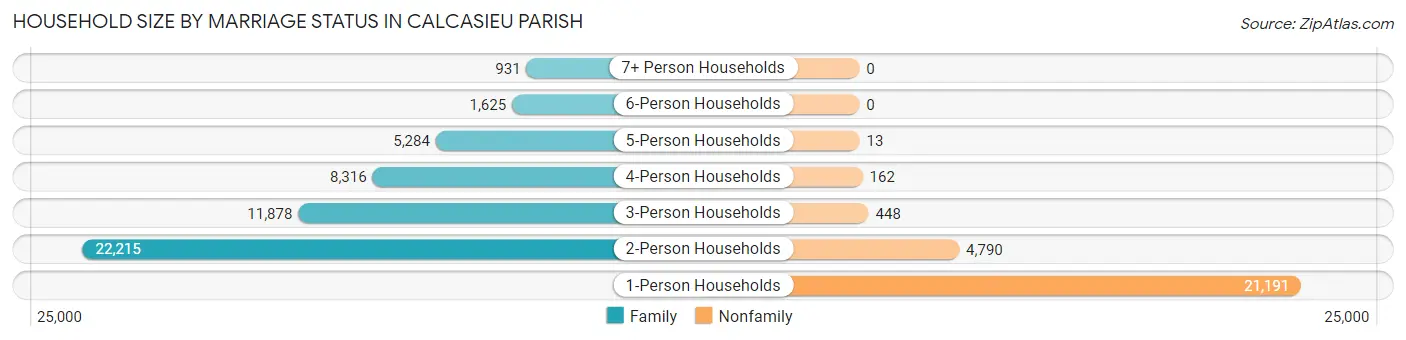
| Household Size | Family Households | Nonfamily Households |
| 1-Person Households | - | 21,191 (27.6%) |
| 2-Person Households | 22,215 (28.9%) | 4,790 (6.2%) |
| 3-Person Households | 11,878 (15.5%) | 448 (0.6%) |
| 4-Person Households | 8,316 (10.8%) | 162 (0.2%) |
| 5-Person Households | 5,284 (6.9%) | 13 (0.0%) |
| 6-Person Households | 1,625 (2.1%) | 0 (0.0%) |
| 7+ Person Households | 931 (1.2%) | 0 (0.0%) |
| Total | 50,249 (65.4%) | 26,604 (34.6%) |
Female Fertility in Calcasieu Parish
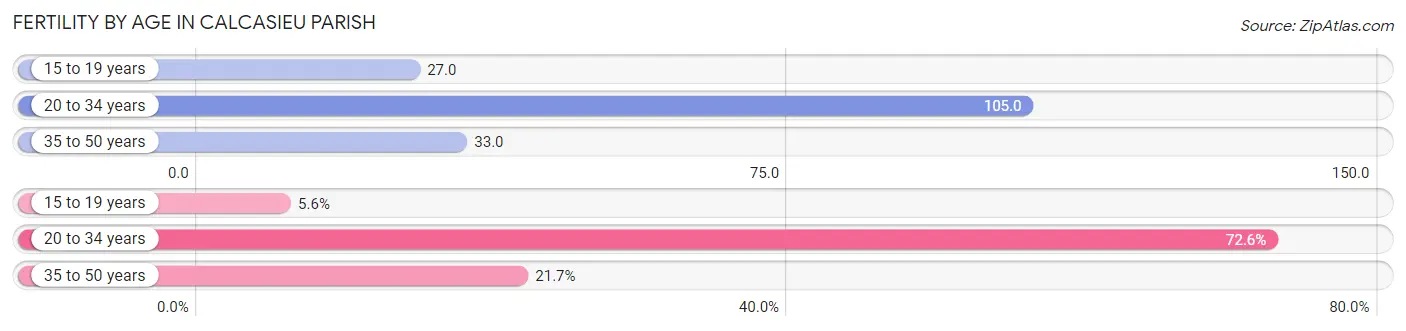
Fertility by Age in Calcasieu Parish
Average fertility rate in Calcasieu Parish is 64.0 births per 1,000 women. Women in the age bracket of 20 to 34 years have the highest fertility rate with 105.0 births per 1,000 women. Women in the age bracket of 20 to 34 years acount for 72.6% of all women with births.
| Age Bracket | Women with Births | Births / 1,000 Women |
| 15 to 19 years | 177 (5.6%) | 27.0 |
| 20 to 34 years | 2,281 (72.6%) | 105.0 |
| 35 to 50 years | 683 (21.7%) | 33.0 |
| Total | 3,141 (100.0%) | 64.0 |
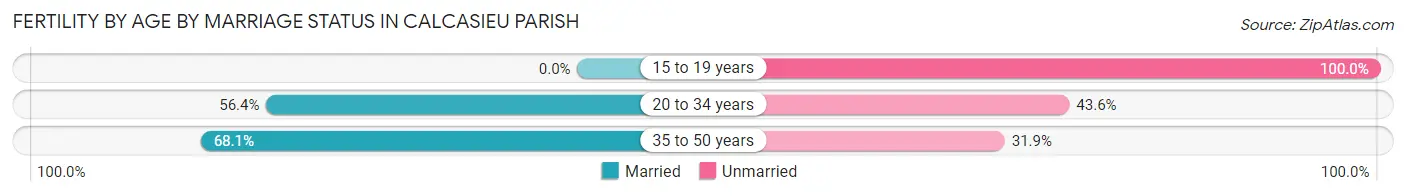
Fertility by Age by Marriage Status in Calcasieu Parish
55.7% of women with births (3,141) in Calcasieu Parish are married. The highest percentage of unmarried women with births falls into 15 to 19 years age bracket with 100.0% of them unmarried at the time of birth, while the lowest percentage of unmarried women with births belong to 35 to 50 years age bracket with 31.9% of them unmarried.
| Age Bracket | Married | Unmarried |
| 15 to 19 years | 0 (0.0%) | 177 (100.0%) |
| 20 to 34 years | 1,286 (56.4%) | 995 (43.6%) |
| 35 to 50 years | 465 (68.1%) | 218 (31.9%) |
| Total | 1,750 (55.7%) | 1,391 (44.3%) |
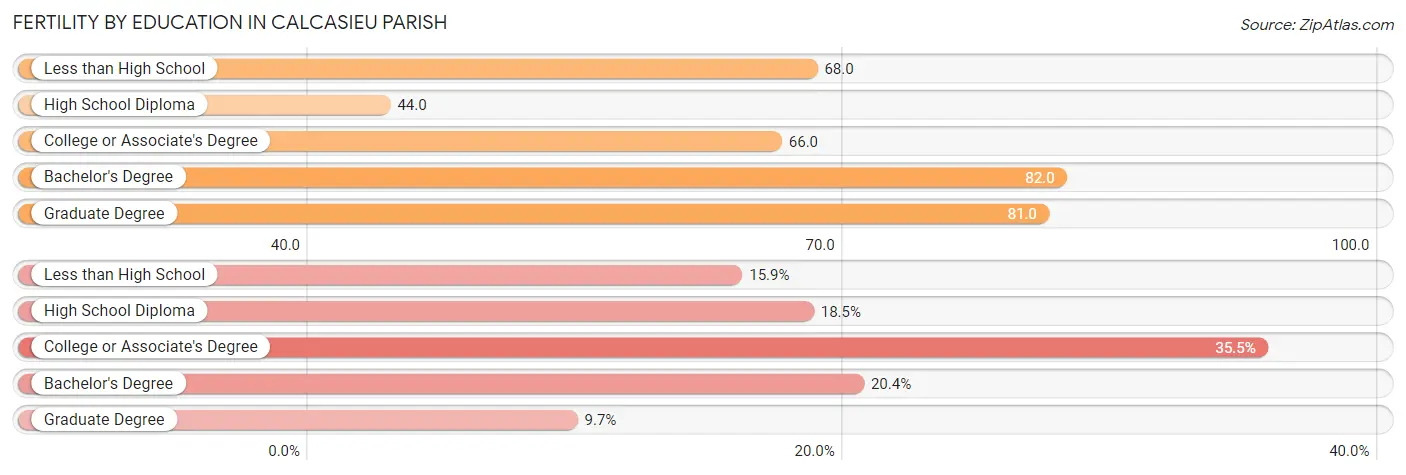
Fertility by Education in Calcasieu Parish
Average fertility rate in Calcasieu Parish is 64.0 births per 1,000 women. Women with the education attainment of bachelor's degree have the highest fertility rate of 82.0 births per 1,000 women, while women with the education attainment of high school diploma have the lowest fertility at 44.0 births per 1,000 women. Women with the education attainment of college or associate's degree represent 35.5% of all women with births.
| Educational Attainment | Women with Births | Births / 1,000 Women |
| Less than High School | 498 (15.9%) | 68.0 |
| High School Diploma | 582 (18.5%) | 44.0 |
| College or Associate's Degree | 1,116 (35.5%) | 66.0 |
| Bachelor's Degree | 641 (20.4%) | 82.0 |
| Graduate Degree | 304 (9.7%) | 81.0 |
| Total | 3,141 (100.0%) | 64.0 |
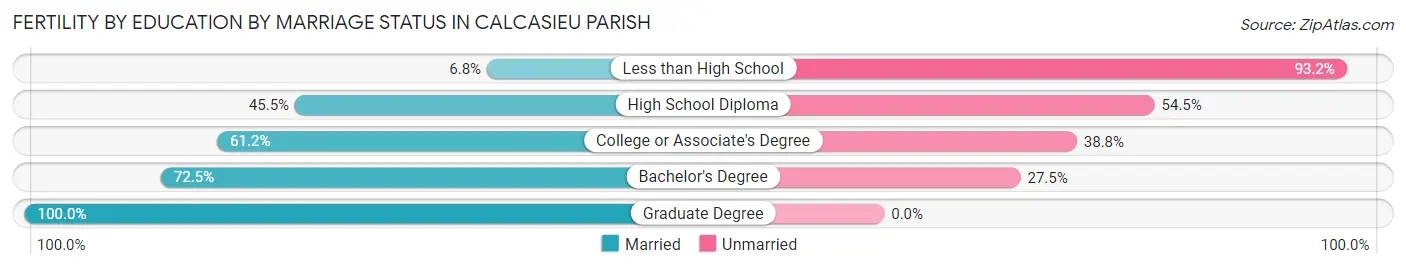
Fertility by Education by Marriage Status in Calcasieu Parish
44.3% of women with births in Calcasieu Parish are unmarried. Women with the educational attainment of graduate degree are most likely to be married with 100.0% of them married at childbirth, while women with the educational attainment of less than high school are least likely to be married with 93.2% of them unmarried at childbirth.
| Educational Attainment | Married | Unmarried |
| Less than High School | 34 (6.8%) | 464 (93.2%) |
| High School Diploma | 265 (45.5%) | 317 (54.5%) |
| College or Associate's Degree | 683 (61.2%) | 433 (38.8%) |
| Bachelor's Degree | 465 (72.5%) | 176 (27.5%) |
| Graduate Degree | 304 (100.0%) | 0 (0.0%) |
| Total | 1,750 (55.7%) | 1,391 (44.3%) |
Income in Calcasieu Parish
Income Overview in Calcasieu Parish
Per Capita Income in Calcasieu Parish is $33,486, while median incomes of families and households are $79,749 and $64,370 respectively.
| Characteristic | Number | Measure |
| Per Capita Income | 210,770 | $33,486 |
| Median Family Income | 50,249 | $79,749 |
| Mean Family Income | 50,249 | $104,639 |
| Median Household Income | 76,853 | $64,370 |
| Mean Household Income | 76,853 | $88,202 |
| Income Deficit | 50,249 | $10,362 |
| Wage / Income Gap (%) | 210,770 | 47.00% |
| Wage / Income Gap ($) | 210,770 | 53.00¢ per $1 |
| Gini / Inequality Index | 210,770 | 0.47 |
Earnings by Sex in Calcasieu Parish
Average Earnings in Calcasieu Parish are $37,015, $50,814 for men and $26,929 for women, a difference of 47.0%.
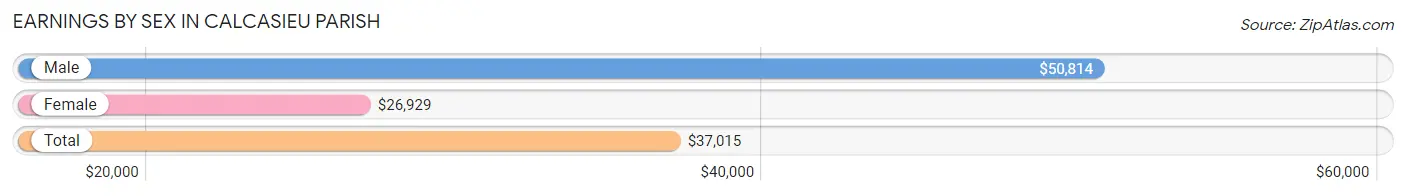
| Sex | Number | Average Earnings |
| Male | 53,355 (52.9%) | $50,814 |
| Female | 47,580 (47.1%) | $26,929 |
| Total | 100,935 (100.0%) | $37,015 |
Earnings by Sex by Income Bracket in Calcasieu Parish
The most common earnings brackets in Calcasieu Parish are $100,000+ for men (12,457 | 23.4%) and $25,000 to $29,999 for women (4,012 | 8.4%).
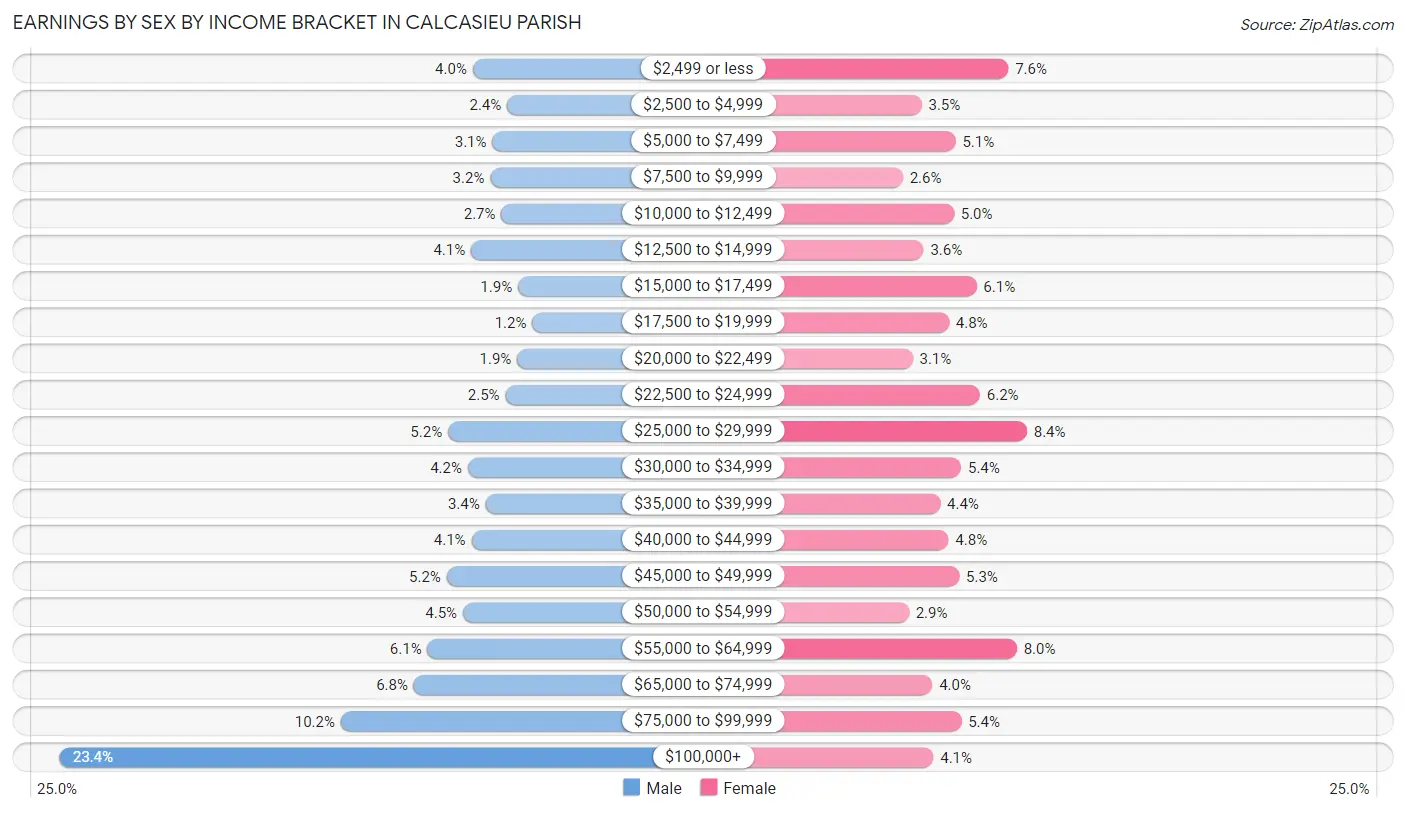
| Income | Male | Female |
| $2,499 or less | 2,140 (4.0%) | 3,595 (7.6%) |
| $2,500 to $4,999 | 1,282 (2.4%) | 1,665 (3.5%) |
| $5,000 to $7,499 | 1,648 (3.1%) | 2,423 (5.1%) |
| $7,500 to $9,999 | 1,703 (3.2%) | 1,247 (2.6%) |
| $10,000 to $12,499 | 1,426 (2.7%) | 2,386 (5.0%) |
| $12,500 to $14,999 | 2,180 (4.1%) | 1,709 (3.6%) |
| $15,000 to $17,499 | 1,007 (1.9%) | 2,890 (6.1%) |
| $17,500 to $19,999 | 652 (1.2%) | 2,276 (4.8%) |
| $20,000 to $22,499 | 1,031 (1.9%) | 1,464 (3.1%) |
| $22,500 to $24,999 | 1,325 (2.5%) | 2,965 (6.2%) |
| $25,000 to $29,999 | 2,756 (5.2%) | 4,012 (8.4%) |
| $30,000 to $34,999 | 2,263 (4.2%) | 2,547 (5.3%) |
| $35,000 to $39,999 | 1,819 (3.4%) | 2,081 (4.4%) |
| $40,000 to $44,999 | 2,174 (4.1%) | 2,266 (4.8%) |
| $45,000 to $49,999 | 2,791 (5.2%) | 2,503 (5.3%) |
| $50,000 to $54,999 | 2,385 (4.5%) | 1,378 (2.9%) |
| $55,000 to $64,999 | 3,270 (6.1%) | 3,789 (8.0%) |
| $65,000 to $74,999 | 3,610 (6.8%) | 1,905 (4.0%) |
| $75,000 to $99,999 | 5,436 (10.2%) | 2,552 (5.4%) |
| $100,000+ | 12,457 (23.4%) | 1,927 (4.1%) |
| Total | 53,355 (100.0%) | 47,580 (100.0%) |
Earnings by Sex by Educational Attainment in Calcasieu Parish
Average earnings in Calcasieu Parish are $58,180 for men and $30,120 for women, a difference of 48.2%. Men with an educational attainment of bachelor's degree enjoy the highest average annual earnings of $91,813, while those with less than high school education earn the least with $34,508. Women with an educational attainment of graduate degree earn the most with the average annual earnings of $57,831, while those with less than high school education have the smallest earnings of $19,920.
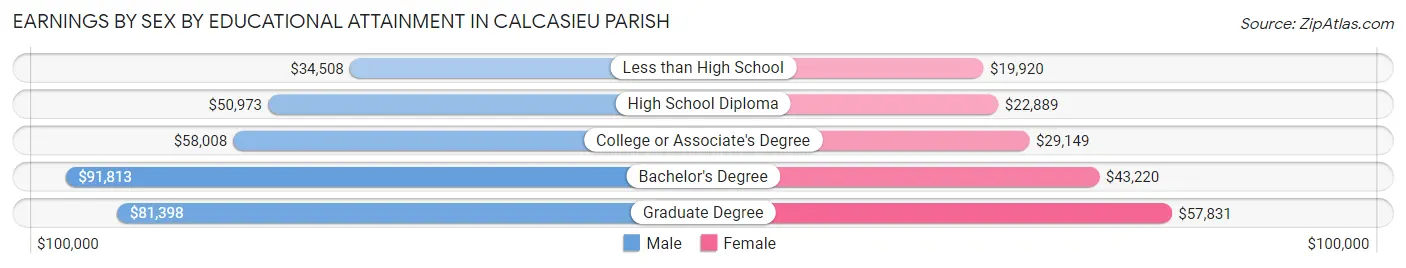
| Educational Attainment | Male Income | Female Income |
| Less than High School | $34,508 | $19,920 |
| High School Diploma | $50,973 | $22,889 |
| College or Associate's Degree | $58,008 | $29,149 |
| Bachelor's Degree | $91,813 | $43,220 |
| Graduate Degree | $81,398 | $57,831 |
| Total | $58,180 | $30,120 |
Family Income in Calcasieu Parish
Family Income Brackets in Calcasieu Parish
According to the Calcasieu Parish family income data, there are 10,201 families falling into the $100,000 to $149,999 income range, which is the most common income bracket and makes up 20.3% of all families. Conversely, the $10,000 to $14,999 income bracket is the least frequent group with only 1,206 families (2.4%) belonging to this category.
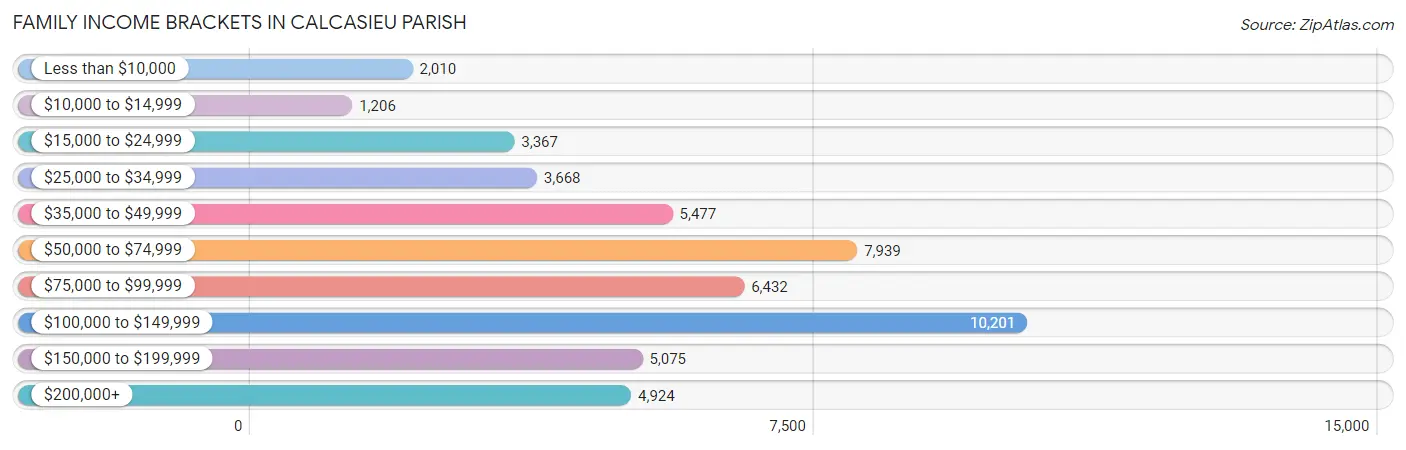
| Income Bracket | # Families | % Families |
| Less than $10,000 | 2,010 | 4.0% |
| $10,000 to $14,999 | 1,206 | 2.4% |
| $15,000 to $24,999 | 3,367 | 6.7% |
| $25,000 to $34,999 | 3,668 | 7.3% |
| $35,000 to $49,999 | 5,477 | 10.9% |
| $50,000 to $74,999 | 7,939 | 15.8% |
| $75,000 to $99,999 | 6,432 | 12.8% |
| $100,000 to $149,999 | 10,201 | 20.3% |
| $150,000 to $199,999 | 5,075 | 10.1% |
| $200,000+ | 4,924 | 9.8% |
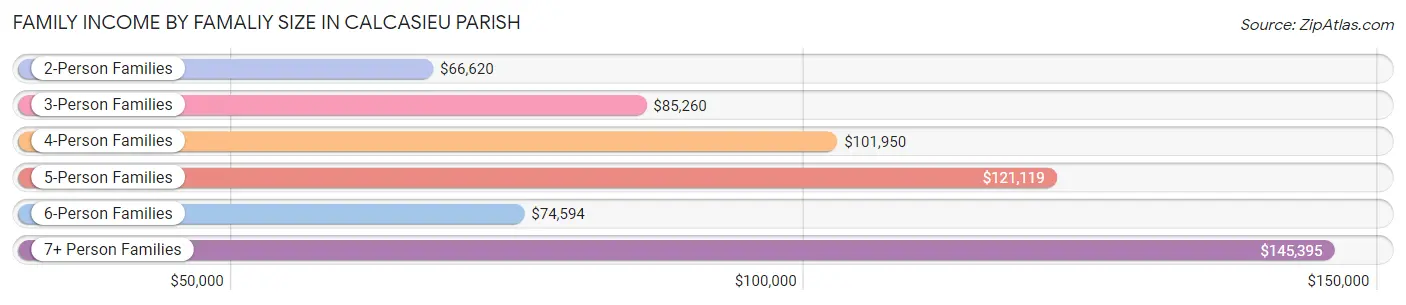
Family Income by Famaliy Size in Calcasieu Parish
7+ person families (740 | 1.5%) account for the highest median family income in Calcasieu Parish with $145,395 per family, while 2-person families (23,258 | 46.3%) have the highest median income of $33,310 per family member.
| Income Bracket | # Families | Median Income |
| 2-Person Families | 23,258 (46.3%) | $66,620 |
| 3-Person Families | 11,786 (23.5%) | $85,260 |
| 4-Person Families | 7,920 (15.8%) | $101,950 |
| 5-Person Families | 4,896 (9.7%) | $121,119 |
| 6-Person Families | 1,649 (3.3%) | $74,594 |
| 7+ Person Families | 740 (1.5%) | $145,395 |
| Total | 50,249 (100.0%) | $79,749 |
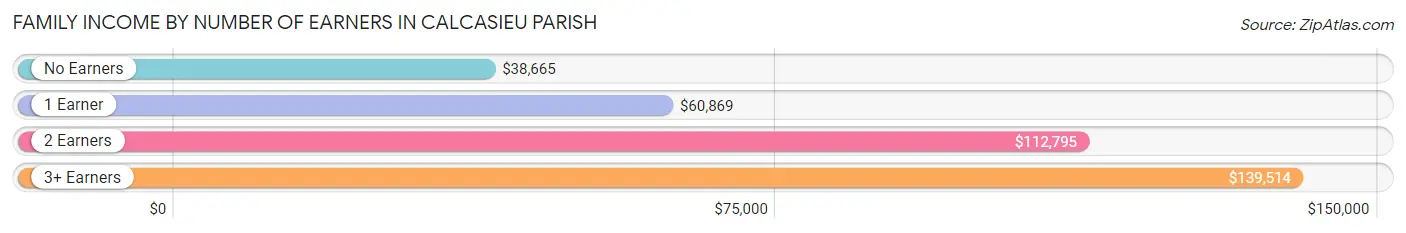
Family Income by Number of Earners in Calcasieu Parish
The median family income in Calcasieu Parish is $79,749, with families comprising 3+ earners (4,493) having the highest median family income of $139,514, while families with no earners (9,205) have the lowest median family income of $38,665, accounting for 8.9% and 18.3% of families, respectively.
| Number of Earners | # Families | Median Income |
| No Earners | 9,205 (18.3%) | $38,665 |
| 1 Earner | 17,834 (35.5%) | $60,869 |
| 2 Earners | 18,717 (37.2%) | $112,795 |
| 3+ Earners | 4,493 (8.9%) | $139,514 |
| Total | 50,249 (100.0%) | $79,749 |
Household Income in Calcasieu Parish
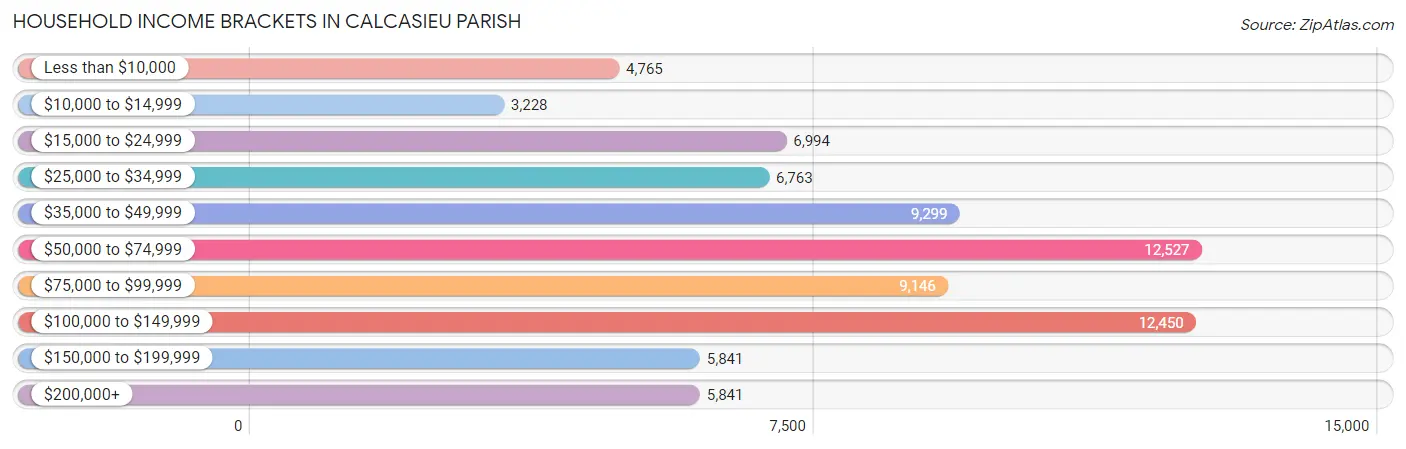
Household Income Brackets in Calcasieu Parish
With 12,527 households falling in the category, the $50,000 to $74,999 income range is the most frequent in Calcasieu Parish, accounting for 16.3% of all households. In contrast, only 3,228 households (4.2%) fall into the $10,000 to $14,999 income bracket, making it the least populous group.
| Income Bracket | # Households | % Households |
| Less than $10,000 | 4,765 | 6.2% |
| $10,000 to $14,999 | 3,228 | 4.2% |
| $15,000 to $24,999 | 6,994 | 9.1% |
| $25,000 to $34,999 | 6,763 | 8.8% |
| $35,000 to $49,999 | 9,299 | 12.1% |
| $50,000 to $74,999 | 12,527 | 16.3% |
| $75,000 to $99,999 | 9,146 | 11.9% |
| $100,000 to $149,999 | 12,450 | 16.2% |
| $150,000 to $199,999 | 5,841 | 7.6% |
| $200,000+ | 5,841 | 7.6% |
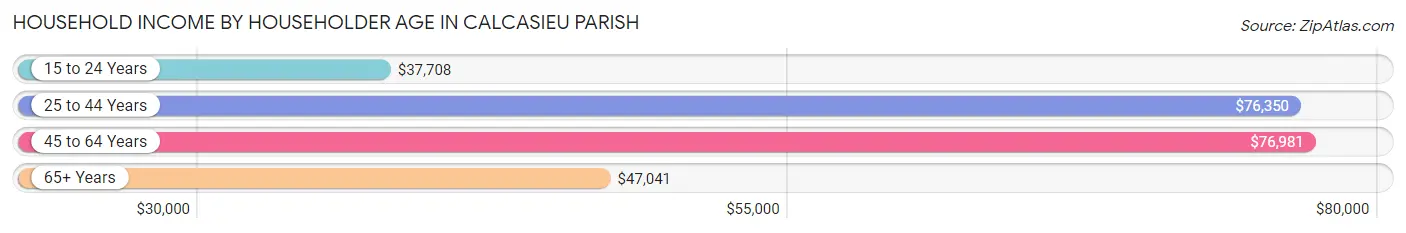
Household Income by Householder Age in Calcasieu Parish
The median household income in Calcasieu Parish is $64,370, with the highest median household income of $76,981 found in the 45 to 64 years age bracket for the primary householder. A total of 28,221 households (36.7%) fall into this category. Meanwhile, the 15 to 24 years age bracket for the primary householder has the lowest median household income of $37,708, with 2,904 households (3.8%) in this group.
| Income Bracket | # Households | Median Income |
| 15 to 24 Years | 2,904 (3.8%) | $37,708 |
| 25 to 44 Years | 24,910 (32.4%) | $76,350 |
| 45 to 64 Years | 28,221 (36.7%) | $76,981 |
| 65+ Years | 20,818 (27.1%) | $47,041 |
| Total | 76,853 (100.0%) | $64,370 |
Poverty in Calcasieu Parish
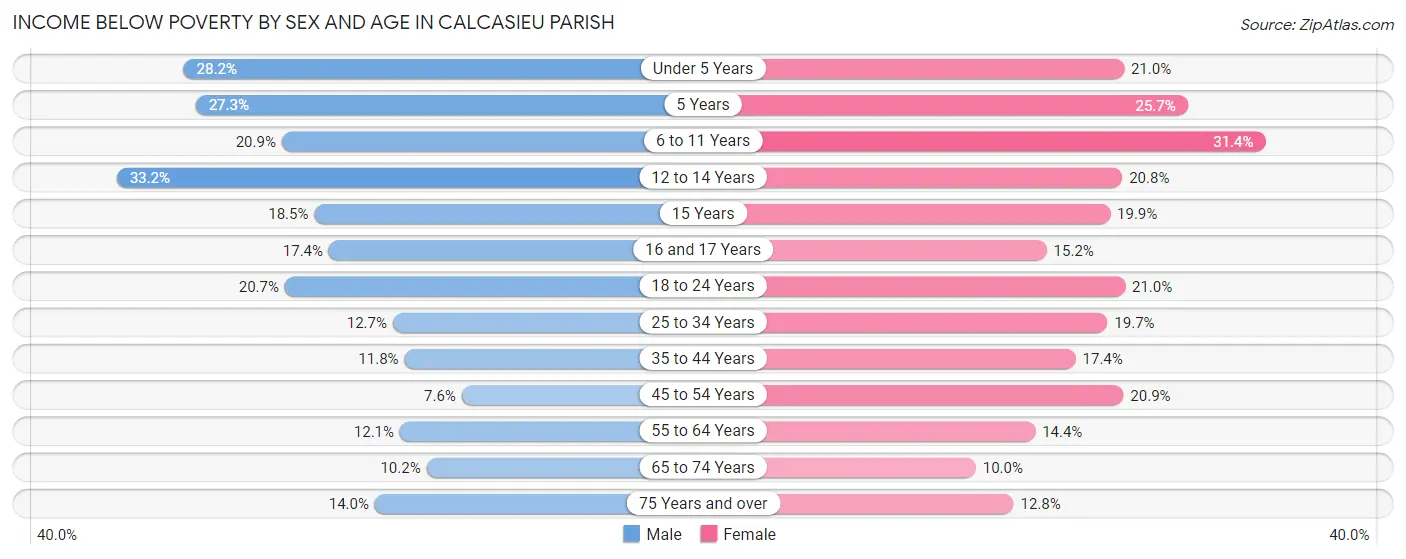
Income Below Poverty by Sex and Age in Calcasieu Parish
With 15.6% poverty level for males and 18.6% for females among the residents of Calcasieu Parish, 12 to 14 year old males and 6 to 11 year old females are the most vulnerable to poverty, with 1,615 males (33.2%) and 2,761 females (31.4%) in their respective age groups living below the poverty level.
| Age Bracket | Male | Female |
| Under 5 Years | 2,057 (28.2%) | 1,496 (20.9%) |
| 5 Years | 301 (27.3%) | 317 (25.7%) |
| 6 to 11 Years | 1,859 (20.9%) | 2,761 (31.4%) |
| 12 to 14 Years | 1,615 (33.2%) | 876 (20.8%) |
| 15 Years | 370 (18.5%) | 285 (19.9%) |
| 16 and 17 Years | 412 (17.4%) | 415 (15.2%) |
| 18 to 24 Years | 1,816 (20.7%) | 1,785 (21.0%) |
| 25 to 34 Years | 1,825 (12.7%) | 2,936 (19.7%) |
| 35 to 44 Years | 1,547 (11.8%) | 2,326 (17.4%) |
| 45 to 54 Years | 897 (7.5%) | 2,559 (20.9%) |
| 55 to 64 Years | 1,560 (12.1%) | 1,982 (14.4%) |
| 65 to 74 Years | 927 (10.2%) | 1,027 (10.0%) |
| 75 Years and over | 715 (14.0%) | 914 (12.8%) |
| Total | 15,901 (15.6%) | 19,679 (18.6%) |
Income Above Poverty by Sex and Age in Calcasieu Parish
According to the poverty statistics in Calcasieu Parish, males aged 45 to 54 years and females aged 65 to 74 years are the age groups that are most secure financially, with 92.4% of males and 90.0% of females in these age groups living above the poverty line.
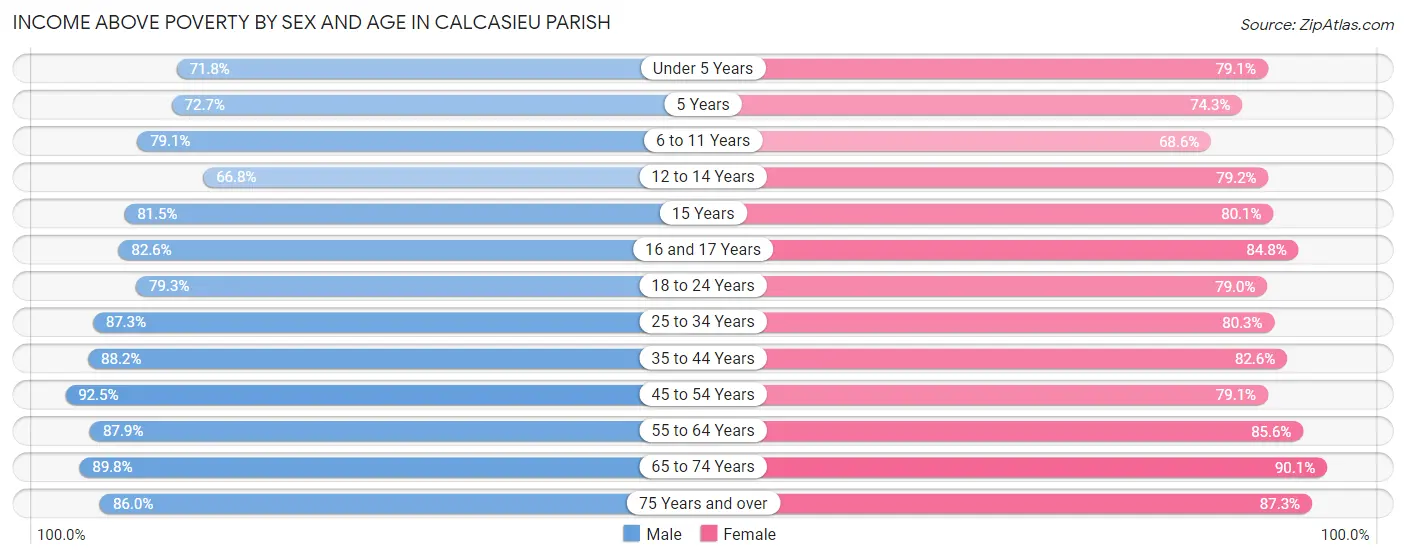
| Age Bracket | Male | Female |
| Under 5 Years | 5,240 (71.8%) | 5,644 (79.0%) |
| 5 Years | 802 (72.7%) | 918 (74.3%) |
| 6 to 11 Years | 7,031 (79.1%) | 6,021 (68.6%) |
| 12 to 14 Years | 3,255 (66.8%) | 3,332 (79.2%) |
| 15 Years | 1,631 (81.5%) | 1,146 (80.1%) |
| 16 and 17 Years | 1,954 (82.6%) | 2,313 (84.8%) |
| 18 to 24 Years | 6,964 (79.3%) | 6,701 (79.0%) |
| 25 to 34 Years | 12,585 (87.3%) | 11,956 (80.3%) |
| 35 to 44 Years | 11,561 (88.2%) | 11,075 (82.6%) |
| 45 to 54 Years | 10,988 (92.4%) | 9,678 (79.1%) |
| 55 to 64 Years | 11,290 (87.9%) | 11,824 (85.6%) |
| 65 to 74 Years | 8,194 (89.8%) | 9,295 (90.0%) |
| 75 Years and over | 4,392 (86.0%) | 6,254 (87.3%) |
| Total | 85,887 (84.4%) | 86,157 (81.4%) |
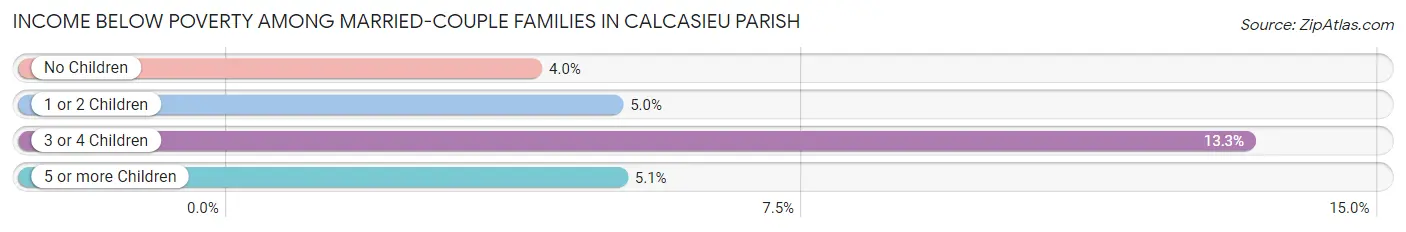
Income Below Poverty Among Married-Couple Families in Calcasieu Parish
The poverty statistics for married-couple families in Calcasieu Parish show that 5.3% or 1,908 of the total 36,296 families live below the poverty line. Families with 3 or 4 children have the highest poverty rate of 13.3%, comprising of 496 families. On the other hand, families with no children have the lowest poverty rate of 4.0%, which includes 846 families.
| Children | Above Poverty | Below Poverty |
| No Children | 20,480 (96.0%) | 846 (4.0%) |
| 1 or 2 Children | 10,299 (95.0%) | 546 (5.0%) |
| 3 or 4 Children | 3,236 (86.7%) | 496 (13.3%) |
| 5 or more Children | 373 (94.9%) | 20 (5.1%) |
| Total | 34,388 (94.7%) | 1,908 (5.3%) |
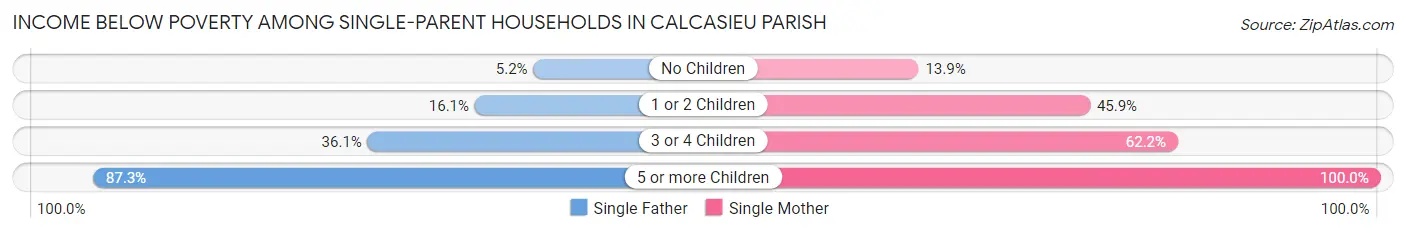
Income Below Poverty Among Single-Parent Households in Calcasieu Parish
According to the poverty data in Calcasieu Parish, 15.3% or 463 single-father households and 35.3% or 3,858 single-mother households are living below the poverty line. Among single-father households, those with 5 or more children have the highest poverty rate, with 48 households (87.3%) experiencing poverty. Likewise, among single-mother households, those with 5 or more children have the highest poverty rate, with 46 households (100.0%) falling below the poverty line.
| Children | Single Father | Single Mother |
| No Children | 64 (5.2%) | 587 (13.9%) |
| 1 or 2 Children | 225 (16.1%) | 2,592 (45.9%) |
| 3 or 4 Children | 126 (36.1%) | 633 (62.2%) |
| 5 or more Children | 48 (87.3%) | 46 (100.0%) |
| Total | 463 (15.3%) | 3,858 (35.3%) |
Income Below Poverty Among Married-Couple vs Single-Parent Households in Calcasieu Parish
The poverty data for Calcasieu Parish shows that 1,908 of the married-couple family households (5.3%) and 4,321 of the single-parent households (31.0%) are living below the poverty level. Within the married-couple family households, those with 3 or 4 children have the highest poverty rate, with 496 households (13.3%) falling below the poverty line. Among the single-parent households, those with 5 or more children have the highest poverty rate, with 94 household (93.1%) living below poverty.
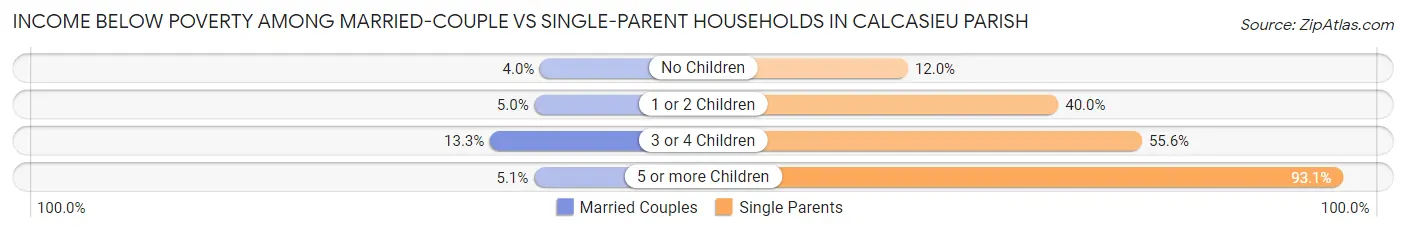
| Children | Married-Couple Families | Single-Parent Households |
| No Children | 846 (4.0%) | 651 (12.0%) |
| 1 or 2 Children | 546 (5.0%) | 2,817 (40.0%) |
| 3 or 4 Children | 496 (13.3%) | 759 (55.6%) |
| 5 or more Children | 20 (5.1%) | 94 (93.1%) |
| Total | 1,908 (5.3%) | 4,321 (31.0%) |
Employment Characteristics in Calcasieu Parish
Employment by Class of Employer in Calcasieu Parish
Among the 90,879 employed individuals in Calcasieu Parish, private company employees (65,147 | 71.7%), local government employees (7,906 | 8.7%), and not-for-profit organizations (5,387 | 5.9%) make up the most common classes of employment.
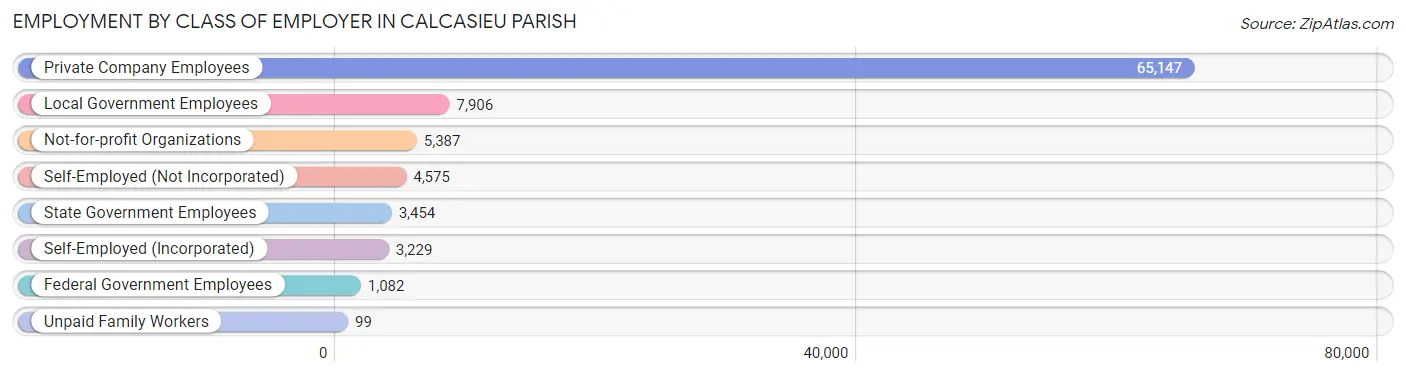
| Employer Class | # Employees | % Employees |
| Private Company Employees | 65,147 | 71.7% |
| Self-Employed (Incorporated) | 3,229 | 3.5% |
| Self-Employed (Not Incorporated) | 4,575 | 5.0% |
| Not-for-profit Organizations | 5,387 | 5.9% |
| Local Government Employees | 7,906 | 8.7% |
| State Government Employees | 3,454 | 3.8% |
| Federal Government Employees | 1,082 | 1.2% |
| Unpaid Family Workers | 99 | 0.1% |
| Total | 90,879 | 100.0% |
Employment Status by Age in Calcasieu Parish
According to the labor force statistics for Calcasieu Parish, out of the total population over 16 years of age (163,354), 59.7% or 97,522 individuals are in the labor force, with 5.6% or 5,461 of them unemployed. The age group with the highest labor force participation rate is 25 to 29 years, with 80.5% or 11,992 individuals in the labor force. Within the labor force, the 16 to 19 years age range has the highest percentage of unemployed individuals, with 17.1% or 720 of them being unemployed.
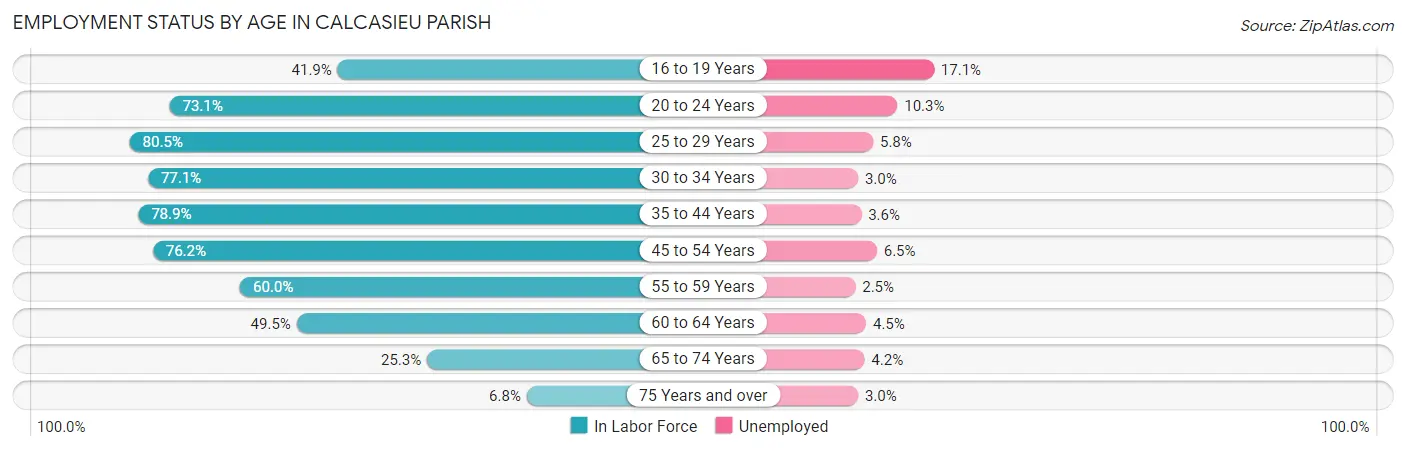
| Age Bracket | In Labor Force | Unemployed |
| 16 to 19 Years | 4,211 (41.9%) | 720 (17.1%) |
| 20 to 24 Years | 9,798 (73.1%) | 1,009 (10.3%) |
| 25 to 29 Years | 11,992 (80.5%) | 696 (5.8%) |
| 30 to 34 Years | 11,430 (77.1%) | 343 (3.0%) |
| 35 to 44 Years | 21,113 (78.9%) | 760 (3.6%) |
| 45 to 54 Years | 18,472 (76.2%) | 1,201 (6.5%) |
| 55 to 59 Years | 7,950 (60.0%) | 199 (2.5%) |
| 60 to 64 Years | 6,732 (49.5%) | 303 (4.5%) |
| 65 to 74 Years | 4,974 (25.3%) | 209 (4.2%) |
| 75 Years and over | 861 (6.8%) | 26 (3.0%) |
| Total | 97,522 (59.7%) | 5,461 (5.6%) |
Employment Status by Educational Attainment in Calcasieu Parish
According to labor force statistics for Calcasieu Parish, 72.2% of individuals (77,667) out of the total population between 25 and 64 years of age (107,572) are in the labor force, with 4.5% or 3,495 of them being unemployed. The group with the highest labor force participation rate are those with the educational attainment of bachelor's degree or higher, with 84.8% or 22,655 individuals in the labor force. Within the labor force, individuals with less than high school education have the highest percentage of unemployment, with 10.4% or 487 of them being unemployed.
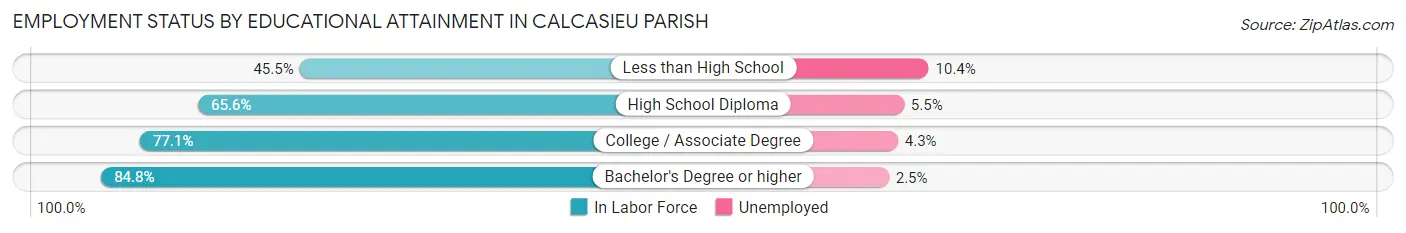
| Educational Attainment | In Labor Force | Unemployed |
| Less than High School | 4,679 (45.5%) | 1,069 (10.4%) |
| High School Diploma | 23,247 (65.6%) | 1,949 (5.5%) |
| College / Associate Degree | 27,090 (77.1%) | 1,511 (4.3%) |
| Bachelor's Degree or higher | 22,655 (84.8%) | 668 (2.5%) |
| Total | 77,667 (72.2%) | 4,841 (4.5%) |
Employment Occupations by Sex in Calcasieu Parish
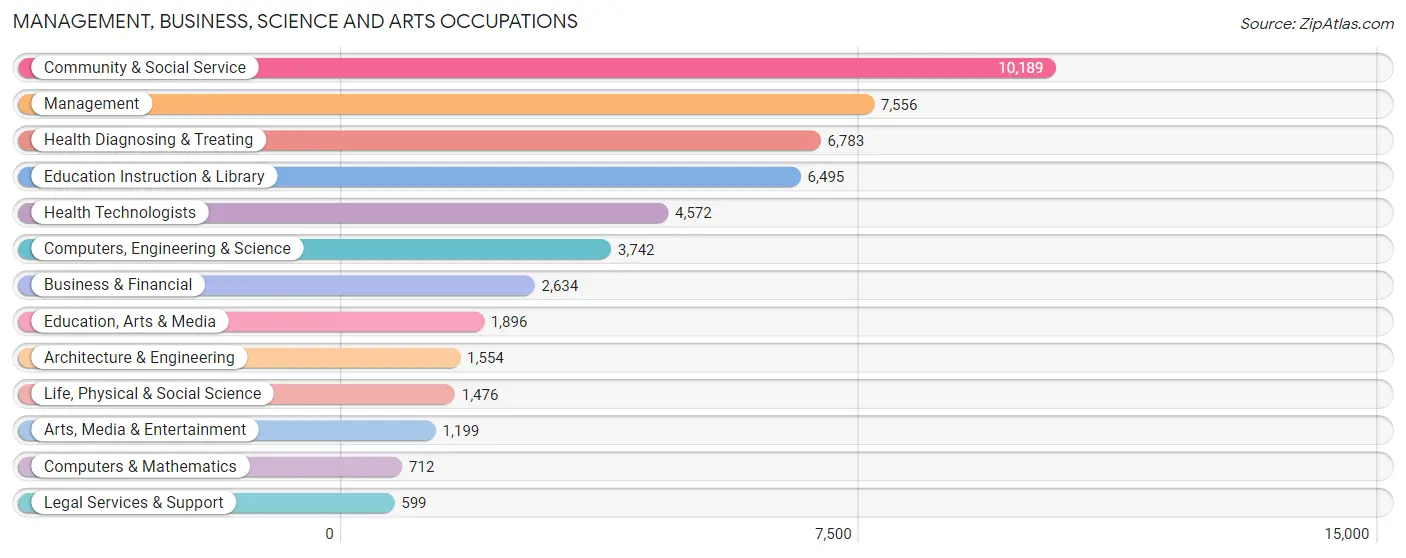
Management, Business, Science and Arts Occupations
The most common Management, Business, Science and Arts occupations in Calcasieu Parish are Community & Social Service (10,189 | 11.1%), Management (7,556 | 8.2%), Health Diagnosing & Treating (6,783 | 7.4%), Education Instruction & Library (6,495 | 7.1%), and Health Technologists (4,572 | 5.0%).
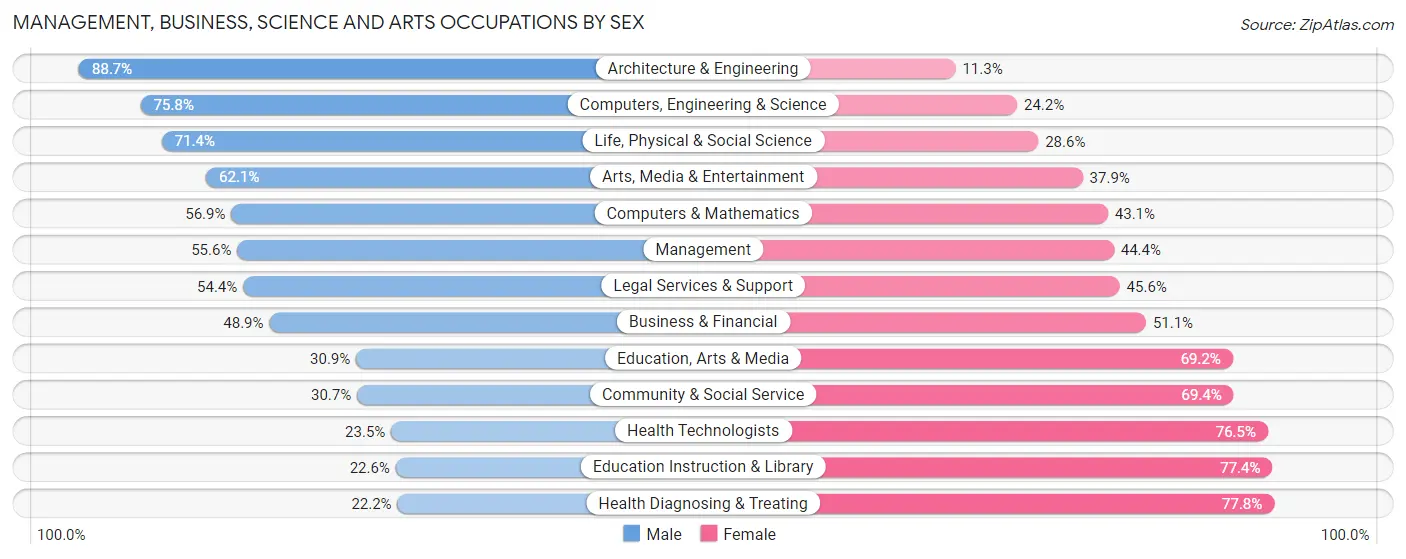
Management, Business, Science and Arts Occupations by Sex
Within the Management, Business, Science and Arts occupations in Calcasieu Parish, the most male-oriented occupations are Architecture & Engineering (88.7%), Computers, Engineering & Science (75.8%), and Life, Physical & Social Science (71.4%), while the most female-oriented occupations are Health Diagnosing & Treating (77.8%), Education Instruction & Library (77.4%), and Health Technologists (76.5%).
| Occupation | Male | Female |
| Management | 4,204 (55.6%) | 3,352 (44.4%) |
| Business & Financial | 1,289 (48.9%) | 1,345 (51.1%) |
| Computers, Engineering & Science | 2,837 (75.8%) | 905 (24.2%) |
| Computers & Mathematics | 405 (56.9%) | 307 (43.1%) |
| Architecture & Engineering | 1,378 (88.7%) | 176 (11.3%) |
| Life, Physical & Social Science | 1,054 (71.4%) | 422 (28.6%) |
| Community & Social Service | 3,123 (30.6%) | 7,066 (69.4%) |
| Education, Arts & Media | 585 (30.8%) | 1,311 (69.2%) |
| Legal Services & Support | 326 (54.4%) | 273 (45.6%) |
| Education Instruction & Library | 1,467 (22.6%) | 5,028 (77.4%) |
| Arts, Media & Entertainment | 745 (62.1%) | 454 (37.9%) |
| Health Diagnosing & Treating | 1,507 (22.2%) | 5,276 (77.8%) |
| Health Technologists | 1,076 (23.5%) | 3,496 (76.5%) |
| Total (Category) | 12,960 (41.9%) | 17,944 (58.1%) |
| Total (Overall) | 48,478 (52.7%) | 43,509 (47.3%) |
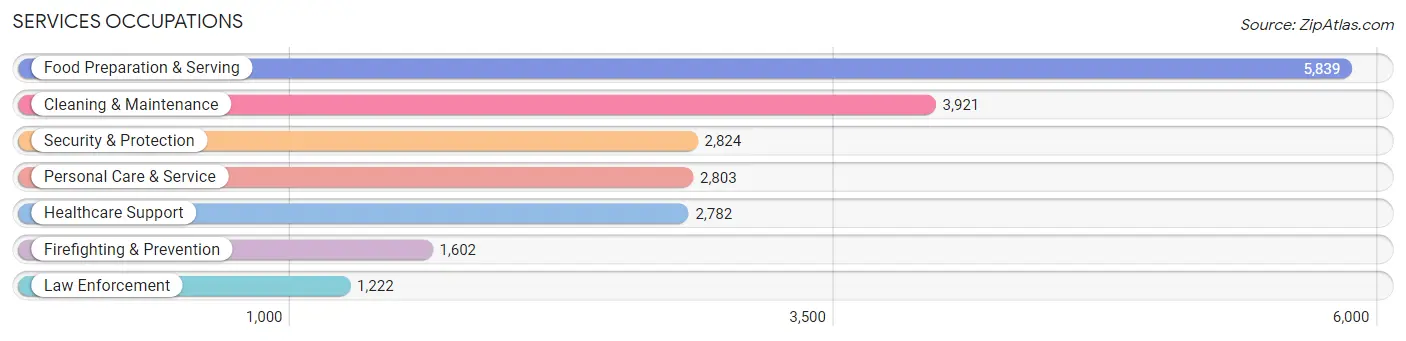
Services Occupations
The most common Services occupations in Calcasieu Parish are Food Preparation & Serving (5,839 | 6.4%), Cleaning & Maintenance (3,921 | 4.3%), Security & Protection (2,824 | 3.1%), Personal Care & Service (2,803 | 3.0%), and Healthcare Support (2,782 | 3.0%).
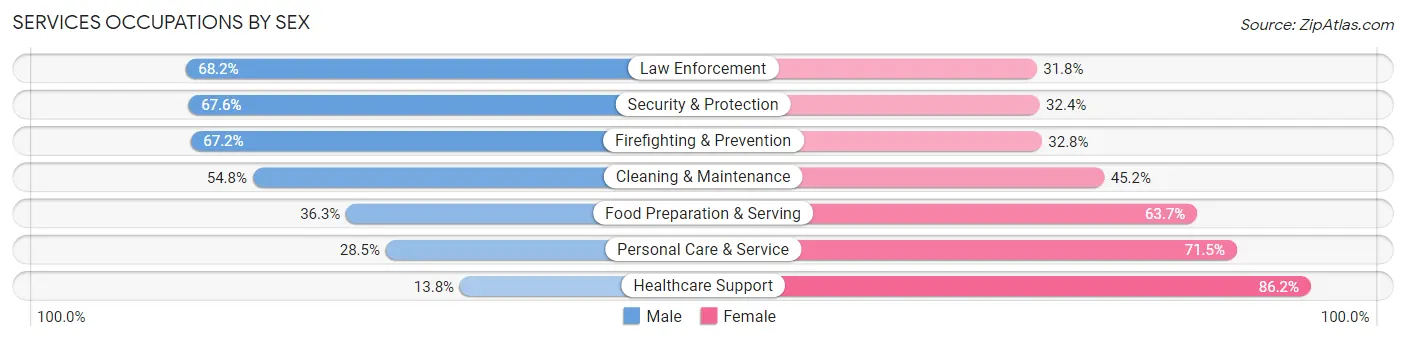
Services Occupations by Sex
Within the Services occupations in Calcasieu Parish, the most male-oriented occupations are Law Enforcement (68.2%), Security & Protection (67.6%), and Firefighting & Prevention (67.2%), while the most female-oriented occupations are Healthcare Support (86.2%), Personal Care & Service (71.5%), and Food Preparation & Serving (63.7%).
| Occupation | Male | Female |
| Healthcare Support | 384 (13.8%) | 2,398 (86.2%) |
| Security & Protection | 1,909 (67.6%) | 915 (32.4%) |
| Firefighting & Prevention | 1,076 (67.2%) | 526 (32.8%) |
| Law Enforcement | 833 (68.2%) | 389 (31.8%) |
| Food Preparation & Serving | 2,121 (36.3%) | 3,718 (63.7%) |
| Cleaning & Maintenance | 2,149 (54.8%) | 1,772 (45.2%) |
| Personal Care & Service | 798 (28.5%) | 2,005 (71.5%) |
| Total (Category) | 7,361 (40.5%) | 10,808 (59.5%) |
| Total (Overall) | 48,478 (52.7%) | 43,509 (47.3%) |
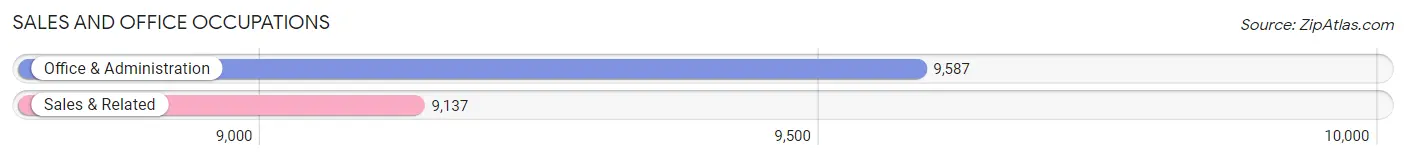
Sales and Office Occupations
The most common Sales and Office occupations in Calcasieu Parish are Office & Administration (9,587 | 10.4%), and Sales & Related (9,137 | 9.9%).
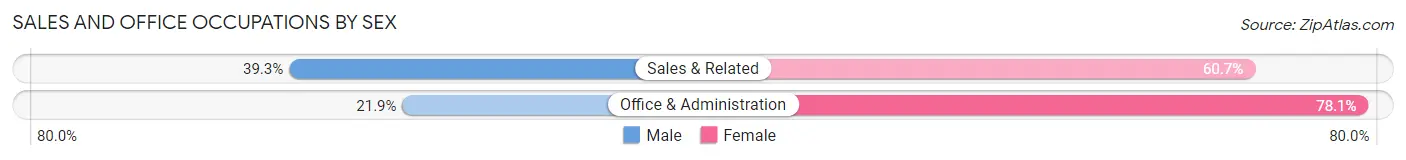
Sales and Office Occupations by Sex
| Occupation | Male | Female |
| Sales & Related | 3,592 (39.3%) | 5,545 (60.7%) |
| Office & Administration | 2,098 (21.9%) | 7,489 (78.1%) |
| Total (Category) | 5,690 (30.4%) | 13,034 (69.6%) |
| Total (Overall) | 48,478 (52.7%) | 43,509 (47.3%) |
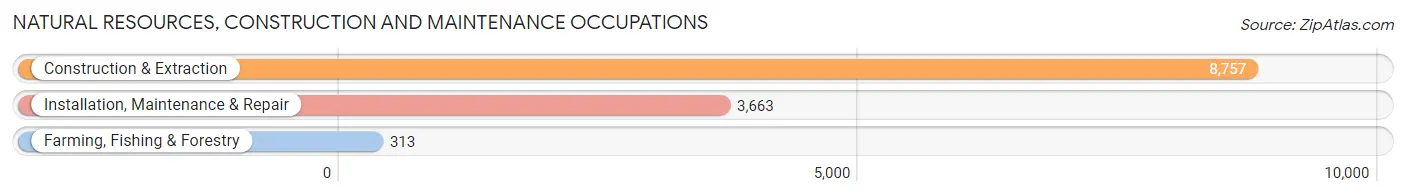
Natural Resources, Construction and Maintenance Occupations
The most common Natural Resources, Construction and Maintenance occupations in Calcasieu Parish are Construction & Extraction (8,757 | 9.5%), Installation, Maintenance & Repair (3,663 | 4.0%), and Farming, Fishing & Forestry (313 | 0.3%).
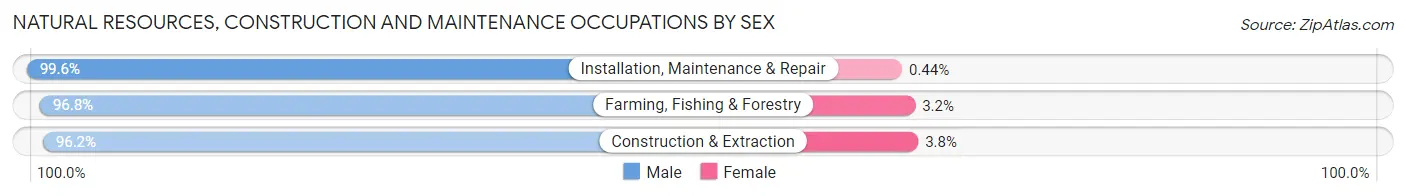
Natural Resources, Construction and Maintenance Occupations by Sex
| Occupation | Male | Female |
| Farming, Fishing & Forestry | 303 (96.8%) | 10 (3.2%) |
| Construction & Extraction | 8,423 (96.2%) | 334 (3.8%) |
| Installation, Maintenance & Repair | 3,647 (99.6%) | 16 (0.4%) |
| Total (Category) | 12,373 (97.2%) | 360 (2.8%) |
| Total (Overall) | 48,478 (52.7%) | 43,509 (47.3%) |
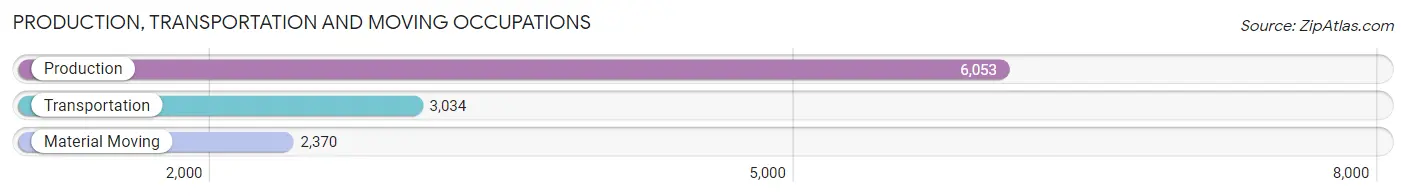
Production, Transportation and Moving Occupations
The most common Production, Transportation and Moving occupations in Calcasieu Parish are Production (6,053 | 6.6%), Transportation (3,034 | 3.3%), and Material Moving (2,370 | 2.6%).
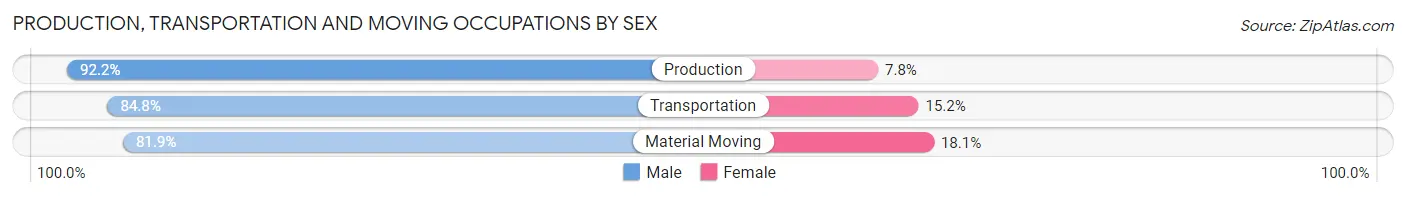
Production, Transportation and Moving Occupations by Sex
| Occupation | Male | Female |
| Production | 5,580 (92.2%) | 473 (7.8%) |
| Transportation | 2,572 (84.8%) | 462 (15.2%) |
| Material Moving | 1,942 (81.9%) | 428 (18.1%) |
| Total (Category) | 10,094 (88.1%) | 1,363 (11.9%) |
| Total (Overall) | 48,478 (52.7%) | 43,509 (47.3%) |
Employment Industries by Sex in Calcasieu Parish
Employment Industries in Calcasieu Parish
The major employment industries in Calcasieu Parish include Health Care & Social Assistance (12,695 | 13.8%), Construction (10,865 | 11.8%), Retail Trade (10,491 | 11.4%), Manufacturing (9,257 | 10.1%), and Educational Services (8,914 | 9.7%).

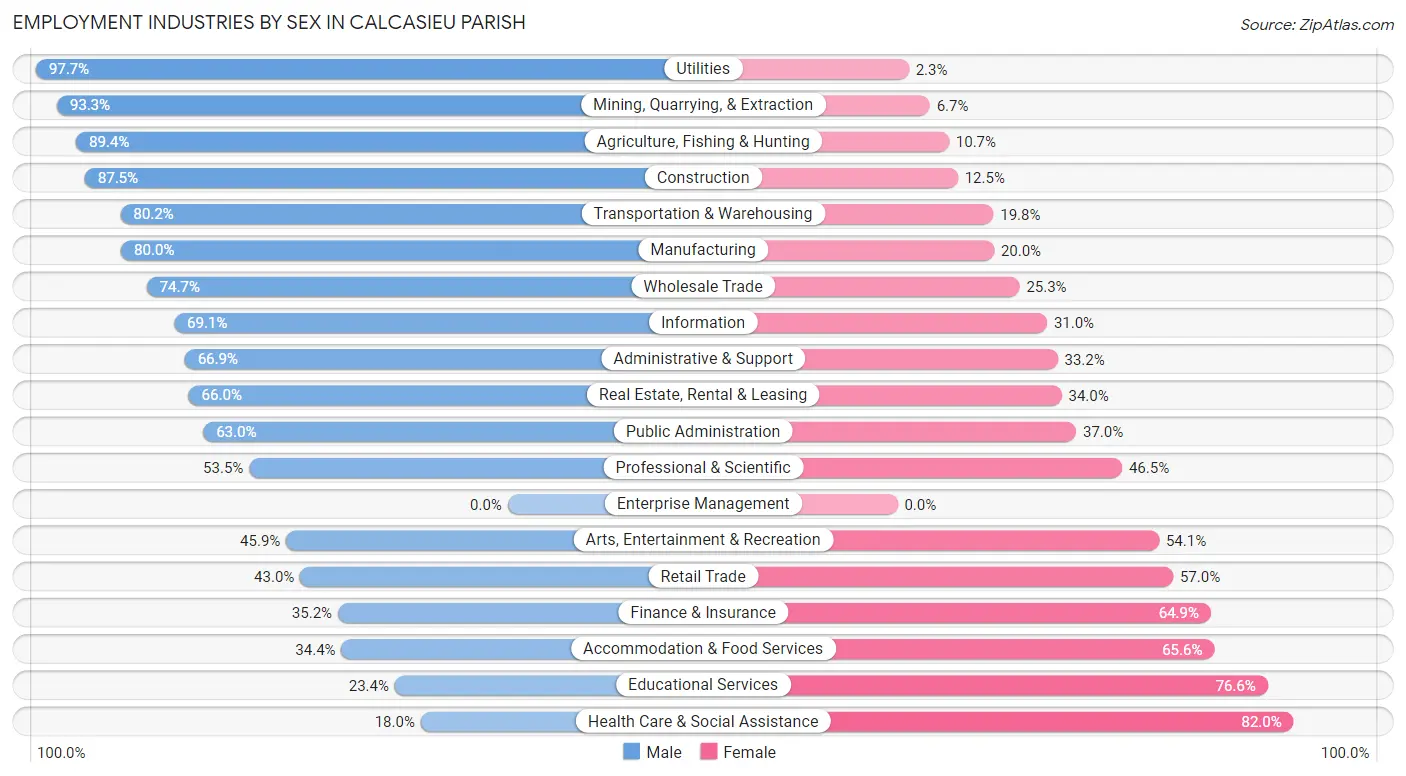
Employment Industries by Sex in Calcasieu Parish
The Calcasieu Parish industries that see more men than women are Utilities (97.7%), Mining, Quarrying, & Extraction (93.3%), and Agriculture, Fishing & Hunting (89.3%), whereas the industries that tend to have a higher number of women are Health Care & Social Assistance (82.0%), Educational Services (76.6%), and Accommodation & Food Services (65.6%).
| Industry | Male | Female |
| Agriculture, Fishing & Hunting | 470 (89.3%) | 56 (10.6%) |
| Mining, Quarrying, & Extraction | 1,255 (93.3%) | 90 (6.7%) |
| Construction | 9,509 (87.5%) | 1,356 (12.5%) |
| Manufacturing | 7,407 (80.0%) | 1,850 (20.0%) |
| Wholesale Trade | 1,204 (74.7%) | 407 (25.3%) |
| Retail Trade | 4,507 (43.0%) | 5,984 (57.0%) |
| Transportation & Warehousing | 2,929 (80.2%) | 725 (19.8%) |
| Utilities | 1,001 (97.7%) | 24 (2.3%) |
| Information | 754 (69.1%) | 338 (30.9%) |
| Finance & Insurance | 1,079 (35.1%) | 1,991 (64.8%) |
| Real Estate, Rental & Leasing | 799 (66.0%) | 411 (34.0%) |
| Professional & Scientific | 2,045 (53.5%) | 1,776 (46.5%) |
| Enterprise Management | 0 (0.0%) | 0 (0.0%) |
| Administrative & Support | 2,585 (66.8%) | 1,282 (33.2%) |
| Educational Services | 2,083 (23.4%) | 6,831 (76.6%) |
| Health Care & Social Assistance | 2,287 (18.0%) | 10,408 (82.0%) |
| Arts, Entertainment & Recreation | 1,759 (45.9%) | 2,077 (54.1%) |
| Accommodation & Food Services | 2,003 (34.4%) | 3,814 (65.6%) |
| Public Administration | 2,561 (63.0%) | 1,503 (37.0%) |
| Total | 48,478 (52.7%) | 43,509 (47.3%) |
Education in Calcasieu Parish
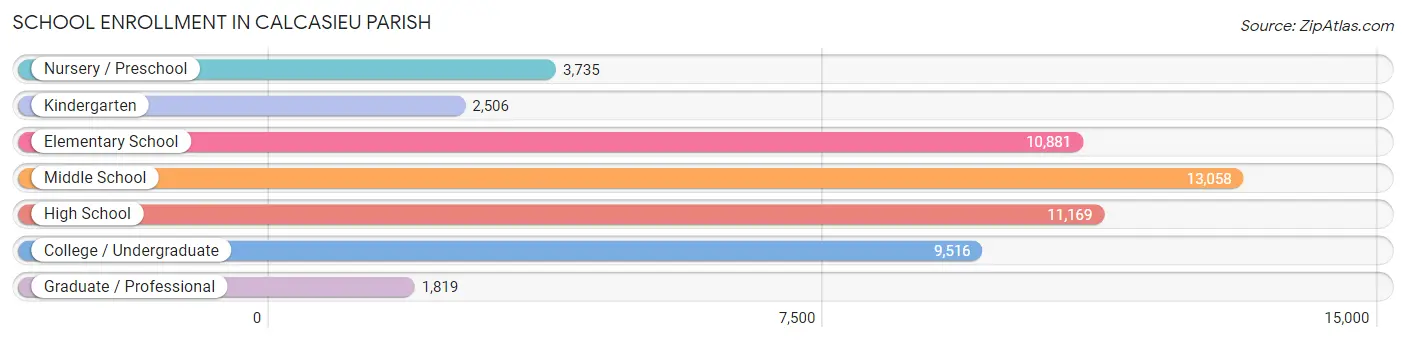
School Enrollment in Calcasieu Parish
The most common levels of schooling among the 52,684 students in Calcasieu Parish are middle school (13,058 | 24.8%), high school (11,169 | 21.2%), and elementary school (10,881 | 20.6%).
| School Level | # Students | % Students |
| Nursery / Preschool | 3,735 | 7.1% |
| Kindergarten | 2,506 | 4.8% |
| Elementary School | 10,881 | 20.6% |
| Middle School | 13,058 | 24.8% |
| High School | 11,169 | 21.2% |
| College / Undergraduate | 9,516 | 18.1% |
| Graduate / Professional | 1,819 | 3.5% |
| Total | 52,684 | 100.0% |
School Enrollment by Age by Funding Source in Calcasieu Parish
Out of a total of 52,684 students who are enrolled in schools in Calcasieu Parish, 9,167 (17.4%) attend a private institution, while the remaining 43,517 (82.6%) are enrolled in public schools. The age group of 3 to 4 year olds has the highest likelihood of being enrolled in private schools, with 1,082 (36.5% in the age bracket) enrolled. Conversely, the age group of 25 to 34 year olds has the lowest likelihood of being enrolled in a private school, with 2,700 (95.3% in the age bracket) attending a public institution.
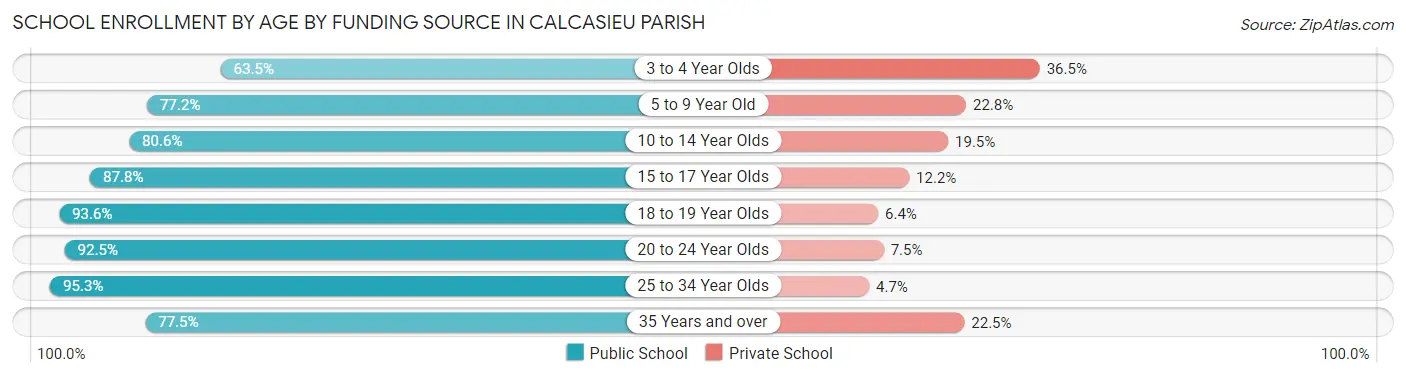
| Age Bracket | Public School | Private School |
| 3 to 4 Year Olds | 1,881 (63.5%) | 1,082 (36.5%) |
| 5 to 9 Year Old | 10,153 (77.2%) | 2,998 (22.8%) |
| 10 to 14 Year Olds | 12,193 (80.5%) | 2,944 (19.5%) |
| 15 to 17 Year Olds | 7,244 (87.8%) | 1,007 (12.2%) |
| 18 to 19 Year Olds | 3,197 (93.6%) | 219 (6.4%) |
| 20 to 24 Year Olds | 4,801 (92.5%) | 387 (7.5%) |
| 25 to 34 Year Olds | 2,700 (95.3%) | 134 (4.7%) |
| 35 Years and over | 1,352 (77.5%) | 392 (22.5%) |
| Total | 43,517 (82.6%) | 9,167 (17.4%) |
Educational Attainment by Field of Study in Calcasieu Parish
Business (5,926 | 17.2%), education (5,856 | 17.0%), science & technology (4,752 | 13.8%), arts & humanities (2,954 | 8.6%), and engineering (2,940 | 8.5%) are the most common fields of study among 34,430 individuals in Calcasieu Parish who have obtained a bachelor's degree or higher.
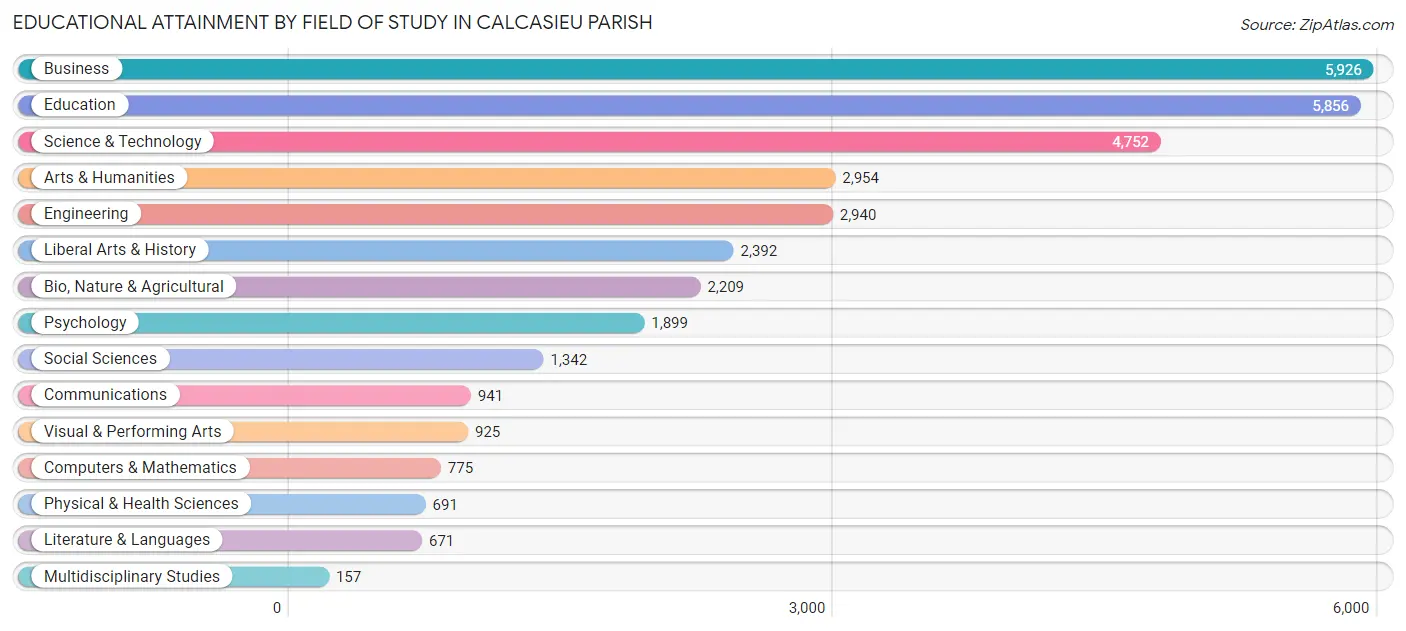
| Field of Study | # Graduates | % Graduates |
| Computers & Mathematics | 775 | 2.2% |
| Bio, Nature & Agricultural | 2,209 | 6.4% |
| Physical & Health Sciences | 691 | 2.0% |
| Psychology | 1,899 | 5.5% |
| Social Sciences | 1,342 | 3.9% |
| Engineering | 2,940 | 8.5% |
| Multidisciplinary Studies | 157 | 0.5% |
| Science & Technology | 4,752 | 13.8% |
| Business | 5,926 | 17.2% |
| Education | 5,856 | 17.0% |
| Literature & Languages | 671 | 1.9% |
| Liberal Arts & History | 2,392 | 7.0% |
| Visual & Performing Arts | 925 | 2.7% |
| Communications | 941 | 2.7% |
| Arts & Humanities | 2,954 | 8.6% |
| Total | 34,430 | 100.0% |
Transportation & Commute in Calcasieu Parish
Vehicle Availability by Sex in Calcasieu Parish
The most prevalent vehicle ownership categories in Calcasieu Parish are males with 2 vehicles (21,325, accounting for 44.5%) and females with 2 vehicles (16,063, making up 50.2%).
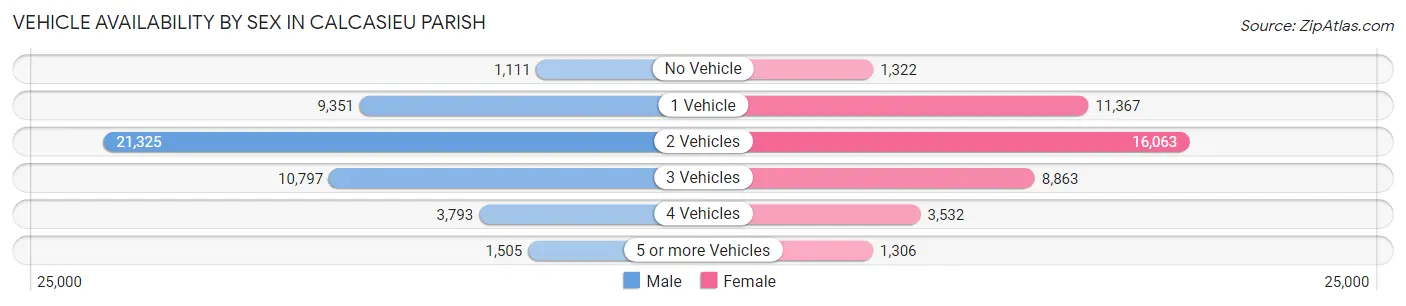
| Vehicles Available | Male | Female |
| No Vehicle | 1,111 (2.3%) | 1,322 (3.1%) |
| 1 Vehicle | 9,351 (19.5%) | 11,367 (26.8%) |
| 2 Vehicles | 21,325 (44.5%) | 16,063 (37.8%) |
| 3 Vehicles | 10,797 (22.6%) | 8,863 (20.9%) |
| 4 Vehicles | 3,793 (7.9%) | 3,532 (8.3%) |
| 5 or more Vehicles | 1,505 (3.1%) | 1,306 (3.1%) |
| Total | 47,882 (100.0%) | 42,453 (100.0%) |
Commute Time in Calcasieu Parish
The most frequently occuring commute durations in Calcasieu Parish are 15 to 19 minutes (18,883 commuters, 21.8%), 10 to 14 minutes (15,675 commuters, 18.1%), and 20 to 24 minutes (13,810 commuters, 15.9%).
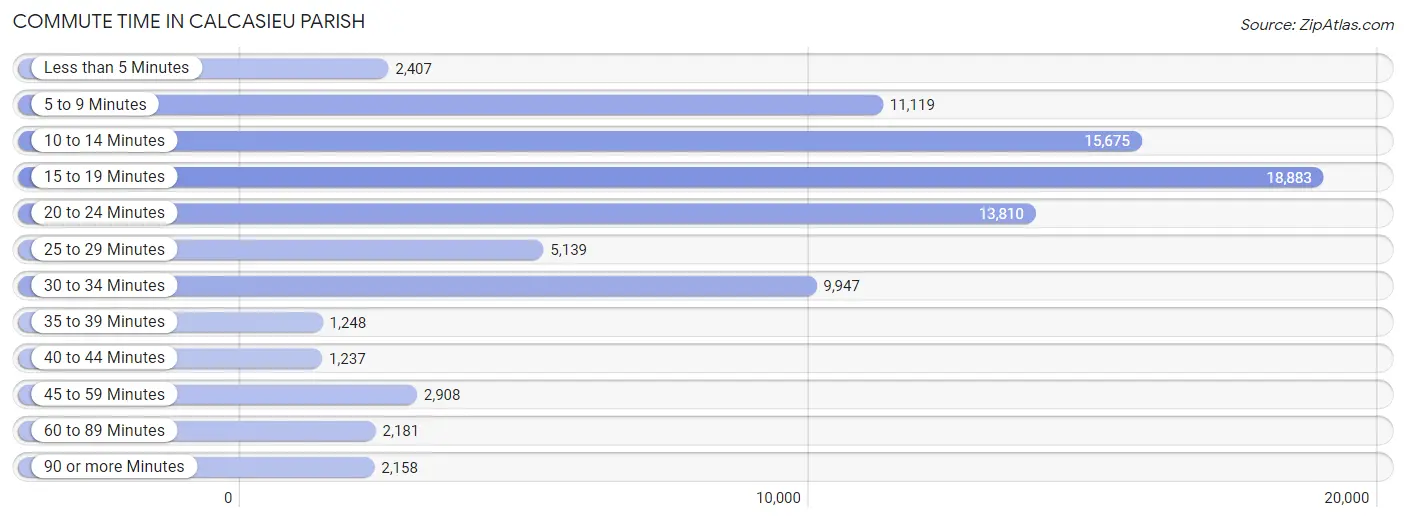
| Commute Time | # Commuters | % Commuters |
| Less than 5 Minutes | 2,407 | 2.8% |
| 5 to 9 Minutes | 11,119 | 12.8% |
| 10 to 14 Minutes | 15,675 | 18.1% |
| 15 to 19 Minutes | 18,883 | 21.8% |
| 20 to 24 Minutes | 13,810 | 15.9% |
| 25 to 29 Minutes | 5,139 | 5.9% |
| 30 to 34 Minutes | 9,947 | 11.5% |
| 35 to 39 Minutes | 1,248 | 1.4% |
| 40 to 44 Minutes | 1,237 | 1.4% |
| 45 to 59 Minutes | 2,908 | 3.4% |
| 60 to 89 Minutes | 2,181 | 2.5% |
| 90 or more Minutes | 2,158 | 2.5% |
Commute Time by Sex in Calcasieu Parish
The most common commute times in Calcasieu Parish are 15 to 19 minutes (8,894 commuters, 19.4%) for males and 15 to 19 minutes (9,989 commuters, 24.4%) for females.
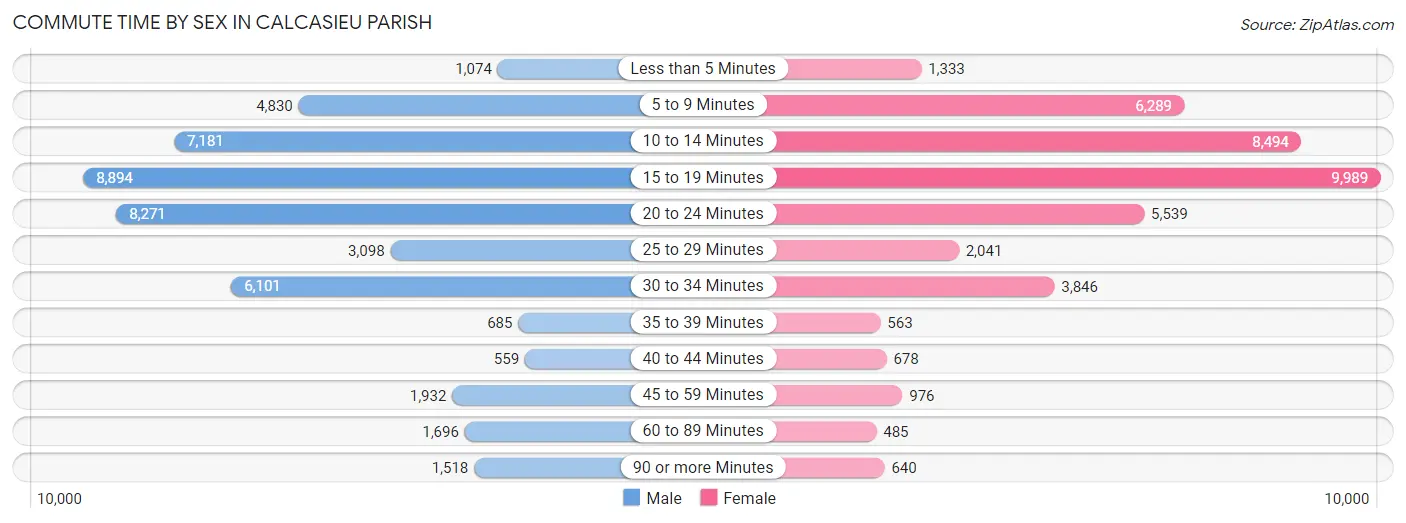
| Commute Time | Male | Female |
| Less than 5 Minutes | 1,074 (2.3%) | 1,333 (3.3%) |
| 5 to 9 Minutes | 4,830 (10.5%) | 6,289 (15.4%) |
| 10 to 14 Minutes | 7,181 (15.7%) | 8,494 (20.8%) |
| 15 to 19 Minutes | 8,894 (19.4%) | 9,989 (24.4%) |
| 20 to 24 Minutes | 8,271 (18.0%) | 5,539 (13.6%) |
| 25 to 29 Minutes | 3,098 (6.8%) | 2,041 (5.0%) |
| 30 to 34 Minutes | 6,101 (13.3%) | 3,846 (9.4%) |
| 35 to 39 Minutes | 685 (1.5%) | 563 (1.4%) |
| 40 to 44 Minutes | 559 (1.2%) | 678 (1.7%) |
| 45 to 59 Minutes | 1,932 (4.2%) | 976 (2.4%) |
| 60 to 89 Minutes | 1,696 (3.7%) | 485 (1.2%) |
| 90 or more Minutes | 1,518 (3.3%) | 640 (1.6%) |
Time of Departure to Work by Sex in Calcasieu Parish
The most frequent times of departure to work in Calcasieu Parish are 12:00 AM to 4:59 AM (6,637, 14.5%) for males and 7:00 AM to 7:29 AM (8,725, 21.3%) for females.
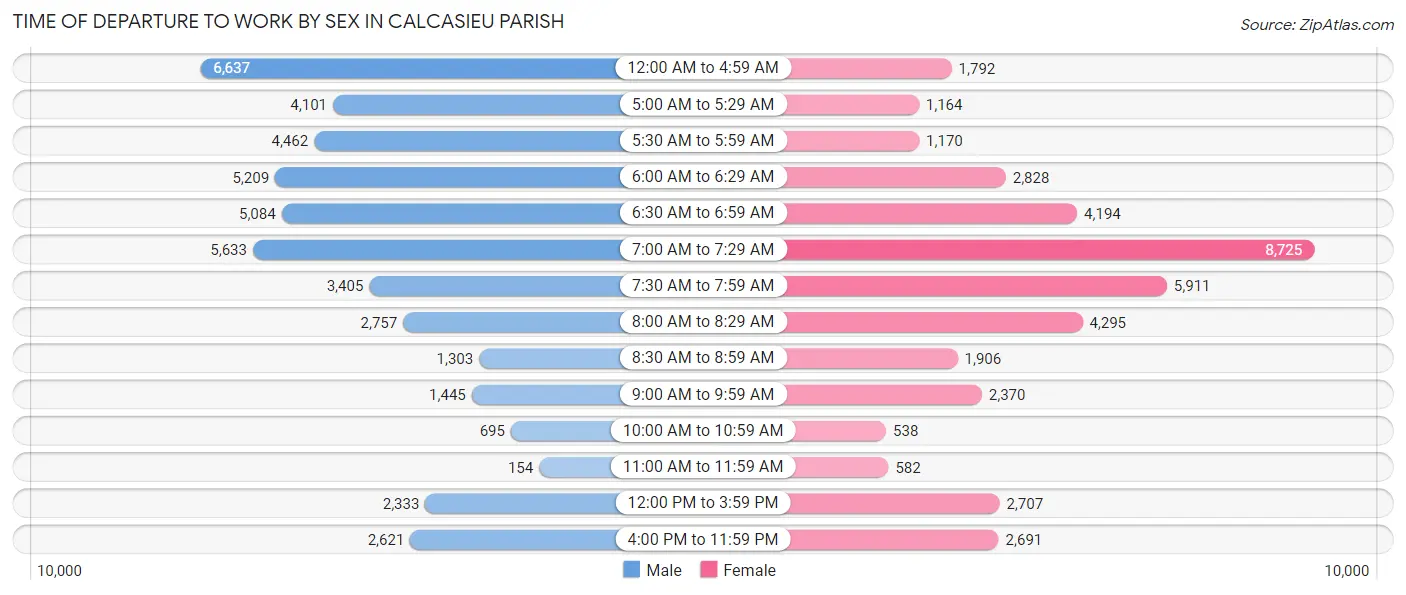
| Time of Departure | Male | Female |
| 12:00 AM to 4:59 AM | 6,637 (14.5%) | 1,792 (4.4%) |
| 5:00 AM to 5:29 AM | 4,101 (8.9%) | 1,164 (2.9%) |
| 5:30 AM to 5:59 AM | 4,462 (9.7%) | 1,170 (2.9%) |
| 6:00 AM to 6:29 AM | 5,209 (11.4%) | 2,828 (6.9%) |
| 6:30 AM to 6:59 AM | 5,084 (11.1%) | 4,194 (10.3%) |
| 7:00 AM to 7:29 AM | 5,633 (12.3%) | 8,725 (21.3%) |
| 7:30 AM to 7:59 AM | 3,405 (7.4%) | 5,911 (14.5%) |
| 8:00 AM to 8:29 AM | 2,757 (6.0%) | 4,295 (10.5%) |
| 8:30 AM to 8:59 AM | 1,303 (2.8%) | 1,906 (4.7%) |
| 9:00 AM to 9:59 AM | 1,445 (3.2%) | 2,370 (5.8%) |
| 10:00 AM to 10:59 AM | 695 (1.5%) | 538 (1.3%) |
| 11:00 AM to 11:59 AM | 154 (0.3%) | 582 (1.4%) |
| 12:00 PM to 3:59 PM | 2,333 (5.1%) | 2,707 (6.6%) |
| 4:00 PM to 11:59 PM | 2,621 (5.7%) | 2,691 (6.6%) |
| Total | 45,839 (100.0%) | 40,873 (100.0%) |
Housing Occupancy in Calcasieu Parish
Occupancy by Ownership in Calcasieu Parish
Of the total 76,853 dwellings in Calcasieu Parish, owner-occupied units account for 54,406 (70.8%), while renter-occupied units make up 22,447 (29.2%).
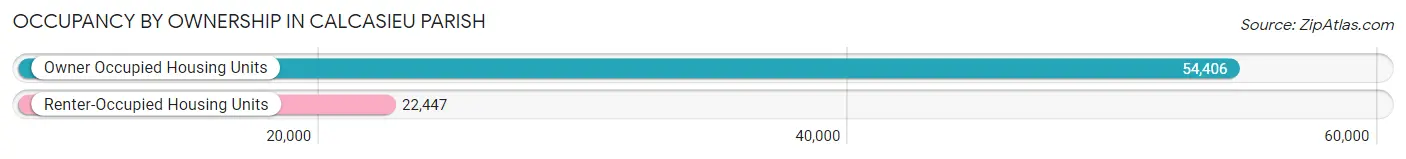
| Occupancy | # Housing Units | % Housing Units |
| Owner Occupied Housing Units | 54,406 | 70.8% |
| Renter-Occupied Housing Units | 22,447 | 29.2% |
| Total Occupied Housing Units | 76,853 | 100.0% |
Occupancy by Household Size in Calcasieu Parish
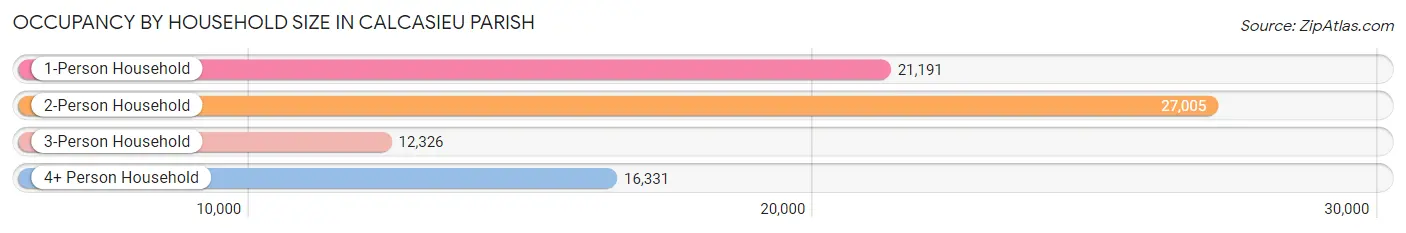
| Household Size | # Housing Units | % Housing Units |
| 1-Person Household | 21,191 | 27.6% |
| 2-Person Household | 27,005 | 35.1% |
| 3-Person Household | 12,326 | 16.0% |
| 4+ Person Household | 16,331 | 21.2% |
| Total Housing Units | 76,853 | 100.0% |
Occupancy by Ownership by Household Size in Calcasieu Parish
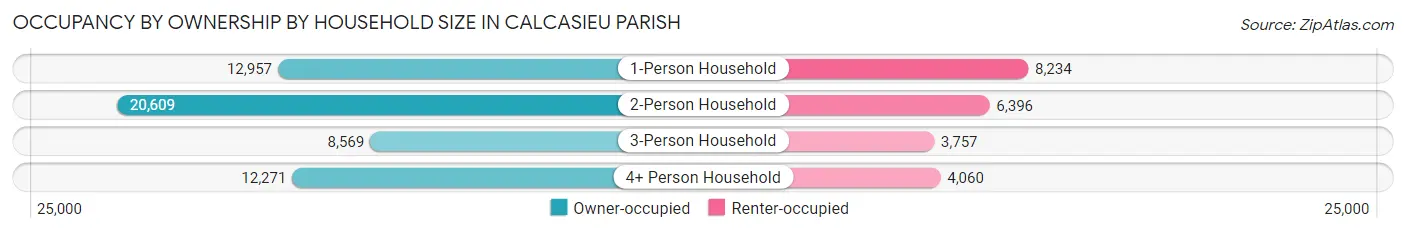
| Household Size | Owner-occupied | Renter-occupied |
| 1-Person Household | 12,957 (61.1%) | 8,234 (38.9%) |
| 2-Person Household | 20,609 (76.3%) | 6,396 (23.7%) |
| 3-Person Household | 8,569 (69.5%) | 3,757 (30.5%) |
| 4+ Person Household | 12,271 (75.1%) | 4,060 (24.9%) |
| Total Housing Units | 54,406 (70.8%) | 22,447 (29.2%) |
Occupancy by Educational Attainment in Calcasieu Parish
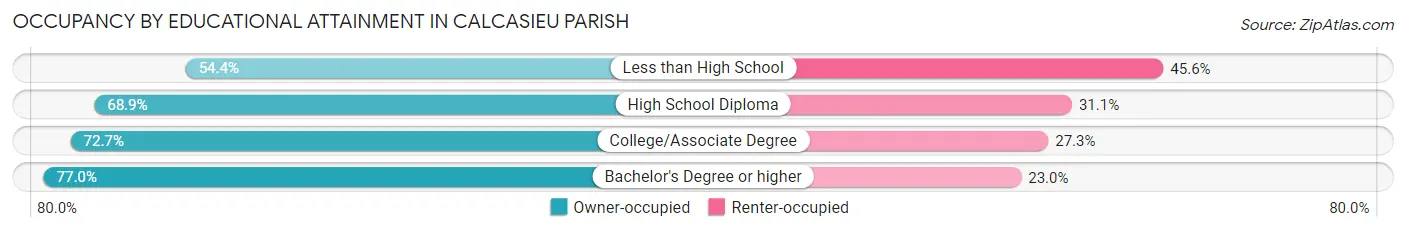
| Household Size | Owner-occupied | Renter-occupied |
| Less than High School | 4,166 (54.4%) | 3,486 (45.6%) |
| High School Diploma | 16,464 (68.9%) | 7,416 (31.1%) |
| College/Associate Degree | 18,894 (72.7%) | 7,094 (27.3%) |
| Bachelor's Degree or higher | 14,882 (77.0%) | 4,451 (23.0%) |
Occupancy by Age of Householder in Calcasieu Parish
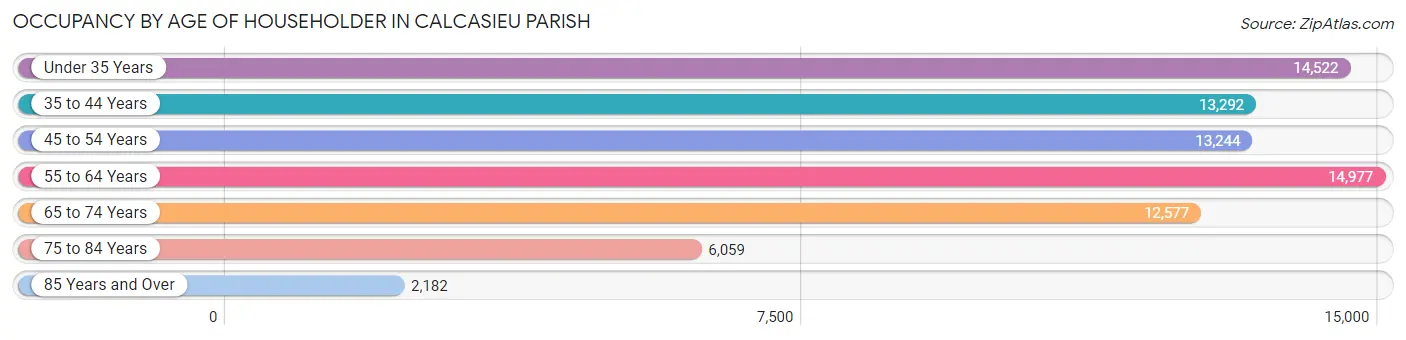
| Age Bracket | # Households | % Households |
| Under 35 Years | 14,522 | 18.9% |
| 35 to 44 Years | 13,292 | 17.3% |
| 45 to 54 Years | 13,244 | 17.2% |
| 55 to 64 Years | 14,977 | 19.5% |
| 65 to 74 Years | 12,577 | 16.4% |
| 75 to 84 Years | 6,059 | 7.9% |
| 85 Years and Over | 2,182 | 2.8% |
| Total | 76,853 | 100.0% |
Housing Finances in Calcasieu Parish
Median Income by Occupancy in Calcasieu Parish
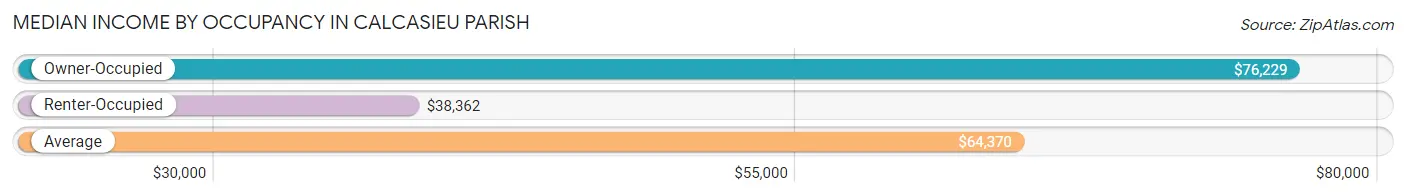
| Occupancy Type | # Households | Median Income |
| Owner-Occupied | 54,406 (70.8%) | $76,229 |
| Renter-Occupied | 22,447 (29.2%) | $38,362 |
| Average | 76,853 (100.0%) | $64,370 |
Occupancy by Householder Income Bracket in Calcasieu Parish
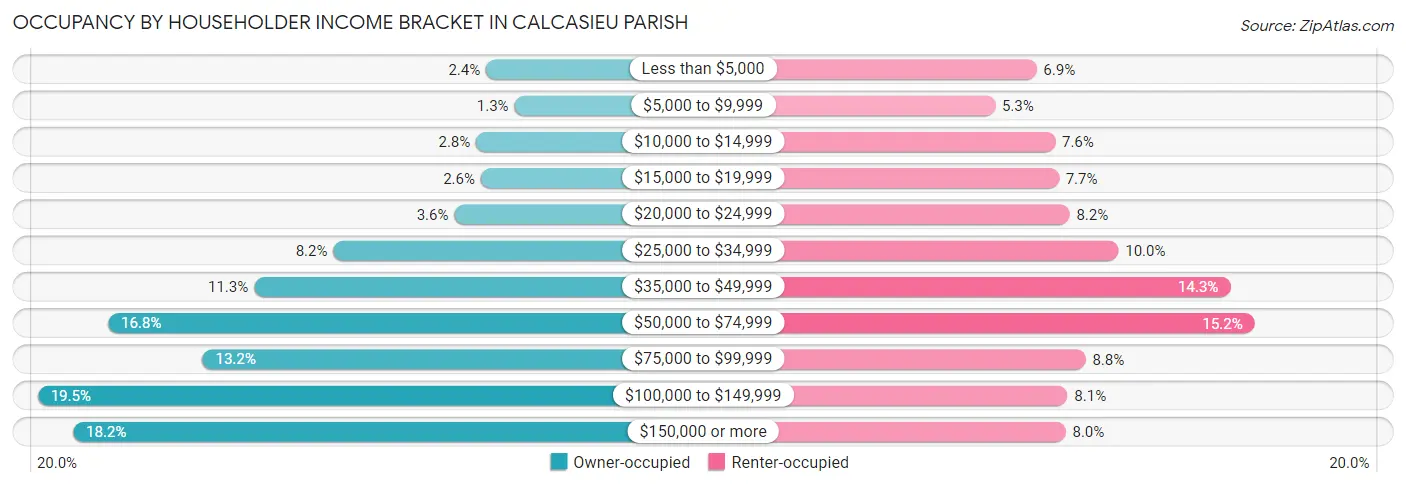
| Income Bracket | Owner-occupied | Renter-occupied |
| Less than $5,000 | 1,316 (2.4%) | 1,547 (6.9%) |
| $5,000 to $9,999 | 730 (1.3%) | 1,193 (5.3%) |
| $10,000 to $14,999 | 1,522 (2.8%) | 1,706 (7.6%) |
| $15,000 to $19,999 | 1,428 (2.6%) | 1,737 (7.7%) |
| $20,000 to $24,999 | 1,975 (3.6%) | 1,829 (8.2%) |
| $25,000 to $34,999 | 4,482 (8.2%) | 2,248 (10.0%) |
| $35,000 to $49,999 | 6,124 (11.3%) | 3,203 (14.3%) |
| $50,000 to $74,999 | 9,152 (16.8%) | 3,411 (15.2%) |
| $75,000 to $99,999 | 7,194 (13.2%) | 1,966 (8.8%) |
| $100,000 to $149,999 | 10,609 (19.5%) | 1,811 (8.1%) |
| $150,000 or more | 9,874 (18.1%) | 1,796 (8.0%) |
| Total | 54,406 (100.0%) | 22,447 (100.0%) |
Monthly Housing Cost Tiers in Calcasieu Parish
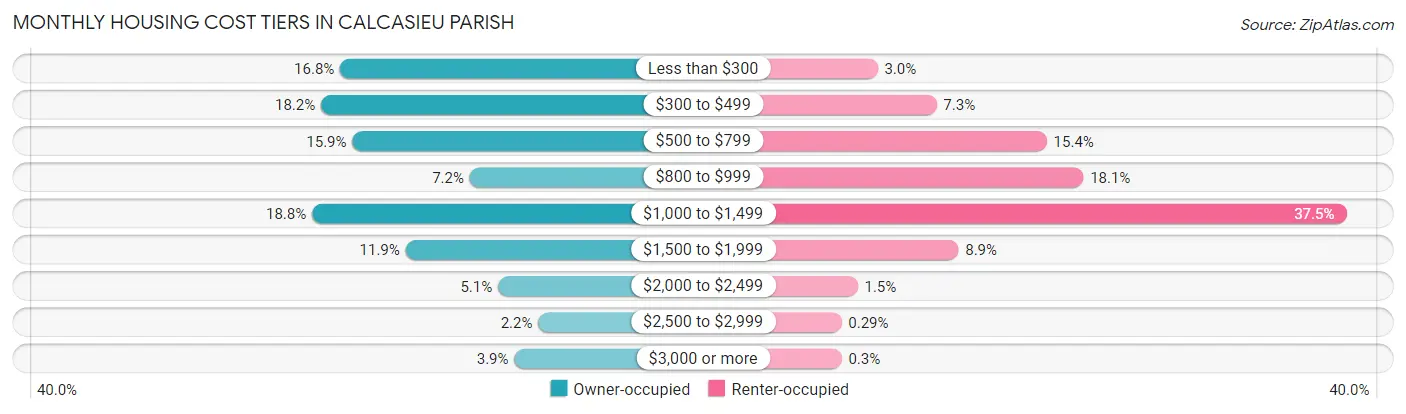
| Monthly Cost | Owner-occupied | Renter-occupied |
| Less than $300 | 9,120 (16.8%) | 663 (2.9%) |
| $300 to $499 | 9,887 (18.2%) | 1,637 (7.3%) |
| $500 to $799 | 8,629 (15.9%) | 3,458 (15.4%) |
| $800 to $999 | 3,921 (7.2%) | 4,063 (18.1%) |
| $1,000 to $1,499 | 10,244 (18.8%) | 8,412 (37.5%) |
| $1,500 to $1,999 | 6,496 (11.9%) | 1,997 (8.9%) |
| $2,000 to $2,499 | 2,789 (5.1%) | 333 (1.5%) |
| $2,500 to $2,999 | 1,180 (2.2%) | 64 (0.3%) |
| $3,000 or more | 2,140 (3.9%) | 68 (0.3%) |
| Total | 54,406 (100.0%) | 22,447 (100.0%) |
Physical Housing Characteristics in Calcasieu Parish
Housing Structures in Calcasieu Parish
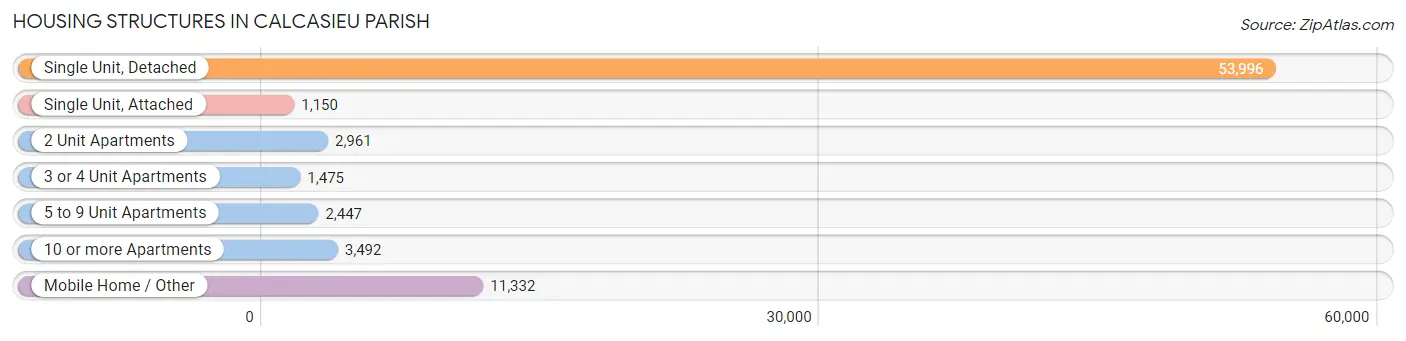
| Structure Type | # Housing Units | % Housing Units |
| Single Unit, Detached | 53,996 | 70.3% |
| Single Unit, Attached | 1,150 | 1.5% |
| 2 Unit Apartments | 2,961 | 3.8% |
| 3 or 4 Unit Apartments | 1,475 | 1.9% |
| 5 to 9 Unit Apartments | 2,447 | 3.2% |
| 10 or more Apartments | 3,492 | 4.5% |
| Mobile Home / Other | 11,332 | 14.7% |
| Total | 76,853 | 100.0% |
Housing Structures by Occupancy in Calcasieu Parish
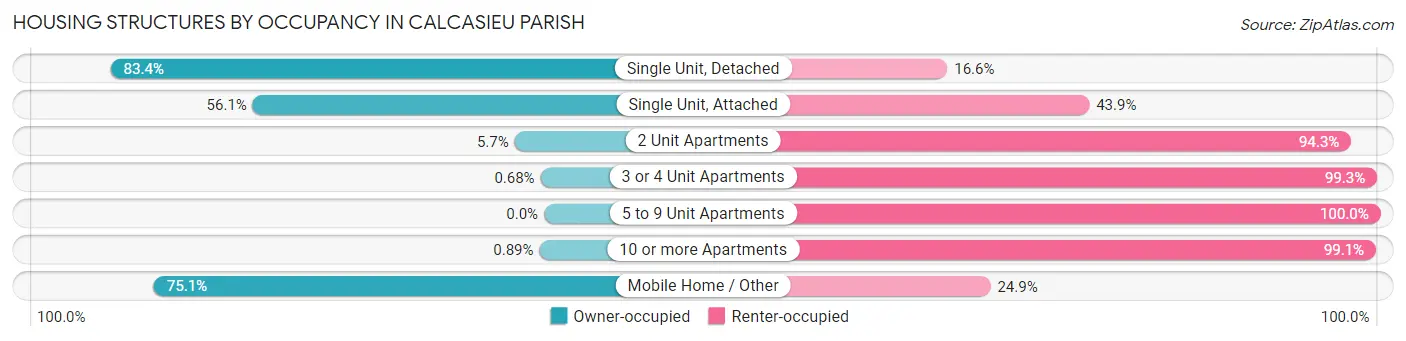
| Structure Type | Owner-occupied | Renter-occupied |
| Single Unit, Detached | 45,042 (83.4%) | 8,954 (16.6%) |
| Single Unit, Attached | 645 (56.1%) | 505 (43.9%) |
| 2 Unit Apartments | 168 (5.7%) | 2,793 (94.3%) |
| 3 or 4 Unit Apartments | 10 (0.7%) | 1,465 (99.3%) |
| 5 to 9 Unit Apartments | 0 (0.0%) | 2,447 (100.0%) |
| 10 or more Apartments | 31 (0.9%) | 3,461 (99.1%) |
| Mobile Home / Other | 8,510 (75.1%) | 2,822 (24.9%) |
| Total | 54,406 (70.8%) | 22,447 (29.2%) |
Housing Structures by Number of Rooms in Calcasieu Parish
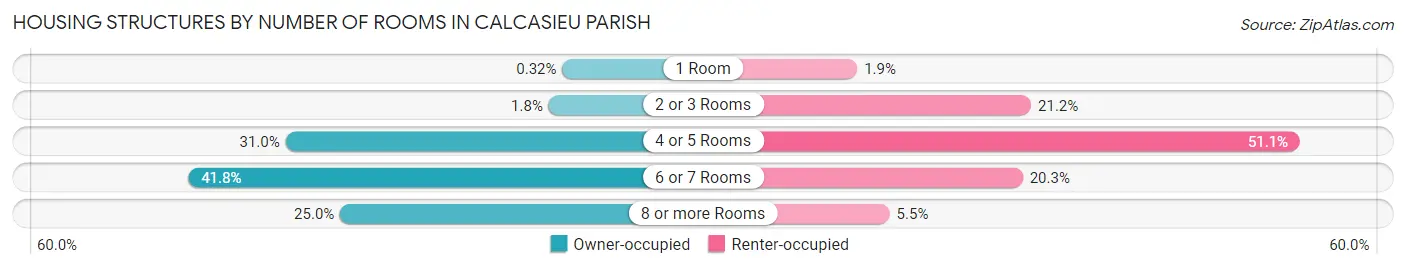
| Number of Rooms | Owner-occupied | Renter-occupied |
| 1 Room | 173 (0.3%) | 432 (1.9%) |
| 2 or 3 Rooms | 994 (1.8%) | 4,763 (21.2%) |
| 4 or 5 Rooms | 16,885 (31.0%) | 11,460 (51.0%) |
| 6 or 7 Rooms | 22,761 (41.8%) | 4,554 (20.3%) |
| 8 or more Rooms | 13,593 (25.0%) | 1,238 (5.5%) |
| Total | 54,406 (100.0%) | 22,447 (100.0%) |
Housing Structure by Heating Type in Calcasieu Parish
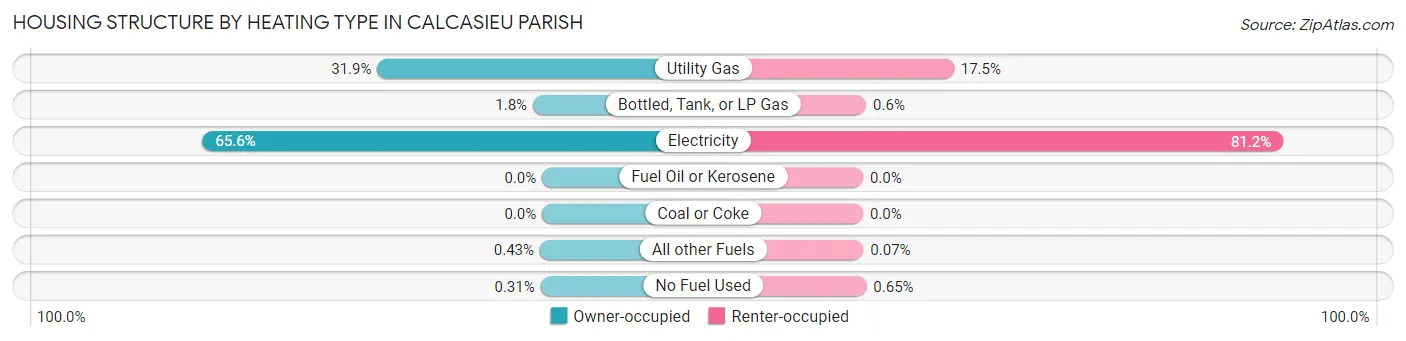
| Heating Type | Owner-occupied | Renter-occupied |
| Utility Gas | 17,326 (31.9%) | 3,937 (17.5%) |
| Bottled, Tank, or LP Gas | 962 (1.8%) | 134 (0.6%) |
| Electricity | 35,714 (65.6%) | 18,216 (81.1%) |
| Fuel Oil or Kerosene | 0 (0.0%) | 0 (0.0%) |
| Coal or Coke | 0 (0.0%) | 0 (0.0%) |
| All other Fuels | 236 (0.4%) | 15 (0.1%) |
| No Fuel Used | 168 (0.3%) | 145 (0.6%) |
| Total | 54,406 (100.0%) | 22,447 (100.0%) |
Household Vehicle Usage in Calcasieu Parish
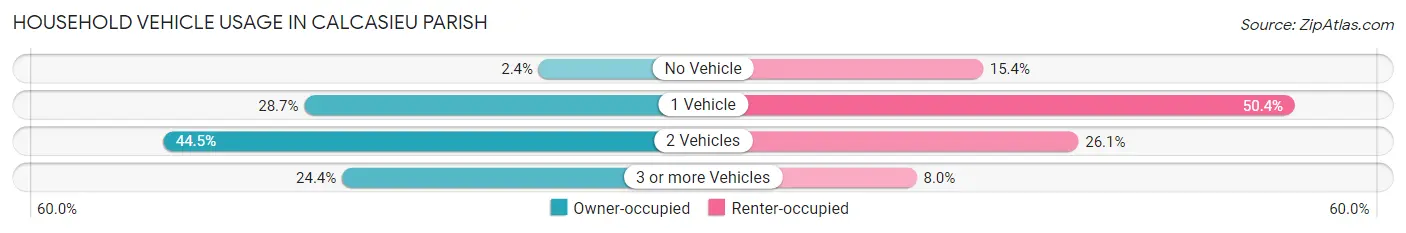
| Vehicles per Household | Owner-occupied | Renter-occupied |
| No Vehicle | 1,301 (2.4%) | 3,466 (15.4%) |
| 1 Vehicle | 15,596 (28.7%) | 11,313 (50.4%) |
| 2 Vehicles | 24,219 (44.5%) | 5,868 (26.1%) |
| 3 or more Vehicles | 13,290 (24.4%) | 1,800 (8.0%) |
| Total | 54,406 (100.0%) | 22,447 (100.0%) |
Real Estate & Mortgages in Calcasieu Parish
Real Estate and Mortgage Overview in Calcasieu Parish
| Characteristic | Without Mortgage | With Mortgage |
| Housing Units | 25,935 | 28,471 |
| Median Property Value | $170,200 | $213,300 |
| Median Household Income | $56,829 | $6,985 |
| Monthly Housing Costs | $373 | $2,026 |
| Real Estate Taxes | $584 | $4,422 |
Property Value by Mortgage Status in Calcasieu Parish
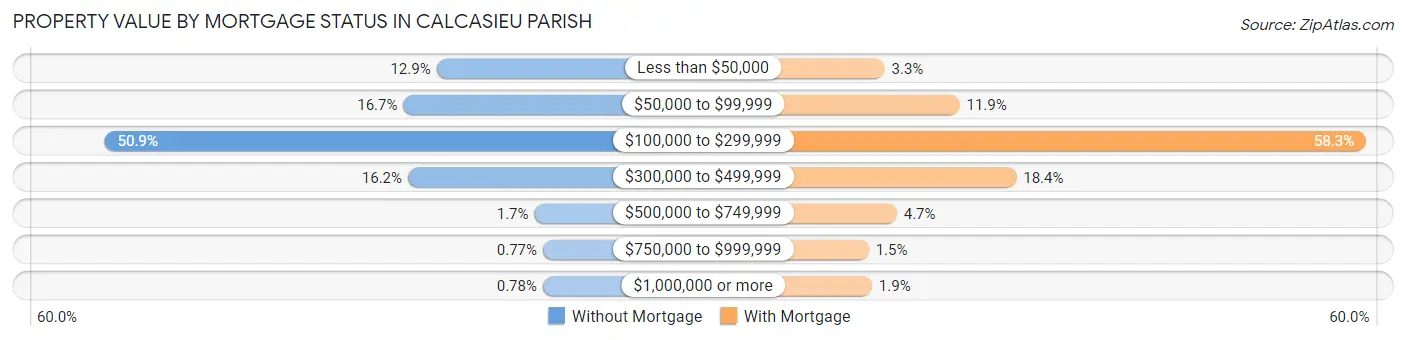
| Property Value | Without Mortgage | With Mortgage |
| Less than $50,000 | 3,354 (12.9%) | 946 (3.3%) |
| $50,000 to $99,999 | 4,337 (16.7%) | 3,386 (11.9%) |
| $100,000 to $299,999 | 13,188 (50.8%) | 16,609 (58.3%) |
| $300,000 to $499,999 | 4,202 (16.2%) | 5,229 (18.4%) |
| $500,000 to $749,999 | 451 (1.7%) | 1,342 (4.7%) |
| $750,000 to $999,999 | 200 (0.8%) | 428 (1.5%) |
| $1,000,000 or more | 203 (0.8%) | 531 (1.9%) |
| Total | 25,935 (100.0%) | 28,471 (100.0%) |
Household Income by Mortgage Status in Calcasieu Parish
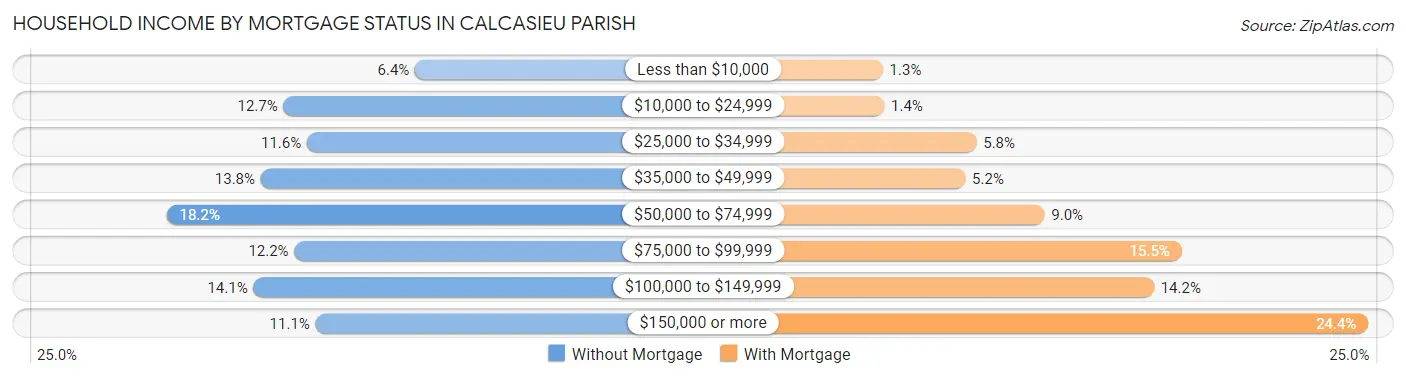
| Household Income | Without Mortgage | With Mortgage |
| Less than $10,000 | 1,660 (6.4%) | 367 (1.3%) |
| $10,000 to $24,999 | 3,287 (12.7%) | 386 (1.4%) |
| $25,000 to $34,999 | 2,995 (11.6%) | 1,638 (5.8%) |
| $35,000 to $49,999 | 3,565 (13.8%) | 1,487 (5.2%) |
| $50,000 to $74,999 | 4,730 (18.2%) | 2,559 (9.0%) |
| $75,000 to $99,999 | 3,151 (12.1%) | 4,422 (15.5%) |
| $100,000 to $149,999 | 3,658 (14.1%) | 4,043 (14.2%) |
| $150,000 or more | 2,889 (11.1%) | 6,951 (24.4%) |
| Total | 25,935 (100.0%) | 28,471 (100.0%) |
Property Value to Household Income Ratio in Calcasieu Parish
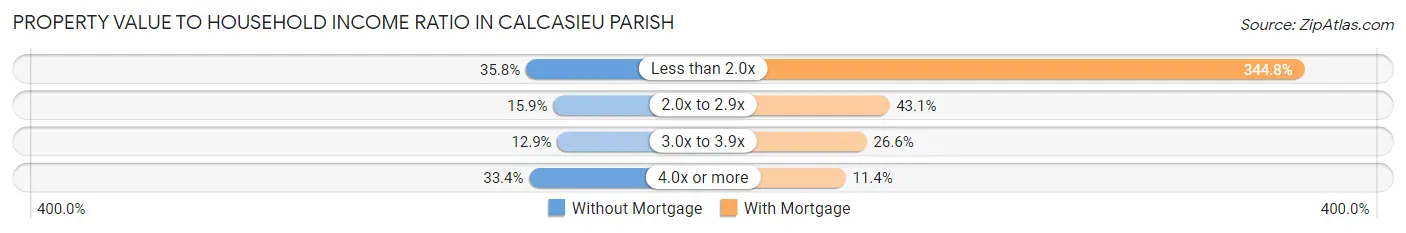
| Value-to-Income Ratio | Without Mortgage | With Mortgage |
| Less than 2.0x | 9,272 (35.7%) | 98,156 (344.8%) |
| 2.0x to 2.9x | 4,117 (15.9%) | 12,271 (43.1%) |
| 3.0x to 3.9x | 3,346 (12.9%) | 7,564 (26.6%) |
| 4.0x or more | 8,660 (33.4%) | 3,238 (11.4%) |
| Total | 25,935 (100.0%) | 28,471 (100.0%) |
Real Estate Taxes by Mortgage Status in Calcasieu Parish
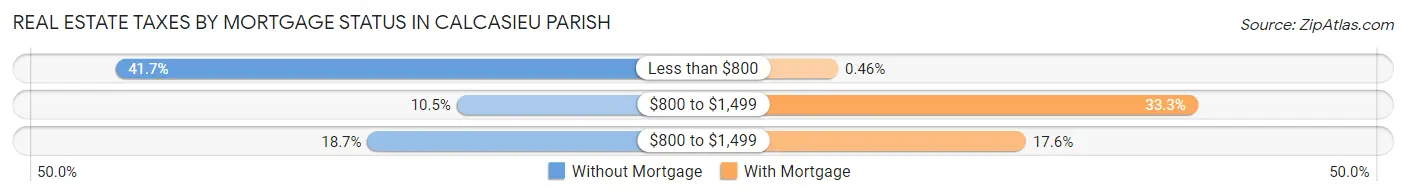
| Property Taxes | Without Mortgage | With Mortgage |
| Less than $800 | 10,821 (41.7%) | 132 (0.5%) |
| $800 to $1,499 | 2,734 (10.5%) | 9,479 (33.3%) |
| $800 to $1,499 | 4,849 (18.7%) | 5,016 (17.6%) |
| Total | 25,935 (100.0%) | 28,471 (100.0%) |
Health & Disability in Calcasieu Parish
Health Insurance Coverage by Age in Calcasieu Parish
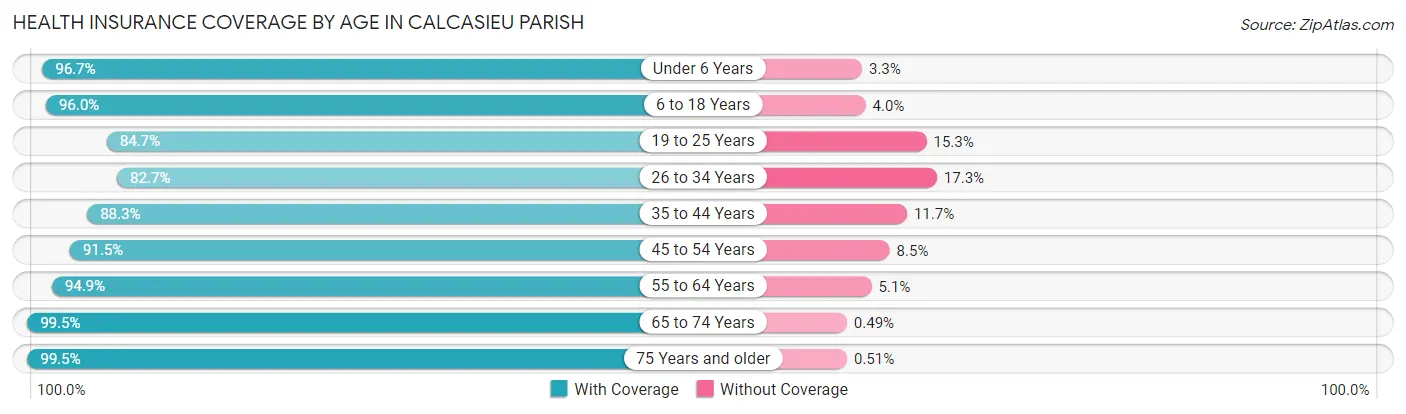
| Age Bracket | With Coverage | Without Coverage |
| Under 6 Years | 16,392 (96.7%) | 562 (3.3%) |
| 6 to 18 Years | 36,194 (96.0%) | 1,499 (4.0%) |
| 19 to 25 Years | 16,207 (84.7%) | 2,934 (15.3%) |
| 26 to 34 Years | 21,617 (82.7%) | 4,514 (17.3%) |
| 35 to 44 Years | 23,399 (88.3%) | 3,096 (11.7%) |
| 45 to 54 Years | 22,066 (91.5%) | 2,038 (8.5%) |
| 55 to 64 Years | 25,298 (94.9%) | 1,358 (5.1%) |
| 65 to 74 Years | 19,348 (99.5%) | 95 (0.5%) |
| 75 Years and older | 12,212 (99.5%) | 63 (0.5%) |
| Total | 192,733 (92.3%) | 16,159 (7.7%) |
Health Insurance Coverage by Citizenship Status in Calcasieu Parish
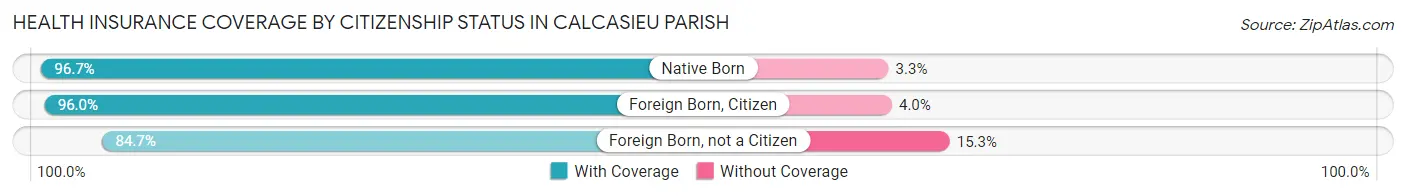
| Citizenship Status | With Coverage | Without Coverage |
| Native Born | 16,392 (96.7%) | 562 (3.3%) |
| Foreign Born, Citizen | 36,194 (96.0%) | 1,499 (4.0%) |
| Foreign Born, not a Citizen | 16,207 (84.7%) | 2,934 (15.3%) |
Health Insurance Coverage by Household Income in Calcasieu Parish
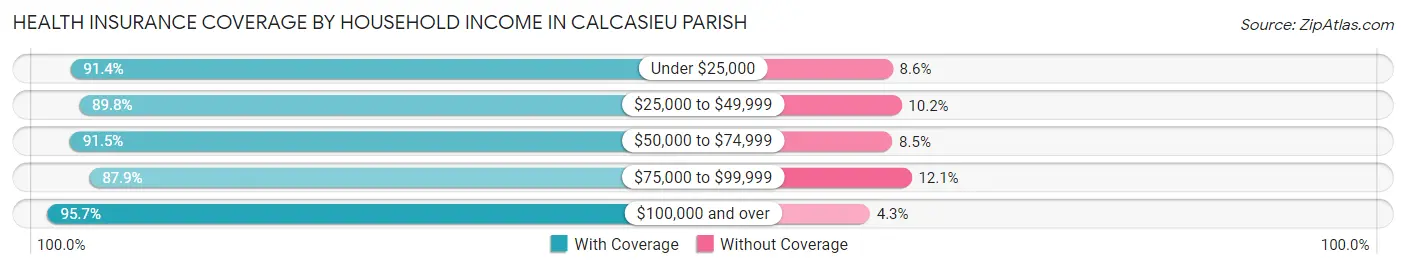
| Household Income | With Coverage | Without Coverage |
| Under $25,000 | 28,520 (91.4%) | 2,681 (8.6%) |
| $25,000 to $49,999 | 35,287 (89.8%) | 4,023 (10.2%) |
| $50,000 to $74,999 | 28,746 (91.5%) | 2,669 (8.5%) |
| $75,000 to $99,999 | 23,801 (87.9%) | 3,278 (12.1%) |
| $100,000 and over | 75,173 (95.7%) | 3,384 (4.3%) |
Public vs Private Health Insurance Coverage by Age in Calcasieu Parish
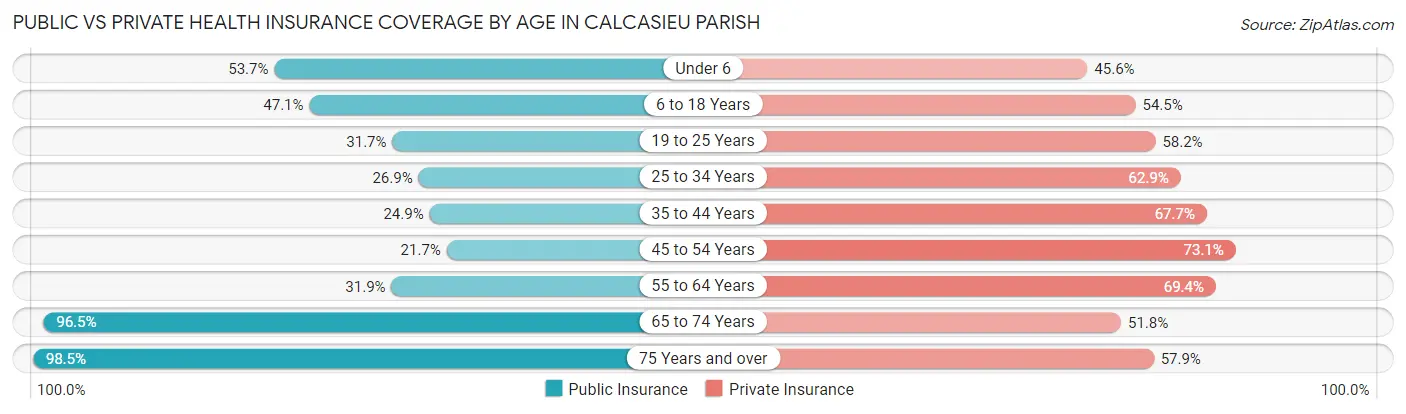
| Age Bracket | Public Insurance | Private Insurance |
| Under 6 | 9,096 (53.6%) | 7,730 (45.6%) |
| 6 to 18 Years | 17,768 (47.1%) | 20,550 (54.5%) |
| 19 to 25 Years | 6,076 (31.7%) | 11,143 (58.2%) |
| 25 to 34 Years | 7,027 (26.9%) | 16,434 (62.9%) |
| 35 to 44 Years | 6,585 (24.8%) | 17,945 (67.7%) |
| 45 to 54 Years | 5,222 (21.7%) | 17,621 (73.1%) |
| 55 to 64 Years | 8,505 (31.9%) | 18,502 (69.4%) |
| 65 to 74 Years | 18,769 (96.5%) | 10,078 (51.8%) |
| 75 Years and over | 12,087 (98.5%) | 7,106 (57.9%) |
| Total | 91,135 (43.6%) | 127,109 (60.9%) |
Disability Status by Sex by Age in Calcasieu Parish
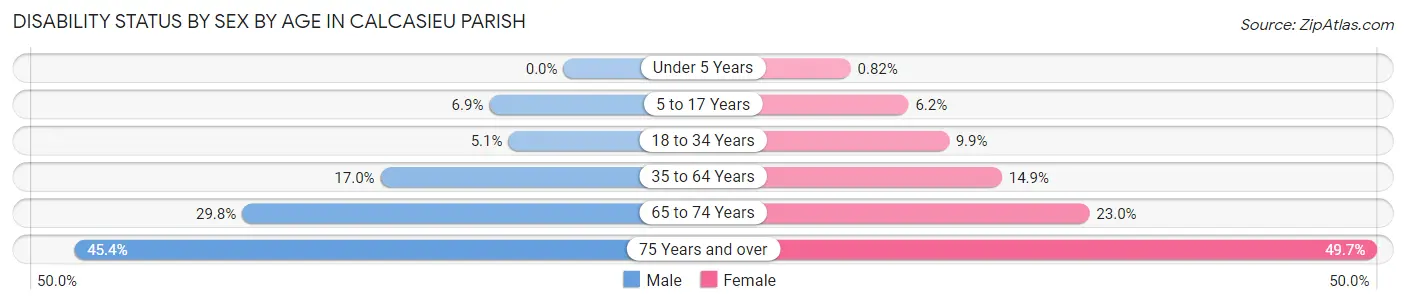
| Age Bracket | Male | Female |
| Under 5 Years | 0 (0.0%) | 59 (0.8%) |
| 5 to 17 Years | 1,331 (6.9%) | 1,147 (6.2%) |
| 18 to 34 Years | 1,204 (5.1%) | 2,367 (9.9%) |
| 35 to 64 Years | 6,419 (17.0%) | 5,856 (14.8%) |
| 65 to 74 Years | 2,720 (29.8%) | 2,372 (23.0%) |
| 75 Years and over | 2,318 (45.4%) | 3,562 (49.7%) |
Disability Class by Sex by Age in Calcasieu Parish
Disability Class: Hearing Difficulty
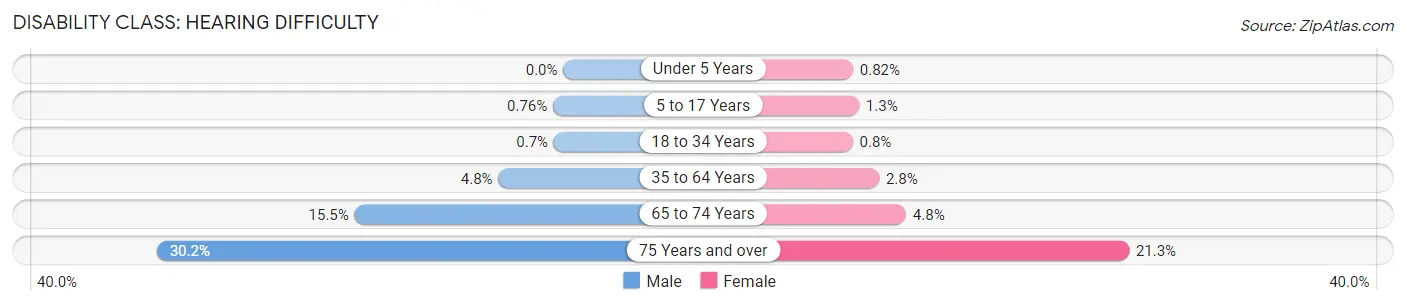
| Age Bracket | Male | Female |
| Under 5 Years | 0 (0.0%) | 59 (0.8%) |
| 5 to 17 Years | 148 (0.8%) | 236 (1.3%) |
| 18 to 34 Years | 164 (0.7%) | 191 (0.8%) |
| 35 to 64 Years | 1,824 (4.8%) | 1,089 (2.8%) |
| 65 to 74 Years | 1,414 (15.5%) | 491 (4.8%) |
| 75 Years and over | 1,542 (30.2%) | 1,528 (21.3%) |
Disability Class: Vision Difficulty
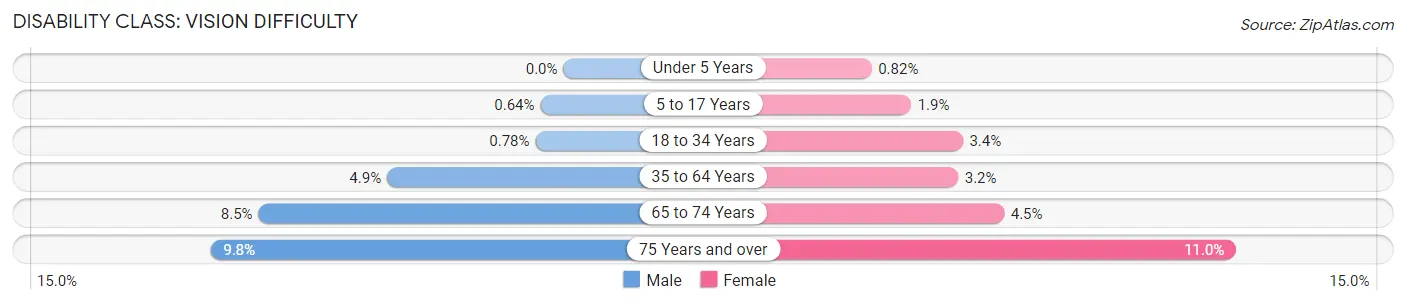
| Age Bracket | Male | Female |
| Under 5 Years | 0 (0.0%) | 59 (0.8%) |
| 5 to 17 Years | 123 (0.6%) | 355 (1.9%) |
| 18 to 34 Years | 184 (0.8%) | 801 (3.4%) |
| 35 to 64 Years | 1,857 (4.9%) | 1,273 (3.2%) |
| 65 to 74 Years | 774 (8.5%) | 466 (4.5%) |
| 75 Years and over | 502 (9.8%) | 787 (11.0%) |
Disability Class: Cognitive Difficulty
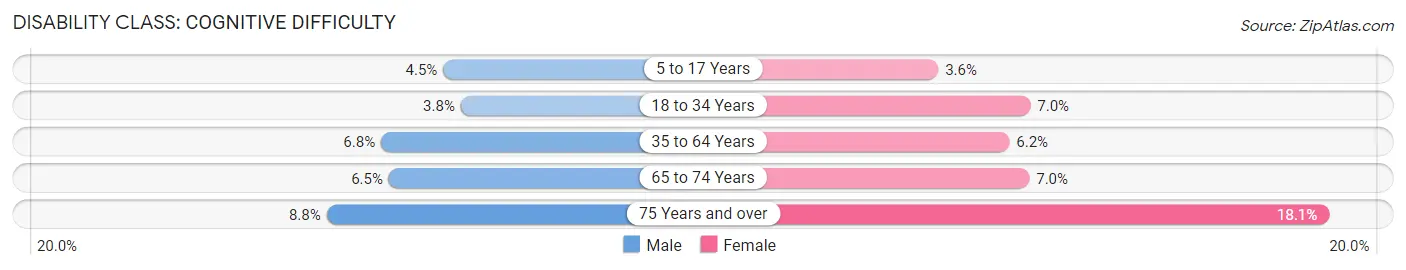
| Age Bracket | Male | Female |
| 5 to 17 Years | 863 (4.5%) | 663 (3.6%) |
| 18 to 34 Years | 898 (3.8%) | 1,670 (7.0%) |
| 35 to 64 Years | 2,561 (6.8%) | 2,455 (6.2%) |
| 65 to 74 Years | 591 (6.5%) | 718 (7.0%) |
| 75 Years and over | 449 (8.8%) | 1,297 (18.1%) |
Disability Class: Ambulatory Difficulty
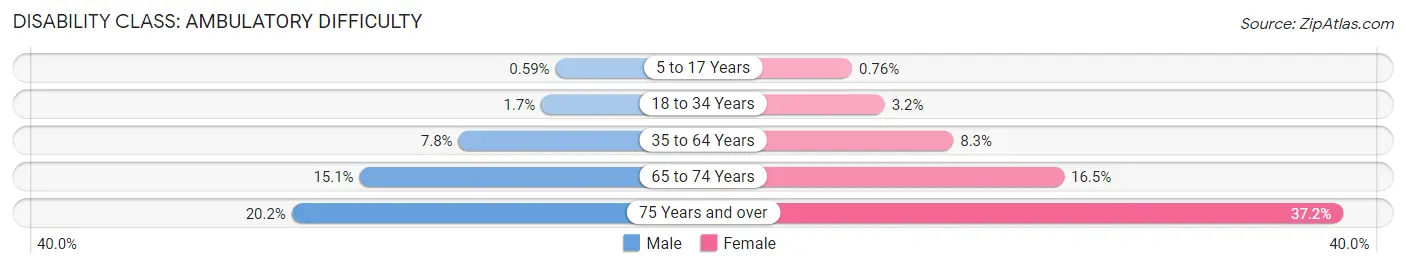
| Age Bracket | Male | Female |
| 5 to 17 Years | 115 (0.6%) | 141 (0.8%) |
| 18 to 34 Years | 388 (1.7%) | 760 (3.2%) |
| 35 to 64 Years | 2,945 (7.8%) | 3,265 (8.3%) |
| 65 to 74 Years | 1,381 (15.1%) | 1,703 (16.5%) |
| 75 Years and over | 1,030 (20.2%) | 2,668 (37.2%) |
Disability Class: Self-Care Difficulty
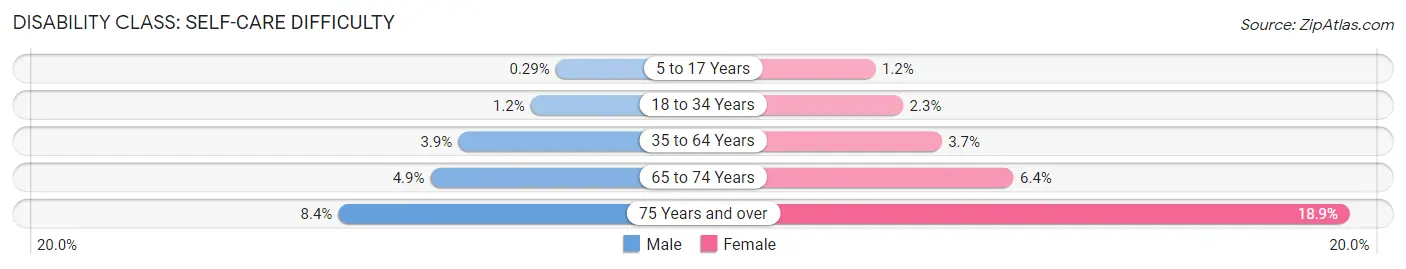
| Age Bracket | Male | Female |
| 5 to 17 Years | 56 (0.3%) | 228 (1.2%) |
| 18 to 34 Years | 288 (1.2%) | 540 (2.3%) |
| 35 to 64 Years | 1,477 (3.9%) | 1,457 (3.7%) |
| 65 to 74 Years | 451 (4.9%) | 656 (6.4%) |
| 75 Years and over | 427 (8.4%) | 1,352 (18.9%) |
Technology Access in Calcasieu Parish
Computing Device Access in Calcasieu Parish
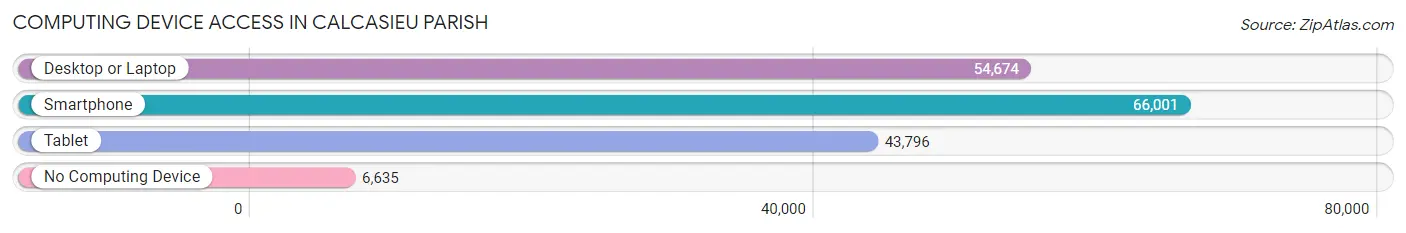
| Device Type | # Households | % Households |
| Desktop or Laptop | 54,674 | 71.1% |
| Smartphone | 66,001 | 85.9% |
| Tablet | 43,796 | 57.0% |
| No Computing Device | 6,635 | 8.6% |
| Total | 76,853 | 100.0% |
Internet Access in Calcasieu Parish
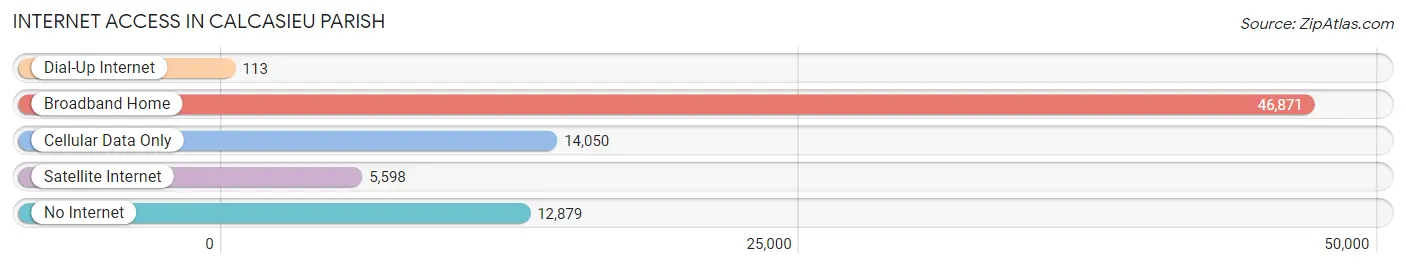
| Internet Type | # Households | % Households |
| Dial-Up Internet | 113 | 0.2% |
| Broadband Home | 46,871 | 61.0% |
| Cellular Data Only | 14,050 | 18.3% |
| Satellite Internet | 5,598 | 7.3% |
| No Internet | 12,879 | 16.8% |
| Total | 76,853 | 100.0% |
Calcasieu Parish Summary
Calcasieu Parish, Louisiana is located in the southwestern corner of the state and is bordered by the Sabine River to the west, the Calcasieu River to the east, and the Gulf of Mexico to the south. The parish is home to a population of over 200,000 people and is the fifth most populous parish in Louisiana. The parish seat is Lake Charles, which is the largest city in the parish and the fifth largest city in the state.
History
Calcasieu Parish was established in 1840 and was named after the Calcasieu River, which was named by the Spanish explorer Hernando de Soto in 1542. The parish was originally part of the larger St. Landry Parish, but was split off in 1840. The parish was originally inhabited by the Attakapas and Opelousas tribes of Native Americans, who were later displaced by French settlers. The parish was also home to a large number of Acadian immigrants who arrived in the area in the late 1700s.
The parish was an important center of the cotton and sugar cane industries in the 19th century, and the city of Lake Charles was established in 1861. The city quickly became an important port and trading center, and it was the site of the Battle of Calcasieu Pass during the Civil War. The parish was also home to a large number of oil and gas wells in the early 20th century, and the city of Lake Charles became a major center of the oil and gas industry.
Geography
Calcasieu Parish is located in the southwestern corner of Louisiana and is bordered by the Sabine River to the west, the Calcasieu River to the east, and the Gulf of Mexico to the south. The parish covers an area of 1,093 square miles and is the fifth largest parish in the state. The parish is mostly flat and is covered by a mix of pine and hardwood forests, swamps, and marshes. The parish is also home to several large lakes, including Lake Charles, which is the largest lake in the parish.
Economy
Calcasieu Parish has a diverse economy that is driven by the oil and gas industry, manufacturing, tourism, and agriculture. The oil and gas industry is the largest employer in the parish, and the city of Lake Charles is home to several major oil and gas companies. The manufacturing sector is also important to the local economy, and the city of Lake Charles is home to several large manufacturing plants. Tourism is also an important part of the local economy, and the city of Lake Charles is a popular destination for tourists. Agriculture is also an important part of the local economy, and the parish is home to several large farms that produce a variety of crops.
Demographics
As of the 2010 census, Calcasieu Parish had a population of 192,768 people. The population is made up of a variety of ethnic and racial groups, including White (63.3%), African American (30.2%), Hispanic or Latino (4.2%), and Asian (1.7%). The median household income in the parish is $45,945, and the median home value is $133,400. The unemployment rate in the parish is 5.2%, which is lower than the national average.
Common Questions
What is the Total Population of Calcasieu Parish?
Total Population of Calcasieu Parish is 210,770.
What is the Total Male Population of Calcasieu Parish?
Total Male Population of Calcasieu Parish is 103,638.
What is the Total Female Population of Calcasieu Parish?
Total Female Population of Calcasieu Parish is 107,132.
What is the Ratio of Males per 100 Females in Calcasieu Parish?
There are 96.74 Males per 100 Females in Calcasieu Parish.
What is the Ratio of Females per 100 Males in Calcasieu Parish?
There are 103.37 Females per 100 Males in Calcasieu Parish.
What is the Median Population Age in Calcasieu Parish?
Median Population Age in Calcasieu Parish is 36.7 Years.
What is the Average Family Size in Calcasieu Parish
Average Family Size in Calcasieu Parish is 3.4 People.
What is the Average Household Size in Calcasieu Parish
Average Household Size in Calcasieu Parish is 2.7 People.
What is Per Capita Income in Calcasieu Parish?
Per Capita income in Calcasieu Parish is $33,486.
What is the Median Family Income in Calcasieu Parish?
Median Family Income in Calcasieu Parish is $79,749.
What is the Median Household income in Calcasieu Parish?
Median Household Income in Calcasieu Parish is $64,370.
What is Income or Wage Gap in Calcasieu Parish?
Income or Wage Gap in Calcasieu Parish is 47.0%.
Women in Calcasieu Parish earn 53.0 cents for every dollar earned by a man.
What is Family Income Deficit in Calcasieu Parish?
Family Income Deficit in Calcasieu Parish is $10,362.
Families that are below poverty line in Calcasieu Parish earn $10,362 less on average than the poverty threshold level.
What is Inequality or Gini Index in Calcasieu Parish?
Inequality or Gini Index in Calcasieu Parish is 0.47.
How Large is the Labor Force in Calcasieu Parish?
There are 97,522 People in the Labor Forcein in Calcasieu Parish.
What is the Percentage of People in the Labor Force in Calcasieu Parish?
59.7% of People are in the Labor Force in Calcasieu Parish.
What is the Unemployment Rate in Calcasieu Parish?
Unemployment Rate in Calcasieu Parish is 5.6%.