Bossier Parish, LA
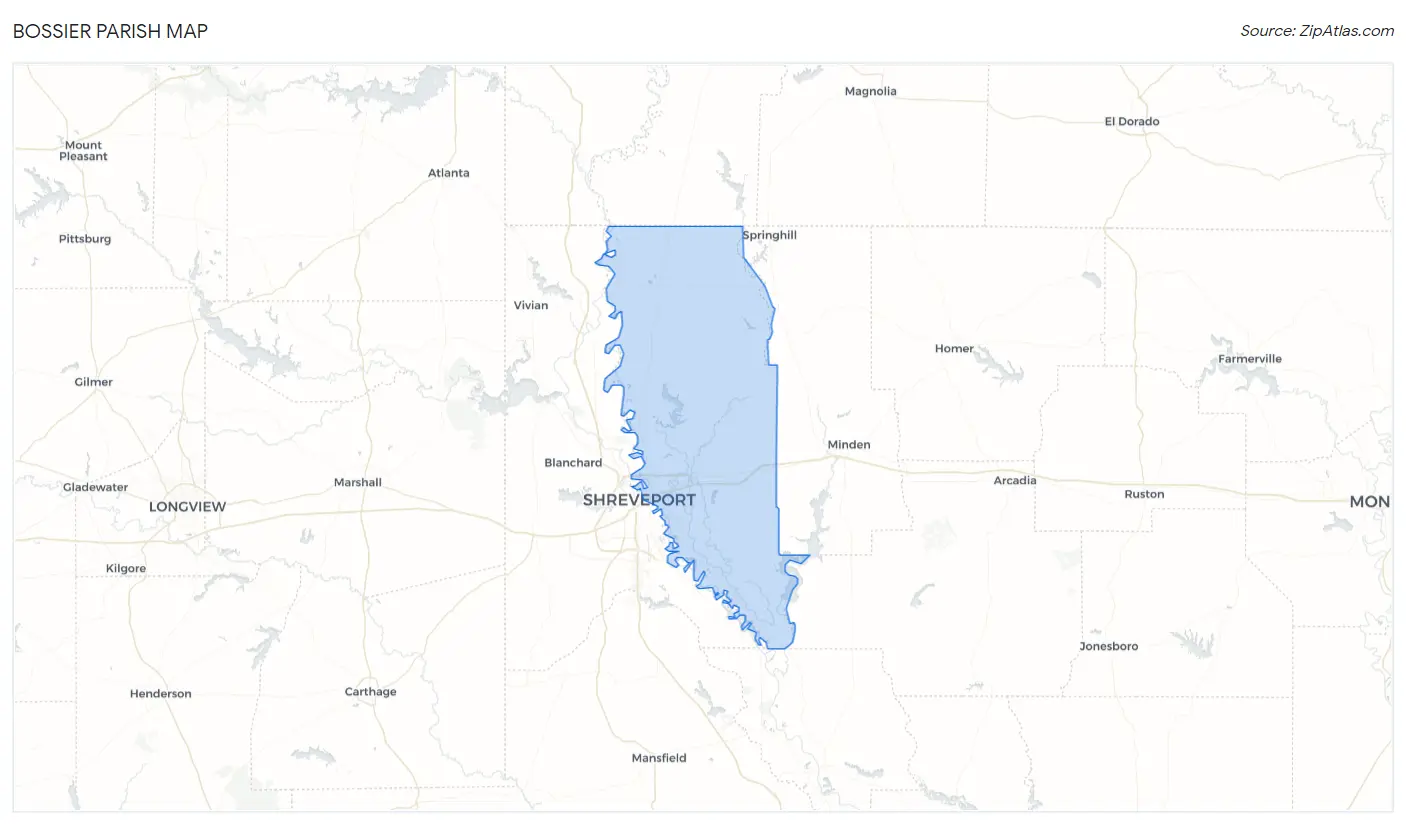
Bossier Parish Map
Bossier Parish Overview
128,877
TOTAL POPULATION
64,006
MALE POPULATION
64,871
FEMALE POPULATION
98.67
MALES / 100 FEMALES
101.35
FEMALES / 100 MALES
36.0
MEDIAN AGE
3.2
AVG FAMILY SIZE
2.6
AVG HOUSEHOLD SIZE
$33,873
PER CAPITA INCOME
$81,271
AVG FAMILY INCOME
$64,598
AVG HOUSEHOLD INCOME
39.4%
WAGE / INCOME GAP [ % ]
60.6¢/ $1
WAGE / INCOME GAP [ $ ]
$11,394
FAMILY INCOME DEFICIT
0.46
INEQUALITY / GINI INDEX
61,617
LABOR FORCE [ PEOPLE ]
61.2%
PERCENT IN LABOR FORCE
5.6%
UNEMPLOYMENT RATE
Bossier Parish Area Codes
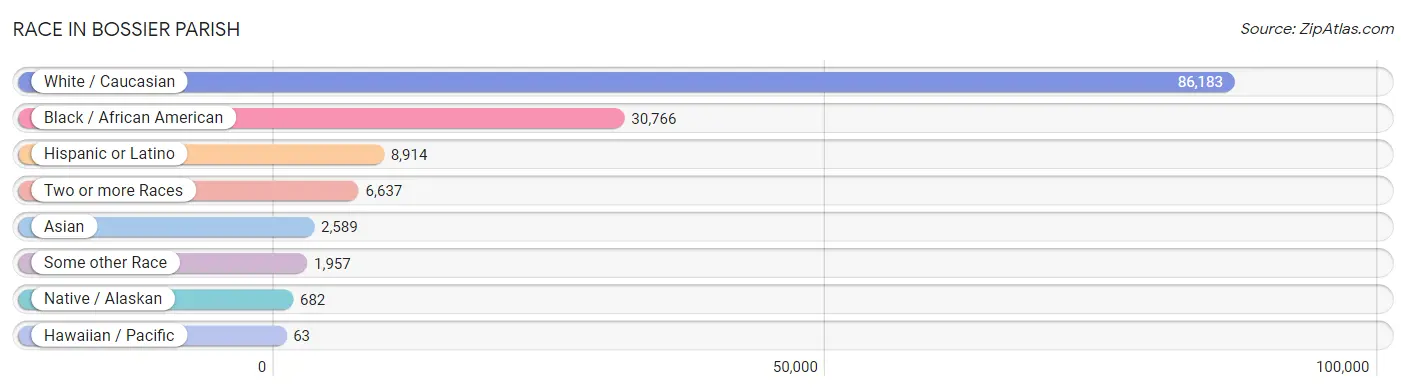
Race in Bossier Parish
The most populous races in Bossier Parish are White / Caucasian (86,183 | 66.9%), Black / African American (30,766 | 23.9%), and Hispanic or Latino (8,914 | 6.9%).
| Race | # Population | % Population |
| Asian | 2,589 | 2.0% |
| Black / African American | 30,766 | 23.9% |
| Hawaiian / Pacific | 63 | 0.1% |
| Hispanic or Latino | 8,914 | 6.9% |
| Native / Alaskan | 682 | 0.5% |
| White / Caucasian | 86,183 | 66.9% |
| Two or more Races | 6,637 | 5.1% |
| Some other Race | 1,957 | 1.5% |
| Total | 128,877 | 100.0% |
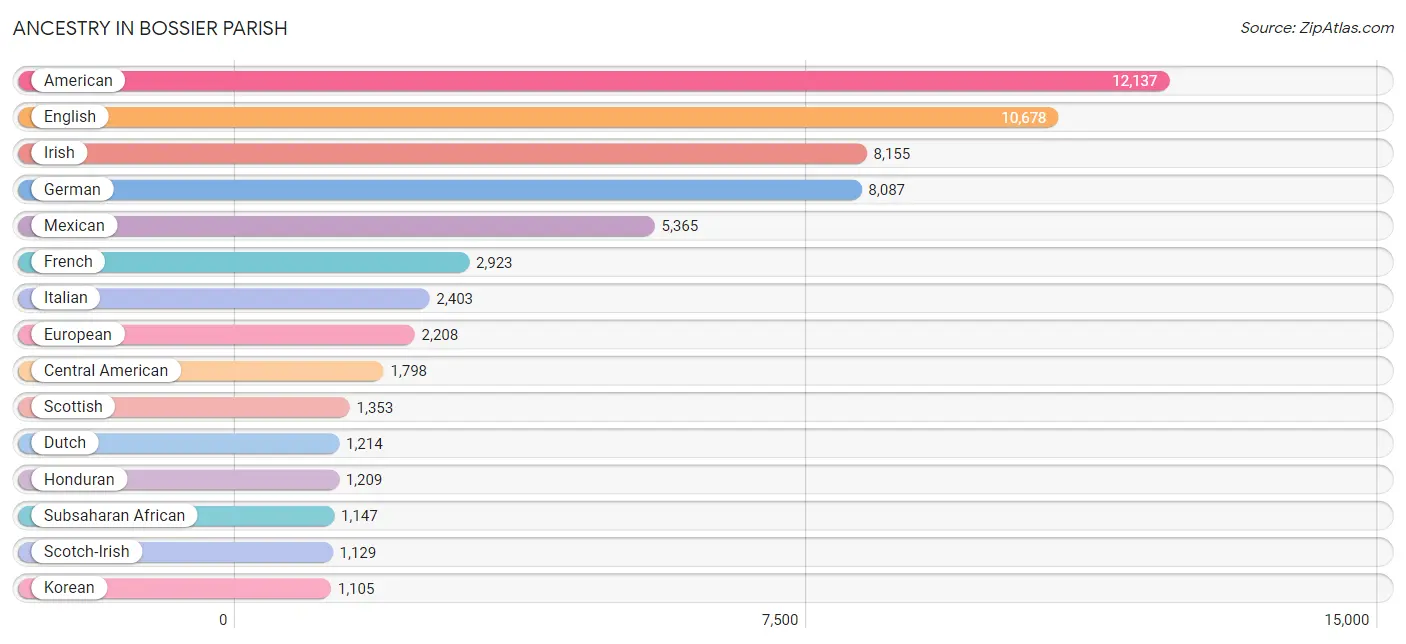
Ancestry in Bossier Parish
The most populous ancestries reported in Bossier Parish are American (12,137 | 9.4%), English (10,678 | 8.3%), Irish (8,155 | 6.3%), German (8,087 | 6.3%), and Mexican (5,365 | 4.2%), together accounting for 34.5% of all Bossier Parish residents.
| Ancestry | # Population | % Population |
| African | 948 | 0.7% |
| Albanian | 15 | 0.0% |
| American | 12,137 | 9.4% |
| Arab | 171 | 0.1% |
| Armenian | 10 | 0.0% |
| Austrian | 25 | 0.0% |
| Bahamian | 51 | 0.0% |
| Belgian | 51 | 0.0% |
| Belizean | 88 | 0.1% |
| Bhutanese | 394 | 0.3% |
| Blackfeet | 36 | 0.0% |
| Bolivian | 9 | 0.0% |
| Brazilian | 12 | 0.0% |
| British | 331 | 0.3% |
| British West Indian | 78 | 0.1% |
| Burmese | 351 | 0.3% |
| Cajun | 381 | 0.3% |
| Canadian | 86 | 0.1% |
| Central American | 1,798 | 1.4% |
| Central American Indian | 202 | 0.2% |
| Cherokee | 266 | 0.2% |
| Chickasaw | 23 | 0.0% |
| Chippewa | 47 | 0.0% |
| Choctaw | 80 | 0.1% |
| Colombian | 114 | 0.1% |
| Comanche | 29 | 0.0% |
| Creek | 8 | 0.0% |
| Cuban | 94 | 0.1% |
| Czech | 153 | 0.1% |
| Czechoslovakian | 95 | 0.1% |
| Danish | 76 | 0.1% |
| Dominican | 334 | 0.3% |
| Dutch | 1,214 | 0.9% |
| Eastern European | 28 | 0.0% |
| Egyptian | 36 | 0.0% |
| English | 10,678 | 8.3% |
| Ethiopian | 87 | 0.1% |
| European | 2,208 | 1.7% |
| Filipino | 20 | 0.0% |
| Finnish | 75 | 0.1% |
| French | 2,923 | 2.3% |
| French Canadian | 523 | 0.4% |
| German | 8,087 | 6.3% |
| Greek | 22 | 0.0% |
| Guamanian / Chamorro | 54 | 0.0% |
| Guatemalan | 333 | 0.3% |
| Guyanese | 16 | 0.0% |
| Haitian | 44 | 0.0% |
| Honduran | 1,209 | 0.9% |
| Houma | 105 | 0.1% |
| Hungarian | 446 | 0.4% |
| Indian (Asian) | 492 | 0.4% |
| Indonesian | 51 | 0.0% |
| Iranian | 10 | 0.0% |
| Irish | 8,155 | 6.3% |
| Israeli | 109 | 0.1% |
| Italian | 2,403 | 1.9% |
| Jamaican | 43 | 0.0% |
| Japanese | 53 | 0.0% |
| Jordanian | 27 | 0.0% |
| Kenyan | 43 | 0.0% |
| Korean | 1,105 | 0.9% |
| Lebanese | 88 | 0.1% |
| Lithuanian | 92 | 0.1% |
| Mexican | 5,365 | 4.2% |
| Mexican American Indian | 74 | 0.1% |
| Native Hawaiian | 35 | 0.0% |
| Navajo | 98 | 0.1% |
| Nicaraguan | 91 | 0.1% |
| Nigerian | 35 | 0.0% |
| Northern European | 28 | 0.0% |
| Norwegian | 787 | 0.6% |
| Pakistani | 71 | 0.1% |
| Palestinian | 5 | 0.0% |
| Panamanian | 10 | 0.0% |
| Pennsylvania German | 19 | 0.0% |
| Polish | 710 | 0.5% |
| Portuguese | 129 | 0.1% |
| Potawatomi | 5 | 0.0% |
| Puerto Rican | 450 | 0.4% |
| Romanian | 15 | 0.0% |
| Russian | 27 | 0.0% |
| Salvadoran | 155 | 0.1% |
| Scandinavian | 412 | 0.3% |
| Scotch-Irish | 1,129 | 0.9% |
| Scottish | 1,353 | 1.1% |
| Serbian | 76 | 0.1% |
| Slavic | 14 | 0.0% |
| Slovak | 56 | 0.0% |
| Slovene | 17 | 0.0% |
| South American | 133 | 0.1% |
| South American Indian | 3 | 0.0% |
| Spaniard | 98 | 0.1% |
| Spanish | 288 | 0.2% |
| Sri Lankan | 547 | 0.4% |
| Subsaharan African | 1,147 | 0.9% |
| Swedish | 331 | 0.3% |
| Swiss | 59 | 0.1% |
| Thai | 431 | 0.3% |
| Tlingit-Haida | 33 | 0.0% |
| Trinidadian and Tobagonian | 8 | 0.0% |
| Ukrainian | 69 | 0.1% |
| Venezuelan | 10 | 0.0% |
| Welsh | 375 | 0.3% |
| West Indian | 154 | 0.1% |
| Yugoslavian | 8 | 0.0% | View All 106 Rows |
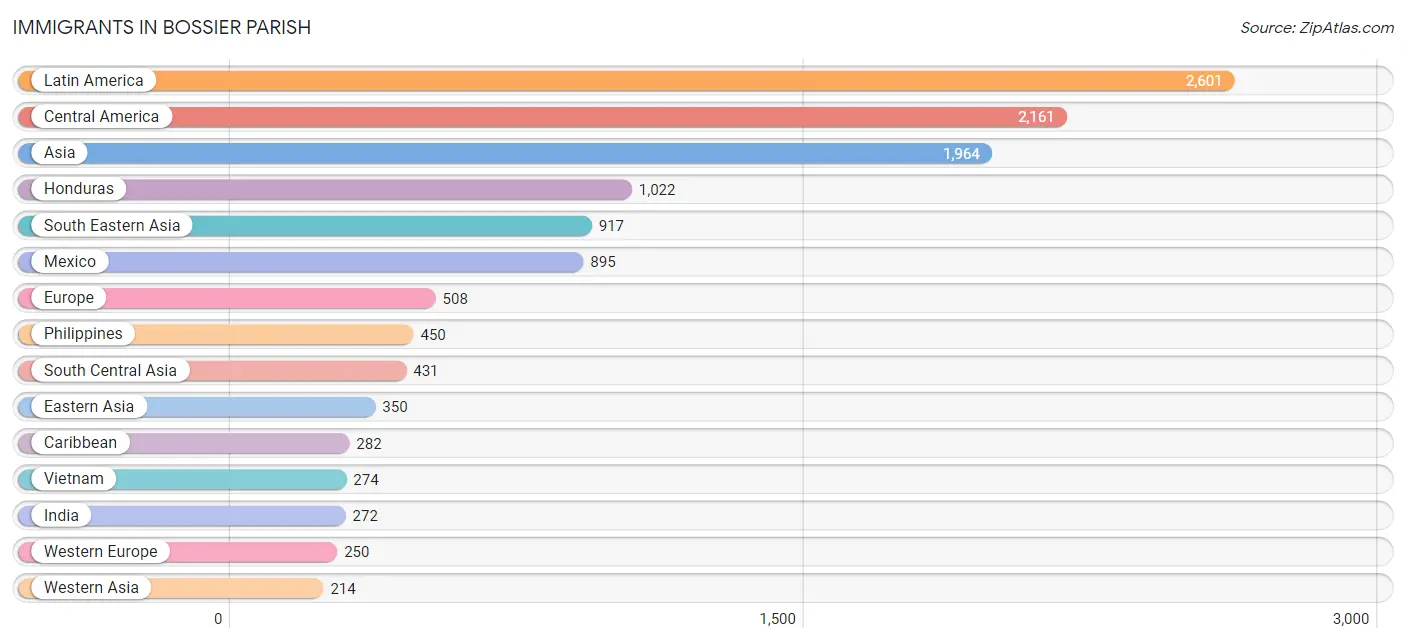
Immigrants in Bossier Parish
The most numerous immigrant groups reported in Bossier Parish came from Latin America (2,601 | 2.0%), Central America (2,161 | 1.7%), Asia (1,964 | 1.5%), Honduras (1,022 | 0.8%), and South Eastern Asia (917 | 0.7%), together accounting for 6.7% of all Bossier Parish residents.
| Immigration Origin | # Population | % Population |
| Africa | 154 | 0.1% |
| Asia | 1,964 | 1.5% |
| Azores | 18 | 0.0% |
| Bahamas | 9 | 0.0% |
| Belgium | 32 | 0.0% |
| Belize | 122 | 0.1% |
| Brazil | 12 | 0.0% |
| Canada | 44 | 0.0% |
| Caribbean | 282 | 0.2% |
| Central America | 2,161 | 1.7% |
| Chile | 7 | 0.0% |
| China | 130 | 0.1% |
| Colombia | 75 | 0.1% |
| Cuba | 46 | 0.0% |
| Dominican Republic | 172 | 0.1% |
| Eastern Africa | 87 | 0.1% |
| Eastern Asia | 350 | 0.3% |
| Eastern Europe | 72 | 0.1% |
| Egypt | 36 | 0.0% |
| El Salvador | 23 | 0.0% |
| England | 87 | 0.1% |
| Ethiopia | 30 | 0.0% |
| Europe | 508 | 0.4% |
| France | 14 | 0.0% |
| Germany | 194 | 0.2% |
| Ghana | 16 | 0.0% |
| Guatemala | 94 | 0.1% |
| Honduras | 1,022 | 0.8% |
| India | 272 | 0.2% |
| Israel | 114 | 0.1% |
| Italy | 24 | 0.0% |
| Jamaica | 11 | 0.0% |
| Japan | 102 | 0.1% |
| Jordan | 67 | 0.1% |
| Kenya | 57 | 0.0% |
| Korea | 118 | 0.1% |
| Kuwait | 9 | 0.0% |
| Latin America | 2,601 | 2.0% |
| Malaysia | 16 | 0.0% |
| Mexico | 895 | 0.7% |
| Netherlands | 10 | 0.0% |
| Nicaragua | 5 | 0.0% |
| Nigeria | 15 | 0.0% |
| Northern Africa | 36 | 0.0% |
| Northern Europe | 144 | 0.1% |
| Pakistan | 159 | 0.1% |
| Philippines | 450 | 0.4% |
| Portugal | 18 | 0.0% |
| Romania | 15 | 0.0% |
| South America | 158 | 0.1% |
| South Central Asia | 431 | 0.3% |
| South Eastern Asia | 917 | 0.7% |
| Southern Europe | 42 | 0.0% |
| Taiwan | 39 | 0.0% |
| Thailand | 162 | 0.1% |
| Trinidad and Tobago | 6 | 0.0% |
| Ukraine | 57 | 0.0% |
| Venezuela | 64 | 0.1% |
| Vietnam | 274 | 0.2% |
| Western Africa | 31 | 0.0% |
| Western Asia | 214 | 0.2% |
| Western Europe | 250 | 0.2% | View All 62 Rows |
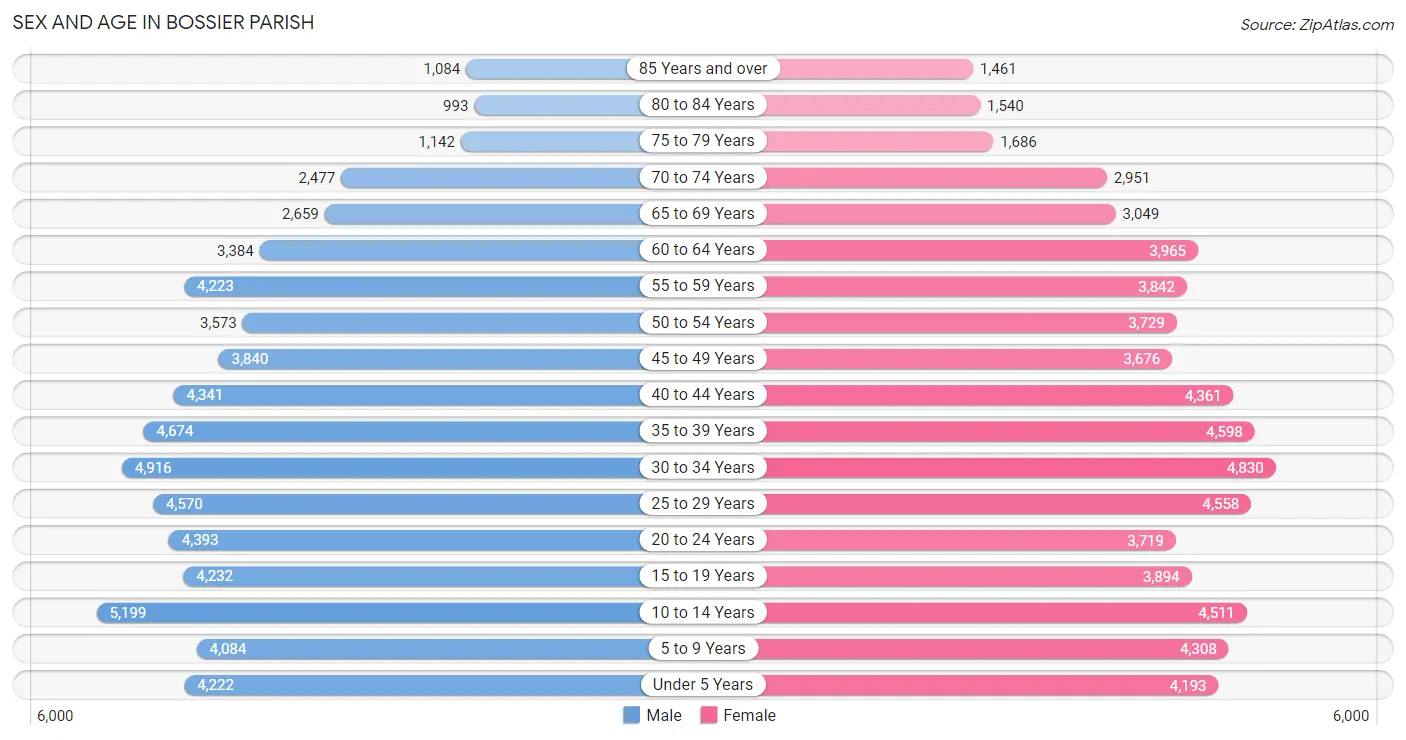
Sex and Age in Bossier Parish
Sex and Age in Bossier Parish
The most populous age groups in Bossier Parish are 10 to 14 Years (5,199 | 8.1%) for men and 30 to 34 Years (4,830 | 7.4%) for women.
| Age Bracket | Male | Female |
| Under 5 Years | 4,222 (6.6%) | 4,193 (6.5%) |
| 5 to 9 Years | 4,084 (6.4%) | 4,308 (6.6%) |
| 10 to 14 Years | 5,199 (8.1%) | 4,511 (7.0%) |
| 15 to 19 Years | 4,232 (6.6%) | 3,894 (6.0%) |
| 20 to 24 Years | 4,393 (6.9%) | 3,719 (5.7%) |
| 25 to 29 Years | 4,570 (7.1%) | 4,558 (7.0%) |
| 30 to 34 Years | 4,916 (7.7%) | 4,830 (7.4%) |
| 35 to 39 Years | 4,674 (7.3%) | 4,598 (7.1%) |
| 40 to 44 Years | 4,341 (6.8%) | 4,361 (6.7%) |
| 45 to 49 Years | 3,840 (6.0%) | 3,676 (5.7%) |
| 50 to 54 Years | 3,573 (5.6%) | 3,729 (5.8%) |
| 55 to 59 Years | 4,223 (6.6%) | 3,842 (5.9%) |
| 60 to 64 Years | 3,384 (5.3%) | 3,965 (6.1%) |
| 65 to 69 Years | 2,659 (4.2%) | 3,049 (4.7%) |
| 70 to 74 Years | 2,477 (3.9%) | 2,951 (4.5%) |
| 75 to 79 Years | 1,142 (1.8%) | 1,686 (2.6%) |
| 80 to 84 Years | 993 (1.5%) | 1,540 (2.4%) |
| 85 Years and over | 1,084 (1.7%) | 1,461 (2.2%) |
| Total | 64,006 (100.0%) | 64,871 (100.0%) |
Families and Households in Bossier Parish
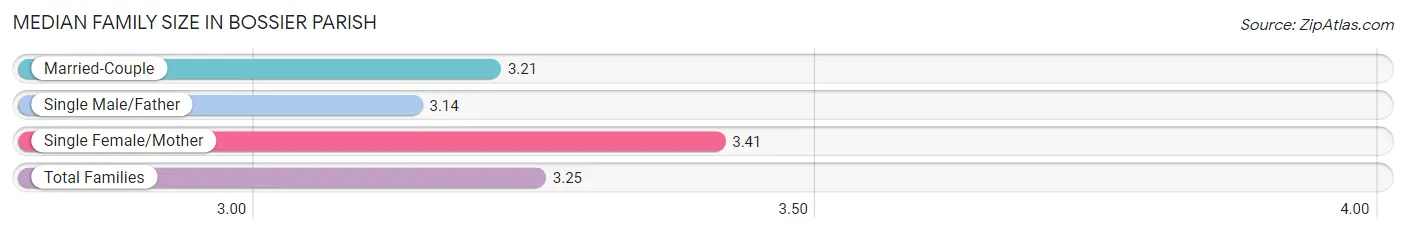
Median Family Size in Bossier Parish
The median family size in Bossier Parish is 3.25 persons per family, with single female/mother families (6,553 | 20.7%) accounting for the largest median family size of 3.41 persons per family. On the other hand, single male/father families (2,511 | 7.9%) represent the smallest median family size with 3.14 persons per family.
| Family Type | # Families | Family Size |
| Married-Couple | 22,589 (71.4%) | 3.21 |
| Single Male/Father | 2,511 (7.9%) | 3.14 |
| Single Female/Mother | 6,553 (20.7%) | 3.41 |
| Total Families | 31,653 (100.0%) | 3.25 |
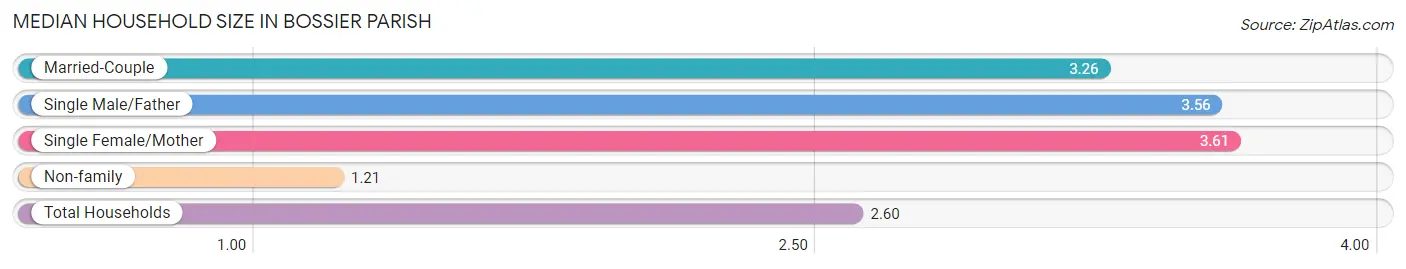
Median Household Size in Bossier Parish
The median household size in Bossier Parish is 2.60 persons per household, with single female/mother households (6,553 | 13.5%) accounting for the largest median household size of 3.61 persons per household. non-family households (16,998 | 34.9%) represent the smallest median household size with 1.21 persons per household.
| Household Type | # Households | Household Size |
| Married-Couple | 22,589 (46.4%) | 3.26 |
| Single Male/Father | 2,511 (5.2%) | 3.56 |
| Single Female/Mother | 6,553 (13.5%) | 3.61 |
| Non-family | 16,998 (34.9%) | 1.21 |
| Total Households | 48,651 (100.0%) | 2.60 |
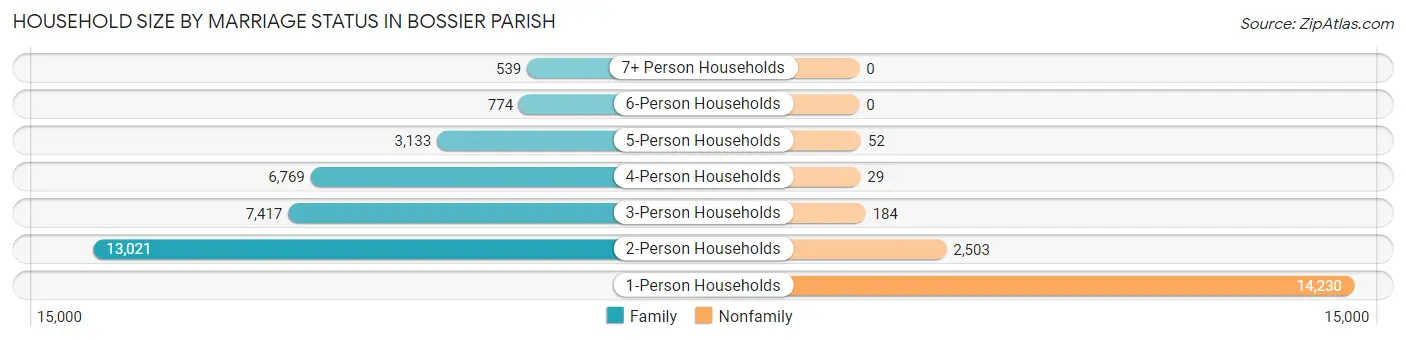
Household Size by Marriage Status in Bossier Parish
Out of a total of 48,651 households in Bossier Parish, 31,653 (65.1%) are family households, while 16,998 (34.9%) are nonfamily households. The most numerous type of family households are 2-person households, comprising 13,021, and the most common type of nonfamily households are 1-person households, comprising 14,230.
| Household Size | Family Households | Nonfamily Households |
| 1-Person Households | - | 14,230 (29.2%) |
| 2-Person Households | 13,021 (26.8%) | 2,503 (5.1%) |
| 3-Person Households | 7,417 (15.2%) | 184 (0.4%) |
| 4-Person Households | 6,769 (13.9%) | 29 (0.1%) |
| 5-Person Households | 3,133 (6.4%) | 52 (0.1%) |
| 6-Person Households | 774 (1.6%) | 0 (0.0%) |
| 7+ Person Households | 539 (1.1%) | 0 (0.0%) |
| Total | 31,653 (65.1%) | 16,998 (34.9%) |
Female Fertility in Bossier Parish
Fertility by Age in Bossier Parish
Average fertility rate in Bossier Parish is 40.0 births per 1,000 women. Women in the age bracket of 20 to 34 years have the highest fertility rate with 63.0 births per 1,000 women. Women in the age bracket of 20 to 34 years acount for 68.5% of all women with births.
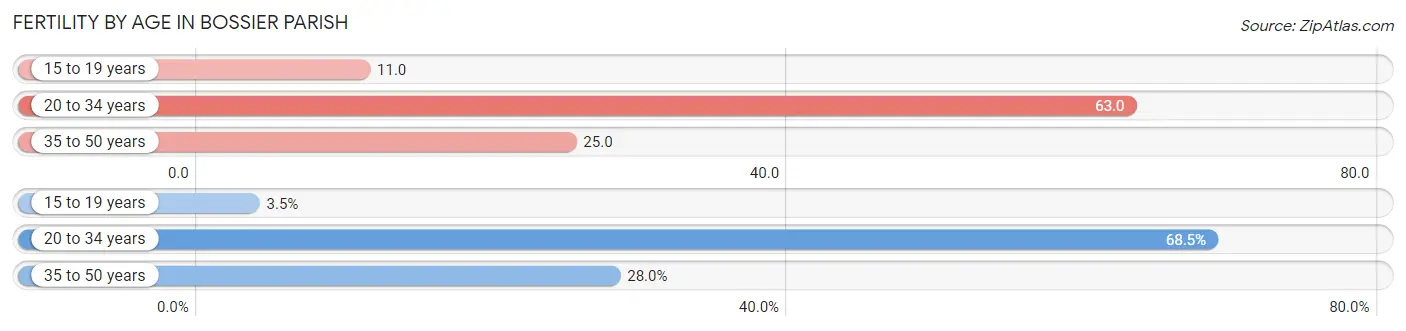
| Age Bracket | Women with Births | Births / 1,000 Women |
| 15 to 19 years | 42 (3.5%) | 11.0 |
| 20 to 34 years | 823 (68.5%) | 63.0 |
| 35 to 50 years | 336 (28.0%) | 25.0 |
| Total | 1,201 (100.0%) | 40.0 |
Fertility by Age by Marriage Status in Bossier Parish
68.3% of women with births (1,201) in Bossier Parish are married. The highest percentage of unmarried women with births falls into 15 to 19 years age bracket with 71.4% of them unmarried at the time of birth, while the lowest percentage of unmarried women with births belong to 35 to 50 years age bracket with 14.6% of them unmarried.
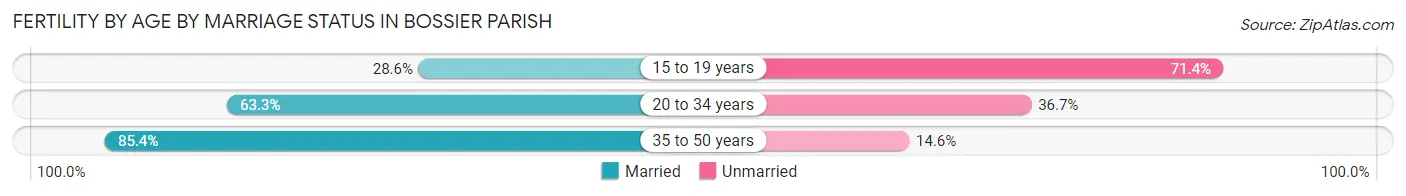
| Age Bracket | Married | Unmarried |
| 15 to 19 years | 12 (28.6%) | 30 (71.4%) |
| 20 to 34 years | 521 (63.3%) | 302 (36.7%) |
| 35 to 50 years | 287 (85.4%) | 49 (14.6%) |
| Total | 820 (68.3%) | 381 (31.7%) |
Fertility by Education in Bossier Parish
Average fertility rate in Bossier Parish is 40.0 births per 1,000 women. Women with the education attainment of bachelor's degree have the highest fertility rate of 75.0 births per 1,000 women, while women with the education attainment of less than high school have the lowest fertility at 20.0 births per 1,000 women. Women with the education attainment of bachelor's degree represent 36.0% of all women with births.
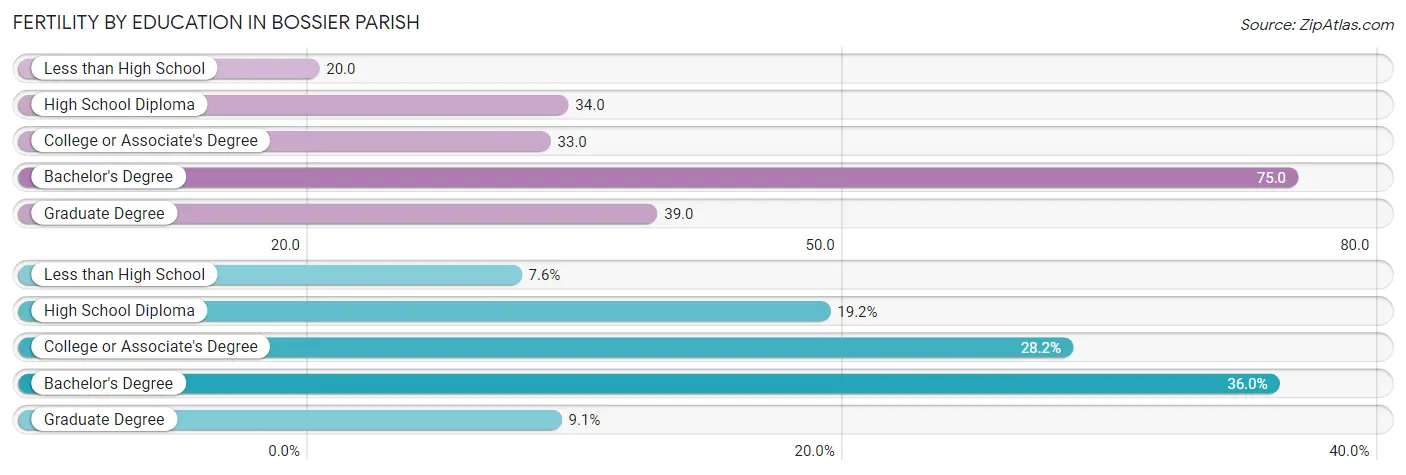
| Educational Attainment | Women with Births | Births / 1,000 Women |
| Less than High School | 91 (7.6%) | 20.0 |
| High School Diploma | 230 (19.2%) | 34.0 |
| College or Associate's Degree | 339 (28.2%) | 33.0 |
| Bachelor's Degree | 432 (36.0%) | 75.0 |
| Graduate Degree | 109 (9.1%) | 39.0 |
| Total | 1,201 (100.0%) | 40.0 |
Fertility by Education by Marriage Status in Bossier Parish
31.7% of women with births in Bossier Parish are unmarried. Women with the educational attainment of graduate degree are most likely to be married with 100.0% of them married at childbirth, while women with the educational attainment of less than high school are least likely to be married with 73.6% of them unmarried at childbirth.
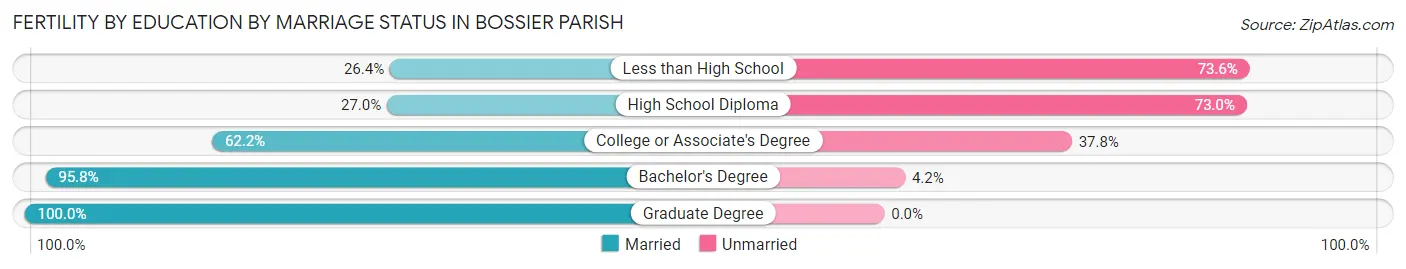
| Educational Attainment | Married | Unmarried |
| Less than High School | 24 (26.4%) | 67 (73.6%) |
| High School Diploma | 62 (27.0%) | 168 (73.0%) |
| College or Associate's Degree | 211 (62.2%) | 128 (37.8%) |
| Bachelor's Degree | 414 (95.8%) | 18 (4.2%) |
| Graduate Degree | 109 (100.0%) | 0 (0.0%) |
| Total | 820 (68.3%) | 381 (31.7%) |
Income in Bossier Parish
Income Overview in Bossier Parish
Per Capita Income in Bossier Parish is $33,873, while median incomes of families and households are $81,271 and $64,598 respectively.
| Characteristic | Number | Measure |
| Per Capita Income | 128,877 | $33,873 |
| Median Family Income | 31,653 | $81,271 |
| Mean Family Income | 31,653 | $99,902 |
| Median Household Income | 48,651 | $64,598 |
| Mean Household Income | 48,651 | $85,431 |
| Income Deficit | 31,653 | $11,394 |
| Wage / Income Gap (%) | 128,877 | 39.36% |
| Wage / Income Gap ($) | 128,877 | 60.64¢ per $1 |
| Gini / Inequality Index | 128,877 | 0.46 |
Earnings by Sex in Bossier Parish
Average Earnings in Bossier Parish are $39,728, $48,335 for men and $29,309 for women, a difference of 39.4%.
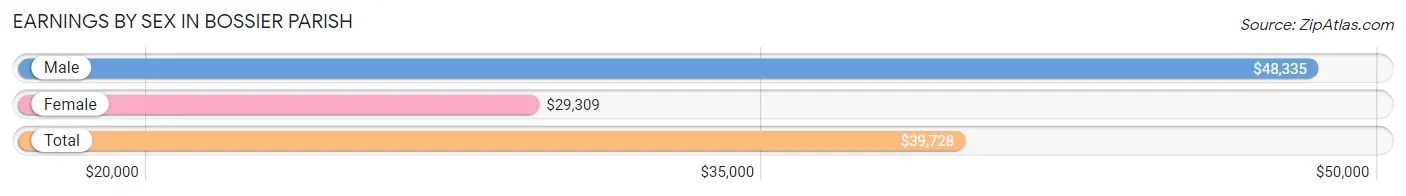
| Sex | Number | Average Earnings |
| Male | 34,572 (54.1%) | $48,335 |
| Female | 29,351 (45.9%) | $29,309 |
| Total | 63,923 (100.0%) | $39,728 |
Earnings by Sex by Income Bracket in Bossier Parish
The most common earnings brackets in Bossier Parish are $100,000+ for men (5,991 | 17.3%) and $55,000 to $64,999 for women (2,509 | 8.6%).
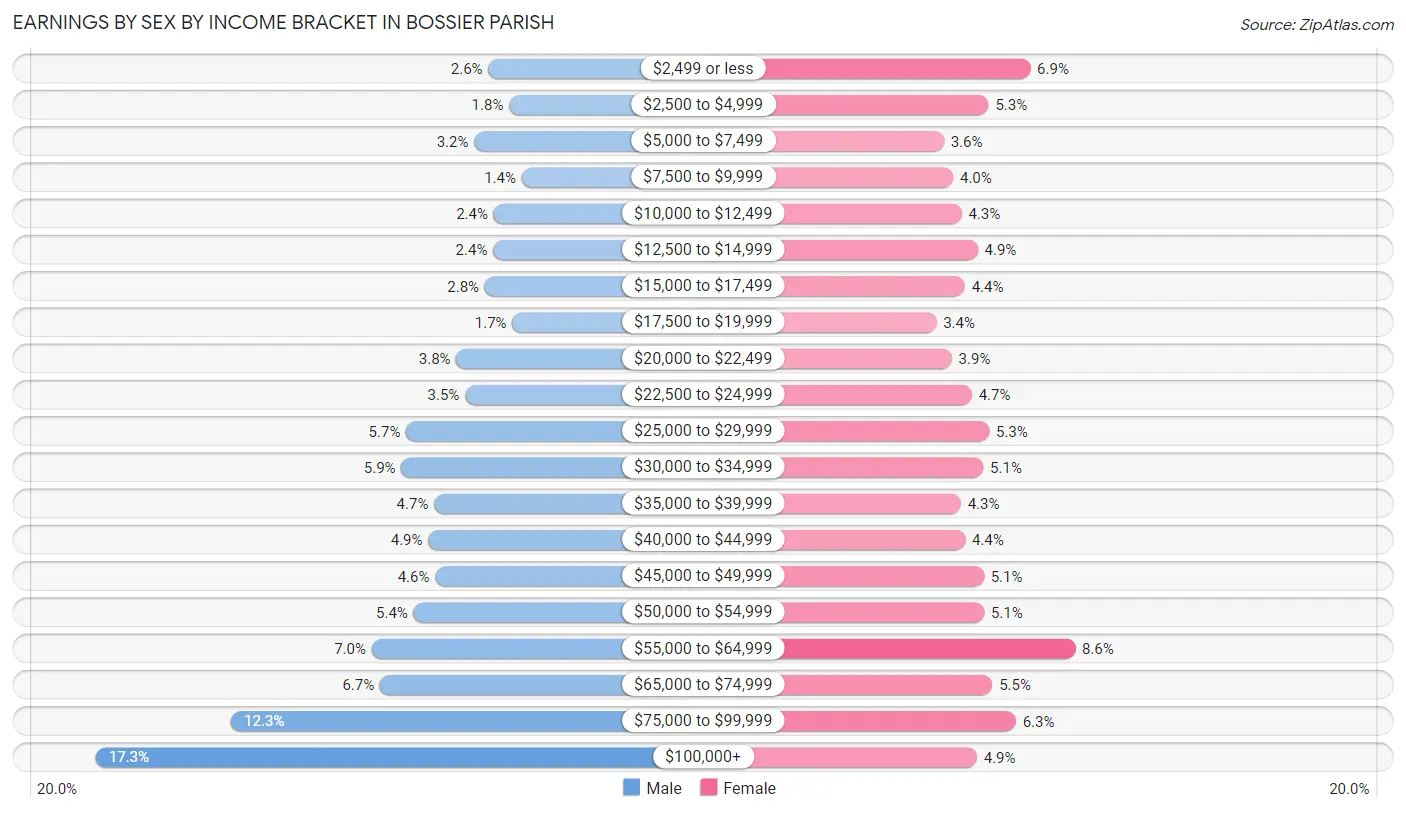
| Income | Male | Female |
| $2,499 or less | 906 (2.6%) | 2,017 (6.9%) |
| $2,500 to $4,999 | 637 (1.8%) | 1,559 (5.3%) |
| $5,000 to $7,499 | 1,088 (3.2%) | 1,066 (3.6%) |
| $7,500 to $9,999 | 475 (1.4%) | 1,167 (4.0%) |
| $10,000 to $12,499 | 836 (2.4%) | 1,263 (4.3%) |
| $12,500 to $14,999 | 843 (2.4%) | 1,439 (4.9%) |
| $15,000 to $17,499 | 951 (2.8%) | 1,298 (4.4%) |
| $17,500 to $19,999 | 594 (1.7%) | 984 (3.4%) |
| $20,000 to $22,499 | 1,321 (3.8%) | 1,154 (3.9%) |
| $22,500 to $24,999 | 1,205 (3.5%) | 1,374 (4.7%) |
| $25,000 to $29,999 | 1,970 (5.7%) | 1,563 (5.3%) |
| $30,000 to $34,999 | 2,032 (5.9%) | 1,499 (5.1%) |
| $35,000 to $39,999 | 1,606 (4.6%) | 1,253 (4.3%) |
| $40,000 to $44,999 | 1,684 (4.9%) | 1,301 (4.4%) |
| $45,000 to $49,999 | 1,595 (4.6%) | 1,506 (5.1%) |
| $50,000 to $54,999 | 1,873 (5.4%) | 1,510 (5.1%) |
| $55,000 to $64,999 | 2,415 (7.0%) | 2,509 (8.6%) |
| $65,000 to $74,999 | 2,311 (6.7%) | 1,601 (5.4%) |
| $75,000 to $99,999 | 4,239 (12.3%) | 1,859 (6.3%) |
| $100,000+ | 5,991 (17.3%) | 1,429 (4.9%) |
| Total | 34,572 (100.0%) | 29,351 (100.0%) |
Earnings by Sex by Educational Attainment in Bossier Parish
Average earnings in Bossier Parish are $53,680 for men and $34,954 for women, a difference of 34.9%. Men with an educational attainment of graduate degree enjoy the highest average annual earnings of $92,962, while those with less than high school education earn the least with $32,112. Women with an educational attainment of graduate degree earn the most with the average annual earnings of $58,678, while those with less than high school education have the smallest earnings of $17,589.
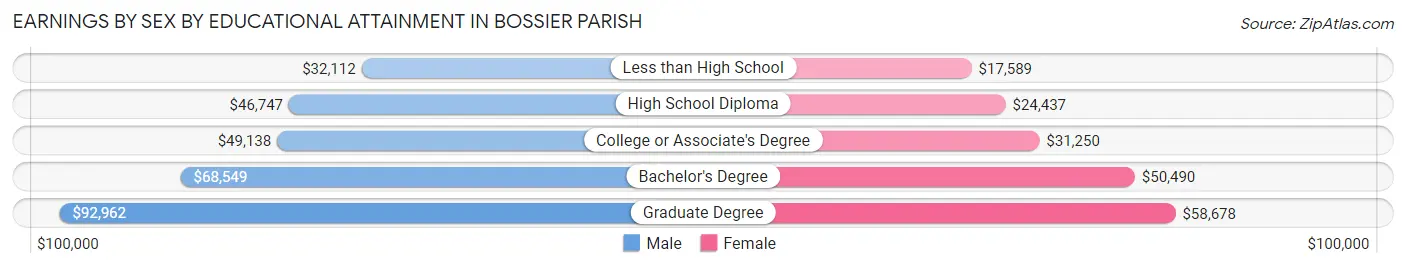
| Educational Attainment | Male Income | Female Income |
| Less than High School | $32,112 | $17,589 |
| High School Diploma | $46,747 | $24,437 |
| College or Associate's Degree | $49,138 | $31,250 |
| Bachelor's Degree | $68,549 | $50,490 |
| Graduate Degree | $92,962 | $58,678 |
| Total | $53,680 | $34,954 |
Family Income in Bossier Parish
Family Income Brackets in Bossier Parish
According to the Bossier Parish family income data, there are 6,710 families falling into the $100,000 to $149,999 income range, which is the most common income bracket and makes up 21.2% of all families. Conversely, the $10,000 to $14,999 income bracket is the least frequent group with only 886 families (2.8%) belonging to this category.
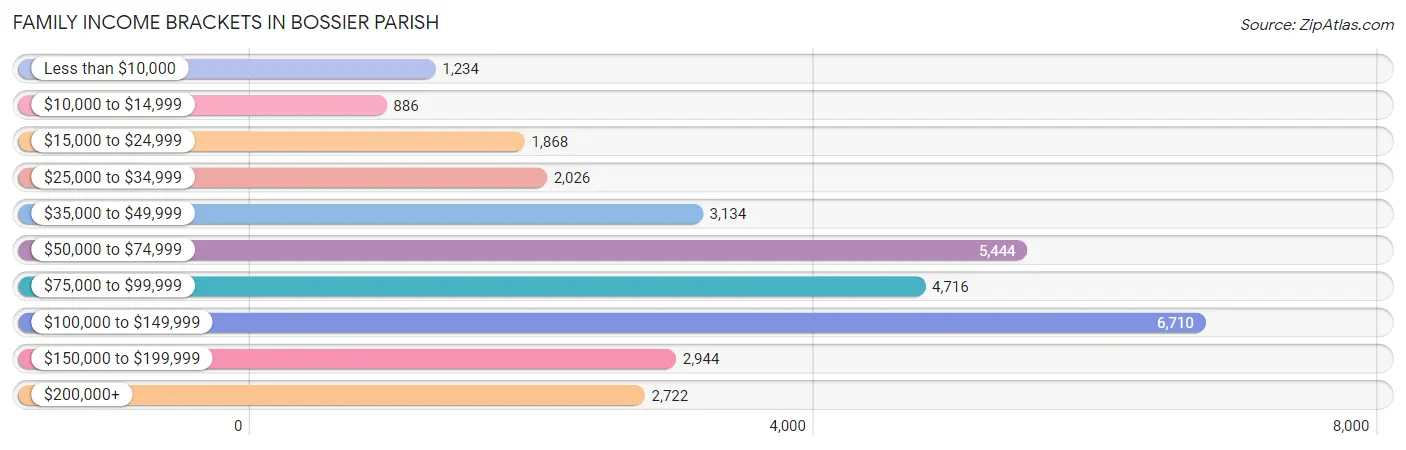
| Income Bracket | # Families | % Families |
| Less than $10,000 | 1,234 | 3.9% |
| $10,000 to $14,999 | 886 | 2.8% |
| $15,000 to $24,999 | 1,868 | 5.9% |
| $25,000 to $34,999 | 2,026 | 6.4% |
| $35,000 to $49,999 | 3,134 | 9.9% |
| $50,000 to $74,999 | 5,444 | 17.2% |
| $75,000 to $99,999 | 4,716 | 14.9% |
| $100,000 to $149,999 | 6,710 | 21.2% |
| $150,000 to $199,999 | 2,944 | 9.3% |
| $200,000+ | 2,722 | 8.6% |
Family Income by Famaliy Size in Bossier Parish
4-person families (6,253 | 19.8%) account for the highest median family income in Bossier Parish with $94,496 per family, while 2-person families (13,697 | 43.3%) have the highest median income of $39,261 per family member.
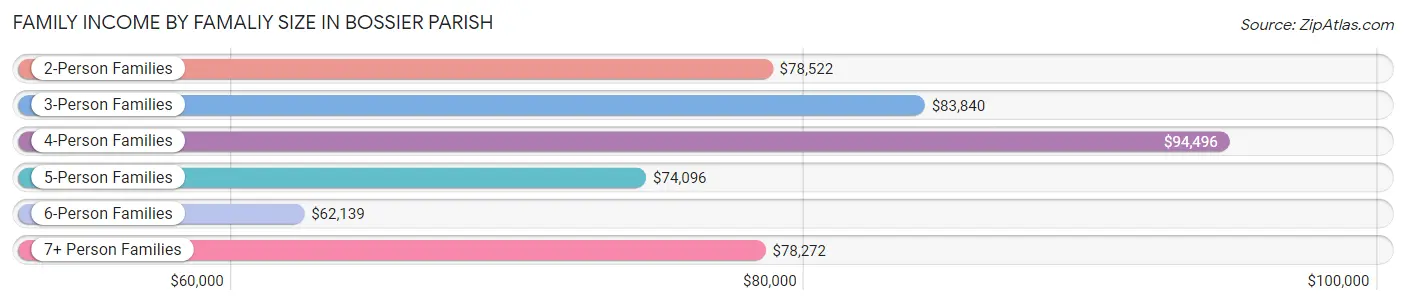
| Income Bracket | # Families | Median Income |
| 2-Person Families | 13,697 (43.3%) | $78,522 |
| 3-Person Families | 7,758 (24.5%) | $83,840 |
| 4-Person Families | 6,253 (19.8%) | $94,496 |
| 5-Person Families | 3,094 (9.8%) | $74,096 |
| 6-Person Families | 394 (1.2%) | $62,139 |
| 7+ Person Families | 457 (1.4%) | $78,272 |
| Total | 31,653 (100.0%) | $81,271 |
Family Income by Number of Earners in Bossier Parish
The median family income in Bossier Parish is $81,271, with families comprising 3+ earners (2,836) having the highest median family income of $119,848, while families with no earners (4,686) have the lowest median family income of $42,521, accounting for 9.0% and 14.8% of families, respectively.
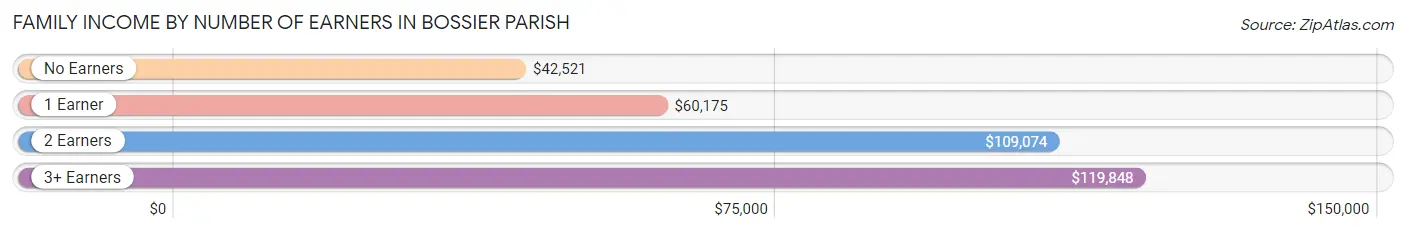
| Number of Earners | # Families | Median Income |
| No Earners | 4,686 (14.8%) | $42,521 |
| 1 Earner | 11,714 (37.0%) | $60,175 |
| 2 Earners | 12,417 (39.2%) | $109,074 |
| 3+ Earners | 2,836 (9.0%) | $119,848 |
| Total | 31,653 (100.0%) | $81,271 |
Household Income in Bossier Parish
Household Income Brackets in Bossier Parish
With 7,833 households falling in the category, the $100,000 to $149,999 income range is the most frequent in Bossier Parish, accounting for 16.1% of all households. In contrast, only 2,384 households (4.9%) fall into the less than $10,000 income bracket, making it the least populous group.
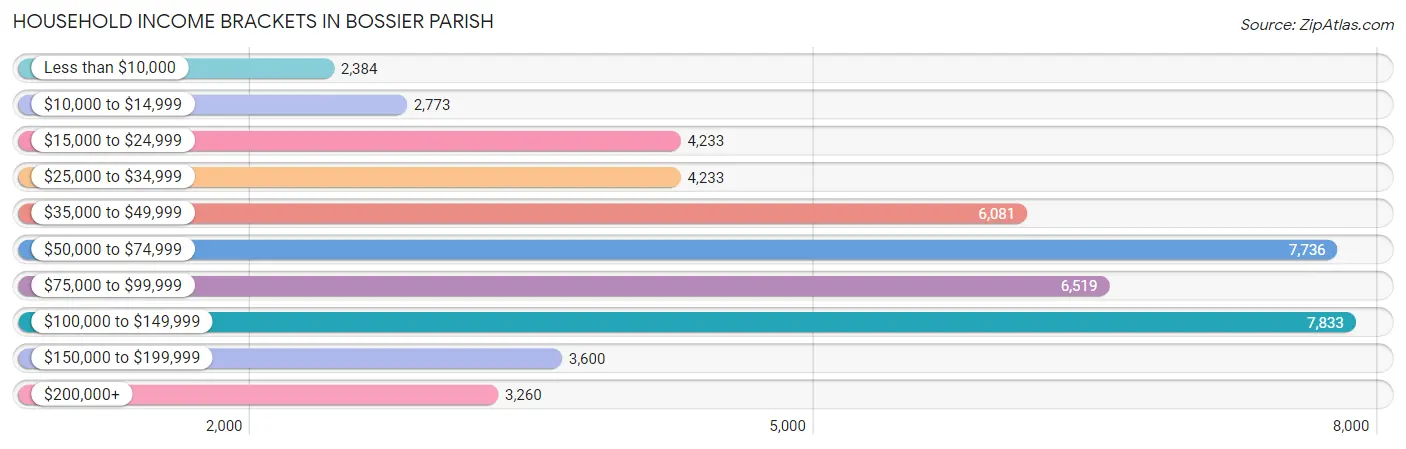
| Income Bracket | # Households | % Households |
| Less than $10,000 | 2,384 | 4.9% |
| $10,000 to $14,999 | 2,773 | 5.7% |
| $15,000 to $24,999 | 4,233 | 8.7% |
| $25,000 to $34,999 | 4,233 | 8.7% |
| $35,000 to $49,999 | 6,081 | 12.5% |
| $50,000 to $74,999 | 7,736 | 15.9% |
| $75,000 to $99,999 | 6,519 | 13.4% |
| $100,000 to $149,999 | 7,833 | 16.1% |
| $150,000 to $199,999 | 3,600 | 7.4% |
| $200,000+ | 3,260 | 6.7% |
Household Income by Householder Age in Bossier Parish
The median household income in Bossier Parish is $64,598, with the highest median household income of $73,799 found in the 45 to 64 years age bracket for the primary householder. A total of 16,372 households (33.7%) fall into this category. Meanwhile, the 15 to 24 years age bracket for the primary householder has the lowest median household income of $46,613, with 1,960 households (4.0%) in this group.
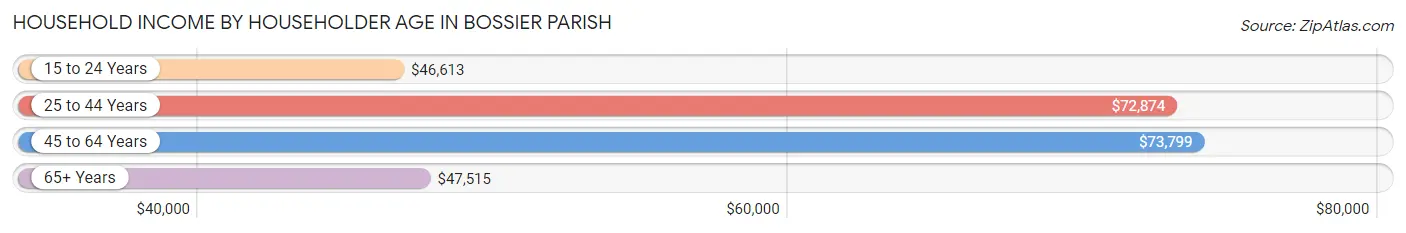
| Income Bracket | # Households | Median Income |
| 15 to 24 Years | 1,960 (4.0%) | $46,613 |
| 25 to 44 Years | 19,109 (39.3%) | $72,874 |
| 45 to 64 Years | 16,372 (33.7%) | $73,799 |
| 65+ Years | 11,210 (23.0%) | $47,515 |
| Total | 48,651 (100.0%) | $64,598 |
Poverty in Bossier Parish
Income Below Poverty by Sex and Age in Bossier Parish
With 15.6% poverty level for males and 17.7% for females among the residents of Bossier Parish, 5 year old males and under 5 year old females are the most vulnerable to poverty, with 331 males (43.3%) and 1,350 females (32.8%) in their respective age groups living below the poverty level.
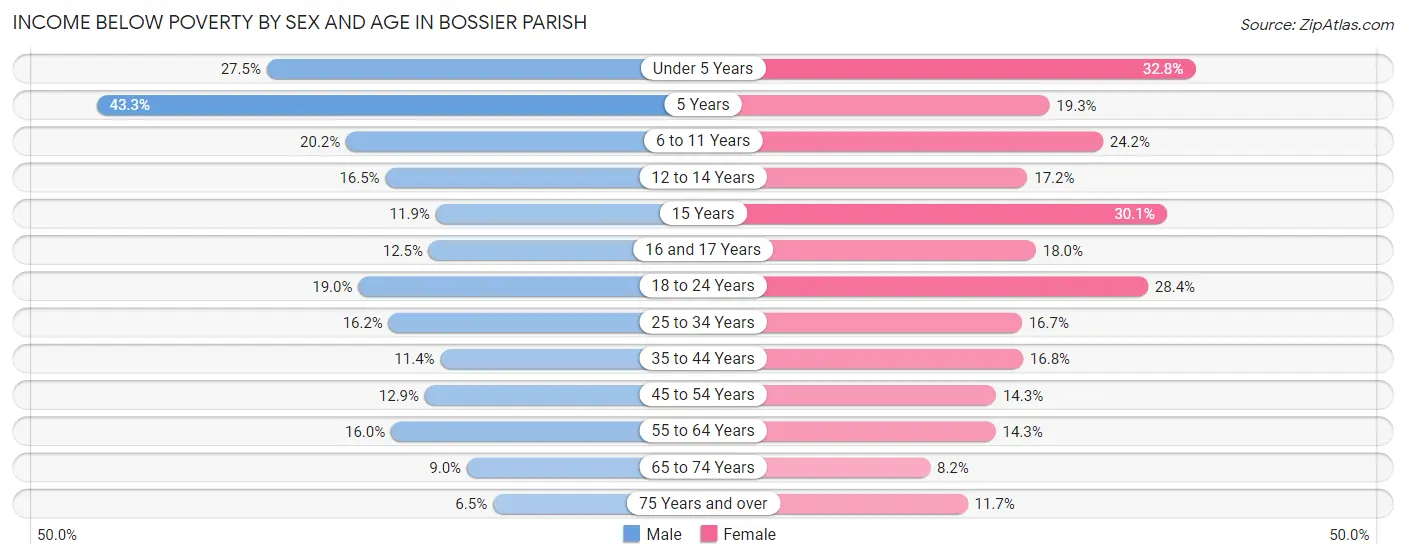
| Age Bracket | Male | Female |
| Under 5 Years | 1,139 (27.5%) | 1,350 (32.8%) |
| 5 Years | 331 (43.3%) | 122 (19.3%) |
| 6 to 11 Years | 1,113 (20.2%) | 1,163 (24.2%) |
| 12 to 14 Years | 468 (16.5%) | 567 (17.2%) |
| 15 Years | 110 (11.8%) | 226 (30.1%) |
| 16 and 17 Years | 218 (12.5%) | 324 (18.0%) |
| 18 to 24 Years | 1,028 (19.0%) | 1,375 (28.4%) |
| 25 to 34 Years | 1,491 (16.2%) | 1,561 (16.7%) |
| 35 to 44 Years | 1,017 (11.4%) | 1,504 (16.8%) |
| 45 to 54 Years | 945 (12.9%) | 1,057 (14.3%) |
| 55 to 64 Years | 1,201 (16.0%) | 1,114 (14.3%) |
| 65 to 74 Years | 448 (8.9%) | 489 (8.2%) |
| 75 Years and over | 202 (6.5%) | 511 (11.7%) |
| Total | 9,711 (15.6%) | 11,363 (17.7%) |
Income Above Poverty by Sex and Age in Bossier Parish
According to the poverty statistics in Bossier Parish, males aged 75 years and over and females aged 65 to 74 years are the age groups that are most secure financially, with 93.5% of males and 91.8% of females in these age groups living above the poverty line.
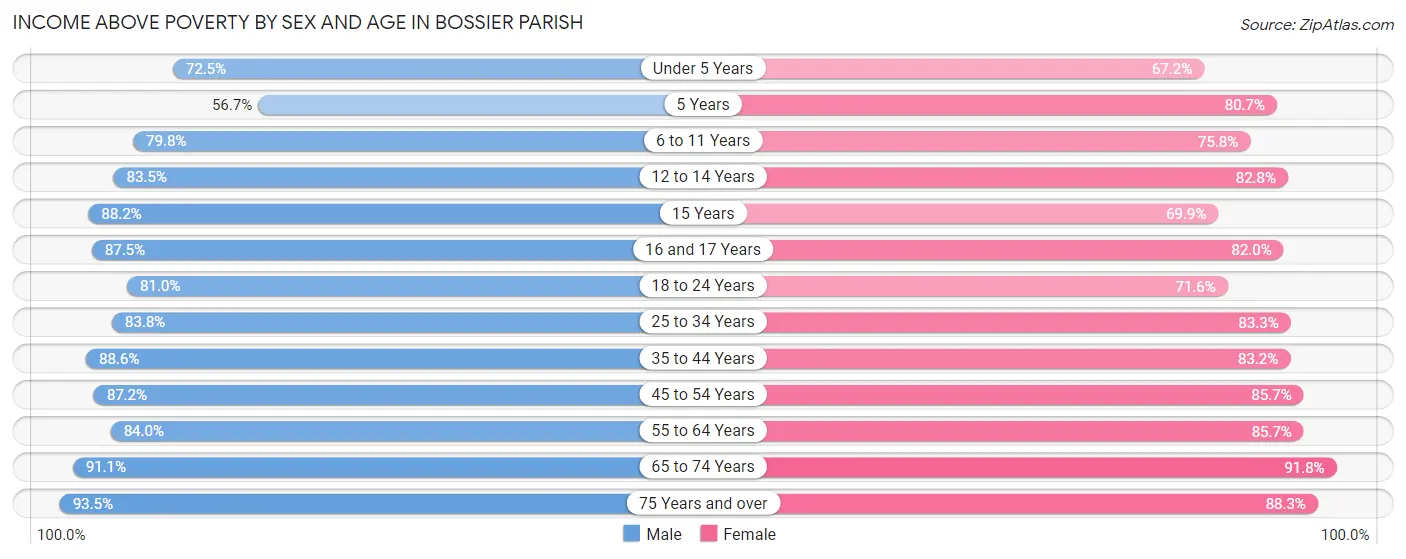
| Age Bracket | Male | Female |
| Under 5 Years | 2,998 (72.5%) | 2,768 (67.2%) |
| 5 Years | 433 (56.7%) | 511 (80.7%) |
| 6 to 11 Years | 4,407 (79.8%) | 3,639 (75.8%) |
| 12 to 14 Years | 2,366 (83.5%) | 2,726 (82.8%) |
| 15 Years | 818 (88.1%) | 524 (69.9%) |
| 16 and 17 Years | 1,527 (87.5%) | 1,475 (82.0%) |
| 18 to 24 Years | 4,373 (81.0%) | 3,465 (71.6%) |
| 25 to 34 Years | 7,709 (83.8%) | 7,785 (83.3%) |
| 35 to 44 Years | 7,897 (88.6%) | 7,444 (83.2%) |
| 45 to 54 Years | 6,411 (87.2%) | 6,327 (85.7%) |
| 55 to 64 Years | 6,309 (84.0%) | 6,693 (85.7%) |
| 65 to 74 Years | 4,555 (91.0%) | 5,483 (91.8%) |
| 75 Years and over | 2,893 (93.5%) | 3,868 (88.3%) |
| Total | 52,696 (84.4%) | 52,708 (82.3%) |
Income Below Poverty Among Married-Couple Families in Bossier Parish
The poverty statistics for married-couple families in Bossier Parish show that 6.7% or 1,506 of the total 22,589 families live below the poverty line. Families with 5 or more children have the highest poverty rate of 32.6%, comprising of 98 families. On the other hand, families with no children have the lowest poverty rate of 4.1%, which includes 503 families.
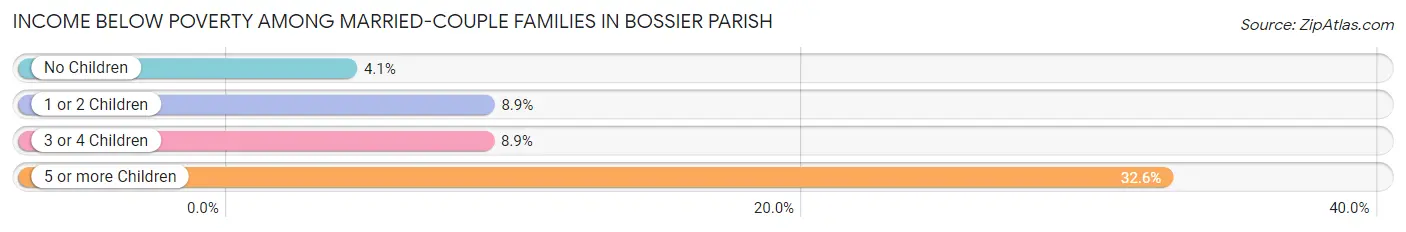
| Children | Above Poverty | Below Poverty |
| No Children | 11,648 (95.9%) | 503 (4.1%) |
| 1 or 2 Children | 7,688 (91.1%) | 754 (8.9%) |
| 3 or 4 Children | 1,544 (91.1%) | 151 (8.9%) |
| 5 or more Children | 203 (67.4%) | 98 (32.6%) |
| Total | 21,083 (93.3%) | 1,506 (6.7%) |
Income Below Poverty Among Single-Parent Households in Bossier Parish
According to the poverty data in Bossier Parish, 15.7% or 394 single-father households and 28.6% or 1,875 single-mother households are living below the poverty line. Among single-father households, those with 3 or 4 children have the highest poverty rate, with 123 households (62.1%) experiencing poverty. Likewise, among single-mother households, those with 3 or 4 children have the highest poverty rate, with 435 households (38.5%) falling below the poverty line.
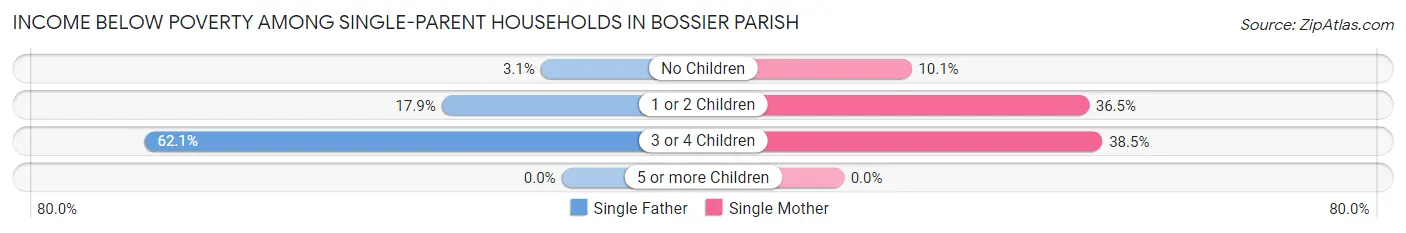
| Children | Single Father | Single Mother |
| No Children | 30 (3.1%) | 207 (10.1%) |
| 1 or 2 Children | 241 (17.9%) | 1,233 (36.5%) |
| 3 or 4 Children | 123 (62.1%) | 435 (38.5%) |
| 5 or more Children | 0 (0.0%) | 0 (0.0%) |
| Total | 394 (15.7%) | 1,875 (28.6%) |
Income Below Poverty Among Married-Couple vs Single-Parent Households in Bossier Parish
The poverty data for Bossier Parish shows that 1,506 of the married-couple family households (6.7%) and 2,269 of the single-parent households (25.0%) are living below the poverty level. Within the married-couple family households, those with 5 or more children have the highest poverty rate, with 98 households (32.6%) falling below the poverty line. Among the single-parent households, those with 3 or 4 children have the highest poverty rate, with 558 household (42.0%) living below poverty.
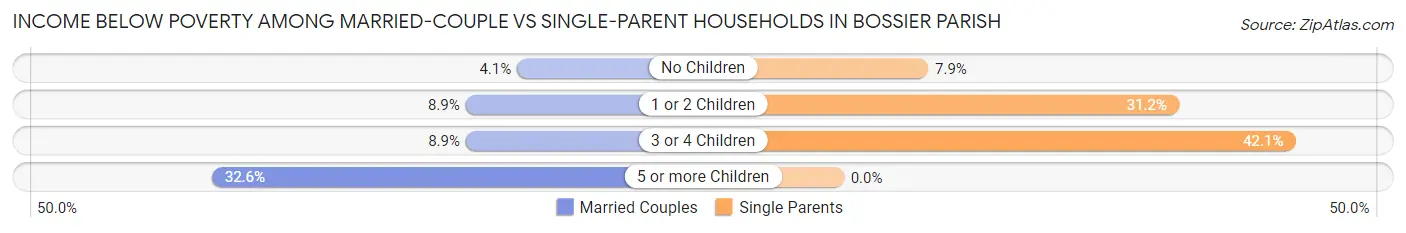
| Children | Married-Couple Families | Single-Parent Households |
| No Children | 503 (4.1%) | 237 (7.9%) |
| 1 or 2 Children | 754 (8.9%) | 1,474 (31.2%) |
| 3 or 4 Children | 151 (8.9%) | 558 (42.0%) |
| 5 or more Children | 98 (32.6%) | 0 (0.0%) |
| Total | 1,506 (6.7%) | 2,269 (25.0%) |
Employment Characteristics in Bossier Parish
Employment by Class of Employer in Bossier Parish
Among the 57,584 employed individuals in Bossier Parish, private company employees (35,128 | 61.0%), federal government employees (6,823 | 11.8%), and not-for-profit organizations (4,341 | 7.5%) make up the most common classes of employment.
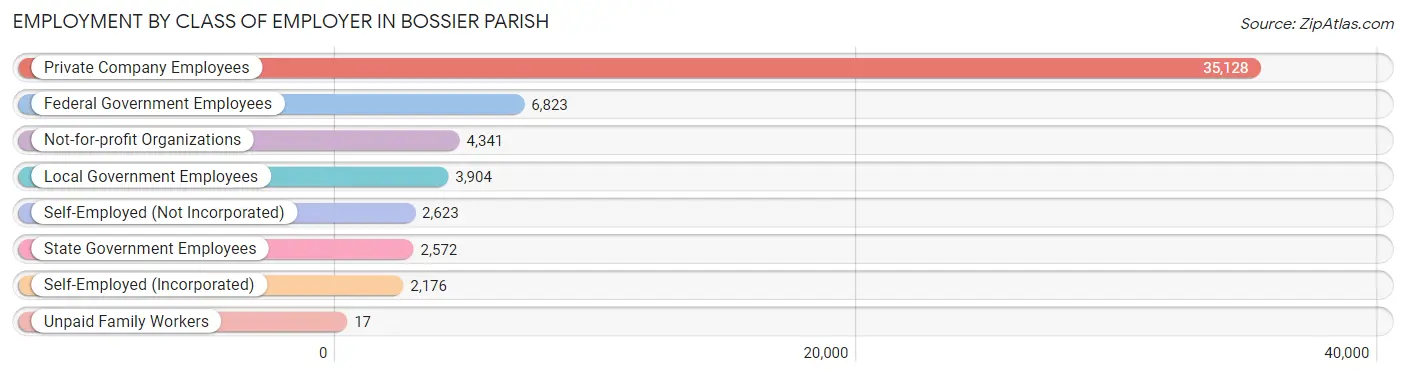
| Employer Class | # Employees | % Employees |
| Private Company Employees | 35,128 | 61.0% |
| Self-Employed (Incorporated) | 2,176 | 3.8% |
| Self-Employed (Not Incorporated) | 2,623 | 4.6% |
| Not-for-profit Organizations | 4,341 | 7.5% |
| Local Government Employees | 3,904 | 6.8% |
| State Government Employees | 2,572 | 4.5% |
| Federal Government Employees | 6,823 | 11.8% |
| Unpaid Family Workers | 17 | 0.0% |
| Total | 57,584 | 100.0% |
Employment Status by Age in Bossier Parish
According to the labor force statistics for Bossier Parish, out of the total population over 16 years of age (100,682), 61.2% or 61,617 individuals are in the labor force, with 5.6% or 3,451 of them unemployed. The age group with the highest labor force participation rate is 35 to 44 years, with 82.7% or 14,864 individuals in the labor force. Within the labor force, the 16 to 19 years age range has the highest percentage of unemployed individuals, with 13.6% or 293 of them being unemployed.
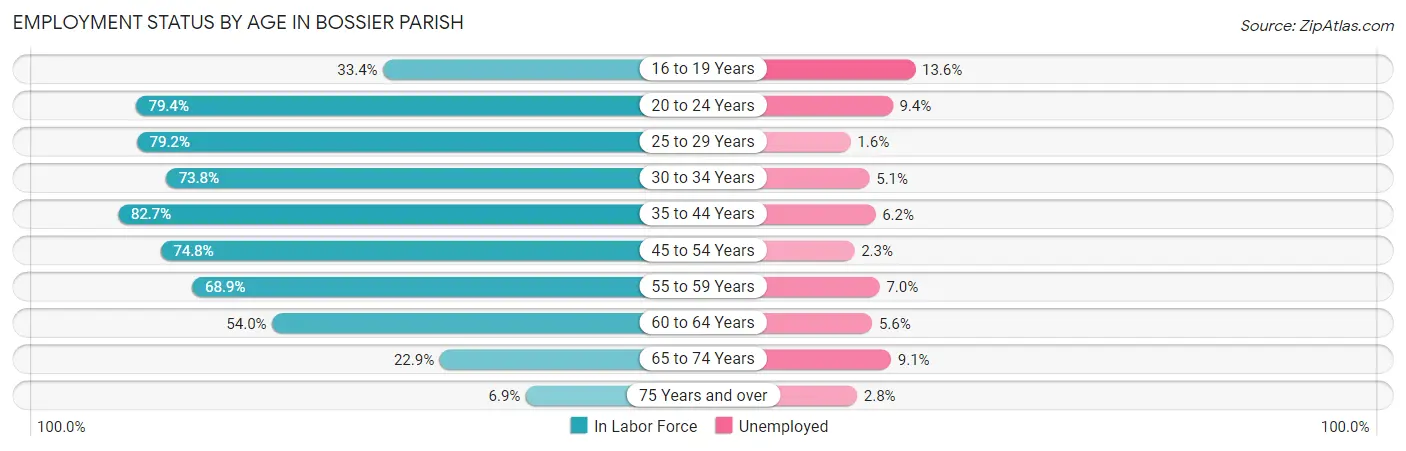
| Age Bracket | In Labor Force | Unemployed |
| 16 to 19 Years | 2,154 (33.4%) | 293 (13.6%) |
| 20 to 24 Years | 6,441 (79.4%) | 605 (9.4%) |
| 25 to 29 Years | 7,229 (79.2%) | 116 (1.6%) |
| 30 to 34 Years | 7,193 (73.8%) | 367 (5.1%) |
| 35 to 44 Years | 14,864 (82.7%) | 922 (6.2%) |
| 45 to 54 Years | 11,084 (74.8%) | 255 (2.3%) |
| 55 to 59 Years | 5,557 (68.9%) | 389 (7.0%) |
| 60 to 64 Years | 3,968 (54.0%) | 222 (5.6%) |
| 65 to 74 Years | 2,550 (22.9%) | 232 (9.1%) |
| 75 Years and over | 546 (6.9%) | 15 (2.8%) |
| Total | 61,617 (61.2%) | 3,451 (5.6%) |
Employment Status by Educational Attainment in Bossier Parish
According to labor force statistics for Bossier Parish, 74.4% of individuals (49,908) out of the total population between 25 and 64 years of age (67,080) are in the labor force, with 4.6% or 2,296 of them being unemployed. The group with the highest labor force participation rate are those with the educational attainment of bachelor's degree or higher, with 84.4% or 16,353 individuals in the labor force. Within the labor force, individuals with less than high school education have the highest percentage of unemployment, with 12.0% or 444 of them being unemployed.
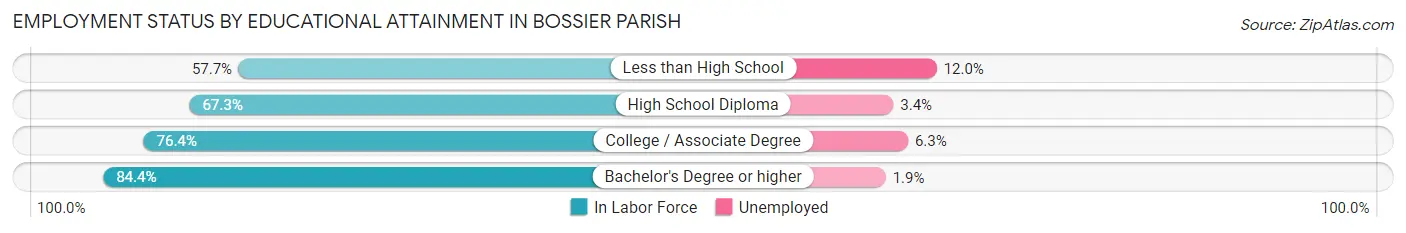
| Educational Attainment | In Labor Force | Unemployed |
| Less than High School | 3,701 (57.7%) | 770 (12.0%) |
| High School Diploma | 12,632 (67.3%) | 638 (3.4%) |
| College / Associate Degree | 17,205 (76.4%) | 1,419 (6.3%) |
| Bachelor's Degree or higher | 16,353 (84.4%) | 368 (1.9%) |
| Total | 49,908 (74.4%) | 3,086 (4.6%) |
Employment Occupations by Sex in Bossier Parish
Management, Business, Science and Arts Occupations
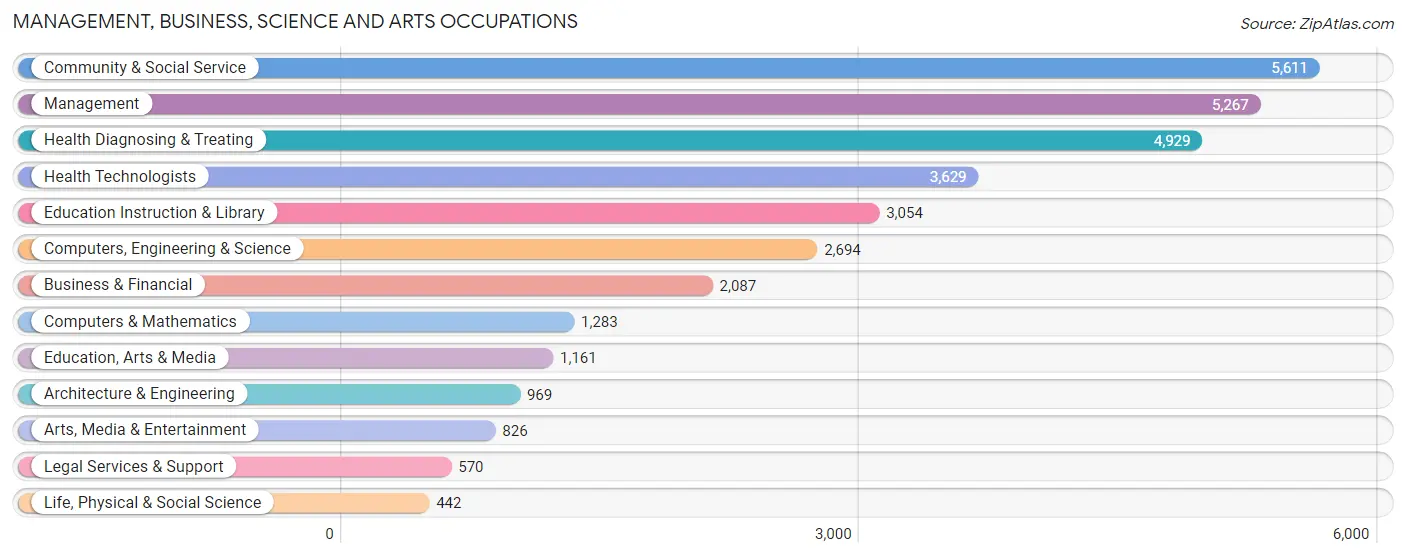
The most common Management, Business, Science and Arts occupations in Bossier Parish are Community & Social Service (5,611 | 10.4%), Management (5,267 | 9.8%), Health Diagnosing & Treating (4,929 | 9.1%), Health Technologists (3,629 | 6.7%), and Education Instruction & Library (3,054 | 5.7%).
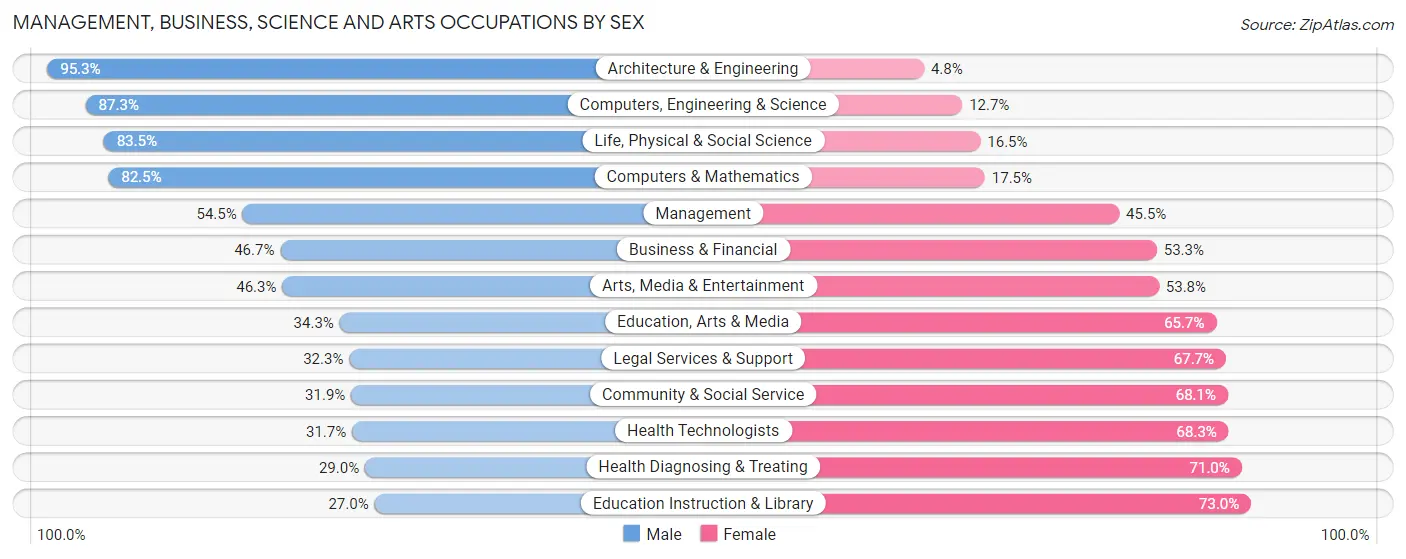
Management, Business, Science and Arts Occupations by Sex
Within the Management, Business, Science and Arts occupations in Bossier Parish, the most male-oriented occupations are Architecture & Engineering (95.3%), Computers, Engineering & Science (87.3%), and Life, Physical & Social Science (83.5%), while the most female-oriented occupations are Education Instruction & Library (73.0%), Health Diagnosing & Treating (71.0%), and Health Technologists (68.3%).
| Occupation | Male | Female |
| Management | 2,872 (54.5%) | 2,395 (45.5%) |
| Business & Financial | 974 (46.7%) | 1,113 (53.3%) |
| Computers, Engineering & Science | 2,351 (87.3%) | 343 (12.7%) |
| Computers & Mathematics | 1,059 (82.5%) | 224 (17.5%) |
| Architecture & Engineering | 923 (95.3%) | 46 (4.8%) |
| Life, Physical & Social Science | 369 (83.5%) | 73 (16.5%) |
| Community & Social Service | 1,789 (31.9%) | 3,822 (68.1%) |
| Education, Arts & Media | 398 (34.3%) | 763 (65.7%) |
| Legal Services & Support | 184 (32.3%) | 386 (67.7%) |
| Education Instruction & Library | 825 (27.0%) | 2,229 (73.0%) |
| Arts, Media & Entertainment | 382 (46.3%) | 444 (53.7%) |
| Health Diagnosing & Treating | 1,429 (29.0%) | 3,500 (71.0%) |
| Health Technologists | 1,150 (31.7%) | 2,479 (68.3%) |
| Total (Category) | 9,415 (45.7%) | 11,173 (54.3%) |
| Total (Overall) | 28,225 (52.3%) | 25,758 (47.7%) |
Services Occupations
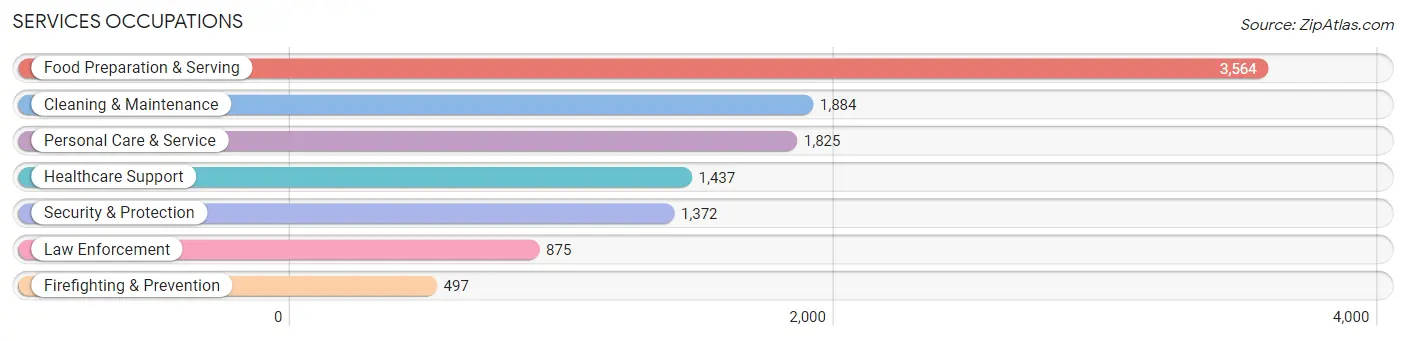
The most common Services occupations in Bossier Parish are Food Preparation & Serving (3,564 | 6.6%), Cleaning & Maintenance (1,884 | 3.5%), Personal Care & Service (1,825 | 3.4%), Healthcare Support (1,437 | 2.7%), and Security & Protection (1,372 | 2.5%).
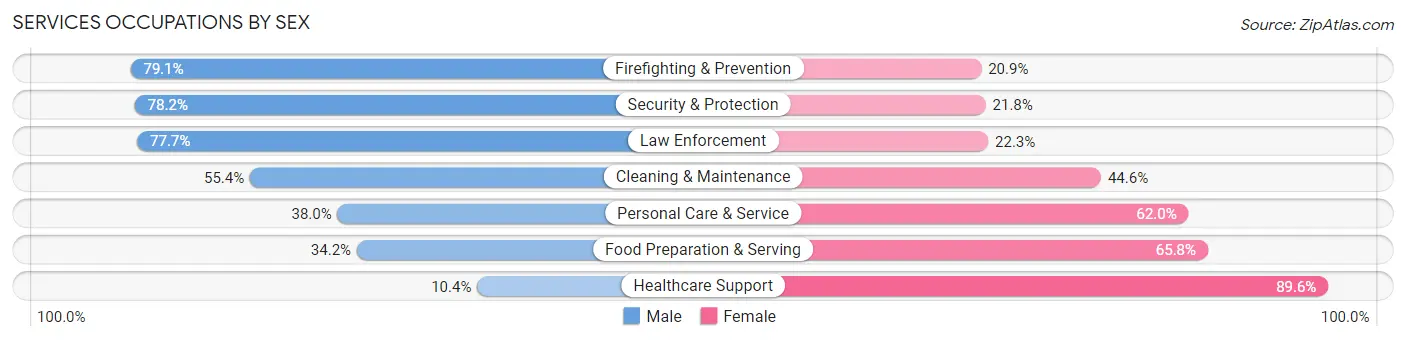
Services Occupations by Sex
Within the Services occupations in Bossier Parish, the most male-oriented occupations are Firefighting & Prevention (79.1%), Security & Protection (78.2%), and Law Enforcement (77.7%), while the most female-oriented occupations are Healthcare Support (89.6%), Food Preparation & Serving (65.8%), and Personal Care & Service (62.0%).
| Occupation | Male | Female |
| Healthcare Support | 149 (10.4%) | 1,288 (89.6%) |
| Security & Protection | 1,073 (78.2%) | 299 (21.8%) |
| Firefighting & Prevention | 393 (79.1%) | 104 (20.9%) |
| Law Enforcement | 680 (77.7%) | 195 (22.3%) |
| Food Preparation & Serving | 1,219 (34.2%) | 2,345 (65.8%) |
| Cleaning & Maintenance | 1,043 (55.4%) | 841 (44.6%) |
| Personal Care & Service | 694 (38.0%) | 1,131 (62.0%) |
| Total (Category) | 4,178 (41.4%) | 5,904 (58.6%) |
| Total (Overall) | 28,225 (52.3%) | 25,758 (47.7%) |
Sales and Office Occupations
The most common Sales and Office occupations in Bossier Parish are Sales & Related (5,936 | 11.0%), and Office & Administration (5,887 | 10.9%).

Sales and Office Occupations by Sex
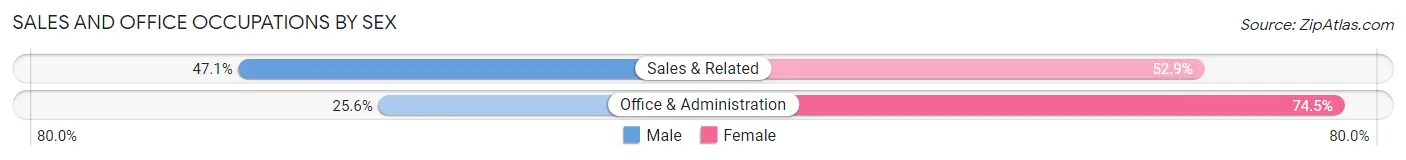
| Occupation | Male | Female |
| Sales & Related | 2,795 (47.1%) | 3,141 (52.9%) |
| Office & Administration | 1,504 (25.6%) | 4,383 (74.5%) |
| Total (Category) | 4,299 (36.4%) | 7,524 (63.6%) |
| Total (Overall) | 28,225 (52.3%) | 25,758 (47.7%) |
Natural Resources, Construction and Maintenance Occupations
The most common Natural Resources, Construction and Maintenance occupations in Bossier Parish are Construction & Extraction (3,307 | 6.1%), Installation, Maintenance & Repair (1,938 | 3.6%), and Farming, Fishing & Forestry (54 | 0.1%).

Natural Resources, Construction and Maintenance Occupations by Sex
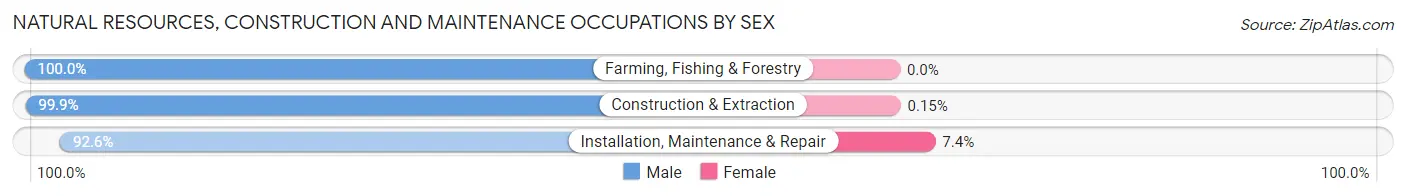
| Occupation | Male | Female |
| Farming, Fishing & Forestry | 54 (100.0%) | 0 (0.0%) |
| Construction & Extraction | 3,302 (99.9%) | 5 (0.2%) |
| Installation, Maintenance & Repair | 1,795 (92.6%) | 143 (7.4%) |
| Total (Category) | 5,151 (97.2%) | 148 (2.8%) |
| Total (Overall) | 28,225 (52.3%) | 25,758 (47.7%) |
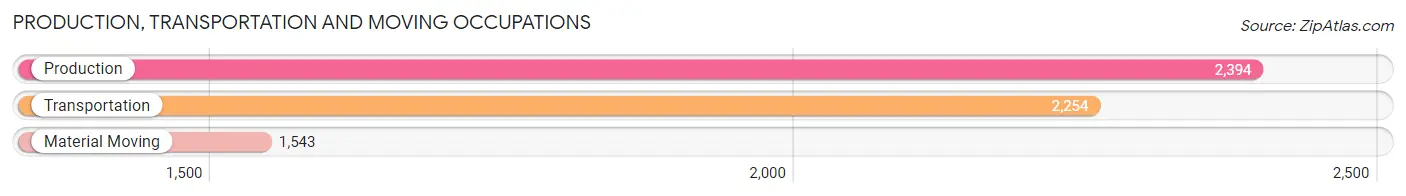
Production, Transportation and Moving Occupations
The most common Production, Transportation and Moving occupations in Bossier Parish are Production (2,394 | 4.4%), Transportation (2,254 | 4.2%), and Material Moving (1,543 | 2.9%).
Production, Transportation and Moving Occupations by Sex
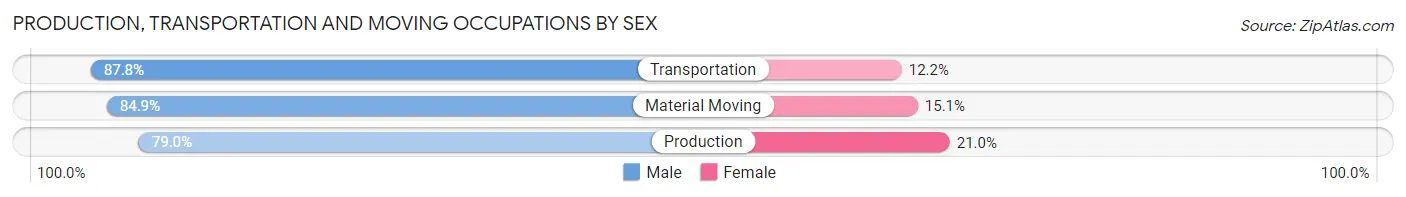
| Occupation | Male | Female |
| Production | 1,892 (79.0%) | 502 (21.0%) |
| Transportation | 1,980 (87.8%) | 274 (12.2%) |
| Material Moving | 1,310 (84.9%) | 233 (15.1%) |
| Total (Category) | 5,182 (83.7%) | 1,009 (16.3%) |
| Total (Overall) | 28,225 (52.3%) | 25,758 (47.7%) |
Employment Industries by Sex in Bossier Parish
Employment Industries in Bossier Parish
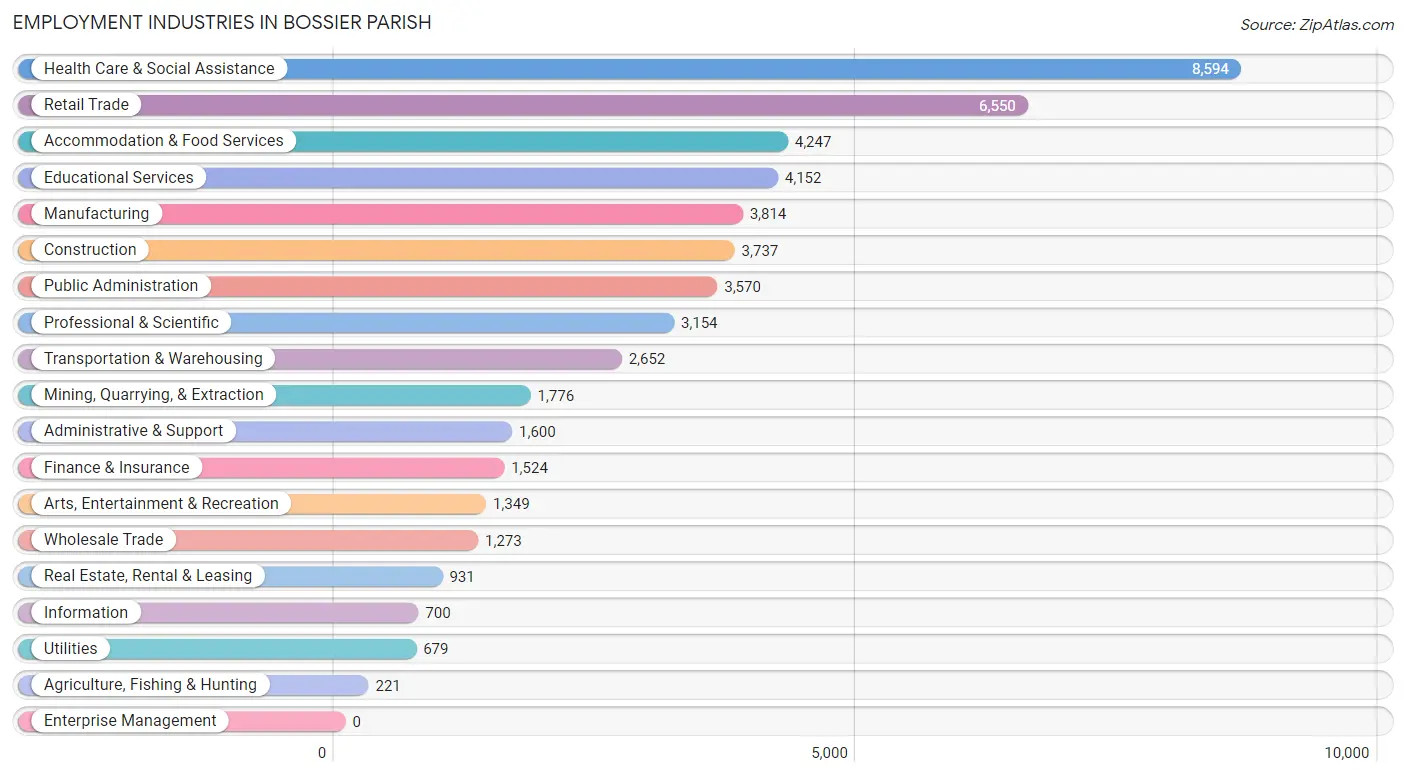
The major employment industries in Bossier Parish include Health Care & Social Assistance (8,594 | 15.9%), Retail Trade (6,550 | 12.1%), Accommodation & Food Services (4,247 | 7.9%), Educational Services (4,152 | 7.7%), and Manufacturing (3,814 | 7.1%).
Employment Industries by Sex in Bossier Parish
The Bossier Parish industries that see more men than women are Construction (92.9%), Mining, Quarrying, & Extraction (89.6%), and Transportation & Warehousing (82.2%), whereas the industries that tend to have a higher number of women are Finance & Insurance (82.3%), Health Care & Social Assistance (76.7%), and Educational Services (73.5%).
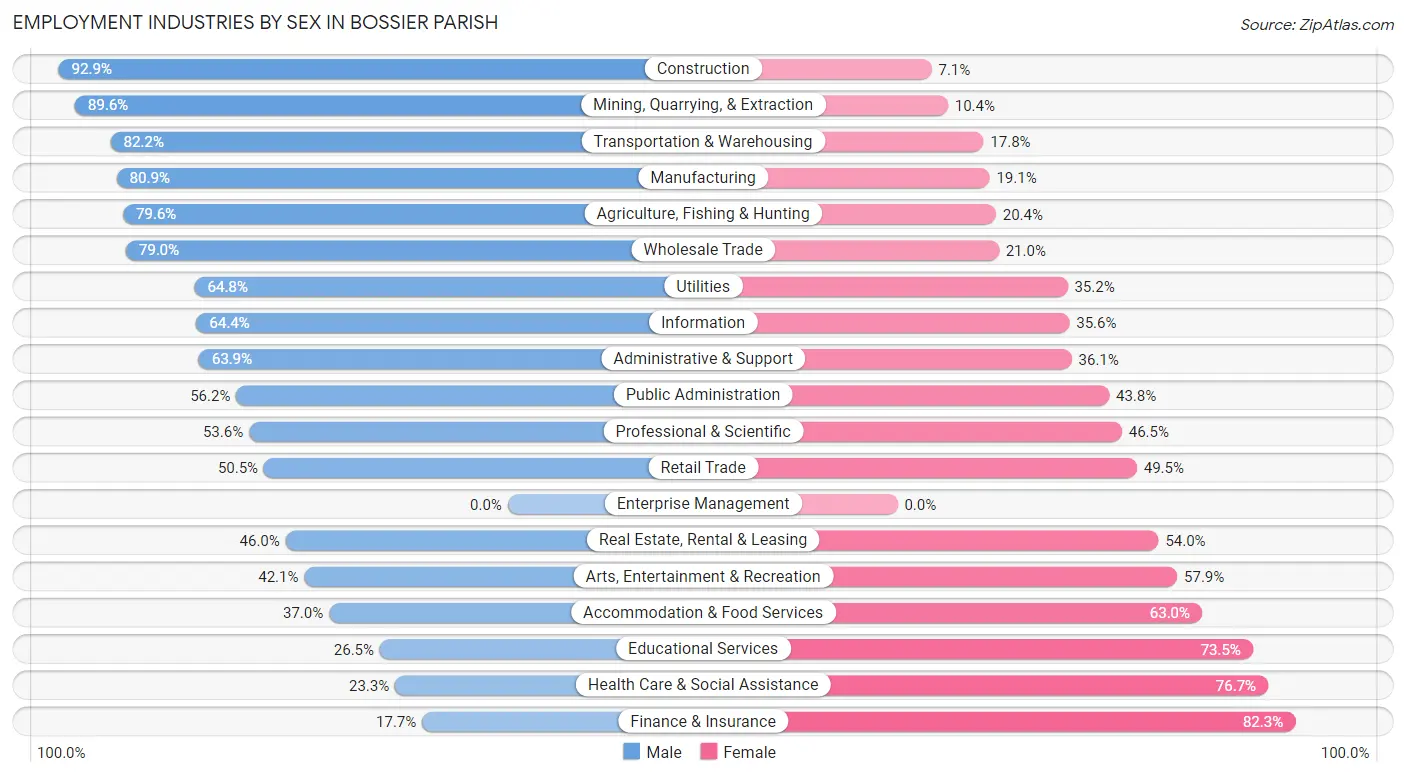
| Industry | Male | Female |
| Agriculture, Fishing & Hunting | 176 (79.6%) | 45 (20.4%) |
| Mining, Quarrying, & Extraction | 1,591 (89.6%) | 185 (10.4%) |
| Construction | 3,473 (92.9%) | 264 (7.1%) |
| Manufacturing | 3,087 (80.9%) | 727 (19.1%) |
| Wholesale Trade | 1,006 (79.0%) | 267 (21.0%) |
| Retail Trade | 3,305 (50.5%) | 3,245 (49.5%) |
| Transportation & Warehousing | 2,180 (82.2%) | 472 (17.8%) |
| Utilities | 440 (64.8%) | 239 (35.2%) |
| Information | 451 (64.4%) | 249 (35.6%) |
| Finance & Insurance | 270 (17.7%) | 1,254 (82.3%) |
| Real Estate, Rental & Leasing | 428 (46.0%) | 503 (54.0%) |
| Professional & Scientific | 1,689 (53.5%) | 1,465 (46.5%) |
| Enterprise Management | 0 (0.0%) | 0 (0.0%) |
| Administrative & Support | 1,023 (63.9%) | 577 (36.1%) |
| Educational Services | 1,099 (26.5%) | 3,053 (73.5%) |
| Health Care & Social Assistance | 2,004 (23.3%) | 6,590 (76.7%) |
| Arts, Entertainment & Recreation | 568 (42.1%) | 781 (57.9%) |
| Accommodation & Food Services | 1,571 (37.0%) | 2,676 (63.0%) |
| Public Administration | 2,006 (56.2%) | 1,564 (43.8%) |
| Total | 28,225 (52.3%) | 25,758 (47.7%) |
Education in Bossier Parish
School Enrollment in Bossier Parish
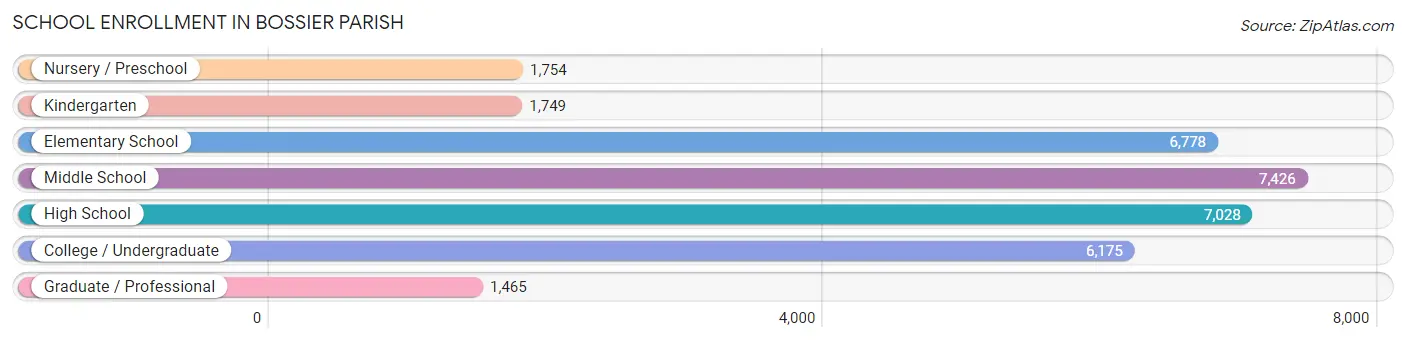
The most common levels of schooling among the 32,375 students in Bossier Parish are middle school (7,426 | 22.9%), high school (7,028 | 21.7%), and elementary school (6,778 | 20.9%).
| School Level | # Students | % Students |
| Nursery / Preschool | 1,754 | 5.4% |
| Kindergarten | 1,749 | 5.4% |
| Elementary School | 6,778 | 20.9% |
| Middle School | 7,426 | 22.9% |
| High School | 7,028 | 21.7% |
| College / Undergraduate | 6,175 | 19.1% |
| Graduate / Professional | 1,465 | 4.5% |
| Total | 32,375 | 100.0% |
School Enrollment by Age by Funding Source in Bossier Parish
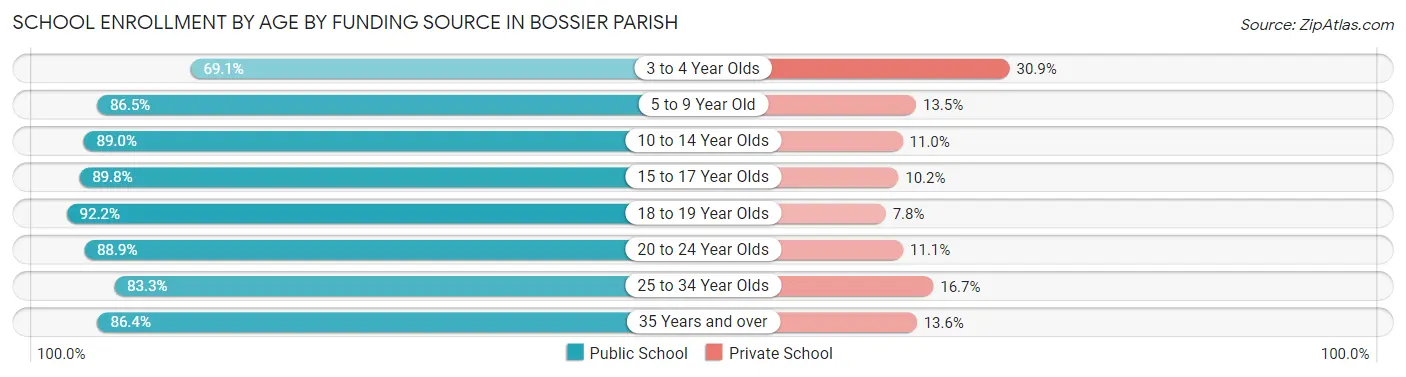
Out of a total of 32,375 students who are enrolled in schools in Bossier Parish, 4,144 (12.8%) attend a private institution, while the remaining 28,231 (87.2%) are enrolled in public schools. The age group of 3 to 4 year olds has the highest likelihood of being enrolled in private schools, with 478 (30.9% in the age bracket) enrolled. Conversely, the age group of 18 to 19 year olds has the lowest likelihood of being enrolled in a private school, with 1,612 (92.2% in the age bracket) attending a public institution.
| Age Bracket | Public School | Private School |
| 3 to 4 Year Olds | 1,069 (69.1%) | 478 (30.9%) |
| 5 to 9 Year Old | 6,770 (86.5%) | 1,055 (13.5%) |
| 10 to 14 Year Olds | 8,528 (89.0%) | 1,052 (11.0%) |
| 15 to 17 Year Olds | 4,395 (89.8%) | 498 (10.2%) |
| 18 to 19 Year Olds | 1,612 (92.2%) | 137 (7.8%) |
| 20 to 24 Year Olds | 2,362 (88.9%) | 294 (11.1%) |
| 25 to 34 Year Olds | 1,832 (83.3%) | 367 (16.7%) |
| 35 Years and over | 1,664 (86.4%) | 262 (13.6%) |
| Total | 28,231 (87.2%) | 4,144 (12.8%) |
Educational Attainment by Field of Study in Bossier Parish
Business (4,880 | 19.6%), education (3,772 | 15.1%), science & technology (3,323 | 13.3%), arts & humanities (2,343 | 9.4%), and liberal arts & history (2,116 | 8.5%) are the most common fields of study among 24,917 individuals in Bossier Parish who have obtained a bachelor's degree or higher.
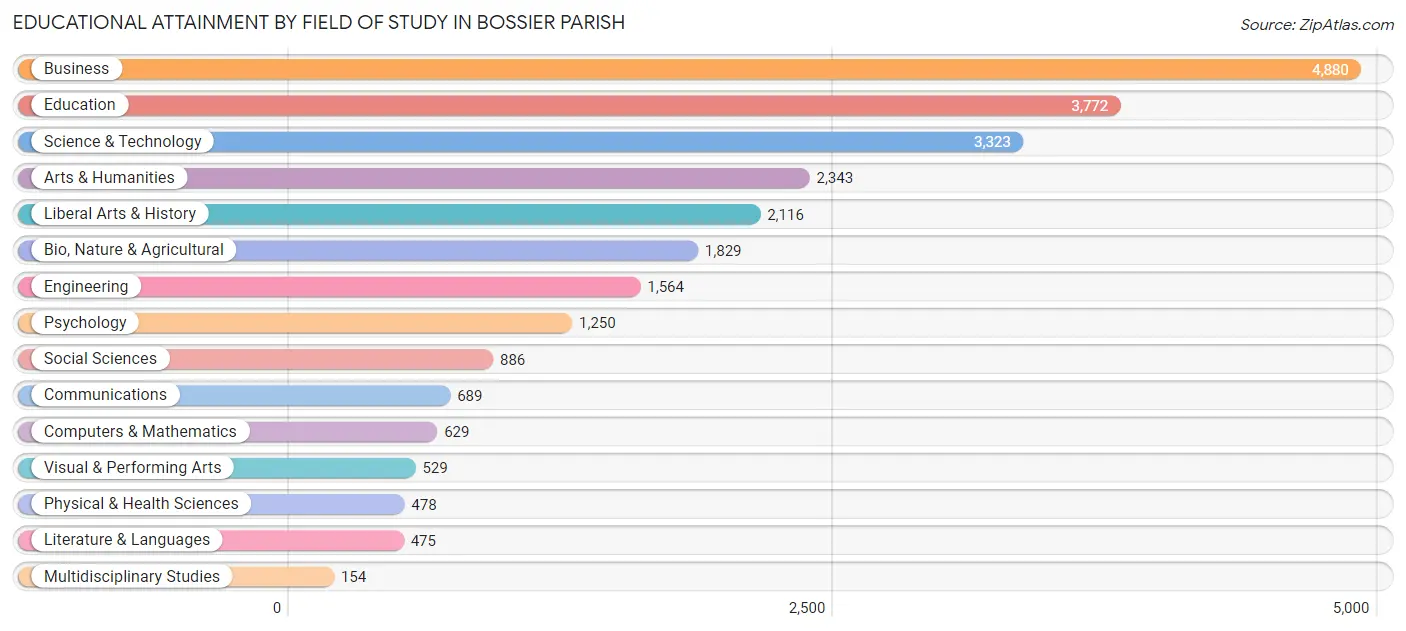
| Field of Study | # Graduates | % Graduates |
| Computers & Mathematics | 629 | 2.5% |
| Bio, Nature & Agricultural | 1,829 | 7.3% |
| Physical & Health Sciences | 478 | 1.9% |
| Psychology | 1,250 | 5.0% |
| Social Sciences | 886 | 3.6% |
| Engineering | 1,564 | 6.3% |
| Multidisciplinary Studies | 154 | 0.6% |
| Science & Technology | 3,323 | 13.3% |
| Business | 4,880 | 19.6% |
| Education | 3,772 | 15.1% |
| Literature & Languages | 475 | 1.9% |
| Liberal Arts & History | 2,116 | 8.5% |
| Visual & Performing Arts | 529 | 2.1% |
| Communications | 689 | 2.8% |
| Arts & Humanities | 2,343 | 9.4% |
| Total | 24,917 | 100.0% |
Transportation & Commute in Bossier Parish
Vehicle Availability by Sex in Bossier Parish
The most prevalent vehicle ownership categories in Bossier Parish are males with 2 vehicles (14,629, accounting for 47.3%) and females with 2 vehicles (10,820, making up 56.3%).
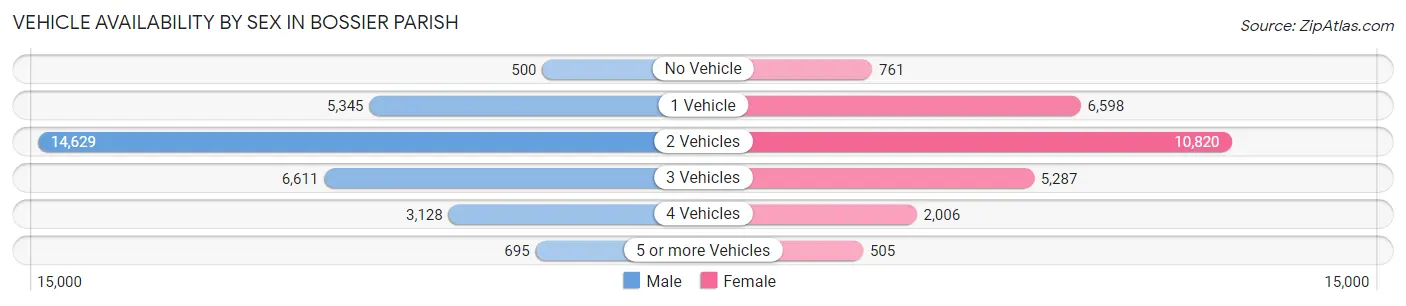
| Vehicles Available | Male | Female |
| No Vehicle | 500 (1.6%) | 761 (2.9%) |
| 1 Vehicle | 5,345 (17.3%) | 6,598 (25.4%) |
| 2 Vehicles | 14,629 (47.3%) | 10,820 (41.6%) |
| 3 Vehicles | 6,611 (21.4%) | 5,287 (20.3%) |
| 4 Vehicles | 3,128 (10.1%) | 2,006 (7.7%) |
| 5 or more Vehicles | 695 (2.2%) | 505 (1.9%) |
| Total | 30,908 (100.0%) | 25,977 (100.0%) |
Commute Time in Bossier Parish
The most frequently occuring commute durations in Bossier Parish are 15 to 19 minutes (11,837 commuters, 21.9%), 20 to 24 minutes (8,738 commuters, 16.2%), and 10 to 14 minutes (7,543 commuters, 14.0%).
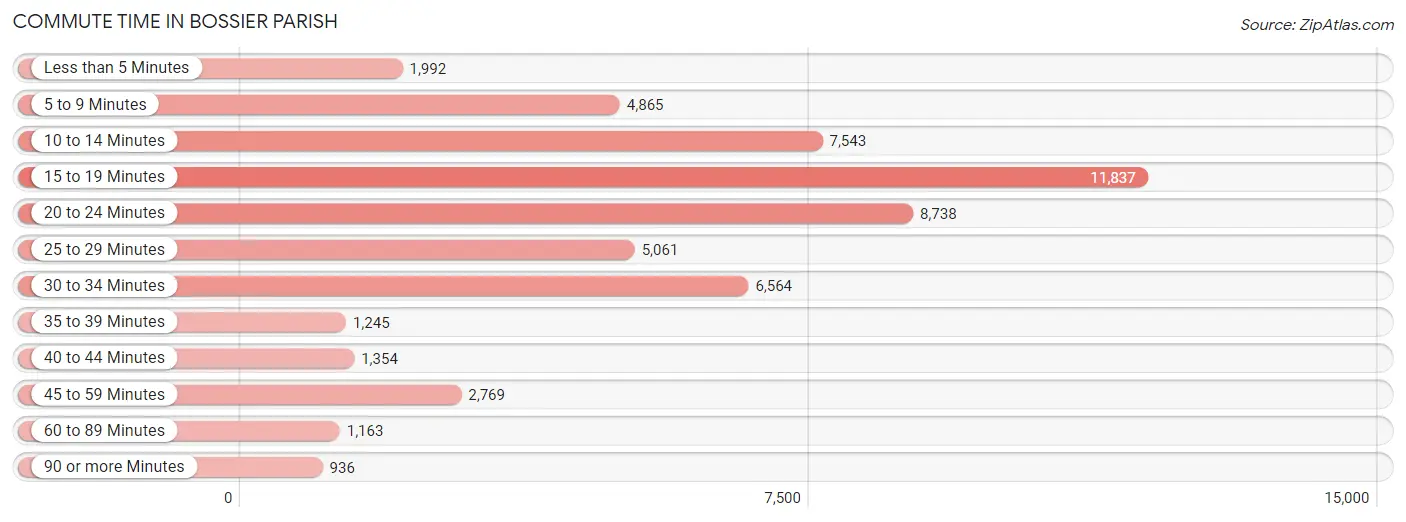
| Commute Time | # Commuters | % Commuters |
| Less than 5 Minutes | 1,992 | 3.7% |
| 5 to 9 Minutes | 4,865 | 9.0% |
| 10 to 14 Minutes | 7,543 | 14.0% |
| 15 to 19 Minutes | 11,837 | 21.9% |
| 20 to 24 Minutes | 8,738 | 16.2% |
| 25 to 29 Minutes | 5,061 | 9.4% |
| 30 to 34 Minutes | 6,564 | 12.1% |
| 35 to 39 Minutes | 1,245 | 2.3% |
| 40 to 44 Minutes | 1,354 | 2.5% |
| 45 to 59 Minutes | 2,769 | 5.1% |
| 60 to 89 Minutes | 1,163 | 2.1% |
| 90 or more Minutes | 936 | 1.7% |
Commute Time by Sex in Bossier Parish
The most common commute times in Bossier Parish are 15 to 19 minutes (6,229 commuters, 21.0%) for males and 15 to 19 minutes (5,608 commuters, 23.0%) for females.
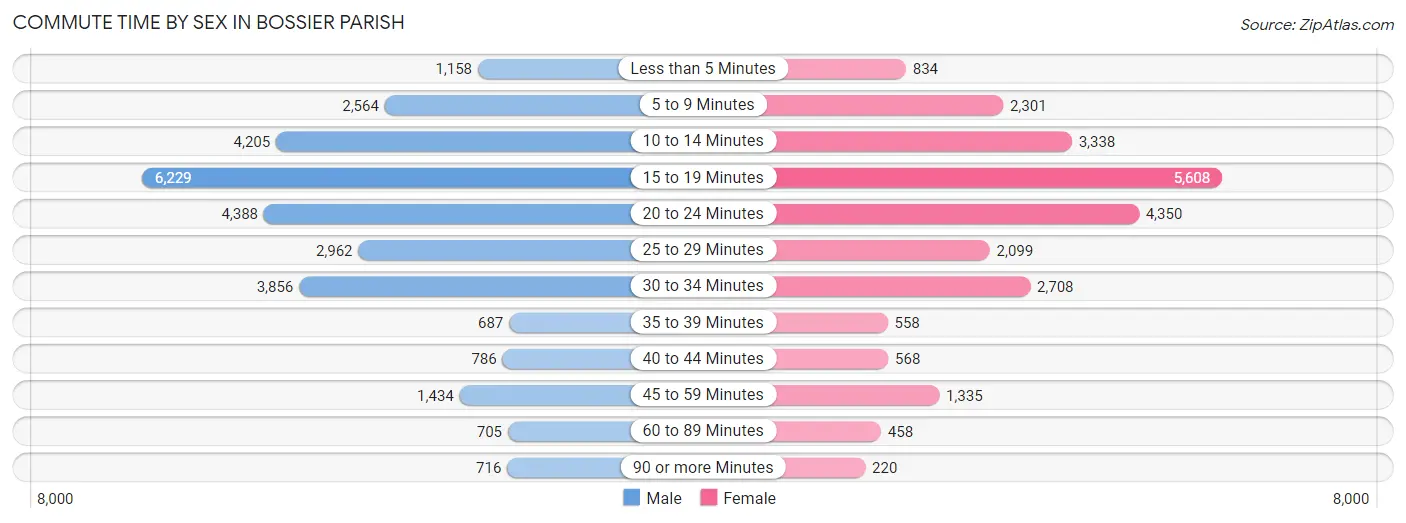
| Commute Time | Male | Female |
| Less than 5 Minutes | 1,158 (3.9%) | 834 (3.4%) |
| 5 to 9 Minutes | 2,564 (8.6%) | 2,301 (9.4%) |
| 10 to 14 Minutes | 4,205 (14.2%) | 3,338 (13.7%) |
| 15 to 19 Minutes | 6,229 (21.0%) | 5,608 (23.0%) |
| 20 to 24 Minutes | 4,388 (14.8%) | 4,350 (17.8%) |
| 25 to 29 Minutes | 2,962 (10.0%) | 2,099 (8.6%) |
| 30 to 34 Minutes | 3,856 (13.0%) | 2,708 (11.1%) |
| 35 to 39 Minutes | 687 (2.3%) | 558 (2.3%) |
| 40 to 44 Minutes | 786 (2.6%) | 568 (2.3%) |
| 45 to 59 Minutes | 1,434 (4.8%) | 1,335 (5.5%) |
| 60 to 89 Minutes | 705 (2.4%) | 458 (1.9%) |
| 90 or more Minutes | 716 (2.4%) | 220 (0.9%) |
Time of Departure to Work by Sex in Bossier Parish
The most frequent times of departure to work in Bossier Parish are 12:00 AM to 4:59 AM (7,764, 26.2%) for males and 12:00 AM to 4:59 AM (5,215, 21.4%) for females.
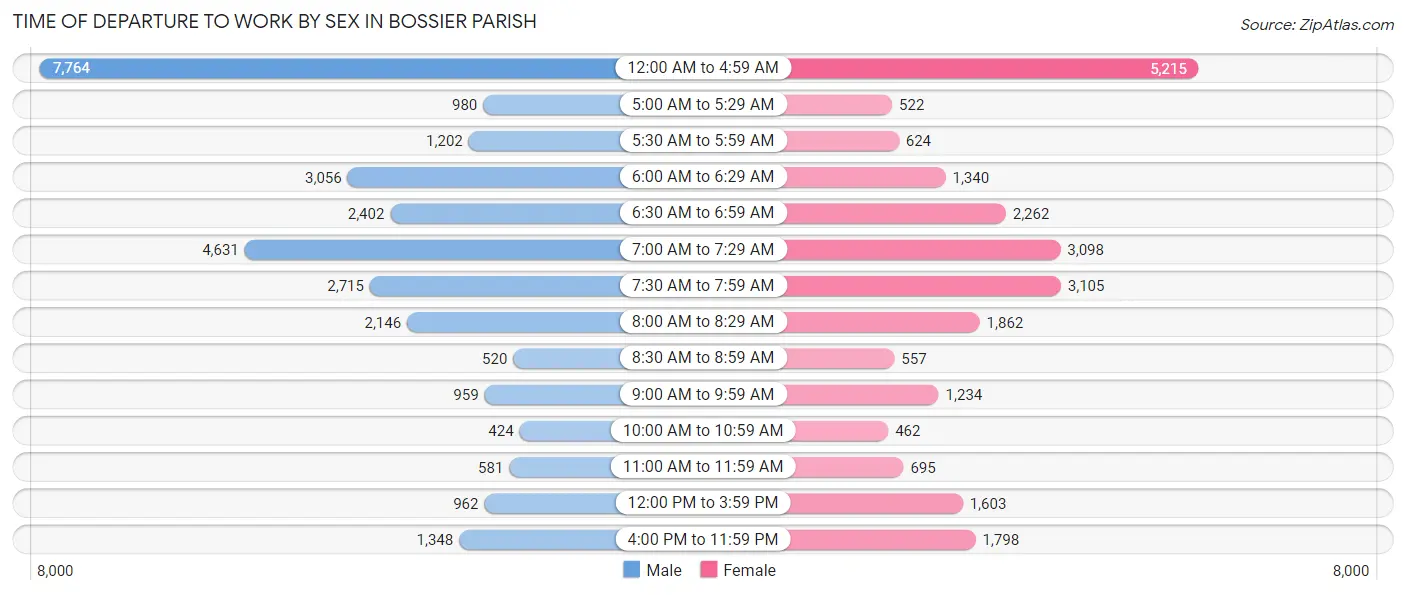
| Time of Departure | Male | Female |
| 12:00 AM to 4:59 AM | 7,764 (26.2%) | 5,215 (21.4%) |
| 5:00 AM to 5:29 AM | 980 (3.3%) | 522 (2.1%) |
| 5:30 AM to 5:59 AM | 1,202 (4.1%) | 624 (2.6%) |
| 6:00 AM to 6:29 AM | 3,056 (10.3%) | 1,340 (5.5%) |
| 6:30 AM to 6:59 AM | 2,402 (8.1%) | 2,262 (9.3%) |
| 7:00 AM to 7:29 AM | 4,631 (15.6%) | 3,098 (12.7%) |
| 7:30 AM to 7:59 AM | 2,715 (9.1%) | 3,105 (12.7%) |
| 8:00 AM to 8:29 AM | 2,146 (7.2%) | 1,862 (7.6%) |
| 8:30 AM to 8:59 AM | 520 (1.8%) | 557 (2.3%) |
| 9:00 AM to 9:59 AM | 959 (3.2%) | 1,234 (5.1%) |
| 10:00 AM to 10:59 AM | 424 (1.4%) | 462 (1.9%) |
| 11:00 AM to 11:59 AM | 581 (2.0%) | 695 (2.9%) |
| 12:00 PM to 3:59 PM | 962 (3.2%) | 1,603 (6.6%) |
| 4:00 PM to 11:59 PM | 1,348 (4.5%) | 1,798 (7.4%) |
| Total | 29,690 (100.0%) | 24,377 (100.0%) |
Housing Occupancy in Bossier Parish
Occupancy by Ownership in Bossier Parish
Of the total 48,651 dwellings in Bossier Parish, owner-occupied units account for 31,834 (65.4%), while renter-occupied units make up 16,817 (34.6%).
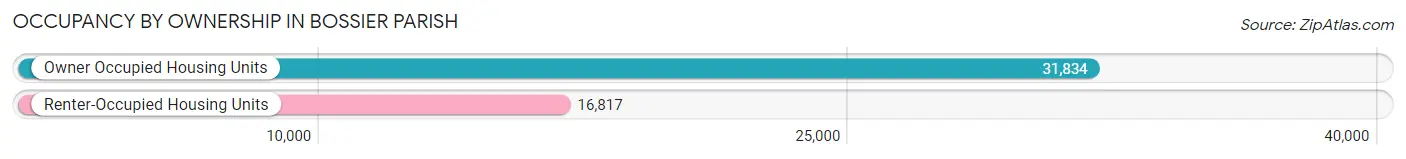
| Occupancy | # Housing Units | % Housing Units |
| Owner Occupied Housing Units | 31,834 | 65.4% |
| Renter-Occupied Housing Units | 16,817 | 34.6% |
| Total Occupied Housing Units | 48,651 | 100.0% |
Occupancy by Household Size in Bossier Parish
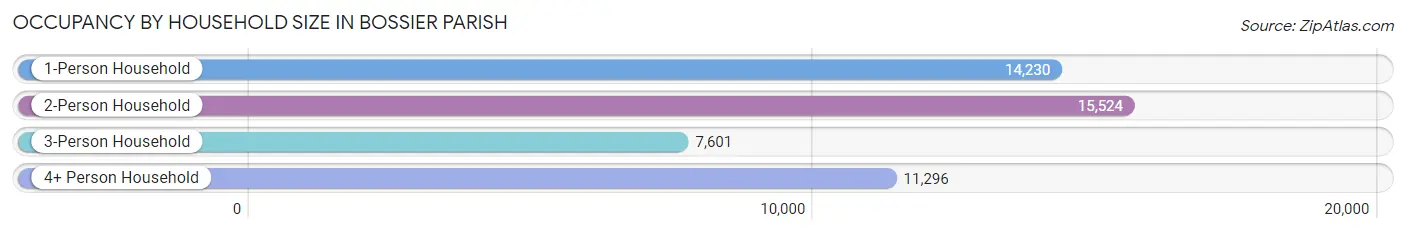
| Household Size | # Housing Units | % Housing Units |
| 1-Person Household | 14,230 | 29.2% |
| 2-Person Household | 15,524 | 31.9% |
| 3-Person Household | 7,601 | 15.6% |
| 4+ Person Household | 11,296 | 23.2% |
| Total Housing Units | 48,651 | 100.0% |
Occupancy by Ownership by Household Size in Bossier Parish
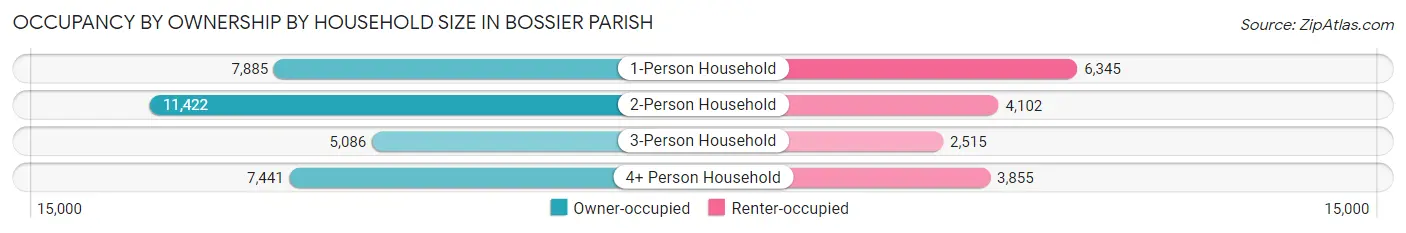
| Household Size | Owner-occupied | Renter-occupied |
| 1-Person Household | 7,885 (55.4%) | 6,345 (44.6%) |
| 2-Person Household | 11,422 (73.6%) | 4,102 (26.4%) |
| 3-Person Household | 5,086 (66.9%) | 2,515 (33.1%) |
| 4+ Person Household | 7,441 (65.9%) | 3,855 (34.1%) |
| Total Housing Units | 31,834 (65.4%) | 16,817 (34.6%) |
Occupancy by Educational Attainment in Bossier Parish
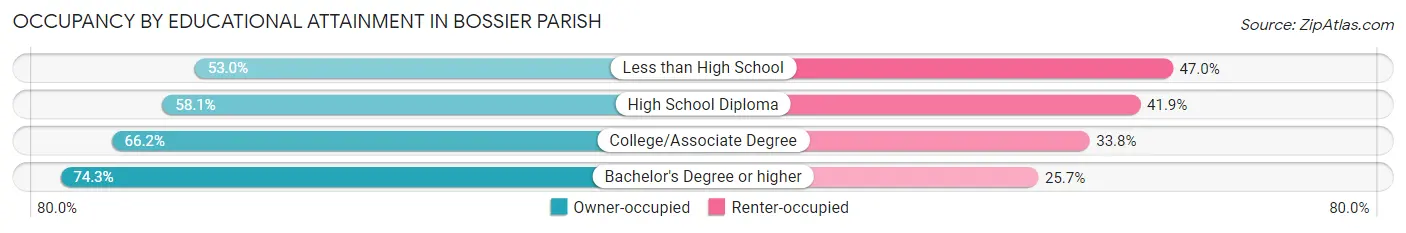
| Household Size | Owner-occupied | Renter-occupied |
| Less than High School | 2,108 (53.0%) | 1,869 (47.0%) |
| High School Diploma | 7,307 (58.1%) | 5,262 (41.9%) |
| College/Associate Degree | 11,726 (66.2%) | 5,991 (33.8%) |
| Bachelor's Degree or higher | 10,693 (74.3%) | 3,695 (25.7%) |
Occupancy by Age of Householder in Bossier Parish
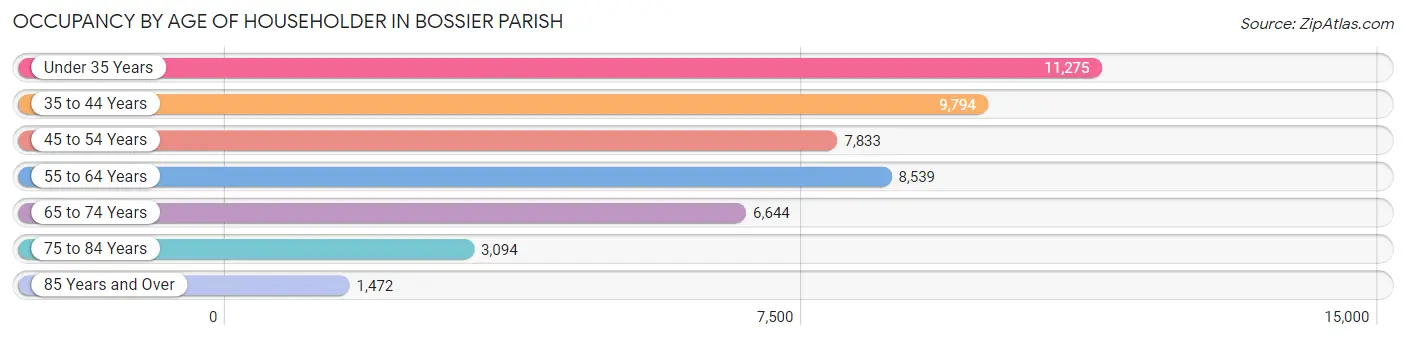
| Age Bracket | # Households | % Households |
| Under 35 Years | 11,275 | 23.2% |
| 35 to 44 Years | 9,794 | 20.1% |
| 45 to 54 Years | 7,833 | 16.1% |
| 55 to 64 Years | 8,539 | 17.5% |
| 65 to 74 Years | 6,644 | 13.7% |
| 75 to 84 Years | 3,094 | 6.4% |
| 85 Years and Over | 1,472 | 3.0% |
| Total | 48,651 | 100.0% |
Housing Finances in Bossier Parish
Median Income by Occupancy in Bossier Parish
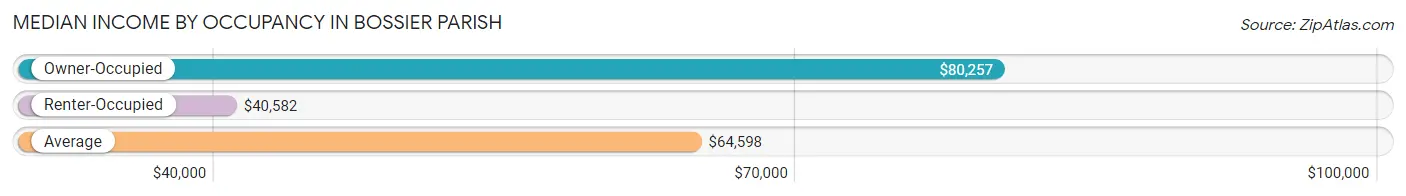
| Occupancy Type | # Households | Median Income |
| Owner-Occupied | 31,834 (65.4%) | $80,257 |
| Renter-Occupied | 16,817 (34.6%) | $40,582 |
| Average | 48,651 (100.0%) | $64,598 |
Occupancy by Householder Income Bracket in Bossier Parish
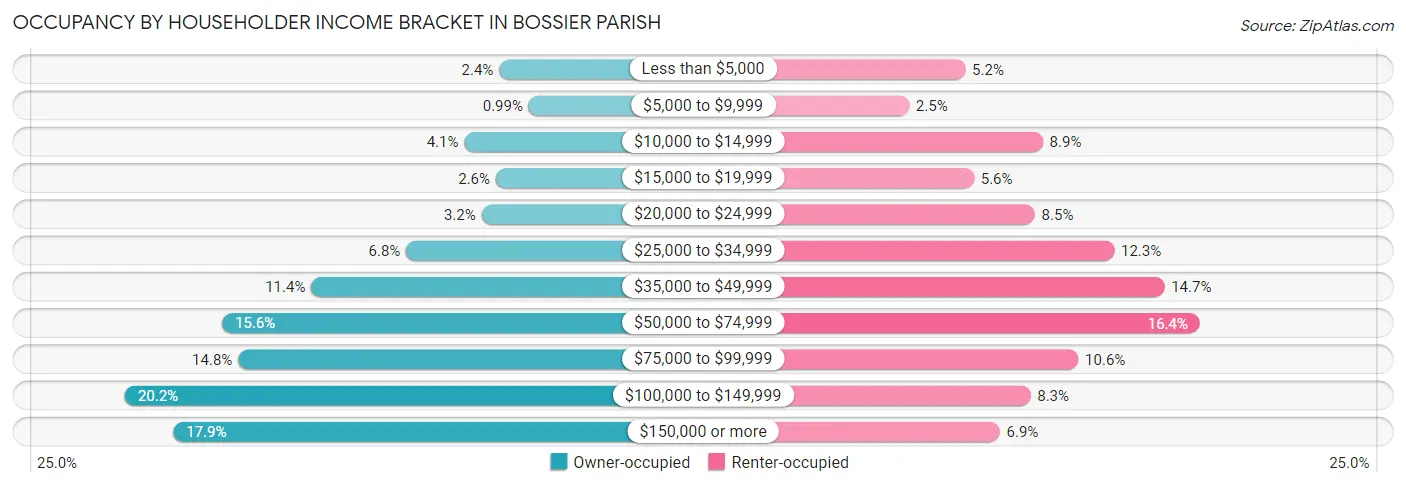
| Income Bracket | Owner-occupied | Renter-occupied |
| Less than $5,000 | 765 (2.4%) | 878 (5.2%) |
| $5,000 to $9,999 | 315 (1.0%) | 427 (2.5%) |
| $10,000 to $14,999 | 1,292 (4.1%) | 1,498 (8.9%) |
| $15,000 to $19,999 | 814 (2.6%) | 947 (5.6%) |
| $20,000 to $24,999 | 1,032 (3.2%) | 1,434 (8.5%) |
| $25,000 to $34,999 | 2,173 (6.8%) | 2,071 (12.3%) |
| $35,000 to $49,999 | 3,612 (11.4%) | 2,472 (14.7%) |
| $50,000 to $74,999 | 4,966 (15.6%) | 2,756 (16.4%) |
| $75,000 to $99,999 | 4,721 (14.8%) | 1,782 (10.6%) |
| $100,000 to $149,999 | 6,438 (20.2%) | 1,399 (8.3%) |
| $150,000 or more | 5,706 (17.9%) | 1,153 (6.9%) |
| Total | 31,834 (100.0%) | 16,817 (100.0%) |
Monthly Housing Cost Tiers in Bossier Parish
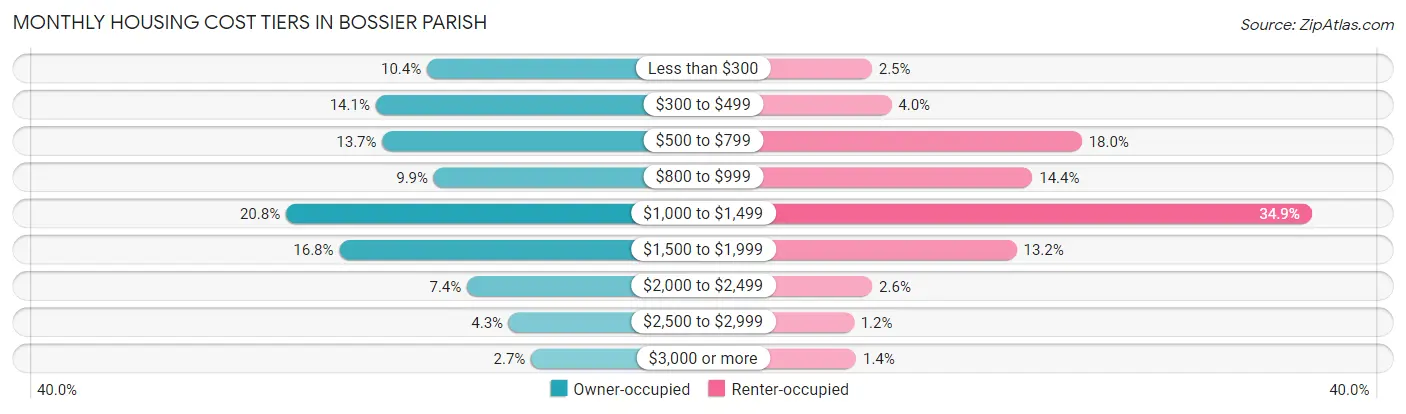
| Monthly Cost | Owner-occupied | Renter-occupied |
| Less than $300 | 3,297 (10.4%) | 425 (2.5%) |
| $300 to $499 | 4,500 (14.1%) | 668 (4.0%) |
| $500 to $799 | 4,346 (13.7%) | 3,025 (18.0%) |
| $800 to $999 | 3,139 (9.9%) | 2,413 (14.3%) |
| $1,000 to $1,499 | 6,604 (20.7%) | 5,873 (34.9%) |
| $1,500 to $1,999 | 5,356 (16.8%) | 2,218 (13.2%) |
| $2,000 to $2,499 | 2,359 (7.4%) | 431 (2.6%) |
| $2,500 to $2,999 | 1,378 (4.3%) | 202 (1.2%) |
| $3,000 or more | 855 (2.7%) | 230 (1.4%) |
| Total | 31,834 (100.0%) | 16,817 (100.0%) |
Physical Housing Characteristics in Bossier Parish
Housing Structures in Bossier Parish
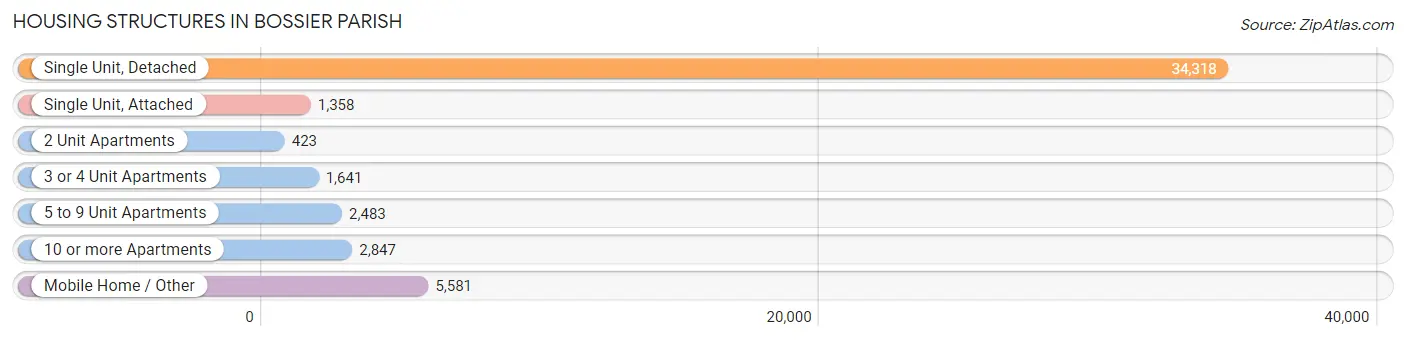
| Structure Type | # Housing Units | % Housing Units |
| Single Unit, Detached | 34,318 | 70.5% |
| Single Unit, Attached | 1,358 | 2.8% |
| 2 Unit Apartments | 423 | 0.9% |
| 3 or 4 Unit Apartments | 1,641 | 3.4% |
| 5 to 9 Unit Apartments | 2,483 | 5.1% |
| 10 or more Apartments | 2,847 | 5.9% |
| Mobile Home / Other | 5,581 | 11.5% |
| Total | 48,651 | 100.0% |
Housing Structures by Occupancy in Bossier Parish
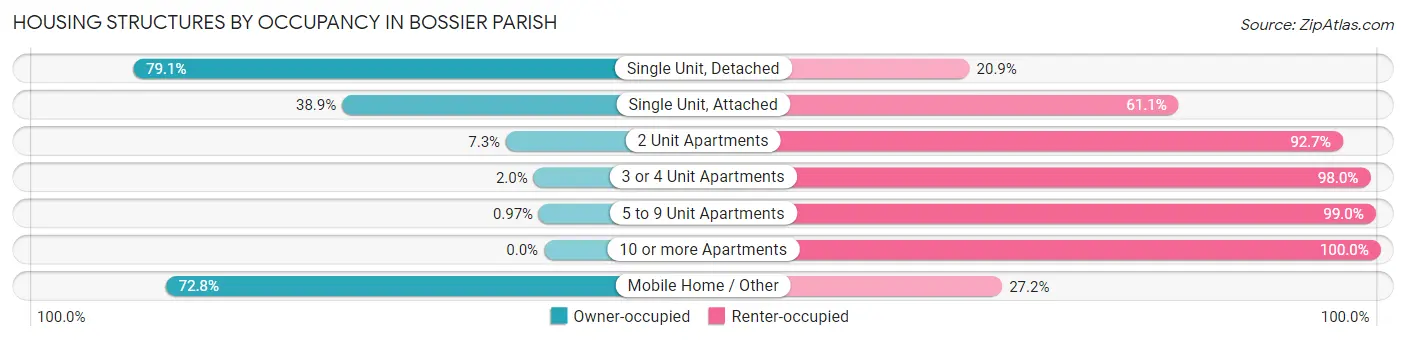
| Structure Type | Owner-occupied | Renter-occupied |
| Single Unit, Detached | 27,153 (79.1%) | 7,165 (20.9%) |
| Single Unit, Attached | 528 (38.9%) | 830 (61.1%) |
| 2 Unit Apartments | 31 (7.3%) | 392 (92.7%) |
| 3 or 4 Unit Apartments | 33 (2.0%) | 1,608 (98.0%) |
| 5 to 9 Unit Apartments | 24 (1.0%) | 2,459 (99.0%) |
| 10 or more Apartments | 0 (0.0%) | 2,847 (100.0%) |
| Mobile Home / Other | 4,065 (72.8%) | 1,516 (27.2%) |
| Total | 31,834 (65.4%) | 16,817 (34.6%) |
Housing Structures by Number of Rooms in Bossier Parish
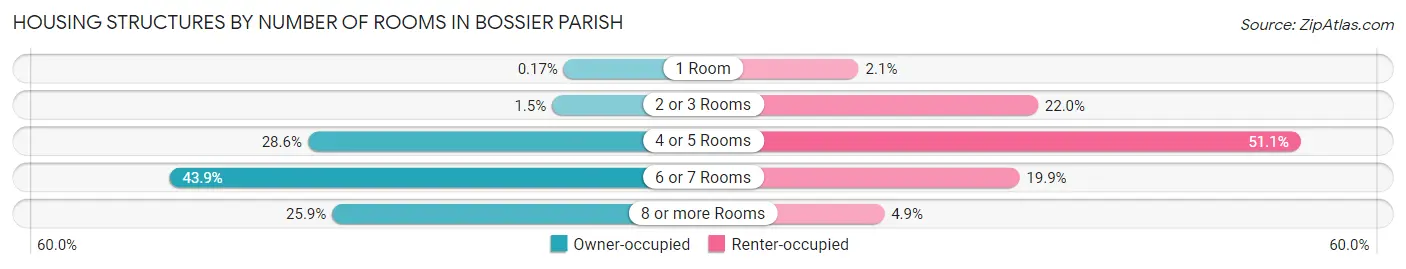
| Number of Rooms | Owner-occupied | Renter-occupied |
| 1 Room | 54 (0.2%) | 349 (2.1%) |
| 2 or 3 Rooms | 465 (1.5%) | 3,695 (22.0%) |
| 4 or 5 Rooms | 9,098 (28.6%) | 8,595 (51.1%) |
| 6 or 7 Rooms | 13,983 (43.9%) | 3,350 (19.9%) |
| 8 or more Rooms | 8,234 (25.9%) | 828 (4.9%) |
| Total | 31,834 (100.0%) | 16,817 (100.0%) |
Housing Structure by Heating Type in Bossier Parish
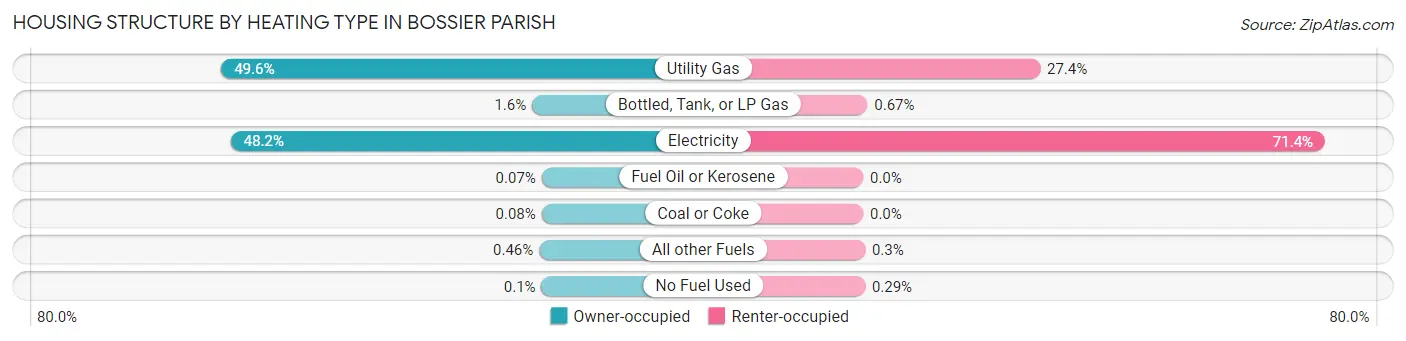
| Heating Type | Owner-occupied | Renter-occupied |
| Utility Gas | 15,791 (49.6%) | 4,601 (27.4%) |
| Bottled, Tank, or LP Gas | 492 (1.5%) | 112 (0.7%) |
| Electricity | 15,328 (48.1%) | 12,006 (71.4%) |
| Fuel Oil or Kerosene | 23 (0.1%) | 0 (0.0%) |
| Coal or Coke | 24 (0.1%) | 0 (0.0%) |
| All other Fuels | 145 (0.5%) | 50 (0.3%) |
| No Fuel Used | 31 (0.1%) | 48 (0.3%) |
| Total | 31,834 (100.0%) | 16,817 (100.0%) |
Household Vehicle Usage in Bossier Parish
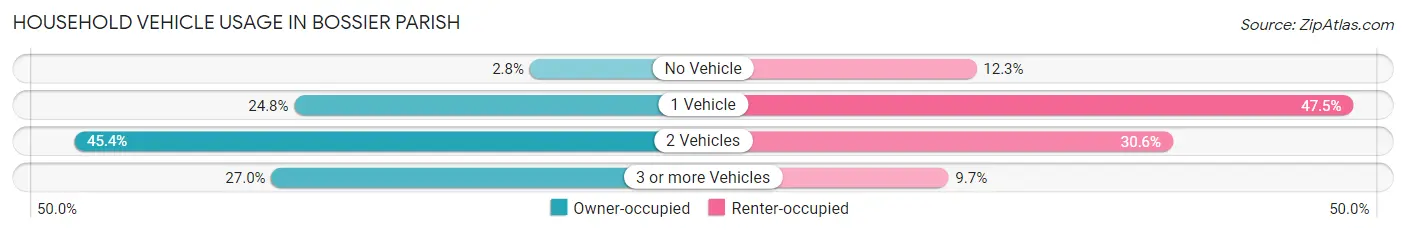
| Vehicles per Household | Owner-occupied | Renter-occupied |
| No Vehicle | 903 (2.8%) | 2,064 (12.3%) |
| 1 Vehicle | 7,900 (24.8%) | 7,981 (47.5%) |
| 2 Vehicles | 14,450 (45.4%) | 5,148 (30.6%) |
| 3 or more Vehicles | 8,581 (27.0%) | 1,624 (9.7%) |
| Total | 31,834 (100.0%) | 16,817 (100.0%) |
Real Estate & Mortgages in Bossier Parish
Real Estate and Mortgage Overview in Bossier Parish
| Characteristic | Without Mortgage | With Mortgage |
| Housing Units | 12,071 | 19,763 |
| Median Property Value | $169,400 | $225,400 |
| Median Household Income | $57,671 | $4,146 |
| Monthly Housing Costs | $400 | $801 |
| Real Estate Taxes | $906 | $1,786 |
Property Value by Mortgage Status in Bossier Parish
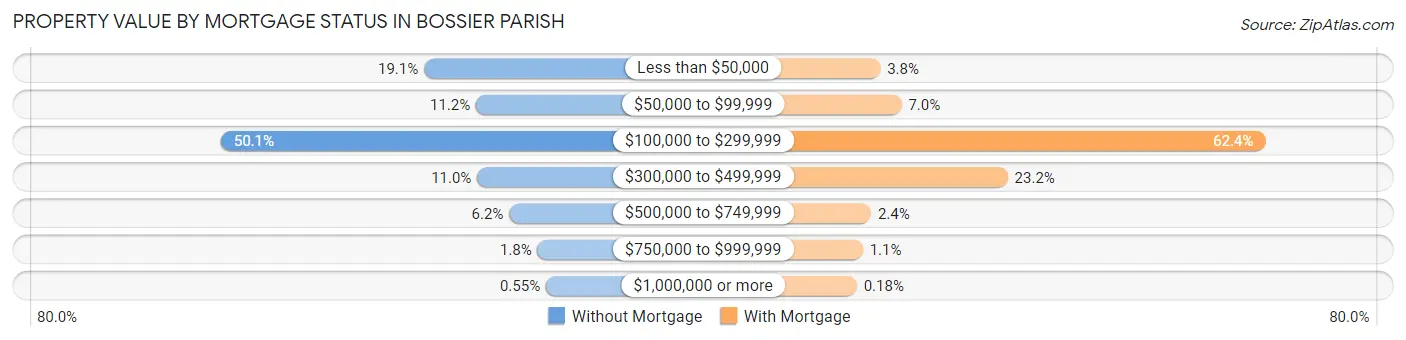
| Property Value | Without Mortgage | With Mortgage |
| Less than $50,000 | 2,309 (19.1%) | 744 (3.8%) |
| $50,000 to $99,999 | 1,353 (11.2%) | 1,383 (7.0%) |
| $100,000 to $299,999 | 6,047 (50.1%) | 12,340 (62.4%) |
| $300,000 to $499,999 | 1,332 (11.0%) | 4,581 (23.2%) |
| $500,000 to $749,999 | 743 (6.2%) | 465 (2.4%) |
| $750,000 to $999,999 | 221 (1.8%) | 215 (1.1%) |
| $1,000,000 or more | 66 (0.5%) | 35 (0.2%) |
| Total | 12,071 (100.0%) | 19,763 (100.0%) |
Household Income by Mortgage Status in Bossier Parish
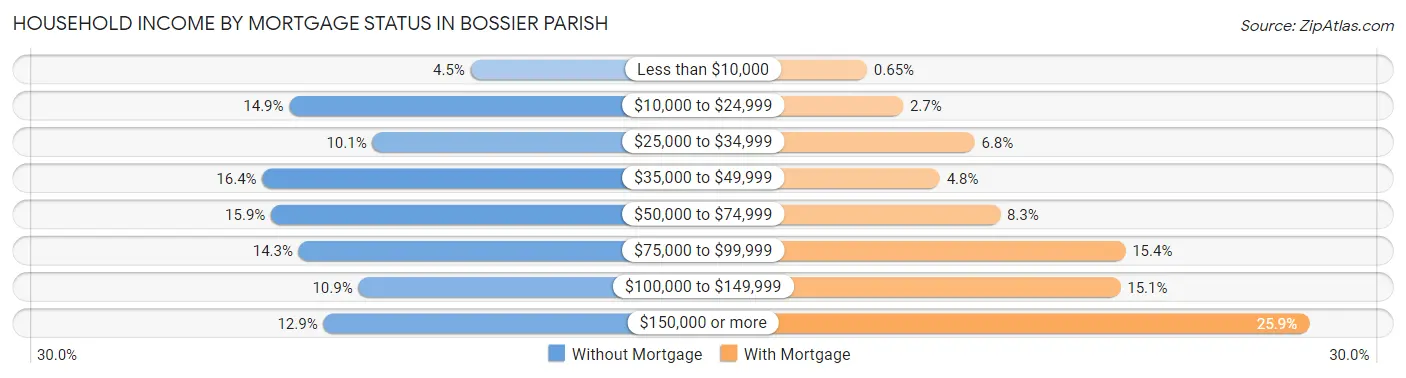
| Household Income | Without Mortgage | With Mortgage |
| Less than $10,000 | 544 (4.5%) | 129 (0.6%) |
| $10,000 to $24,999 | 1,795 (14.9%) | 536 (2.7%) |
| $25,000 to $34,999 | 1,222 (10.1%) | 1,343 (6.8%) |
| $35,000 to $49,999 | 1,981 (16.4%) | 951 (4.8%) |
| $50,000 to $74,999 | 1,921 (15.9%) | 1,631 (8.3%) |
| $75,000 to $99,999 | 1,730 (14.3%) | 3,045 (15.4%) |
| $100,000 to $149,999 | 1,318 (10.9%) | 2,991 (15.1%) |
| $150,000 or more | 1,560 (12.9%) | 5,120 (25.9%) |
| Total | 12,071 (100.0%) | 19,763 (100.0%) |
Property Value to Household Income Ratio in Bossier Parish
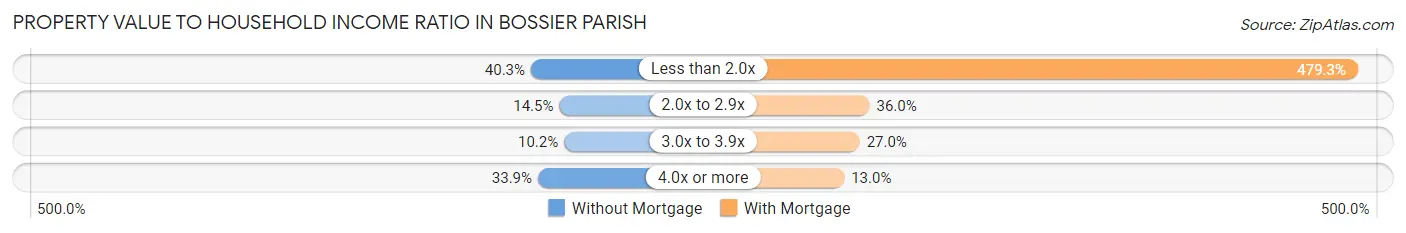
| Value-to-Income Ratio | Without Mortgage | With Mortgage |
| Less than 2.0x | 4,861 (40.3%) | 94,726 (479.3%) |
| 2.0x to 2.9x | 1,750 (14.5%) | 7,116 (36.0%) |
| 3.0x to 3.9x | 1,229 (10.2%) | 5,341 (27.0%) |
| 4.0x or more | 4,097 (33.9%) | 2,568 (13.0%) |
| Total | 12,071 (100.0%) | 19,763 (100.0%) |
Real Estate Taxes by Mortgage Status in Bossier Parish
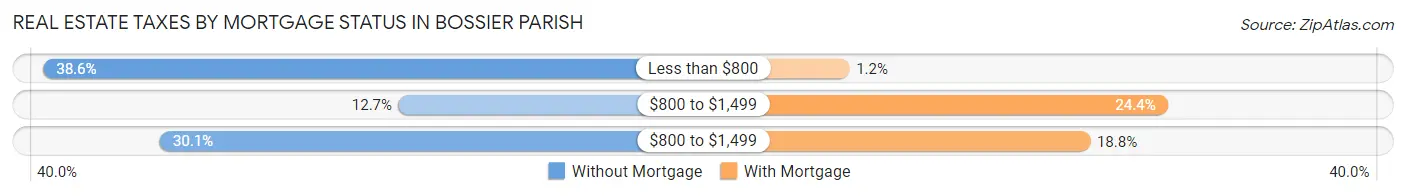
| Property Taxes | Without Mortgage | With Mortgage |
| Less than $800 | 4,663 (38.6%) | 234 (1.2%) |
| $800 to $1,499 | 1,537 (12.7%) | 4,830 (24.4%) |
| $800 to $1,499 | 3,634 (30.1%) | 3,709 (18.8%) |
| Total | 12,071 (100.0%) | 19,763 (100.0%) |
Health & Disability in Bossier Parish
Health Insurance Coverage by Age in Bossier Parish
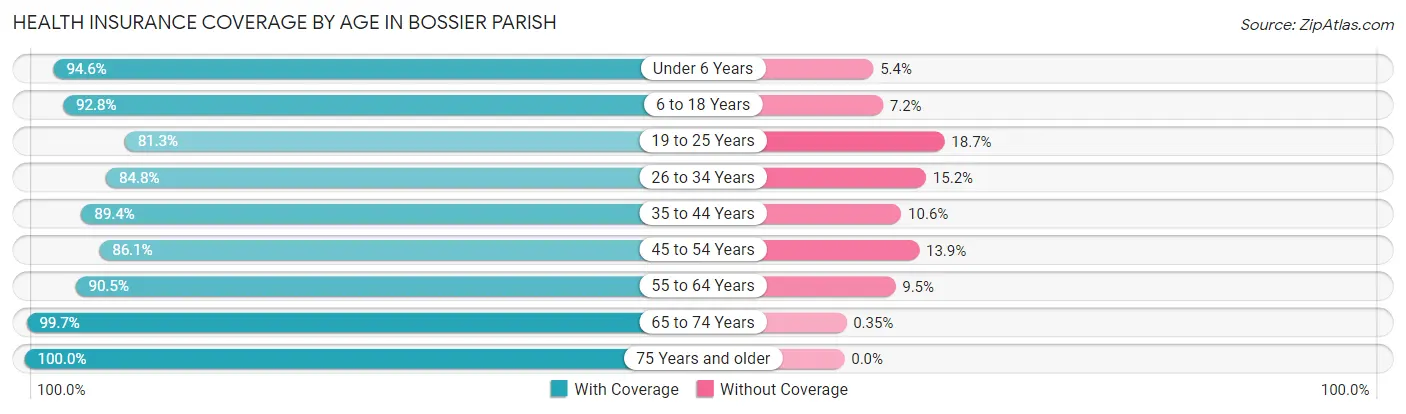
| Age Bracket | With Coverage | Without Coverage |
| Under 6 Years | 9,311 (94.6%) | 530 (5.4%) |
| 6 to 18 Years | 21,882 (92.8%) | 1,695 (7.2%) |
| 19 to 25 Years | 8,123 (81.3%) | 1,865 (18.7%) |
| 26 to 34 Years | 12,597 (84.8%) | 2,262 (15.2%) |
| 35 to 44 Years | 14,923 (89.4%) | 1,769 (10.6%) |
| 45 to 54 Years | 12,436 (86.1%) | 2,014 (13.9%) |
| 55 to 64 Years | 13,843 (90.5%) | 1,454 (9.5%) |
| 65 to 74 Years | 10,937 (99.7%) | 38 (0.4%) |
| 75 Years and older | 7,474 (100.0%) | 0 (0.0%) |
| Total | 111,526 (90.6%) | 11,627 (9.4%) |
Health Insurance Coverage by Citizenship Status in Bossier Parish
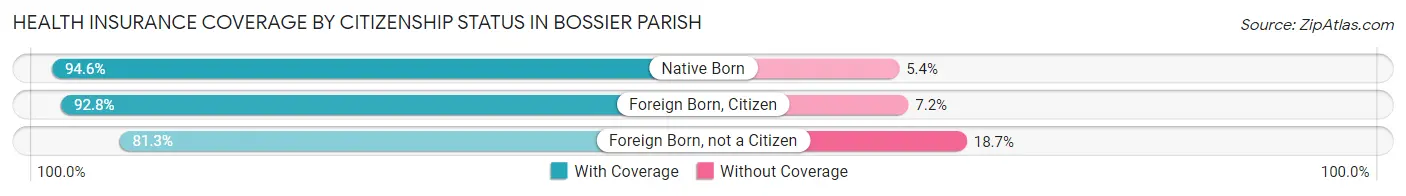
| Citizenship Status | With Coverage | Without Coverage |
| Native Born | 9,311 (94.6%) | 530 (5.4%) |
| Foreign Born, Citizen | 21,882 (92.8%) | 1,695 (7.2%) |
| Foreign Born, not a Citizen | 8,123 (81.3%) | 1,865 (18.7%) |
Health Insurance Coverage by Household Income in Bossier Parish
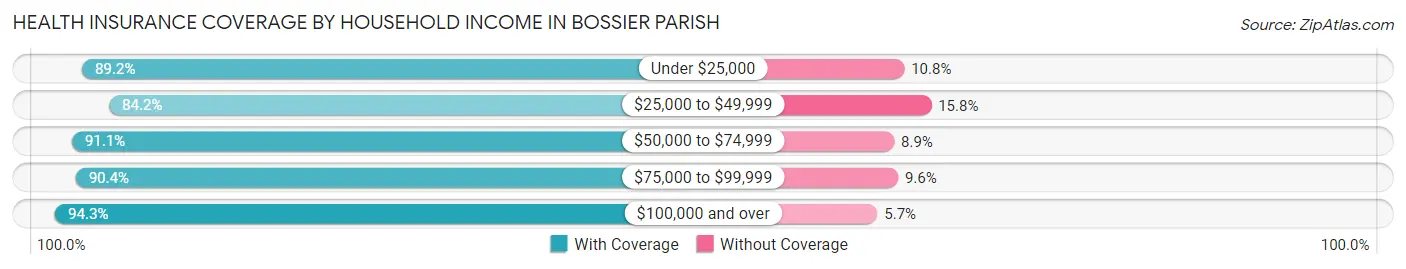
| Household Income | With Coverage | Without Coverage |
| Under $25,000 | 16,630 (89.2%) | 2,006 (10.8%) |
| $25,000 to $49,999 | 19,777 (84.2%) | 3,716 (15.8%) |
| $50,000 to $74,999 | 16,892 (91.1%) | 1,644 (8.9%) |
| $75,000 to $99,999 | 15,989 (90.4%) | 1,695 (9.6%) |
| $100,000 and over | 41,931 (94.3%) | 2,550 (5.7%) |
Public vs Private Health Insurance Coverage by Age in Bossier Parish
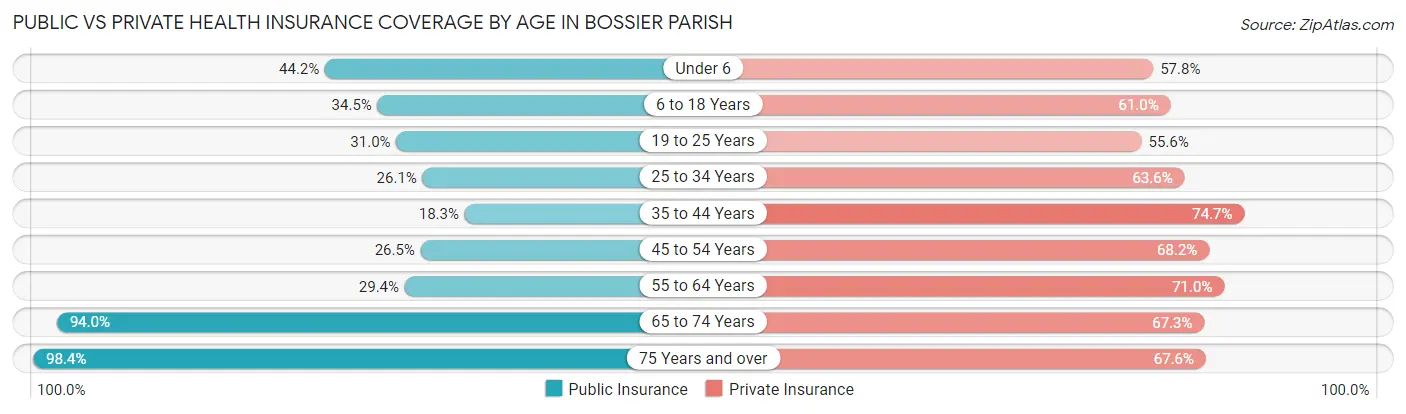
| Age Bracket | Public Insurance | Private Insurance |
| Under 6 | 4,352 (44.2%) | 5,689 (57.8%) |
| 6 to 18 Years | 8,127 (34.5%) | 14,384 (61.0%) |
| 19 to 25 Years | 3,095 (31.0%) | 5,557 (55.6%) |
| 25 to 34 Years | 3,879 (26.1%) | 9,450 (63.6%) |
| 35 to 44 Years | 3,055 (18.3%) | 12,471 (74.7%) |
| 45 to 54 Years | 3,827 (26.5%) | 9,852 (68.2%) |
| 55 to 64 Years | 4,500 (29.4%) | 10,858 (71.0%) |
| 65 to 74 Years | 10,321 (94.0%) | 7,385 (67.3%) |
| 75 Years and over | 7,357 (98.4%) | 5,050 (67.6%) |
| Total | 48,513 (39.4%) | 80,696 (65.5%) |
Disability Status by Sex by Age in Bossier Parish
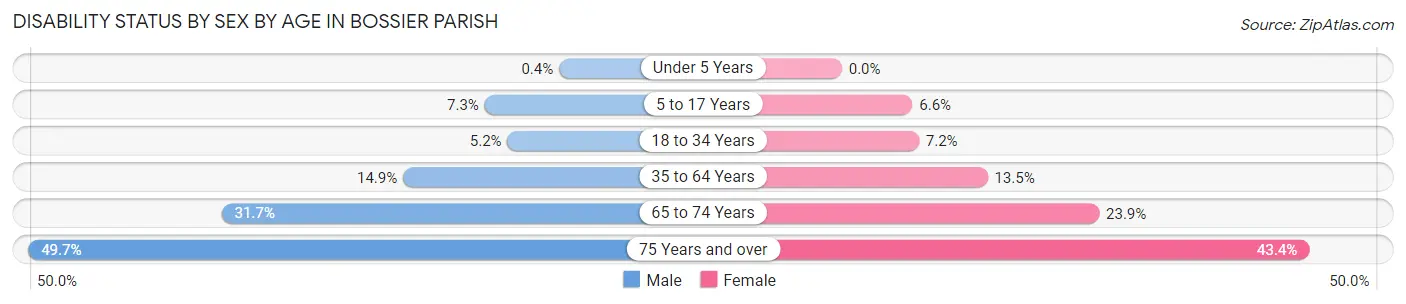
| Age Bracket | Male | Female |
| Under 5 Years | 17 (0.4%) | 0 (0.0%) |
| 5 to 17 Years | 873 (7.3%) | 745 (6.6%) |
| 18 to 34 Years | 663 (5.2%) | 984 (7.1%) |
| 35 to 64 Years | 3,347 (14.9%) | 3,237 (13.5%) |
| 65 to 74 Years | 1,587 (31.7%) | 1,426 (23.9%) |
| 75 Years and over | 1,537 (49.7%) | 1,899 (43.4%) |
Disability Class by Sex by Age in Bossier Parish
Disability Class: Hearing Difficulty
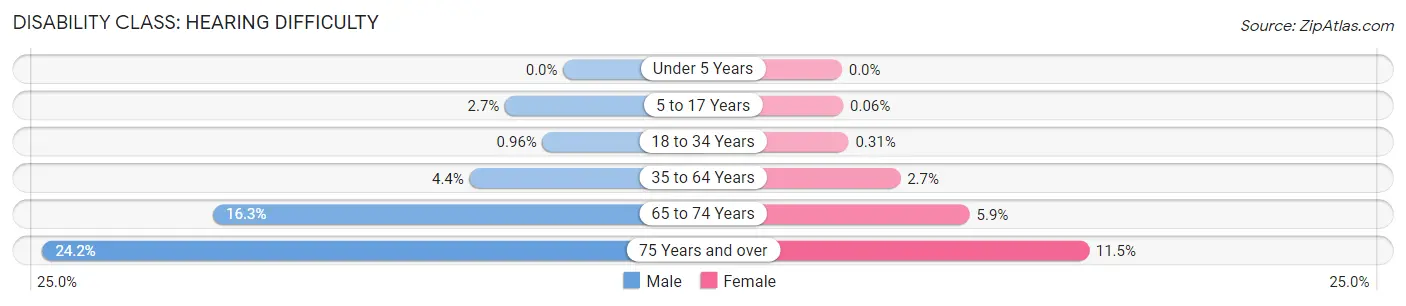
| Age Bracket | Male | Female |
| Under 5 Years | 0 (0.0%) | 0 (0.0%) |
| 5 to 17 Years | 323 (2.7%) | 7 (0.1%) |
| 18 to 34 Years | 123 (1.0%) | 42 (0.3%) |
| 35 to 64 Years | 979 (4.3%) | 649 (2.7%) |
| 65 to 74 Years | 813 (16.3%) | 354 (5.9%) |
| 75 Years and over | 748 (24.2%) | 502 (11.5%) |
Disability Class: Vision Difficulty
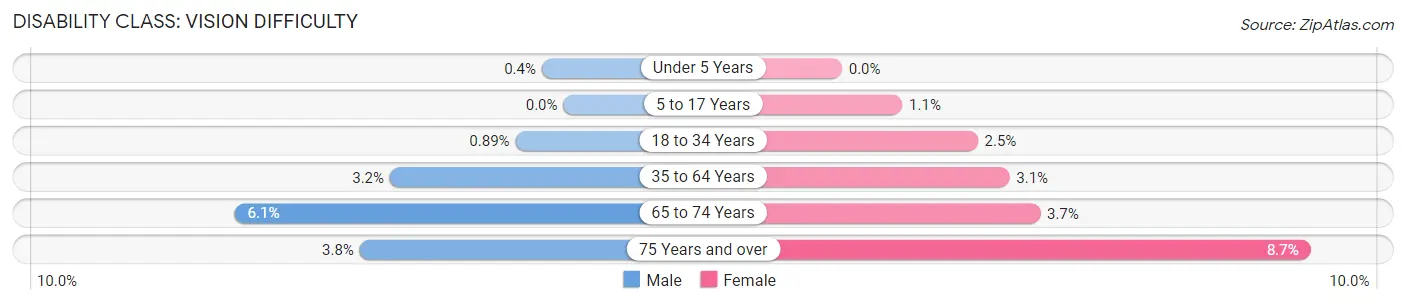
| Age Bracket | Male | Female |
| Under 5 Years | 17 (0.4%) | 0 (0.0%) |
| 5 to 17 Years | 0 (0.0%) | 127 (1.1%) |
| 18 to 34 Years | 113 (0.9%) | 347 (2.5%) |
| 35 to 64 Years | 725 (3.2%) | 745 (3.1%) |
| 65 to 74 Years | 305 (6.1%) | 220 (3.7%) |
| 75 Years and over | 117 (3.8%) | 381 (8.7%) |
Disability Class: Cognitive Difficulty
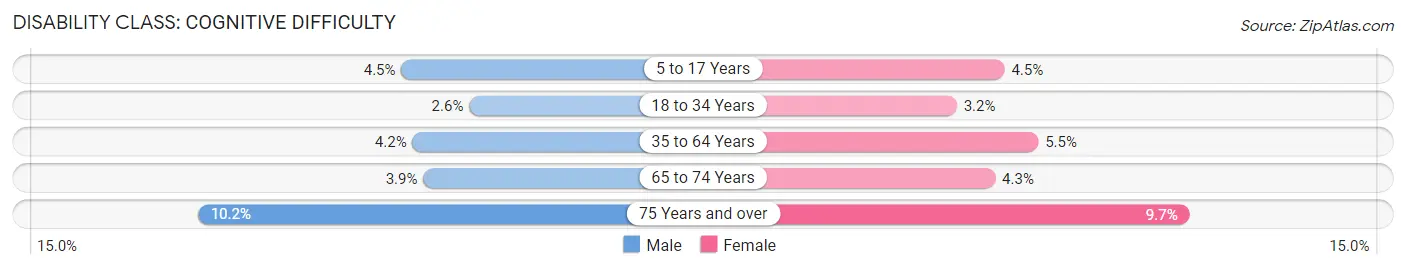
| Age Bracket | Male | Female |
| 5 to 17 Years | 539 (4.5%) | 515 (4.5%) |
| 18 to 34 Years | 335 (2.6%) | 440 (3.2%) |
| 35 to 64 Years | 945 (4.2%) | 1,311 (5.5%) |
| 65 to 74 Years | 195 (3.9%) | 255 (4.3%) |
| 75 Years and over | 315 (10.2%) | 424 (9.7%) |
Disability Class: Ambulatory Difficulty
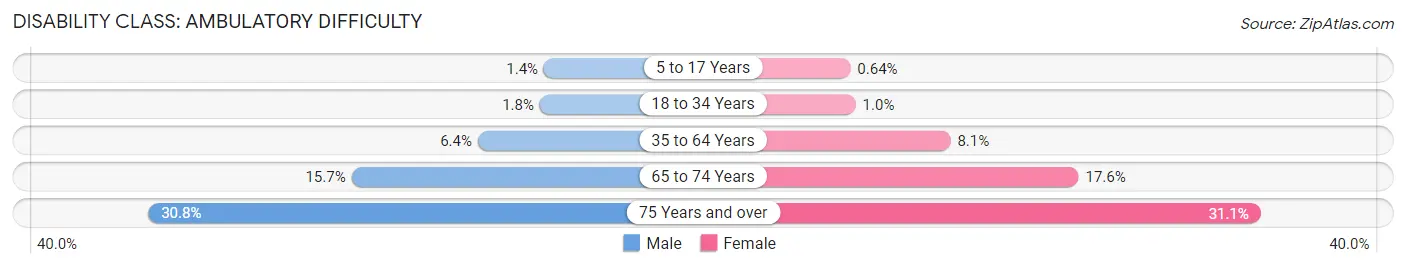
| Age Bracket | Male | Female |
| 5 to 17 Years | 172 (1.4%) | 73 (0.6%) |
| 18 to 34 Years | 223 (1.8%) | 142 (1.0%) |
| 35 to 64 Years | 1,427 (6.4%) | 1,933 (8.1%) |
| 65 to 74 Years | 787 (15.7%) | 1,050 (17.6%) |
| 75 Years and over | 954 (30.8%) | 1,362 (31.1%) |
Disability Class: Self-Care Difficulty
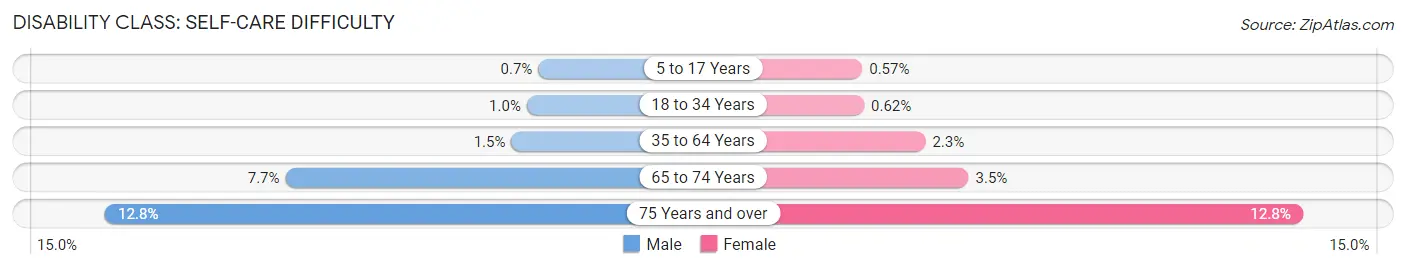
| Age Bracket | Male | Female |
| 5 to 17 Years | 84 (0.7%) | 65 (0.6%) |
| 18 to 34 Years | 130 (1.0%) | 86 (0.6%) |
| 35 to 64 Years | 325 (1.5%) | 558 (2.3%) |
| 65 to 74 Years | 387 (7.7%) | 211 (3.5%) |
| 75 Years and over | 395 (12.8%) | 562 (12.8%) |
Technology Access in Bossier Parish
Computing Device Access in Bossier Parish
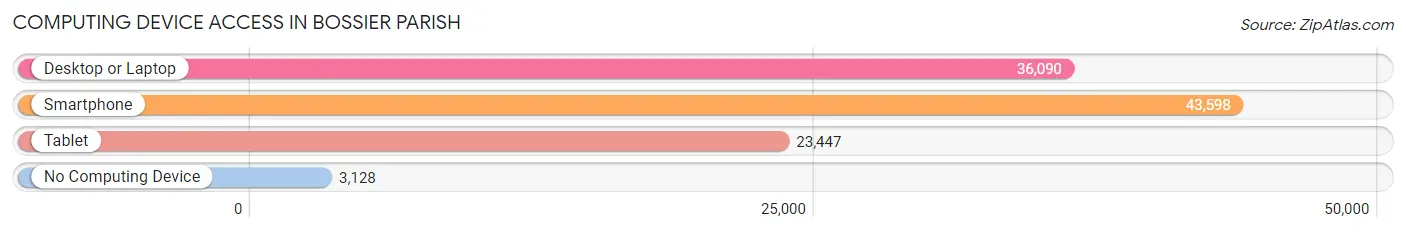
| Device Type | # Households | % Households |
| Desktop or Laptop | 36,090 | 74.2% |
| Smartphone | 43,598 | 89.6% |
| Tablet | 23,447 | 48.2% |
| No Computing Device | 3,128 | 6.4% |
| Total | 48,651 | 100.0% |
Internet Access in Bossier Parish
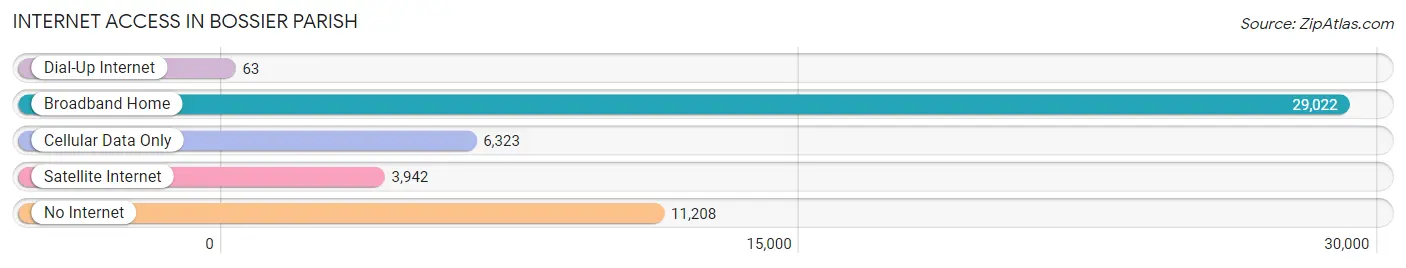
| Internet Type | # Households | % Households |
| Dial-Up Internet | 63 | 0.1% |
| Broadband Home | 29,022 | 59.7% |
| Cellular Data Only | 6,323 | 13.0% |
| Satellite Internet | 3,942 | 8.1% |
| No Internet | 11,208 | 23.0% |
| Total | 48,651 | 100.0% |
Bossier Parish Summary
Bossier Parish is a parish located in the northwestern corner of the state of Louisiana. It is bordered by Arkansas to the north, Webster Parish to the east, DeSoto Parish to the south, and Caddo Parish to the west. The parish seat is Benton, and the largest city is Bossier City. As of the 2010 census, the population of Bossier Parish was 116,979.
History
Bossier Parish was formed in 1843 from the western portion of Claiborne Parish. It was named for Pierre Evariste John Baptiste Bossier, a former Louisiana state senator and U.S. representative from Natchitoches Parish.
The parish was the site of several battles during the American Civil War. In 1863, the Union Army established a supply depot at the mouth of the Red River, which was used to supply Union troops in the region. In 1864, Confederate forces attacked the depot, but were unsuccessful in their attempt to take it.
In the late 19th century, Bossier Parish was home to a large number of cotton plantations. The parish was also home to a large number of African-American slaves, who worked on the plantations.
Geography
Bossier Parish is located in the northwestern corner of Louisiana. It is bordered by Arkansas to the north, Webster Parish to the east, DeSoto Parish to the south, and Caddo Parish to the west. The parish covers an area of 810 square miles, and is the second-largest parish in the state.
The Red River forms the northern boundary of the parish, and the Red Chute Bayou forms the western boundary. The parish is mostly flat, with some rolling hills in the northern and eastern parts. The highest point in the parish is an unnamed hill in the northern part, which has an elevation of 486 feet.
Economy
Bossier Parish has a diversified economy, with a mix of manufacturing, retail, and service industries. The largest employers in the parish are Barksdale Air Force Base, the City of Bossier City, and the Bossier Parish School Board.
The parish is home to several major manufacturing companies, including International Paper, Georgia-Pacific, and Kimberly-Clark. The parish is also home to several retail stores, including Walmart, Target, and Lowe's.
The parish is home to several casinos, including the Horseshoe Casino and Hotel, the Boomtown Casino, and the Diamond Jacks Casino. These casinos generate millions of dollars in revenue for the parish each year.
Demographics
As of the 2010 census, the population of Bossier Parish was 116,979. The racial makeup of the parish was 73.3% White, 22.2% African American, 0.7% Native American, 1.3% Asian, 0.1% Pacific Islander, 1.2% from other races, and 1.2% from two or more races. Hispanic or Latino of any race were 3.2% of the population.
The median income for a household in the parish was $45,945, and the median income for a family was $54,844. The per capita income for the parish was $22,845. About 11.2% of families and 14.2% of the population were below the poverty line, including 19.2% of those under age 18 and 10.2% of those age 65 or over.
Common Questions
What is the Total Population of Bossier Parish?
Total Population of Bossier Parish is 128,877.
What is the Total Male Population of Bossier Parish?
Total Male Population of Bossier Parish is 64,006.
What is the Total Female Population of Bossier Parish?
Total Female Population of Bossier Parish is 64,871.
What is the Ratio of Males per 100 Females in Bossier Parish?
There are 98.67 Males per 100 Females in Bossier Parish.
What is the Ratio of Females per 100 Males in Bossier Parish?
There are 101.35 Females per 100 Males in Bossier Parish.
What is the Median Population Age in Bossier Parish?
Median Population Age in Bossier Parish is 36.0 Years.
What is the Average Family Size in Bossier Parish
Average Family Size in Bossier Parish is 3.2 People.
What is the Average Household Size in Bossier Parish
Average Household Size in Bossier Parish is 2.6 People.
What is Per Capita Income in Bossier Parish?
Per Capita income in Bossier Parish is $33,873.
What is the Median Family Income in Bossier Parish?
Median Family Income in Bossier Parish is $81,271.
What is the Median Household income in Bossier Parish?
Median Household Income in Bossier Parish is $64,598.
What is Income or Wage Gap in Bossier Parish?
Income or Wage Gap in Bossier Parish is 39.4%.
Women in Bossier Parish earn 60.6 cents for every dollar earned by a man.
What is Family Income Deficit in Bossier Parish?
Family Income Deficit in Bossier Parish is $11,394.
Families that are below poverty line in Bossier Parish earn $11,394 less on average than the poverty threshold level.
What is Inequality or Gini Index in Bossier Parish?
Inequality or Gini Index in Bossier Parish is 0.46.
How Large is the Labor Force in Bossier Parish?
There are 61,617 People in the Labor Forcein in Bossier Parish.
What is the Percentage of People in the Labor Force in Bossier Parish?
61.2% of People are in the Labor Force in Bossier Parish.
What is the Unemployment Rate in Bossier Parish?
Unemployment Rate in Bossier Parish is 5.6%.