Bienville Parish, LA
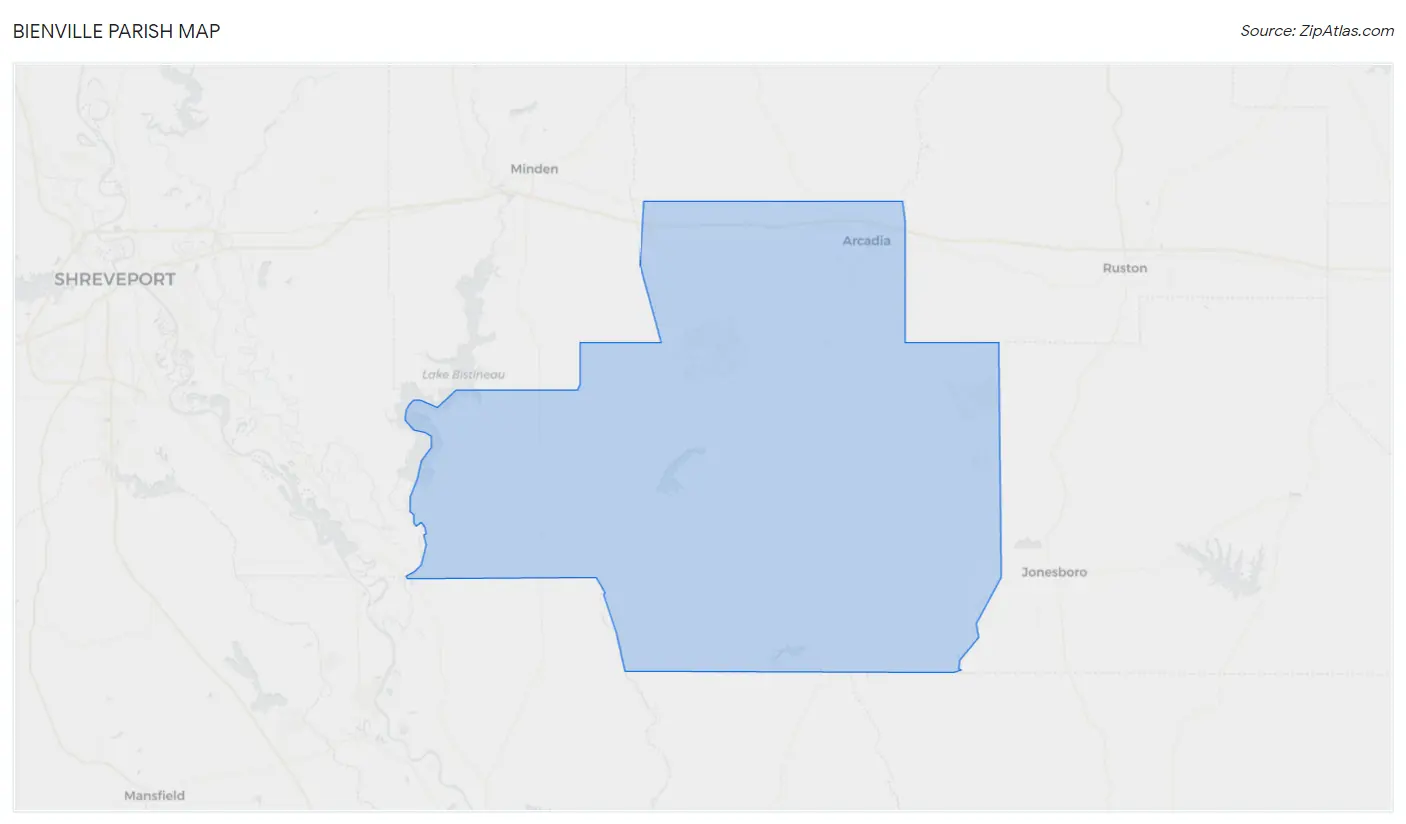
Bienville Parish Map
Bienville Parish Overview
12,958
TOTAL POPULATION
6,192
MALE POPULATION
6,766
FEMALE POPULATION
91.52
MALES / 100 FEMALES
109.27
FEMALES / 100 MALES
42.1
MEDIAN AGE
3.2
AVG FAMILY SIZE
2.4
AVG HOUSEHOLD SIZE
$22,269
PER CAPITA INCOME
$50,606
AVG FAMILY INCOME
$34,268
AVG HOUSEHOLD INCOME
35.4%
WAGE / INCOME GAP [ % ]
64.6¢/ $1
WAGE / INCOME GAP [ $ ]
$11,130
FAMILY INCOME DEFICIT
0.47
INEQUALITY / GINI INDEX
4,776
LABOR FORCE [ PEOPLE ]
45.8%
PERCENT IN LABOR FORCE
5.6%
UNEMPLOYMENT RATE
Bienville Parish Area Codes
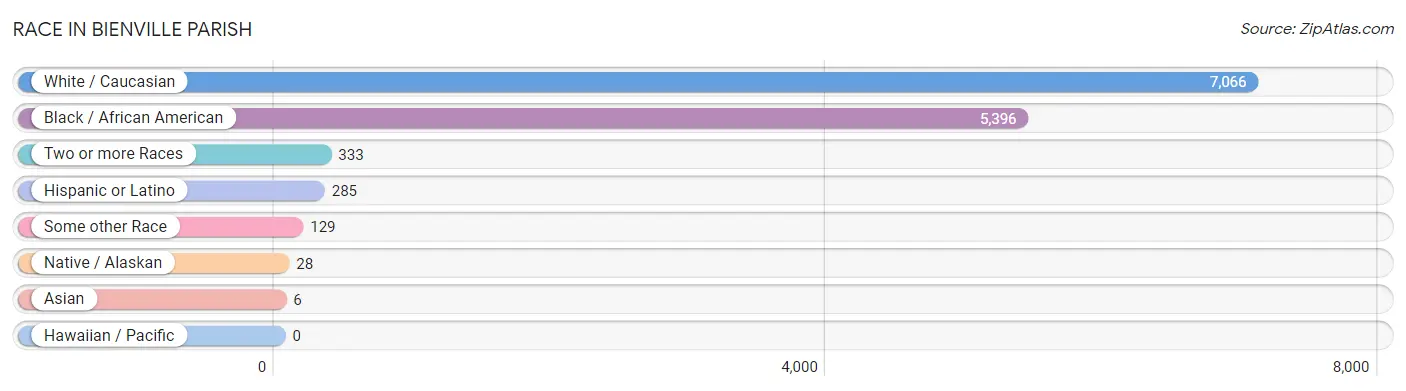
Race in Bienville Parish
The most populous races in Bienville Parish are White / Caucasian (7,066 | 54.5%), Black / African American (5,396 | 41.6%), and Two or more Races (333 | 2.6%).
| Race | # Population | % Population |
| Asian | 6 | 0.1% |
| Black / African American | 5,396 | 41.6% |
| Hawaiian / Pacific | 0 | 0.0% |
| Hispanic or Latino | 285 | 2.2% |
| Native / Alaskan | 28 | 0.2% |
| White / Caucasian | 7,066 | 54.5% |
| Two or more Races | 333 | 2.6% |
| Some other Race | 129 | 1.0% |
| Total | 12,958 | 100.0% |
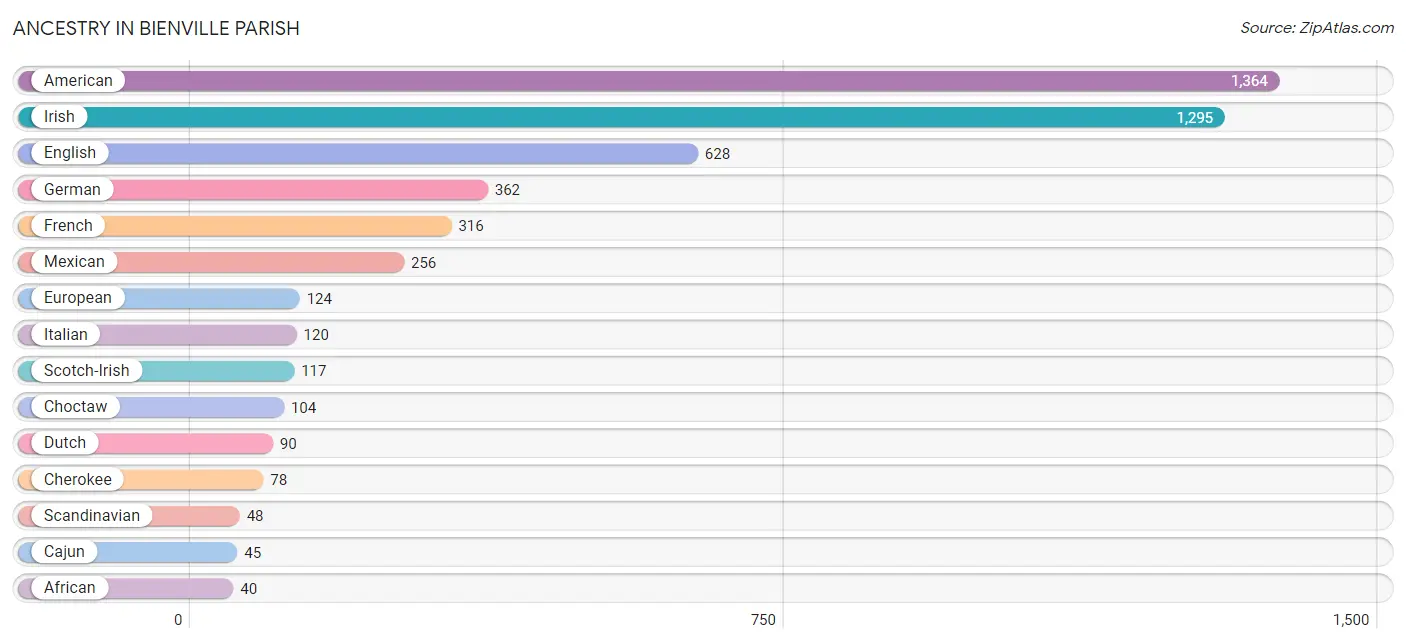
Ancestry in Bienville Parish
The most populous ancestries reported in Bienville Parish are American (1,364 | 10.5%), Irish (1,295 | 10.0%), English (628 | 4.9%), German (362 | 2.8%), and French (316 | 2.4%), together accounting for 30.6% of all Bienville Parish residents.
| Ancestry | # Population | % Population |
| African | 40 | 0.3% |
| American | 1,364 | 10.5% |
| Bhutanese | 1 | 0.0% |
| British | 16 | 0.1% |
| Cajun | 45 | 0.4% |
| Canadian | 4 | 0.0% |
| Central American | 1 | 0.0% |
| Cherokee | 78 | 0.6% |
| Chickasaw | 9 | 0.1% |
| Choctaw | 104 | 0.8% |
| Dutch | 90 | 0.7% |
| Eastern European | 25 | 0.2% |
| English | 628 | 4.9% |
| European | 124 | 1.0% |
| French | 316 | 2.4% |
| French American Indian | 2 | 0.0% |
| French Canadian | 23 | 0.2% |
| German | 362 | 2.8% |
| Irish | 1,295 | 10.0% |
| Italian | 120 | 0.9% |
| Korean | 3 | 0.0% |
| Lithuanian | 2 | 0.0% |
| Mexican | 256 | 2.0% |
| Nicaraguan | 1 | 0.0% |
| Pakistani | 29 | 0.2% |
| Polish | 4 | 0.0% |
| Puerto Rican | 4 | 0.0% |
| Scandinavian | 48 | 0.4% |
| Scotch-Irish | 117 | 0.9% |
| Scottish | 9 | 0.1% |
| Spanish | 24 | 0.2% |
| Subsaharan African | 40 | 0.3% |
| Swedish | 19 | 0.2% |
| Thai | 3 | 0.0% |
| Welsh | 28 | 0.2% | View All 35 Rows |
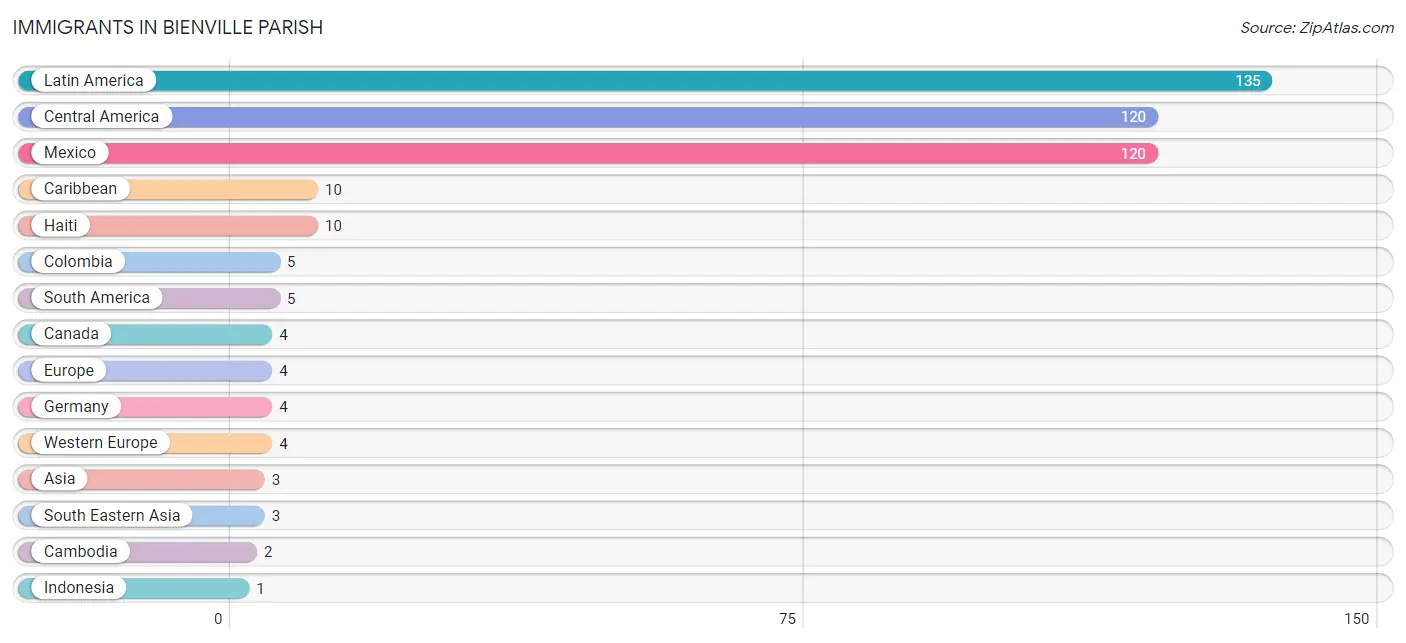
Immigrants in Bienville Parish
The most numerous immigrant groups reported in Bienville Parish came from Latin America (135 | 1.0%), Central America (120 | 0.9%), Mexico (120 | 0.9%), Caribbean (10 | 0.1%), and Haiti (10 | 0.1%), together accounting for 3.1% of all Bienville Parish residents.
| Immigration Origin | # Population | % Population |
| Asia | 3 | 0.0% |
| Cambodia | 2 | 0.0% |
| Canada | 4 | 0.0% |
| Caribbean | 10 | 0.1% |
| Central America | 120 | 0.9% |
| Colombia | 5 | 0.0% |
| Europe | 4 | 0.0% |
| Germany | 4 | 0.0% |
| Haiti | 10 | 0.1% |
| Indonesia | 1 | 0.0% |
| Latin America | 135 | 1.0% |
| Mexico | 120 | 0.9% |
| South America | 5 | 0.0% |
| South Eastern Asia | 3 | 0.0% |
| Western Europe | 4 | 0.0% | View All 15 Rows |
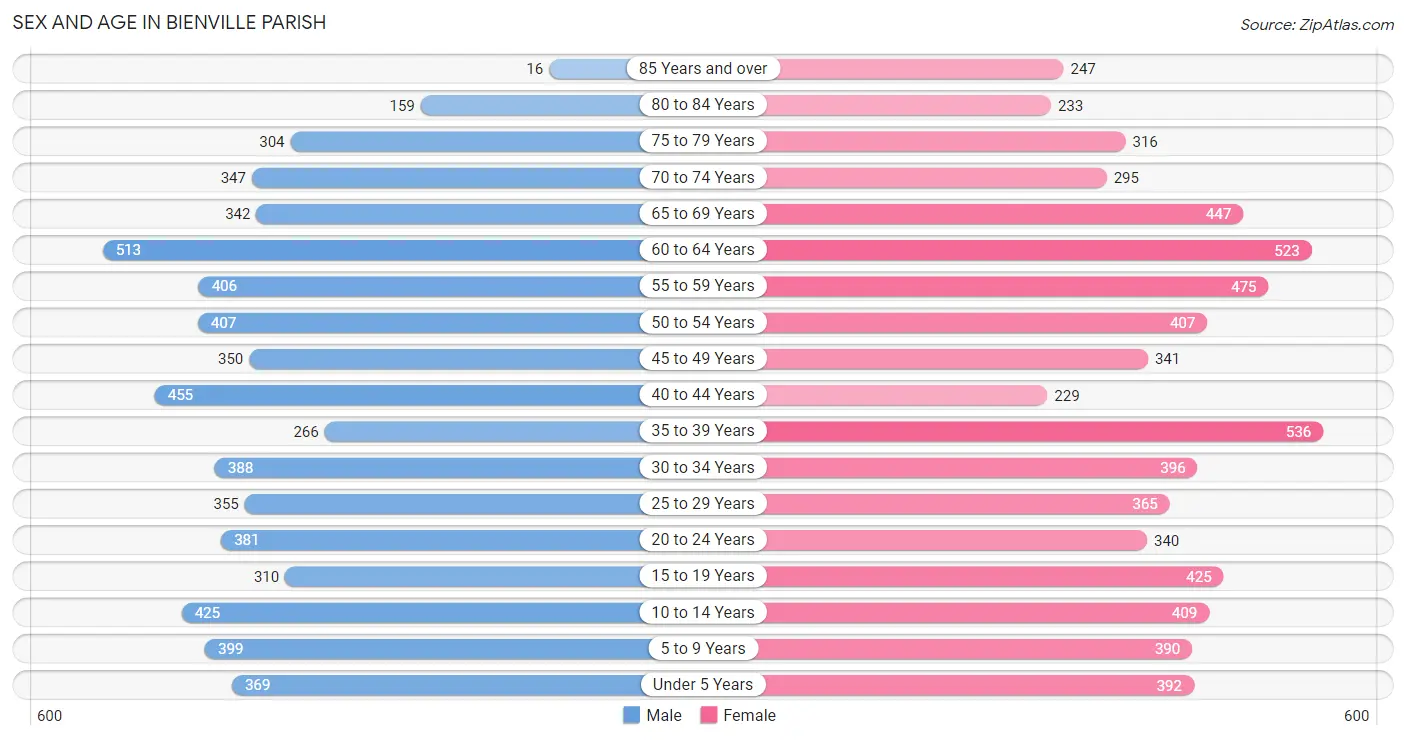
Sex and Age in Bienville Parish
Sex and Age in Bienville Parish
The most populous age groups in Bienville Parish are 60 to 64 Years (513 | 8.3%) for men and 35 to 39 Years (536 | 7.9%) for women.
| Age Bracket | Male | Female |
| Under 5 Years | 369 (6.0%) | 392 (5.8%) |
| 5 to 9 Years | 399 (6.4%) | 390 (5.8%) |
| 10 to 14 Years | 425 (6.9%) | 409 (6.0%) |
| 15 to 19 Years | 310 (5.0%) | 425 (6.3%) |
| 20 to 24 Years | 381 (6.1%) | 340 (5.0%) |
| 25 to 29 Years | 355 (5.7%) | 365 (5.4%) |
| 30 to 34 Years | 388 (6.3%) | 396 (5.9%) |
| 35 to 39 Years | 266 (4.3%) | 536 (7.9%) |
| 40 to 44 Years | 455 (7.3%) | 229 (3.4%) |
| 45 to 49 Years | 350 (5.7%) | 341 (5.0%) |
| 50 to 54 Years | 407 (6.6%) | 407 (6.0%) |
| 55 to 59 Years | 406 (6.6%) | 475 (7.0%) |
| 60 to 64 Years | 513 (8.3%) | 523 (7.7%) |
| 65 to 69 Years | 342 (5.5%) | 447 (6.6%) |
| 70 to 74 Years | 347 (5.6%) | 295 (4.4%) |
| 75 to 79 Years | 304 (4.9%) | 316 (4.7%) |
| 80 to 84 Years | 159 (2.6%) | 233 (3.4%) |
| 85 Years and over | 16 (0.3%) | 247 (3.6%) |
| Total | 6,192 (100.0%) | 6,766 (100.0%) |
Families and Households in Bienville Parish
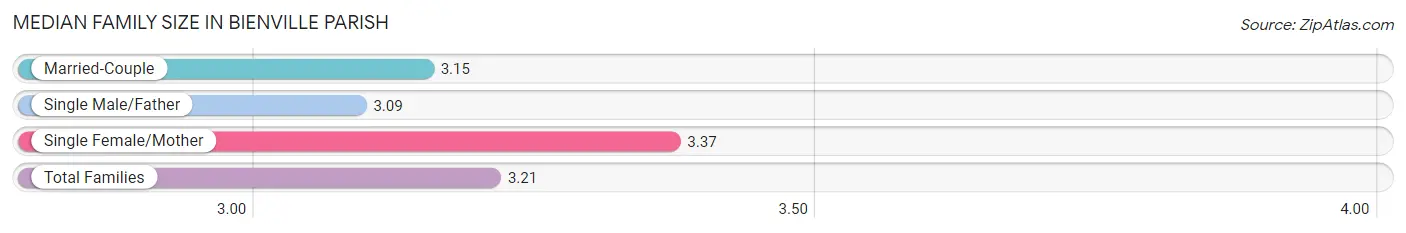
Median Family Size in Bienville Parish
The median family size in Bienville Parish is 3.21 persons per family, with single female/mother families (877 | 28.4%) accounting for the largest median family size of 3.37 persons per family. On the other hand, single male/father families (256 | 8.3%) represent the smallest median family size with 3.09 persons per family.
| Family Type | # Families | Family Size |
| Married-Couple | 1,957 (63.3%) | 3.15 |
| Single Male/Father | 256 (8.3%) | 3.09 |
| Single Female/Mother | 877 (28.4%) | 3.37 |
| Total Families | 3,090 (100.0%) | 3.21 |
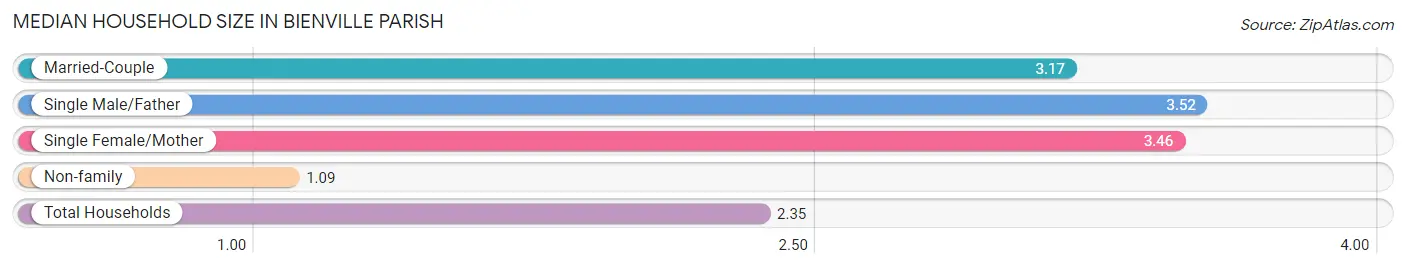
Median Household Size in Bienville Parish
The median household size in Bienville Parish is 2.35 persons per household, with single male/father households (256 | 4.8%) accounting for the largest median household size of 3.52 persons per household. non-family households (2,285 | 42.5%) represent the smallest median household size with 1.09 persons per household.
| Household Type | # Households | Household Size |
| Married-Couple | 1,957 (36.4%) | 3.17 |
| Single Male/Father | 256 (4.8%) | 3.52 |
| Single Female/Mother | 877 (16.3%) | 3.46 |
| Non-family | 2,285 (42.5%) | 1.09 |
| Total Households | 5,375 (100.0%) | 2.35 |
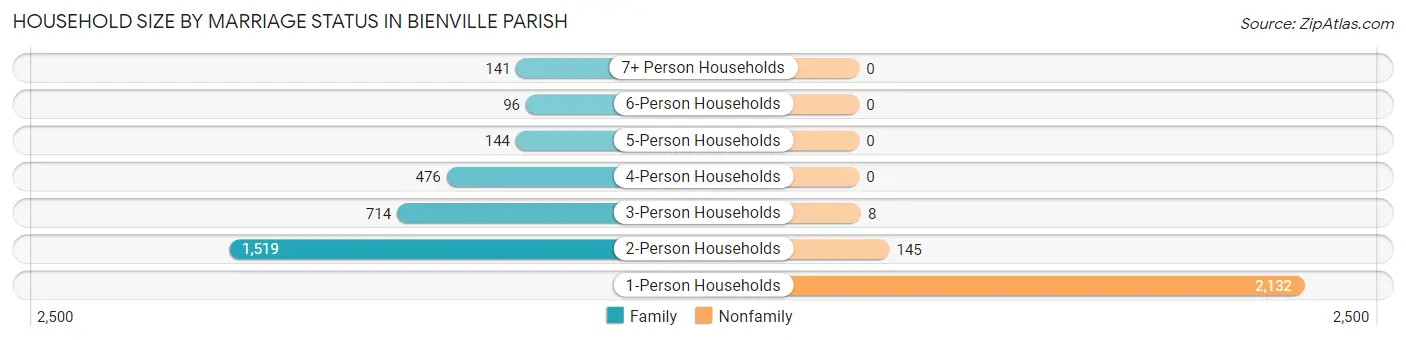
Household Size by Marriage Status in Bienville Parish
Out of a total of 5,375 households in Bienville Parish, 3,090 (57.5%) are family households, while 2,285 (42.5%) are nonfamily households. The most numerous type of family households are 2-person households, comprising 1,519, and the most common type of nonfamily households are 1-person households, comprising 2,132.
| Household Size | Family Households | Nonfamily Households |
| 1-Person Households | - | 2,132 (39.7%) |
| 2-Person Households | 1,519 (28.3%) | 145 (2.7%) |
| 3-Person Households | 714 (13.3%) | 8 (0.2%) |
| 4-Person Households | 476 (8.9%) | 0 (0.0%) |
| 5-Person Households | 144 (2.7%) | 0 (0.0%) |
| 6-Person Households | 96 (1.8%) | 0 (0.0%) |
| 7+ Person Households | 141 (2.6%) | 0 (0.0%) |
| Total | 3,090 (57.5%) | 2,285 (42.5%) |
Female Fertility in Bienville Parish
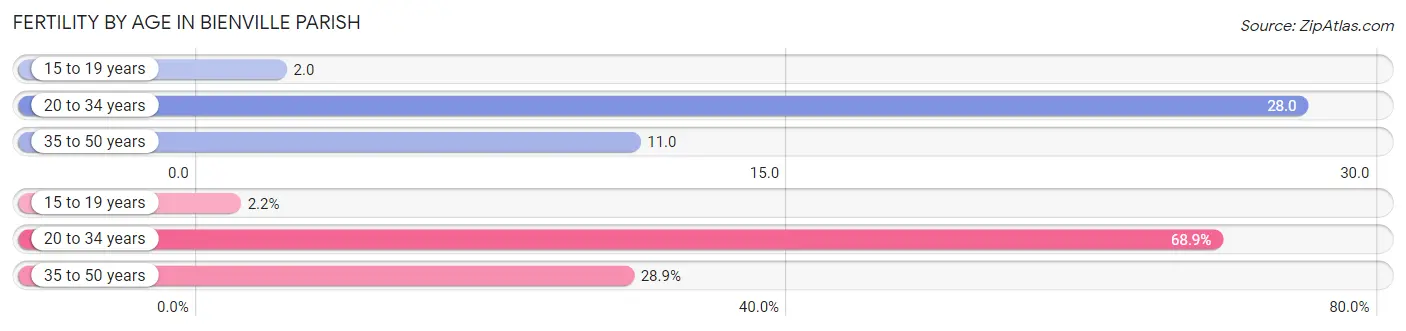
Fertility by Age in Bienville Parish
Average fertility rate in Bienville Parish is 17.0 births per 1,000 women. Women in the age bracket of 20 to 34 years have the highest fertility rate with 28.0 births per 1,000 women. Women in the age bracket of 20 to 34 years acount for 68.9% of all women with births.
| Age Bracket | Women with Births | Births / 1,000 Women |
| 15 to 19 years | 1 (2.2%) | 2.0 |
| 20 to 34 years | 31 (68.9%) | 28.0 |
| 35 to 50 years | 13 (28.9%) | 11.0 |
| Total | 45 (100.0%) | 17.0 |
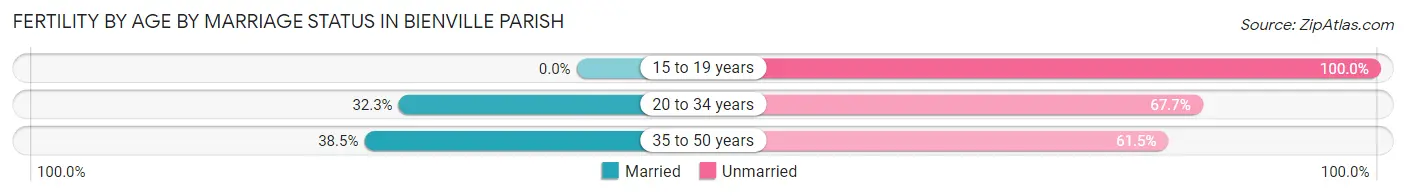
Fertility by Age by Marriage Status in Bienville Parish
33.3% of women with births (45) in Bienville Parish are married. The highest percentage of unmarried women with births falls into 15 to 19 years age bracket with 100.0% of them unmarried at the time of birth, while the lowest percentage of unmarried women with births belong to 35 to 50 years age bracket with 61.5% of them unmarried.
| Age Bracket | Married | Unmarried |
| 15 to 19 years | 0 (0.0%) | 1 (100.0%) |
| 20 to 34 years | 10 (32.3%) | 21 (67.7%) |
| 35 to 50 years | 5 (38.5%) | 8 (61.5%) |
| Total | 15 (33.3%) | 30 (66.7%) |
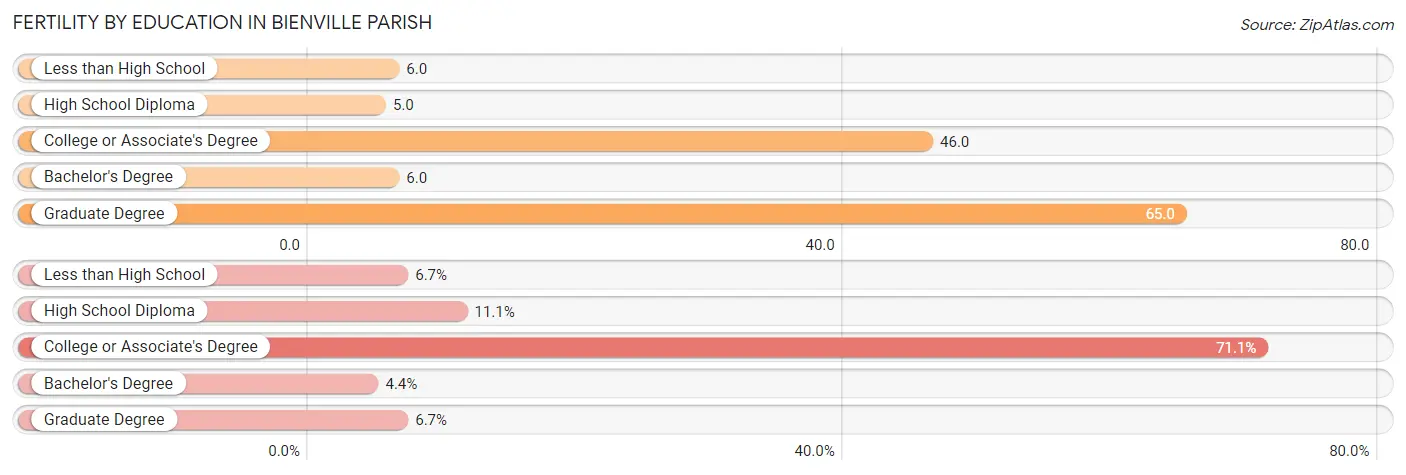
Fertility by Education in Bienville Parish
Average fertility rate in Bienville Parish is 17.0 births per 1,000 women. Women with the education attainment of graduate degree have the highest fertility rate of 65.0 births per 1,000 women, while women with the education attainment of high school diploma have the lowest fertility at 5.0 births per 1,000 women. Women with the education attainment of college or associate's degree represent 71.1% of all women with births.
| Educational Attainment | Women with Births | Births / 1,000 Women |
| Less than High School | 3 (6.7%) | 6.0 |
| High School Diploma | 5 (11.1%) | 5.0 |
| College or Associate's Degree | 32 (71.1%) | 46.0 |
| Bachelor's Degree | 2 (4.4%) | 6.0 |
| Graduate Degree | 3 (6.7%) | 65.0 |
| Total | 45 (100.0%) | 17.0 |
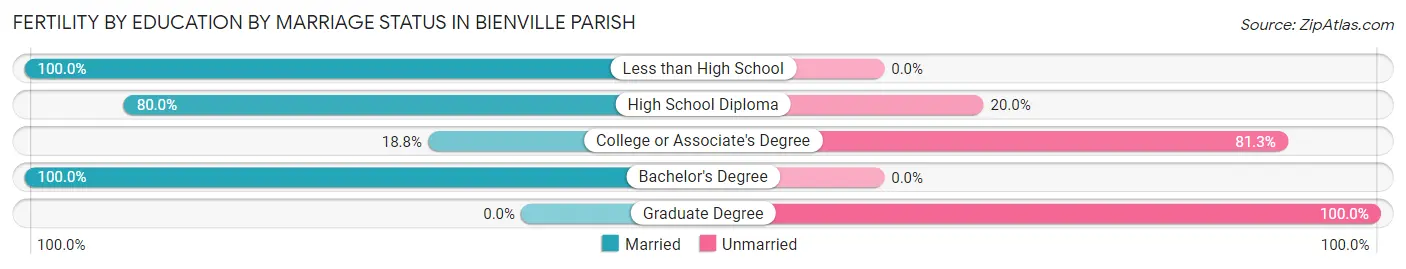
Fertility by Education by Marriage Status in Bienville Parish
66.7% of women with births in Bienville Parish are unmarried. Women with the educational attainment of less than high school are most likely to be married with 100.0% of them married at childbirth, while women with the educational attainment of graduate degree are least likely to be married with 100.0% of them unmarried at childbirth.
| Educational Attainment | Married | Unmarried |
| Less than High School | 3 (100.0%) | 0 (0.0%) |
| High School Diploma | 4 (80.0%) | 1 (20.0%) |
| College or Associate's Degree | 6 (18.8%) | 26 (81.2%) |
| Bachelor's Degree | 2 (100.0%) | 0 (0.0%) |
| Graduate Degree | 0 (0.0%) | 3 (100.0%) |
| Total | 15 (33.3%) | 30 (66.7%) |
Income in Bienville Parish
Income Overview in Bienville Parish
Per Capita Income in Bienville Parish is $22,269, while median incomes of families and households are $50,606 and $34,268 respectively.
| Characteristic | Number | Measure |
| Per Capita Income | 12,958 | $22,269 |
| Median Family Income | 3,090 | $50,606 |
| Mean Family Income | 3,090 | $64,945 |
| Median Household Income | 5,375 | $34,268 |
| Mean Household Income | 5,375 | $50,794 |
| Income Deficit | 3,090 | $11,130 |
| Wage / Income Gap (%) | 12,958 | 35.39% |
| Wage / Income Gap ($) | 12,958 | 64.61¢ per $1 |
| Gini / Inequality Index | 12,958 | 0.47 |
Earnings by Sex in Bienville Parish
Average Earnings in Bienville Parish are $29,302, $36,370 for men and $23,499 for women, a difference of 35.4%.
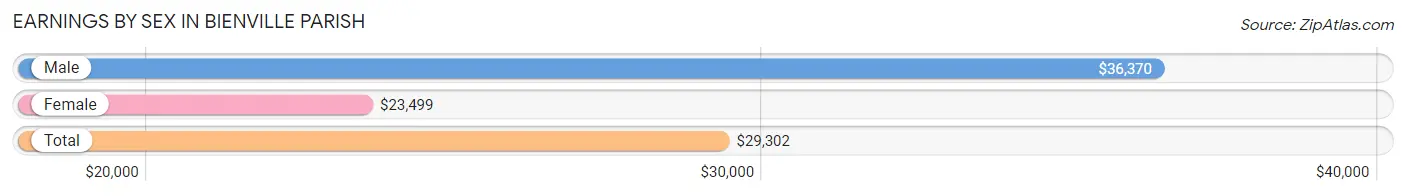
| Sex | Number | Average Earnings |
| Male | 2,703 (55.5%) | $36,370 |
| Female | 2,165 (44.5%) | $23,499 |
| Total | 4,868 (100.0%) | $29,302 |
Earnings by Sex by Income Bracket in Bienville Parish
The most common earnings brackets in Bienville Parish are $100,000+ for men (320 | 11.8%) and $25,000 to $29,999 for women (243 | 11.2%).
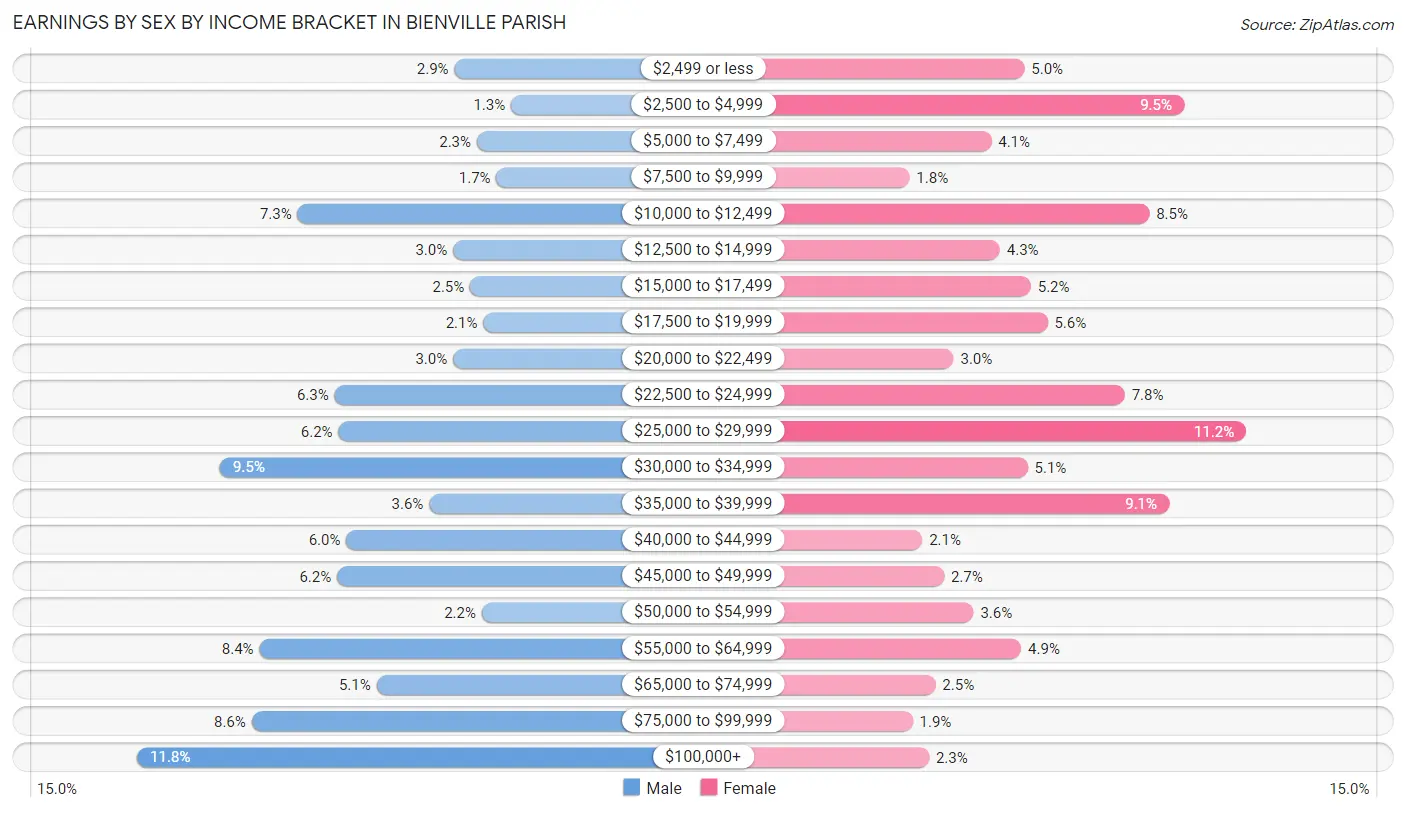
| Income | Male | Female |
| $2,499 or less | 79 (2.9%) | 108 (5.0%) |
| $2,500 to $4,999 | 36 (1.3%) | 205 (9.5%) |
| $5,000 to $7,499 | 62 (2.3%) | 88 (4.1%) |
| $7,500 to $9,999 | 47 (1.7%) | 38 (1.8%) |
| $10,000 to $12,499 | 198 (7.3%) | 184 (8.5%) |
| $12,500 to $14,999 | 80 (3.0%) | 93 (4.3%) |
| $15,000 to $17,499 | 67 (2.5%) | 112 (5.2%) |
| $17,500 to $19,999 | 57 (2.1%) | 122 (5.6%) |
| $20,000 to $22,499 | 80 (3.0%) | 65 (3.0%) |
| $22,500 to $24,999 | 170 (6.3%) | 169 (7.8%) |
| $25,000 to $29,999 | 167 (6.2%) | 243 (11.2%) |
| $30,000 to $34,999 | 257 (9.5%) | 110 (5.1%) |
| $35,000 to $39,999 | 98 (3.6%) | 196 (9.0%) |
| $40,000 to $44,999 | 161 (6.0%) | 46 (2.1%) |
| $45,000 to $49,999 | 168 (6.2%) | 59 (2.7%) |
| $50,000 to $54,999 | 58 (2.1%) | 77 (3.6%) |
| $55,000 to $64,999 | 227 (8.4%) | 106 (4.9%) |
| $65,000 to $74,999 | 138 (5.1%) | 54 (2.5%) |
| $75,000 to $99,999 | 233 (8.6%) | 40 (1.8%) |
| $100,000+ | 320 (11.8%) | 50 (2.3%) |
| Total | 2,703 (100.0%) | 2,165 (100.0%) |
Earnings by Sex by Educational Attainment in Bienville Parish
Average earnings in Bienville Parish are $37,434 for men and $24,963 for women, a difference of 33.3%. Men with an educational attainment of bachelor's degree enjoy the highest average annual earnings of $103,162, while those with high school diploma education earn the least with $30,361. Women with an educational attainment of graduate degree earn the most with the average annual earnings of $61,029, while those with less than high school education have the smallest earnings of $12,143.
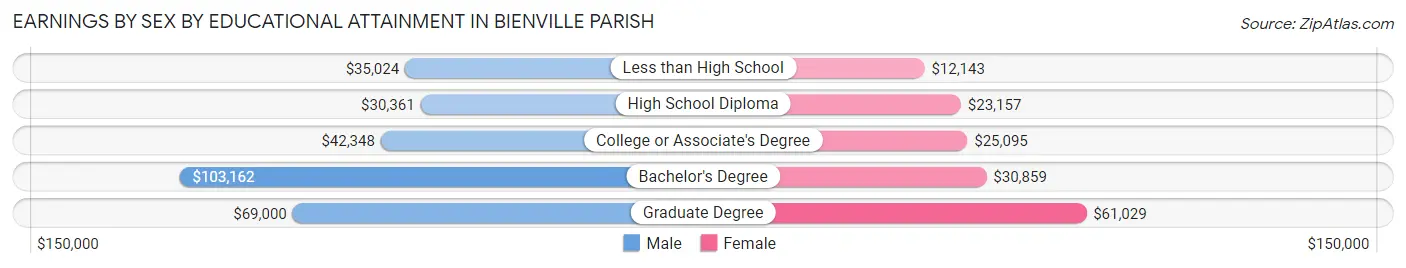
| Educational Attainment | Male Income | Female Income |
| Less than High School | $35,024 | $12,143 |
| High School Diploma | $30,361 | $23,157 |
| College or Associate's Degree | $42,348 | $25,095 |
| Bachelor's Degree | $103,162 | $30,859 |
| Graduate Degree | $69,000 | $61,029 |
| Total | $37,434 | $24,963 |
Family Income in Bienville Parish
Family Income Brackets in Bienville Parish
According to the Bienville Parish family income data, there are 575 families falling into the $50,000 to $74,999 income range, which is the most common income bracket and makes up 18.6% of all families. Conversely, the $200,000+ income bracket is the least frequent group with only 53 families (1.7%) belonging to this category.
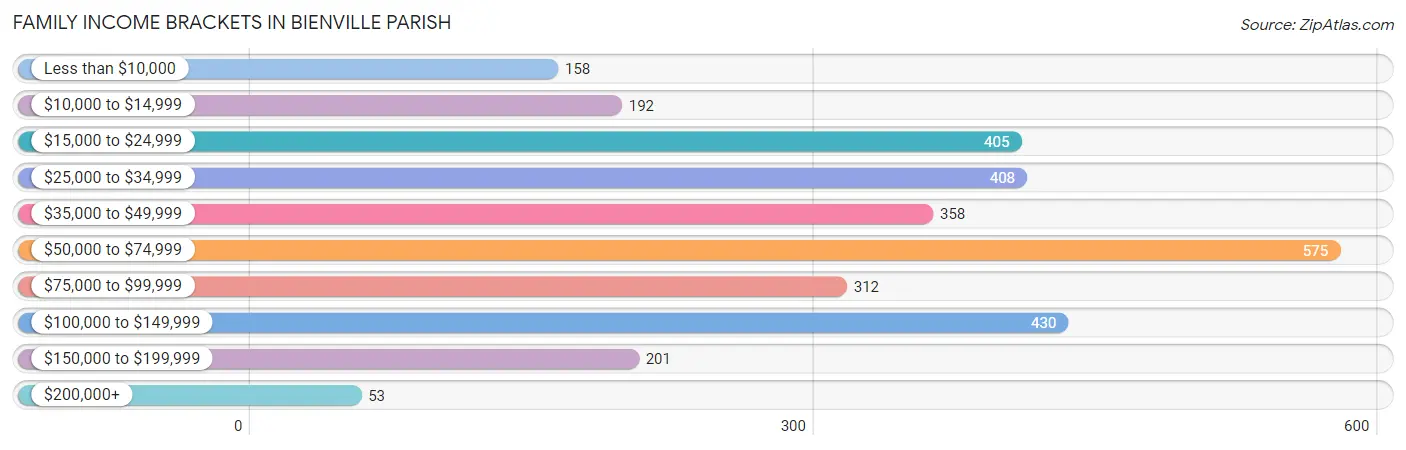
| Income Bracket | # Families | % Families |
| Less than $10,000 | 158 | 5.1% |
| $10,000 to $14,999 | 192 | 6.2% |
| $15,000 to $24,999 | 405 | 13.1% |
| $25,000 to $34,999 | 408 | 13.2% |
| $35,000 to $49,999 | 358 | 11.6% |
| $50,000 to $74,999 | 575 | 18.6% |
| $75,000 to $99,999 | 312 | 10.1% |
| $100,000 to $149,999 | 430 | 13.9% |
| $150,000 to $199,999 | 201 | 6.5% |
| $200,000+ | 53 | 1.7% |
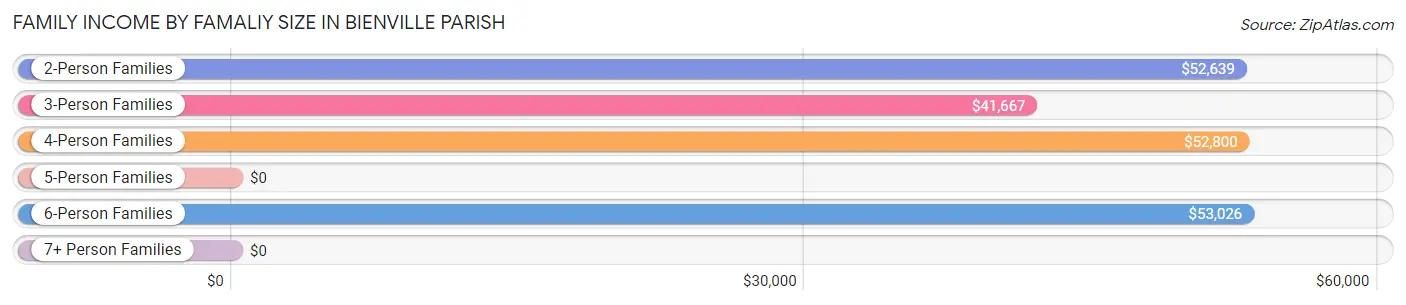
Family Income by Famaliy Size in Bienville Parish
6-person families (110 | 3.6%) account for the highest median family income in Bienville Parish with $53,026 per family, while 2-person families (1,556 | 50.4%) have the highest median income of $26,320 per family member.
| Income Bracket | # Families | Median Income |
| 2-Person Families | 1,556 (50.4%) | $52,639 |
| 3-Person Families | 714 (23.1%) | $41,667 |
| 4-Person Families | 508 (16.4%) | $52,800 |
| 5-Person Families | 75 (2.4%) | $0 |
| 6-Person Families | 110 (3.6%) | $53,026 |
| 7+ Person Families | 127 (4.1%) | $0 |
| Total | 3,090 (100.0%) | $50,606 |
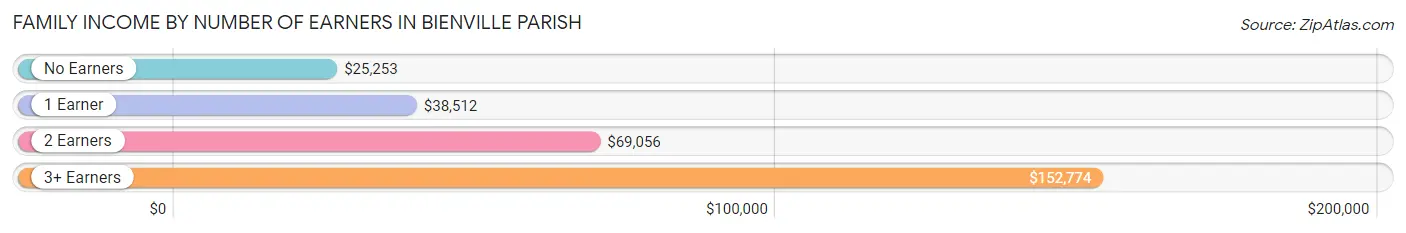
Family Income by Number of Earners in Bienville Parish
The median family income in Bienville Parish is $50,606, with families comprising 3+ earners (101) having the highest median family income of $152,774, while families with no earners (732) have the lowest median family income of $25,253, accounting for 3.3% and 23.7% of families, respectively.
| Number of Earners | # Families | Median Income |
| No Earners | 732 (23.7%) | $25,253 |
| 1 Earner | 1,200 (38.8%) | $38,512 |
| 2 Earners | 1,057 (34.2%) | $69,056 |
| 3+ Earners | 101 (3.3%) | $152,774 |
| Total | 3,090 (100.0%) | $50,606 |
Household Income in Bienville Parish
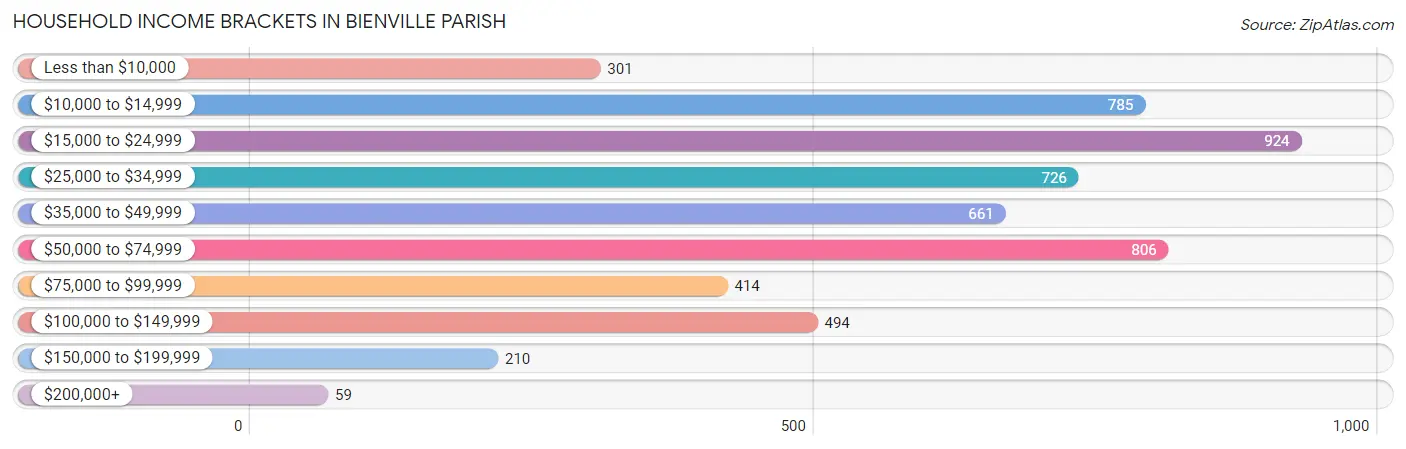
Household Income Brackets in Bienville Parish
With 924 households falling in the category, the $15,000 to $24,999 income range is the most frequent in Bienville Parish, accounting for 17.2% of all households. In contrast, only 59 households (1.1%) fall into the $200,000+ income bracket, making it the least populous group.
| Income Bracket | # Households | % Households |
| Less than $10,000 | 301 | 5.6% |
| $10,000 to $14,999 | 785 | 14.6% |
| $15,000 to $24,999 | 924 | 17.2% |
| $25,000 to $34,999 | 726 | 13.5% |
| $35,000 to $49,999 | 661 | 12.3% |
| $50,000 to $74,999 | 806 | 15.0% |
| $75,000 to $99,999 | 414 | 7.7% |
| $100,000 to $149,999 | 494 | 9.2% |
| $150,000 to $199,999 | 210 | 3.9% |
| $200,000+ | 59 | 1.1% |
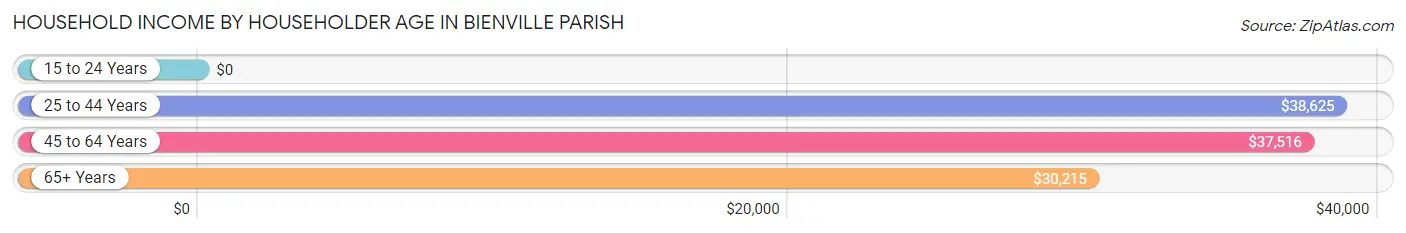
Household Income by Householder Age in Bienville Parish
The median household income in Bienville Parish is $34,268, with the highest median household income of $38,625 found in the 25 to 44 years age bracket for the primary householder. A total of 1,414 households (26.3%) fall into this category. Meanwhile, the 15 to 24 years age bracket for the primary householder has the lowest median household income of $0, with 104 households (1.9%) in this group.
| Income Bracket | # Households | Median Income |
| 15 to 24 Years | 104 (1.9%) | $0 |
| 25 to 44 Years | 1,414 (26.3%) | $38,625 |
| 45 to 64 Years | 2,046 (38.1%) | $37,516 |
| 65+ Years | 1,811 (33.7%) | $30,215 |
| Total | 5,375 (100.0%) | $34,268 |
Poverty in Bienville Parish
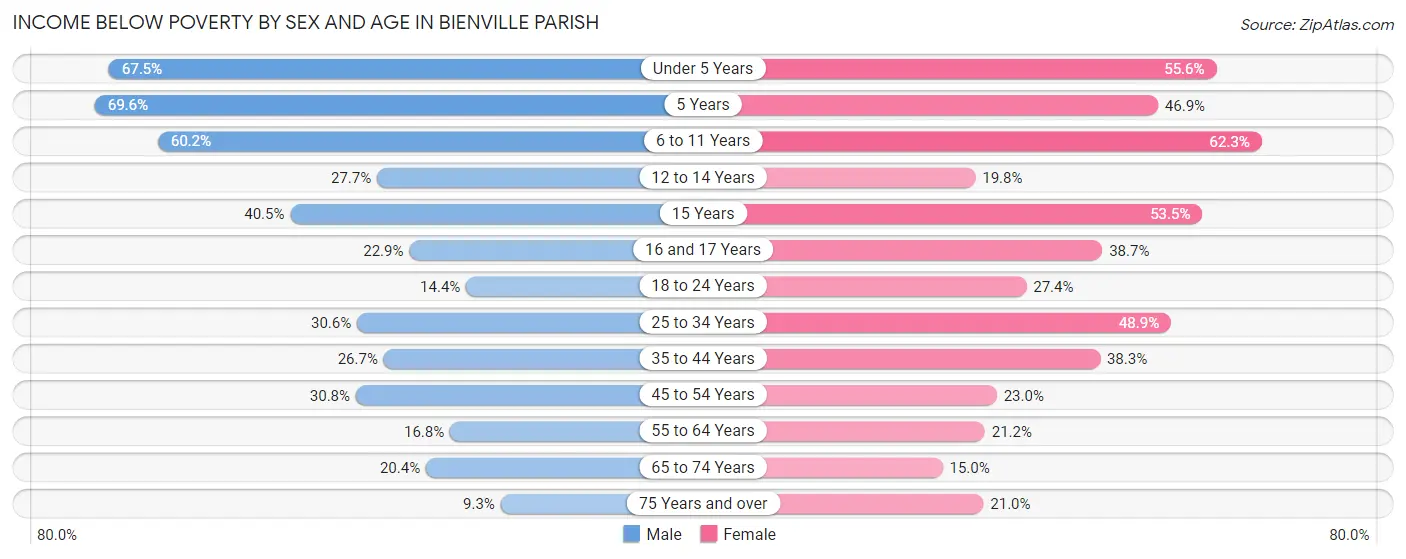
Income Below Poverty by Sex and Age in Bienville Parish
With 29.3% poverty level for males and 32.7% for females among the residents of Bienville Parish, 5 year old males and 6 to 11 year old females are the most vulnerable to poverty, with 32 males (69.6%) and 331 females (62.3%) in their respective age groups living below the poverty level.
| Age Bracket | Male | Female |
| Under 5 Years | 249 (67.5%) | 218 (55.6%) |
| 5 Years | 32 (69.6%) | 23 (46.9%) |
| 6 to 11 Years | 327 (60.2%) | 331 (62.3%) |
| 12 to 14 Years | 65 (27.7%) | 43 (19.8%) |
| 15 Years | 30 (40.5%) | 38 (53.5%) |
| 16 and 17 Years | 27 (22.9%) | 99 (38.7%) |
| 18 to 24 Years | 72 (14.4%) | 120 (27.4%) |
| 25 to 34 Years | 224 (30.6%) | 372 (48.9%) |
| 35 to 44 Years | 188 (26.7%) | 286 (38.3%) |
| 45 to 54 Years | 232 (30.8%) | 171 (23.0%) |
| 55 to 64 Years | 144 (16.8%) | 204 (21.2%) |
| 65 to 74 Years | 132 (20.4%) | 111 (15.0%) |
| 75 Years and over | 42 (9.3%) | 148 (21.0%) |
| Total | 1,764 (29.3%) | 2,164 (32.7%) |
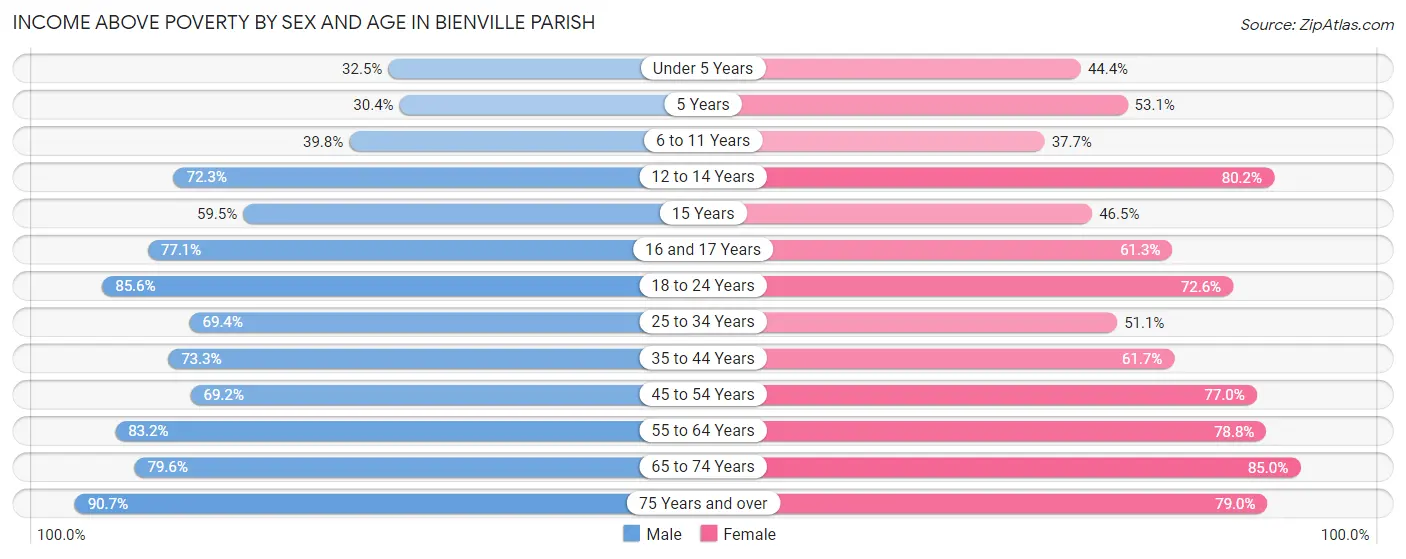
Income Above Poverty by Sex and Age in Bienville Parish
According to the poverty statistics in Bienville Parish, males aged 75 years and over and females aged 65 to 74 years are the age groups that are most secure financially, with 90.7% of males and 85.0% of females in these age groups living above the poverty line.
| Age Bracket | Male | Female |
| Under 5 Years | 120 (32.5%) | 174 (44.4%) |
| 5 Years | 14 (30.4%) | 26 (53.1%) |
| 6 to 11 Years | 216 (39.8%) | 200 (37.7%) |
| 12 to 14 Years | 170 (72.3%) | 174 (80.2%) |
| 15 Years | 44 (59.5%) | 33 (46.5%) |
| 16 and 17 Years | 91 (77.1%) | 157 (61.3%) |
| 18 to 24 Years | 427 (85.6%) | 318 (72.6%) |
| 25 to 34 Years | 507 (69.4%) | 389 (51.1%) |
| 35 to 44 Years | 517 (73.3%) | 460 (61.7%) |
| 45 to 54 Years | 521 (69.2%) | 572 (77.0%) |
| 55 to 64 Years | 712 (83.2%) | 757 (78.8%) |
| 65 to 74 Years | 515 (79.6%) | 631 (85.0%) |
| 75 Years and over | 409 (90.7%) | 556 (79.0%) |
| Total | 4,263 (70.7%) | 4,447 (67.3%) |
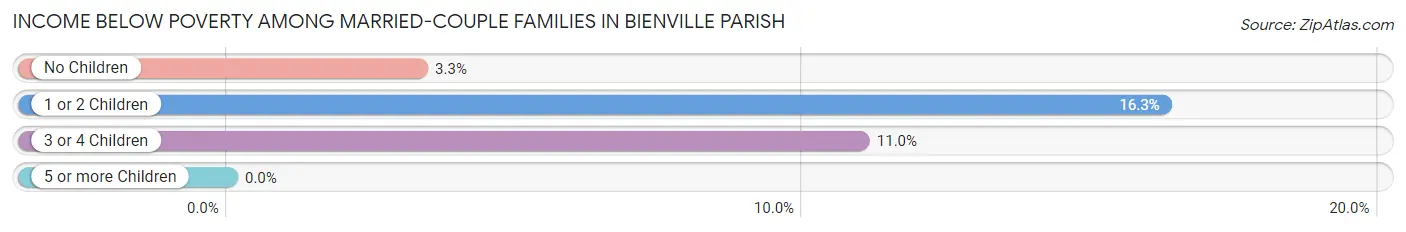
Income Below Poverty Among Married-Couple Families in Bienville Parish
The poverty statistics for married-couple families in Bienville Parish show that 6.8% or 133 of the total 1,957 families live below the poverty line. Families with 1 or 2 children have the highest poverty rate of 16.3%, comprising of 78 families. On the other hand, families with 5 or more children have the lowest poverty rate of 0.0%, which includes 0 families.
| Children | Above Poverty | Below Poverty |
| No Children | 1,285 (96.7%) | 44 (3.3%) |
| 1 or 2 Children | 402 (83.8%) | 78 (16.3%) |
| 3 or 4 Children | 89 (89.0%) | 11 (11.0%) |
| 5 or more Children | 48 (100.0%) | 0 (0.0%) |
| Total | 1,824 (93.2%) | 133 (6.8%) |
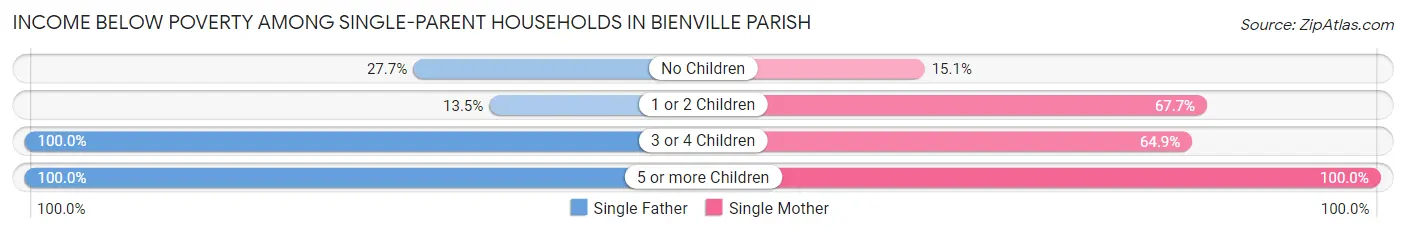
Income Below Poverty Among Single-Parent Households in Bienville Parish
According to the poverty data in Bienville Parish, 43.4% or 111 single-father households and 52.9% or 464 single-mother households are living below the poverty line. Among single-father households, those with 3 or 4 children have the highest poverty rate, with 37 households (100.0%) experiencing poverty. Likewise, among single-mother households, those with 5 or more children have the highest poverty rate, with 11 households (100.0%) falling below the poverty line.
| Children | Single Father | Single Mother |
| No Children | 26 (27.7%) | 37 (15.1%) |
| 1 or 2 Children | 12 (13.5%) | 318 (67.7%) |
| 3 or 4 Children | 37 (100.0%) | 98 (64.9%) |
| 5 or more Children | 36 (100.0%) | 11 (100.0%) |
| Total | 111 (43.4%) | 464 (52.9%) |
Income Below Poverty Among Married-Couple vs Single-Parent Households in Bienville Parish
The poverty data for Bienville Parish shows that 133 of the married-couple family households (6.8%) and 575 of the single-parent households (50.7%) are living below the poverty level. Within the married-couple family households, those with 1 or 2 children have the highest poverty rate, with 78 households (16.3%) falling below the poverty line. Among the single-parent households, those with 5 or more children have the highest poverty rate, with 47 household (100.0%) living below poverty.
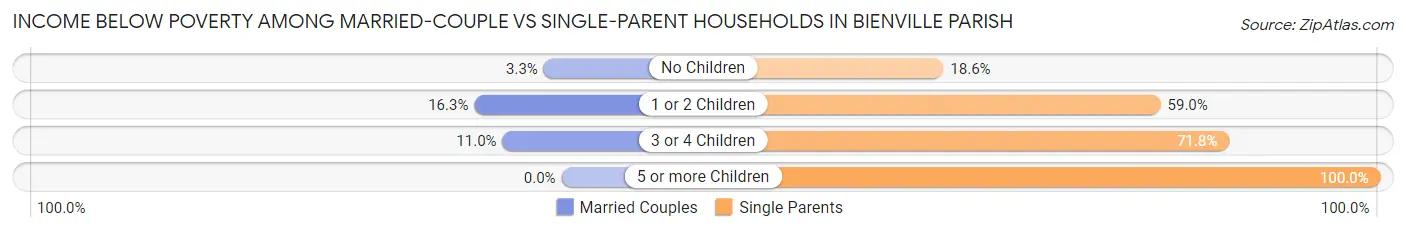
| Children | Married-Couple Families | Single-Parent Households |
| No Children | 44 (3.3%) | 63 (18.6%) |
| 1 or 2 Children | 78 (16.3%) | 330 (59.0%) |
| 3 or 4 Children | 11 (11.0%) | 135 (71.8%) |
| 5 or more Children | 0 (0.0%) | 47 (100.0%) |
| Total | 133 (6.8%) | 575 (50.7%) |
Employment Characteristics in Bienville Parish
Employment by Class of Employer in Bienville Parish
Among the 4,426 employed individuals in Bienville Parish, private company employees (2,900 | 65.5%), local government employees (504 | 11.4%), and state government employees (364 | 8.2%) make up the most common classes of employment.
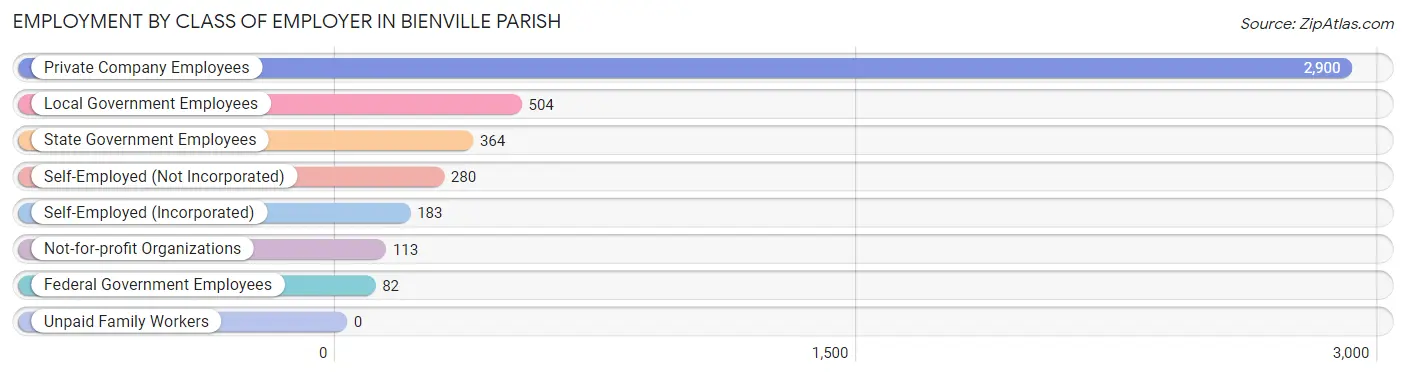
| Employer Class | # Employees | % Employees |
| Private Company Employees | 2,900 | 65.5% |
| Self-Employed (Incorporated) | 183 | 4.1% |
| Self-Employed (Not Incorporated) | 280 | 6.3% |
| Not-for-profit Organizations | 113 | 2.5% |
| Local Government Employees | 504 | 11.4% |
| State Government Employees | 364 | 8.2% |
| Federal Government Employees | 82 | 1.8% |
| Unpaid Family Workers | 0 | 0.0% |
| Total | 4,426 | 100.0% |
Employment Status by Age in Bienville Parish
According to the labor force statistics for Bienville Parish, out of the total population over 16 years of age (10,429), 45.8% or 4,776 individuals are in the labor force, with 5.6% or 267 of them unemployed. The age group with the highest labor force participation rate is 35 to 44 years, with 68.6% or 1,019 individuals in the labor force. Within the labor force, the 16 to 19 years age range has the highest percentage of unemployed individuals, with 23.0% or 38 of them being unemployed.
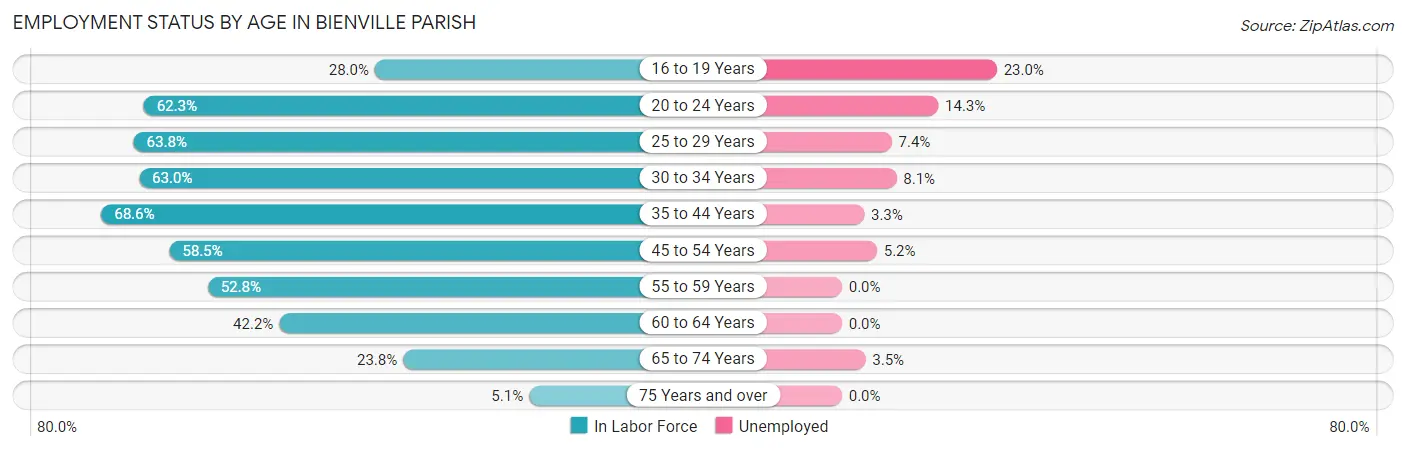
| Age Bracket | In Labor Force | Unemployed |
| 16 to 19 Years | 165 (28.0%) | 38 (23.0%) |
| 20 to 24 Years | 449 (62.3%) | 64 (14.3%) |
| 25 to 29 Years | 459 (63.8%) | 34 (7.4%) |
| 30 to 34 Years | 494 (63.0%) | 40 (8.1%) |
| 35 to 44 Years | 1,019 (68.6%) | 34 (3.3%) |
| 45 to 54 Years | 880 (58.5%) | 46 (5.2%) |
| 55 to 59 Years | 465 (52.8%) | 0 (0.0%) |
| 60 to 64 Years | 437 (42.2%) | 0 (0.0%) |
| 65 to 74 Years | 341 (23.8%) | 12 (3.5%) |
| 75 Years and over | 65 (5.1%) | 0 (0.0%) |
| Total | 4,776 (45.8%) | 267 (5.6%) |
Employment Status by Educational Attainment in Bienville Parish
According to labor force statistics for Bienville Parish, 58.6% of individuals (3,757) out of the total population between 25 and 64 years of age (6,412) are in the labor force, with 4.1% or 154 of them being unemployed. The group with the highest labor force participation rate are those with the educational attainment of college / associate degree, with 67.8% or 1,130 individuals in the labor force. Within the labor force, individuals with high school diploma education have the highest percentage of unemployment, with 5.8% or 105 of them being unemployed.
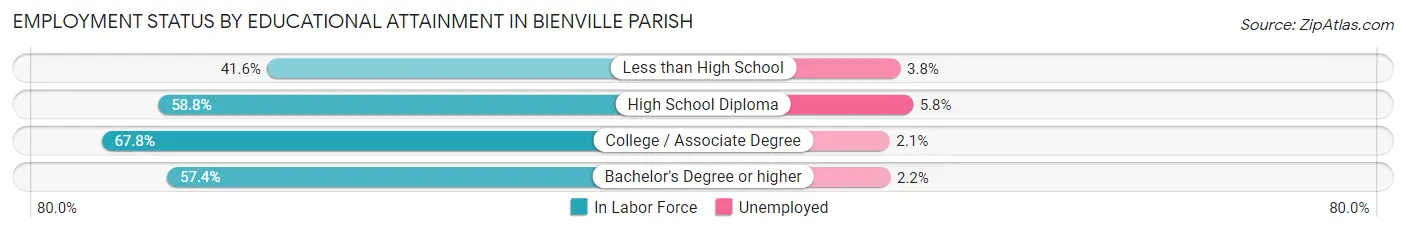
| Educational Attainment | In Labor Force | Unemployed |
| Less than High School | 367 (41.6%) | 34 (3.8%) |
| High School Diploma | 1,810 (58.8%) | 179 (5.8%) |
| College / Associate Degree | 1,130 (67.8%) | 35 (2.1%) |
| Bachelor's Degree or higher | 450 (57.4%) | 17 (2.2%) |
| Total | 3,757 (58.6%) | 263 (4.1%) |
Employment Occupations by Sex in Bienville Parish
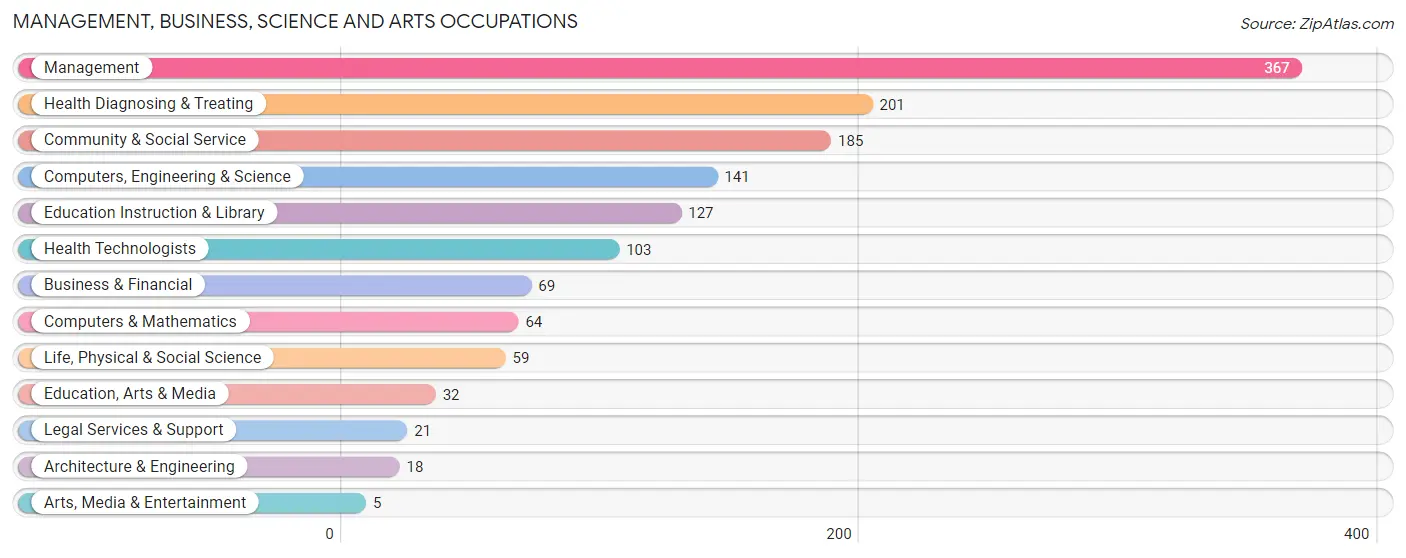
Management, Business, Science and Arts Occupations
The most common Management, Business, Science and Arts occupations in Bienville Parish are Management (367 | 8.2%), Health Diagnosing & Treating (201 | 4.5%), Community & Social Service (185 | 4.1%), Computers, Engineering & Science (141 | 3.1%), and Education Instruction & Library (127 | 2.8%).
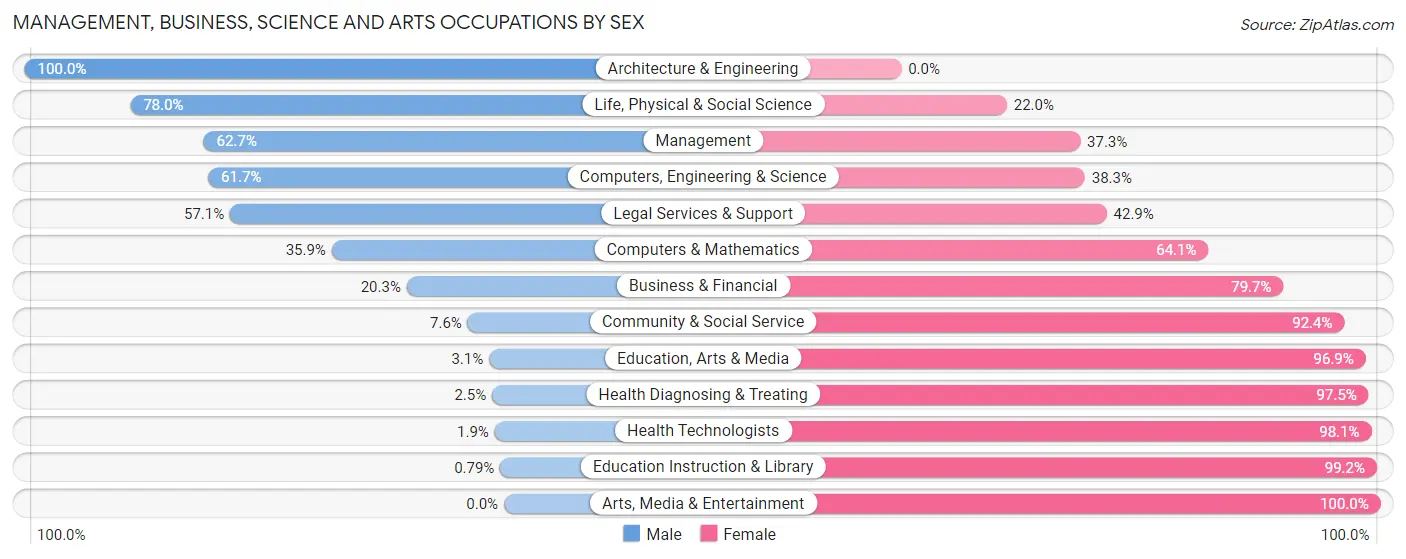
Management, Business, Science and Arts Occupations by Sex
Within the Management, Business, Science and Arts occupations in Bienville Parish, the most male-oriented occupations are Architecture & Engineering (100.0%), Life, Physical & Social Science (78.0%), and Management (62.7%), while the most female-oriented occupations are Arts, Media & Entertainment (100.0%), Education Instruction & Library (99.2%), and Health Technologists (98.1%).
| Occupation | Male | Female |
| Management | 230 (62.7%) | 137 (37.3%) |
| Business & Financial | 14 (20.3%) | 55 (79.7%) |
| Computers, Engineering & Science | 87 (61.7%) | 54 (38.3%) |
| Computers & Mathematics | 23 (35.9%) | 41 (64.1%) |
| Architecture & Engineering | 18 (100.0%) | 0 (0.0%) |
| Life, Physical & Social Science | 46 (78.0%) | 13 (22.0%) |
| Community & Social Service | 14 (7.6%) | 171 (92.4%) |
| Education, Arts & Media | 1 (3.1%) | 31 (96.9%) |
| Legal Services & Support | 12 (57.1%) | 9 (42.9%) |
| Education Instruction & Library | 1 (0.8%) | 126 (99.2%) |
| Arts, Media & Entertainment | 0 (0.0%) | 5 (100.0%) |
| Health Diagnosing & Treating | 5 (2.5%) | 196 (97.5%) |
| Health Technologists | 2 (1.9%) | 101 (98.1%) |
| Total (Category) | 350 (36.3%) | 613 (63.7%) |
| Total (Overall) | 2,540 (56.4%) | 1,961 (43.6%) |
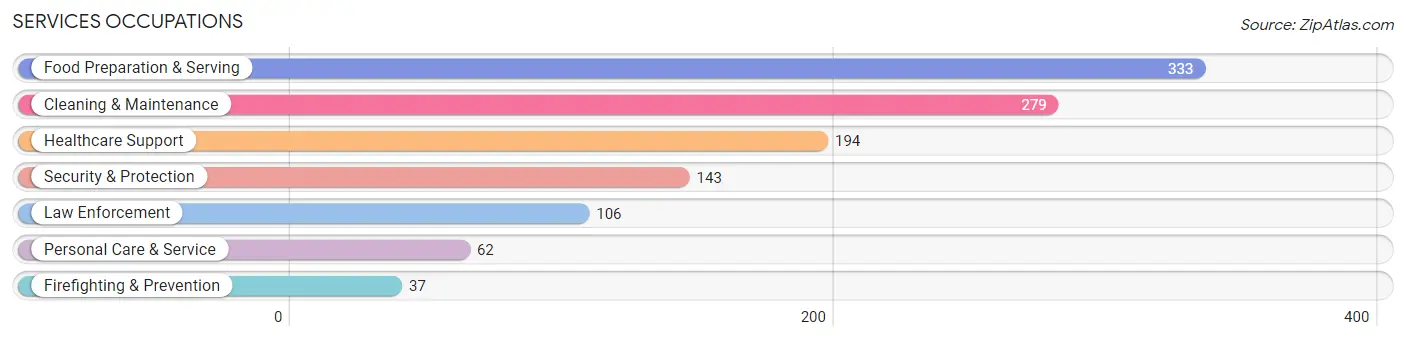
Services Occupations
The most common Services occupations in Bienville Parish are Food Preparation & Serving (333 | 7.4%), Cleaning & Maintenance (279 | 6.2%), Healthcare Support (194 | 4.3%), Security & Protection (143 | 3.2%), and Law Enforcement (106 | 2.4%).
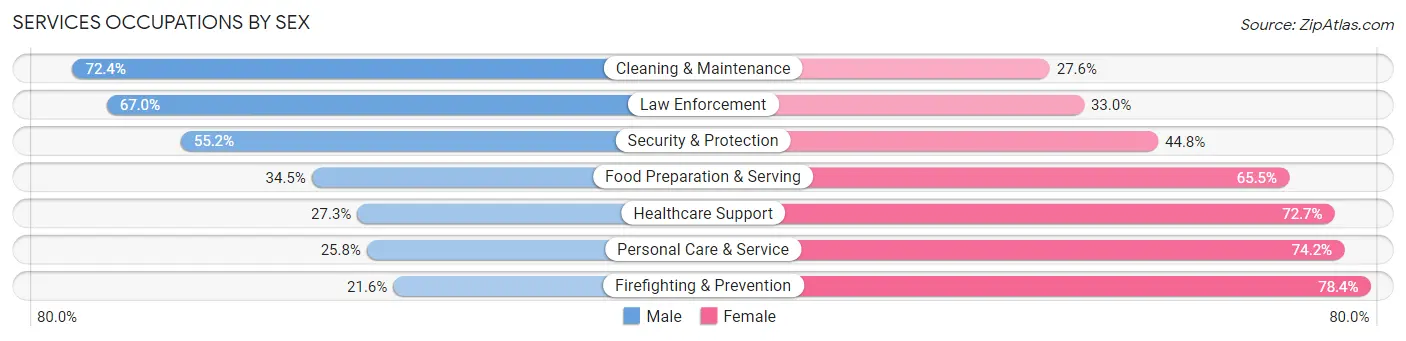
Services Occupations by Sex
Within the Services occupations in Bienville Parish, the most male-oriented occupations are Cleaning & Maintenance (72.4%), Law Enforcement (67.0%), and Security & Protection (55.2%), while the most female-oriented occupations are Firefighting & Prevention (78.4%), Personal Care & Service (74.2%), and Healthcare Support (72.7%).
| Occupation | Male | Female |
| Healthcare Support | 53 (27.3%) | 141 (72.7%) |
| Security & Protection | 79 (55.2%) | 64 (44.8%) |
| Firefighting & Prevention | 8 (21.6%) | 29 (78.4%) |
| Law Enforcement | 71 (67.0%) | 35 (33.0%) |
| Food Preparation & Serving | 115 (34.5%) | 218 (65.5%) |
| Cleaning & Maintenance | 202 (72.4%) | 77 (27.6%) |
| Personal Care & Service | 16 (25.8%) | 46 (74.2%) |
| Total (Category) | 465 (46.0%) | 546 (54.0%) |
| Total (Overall) | 2,540 (56.4%) | 1,961 (43.6%) |
Sales and Office Occupations
The most common Sales and Office occupations in Bienville Parish are Sales & Related (359 | 8.0%), and Office & Administration (349 | 7.7%).

Sales and Office Occupations by Sex
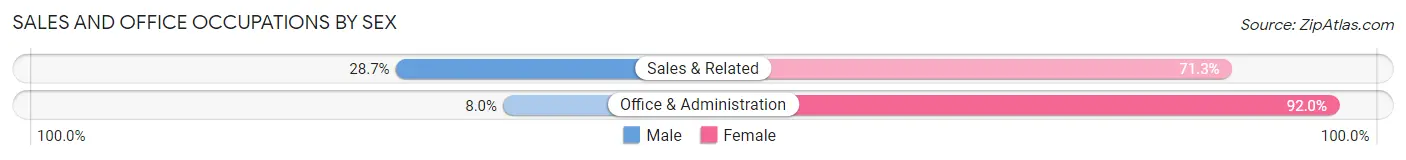
| Occupation | Male | Female |
| Sales & Related | 103 (28.7%) | 256 (71.3%) |
| Office & Administration | 28 (8.0%) | 321 (92.0%) |
| Total (Category) | 131 (18.5%) | 577 (81.5%) |
| Total (Overall) | 2,540 (56.4%) | 1,961 (43.6%) |
Natural Resources, Construction and Maintenance Occupations
The most common Natural Resources, Construction and Maintenance occupations in Bienville Parish are Installation, Maintenance & Repair (344 | 7.6%), Construction & Extraction (311 | 6.9%), and Farming, Fishing & Forestry (100 | 2.2%).

Natural Resources, Construction and Maintenance Occupations by Sex
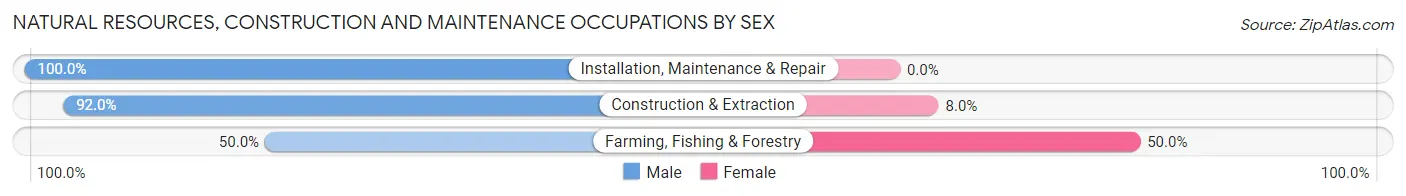
| Occupation | Male | Female |
| Farming, Fishing & Forestry | 50 (50.0%) | 50 (50.0%) |
| Construction & Extraction | 286 (92.0%) | 25 (8.0%) |
| Installation, Maintenance & Repair | 344 (100.0%) | 0 (0.0%) |
| Total (Category) | 680 (90.1%) | 75 (9.9%) |
| Total (Overall) | 2,540 (56.4%) | 1,961 (43.6%) |
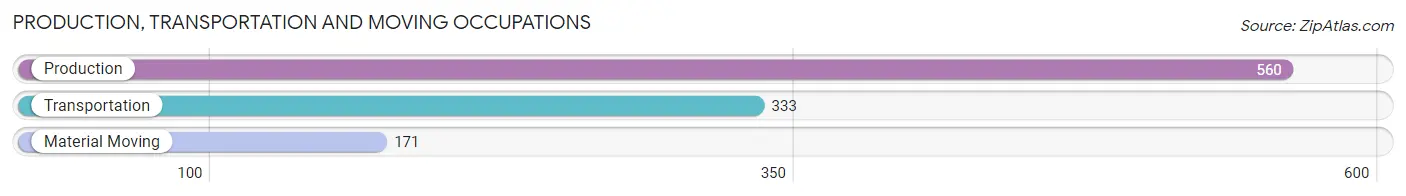
Production, Transportation and Moving Occupations
The most common Production, Transportation and Moving occupations in Bienville Parish are Production (560 | 12.4%), Transportation (333 | 7.4%), and Material Moving (171 | 3.8%).
Production, Transportation and Moving Occupations by Sex
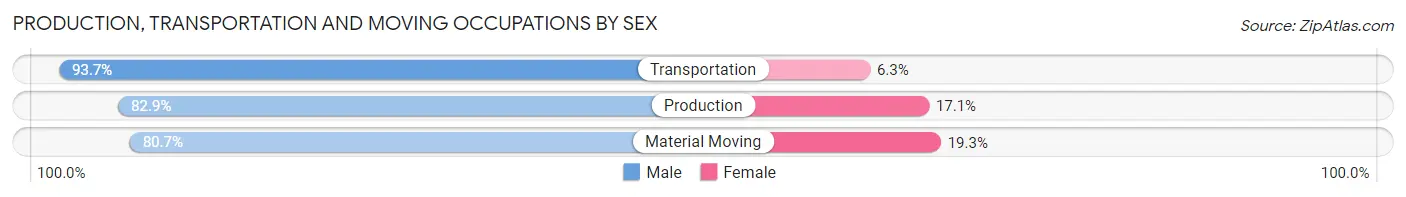
| Occupation | Male | Female |
| Production | 464 (82.9%) | 96 (17.1%) |
| Transportation | 312 (93.7%) | 21 (6.3%) |
| Material Moving | 138 (80.7%) | 33 (19.3%) |
| Total (Category) | 914 (85.9%) | 150 (14.1%) |
| Total (Overall) | 2,540 (56.4%) | 1,961 (43.6%) |
Employment Industries by Sex in Bienville Parish
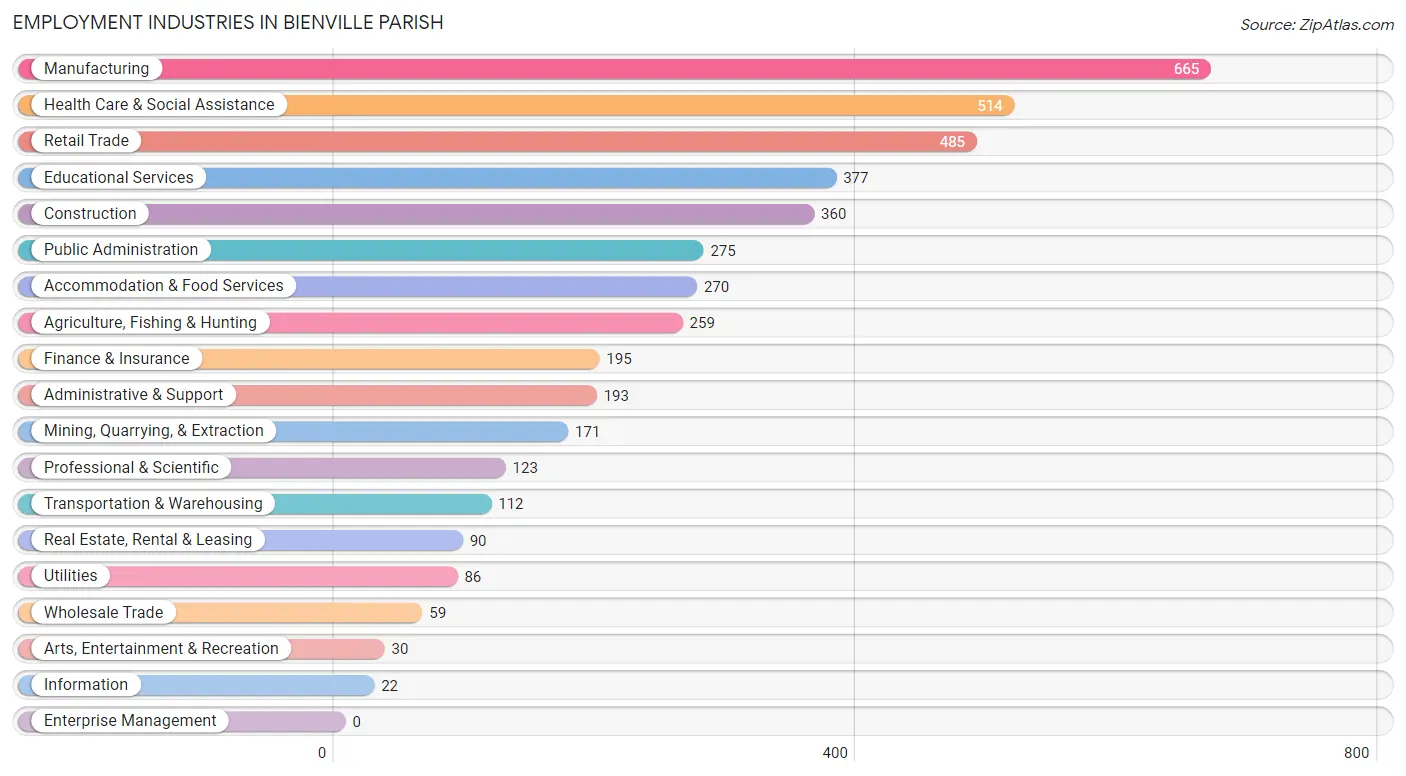
Employment Industries in Bienville Parish
The major employment industries in Bienville Parish include Manufacturing (665 | 14.8%), Health Care & Social Assistance (514 | 11.4%), Retail Trade (485 | 10.8%), Educational Services (377 | 8.4%), and Construction (360 | 8.0%).
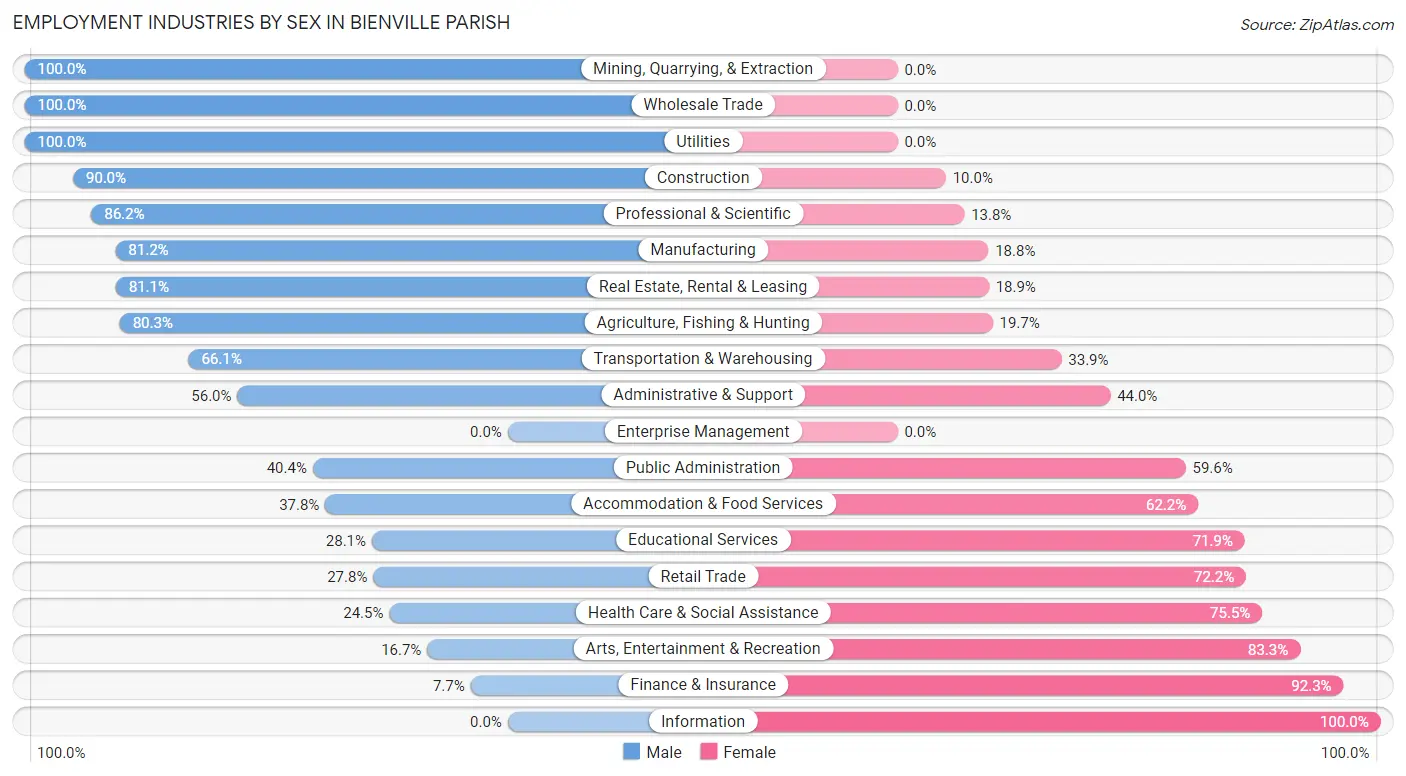
Employment Industries by Sex in Bienville Parish
The Bienville Parish industries that see more men than women are Mining, Quarrying, & Extraction (100.0%), Wholesale Trade (100.0%), and Utilities (100.0%), whereas the industries that tend to have a higher number of women are Information (100.0%), Finance & Insurance (92.3%), and Arts, Entertainment & Recreation (83.3%).
| Industry | Male | Female |
| Agriculture, Fishing & Hunting | 208 (80.3%) | 51 (19.7%) |
| Mining, Quarrying, & Extraction | 171 (100.0%) | 0 (0.0%) |
| Construction | 324 (90.0%) | 36 (10.0%) |
| Manufacturing | 540 (81.2%) | 125 (18.8%) |
| Wholesale Trade | 59 (100.0%) | 0 (0.0%) |
| Retail Trade | 135 (27.8%) | 350 (72.2%) |
| Transportation & Warehousing | 74 (66.1%) | 38 (33.9%) |
| Utilities | 86 (100.0%) | 0 (0.0%) |
| Information | 0 (0.0%) | 22 (100.0%) |
| Finance & Insurance | 15 (7.7%) | 180 (92.3%) |
| Real Estate, Rental & Leasing | 73 (81.1%) | 17 (18.9%) |
| Professional & Scientific | 106 (86.2%) | 17 (13.8%) |
| Enterprise Management | 0 (0.0%) | 0 (0.0%) |
| Administrative & Support | 108 (56.0%) | 85 (44.0%) |
| Educational Services | 106 (28.1%) | 271 (71.9%) |
| Health Care & Social Assistance | 126 (24.5%) | 388 (75.5%) |
| Arts, Entertainment & Recreation | 5 (16.7%) | 25 (83.3%) |
| Accommodation & Food Services | 102 (37.8%) | 168 (62.2%) |
| Public Administration | 111 (40.4%) | 164 (59.6%) |
| Total | 2,540 (56.4%) | 1,961 (43.6%) |
Education in Bienville Parish
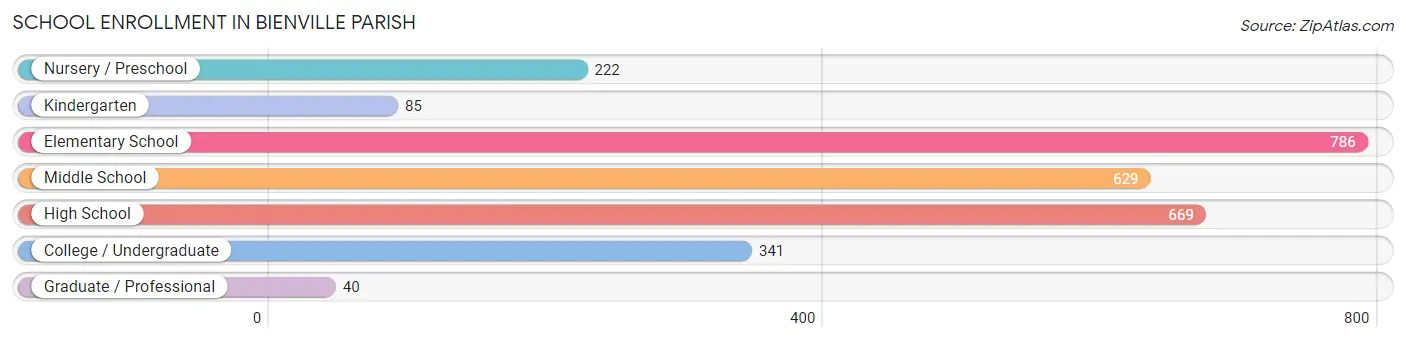
School Enrollment in Bienville Parish
The most common levels of schooling among the 2,772 students in Bienville Parish are elementary school (786 | 28.3%), high school (669 | 24.1%), and middle school (629 | 22.7%).
| School Level | # Students | % Students |
| Nursery / Preschool | 222 | 8.0% |
| Kindergarten | 85 | 3.1% |
| Elementary School | 786 | 28.3% |
| Middle School | 629 | 22.7% |
| High School | 669 | 24.1% |
| College / Undergraduate | 341 | 12.3% |
| Graduate / Professional | 40 | 1.4% |
| Total | 2,772 | 100.0% |
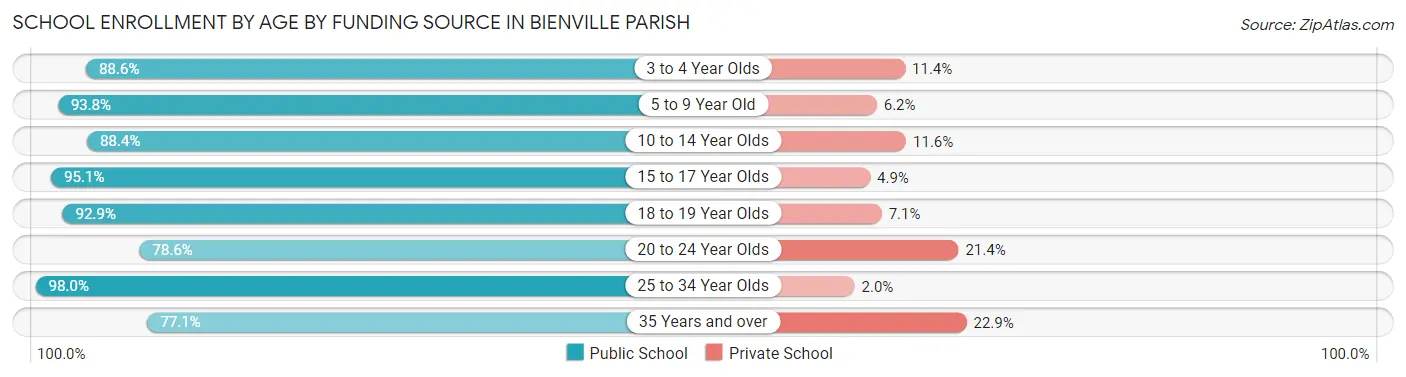
School Enrollment by Age by Funding Source in Bienville Parish
Out of a total of 2,772 students who are enrolled in schools in Bienville Parish, 269 (9.7%) attend a private institution, while the remaining 2,503 (90.3%) are enrolled in public schools. The age group of 35 years and over has the highest likelihood of being enrolled in private schools, with 27 (22.9% in the age bracket) enrolled. Conversely, the age group of 25 to 34 year olds has the lowest likelihood of being enrolled in a private school, with 48 (98.0% in the age bracket) attending a public institution.
| Age Bracket | Public School | Private School |
| 3 to 4 Year Olds | 178 (88.6%) | 23 (11.4%) |
| 5 to 9 Year Old | 715 (93.8%) | 47 (6.2%) |
| 10 to 14 Year Olds | 737 (88.4%) | 97 (11.6%) |
| 15 to 17 Year Olds | 483 (95.1%) | 25 (4.9%) |
| 18 to 19 Year Olds | 105 (92.9%) | 8 (7.1%) |
| 20 to 24 Year Olds | 147 (78.6%) | 40 (21.4%) |
| 25 to 34 Year Olds | 48 (98.0%) | 1 (2.0%) |
| 35 Years and over | 91 (77.1%) | 27 (22.9%) |
| Total | 2,503 (90.3%) | 269 (9.7%) |
Educational Attainment by Field of Study in Bienville Parish
Business (300 | 25.6%), education (290 | 24.7%), bio, nature & agricultural (138 | 11.8%), arts & humanities (125 | 10.7%), and science & technology (81 | 6.9%) are the most common fields of study among 1,172 individuals in Bienville Parish who have obtained a bachelor's degree or higher.
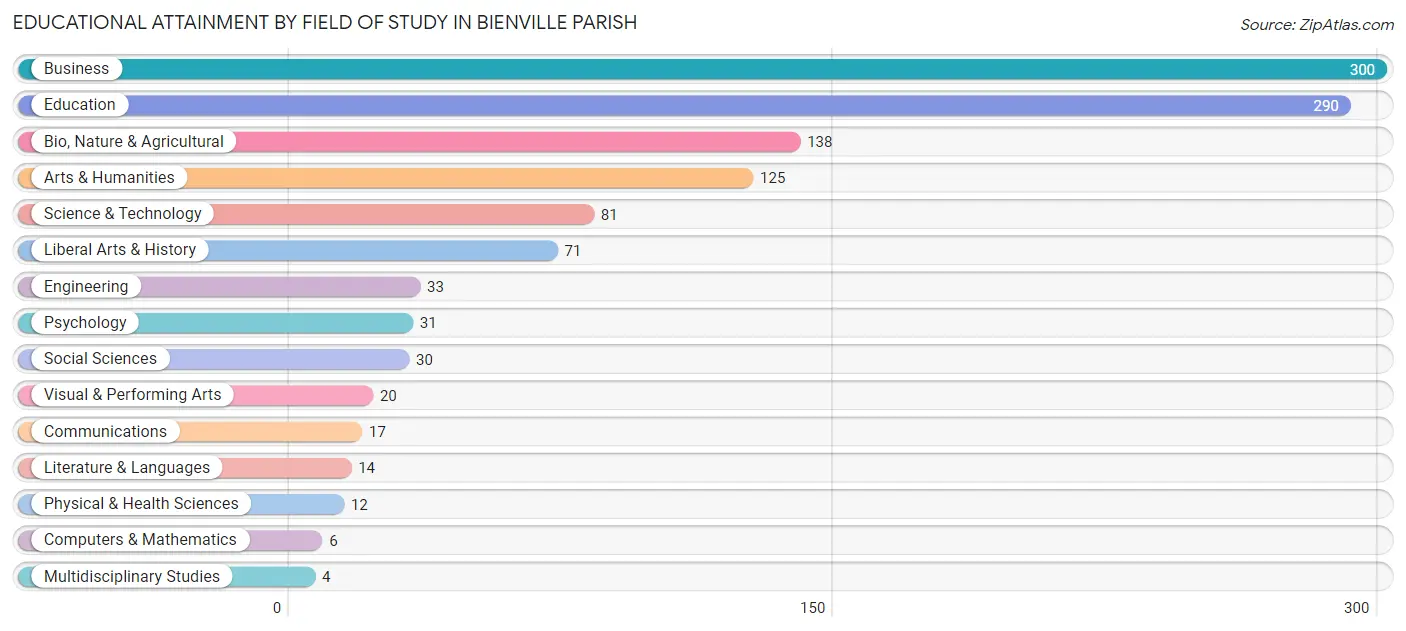
| Field of Study | # Graduates | % Graduates |
| Computers & Mathematics | 6 | 0.5% |
| Bio, Nature & Agricultural | 138 | 11.8% |
| Physical & Health Sciences | 12 | 1.0% |
| Psychology | 31 | 2.6% |
| Social Sciences | 30 | 2.6% |
| Engineering | 33 | 2.8% |
| Multidisciplinary Studies | 4 | 0.3% |
| Science & Technology | 81 | 6.9% |
| Business | 300 | 25.6% |
| Education | 290 | 24.7% |
| Literature & Languages | 14 | 1.2% |
| Liberal Arts & History | 71 | 6.1% |
| Visual & Performing Arts | 20 | 1.7% |
| Communications | 17 | 1.5% |
| Arts & Humanities | 125 | 10.7% |
| Total | 1,172 | 100.0% |
Transportation & Commute in Bienville Parish
Vehicle Availability by Sex in Bienville Parish
The most prevalent vehicle ownership categories in Bienville Parish are males with 2 vehicles (975, accounting for 39.1%) and females with 2 vehicles (637, making up 50.4%).
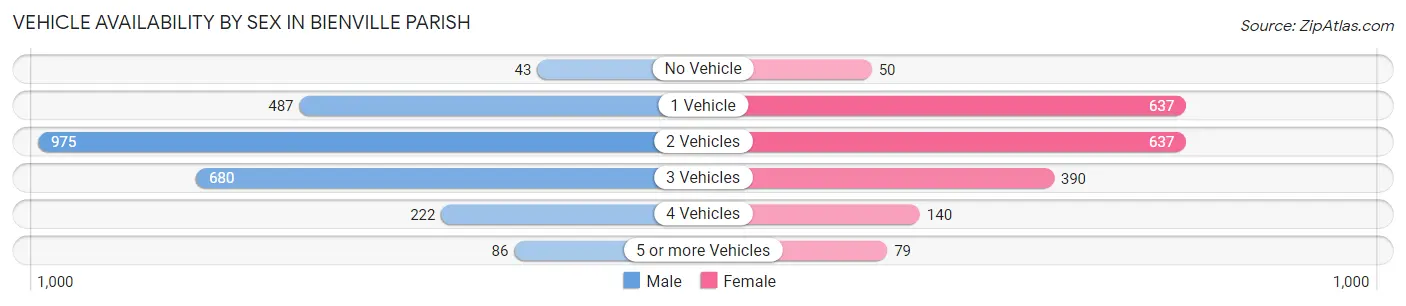
| Vehicles Available | Male | Female |
| No Vehicle | 43 (1.7%) | 50 (2.6%) |
| 1 Vehicle | 487 (19.5%) | 637 (33.0%) |
| 2 Vehicles | 975 (39.1%) | 637 (33.0%) |
| 3 Vehicles | 680 (27.3%) | 390 (20.2%) |
| 4 Vehicles | 222 (8.9%) | 140 (7.2%) |
| 5 or more Vehicles | 86 (3.5%) | 79 (4.1%) |
| Total | 2,493 (100.0%) | 1,933 (100.0%) |
Commute Time in Bienville Parish
The most frequently occuring commute durations in Bienville Parish are 30 to 34 minutes (775 commuters, 18.6%), 60 to 89 minutes (503 commuters, 12.1%), and 10 to 14 minutes (433 commuters, 10.4%).
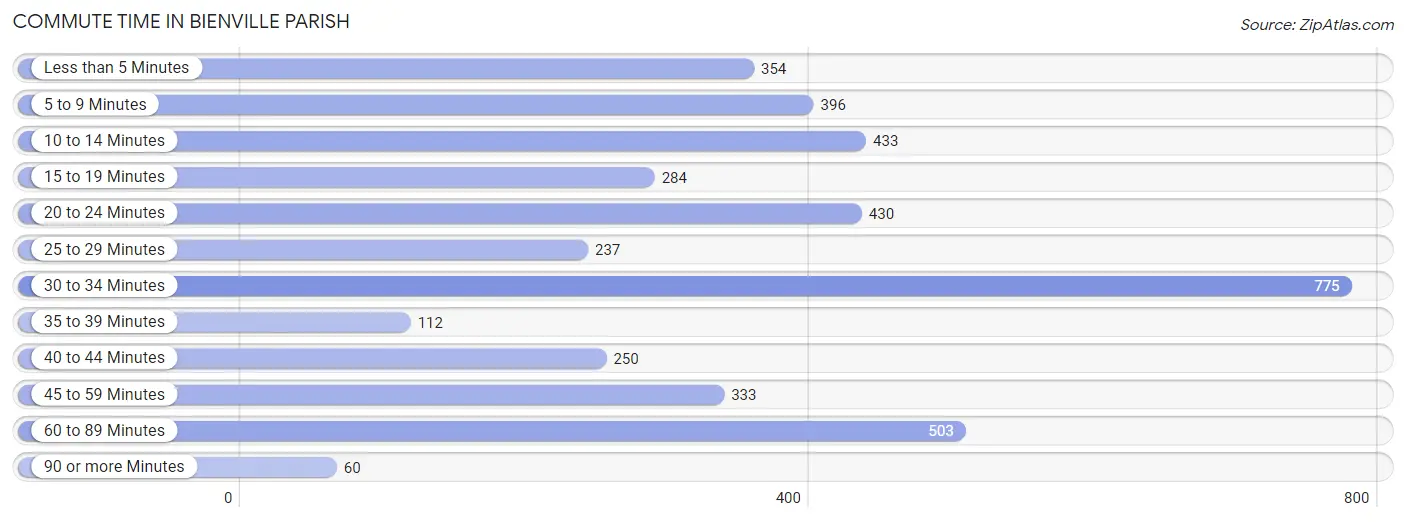
| Commute Time | # Commuters | % Commuters |
| Less than 5 Minutes | 354 | 8.5% |
| 5 to 9 Minutes | 396 | 9.5% |
| 10 to 14 Minutes | 433 | 10.4% |
| 15 to 19 Minutes | 284 | 6.8% |
| 20 to 24 Minutes | 430 | 10.3% |
| 25 to 29 Minutes | 237 | 5.7% |
| 30 to 34 Minutes | 775 | 18.6% |
| 35 to 39 Minutes | 112 | 2.7% |
| 40 to 44 Minutes | 250 | 6.0% |
| 45 to 59 Minutes | 333 | 8.0% |
| 60 to 89 Minutes | 503 | 12.1% |
| 90 or more Minutes | 60 | 1.4% |
Commute Time by Sex in Bienville Parish
The most common commute times in Bienville Parish are 30 to 34 minutes (424 commuters, 18.4%) for males and 30 to 34 minutes (351 commuters, 18.8%) for females.
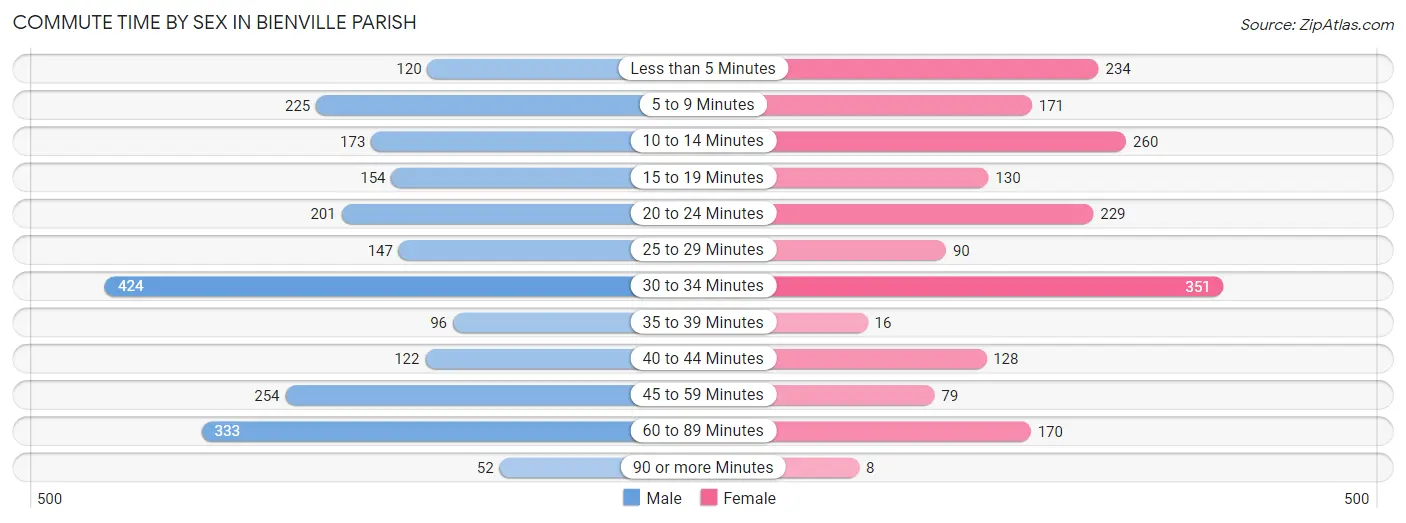
| Commute Time | Male | Female |
| Less than 5 Minutes | 120 (5.2%) | 234 (12.5%) |
| 5 to 9 Minutes | 225 (9.8%) | 171 (9.2%) |
| 10 to 14 Minutes | 173 (7.5%) | 260 (13.9%) |
| 15 to 19 Minutes | 154 (6.7%) | 130 (7.0%) |
| 20 to 24 Minutes | 201 (8.7%) | 229 (12.3%) |
| 25 to 29 Minutes | 147 (6.4%) | 90 (4.8%) |
| 30 to 34 Minutes | 424 (18.4%) | 351 (18.8%) |
| 35 to 39 Minutes | 96 (4.2%) | 16 (0.9%) |
| 40 to 44 Minutes | 122 (5.3%) | 128 (6.9%) |
| 45 to 59 Minutes | 254 (11.0%) | 79 (4.2%) |
| 60 to 89 Minutes | 333 (14.5%) | 170 (9.1%) |
| 90 or more Minutes | 52 (2.3%) | 8 (0.4%) |
Time of Departure to Work by Sex in Bienville Parish
The most frequent times of departure to work in Bienville Parish are 7:00 AM to 7:29 AM (397, 17.2%) for males and 7:00 AM to 7:29 AM (412, 22.1%) for females.
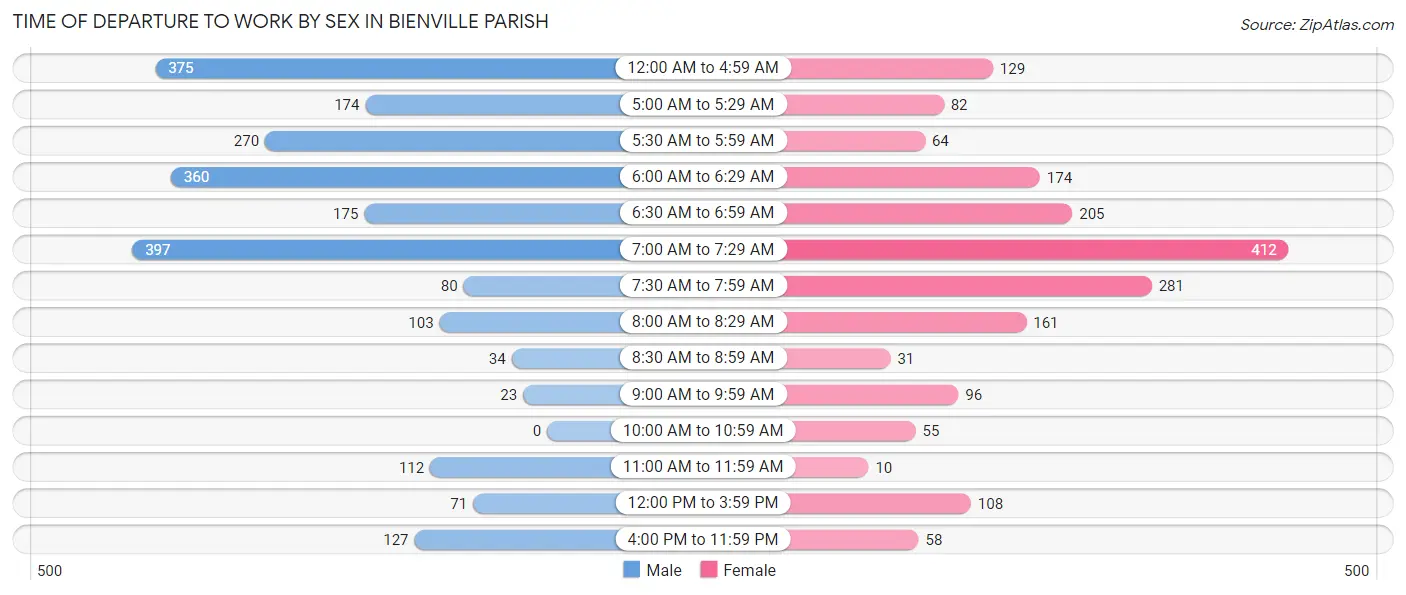
| Time of Departure | Male | Female |
| 12:00 AM to 4:59 AM | 375 (16.3%) | 129 (6.9%) |
| 5:00 AM to 5:29 AM | 174 (7.6%) | 82 (4.4%) |
| 5:30 AM to 5:59 AM | 270 (11.7%) | 64 (3.4%) |
| 6:00 AM to 6:29 AM | 360 (15.7%) | 174 (9.3%) |
| 6:30 AM to 6:59 AM | 175 (7.6%) | 205 (11.0%) |
| 7:00 AM to 7:29 AM | 397 (17.2%) | 412 (22.1%) |
| 7:30 AM to 7:59 AM | 80 (3.5%) | 281 (15.1%) |
| 8:00 AM to 8:29 AM | 103 (4.5%) | 161 (8.6%) |
| 8:30 AM to 8:59 AM | 34 (1.5%) | 31 (1.7%) |
| 9:00 AM to 9:59 AM | 23 (1.0%) | 96 (5.1%) |
| 10:00 AM to 10:59 AM | 0 (0.0%) | 55 (2.9%) |
| 11:00 AM to 11:59 AM | 112 (4.9%) | 10 (0.5%) |
| 12:00 PM to 3:59 PM | 71 (3.1%) | 108 (5.8%) |
| 4:00 PM to 11:59 PM | 127 (5.5%) | 58 (3.1%) |
| Total | 2,301 (100.0%) | 1,866 (100.0%) |
Housing Occupancy in Bienville Parish
Occupancy by Ownership in Bienville Parish
Of the total 5,375 dwellings in Bienville Parish, owner-occupied units account for 3,962 (73.7%), while renter-occupied units make up 1,413 (26.3%).
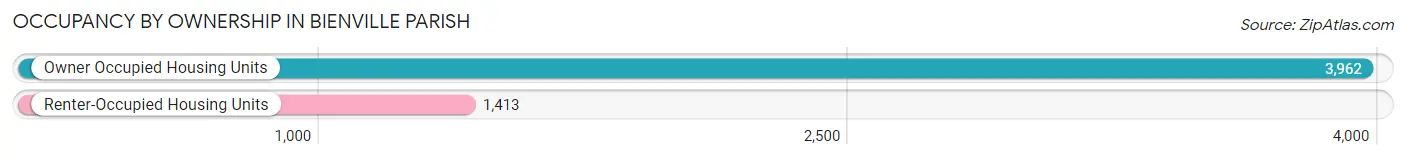
| Occupancy | # Housing Units | % Housing Units |
| Owner Occupied Housing Units | 3,962 | 73.7% |
| Renter-Occupied Housing Units | 1,413 | 26.3% |
| Total Occupied Housing Units | 5,375 | 100.0% |
Occupancy by Household Size in Bienville Parish
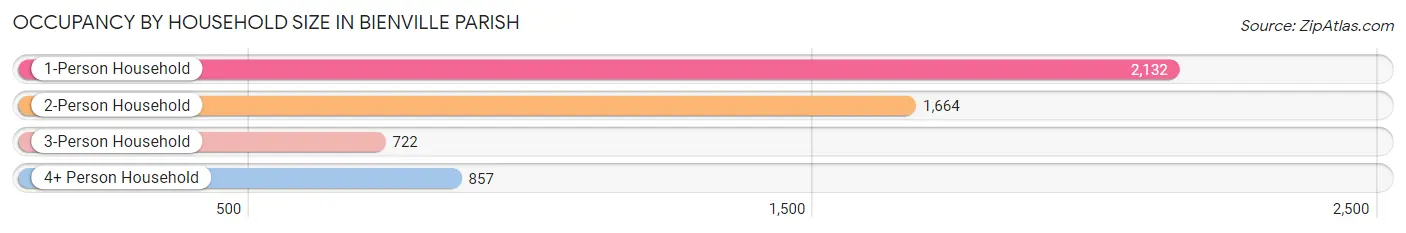
| Household Size | # Housing Units | % Housing Units |
| 1-Person Household | 2,132 | 39.7% |
| 2-Person Household | 1,664 | 31.0% |
| 3-Person Household | 722 | 13.4% |
| 4+ Person Household | 857 | 15.9% |
| Total Housing Units | 5,375 | 100.0% |
Occupancy by Ownership by Household Size in Bienville Parish
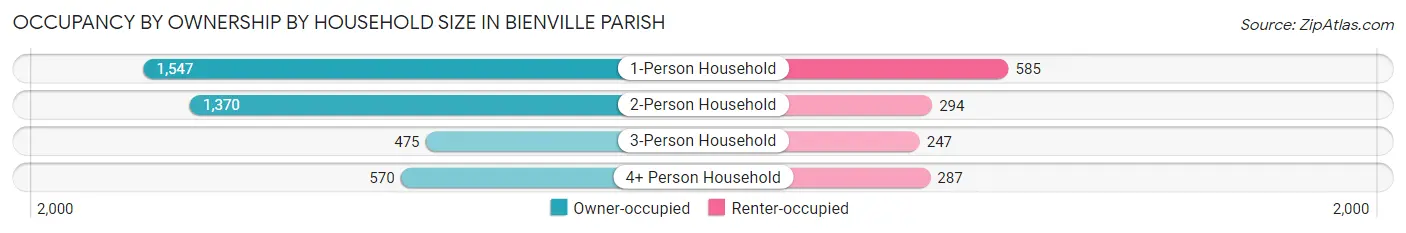
| Household Size | Owner-occupied | Renter-occupied |
| 1-Person Household | 1,547 (72.6%) | 585 (27.4%) |
| 2-Person Household | 1,370 (82.3%) | 294 (17.7%) |
| 3-Person Household | 475 (65.8%) | 247 (34.2%) |
| 4+ Person Household | 570 (66.5%) | 287 (33.5%) |
| Total Housing Units | 3,962 (73.7%) | 1,413 (26.3%) |
Occupancy by Educational Attainment in Bienville Parish
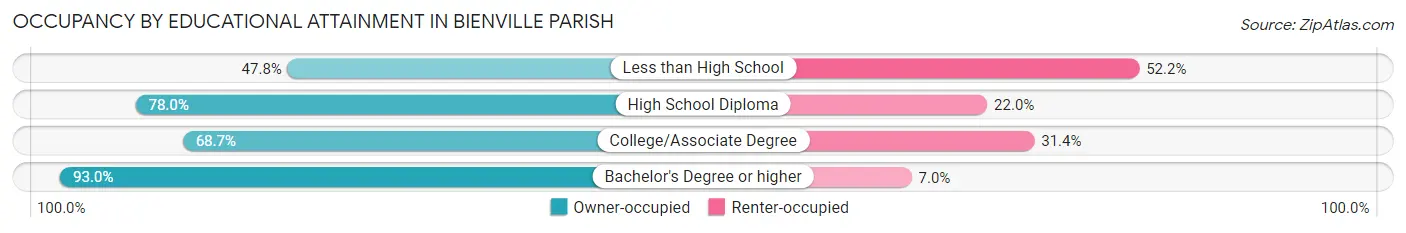
| Household Size | Owner-occupied | Renter-occupied |
| Less than High School | 321 (47.8%) | 350 (52.2%) |
| High School Diploma | 1,964 (78.0%) | 554 (22.0%) |
| College/Associate Degree | 1,003 (68.6%) | 458 (31.4%) |
| Bachelor's Degree or higher | 674 (93.0%) | 51 (7.0%) |
Occupancy by Age of Householder in Bienville Parish
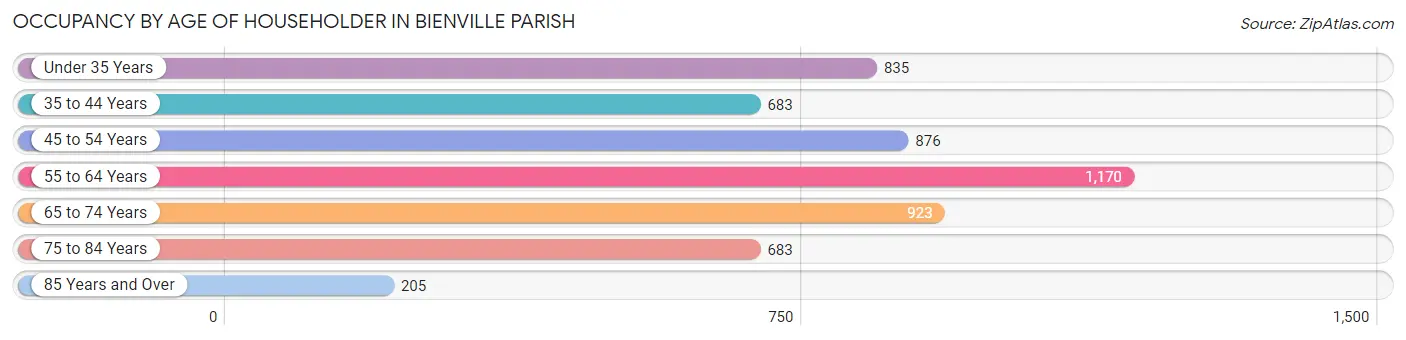
| Age Bracket | # Households | % Households |
| Under 35 Years | 835 | 15.5% |
| 35 to 44 Years | 683 | 12.7% |
| 45 to 54 Years | 876 | 16.3% |
| 55 to 64 Years | 1,170 | 21.8% |
| 65 to 74 Years | 923 | 17.2% |
| 75 to 84 Years | 683 | 12.7% |
| 85 Years and Over | 205 | 3.8% |
| Total | 5,375 | 100.0% |
Housing Finances in Bienville Parish
Median Income by Occupancy in Bienville Parish
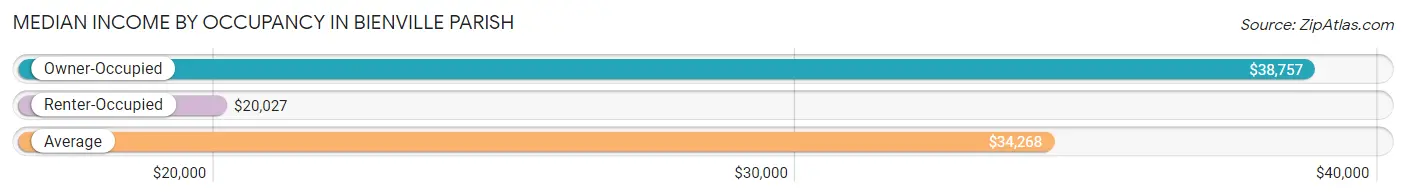
| Occupancy Type | # Households | Median Income |
| Owner-Occupied | 3,962 (73.7%) | $38,757 |
| Renter-Occupied | 1,413 (26.3%) | $20,027 |
| Average | 5,375 (100.0%) | $34,268 |
Occupancy by Householder Income Bracket in Bienville Parish
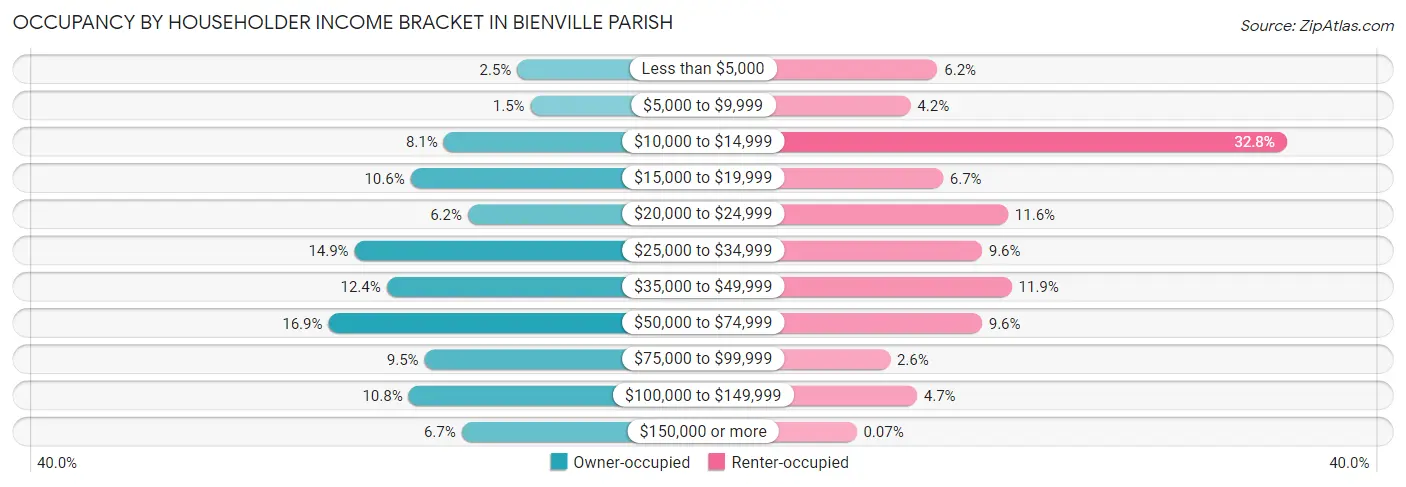
| Income Bracket | Owner-occupied | Renter-occupied |
| Less than $5,000 | 98 (2.5%) | 88 (6.2%) |
| $5,000 to $9,999 | 58 (1.5%) | 59 (4.2%) |
| $10,000 to $14,999 | 320 (8.1%) | 464 (32.8%) |
| $15,000 to $19,999 | 420 (10.6%) | 94 (6.7%) |
| $20,000 to $24,999 | 247 (6.2%) | 164 (11.6%) |
| $25,000 to $34,999 | 589 (14.9%) | 136 (9.6%) |
| $35,000 to $49,999 | 492 (12.4%) | 168 (11.9%) |
| $50,000 to $74,999 | 668 (16.9%) | 136 (9.6%) |
| $75,000 to $99,999 | 378 (9.5%) | 37 (2.6%) |
| $100,000 to $149,999 | 426 (10.7%) | 66 (4.7%) |
| $150,000 or more | 266 (6.7%) | 1 (0.1%) |
| Total | 3,962 (100.0%) | 1,413 (100.0%) |
Monthly Housing Cost Tiers in Bienville Parish
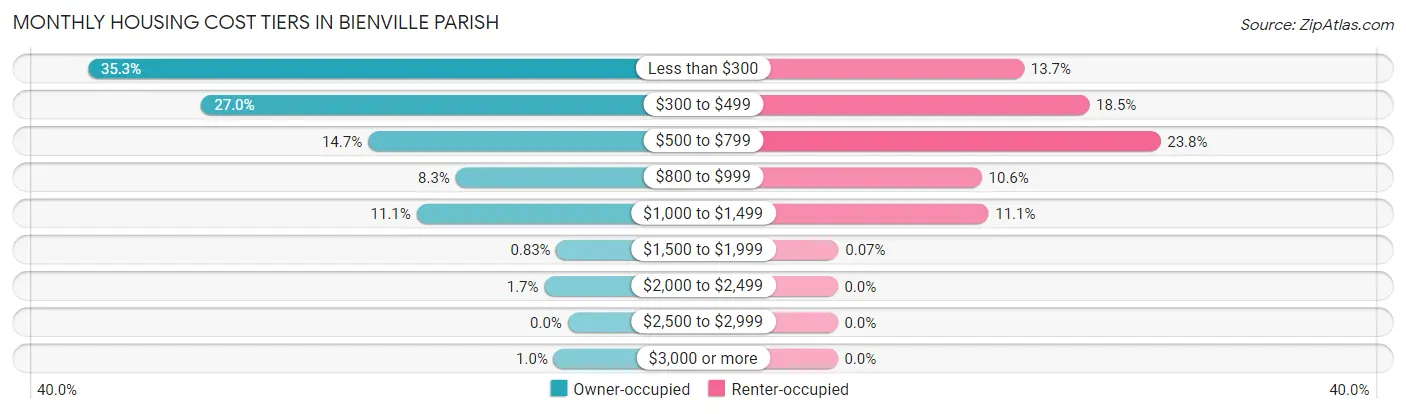
| Monthly Cost | Owner-occupied | Renter-occupied |
| Less than $300 | 1,400 (35.3%) | 194 (13.7%) |
| $300 to $499 | 1,069 (27.0%) | 262 (18.5%) |
| $500 to $799 | 583 (14.7%) | 336 (23.8%) |
| $800 to $999 | 327 (8.3%) | 150 (10.6%) |
| $1,000 to $1,499 | 441 (11.1%) | 157 (11.1%) |
| $1,500 to $1,999 | 33 (0.8%) | 1 (0.1%) |
| $2,000 to $2,499 | 68 (1.7%) | 0 (0.0%) |
| $2,500 to $2,999 | 0 (0.0%) | 0 (0.0%) |
| $3,000 or more | 41 (1.0%) | 0 (0.0%) |
| Total | 3,962 (100.0%) | 1,413 (100.0%) |
Physical Housing Characteristics in Bienville Parish
Housing Structures in Bienville Parish
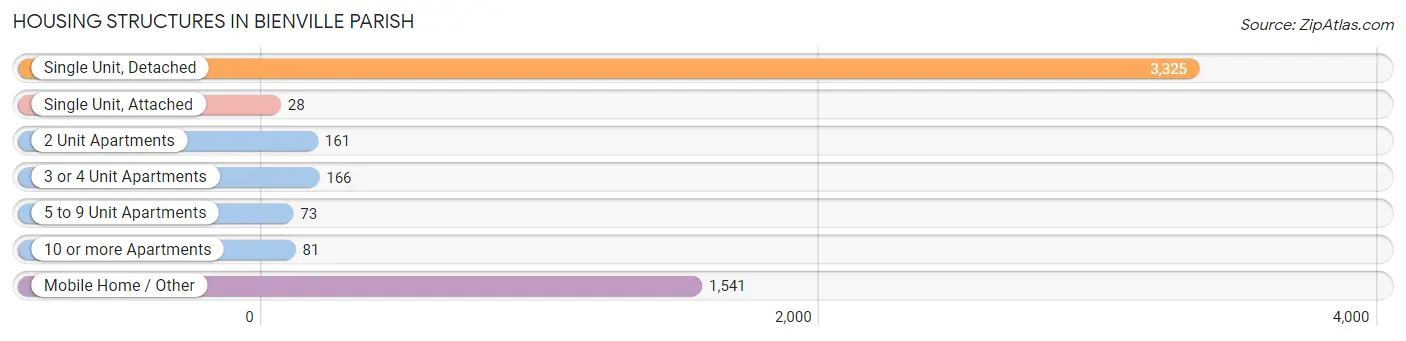
| Structure Type | # Housing Units | % Housing Units |
| Single Unit, Detached | 3,325 | 61.9% |
| Single Unit, Attached | 28 | 0.5% |
| 2 Unit Apartments | 161 | 3.0% |
| 3 or 4 Unit Apartments | 166 | 3.1% |
| 5 to 9 Unit Apartments | 73 | 1.4% |
| 10 or more Apartments | 81 | 1.5% |
| Mobile Home / Other | 1,541 | 28.7% |
| Total | 5,375 | 100.0% |
Housing Structures by Occupancy in Bienville Parish
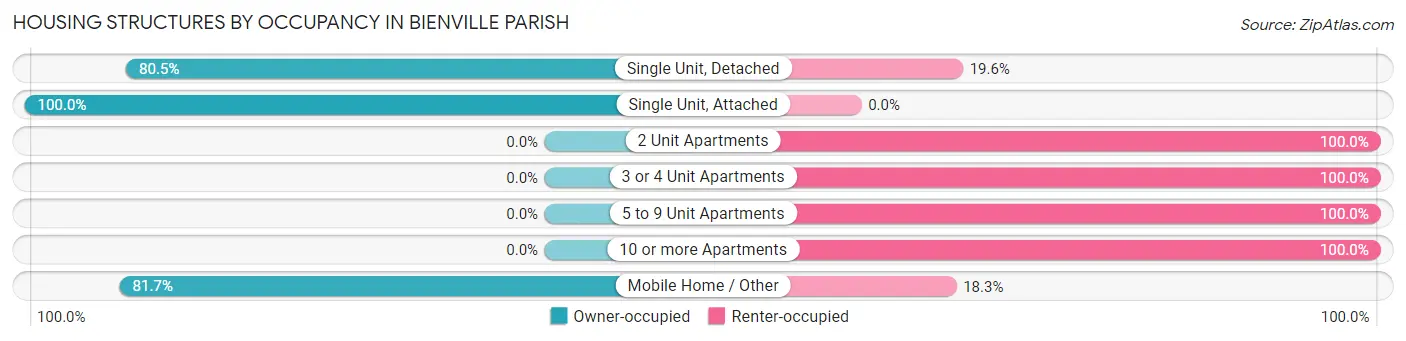
| Structure Type | Owner-occupied | Renter-occupied |
| Single Unit, Detached | 2,675 (80.4%) | 650 (19.6%) |
| Single Unit, Attached | 28 (100.0%) | 0 (0.0%) |
| 2 Unit Apartments | 0 (0.0%) | 161 (100.0%) |
| 3 or 4 Unit Apartments | 0 (0.0%) | 166 (100.0%) |
| 5 to 9 Unit Apartments | 0 (0.0%) | 73 (100.0%) |
| 10 or more Apartments | 0 (0.0%) | 81 (100.0%) |
| Mobile Home / Other | 1,259 (81.7%) | 282 (18.3%) |
| Total | 3,962 (73.7%) | 1,413 (26.3%) |
Housing Structures by Number of Rooms in Bienville Parish
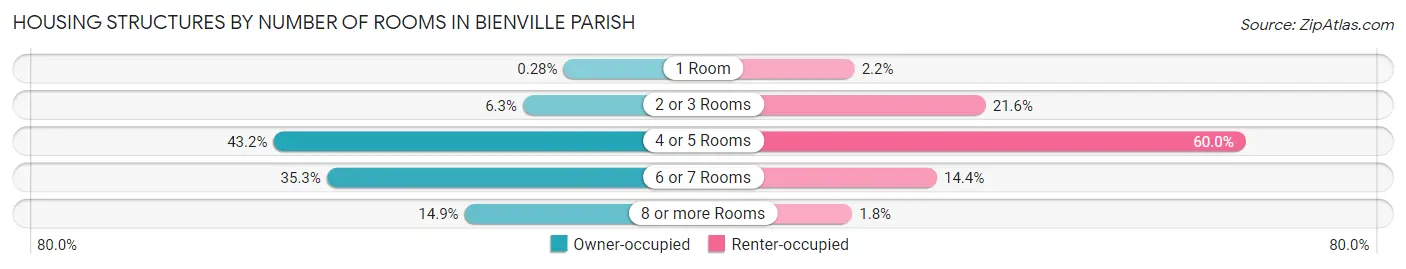
| Number of Rooms | Owner-occupied | Renter-occupied |
| 1 Room | 11 (0.3%) | 31 (2.2%) |
| 2 or 3 Rooms | 249 (6.3%) | 305 (21.6%) |
| 4 or 5 Rooms | 1,712 (43.2%) | 848 (60.0%) |
| 6 or 7 Rooms | 1,399 (35.3%) | 203 (14.4%) |
| 8 or more Rooms | 591 (14.9%) | 26 (1.8%) |
| Total | 3,962 (100.0%) | 1,413 (100.0%) |
Housing Structure by Heating Type in Bienville Parish
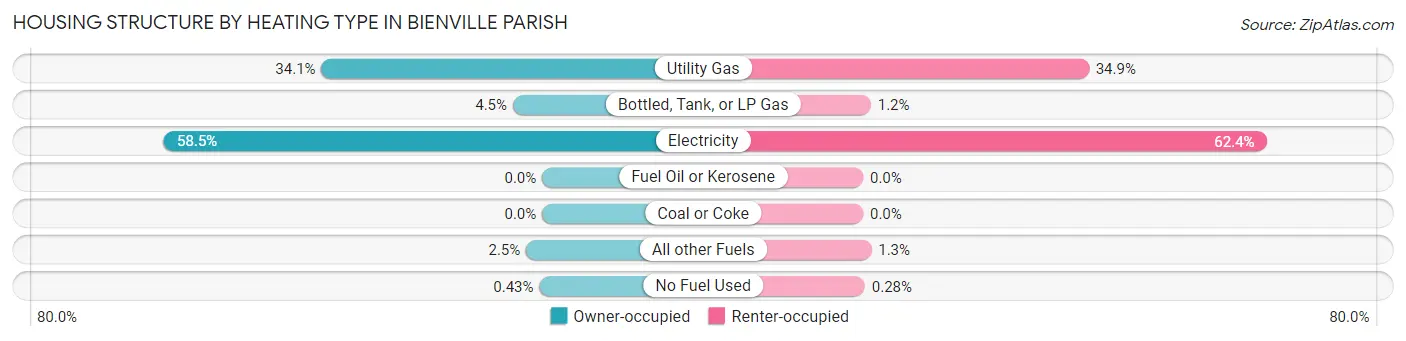
| Heating Type | Owner-occupied | Renter-occupied |
| Utility Gas | 1,352 (34.1%) | 493 (34.9%) |
| Bottled, Tank, or LP Gas | 179 (4.5%) | 17 (1.2%) |
| Electricity | 2,316 (58.5%) | 881 (62.4%) |
| Fuel Oil or Kerosene | 0 (0.0%) | 0 (0.0%) |
| Coal or Coke | 0 (0.0%) | 0 (0.0%) |
| All other Fuels | 98 (2.5%) | 18 (1.3%) |
| No Fuel Used | 17 (0.4%) | 4 (0.3%) |
| Total | 3,962 (100.0%) | 1,413 (100.0%) |
Household Vehicle Usage in Bienville Parish
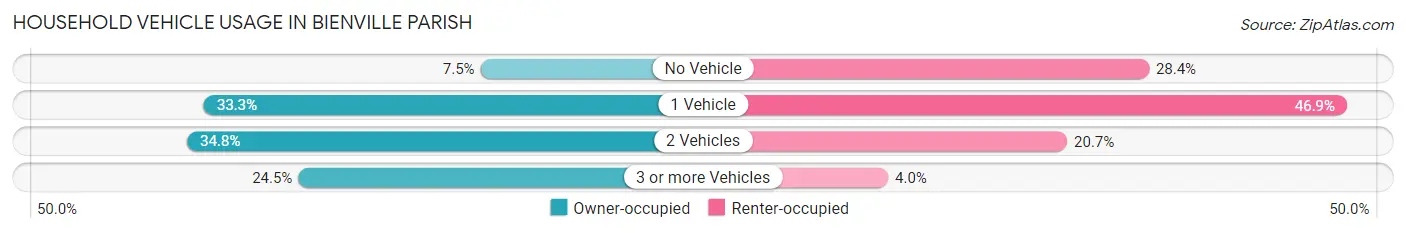
| Vehicles per Household | Owner-occupied | Renter-occupied |
| No Vehicle | 295 (7.4%) | 401 (28.4%) |
| 1 Vehicle | 1,318 (33.3%) | 662 (46.9%) |
| 2 Vehicles | 1,380 (34.8%) | 293 (20.7%) |
| 3 or more Vehicles | 969 (24.5%) | 57 (4.0%) |
| Total | 3,962 (100.0%) | 1,413 (100.0%) |
Real Estate & Mortgages in Bienville Parish
Real Estate and Mortgage Overview in Bienville Parish
| Characteristic | Without Mortgage | With Mortgage |
| Housing Units | 2,718 | 1,244 |
| Median Property Value | $64,800 | $97,500 |
| Median Household Income | $35,924 | $104 |
| Monthly Housing Costs | $292 | $41 |
| Real Estate Taxes | $199 | $499 |
Property Value by Mortgage Status in Bienville Parish
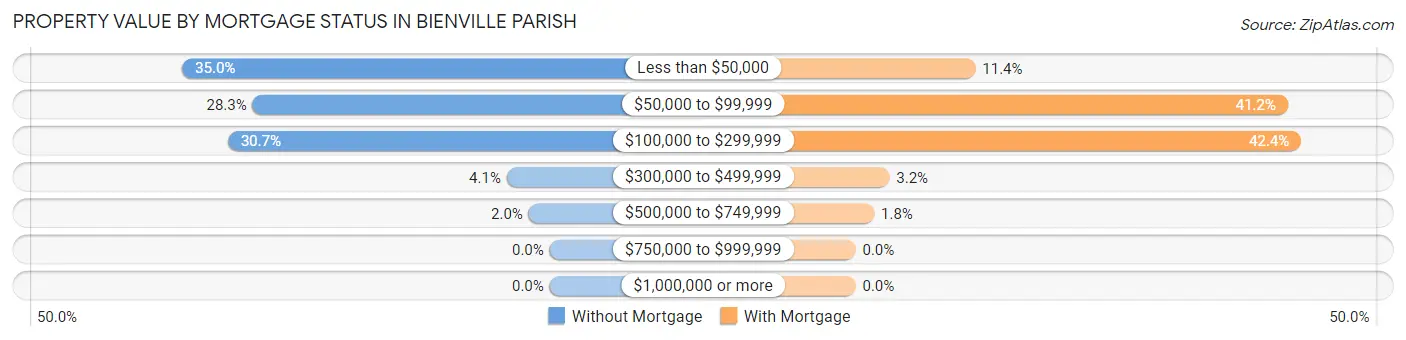
| Property Value | Without Mortgage | With Mortgage |
| Less than $50,000 | 951 (35.0%) | 142 (11.4%) |
| $50,000 to $99,999 | 769 (28.3%) | 512 (41.2%) |
| $100,000 to $299,999 | 833 (30.6%) | 528 (42.4%) |
| $300,000 to $499,999 | 111 (4.1%) | 40 (3.2%) |
| $500,000 to $749,999 | 54 (2.0%) | 22 (1.8%) |
| $750,000 to $999,999 | 0 (0.0%) | 0 (0.0%) |
| $1,000,000 or more | 0 (0.0%) | 0 (0.0%) |
| Total | 2,718 (100.0%) | 1,244 (100.0%) |
Household Income by Mortgage Status in Bienville Parish
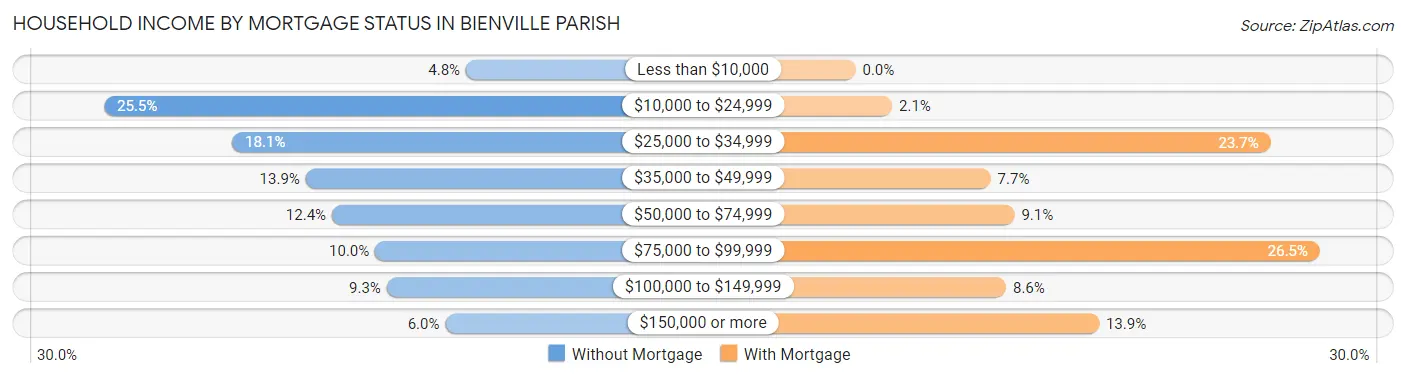
| Household Income | Without Mortgage | With Mortgage |
| Less than $10,000 | 130 (4.8%) | 0 (0.0%) |
| $10,000 to $24,999 | 692 (25.5%) | 26 (2.1%) |
| $25,000 to $34,999 | 493 (18.1%) | 295 (23.7%) |
| $35,000 to $49,999 | 379 (13.9%) | 96 (7.7%) |
| $50,000 to $74,999 | 338 (12.4%) | 113 (9.1%) |
| $75,000 to $99,999 | 271 (10.0%) | 330 (26.5%) |
| $100,000 to $149,999 | 253 (9.3%) | 107 (8.6%) |
| $150,000 or more | 162 (6.0%) | 173 (13.9%) |
| Total | 2,718 (100.0%) | 1,244 (100.0%) |
Property Value to Household Income Ratio in Bienville Parish
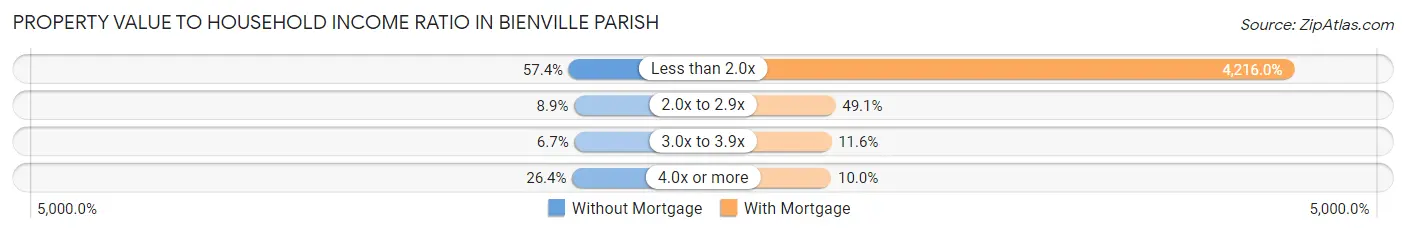
| Value-to-Income Ratio | Without Mortgage | With Mortgage |
| Less than 2.0x | 1,559 (57.4%) | 52,447 (4,216.0%) |
| 2.0x to 2.9x | 243 (8.9%) | 611 (49.1%) |
| 3.0x to 3.9x | 182 (6.7%) | 144 (11.6%) |
| 4.0x or more | 718 (26.4%) | 124 (10.0%) |
| Total | 2,718 (100.0%) | 1,244 (100.0%) |
Real Estate Taxes by Mortgage Status in Bienville Parish
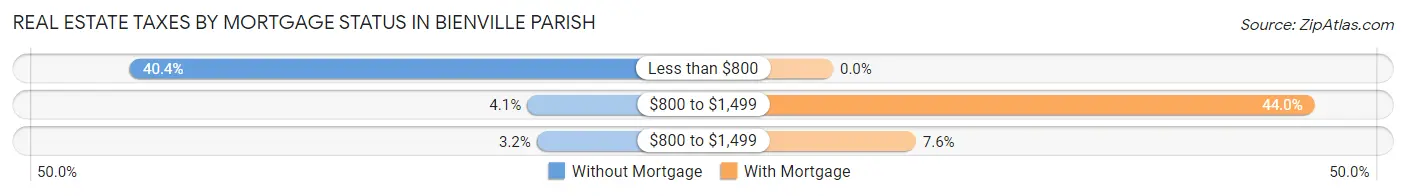
| Property Taxes | Without Mortgage | With Mortgage |
| Less than $800 | 1,097 (40.4%) | 0 (0.0%) |
| $800 to $1,499 | 112 (4.1%) | 547 (44.0%) |
| $800 to $1,499 | 88 (3.2%) | 94 (7.6%) |
| Total | 2,718 (100.0%) | 1,244 (100.0%) |
Health & Disability in Bienville Parish
Health Insurance Coverage by Age in Bienville Parish
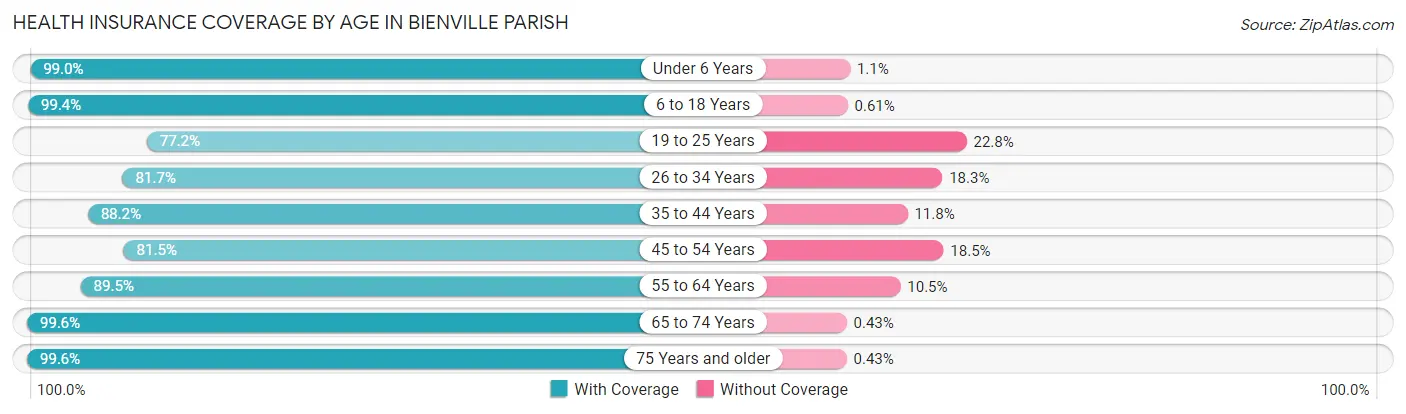
| Age Bracket | With Coverage | Without Coverage |
| Under 6 Years | 847 (99.0%) | 9 (1.1%) |
| 6 to 18 Years | 2,114 (99.4%) | 13 (0.6%) |
| 19 to 25 Years | 769 (77.2%) | 227 (22.8%) |
| 26 to 34 Years | 1,106 (81.7%) | 247 (18.3%) |
| 35 to 44 Years | 1,280 (88.2%) | 171 (11.8%) |
| 45 to 54 Years | 1,213 (81.5%) | 275 (18.5%) |
| 55 to 64 Years | 1,627 (89.5%) | 190 (10.5%) |
| 65 to 74 Years | 1,383 (99.6%) | 6 (0.4%) |
| 75 Years and older | 1,150 (99.6%) | 5 (0.4%) |
| Total | 11,489 (90.9%) | 1,143 (9.0%) |
Health Insurance Coverage by Citizenship Status in Bienville Parish
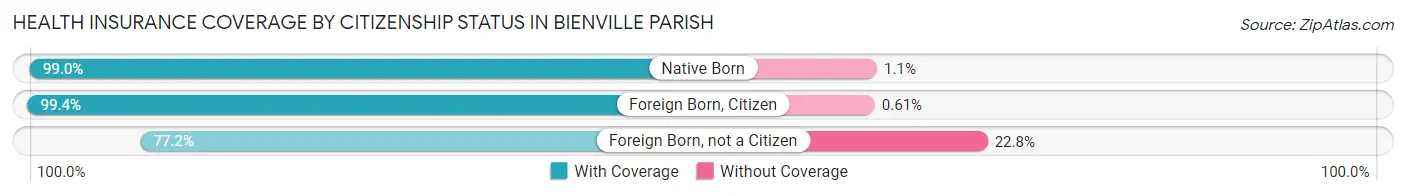
| Citizenship Status | With Coverage | Without Coverage |
| Native Born | 847 (99.0%) | 9 (1.1%) |
| Foreign Born, Citizen | 2,114 (99.4%) | 13 (0.6%) |
| Foreign Born, not a Citizen | 769 (77.2%) | 227 (22.8%) |
Health Insurance Coverage by Household Income in Bienville Parish
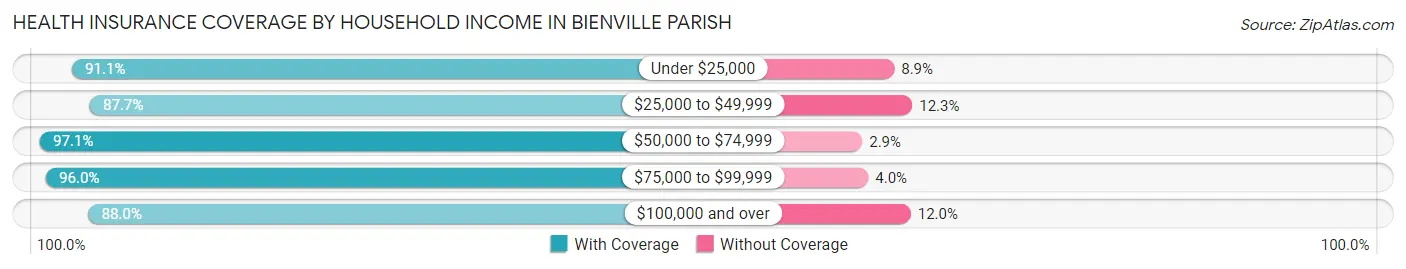
| Household Income | With Coverage | Without Coverage |
| Under $25,000 | 3,564 (91.1%) | 348 (8.9%) |
| $25,000 to $49,999 | 3,007 (87.7%) | 421 (12.3%) |
| $50,000 to $74,999 | 1,809 (97.1%) | 54 (2.9%) |
| $75,000 to $99,999 | 1,093 (96.0%) | 46 (4.0%) |
| $100,000 and over | 2,011 (88.0%) | 274 (12.0%) |
Public vs Private Health Insurance Coverage by Age in Bienville Parish
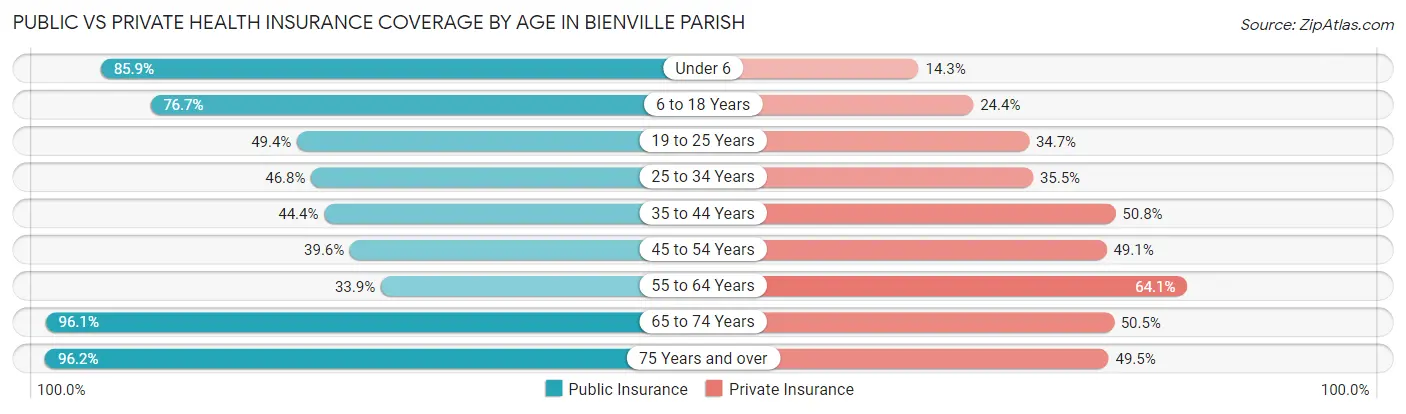
| Age Bracket | Public Insurance | Private Insurance |
| Under 6 | 735 (85.9%) | 122 (14.2%) |
| 6 to 18 Years | 1,631 (76.7%) | 519 (24.4%) |
| 19 to 25 Years | 492 (49.4%) | 346 (34.7%) |
| 25 to 34 Years | 633 (46.8%) | 480 (35.5%) |
| 35 to 44 Years | 644 (44.4%) | 737 (50.8%) |
| 45 to 54 Years | 589 (39.6%) | 731 (49.1%) |
| 55 to 64 Years | 615 (33.9%) | 1,165 (64.1%) |
| 65 to 74 Years | 1,335 (96.1%) | 701 (50.5%) |
| 75 Years and over | 1,111 (96.2%) | 572 (49.5%) |
| Total | 7,785 (61.6%) | 5,373 (42.5%) |
Disability Status by Sex by Age in Bienville Parish
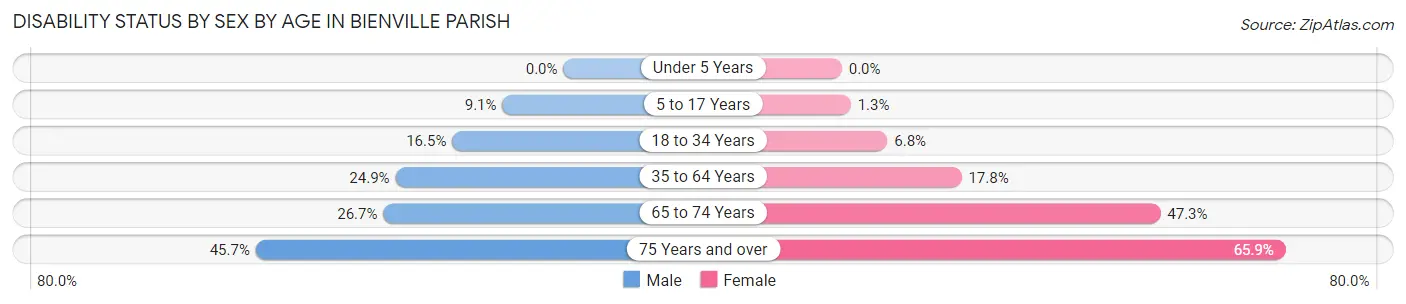
| Age Bracket | Male | Female |
| Under 5 Years | 0 (0.0%) | 0 (0.0%) |
| 5 to 17 Years | 92 (9.1%) | 15 (1.3%) |
| 18 to 34 Years | 203 (16.5%) | 81 (6.8%) |
| 35 to 64 Years | 577 (24.9%) | 434 (17.8%) |
| 65 to 74 Years | 173 (26.7%) | 351 (47.3%) |
| 75 Years and over | 206 (45.7%) | 464 (65.9%) |
Disability Class by Sex by Age in Bienville Parish
Disability Class: Hearing Difficulty
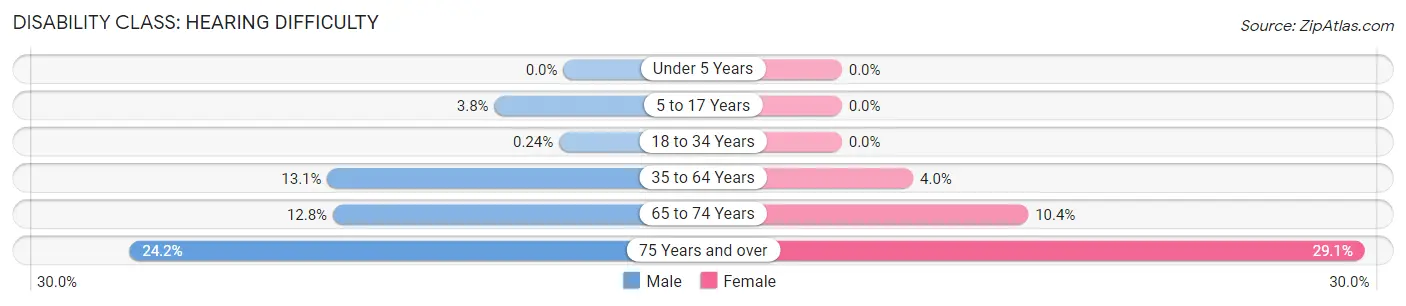
| Age Bracket | Male | Female |
| Under 5 Years | 0 (0.0%) | 0 (0.0%) |
| 5 to 17 Years | 39 (3.8%) | 0 (0.0%) |
| 18 to 34 Years | 3 (0.2%) | 0 (0.0%) |
| 35 to 64 Years | 304 (13.1%) | 97 (4.0%) |
| 65 to 74 Years | 83 (12.8%) | 77 (10.4%) |
| 75 Years and over | 109 (24.2%) | 205 (29.1%) |
Disability Class: Vision Difficulty
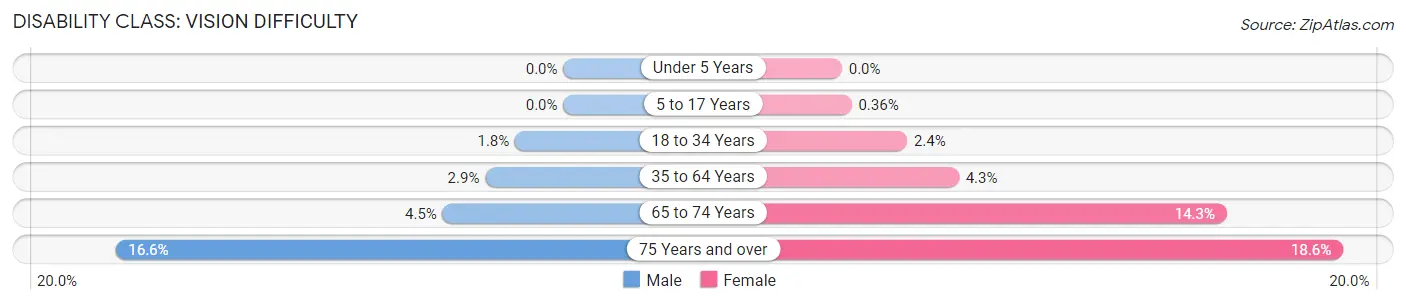
| Age Bracket | Male | Female |
| Under 5 Years | 0 (0.0%) | 0 (0.0%) |
| 5 to 17 Years | 0 (0.0%) | 4 (0.4%) |
| 18 to 34 Years | 22 (1.8%) | 29 (2.4%) |
| 35 to 64 Years | 67 (2.9%) | 106 (4.3%) |
| 65 to 74 Years | 29 (4.5%) | 106 (14.3%) |
| 75 Years and over | 75 (16.6%) | 131 (18.6%) |
Disability Class: Cognitive Difficulty
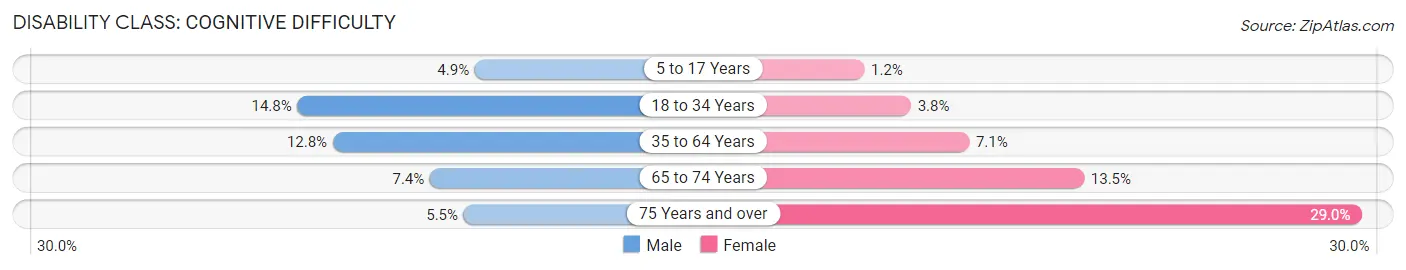
| Age Bracket | Male | Female |
| 5 to 17 Years | 50 (4.9%) | 14 (1.2%) |
| 18 to 34 Years | 182 (14.8%) | 46 (3.8%) |
| 35 to 64 Years | 297 (12.8%) | 173 (7.1%) |
| 65 to 74 Years | 48 (7.4%) | 100 (13.5%) |
| 75 Years and over | 25 (5.5%) | 204 (29.0%) |
Disability Class: Ambulatory Difficulty
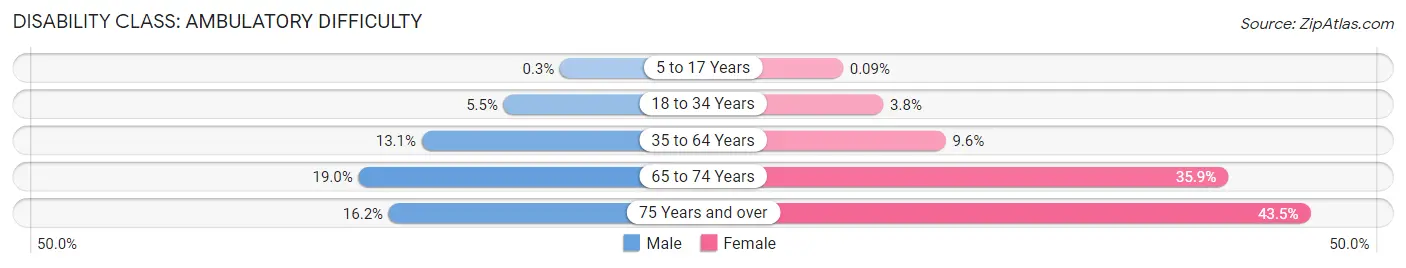
| Age Bracket | Male | Female |
| 5 to 17 Years | 3 (0.3%) | 1 (0.1%) |
| 18 to 34 Years | 68 (5.5%) | 46 (3.8%) |
| 35 to 64 Years | 304 (13.1%) | 235 (9.6%) |
| 65 to 74 Years | 123 (19.0%) | 266 (35.8%) |
| 75 Years and over | 73 (16.2%) | 306 (43.5%) |
Disability Class: Self-Care Difficulty
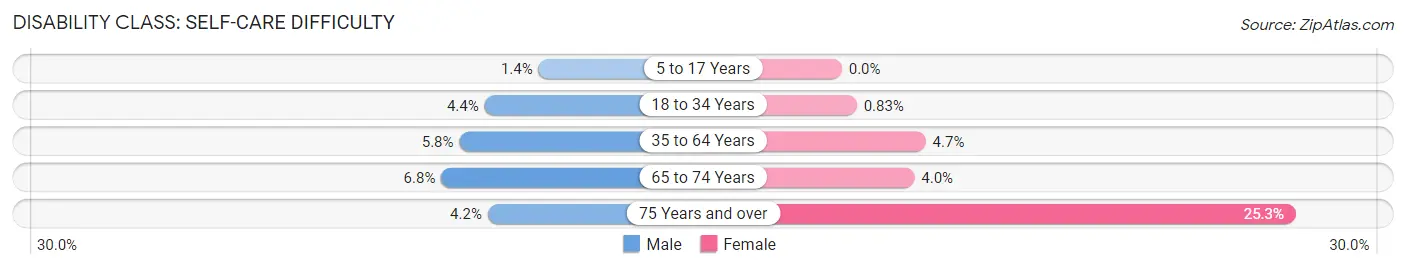
| Age Bracket | Male | Female |
| 5 to 17 Years | 14 (1.4%) | 0 (0.0%) |
| 18 to 34 Years | 54 (4.4%) | 10 (0.8%) |
| 35 to 64 Years | 134 (5.8%) | 114 (4.7%) |
| 65 to 74 Years | 44 (6.8%) | 30 (4.0%) |
| 75 Years and over | 19 (4.2%) | 178 (25.3%) |
Technology Access in Bienville Parish
Computing Device Access in Bienville Parish
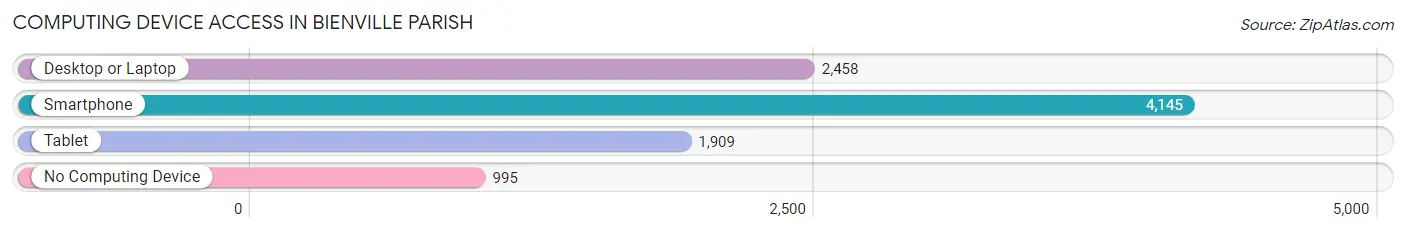
| Device Type | # Households | % Households |
| Desktop or Laptop | 2,458 | 45.7% |
| Smartphone | 4,145 | 77.1% |
| Tablet | 1,909 | 35.5% |
| No Computing Device | 995 | 18.5% |
| Total | 5,375 | 100.0% |
Internet Access in Bienville Parish
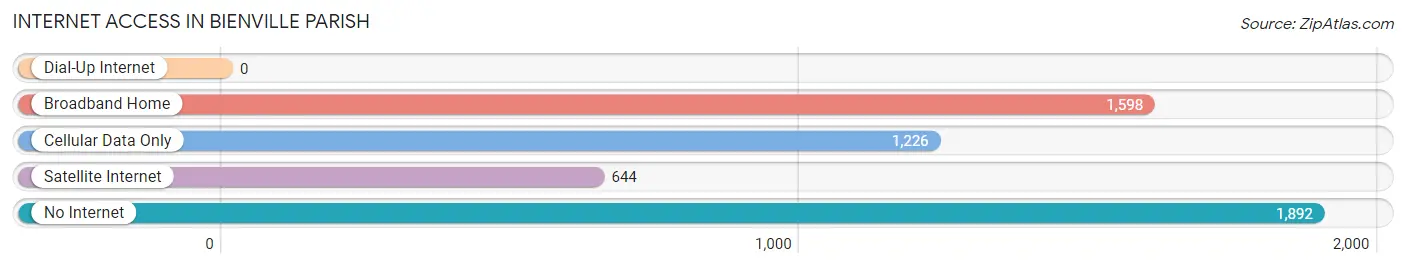
| Internet Type | # Households | % Households |
| Dial-Up Internet | 0 | 0.0% |
| Broadband Home | 1,598 | 29.7% |
| Cellular Data Only | 1,226 | 22.8% |
| Satellite Internet | 644 | 12.0% |
| No Internet | 1,892 | 35.2% |
| Total | 5,375 | 100.0% |
Bienville Parish Summary
Bienville Parish is a parish located in the northwestern corner of the state of Louisiana. It is bordered by the states of Arkansas and Mississippi, and is part of the Ark-La-Tex region. The parish seat is Arcadia, and the largest city is Gibsland. As of the 2010 census, the population was 14,353.
Geography
Bienville Parish is located in the northwest corner of Louisiana, and is bordered by Arkansas to the north, Mississippi to the east, and Webster and Claiborne Parishes to the south. The parish covers an area of 845 square miles, and is the fourth largest parish in the state. The terrain is mostly flat, with some rolling hills in the northern part of the parish. The highest point in the parish is located in the northwest corner, at an elevation of 545 feet. The parish is drained by the Red River, which forms the western boundary of the parish.
The parish is home to several protected areas, including the Kisatchie National Forest, the Upper Ouachita National Wildlife Refuge, and the Red River National Wildlife Refuge.
History
Bienville Parish was created in 1848, and was named for Pierre Le Moyne d'Iberville, the French explorer who founded Louisiana. The parish was originally part of Claiborne Parish, but was split off in 1848. The parish seat was originally located in the town of Sparta, but was moved to Arcadia in 1859.
The parish was largely rural until the early 20th century, when the timber and oil industries began to develop. The timber industry was particularly important, and the parish was home to several large sawmills. The oil industry began to develop in the 1920s, and the parish was home to several oil fields.
Economy
The economy of Bienville Parish is largely based on agriculture and timber. The parish is home to several large timber companies, and the timber industry is the largest employer in the parish. The oil industry is also important, and the parish is home to several oil fields.
The parish is also home to several manufacturing companies, including a paper mill, a furniture factory, and a plastics plant. The parish is also home to several retail stores, restaurants, and other businesses.
Demographics
As of the 2010 census, there were 14,353 people, 5,541 households, and 3,845 families living in the parish. The population density was 17.1 people per square mile. The racial makeup of the parish was 79.3% White, 18.2% African American, 0.4% Native American, 0.3% Asian, 0.1% Pacific Islander, 0.7% from other races, and 1.0% from two or more races. Hispanic or Latino of any race were 1.9% of the population.
The median income for a household in the parish was $30,945, and the median income for a family was $37,945. The per capita income for the parish was $15,945. About 19.3% of families and 24.2% of the population were below the poverty line, including 33.3% of those under age 18 and 18.2% of those age 65 or over.
Common Questions
What is the Total Population of Bienville Parish?
Total Population of Bienville Parish is 12,958.
What is the Total Male Population of Bienville Parish?
Total Male Population of Bienville Parish is 6,192.
What is the Total Female Population of Bienville Parish?
Total Female Population of Bienville Parish is 6,766.
What is the Ratio of Males per 100 Females in Bienville Parish?
There are 91.52 Males per 100 Females in Bienville Parish.
What is the Ratio of Females per 100 Males in Bienville Parish?
There are 109.27 Females per 100 Males in Bienville Parish.
What is the Median Population Age in Bienville Parish?
Median Population Age in Bienville Parish is 42.1 Years.
What is the Average Family Size in Bienville Parish
Average Family Size in Bienville Parish is 3.2 People.
What is the Average Household Size in Bienville Parish
Average Household Size in Bienville Parish is 2.4 People.
What is Per Capita Income in Bienville Parish?
Per Capita income in Bienville Parish is $22,269.
What is the Median Family Income in Bienville Parish?
Median Family Income in Bienville Parish is $50,606.
What is the Median Household income in Bienville Parish?
Median Household Income in Bienville Parish is $34,268.
What is Income or Wage Gap in Bienville Parish?
Income or Wage Gap in Bienville Parish is 35.4%.
Women in Bienville Parish earn 64.6 cents for every dollar earned by a man.
What is Family Income Deficit in Bienville Parish?
Family Income Deficit in Bienville Parish is $11,130.
Families that are below poverty line in Bienville Parish earn $11,130 less on average than the poverty threshold level.
What is Inequality or Gini Index in Bienville Parish?
Inequality or Gini Index in Bienville Parish is 0.47.
How Large is the Labor Force in Bienville Parish?
There are 4,776 People in the Labor Forcein in Bienville Parish.
What is the Percentage of People in the Labor Force in Bienville Parish?
45.8% of People are in the Labor Force in Bienville Parish.
What is the Unemployment Rate in Bienville Parish?
Unemployment Rate in Bienville Parish is 5.6%.