Avoyelles Parish, LA
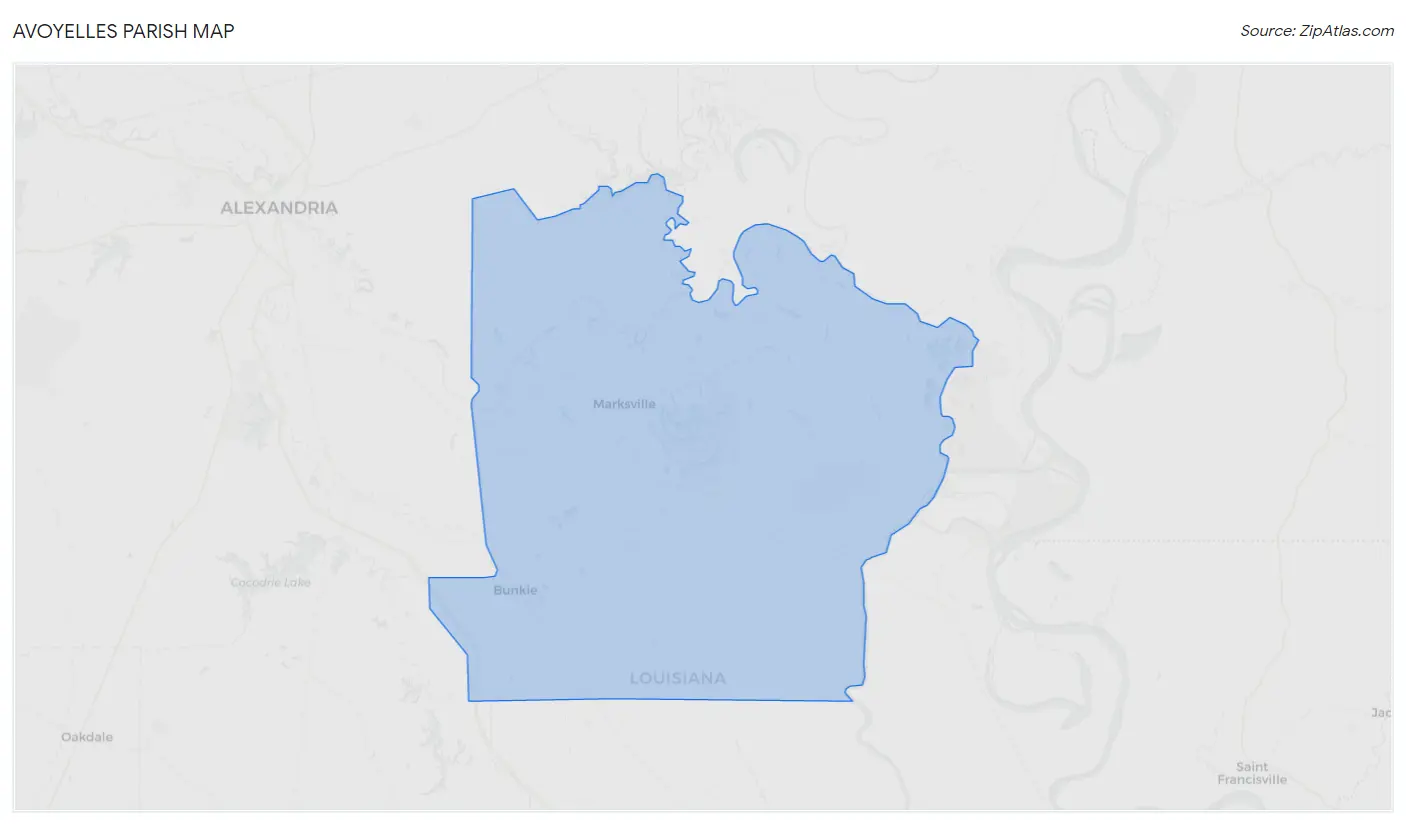
Avoyelles Parish Map
Avoyelles Parish Overview
39,529
TOTAL POPULATION
19,774
MALE POPULATION
19,755
FEMALE POPULATION
100.10
MALES / 100 FEMALES
99.90
FEMALES / 100 MALES
38.6
MEDIAN AGE
3.1
AVG FAMILY SIZE
2.5
AVG HOUSEHOLD SIZE
$23,597
PER CAPITA INCOME
$48,982
AVG FAMILY INCOME
$38,696
AVG HOUSEHOLD INCOME
33.3%
WAGE / INCOME GAP [ % ]
66.7¢/ $1
WAGE / INCOME GAP [ $ ]
$12,400
FAMILY INCOME DEFICIT
0.51
INEQUALITY / GINI INDEX
16,163
LABOR FORCE [ PEOPLE ]
51.6%
PERCENT IN LABOR FORCE
7.5%
UNEMPLOYMENT RATE
Avoyelles Parish Area Codes
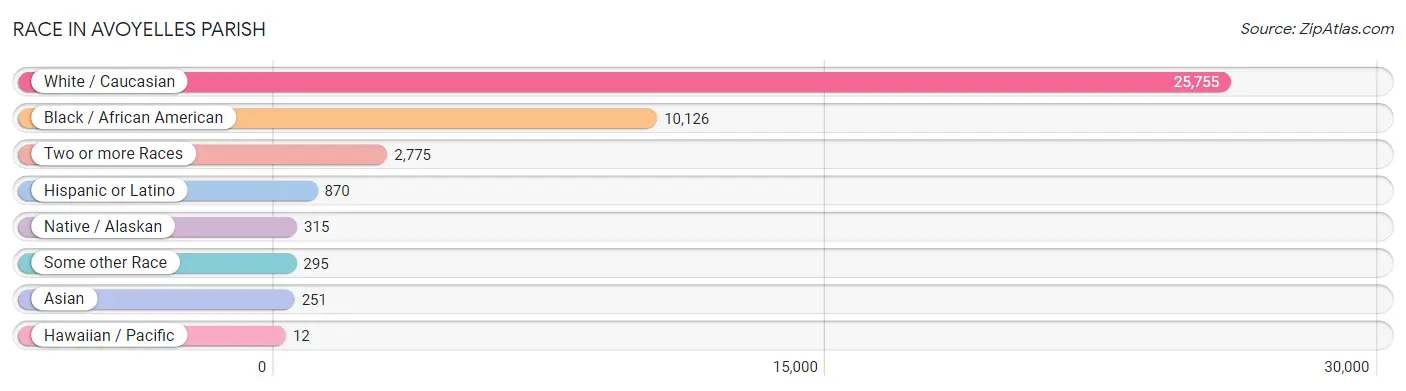
Race in Avoyelles Parish
The most populous races in Avoyelles Parish are White / Caucasian (25,755 | 65.1%), Black / African American (10,126 | 25.6%), and Two or more Races (2,775 | 7.0%).
| Race | # Population | % Population |
| Asian | 251 | 0.6% |
| Black / African American | 10,126 | 25.6% |
| Hawaiian / Pacific | 12 | 0.0% |
| Hispanic or Latino | 870 | 2.2% |
| Native / Alaskan | 315 | 0.8% |
| White / Caucasian | 25,755 | 65.1% |
| Two or more Races | 2,775 | 7.0% |
| Some other Race | 295 | 0.7% |
| Total | 39,529 | 100.0% |
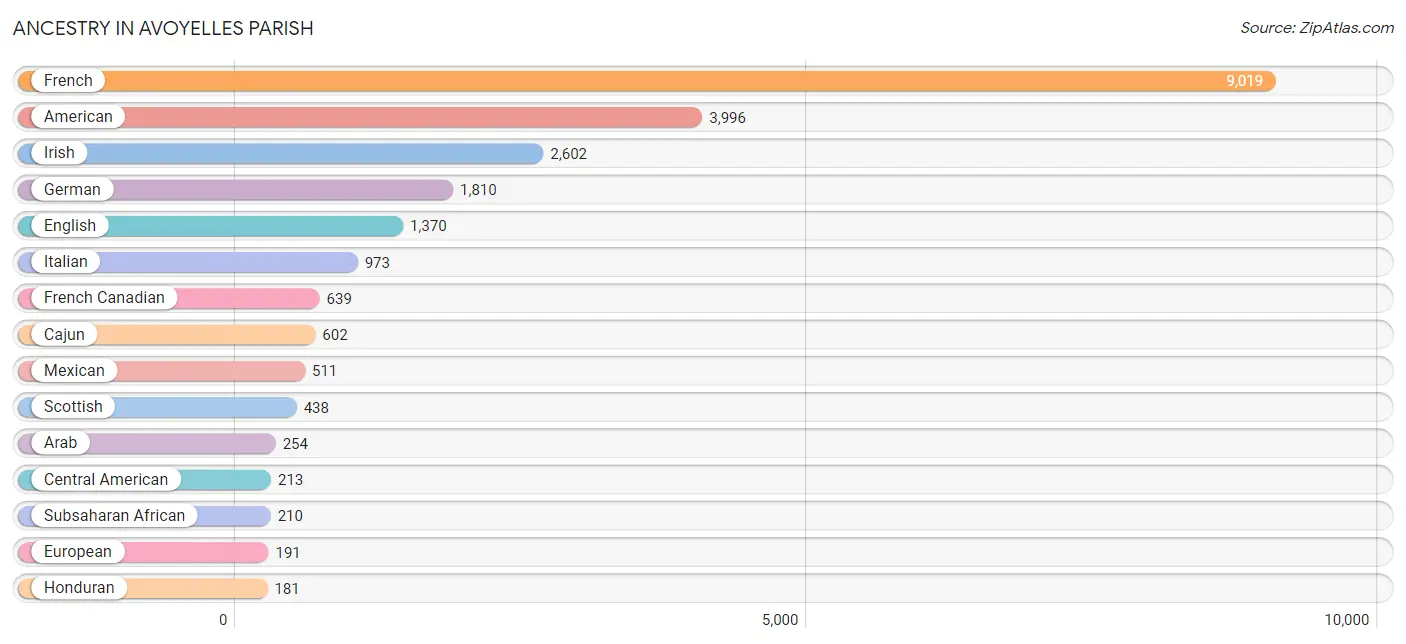
Ancestry in Avoyelles Parish
The most populous ancestries reported in Avoyelles Parish are French (9,019 | 22.8%), American (3,996 | 10.1%), Irish (2,602 | 6.6%), German (1,810 | 4.6%), and English (1,370 | 3.5%), together accounting for 47.6% of all Avoyelles Parish residents.
| Ancestry | # Population | % Population |
| African | 45 | 0.1% |
| Alaskan Athabascan | 17 | 0.0% |
| American | 3,996 | 10.1% |
| Arab | 254 | 0.6% |
| Belgian | 6 | 0.0% |
| Bhutanese | 6 | 0.0% |
| Blackfeet | 19 | 0.1% |
| British | 34 | 0.1% |
| Burmese | 3 | 0.0% |
| Cajun | 602 | 1.5% |
| Canadian | 36 | 0.1% |
| Central American | 213 | 0.5% |
| Cherokee | 108 | 0.3% |
| Choctaw | 77 | 0.2% |
| Creek | 18 | 0.1% |
| Czech | 32 | 0.1% |
| Danish | 6 | 0.0% |
| Dutch | 172 | 0.4% |
| Eastern European | 51 | 0.1% |
| Egyptian | 12 | 0.0% |
| English | 1,370 | 3.5% |
| European | 191 | 0.5% |
| French | 9,019 | 22.8% |
| French Canadian | 639 | 1.6% |
| German | 1,810 | 4.6% |
| Greek | 3 | 0.0% |
| Honduran | 181 | 0.5% |
| Indian (Asian) | 48 | 0.1% |
| Irish | 2,602 | 6.6% |
| Iroquois | 16 | 0.0% |
| Italian | 973 | 2.5% |
| Korean | 151 | 0.4% |
| Lebanese | 2 | 0.0% |
| Mexican | 511 | 1.3% |
| Mexican American Indian | 47 | 0.1% |
| Moroccan | 40 | 0.1% |
| Native Hawaiian | 2 | 0.0% |
| Nigerian | 5 | 0.0% |
| Norwegian | 55 | 0.1% |
| Polish | 10 | 0.0% |
| Portuguese | 41 | 0.1% |
| Puerto Rican | 19 | 0.1% |
| Salvadoran | 32 | 0.1% |
| Scandinavian | 69 | 0.2% |
| Scotch-Irish | 154 | 0.4% |
| Scottish | 438 | 1.1% |
| Spaniard | 11 | 0.0% |
| Spanish | 50 | 0.1% |
| Sri Lankan | 37 | 0.1% |
| Subsaharan African | 210 | 0.5% |
| Swedish | 47 | 0.1% |
| Swiss | 7 | 0.0% |
| Thai | 6 | 0.0% |
| Ukrainian | 5 | 0.0% |
| Welsh | 52 | 0.1% | View All 55 Rows |
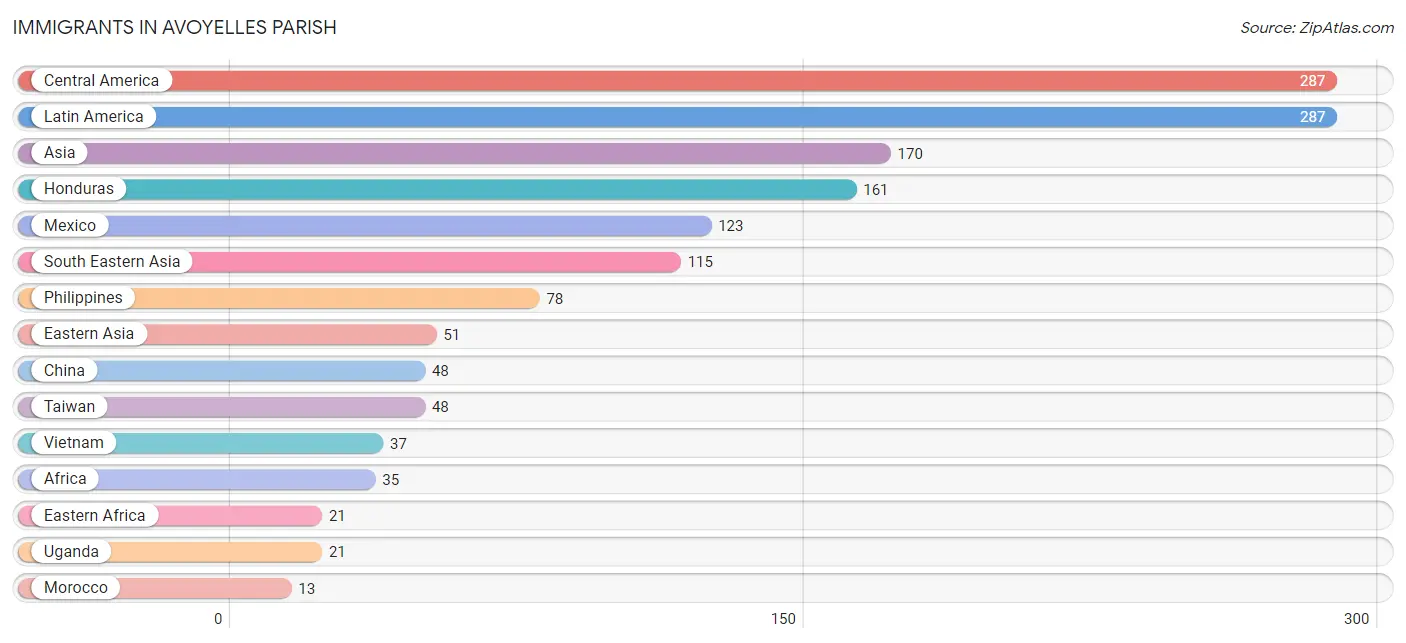
Immigrants in Avoyelles Parish
The most numerous immigrant groups reported in Avoyelles Parish came from Central America (287 | 0.7%), Latin America (287 | 0.7%), Asia (170 | 0.4%), Honduras (161 | 0.4%), and Mexico (123 | 0.3%), together accounting for 2.6% of all Avoyelles Parish residents.
| Immigration Origin | # Population | % Population |
| Africa | 35 | 0.1% |
| Asia | 170 | 0.4% |
| Central America | 287 | 0.7% |
| China | 48 | 0.1% |
| Eastern Africa | 21 | 0.1% |
| Eastern Asia | 51 | 0.1% |
| Eastern Europe | 5 | 0.0% |
| Europe | 5 | 0.0% |
| Guatemala | 3 | 0.0% |
| Honduras | 161 | 0.4% |
| India | 4 | 0.0% |
| Korea | 3 | 0.0% |
| Latin America | 287 | 0.7% |
| Mexico | 123 | 0.3% |
| Morocco | 13 | 0.0% |
| Nigeria | 1 | 0.0% |
| Northern Africa | 13 | 0.0% |
| Philippines | 78 | 0.2% |
| South Central Asia | 4 | 0.0% |
| South Eastern Asia | 115 | 0.3% |
| Taiwan | 48 | 0.1% |
| Uganda | 21 | 0.1% |
| Ukraine | 5 | 0.0% |
| Vietnam | 37 | 0.1% |
| Western Africa | 1 | 0.0% | View All 25 Rows |
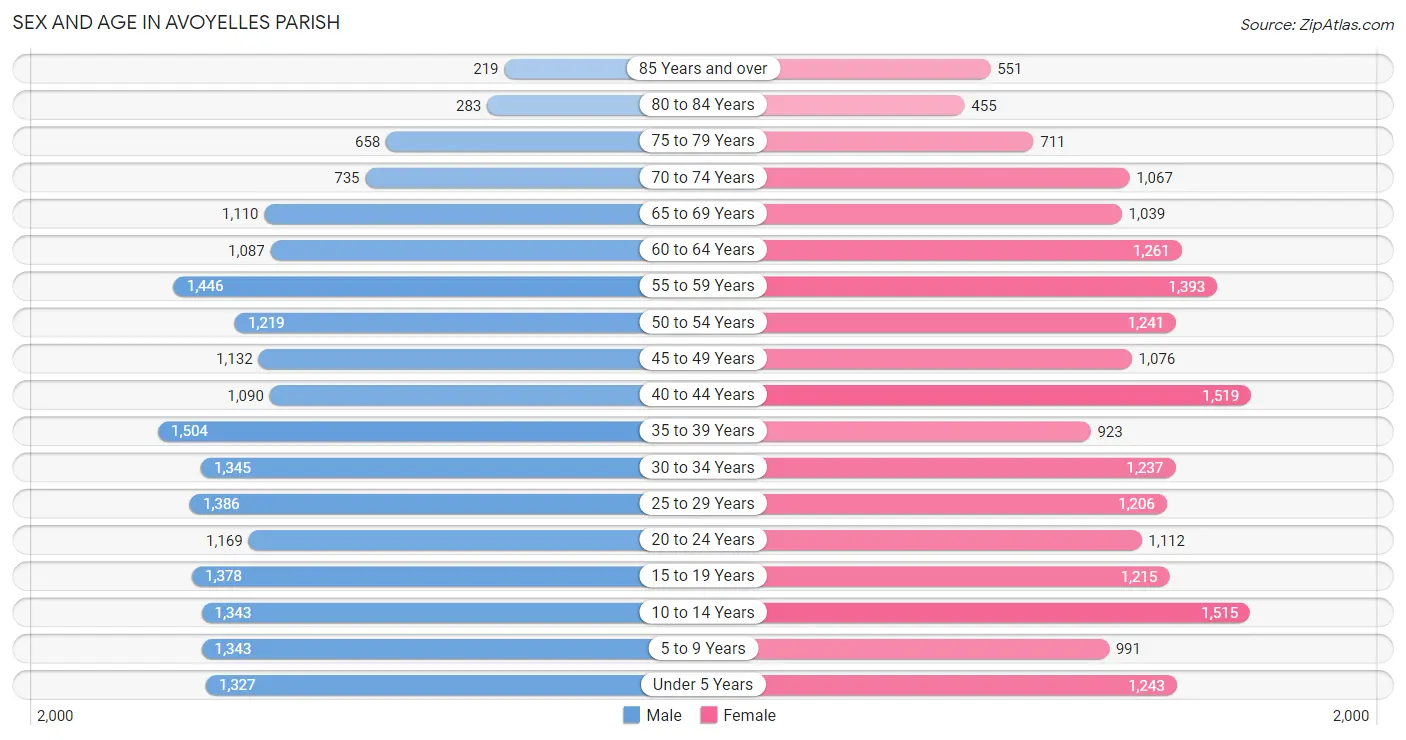
Sex and Age in Avoyelles Parish
Sex and Age in Avoyelles Parish
The most populous age groups in Avoyelles Parish are 35 to 39 Years (1,504 | 7.6%) for men and 40 to 44 Years (1,519 | 7.7%) for women.
| Age Bracket | Male | Female |
| Under 5 Years | 1,327 (6.7%) | 1,243 (6.3%) |
| 5 to 9 Years | 1,343 (6.8%) | 991 (5.0%) |
| 10 to 14 Years | 1,343 (6.8%) | 1,515 (7.7%) |
| 15 to 19 Years | 1,378 (7.0%) | 1,215 (6.1%) |
| 20 to 24 Years | 1,169 (5.9%) | 1,112 (5.6%) |
| 25 to 29 Years | 1,386 (7.0%) | 1,206 (6.1%) |
| 30 to 34 Years | 1,345 (6.8%) | 1,237 (6.3%) |
| 35 to 39 Years | 1,504 (7.6%) | 923 (4.7%) |
| 40 to 44 Years | 1,090 (5.5%) | 1,519 (7.7%) |
| 45 to 49 Years | 1,132 (5.7%) | 1,076 (5.4%) |
| 50 to 54 Years | 1,219 (6.2%) | 1,241 (6.3%) |
| 55 to 59 Years | 1,446 (7.3%) | 1,393 (7.0%) |
| 60 to 64 Years | 1,087 (5.5%) | 1,261 (6.4%) |
| 65 to 69 Years | 1,110 (5.6%) | 1,039 (5.3%) |
| 70 to 74 Years | 735 (3.7%) | 1,067 (5.4%) |
| 75 to 79 Years | 658 (3.3%) | 711 (3.6%) |
| 80 to 84 Years | 283 (1.4%) | 455 (2.3%) |
| 85 Years and over | 219 (1.1%) | 551 (2.8%) |
| Total | 19,774 (100.0%) | 19,755 (100.0%) |
Families and Households in Avoyelles Parish
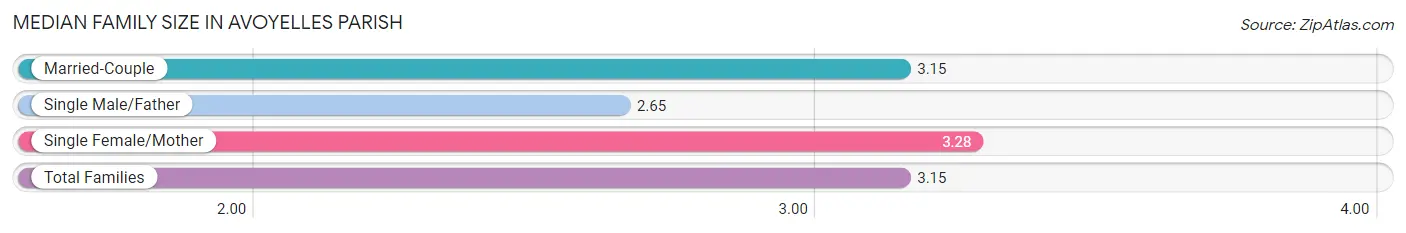
Median Family Size in Avoyelles Parish
The median family size in Avoyelles Parish is 3.15 persons per family, with single female/mother families (2,779 | 30.5%) accounting for the largest median family size of 3.28 persons per family. On the other hand, single male/father families (745 | 8.2%) represent the smallest median family size with 2.65 persons per family.
| Family Type | # Families | Family Size |
| Married-Couple | 5,575 (61.3%) | 3.15 |
| Single Male/Father | 745 (8.2%) | 2.65 |
| Single Female/Mother | 2,779 (30.5%) | 3.28 |
| Total Families | 9,099 (100.0%) | 3.15 |
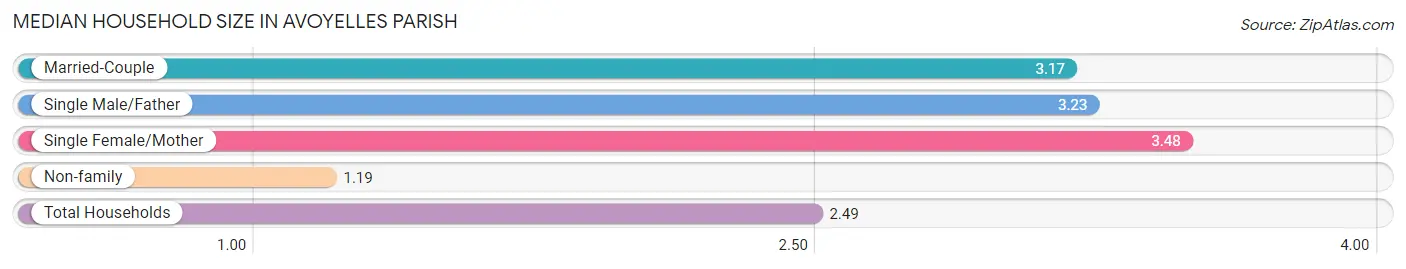
Median Household Size in Avoyelles Parish
The median household size in Avoyelles Parish is 2.49 persons per household, with single female/mother households (2,779 | 19.0%) accounting for the largest median household size of 3.48 persons per household. non-family households (5,501 | 37.7%) represent the smallest median household size with 1.19 persons per household.
| Household Type | # Households | Household Size |
| Married-Couple | 5,575 (38.2%) | 3.17 |
| Single Male/Father | 745 (5.1%) | 3.23 |
| Single Female/Mother | 2,779 (19.0%) | 3.48 |
| Non-family | 5,501 (37.7%) | 1.19 |
| Total Households | 14,600 (100.0%) | 2.49 |
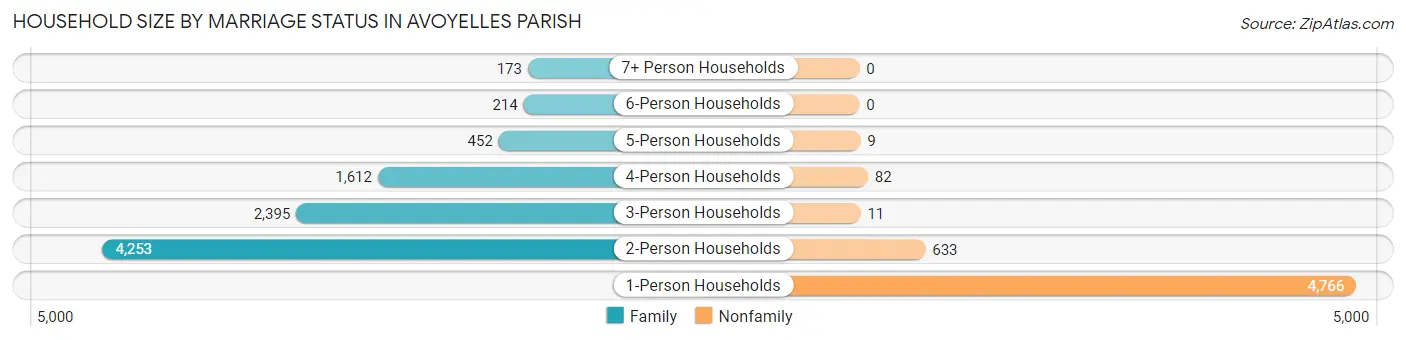
Household Size by Marriage Status in Avoyelles Parish
Out of a total of 14,600 households in Avoyelles Parish, 9,099 (62.3%) are family households, while 5,501 (37.7%) are nonfamily households. The most numerous type of family households are 2-person households, comprising 4,253, and the most common type of nonfamily households are 1-person households, comprising 4,766.
| Household Size | Family Households | Nonfamily Households |
| 1-Person Households | - | 4,766 (32.6%) |
| 2-Person Households | 4,253 (29.1%) | 633 (4.3%) |
| 3-Person Households | 2,395 (16.4%) | 11 (0.1%) |
| 4-Person Households | 1,612 (11.0%) | 82 (0.6%) |
| 5-Person Households | 452 (3.1%) | 9 (0.1%) |
| 6-Person Households | 214 (1.5%) | 0 (0.0%) |
| 7+ Person Households | 173 (1.2%) | 0 (0.0%) |
| Total | 9,099 (62.3%) | 5,501 (37.7%) |
Female Fertility in Avoyelles Parish
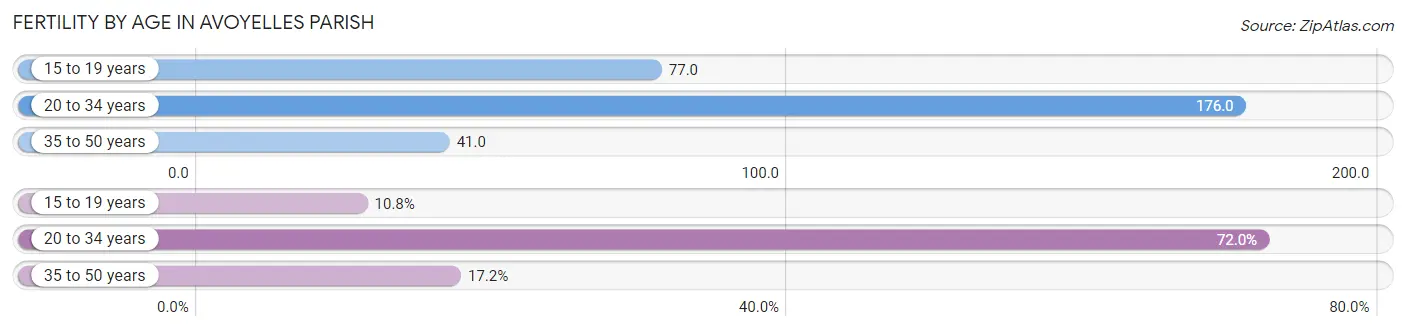
Fertility by Age in Avoyelles Parish
Average fertility rate in Avoyelles Parish is 103.0 births per 1,000 women. Women in the age bracket of 20 to 34 years have the highest fertility rate with 176.0 births per 1,000 women. Women in the age bracket of 20 to 34 years acount for 72.0% of all women with births.
| Age Bracket | Women with Births | Births / 1,000 Women |
| 15 to 19 years | 94 (10.8%) | 77.0 |
| 20 to 34 years | 625 (72.0%) | 176.0 |
| 35 to 50 years | 149 (17.2%) | 41.0 |
| Total | 868 (100.0%) | 103.0 |
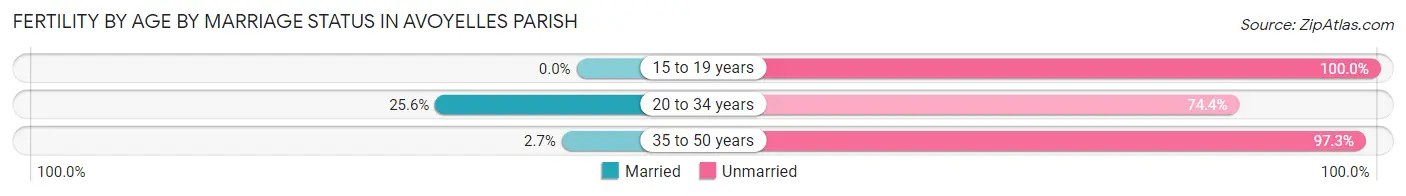
Fertility by Age by Marriage Status in Avoyelles Parish
18.9% of women with births (868) in Avoyelles Parish are married. The highest percentage of unmarried women with births falls into 15 to 19 years age bracket with 100.0% of them unmarried at the time of birth, while the lowest percentage of unmarried women with births belong to 20 to 34 years age bracket with 74.4% of them unmarried.
| Age Bracket | Married | Unmarried |
| 15 to 19 years | 0 (0.0%) | 94 (100.0%) |
| 20 to 34 years | 160 (25.6%) | 465 (74.4%) |
| 35 to 50 years | 4 (2.7%) | 145 (97.3%) |
| Total | 164 (18.9%) | 704 (81.1%) |
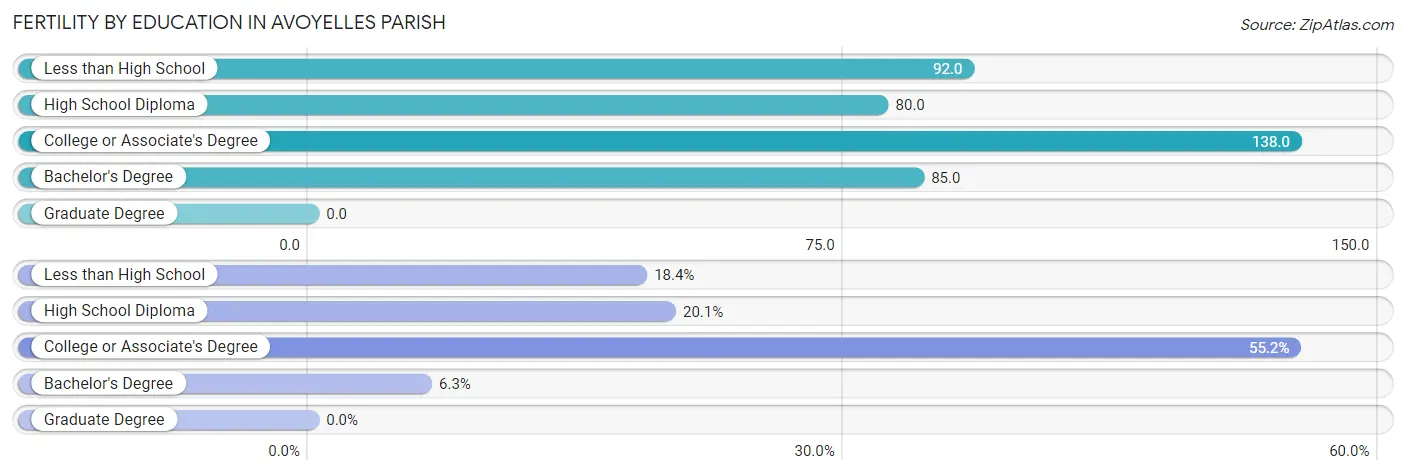
Fertility by Education in Avoyelles Parish
| Educational Attainment | Women with Births | Births / 1,000 Women |
| Less than High School | 160 (18.4%) | 92.0 |
| High School Diploma | 174 (20.1%) | 80.0 |
| College or Associate's Degree | 479 (55.2%) | 138.0 |
| Bachelor's Degree | 55 (6.3%) | 85.0 |
| Graduate Degree | 0 (0.0%) | 0.0 |
| Total | 868 (100.0%) | 103.0 |
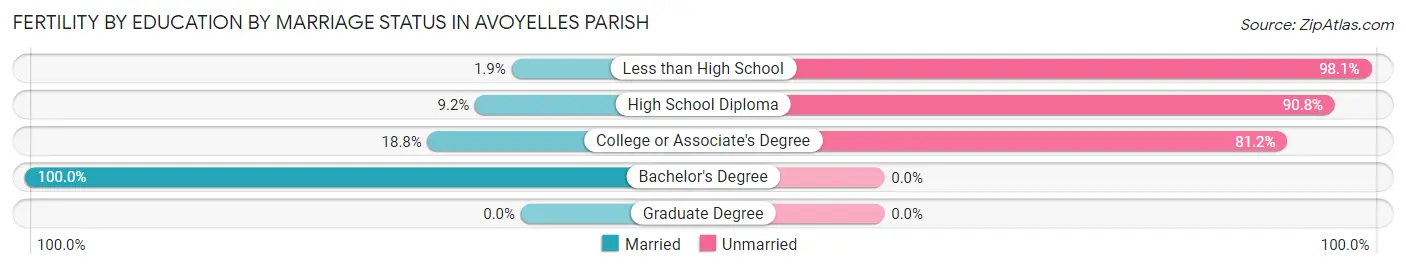
Fertility by Education by Marriage Status in Avoyelles Parish
81.1% of women with births in Avoyelles Parish are unmarried. Women with the educational attainment of bachelor's degree are most likely to be married with 100.0% of them married at childbirth, while women with the educational attainment of less than high school are least likely to be married with 98.1% of them unmarried at childbirth.
| Educational Attainment | Married | Unmarried |
| Less than High School | 3 (1.9%) | 157 (98.1%) |
| High School Diploma | 16 (9.2%) | 158 (90.8%) |
| College or Associate's Degree | 90 (18.8%) | 389 (81.2%) |
| Bachelor's Degree | 55 (100.0%) | 0 (0.0%) |
| Graduate Degree | 0 (0.0%) | 0 (0.0%) |
| Total | 164 (18.9%) | 704 (81.1%) |
Income in Avoyelles Parish
Income Overview in Avoyelles Parish
Per Capita Income in Avoyelles Parish is $23,597, while median incomes of families and households are $48,982 and $38,696 respectively.
| Characteristic | Number | Measure |
| Per Capita Income | 39,529 | $23,597 |
| Median Family Income | 9,099 | $48,982 |
| Mean Family Income | 9,099 | $67,737 |
| Median Household Income | 14,600 | $38,696 |
| Mean Household Income | 14,600 | $59,355 |
| Income Deficit | 9,099 | $12,400 |
| Wage / Income Gap (%) | 39,529 | 33.30% |
| Wage / Income Gap ($) | 39,529 | 66.70¢ per $1 |
| Gini / Inequality Index | 39,529 | 0.51 |
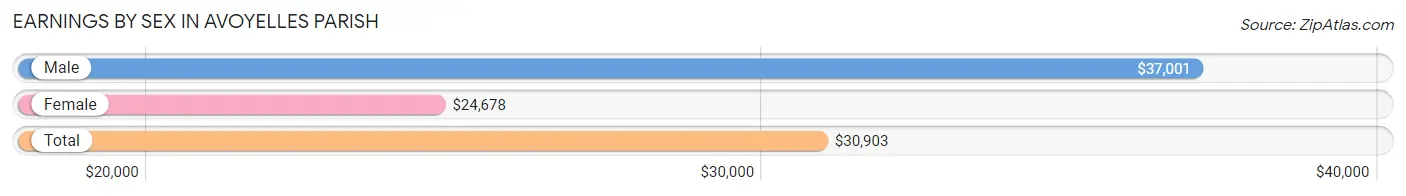
Earnings by Sex in Avoyelles Parish
Average Earnings in Avoyelles Parish are $30,903, $37,001 for men and $24,678 for women, a difference of 33.3%.
| Sex | Number | Average Earnings |
| Male | 8,544 (52.2%) | $37,001 |
| Female | 7,835 (47.8%) | $24,678 |
| Total | 16,379 (100.0%) | $30,903 |
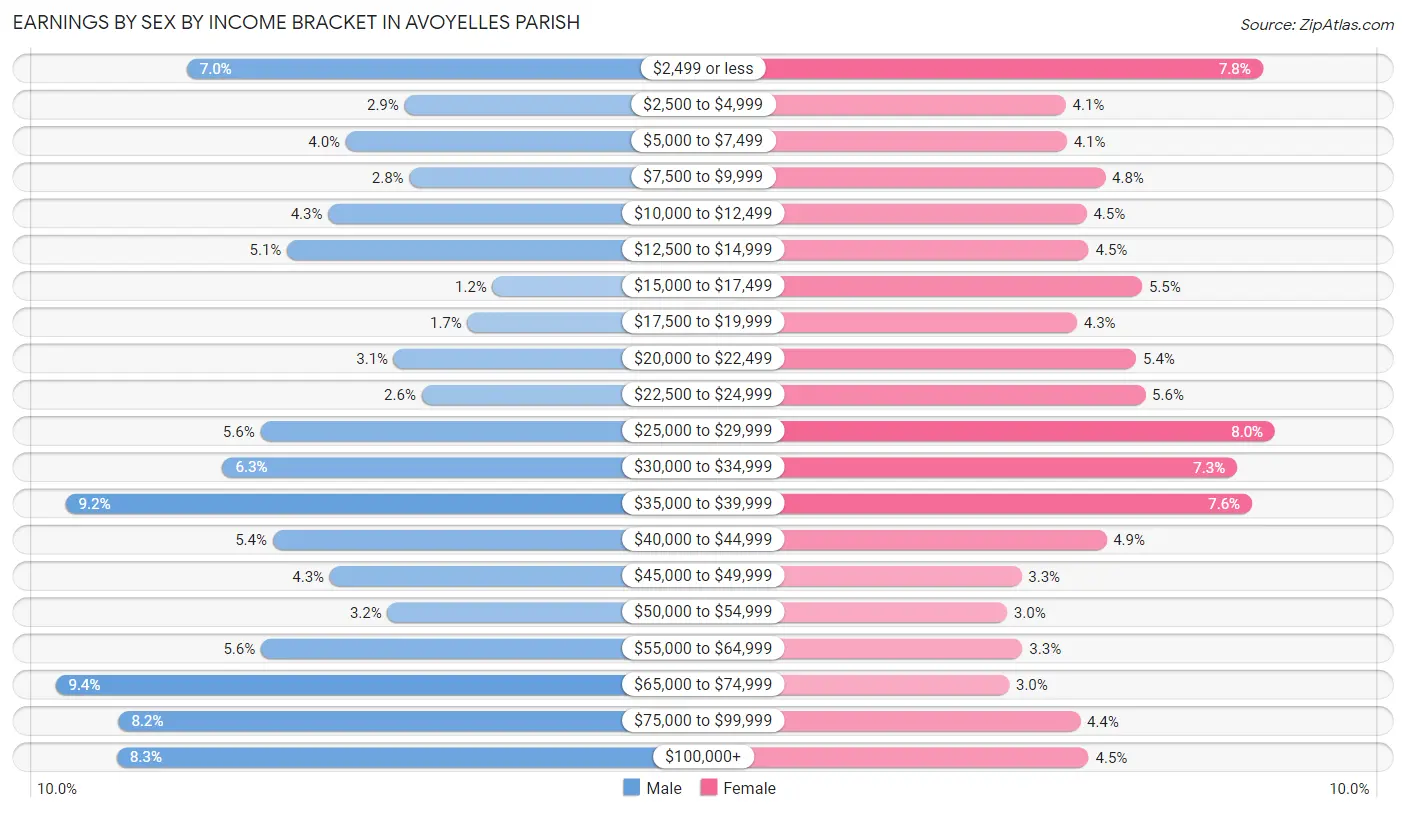
Earnings by Sex by Income Bracket in Avoyelles Parish
The most common earnings brackets in Avoyelles Parish are $65,000 to $74,999 for men (805 | 9.4%) and $25,000 to $29,999 for women (628 | 8.0%).
| Income | Male | Female |
| $2,499 or less | 595 (7.0%) | 610 (7.8%) |
| $2,500 to $4,999 | 246 (2.9%) | 321 (4.1%) |
| $5,000 to $7,499 | 340 (4.0%) | 323 (4.1%) |
| $7,500 to $9,999 | 238 (2.8%) | 379 (4.8%) |
| $10,000 to $12,499 | 368 (4.3%) | 352 (4.5%) |
| $12,500 to $14,999 | 434 (5.1%) | 355 (4.5%) |
| $15,000 to $17,499 | 105 (1.2%) | 433 (5.5%) |
| $17,500 to $19,999 | 145 (1.7%) | 338 (4.3%) |
| $20,000 to $22,499 | 263 (3.1%) | 425 (5.4%) |
| $22,500 to $24,999 | 219 (2.6%) | 438 (5.6%) |
| $25,000 to $29,999 | 477 (5.6%) | 628 (8.0%) |
| $30,000 to $34,999 | 537 (6.3%) | 573 (7.3%) |
| $35,000 to $39,999 | 789 (9.2%) | 595 (7.6%) |
| $40,000 to $44,999 | 457 (5.3%) | 381 (4.9%) |
| $45,000 to $49,999 | 366 (4.3%) | 256 (3.3%) |
| $50,000 to $54,999 | 273 (3.2%) | 235 (3.0%) |
| $55,000 to $64,999 | 476 (5.6%) | 258 (3.3%) |
| $65,000 to $74,999 | 805 (9.4%) | 238 (3.0%) |
| $75,000 to $99,999 | 704 (8.2%) | 342 (4.4%) |
| $100,000+ | 707 (8.3%) | 355 (4.5%) |
| Total | 8,544 (100.0%) | 7,835 (100.0%) |
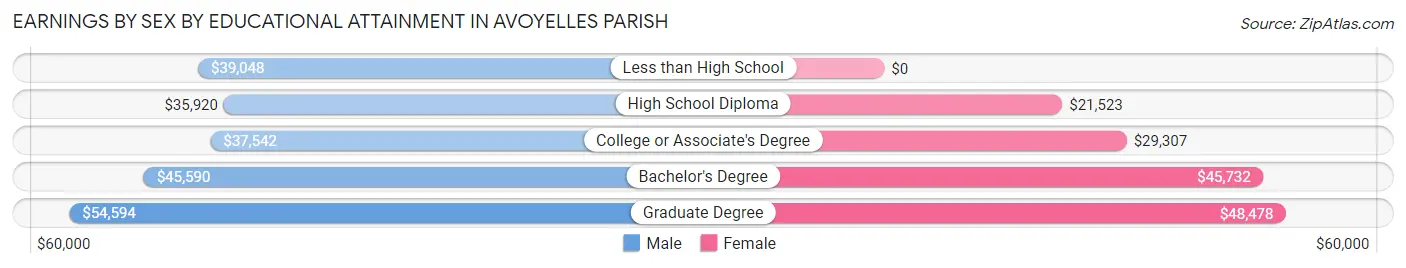
Earnings by Sex by Educational Attainment in Avoyelles Parish
Average earnings in Avoyelles Parish are $38,529 for men and $27,403 for women, a difference of 28.9%. Men with an educational attainment of graduate degree enjoy the highest average annual earnings of $54,594, while those with high school diploma education earn the least with $35,920. Women with an educational attainment of graduate degree earn the most with the average annual earnings of $48,478, while those with high school diploma education have the smallest earnings of $21,523.
| Educational Attainment | Male Income | Female Income |
| Less than High School | $39,048 | $0 |
| High School Diploma | $35,920 | $21,523 |
| College or Associate's Degree | $37,542 | $29,307 |
| Bachelor's Degree | $45,590 | $45,732 |
| Graduate Degree | $54,594 | $48,478 |
| Total | $38,529 | $27,403 |
Family Income in Avoyelles Parish
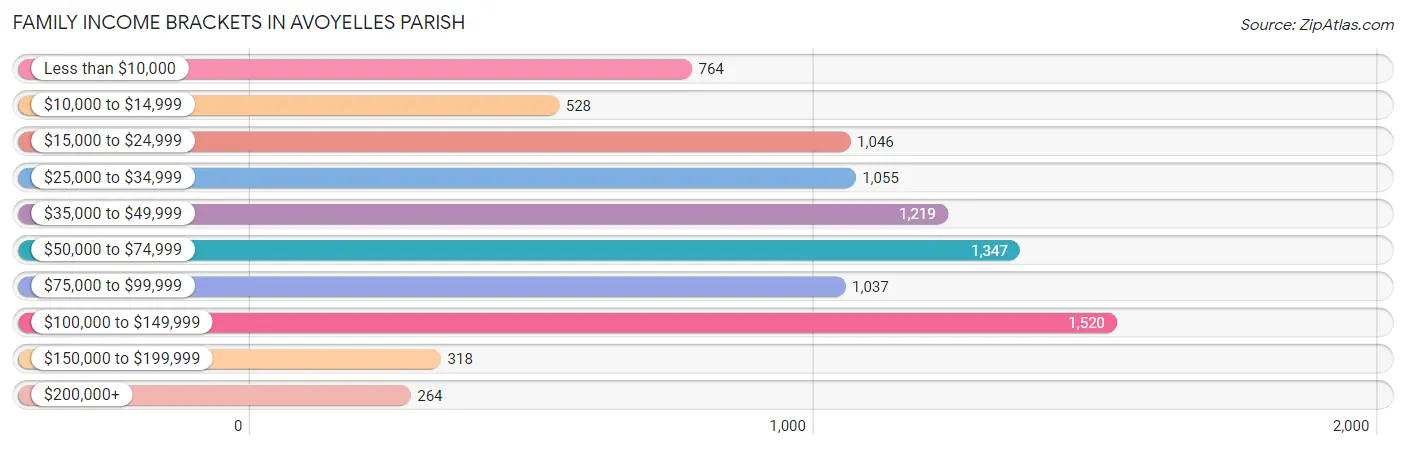
Family Income Brackets in Avoyelles Parish
According to the Avoyelles Parish family income data, there are 1,520 families falling into the $100,000 to $149,999 income range, which is the most common income bracket and makes up 16.7% of all families. Conversely, the $200,000+ income bracket is the least frequent group with only 264 families (2.9%) belonging to this category.
| Income Bracket | # Families | % Families |
| Less than $10,000 | 764 | 8.4% |
| $10,000 to $14,999 | 528 | 5.8% |
| $15,000 to $24,999 | 1,046 | 11.5% |
| $25,000 to $34,999 | 1,055 | 11.6% |
| $35,000 to $49,999 | 1,219 | 13.4% |
| $50,000 to $74,999 | 1,347 | 14.8% |
| $75,000 to $99,999 | 1,037 | 11.4% |
| $100,000 to $149,999 | 1,520 | 16.7% |
| $150,000 to $199,999 | 318 | 3.5% |
| $200,000+ | 264 | 2.9% |
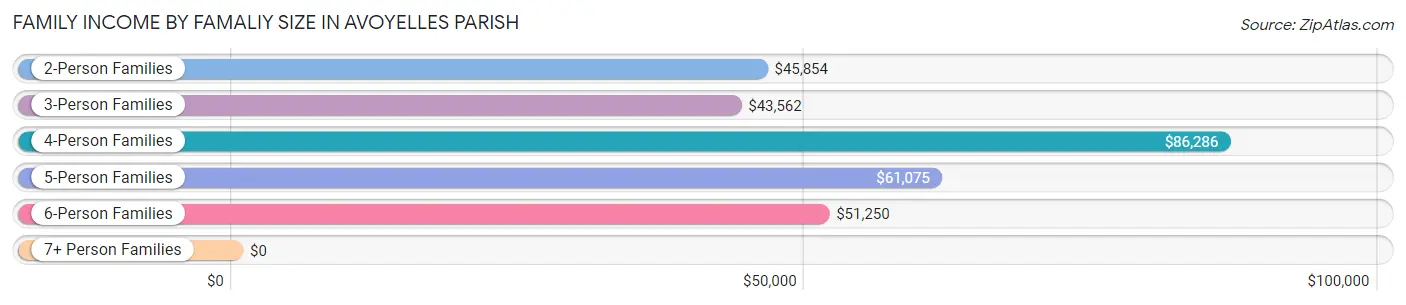
Family Income by Famaliy Size in Avoyelles Parish
4-person families (1,297 | 14.2%) account for the highest median family income in Avoyelles Parish with $86,286 per family, while 2-person families (4,708 | 51.7%) have the highest median income of $22,927 per family member.
| Income Bracket | # Families | Median Income |
| 2-Person Families | 4,708 (51.7%) | $45,854 |
| 3-Person Families | 2,307 (25.4%) | $43,562 |
| 4-Person Families | 1,297 (14.2%) | $86,286 |
| 5-Person Families | 517 (5.7%) | $61,075 |
| 6-Person Families | 148 (1.6%) | $51,250 |
| 7+ Person Families | 122 (1.3%) | $0 |
| Total | 9,099 (100.0%) | $48,982 |
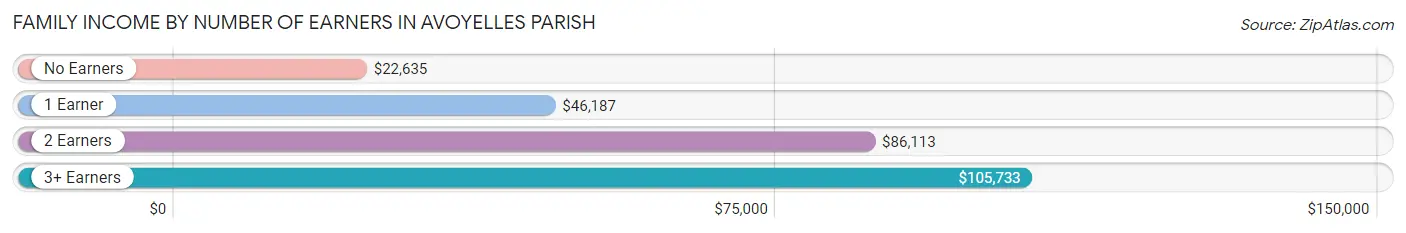
Family Income by Number of Earners in Avoyelles Parish
The median family income in Avoyelles Parish is $48,982, with families comprising 3+ earners (326) having the highest median family income of $105,733, while families with no earners (1,946) have the lowest median family income of $22,635, accounting for 3.6% and 21.4% of families, respectively.
| Number of Earners | # Families | Median Income |
| No Earners | 1,946 (21.4%) | $22,635 |
| 1 Earner | 3,752 (41.2%) | $46,187 |
| 2 Earners | 3,075 (33.8%) | $86,113 |
| 3+ Earners | 326 (3.6%) | $105,733 |
| Total | 9,099 (100.0%) | $48,982 |
Household Income in Avoyelles Parish
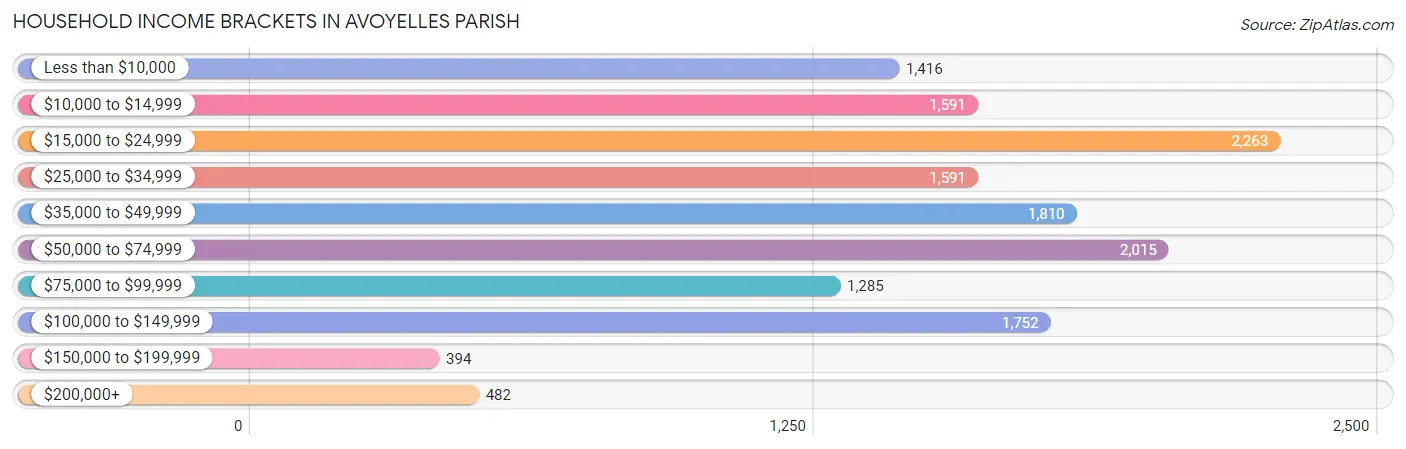
Household Income Brackets in Avoyelles Parish
With 2,263 households falling in the category, the $15,000 to $24,999 income range is the most frequent in Avoyelles Parish, accounting for 15.5% of all households. In contrast, only 394 households (2.7%) fall into the $150,000 to $199,999 income bracket, making it the least populous group.
| Income Bracket | # Households | % Households |
| Less than $10,000 | 1,416 | 9.7% |
| $10,000 to $14,999 | 1,591 | 10.9% |
| $15,000 to $24,999 | 2,263 | 15.5% |
| $25,000 to $34,999 | 1,591 | 10.9% |
| $35,000 to $49,999 | 1,810 | 12.4% |
| $50,000 to $74,999 | 2,015 | 13.8% |
| $75,000 to $99,999 | 1,285 | 8.8% |
| $100,000 to $149,999 | 1,752 | 12.0% |
| $150,000 to $199,999 | 394 | 2.7% |
| $200,000+ | 482 | 3.3% |
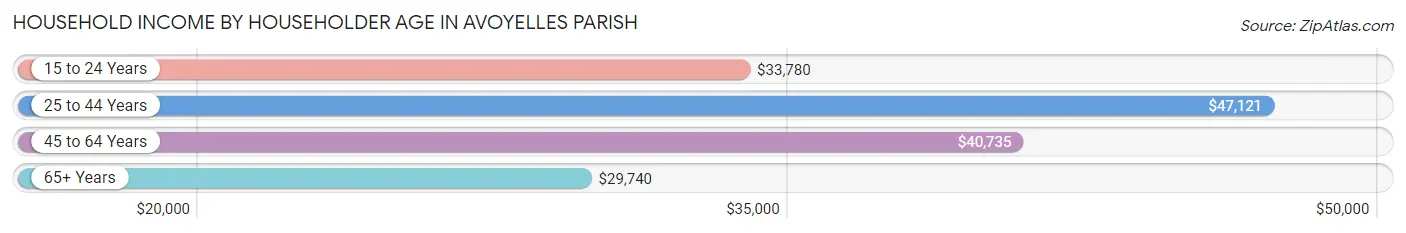
Household Income by Householder Age in Avoyelles Parish
The median household income in Avoyelles Parish is $38,696, with the highest median household income of $47,121 found in the 25 to 44 years age bracket for the primary householder. A total of 4,274 households (29.3%) fall into this category. Meanwhile, the 65+ years age bracket for the primary householder has the lowest median household income of $29,740, with 3,864 households (26.5%) in this group.
| Income Bracket | # Households | Median Income |
| 15 to 24 Years | 595 (4.1%) | $33,780 |
| 25 to 44 Years | 4,274 (29.3%) | $47,121 |
| 45 to 64 Years | 5,867 (40.2%) | $40,735 |
| 65+ Years | 3,864 (26.5%) | $29,740 |
| Total | 14,600 (100.0%) | $38,696 |
Poverty in Avoyelles Parish
Income Below Poverty by Sex and Age in Avoyelles Parish
With 24.2% poverty level for males and 31.3% for females among the residents of Avoyelles Parish, 15 year old males and 5 year old females are the most vulnerable to poverty, with 186 males (73.5%) and 227 females (82.9%) in their respective age groups living below the poverty level.
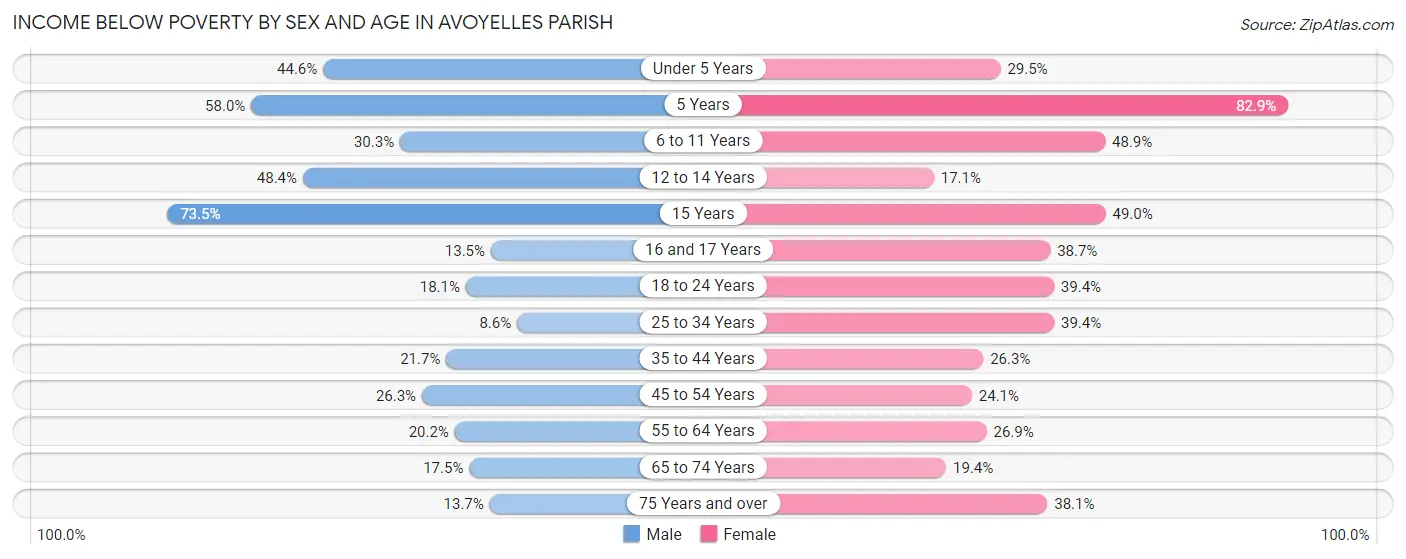
| Age Bracket | Male | Female |
| Under 5 Years | 589 (44.6%) | 359 (29.4%) |
| 5 Years | 153 (58.0%) | 227 (82.9%) |
| 6 to 11 Years | 467 (30.3%) | 540 (48.9%) |
| 12 to 14 Years | 410 (48.3%) | 185 (17.1%) |
| 15 Years | 186 (73.5%) | 93 (48.9%) |
| 16 and 17 Years | 74 (13.5%) | 229 (38.7%) |
| 18 to 24 Years | 289 (18.1%) | 602 (39.4%) |
| 25 to 34 Years | 161 (8.6%) | 944 (39.4%) |
| 35 to 44 Years | 439 (21.7%) | 630 (26.3%) |
| 45 to 54 Years | 529 (26.3%) | 552 (24.1%) |
| 55 to 64 Years | 437 (20.2%) | 691 (26.9%) |
| 65 to 74 Years | 314 (17.5%) | 392 (19.4%) |
| 75 Years and over | 147 (13.7%) | 521 (38.1%) |
| Total | 4,195 (24.2%) | 5,965 (31.3%) |
Income Above Poverty by Sex and Age in Avoyelles Parish
According to the poverty statistics in Avoyelles Parish, males aged 25 to 34 years and females aged 12 to 14 years are the age groups that are most secure financially, with 91.4% of males and 82.9% of females in these age groups living above the poverty line.
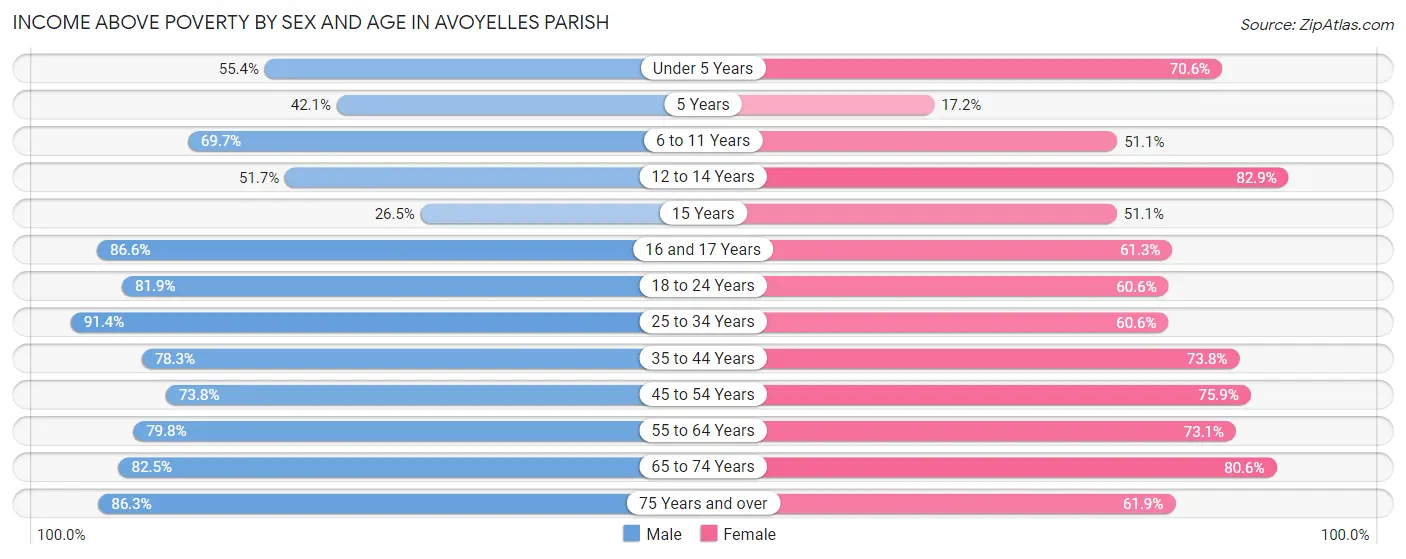
| Age Bracket | Male | Female |
| Under 5 Years | 732 (55.4%) | 860 (70.6%) |
| 5 Years | 111 (42.0%) | 47 (17.2%) |
| 6 to 11 Years | 1,073 (69.7%) | 565 (51.1%) |
| 12 to 14 Years | 438 (51.6%) | 898 (82.9%) |
| 15 Years | 67 (26.5%) | 97 (51.0%) |
| 16 and 17 Years | 476 (86.6%) | 363 (61.3%) |
| 18 to 24 Years | 1,307 (81.9%) | 927 (60.6%) |
| 25 to 34 Years | 1,713 (91.4%) | 1,452 (60.6%) |
| 35 to 44 Years | 1,580 (78.3%) | 1,770 (73.8%) |
| 45 to 54 Years | 1,486 (73.8%) | 1,735 (75.9%) |
| 55 to 64 Years | 1,730 (79.8%) | 1,882 (73.1%) |
| 65 to 74 Years | 1,483 (82.5%) | 1,633 (80.6%) |
| 75 Years and over | 927 (86.3%) | 845 (61.9%) |
| Total | 13,123 (75.8%) | 13,074 (68.7%) |
Income Below Poverty Among Married-Couple Families in Avoyelles Parish
The poverty statistics for married-couple families in Avoyelles Parish show that 10.7% or 596 of the total 5,575 families live below the poverty line. Families with 3 or 4 children have the highest poverty rate of 43.6%, comprising of 150 families. On the other hand, families with 5 or more children have the lowest poverty rate of 0.0%, which includes 0 families.
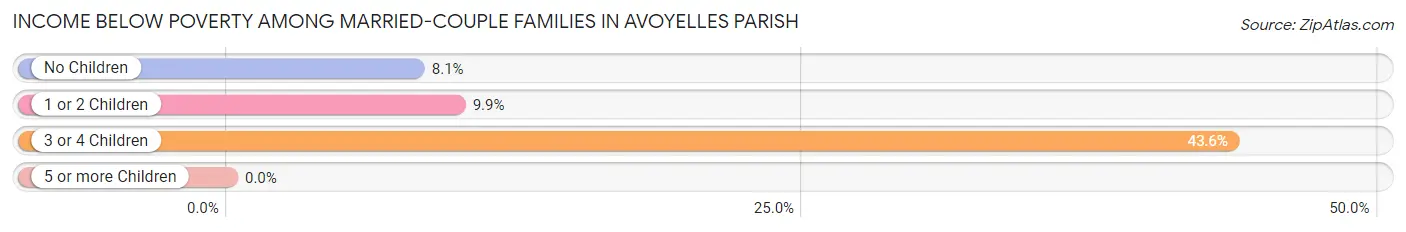
| Children | Above Poverty | Below Poverty |
| No Children | 3,503 (91.9%) | 310 (8.1%) |
| 1 or 2 Children | 1,236 (90.1%) | 136 (9.9%) |
| 3 or 4 Children | 194 (56.4%) | 150 (43.6%) |
| 5 or more Children | 46 (100.0%) | 0 (0.0%) |
| Total | 4,979 (89.3%) | 596 (10.7%) |
Income Below Poverty Among Single-Parent Households in Avoyelles Parish
According to the poverty data in Avoyelles Parish, 10.3% or 77 single-father households and 47.5% or 1,320 single-mother households are living below the poverty line. Among single-father households, those with 5 or more children have the highest poverty rate, with 5 households (100.0%) experiencing poverty. Likewise, among single-mother households, those with 5 or more children have the highest poverty rate, with 25 households (100.0%) falling below the poverty line.
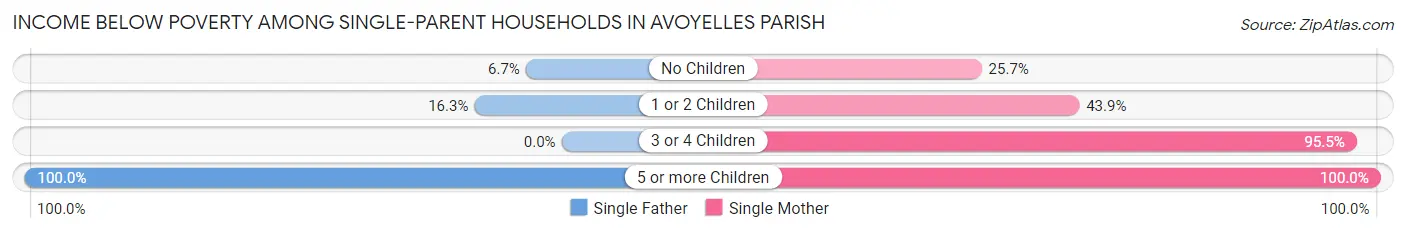
| Children | Single Father | Single Mother |
| No Children | 26 (6.7%) | 156 (25.7%) |
| 1 or 2 Children | 46 (16.3%) | 775 (43.9%) |
| 3 or 4 Children | 0 (0.0%) | 364 (95.5%) |
| 5 or more Children | 5 (100.0%) | 25 (100.0%) |
| Total | 77 (10.3%) | 1,320 (47.5%) |
Income Below Poverty Among Married-Couple vs Single-Parent Households in Avoyelles Parish
The poverty data for Avoyelles Parish shows that 596 of the married-couple family households (10.7%) and 1,397 of the single-parent households (39.6%) are living below the poverty level. Within the married-couple family households, those with 3 or 4 children have the highest poverty rate, with 150 households (43.6%) falling below the poverty line. Among the single-parent households, those with 5 or more children have the highest poverty rate, with 30 household (100.0%) living below poverty.
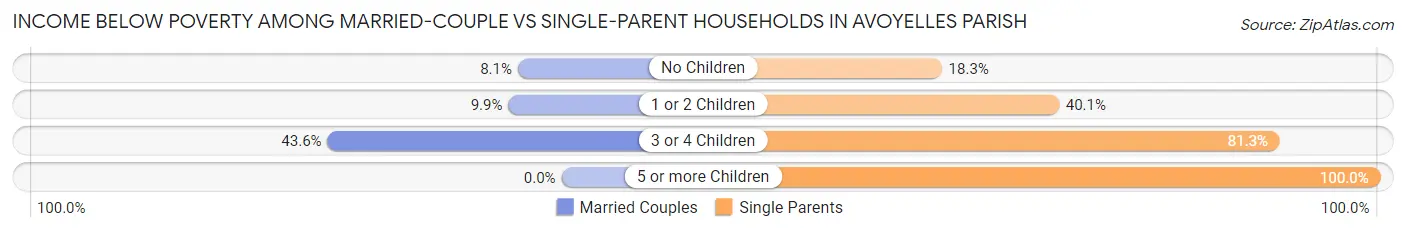
| Children | Married-Couple Families | Single-Parent Households |
| No Children | 310 (8.1%) | 182 (18.2%) |
| 1 or 2 Children | 136 (9.9%) | 821 (40.1%) |
| 3 or 4 Children | 150 (43.6%) | 364 (81.2%) |
| 5 or more Children | 0 (0.0%) | 30 (100.0%) |
| Total | 596 (10.7%) | 1,397 (39.6%) |
Employment Characteristics in Avoyelles Parish
Employment by Class of Employer in Avoyelles Parish
Among the 14,535 employed individuals in Avoyelles Parish, private company employees (9,058 | 62.3%), local government employees (1,320 | 9.1%), and state government employees (1,182 | 8.1%) make up the most common classes of employment.
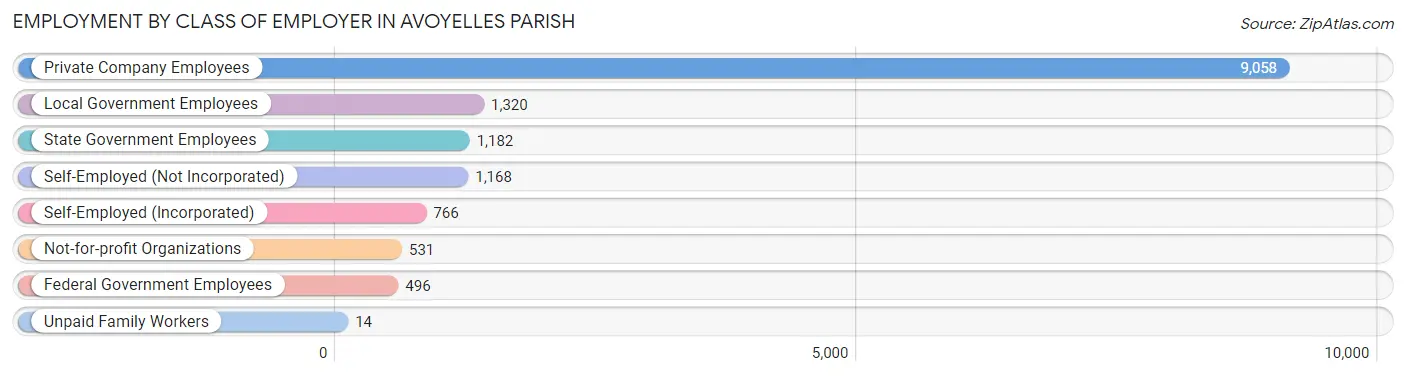
| Employer Class | # Employees | % Employees |
| Private Company Employees | 9,058 | 62.3% |
| Self-Employed (Incorporated) | 766 | 5.3% |
| Self-Employed (Not Incorporated) | 1,168 | 8.0% |
| Not-for-profit Organizations | 531 | 3.6% |
| Local Government Employees | 1,320 | 9.1% |
| State Government Employees | 1,182 | 8.1% |
| Federal Government Employees | 496 | 3.4% |
| Unpaid Family Workers | 14 | 0.1% |
| Total | 14,535 | 100.0% |
Employment Status by Age in Avoyelles Parish
According to the labor force statistics for Avoyelles Parish, out of the total population over 16 years of age (31,323), 51.6% or 16,163 individuals are in the labor force, with 7.5% or 1,212 of them unemployed. The age group with the highest labor force participation rate is 25 to 29 years, with 75.2% or 1,949 individuals in the labor force. Within the labor force, the 16 to 19 years age range has the highest percentage of unemployed individuals, with 25.6% or 207 of them being unemployed.
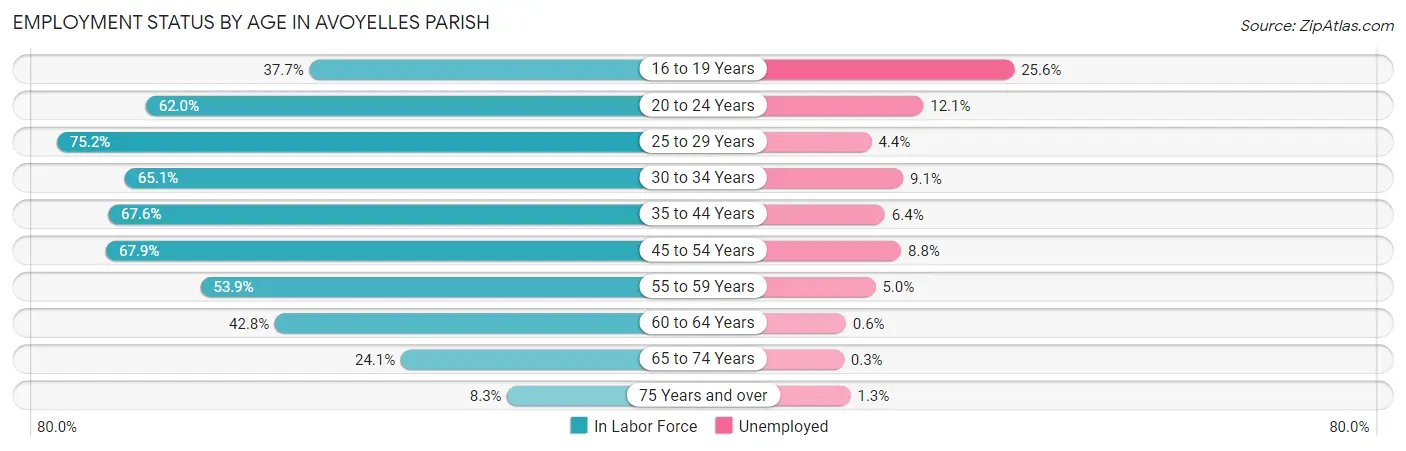
| Age Bracket | In Labor Force | Unemployed |
| 16 to 19 Years | 810 (37.7%) | 207 (25.6%) |
| 20 to 24 Years | 1,414 (62.0%) | 171 (12.1%) |
| 25 to 29 Years | 1,949 (75.2%) | 86 (4.4%) |
| 30 to 34 Years | 1,681 (65.1%) | 153 (9.1%) |
| 35 to 44 Years | 3,404 (67.6%) | 218 (6.4%) |
| 45 to 54 Years | 3,170 (67.9%) | 279 (8.8%) |
| 55 to 59 Years | 1,530 (53.9%) | 76 (5.0%) |
| 60 to 64 Years | 1,005 (42.8%) | 6 (0.6%) |
| 65 to 74 Years | 952 (24.1%) | 3 (0.3%) |
| 75 Years and over | 239 (8.3%) | 3 (1.3%) |
| Total | 16,163 (51.6%) | 1,212 (7.5%) |
Employment Status by Educational Attainment in Avoyelles Parish
According to labor force statistics for Avoyelles Parish, 63.5% of individuals (12,741) out of the total population between 25 and 64 years of age (20,065) are in the labor force, with 6.4% or 815 of them being unemployed. The group with the highest labor force participation rate are those with the educational attainment of bachelor's degree or higher, with 79.1% or 1,750 individuals in the labor force. Within the labor force, individuals with less than high school education have the highest percentage of unemployment, with 9.9% or 182 of them being unemployed.
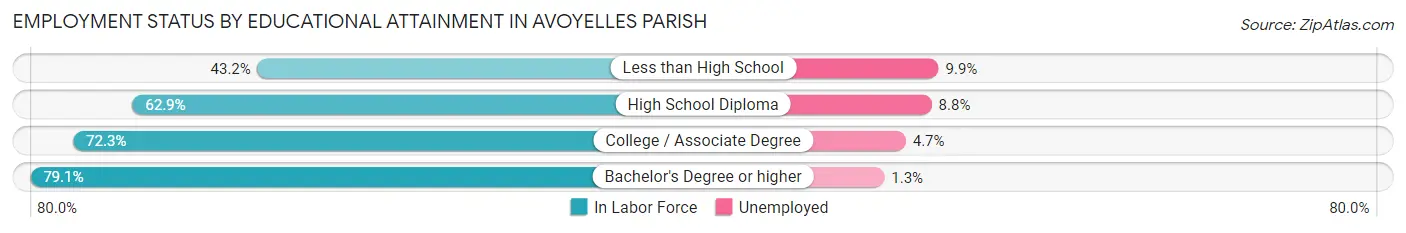
| Educational Attainment | In Labor Force | Unemployed |
| Less than High School | 1,842 (43.2%) | 422 (9.9%) |
| High School Diploma | 4,509 (62.9%) | 631 (8.8%) |
| College / Associate Degree | 4,641 (72.3%) | 302 (4.7%) |
| Bachelor's Degree or higher | 1,750 (79.1%) | 29 (1.3%) |
| Total | 12,741 (63.5%) | 1,284 (6.4%) |
Employment Occupations by Sex in Avoyelles Parish
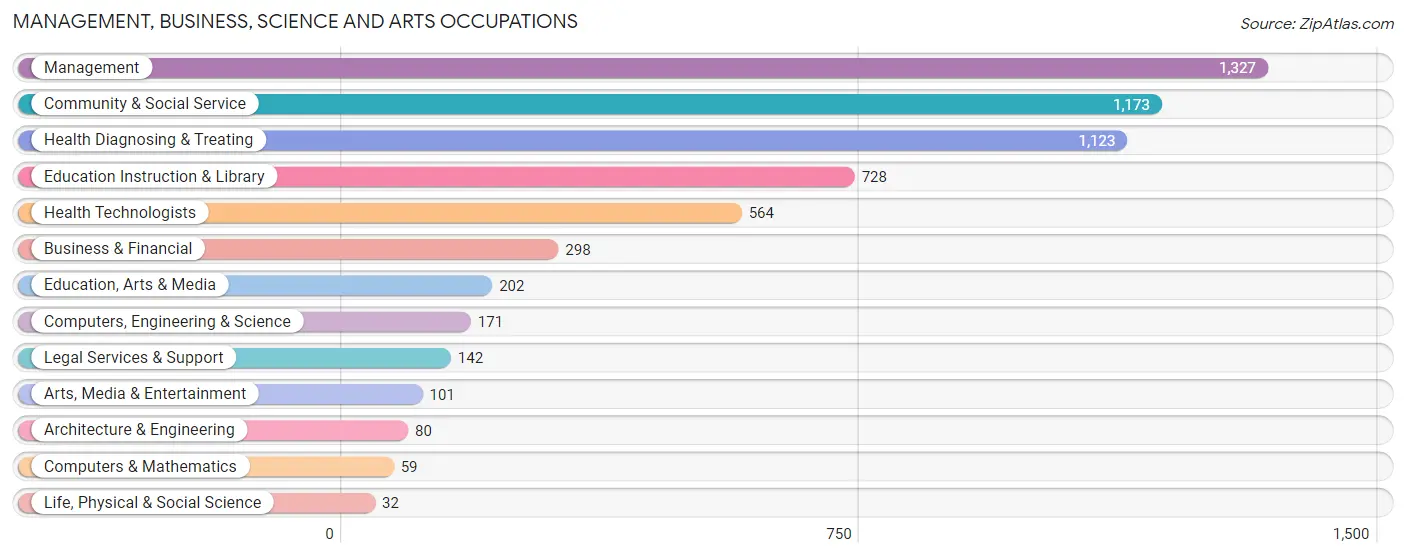
Management, Business, Science and Arts Occupations
The most common Management, Business, Science and Arts occupations in Avoyelles Parish are Management (1,327 | 8.9%), Community & Social Service (1,173 | 7.9%), Health Diagnosing & Treating (1,123 | 7.6%), Education Instruction & Library (728 | 4.9%), and Health Technologists (564 | 3.8%).
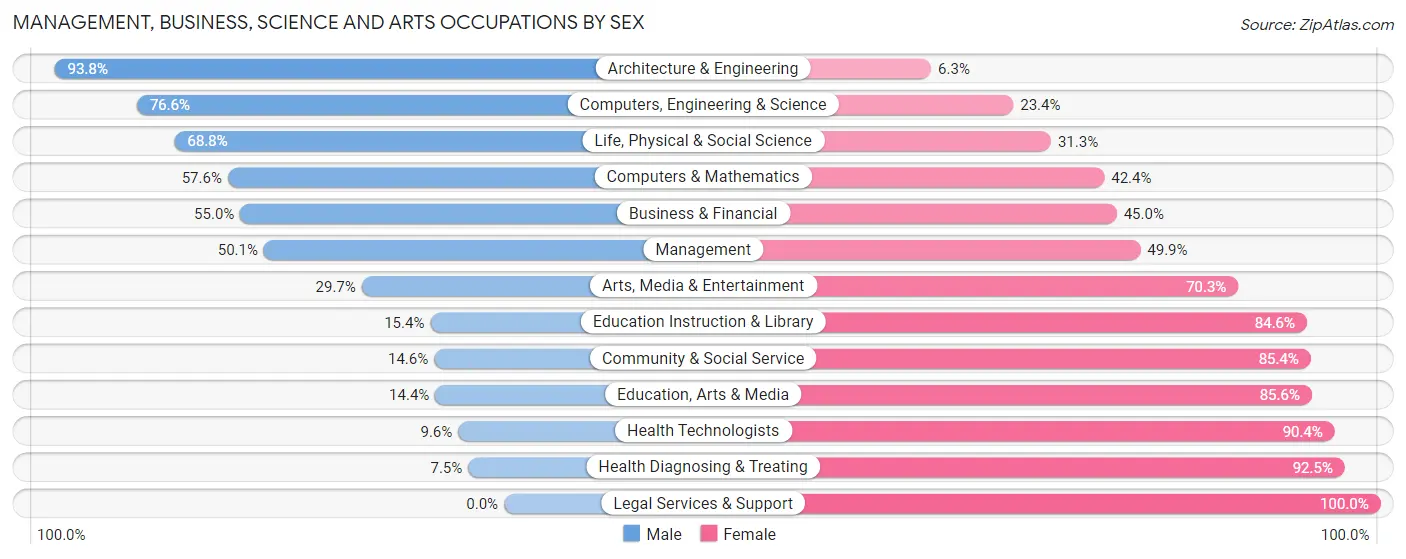
Management, Business, Science and Arts Occupations by Sex
Within the Management, Business, Science and Arts occupations in Avoyelles Parish, the most male-oriented occupations are Architecture & Engineering (93.8%), Computers, Engineering & Science (76.6%), and Life, Physical & Social Science (68.8%), while the most female-oriented occupations are Legal Services & Support (100.0%), Health Diagnosing & Treating (92.5%), and Health Technologists (90.4%).
| Occupation | Male | Female |
| Management | 665 (50.1%) | 662 (49.9%) |
| Business & Financial | 164 (55.0%) | 134 (45.0%) |
| Computers, Engineering & Science | 131 (76.6%) | 40 (23.4%) |
| Computers & Mathematics | 34 (57.6%) | 25 (42.4%) |
| Architecture & Engineering | 75 (93.8%) | 5 (6.2%) |
| Life, Physical & Social Science | 22 (68.8%) | 10 (31.2%) |
| Community & Social Service | 171 (14.6%) | 1,002 (85.4%) |
| Education, Arts & Media | 29 (14.4%) | 173 (85.6%) |
| Legal Services & Support | 0 (0.0%) | 142 (100.0%) |
| Education Instruction & Library | 112 (15.4%) | 616 (84.6%) |
| Arts, Media & Entertainment | 30 (29.7%) | 71 (70.3%) |
| Health Diagnosing & Treating | 84 (7.5%) | 1,039 (92.5%) |
| Health Technologists | 54 (9.6%) | 510 (90.4%) |
| Total (Category) | 1,215 (29.7%) | 2,877 (70.3%) |
| Total (Overall) | 7,614 (51.2%) | 7,247 (48.8%) |
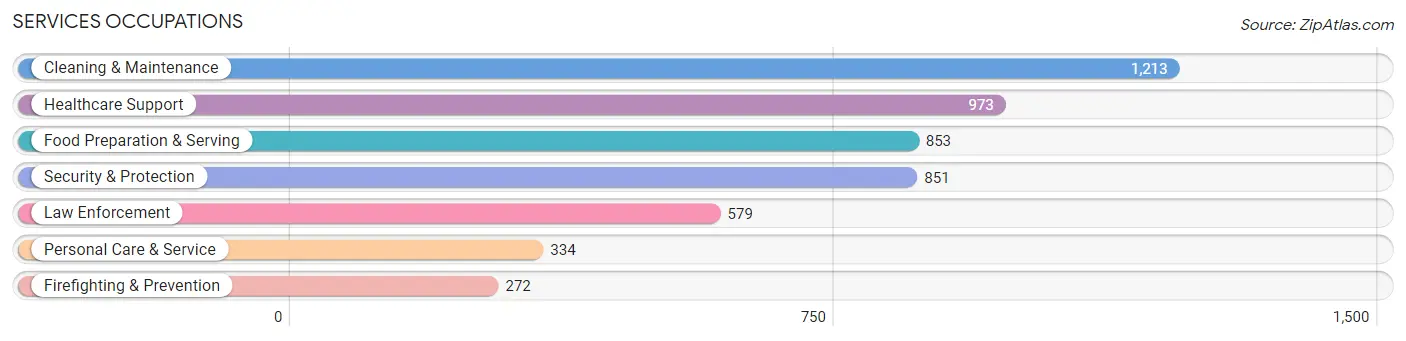
Services Occupations
The most common Services occupations in Avoyelles Parish are Cleaning & Maintenance (1,213 | 8.2%), Healthcare Support (973 | 6.6%), Food Preparation & Serving (853 | 5.7%), Security & Protection (851 | 5.7%), and Law Enforcement (579 | 3.9%).
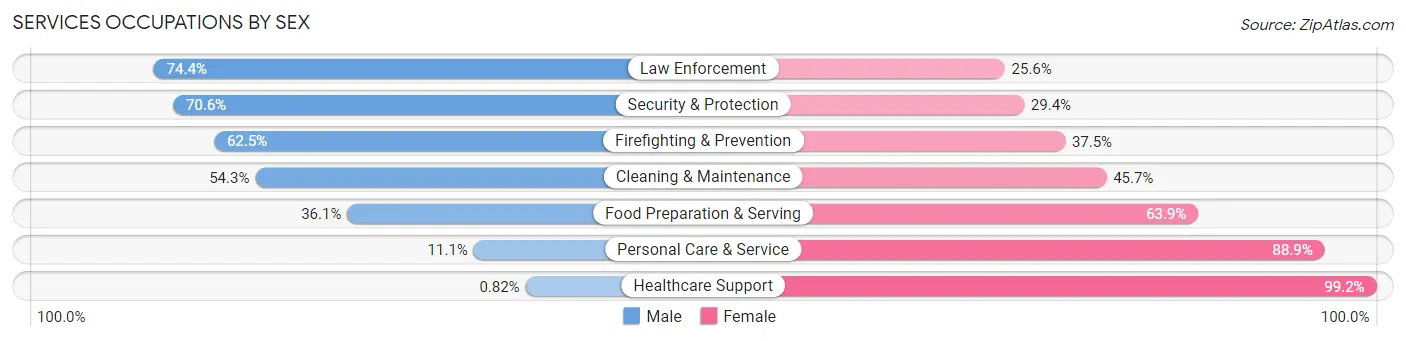
Services Occupations by Sex
Within the Services occupations in Avoyelles Parish, the most male-oriented occupations are Law Enforcement (74.4%), Security & Protection (70.6%), and Firefighting & Prevention (62.5%), while the most female-oriented occupations are Healthcare Support (99.2%), Personal Care & Service (88.9%), and Food Preparation & Serving (63.9%).
| Occupation | Male | Female |
| Healthcare Support | 8 (0.8%) | 965 (99.2%) |
| Security & Protection | 601 (70.6%) | 250 (29.4%) |
| Firefighting & Prevention | 170 (62.5%) | 102 (37.5%) |
| Law Enforcement | 431 (74.4%) | 148 (25.6%) |
| Food Preparation & Serving | 308 (36.1%) | 545 (63.9%) |
| Cleaning & Maintenance | 659 (54.3%) | 554 (45.7%) |
| Personal Care & Service | 37 (11.1%) | 297 (88.9%) |
| Total (Category) | 1,613 (38.2%) | 2,611 (61.8%) |
| Total (Overall) | 7,614 (51.2%) | 7,247 (48.8%) |
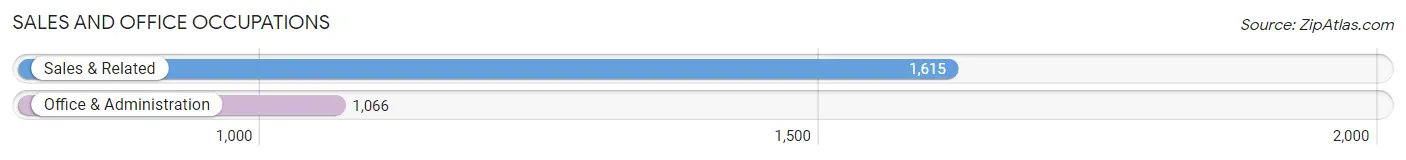
Sales and Office Occupations
The most common Sales and Office occupations in Avoyelles Parish are Sales & Related (1,615 | 10.9%), and Office & Administration (1,066 | 7.2%).
Sales and Office Occupations by Sex
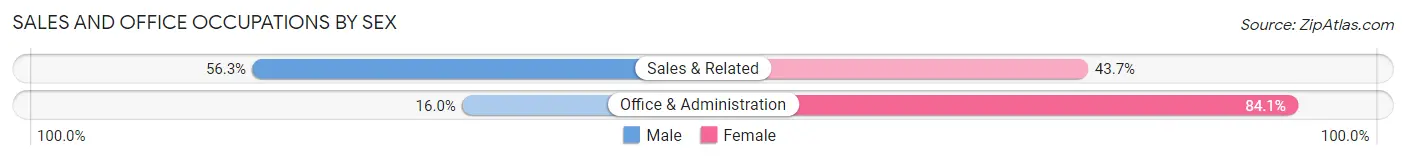
| Occupation | Male | Female |
| Sales & Related | 909 (56.3%) | 706 (43.7%) |
| Office & Administration | 170 (16.0%) | 896 (84.1%) |
| Total (Category) | 1,079 (40.3%) | 1,602 (59.8%) |
| Total (Overall) | 7,614 (51.2%) | 7,247 (48.8%) |
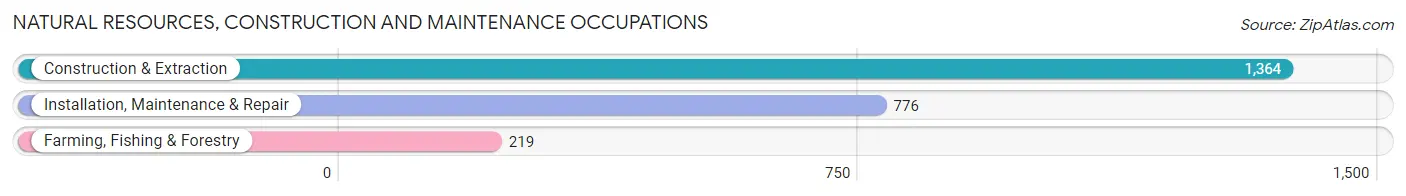
Natural Resources, Construction and Maintenance Occupations
The most common Natural Resources, Construction and Maintenance occupations in Avoyelles Parish are Construction & Extraction (1,364 | 9.2%), Installation, Maintenance & Repair (776 | 5.2%), and Farming, Fishing & Forestry (219 | 1.5%).
Natural Resources, Construction and Maintenance Occupations by Sex
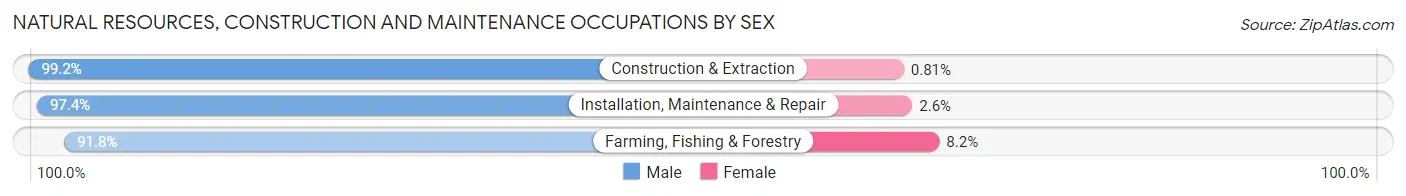
| Occupation | Male | Female |
| Farming, Fishing & Forestry | 201 (91.8%) | 18 (8.2%) |
| Construction & Extraction | 1,353 (99.2%) | 11 (0.8%) |
| Installation, Maintenance & Repair | 756 (97.4%) | 20 (2.6%) |
| Total (Category) | 2,310 (97.9%) | 49 (2.1%) |
| Total (Overall) | 7,614 (51.2%) | 7,247 (48.8%) |
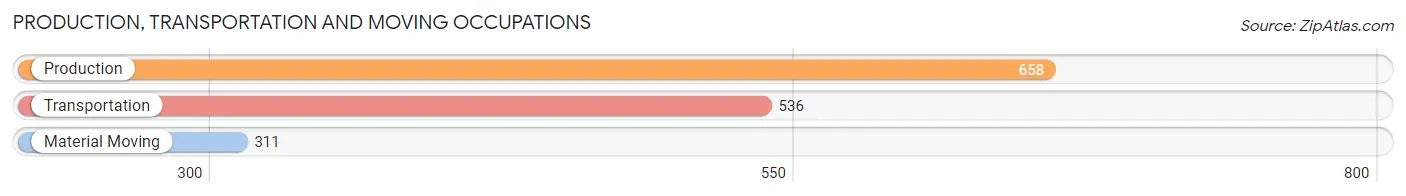
Production, Transportation and Moving Occupations
The most common Production, Transportation and Moving occupations in Avoyelles Parish are Production (658 | 4.4%), Transportation (536 | 3.6%), and Material Moving (311 | 2.1%).
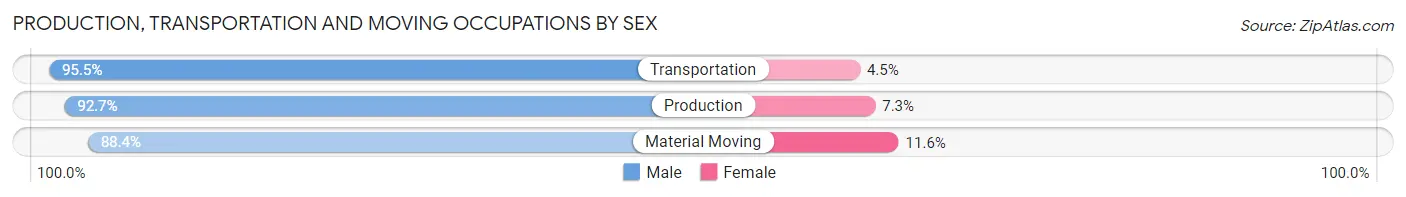
Production, Transportation and Moving Occupations by Sex
| Occupation | Male | Female |
| Production | 610 (92.7%) | 48 (7.3%) |
| Transportation | 512 (95.5%) | 24 (4.5%) |
| Material Moving | 275 (88.4%) | 36 (11.6%) |
| Total (Category) | 1,397 (92.8%) | 108 (7.2%) |
| Total (Overall) | 7,614 (51.2%) | 7,247 (48.8%) |
Employment Industries by Sex in Avoyelles Parish
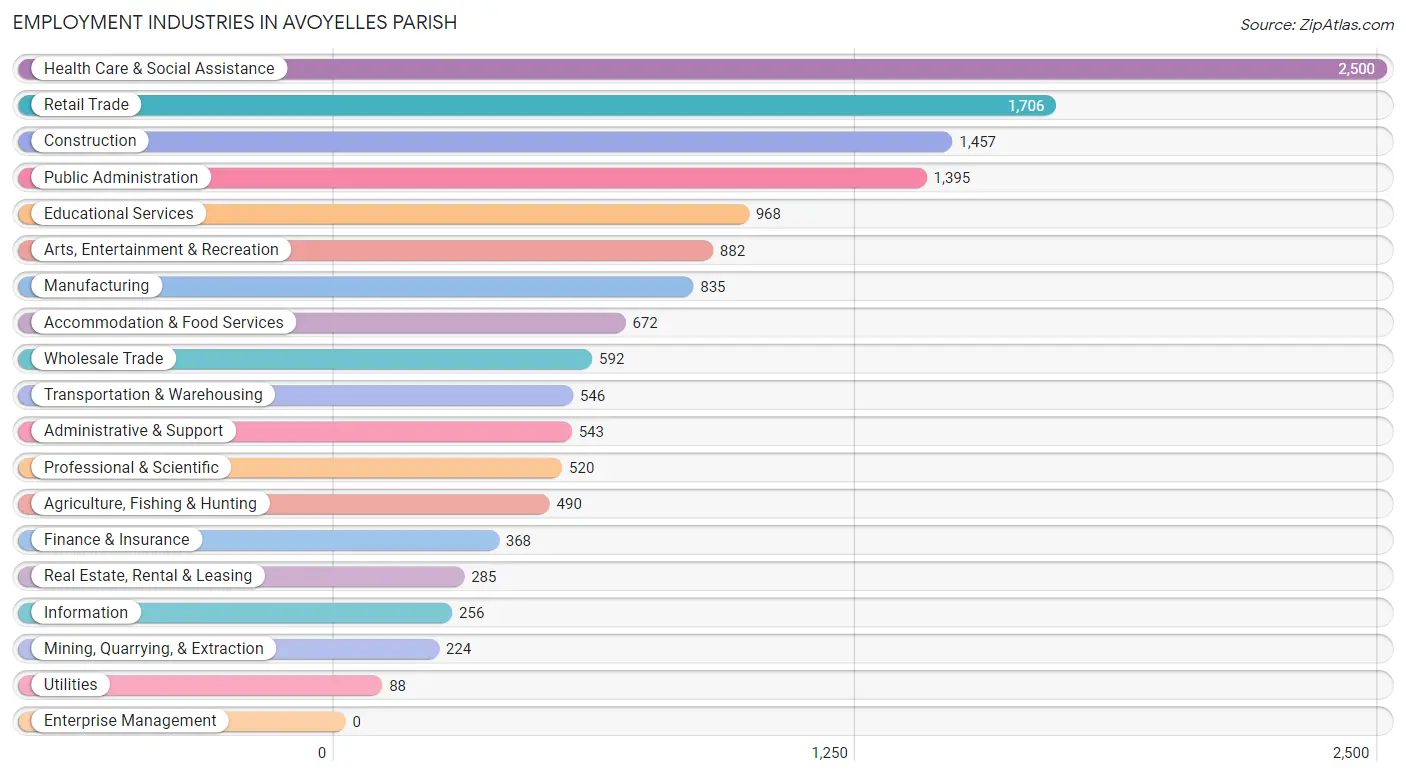
Employment Industries in Avoyelles Parish
The major employment industries in Avoyelles Parish include Health Care & Social Assistance (2,500 | 16.8%), Retail Trade (1,706 | 11.5%), Construction (1,457 | 9.8%), Public Administration (1,395 | 9.4%), and Educational Services (968 | 6.5%).
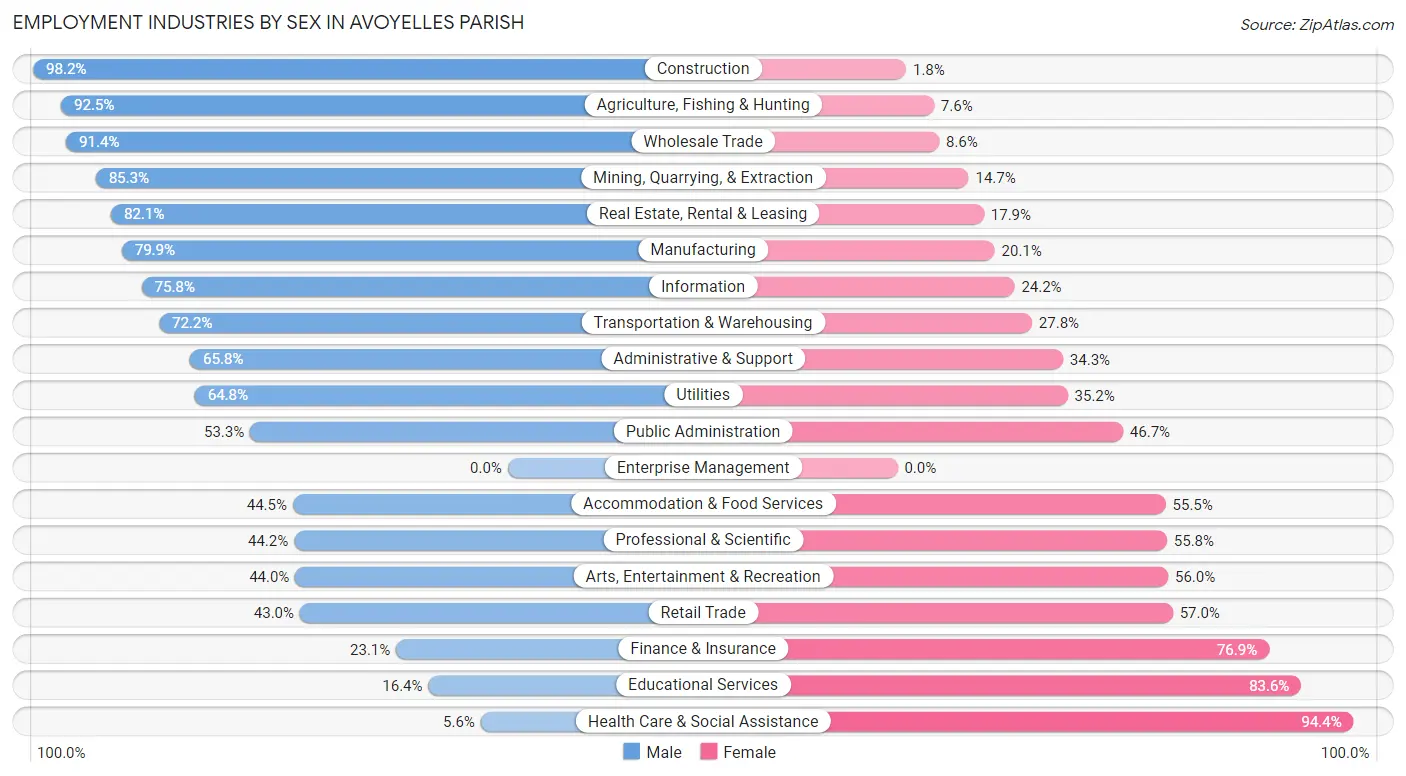
Employment Industries by Sex in Avoyelles Parish
The Avoyelles Parish industries that see more men than women are Construction (98.2%), Agriculture, Fishing & Hunting (92.4%), and Wholesale Trade (91.4%), whereas the industries that tend to have a higher number of women are Health Care & Social Assistance (94.4%), Educational Services (83.6%), and Finance & Insurance (76.9%).
| Industry | Male | Female |
| Agriculture, Fishing & Hunting | 453 (92.4%) | 37 (7.5%) |
| Mining, Quarrying, & Extraction | 191 (85.3%) | 33 (14.7%) |
| Construction | 1,431 (98.2%) | 26 (1.8%) |
| Manufacturing | 667 (79.9%) | 168 (20.1%) |
| Wholesale Trade | 541 (91.4%) | 51 (8.6%) |
| Retail Trade | 734 (43.0%) | 972 (57.0%) |
| Transportation & Warehousing | 394 (72.2%) | 152 (27.8%) |
| Utilities | 57 (64.8%) | 31 (35.2%) |
| Information | 194 (75.8%) | 62 (24.2%) |
| Finance & Insurance | 85 (23.1%) | 283 (76.9%) |
| Real Estate, Rental & Leasing | 234 (82.1%) | 51 (17.9%) |
| Professional & Scientific | 230 (44.2%) | 290 (55.8%) |
| Enterprise Management | 0 (0.0%) | 0 (0.0%) |
| Administrative & Support | 357 (65.7%) | 186 (34.3%) |
| Educational Services | 159 (16.4%) | 809 (83.6%) |
| Health Care & Social Assistance | 140 (5.6%) | 2,360 (94.4%) |
| Arts, Entertainment & Recreation | 388 (44.0%) | 494 (56.0%) |
| Accommodation & Food Services | 299 (44.5%) | 373 (55.5%) |
| Public Administration | 744 (53.3%) | 651 (46.7%) |
| Total | 7,614 (51.2%) | 7,247 (48.8%) |
Education in Avoyelles Parish
School Enrollment in Avoyelles Parish
The most common levels of schooling among the 9,937 students in Avoyelles Parish are middle school (2,327 | 23.4%), high school (2,312 | 23.3%), and elementary school (1,850 | 18.6%).
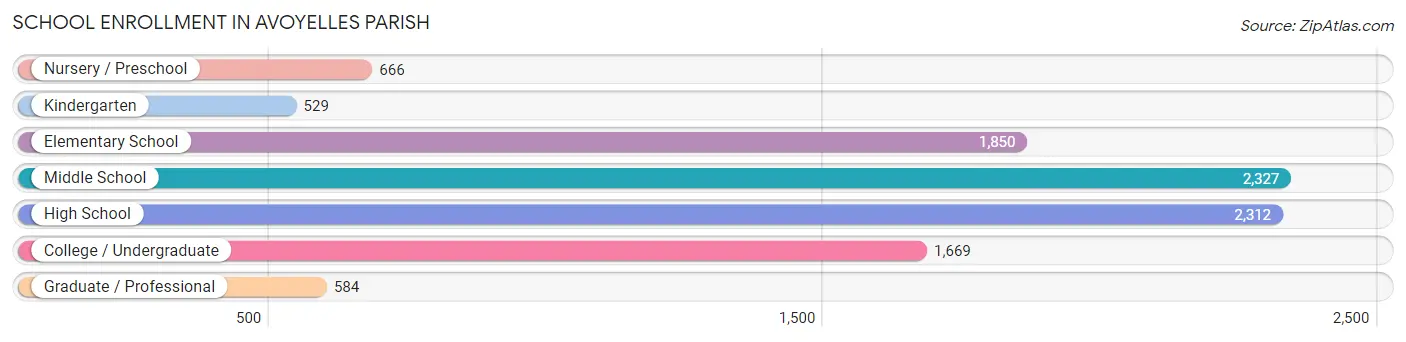
| School Level | # Students | % Students |
| Nursery / Preschool | 666 | 6.7% |
| Kindergarten | 529 | 5.3% |
| Elementary School | 1,850 | 18.6% |
| Middle School | 2,327 | 23.4% |
| High School | 2,312 | 23.3% |
| College / Undergraduate | 1,669 | 16.8% |
| Graduate / Professional | 584 | 5.9% |
| Total | 9,937 | 100.0% |
School Enrollment by Age by Funding Source in Avoyelles Parish
Out of a total of 9,937 students who are enrolled in schools in Avoyelles Parish, 1,669 (16.8%) attend a private institution, while the remaining 8,268 (83.2%) are enrolled in public schools. The age group of 25 to 34 year olds has the highest likelihood of being enrolled in private schools, with 193 (37.6% in the age bracket) enrolled. Conversely, the age group of 20 to 24 year olds has the lowest likelihood of being enrolled in a private school, with 745 (94.1% in the age bracket) attending a public institution.
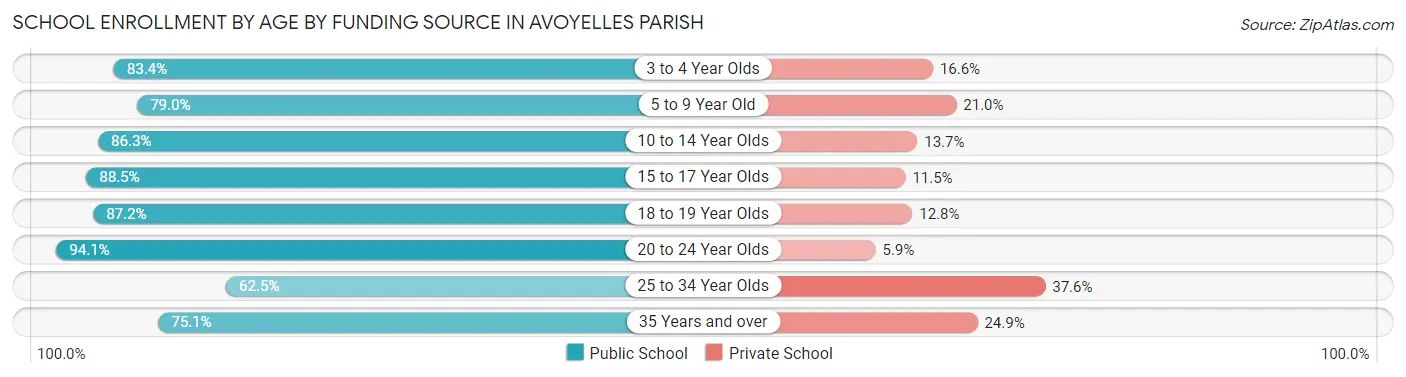
| Age Bracket | Public School | Private School |
| 3 to 4 Year Olds | 416 (83.4%) | 83 (16.6%) |
| 5 to 9 Year Old | 1,799 (79.0%) | 478 (21.0%) |
| 10 to 14 Year Olds | 2,442 (86.3%) | 388 (13.7%) |
| 15 to 17 Year Olds | 1,376 (88.5%) | 179 (11.5%) |
| 18 to 19 Year Olds | 484 (87.2%) | 71 (12.8%) |
| 20 to 24 Year Olds | 745 (94.1%) | 47 (5.9%) |
| 25 to 34 Year Olds | 321 (62.5%) | 193 (37.6%) |
| 35 Years and over | 687 (75.1%) | 228 (24.9%) |
| Total | 8,268 (83.2%) | 1,669 (16.8%) |
Educational Attainment by Field of Study in Avoyelles Parish
Education (815 | 23.6%), science & technology (641 | 18.5%), business (570 | 16.5%), arts & humanities (369 | 10.7%), and liberal arts & history (237 | 6.9%) are the most common fields of study among 3,457 individuals in Avoyelles Parish who have obtained a bachelor's degree or higher.
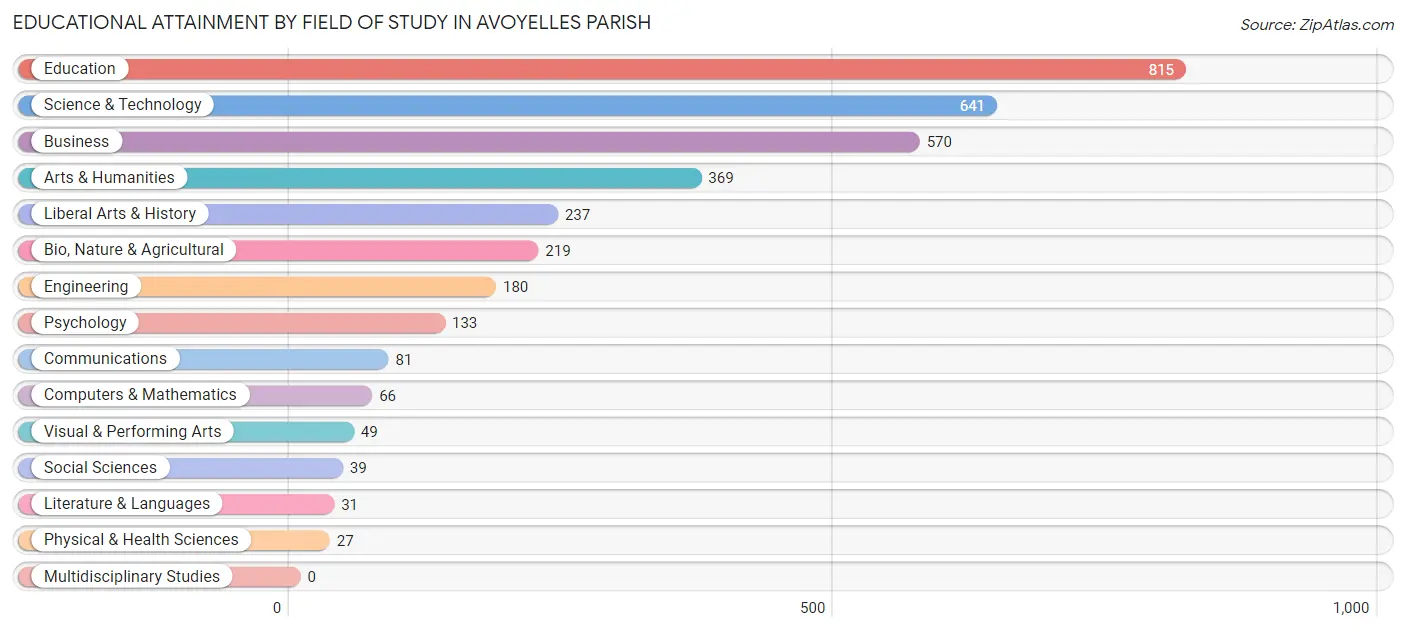
| Field of Study | # Graduates | % Graduates |
| Computers & Mathematics | 66 | 1.9% |
| Bio, Nature & Agricultural | 219 | 6.3% |
| Physical & Health Sciences | 27 | 0.8% |
| Psychology | 133 | 3.8% |
| Social Sciences | 39 | 1.1% |
| Engineering | 180 | 5.2% |
| Multidisciplinary Studies | 0 | 0.0% |
| Science & Technology | 641 | 18.5% |
| Business | 570 | 16.5% |
| Education | 815 | 23.6% |
| Literature & Languages | 31 | 0.9% |
| Liberal Arts & History | 237 | 6.9% |
| Visual & Performing Arts | 49 | 1.4% |
| Communications | 81 | 2.3% |
| Arts & Humanities | 369 | 10.7% |
| Total | 3,457 | 100.0% |
Transportation & Commute in Avoyelles Parish
Vehicle Availability by Sex in Avoyelles Parish
The most prevalent vehicle ownership categories in Avoyelles Parish are males with 2 vehicles (3,215, accounting for 42.9%) and females with 2 vehicles (2,561, making up 45.8%).
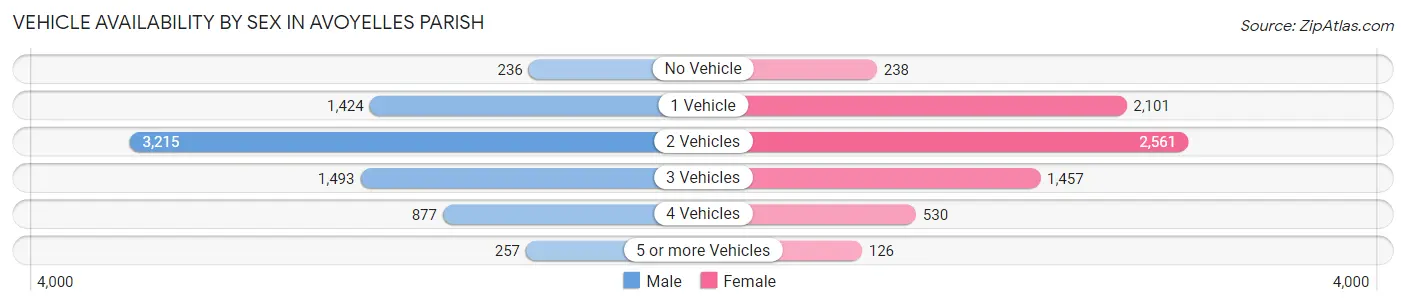
| Vehicles Available | Male | Female |
| No Vehicle | 236 (3.2%) | 238 (3.4%) |
| 1 Vehicle | 1,424 (19.0%) | 2,101 (30.0%) |
| 2 Vehicles | 3,215 (42.9%) | 2,561 (36.5%) |
| 3 Vehicles | 1,493 (19.9%) | 1,457 (20.8%) |
| 4 Vehicles | 877 (11.7%) | 530 (7.6%) |
| 5 or more Vehicles | 257 (3.4%) | 126 (1.8%) |
| Total | 7,502 (100.0%) | 7,013 (100.0%) |
Commute Time in Avoyelles Parish
The most frequently occuring commute durations in Avoyelles Parish are 10 to 14 minutes (2,084 commuters, 14.8%), 30 to 34 minutes (1,742 commuters, 12.4%), and 5 to 9 minutes (1,715 commuters, 12.2%).
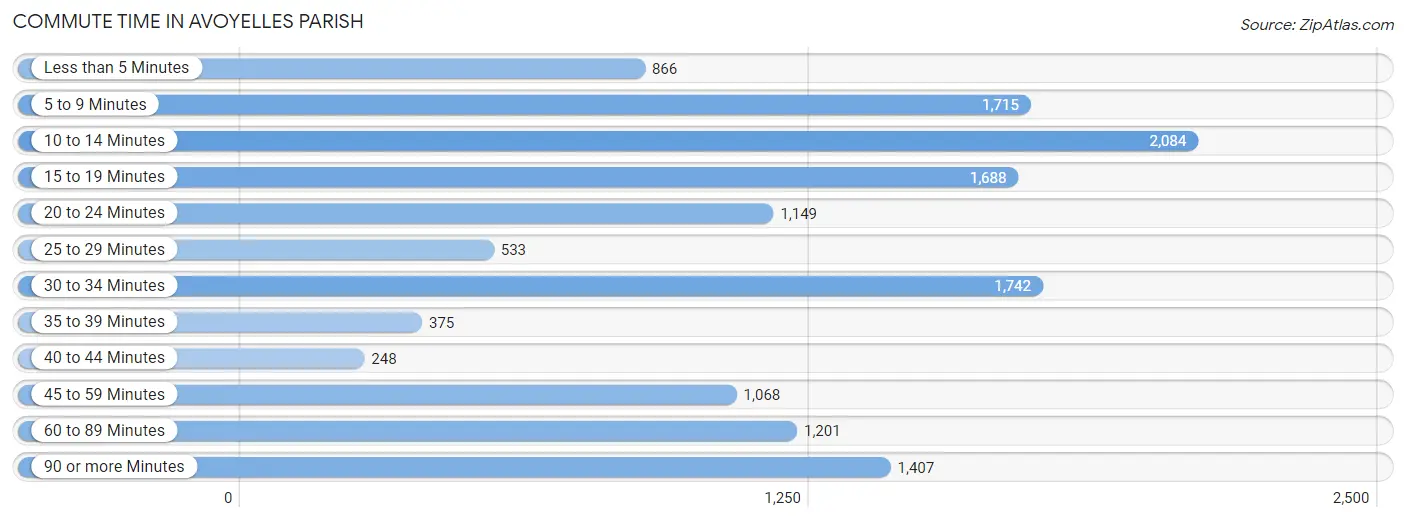
| Commute Time | # Commuters | % Commuters |
| Less than 5 Minutes | 866 | 6.1% |
| 5 to 9 Minutes | 1,715 | 12.2% |
| 10 to 14 Minutes | 2,084 | 14.8% |
| 15 to 19 Minutes | 1,688 | 12.0% |
| 20 to 24 Minutes | 1,149 | 8.2% |
| 25 to 29 Minutes | 533 | 3.8% |
| 30 to 34 Minutes | 1,742 | 12.4% |
| 35 to 39 Minutes | 375 | 2.7% |
| 40 to 44 Minutes | 248 | 1.8% |
| 45 to 59 Minutes | 1,068 | 7.6% |
| 60 to 89 Minutes | 1,201 | 8.5% |
| 90 or more Minutes | 1,407 | 10.0% |
Commute Time by Sex in Avoyelles Parish
The most common commute times in Avoyelles Parish are 90 or more minutes (1,074 commuters, 14.8%) for males and 5 to 9 minutes (1,073 commuters, 15.7%) for females.
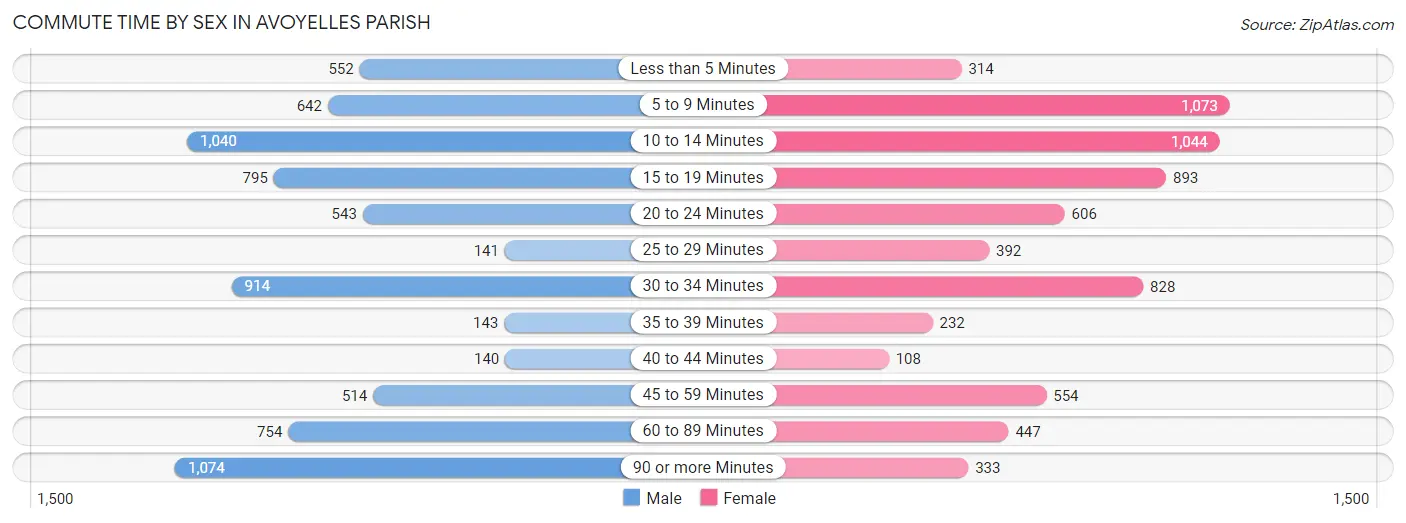
| Commute Time | Male | Female |
| Less than 5 Minutes | 552 (7.6%) | 314 (4.6%) |
| 5 to 9 Minutes | 642 (8.8%) | 1,073 (15.7%) |
| 10 to 14 Minutes | 1,040 (14.3%) | 1,044 (15.3%) |
| 15 to 19 Minutes | 795 (11.0%) | 893 (13.1%) |
| 20 to 24 Minutes | 543 (7.5%) | 606 (8.9%) |
| 25 to 29 Minutes | 141 (1.9%) | 392 (5.7%) |
| 30 to 34 Minutes | 914 (12.6%) | 828 (12.1%) |
| 35 to 39 Minutes | 143 (2.0%) | 232 (3.4%) |
| 40 to 44 Minutes | 140 (1.9%) | 108 (1.6%) |
| 45 to 59 Minutes | 514 (7.1%) | 554 (8.1%) |
| 60 to 89 Minutes | 754 (10.4%) | 447 (6.6%) |
| 90 or more Minutes | 1,074 (14.8%) | 333 (4.9%) |
Time of Departure to Work by Sex in Avoyelles Parish
The most frequent times of departure to work in Avoyelles Parish are 12:00 AM to 4:59 AM (1,335, 18.4%) for males and 7:30 AM to 7:59 AM (1,098, 16.1%) for females.
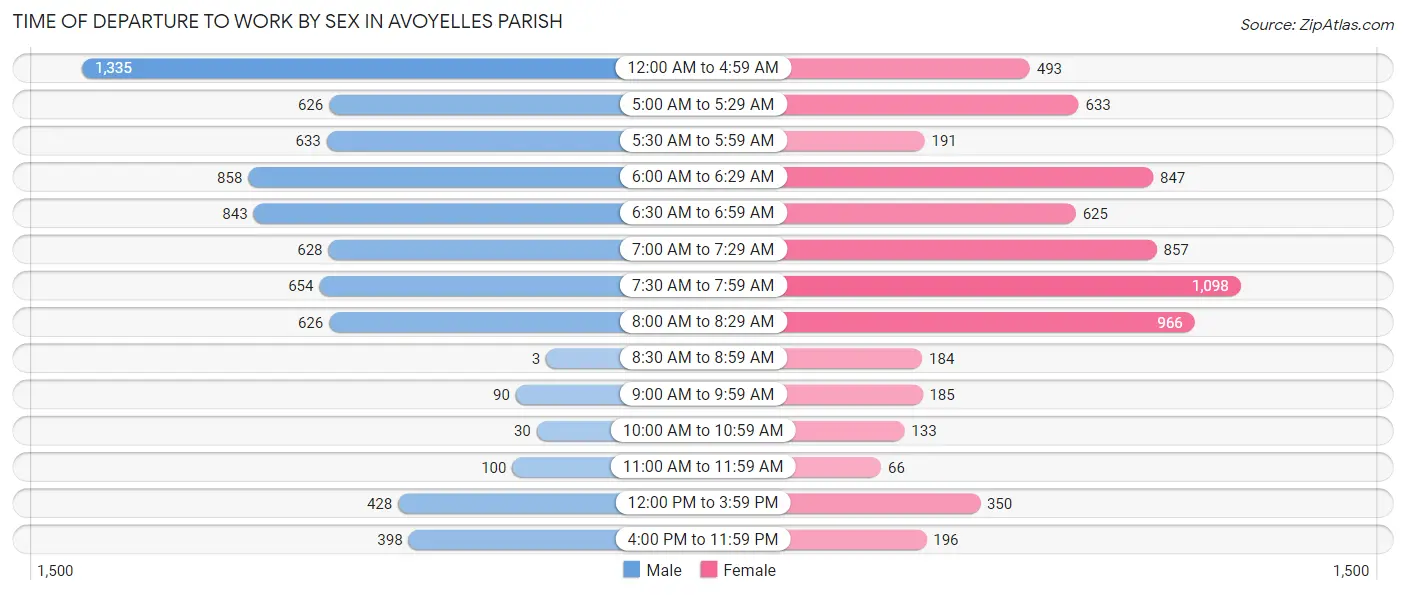
| Time of Departure | Male | Female |
| 12:00 AM to 4:59 AM | 1,335 (18.4%) | 493 (7.2%) |
| 5:00 AM to 5:29 AM | 626 (8.6%) | 633 (9.3%) |
| 5:30 AM to 5:59 AM | 633 (8.7%) | 191 (2.8%) |
| 6:00 AM to 6:29 AM | 858 (11.8%) | 847 (12.4%) |
| 6:30 AM to 6:59 AM | 843 (11.6%) | 625 (9.2%) |
| 7:00 AM to 7:29 AM | 628 (8.7%) | 857 (12.6%) |
| 7:30 AM to 7:59 AM | 654 (9.0%) | 1,098 (16.1%) |
| 8:00 AM to 8:29 AM | 626 (8.6%) | 966 (14.2%) |
| 8:30 AM to 8:59 AM | 3 (0.0%) | 184 (2.7%) |
| 9:00 AM to 9:59 AM | 90 (1.2%) | 185 (2.7%) |
| 10:00 AM to 10:59 AM | 30 (0.4%) | 133 (1.9%) |
| 11:00 AM to 11:59 AM | 100 (1.4%) | 66 (1.0%) |
| 12:00 PM to 3:59 PM | 428 (5.9%) | 350 (5.1%) |
| 4:00 PM to 11:59 PM | 398 (5.5%) | 196 (2.9%) |
| Total | 7,252 (100.0%) | 6,824 (100.0%) |
Housing Occupancy in Avoyelles Parish
Occupancy by Ownership in Avoyelles Parish
Of the total 14,600 dwellings in Avoyelles Parish, owner-occupied units account for 10,251 (70.2%), while renter-occupied units make up 4,349 (29.8%).
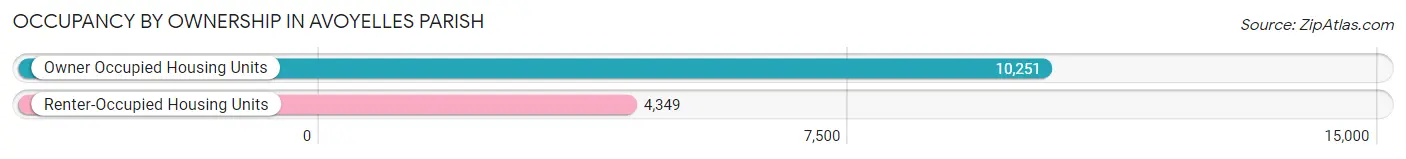
| Occupancy | # Housing Units | % Housing Units |
| Owner Occupied Housing Units | 10,251 | 70.2% |
| Renter-Occupied Housing Units | 4,349 | 29.8% |
| Total Occupied Housing Units | 14,600 | 100.0% |
Occupancy by Household Size in Avoyelles Parish
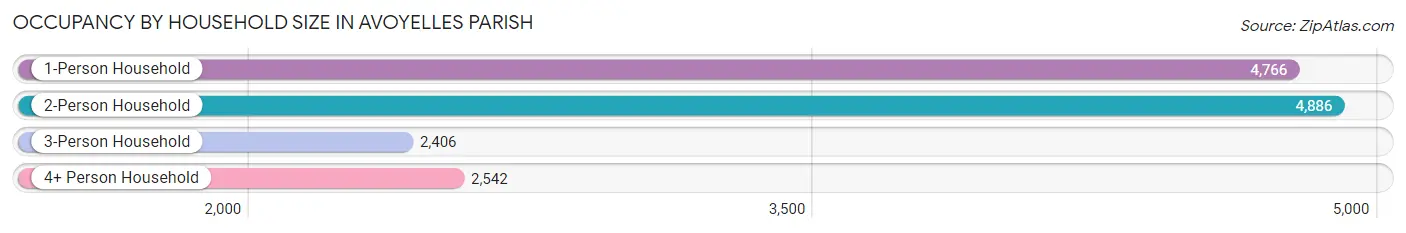
| Household Size | # Housing Units | % Housing Units |
| 1-Person Household | 4,766 | 32.6% |
| 2-Person Household | 4,886 | 33.5% |
| 3-Person Household | 2,406 | 16.5% |
| 4+ Person Household | 2,542 | 17.4% |
| Total Housing Units | 14,600 | 100.0% |
Occupancy by Ownership by Household Size in Avoyelles Parish
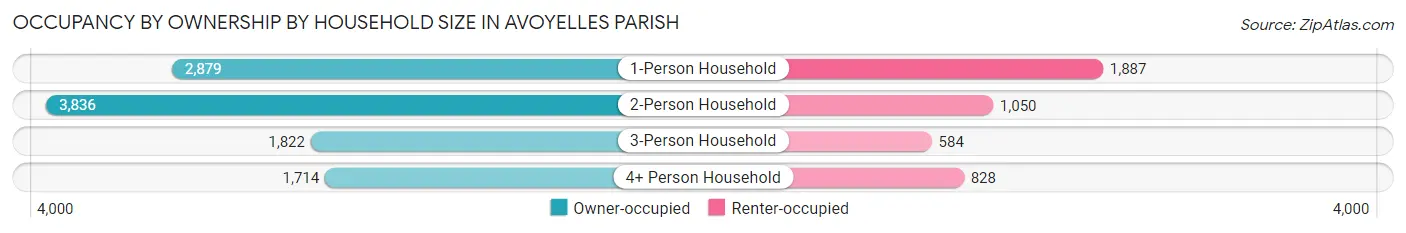
| Household Size | Owner-occupied | Renter-occupied |
| 1-Person Household | 2,879 (60.4%) | 1,887 (39.6%) |
| 2-Person Household | 3,836 (78.5%) | 1,050 (21.5%) |
| 3-Person Household | 1,822 (75.7%) | 584 (24.3%) |
| 4+ Person Household | 1,714 (67.4%) | 828 (32.6%) |
| Total Housing Units | 10,251 (70.2%) | 4,349 (29.8%) |
Occupancy by Educational Attainment in Avoyelles Parish
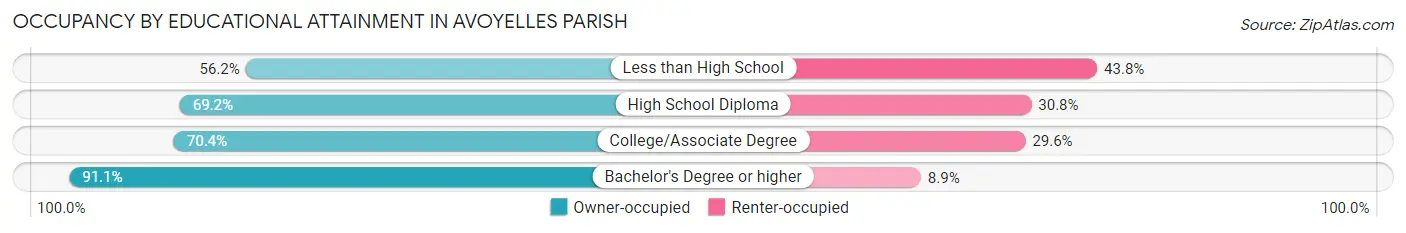
| Household Size | Owner-occupied | Renter-occupied |
| Less than High School | 1,498 (56.2%) | 1,168 (43.8%) |
| High School Diploma | 3,802 (69.2%) | 1,690 (30.8%) |
| College/Associate Degree | 3,123 (70.4%) | 1,313 (29.6%) |
| Bachelor's Degree or higher | 1,828 (91.1%) | 178 (8.9%) |
Occupancy by Age of Householder in Avoyelles Parish
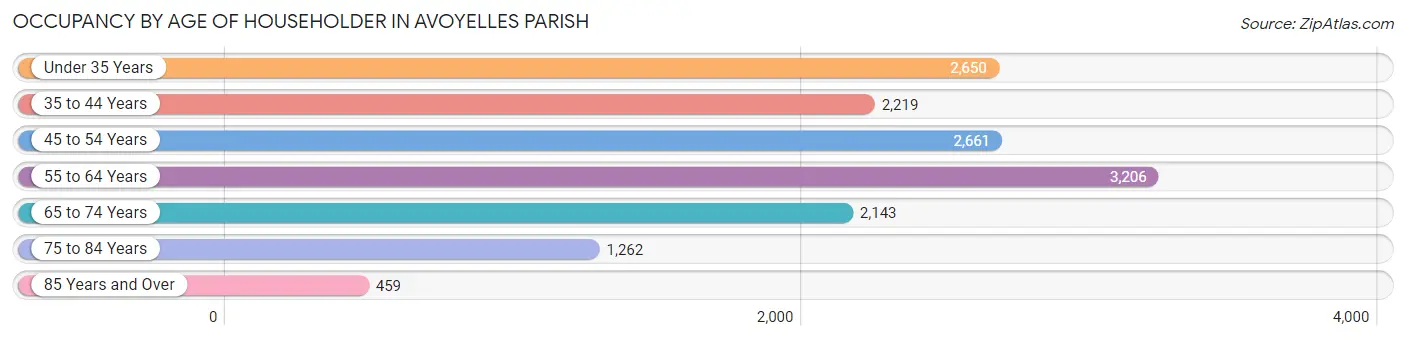
| Age Bracket | # Households | % Households |
| Under 35 Years | 2,650 | 18.1% |
| 35 to 44 Years | 2,219 | 15.2% |
| 45 to 54 Years | 2,661 | 18.2% |
| 55 to 64 Years | 3,206 | 22.0% |
| 65 to 74 Years | 2,143 | 14.7% |
| 75 to 84 Years | 1,262 | 8.6% |
| 85 Years and Over | 459 | 3.1% |
| Total | 14,600 | 100.0% |
Housing Finances in Avoyelles Parish
Median Income by Occupancy in Avoyelles Parish
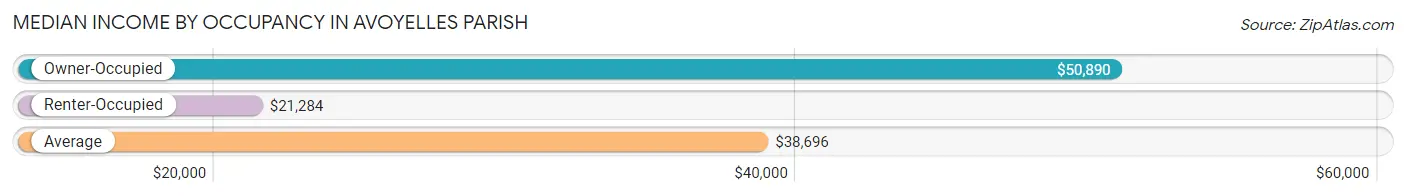
| Occupancy Type | # Households | Median Income |
| Owner-Occupied | 10,251 (70.2%) | $50,890 |
| Renter-Occupied | 4,349 (29.8%) | $21,284 |
| Average | 14,600 (100.0%) | $38,696 |
Occupancy by Householder Income Bracket in Avoyelles Parish
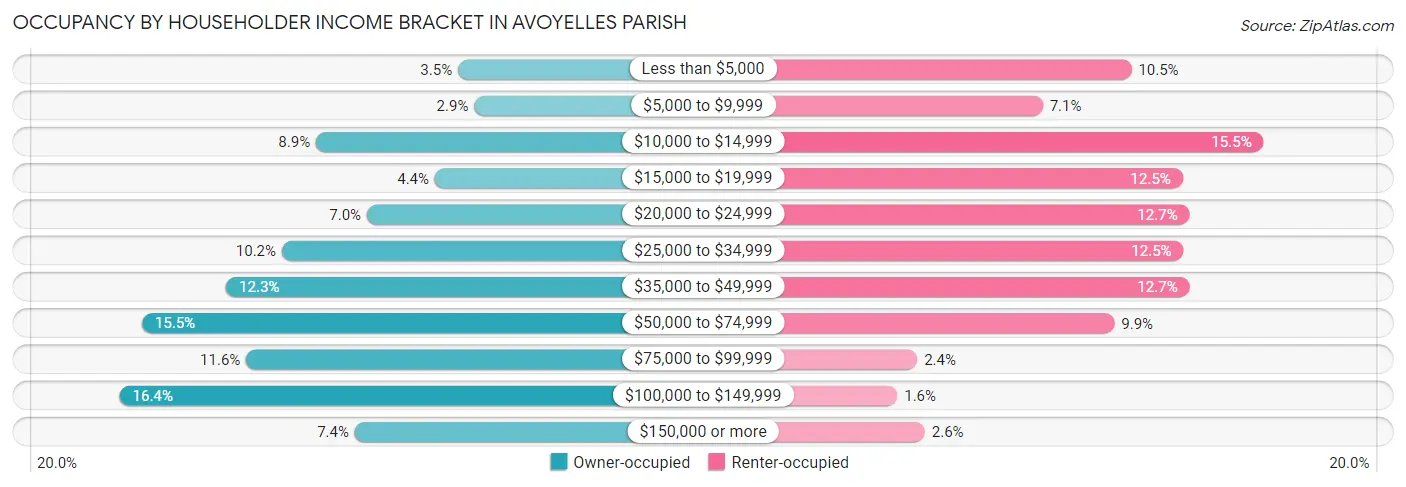
| Income Bracket | Owner-occupied | Renter-occupied |
| Less than $5,000 | 358 (3.5%) | 457 (10.5%) |
| $5,000 to $9,999 | 294 (2.9%) | 310 (7.1%) |
| $10,000 to $14,999 | 912 (8.9%) | 676 (15.5%) |
| $15,000 to $19,999 | 448 (4.4%) | 542 (12.5%) |
| $20,000 to $24,999 | 713 (7.0%) | 553 (12.7%) |
| $25,000 to $34,999 | 1,046 (10.2%) | 543 (12.5%) |
| $35,000 to $49,999 | 1,263 (12.3%) | 553 (12.7%) |
| $50,000 to $74,999 | 1,592 (15.5%) | 429 (9.9%) |
| $75,000 to $99,999 | 1,185 (11.6%) | 102 (2.4%) |
| $100,000 to $149,999 | 1,679 (16.4%) | 69 (1.6%) |
| $150,000 or more | 761 (7.4%) | 115 (2.6%) |
| Total | 10,251 (100.0%) | 4,349 (100.0%) |
Monthly Housing Cost Tiers in Avoyelles Parish
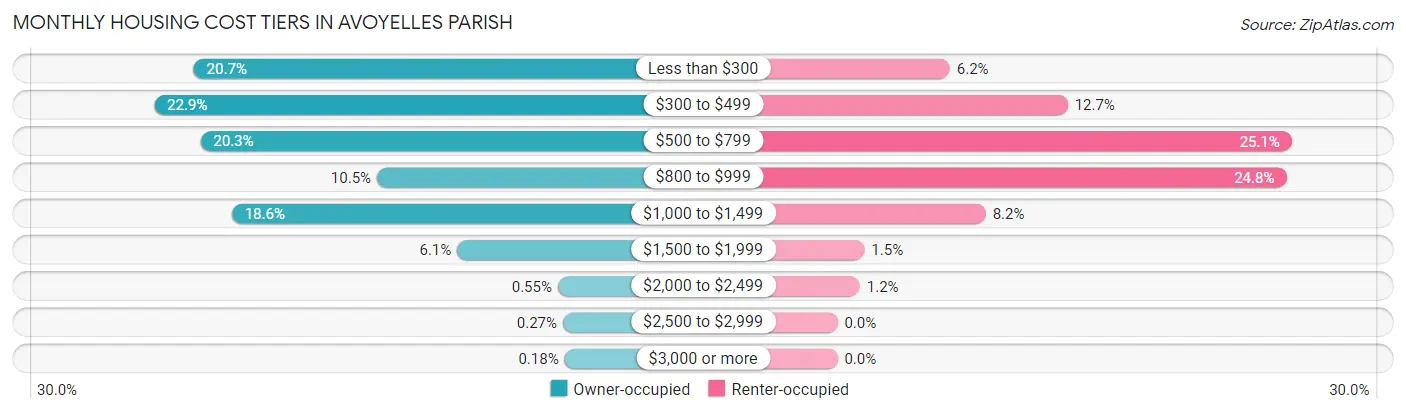
| Monthly Cost | Owner-occupied | Renter-occupied |
| Less than $300 | 2,118 (20.7%) | 270 (6.2%) |
| $300 to $499 | 2,342 (22.9%) | 553 (12.7%) |
| $500 to $799 | 2,080 (20.3%) | 1,091 (25.1%) |
| $800 to $999 | 1,080 (10.5%) | 1,078 (24.8%) |
| $1,000 to $1,499 | 1,903 (18.6%) | 356 (8.2%) |
| $1,500 to $1,999 | 626 (6.1%) | 65 (1.5%) |
| $2,000 to $2,499 | 56 (0.5%) | 54 (1.2%) |
| $2,500 to $2,999 | 28 (0.3%) | 0 (0.0%) |
| $3,000 or more | 18 (0.2%) | 0 (0.0%) |
| Total | 10,251 (100.0%) | 4,349 (100.0%) |
Physical Housing Characteristics in Avoyelles Parish
Housing Structures in Avoyelles Parish
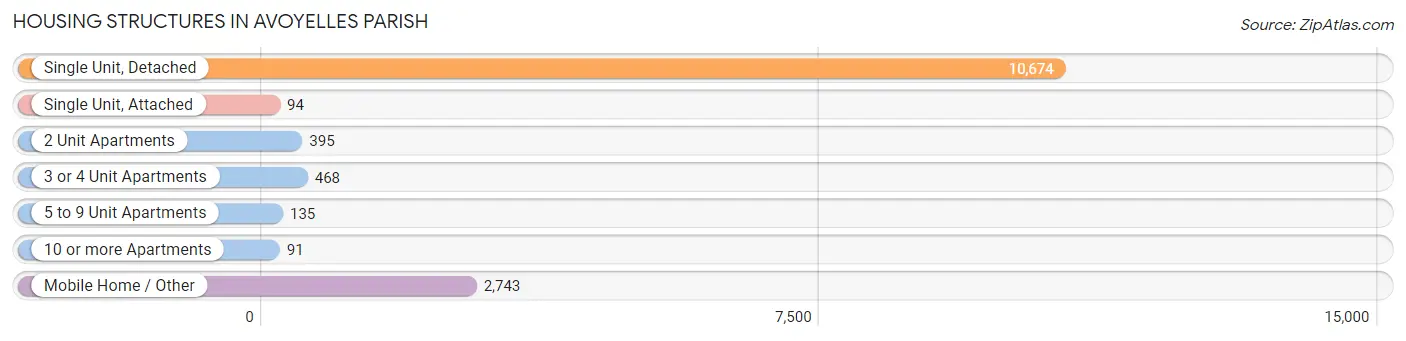
| Structure Type | # Housing Units | % Housing Units |
| Single Unit, Detached | 10,674 | 73.1% |
| Single Unit, Attached | 94 | 0.6% |
| 2 Unit Apartments | 395 | 2.7% |
| 3 or 4 Unit Apartments | 468 | 3.2% |
| 5 to 9 Unit Apartments | 135 | 0.9% |
| 10 or more Apartments | 91 | 0.6% |
| Mobile Home / Other | 2,743 | 18.8% |
| Total | 14,600 | 100.0% |
Housing Structures by Occupancy in Avoyelles Parish
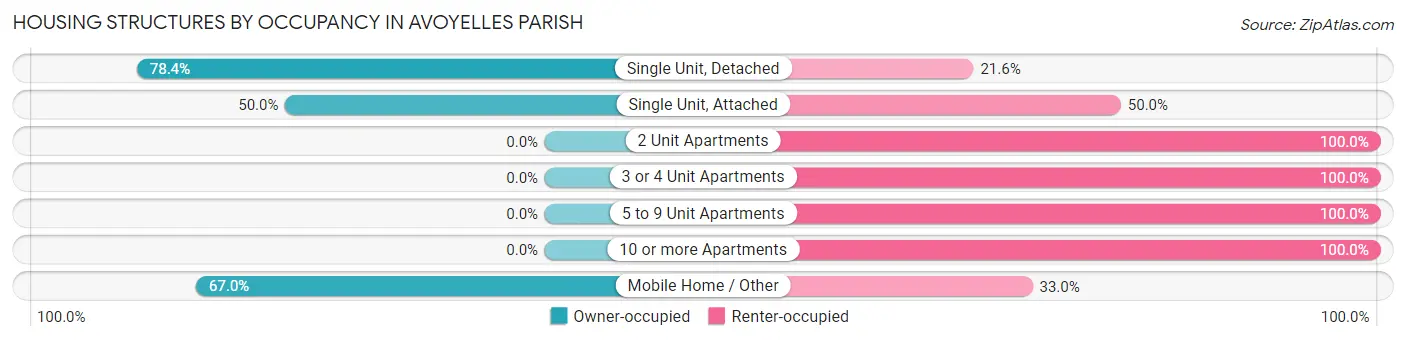
| Structure Type | Owner-occupied | Renter-occupied |
| Single Unit, Detached | 8,366 (78.4%) | 2,308 (21.6%) |
| Single Unit, Attached | 47 (50.0%) | 47 (50.0%) |
| 2 Unit Apartments | 0 (0.0%) | 395 (100.0%) |
| 3 or 4 Unit Apartments | 0 (0.0%) | 468 (100.0%) |
| 5 to 9 Unit Apartments | 0 (0.0%) | 135 (100.0%) |
| 10 or more Apartments | 0 (0.0%) | 91 (100.0%) |
| Mobile Home / Other | 1,838 (67.0%) | 905 (33.0%) |
| Total | 10,251 (70.2%) | 4,349 (29.8%) |
Housing Structures by Number of Rooms in Avoyelles Parish
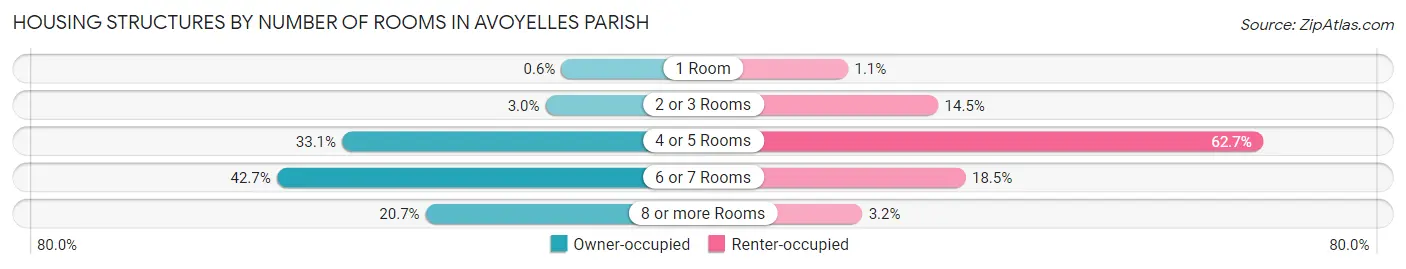
| Number of Rooms | Owner-occupied | Renter-occupied |
| 1 Room | 61 (0.6%) | 49 (1.1%) |
| 2 or 3 Rooms | 302 (2.9%) | 629 (14.5%) |
| 4 or 5 Rooms | 3,388 (33.1%) | 2,726 (62.7%) |
| 6 or 7 Rooms | 4,379 (42.7%) | 805 (18.5%) |
| 8 or more Rooms | 2,121 (20.7%) | 140 (3.2%) |
| Total | 10,251 (100.0%) | 4,349 (100.0%) |
Housing Structure by Heating Type in Avoyelles Parish
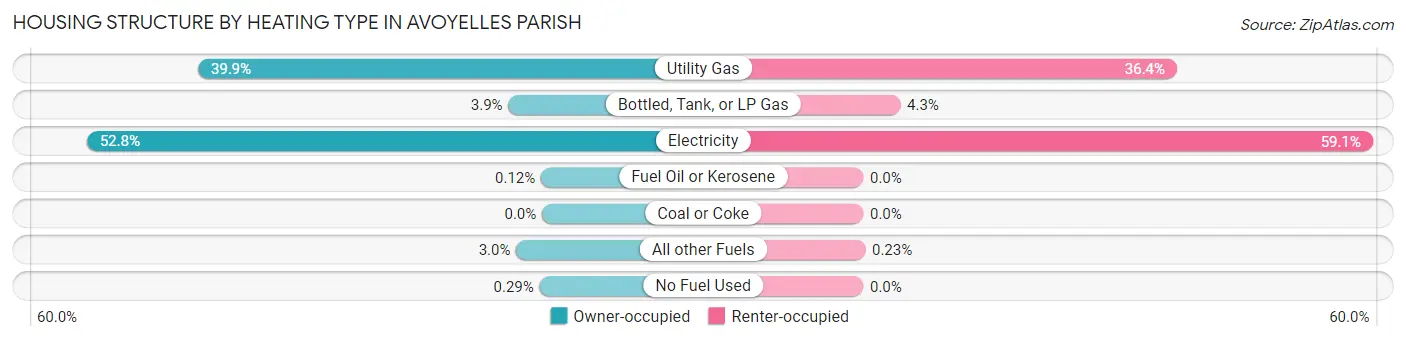
| Heating Type | Owner-occupied | Renter-occupied |
| Utility Gas | 4,091 (39.9%) | 1,582 (36.4%) |
| Bottled, Tank, or LP Gas | 400 (3.9%) | 187 (4.3%) |
| Electricity | 5,412 (52.8%) | 2,570 (59.1%) |
| Fuel Oil or Kerosene | 12 (0.1%) | 0 (0.0%) |
| Coal or Coke | 0 (0.0%) | 0 (0.0%) |
| All other Fuels | 306 (3.0%) | 10 (0.2%) |
| No Fuel Used | 30 (0.3%) | 0 (0.0%) |
| Total | 10,251 (100.0%) | 4,349 (100.0%) |
Household Vehicle Usage in Avoyelles Parish
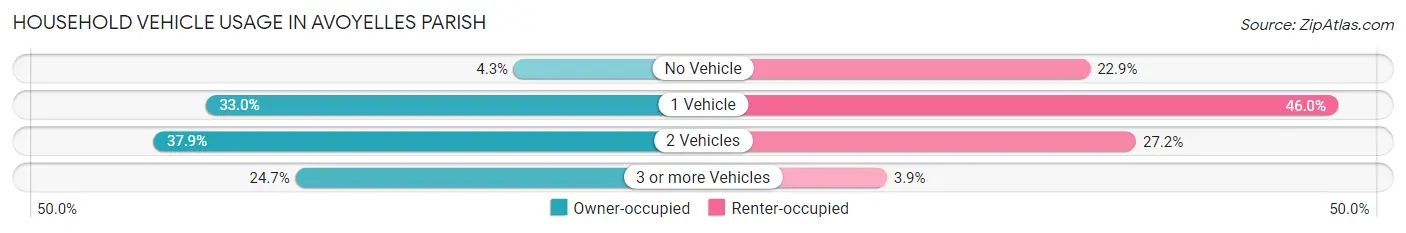
| Vehicles per Household | Owner-occupied | Renter-occupied |
| No Vehicle | 443 (4.3%) | 996 (22.9%) |
| 1 Vehicle | 3,387 (33.0%) | 2,001 (46.0%) |
| 2 Vehicles | 3,888 (37.9%) | 1,182 (27.2%) |
| 3 or more Vehicles | 2,533 (24.7%) | 170 (3.9%) |
| Total | 10,251 (100.0%) | 4,349 (100.0%) |
Real Estate & Mortgages in Avoyelles Parish
Real Estate and Mortgage Overview in Avoyelles Parish
| Characteristic | Without Mortgage | With Mortgage |
| Housing Units | 5,682 | 4,569 |
| Median Property Value | $109,100 | $136,500 |
| Median Household Income | $41,335 | $357 |
| Monthly Housing Costs | $345 | $18 |
| Real Estate Taxes | $199 | $1,016 |
Property Value by Mortgage Status in Avoyelles Parish
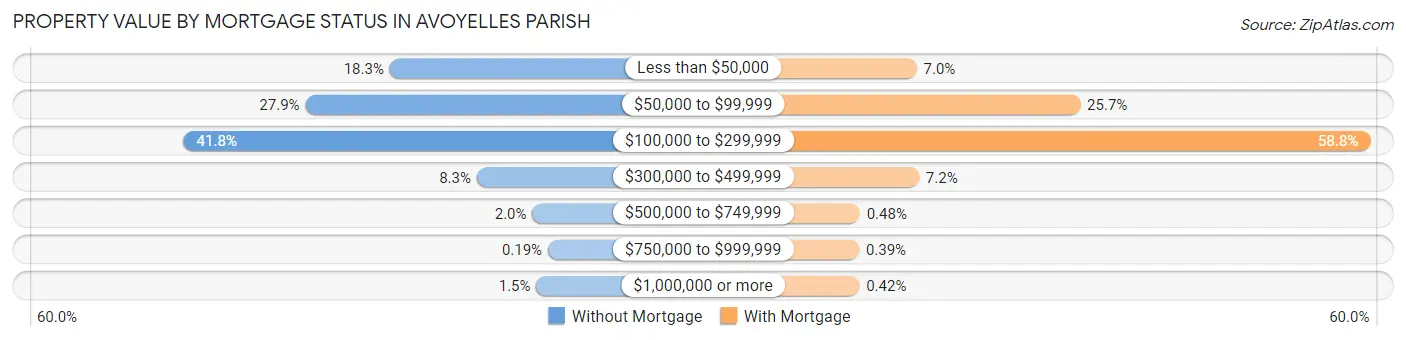
| Property Value | Without Mortgage | With Mortgage |
| Less than $50,000 | 1,038 (18.3%) | 319 (7.0%) |
| $50,000 to $99,999 | 1,586 (27.9%) | 1,173 (25.7%) |
| $100,000 to $299,999 | 2,376 (41.8%) | 2,687 (58.8%) |
| $300,000 to $499,999 | 473 (8.3%) | 331 (7.2%) |
| $500,000 to $749,999 | 112 (2.0%) | 22 (0.5%) |
| $750,000 to $999,999 | 11 (0.2%) | 18 (0.4%) |
| $1,000,000 or more | 86 (1.5%) | 19 (0.4%) |
| Total | 5,682 (100.0%) | 4,569 (100.0%) |
Household Income by Mortgage Status in Avoyelles Parish
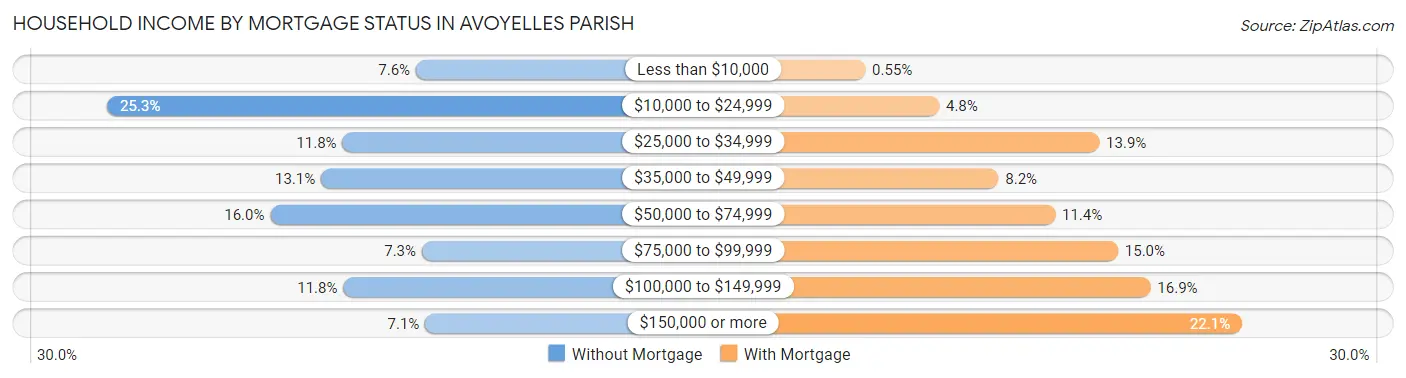
| Household Income | Without Mortgage | With Mortgage |
| Less than $10,000 | 434 (7.6%) | 25 (0.5%) |
| $10,000 to $24,999 | 1,437 (25.3%) | 218 (4.8%) |
| $25,000 to $34,999 | 673 (11.8%) | 636 (13.9%) |
| $35,000 to $49,999 | 742 (13.1%) | 373 (8.2%) |
| $50,000 to $74,999 | 907 (16.0%) | 521 (11.4%) |
| $75,000 to $99,999 | 415 (7.3%) | 685 (15.0%) |
| $100,000 to $149,999 | 670 (11.8%) | 770 (16.9%) |
| $150,000 or more | 404 (7.1%) | 1,009 (22.1%) |
| Total | 5,682 (100.0%) | 4,569 (100.0%) |
Property Value to Household Income Ratio in Avoyelles Parish
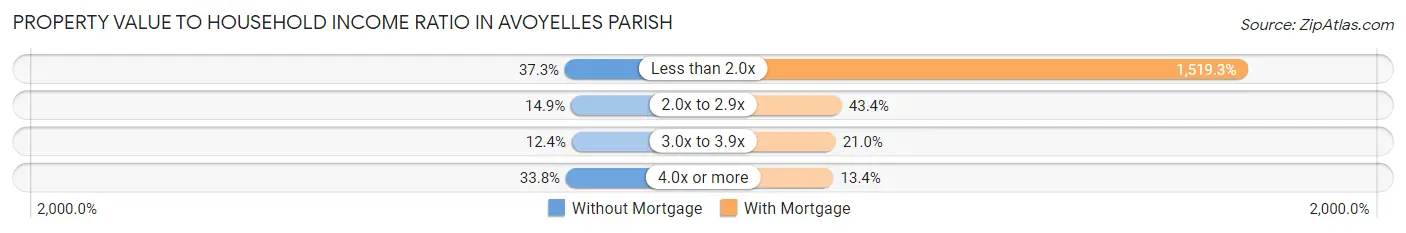
| Value-to-Income Ratio | Without Mortgage | With Mortgage |
| Less than 2.0x | 2,119 (37.3%) | 69,418 (1,519.3%) |
| 2.0x to 2.9x | 844 (14.8%) | 1,981 (43.4%) |
| 3.0x to 3.9x | 707 (12.4%) | 961 (21.0%) |
| 4.0x or more | 1,921 (33.8%) | 610 (13.4%) |
| Total | 5,682 (100.0%) | 4,569 (100.0%) |
Real Estate Taxes by Mortgage Status in Avoyelles Parish
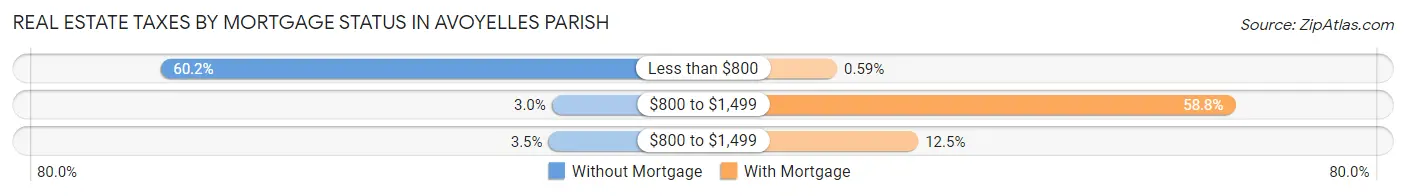
| Property Taxes | Without Mortgage | With Mortgage |
| Less than $800 | 3,419 (60.2%) | 27 (0.6%) |
| $800 to $1,499 | 170 (3.0%) | 2,685 (58.8%) |
| $800 to $1,499 | 197 (3.5%) | 569 (12.4%) |
| Total | 5,682 (100.0%) | 4,569 (100.0%) |
Health & Disability in Avoyelles Parish
Health Insurance Coverage by Age in Avoyelles Parish
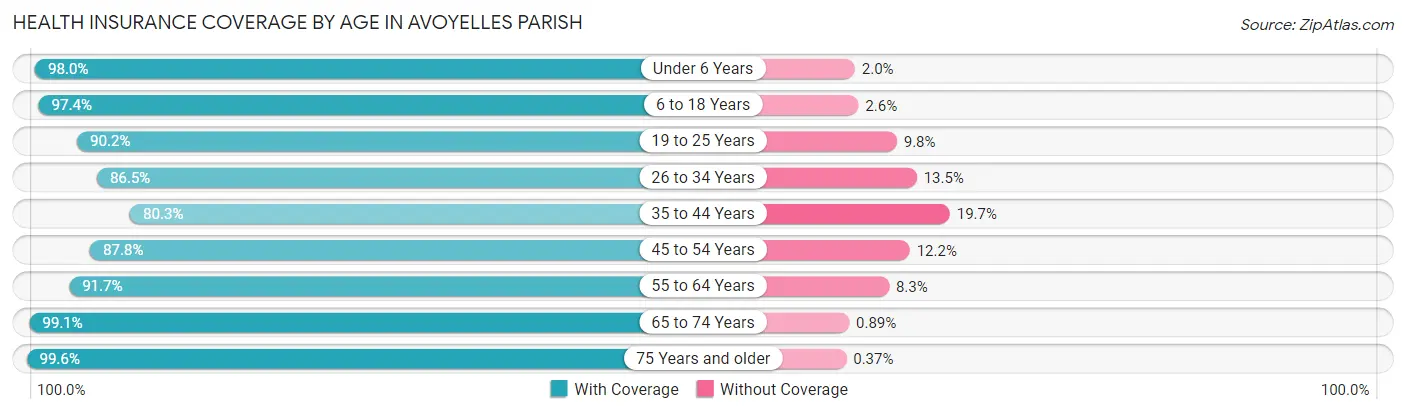
| Age Bracket | With Coverage | Without Coverage |
| Under 6 Years | 3,057 (98.0%) | 61 (2.0%) |
| 6 to 18 Years | 6,482 (97.4%) | 175 (2.6%) |
| 19 to 25 Years | 2,884 (90.2%) | 313 (9.8%) |
| 26 to 34 Years | 3,177 (86.5%) | 496 (13.5%) |
| 35 to 44 Years | 3,550 (80.3%) | 869 (19.7%) |
| 45 to 54 Years | 3,777 (87.8%) | 525 (12.2%) |
| 55 to 64 Years | 4,345 (91.7%) | 395 (8.3%) |
| 65 to 74 Years | 3,788 (99.1%) | 34 (0.9%) |
| 75 Years and older | 2,431 (99.6%) | 9 (0.4%) |
| Total | 33,491 (92.1%) | 2,877 (7.9%) |
Health Insurance Coverage by Citizenship Status in Avoyelles Parish
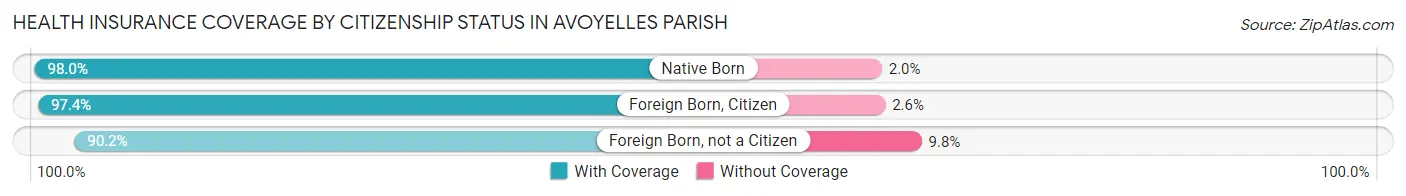
| Citizenship Status | With Coverage | Without Coverage |
| Native Born | 3,057 (98.0%) | 61 (2.0%) |
| Foreign Born, Citizen | 6,482 (97.4%) | 175 (2.6%) |
| Foreign Born, not a Citizen | 2,884 (90.2%) | 313 (9.8%) |
Health Insurance Coverage by Household Income in Avoyelles Parish
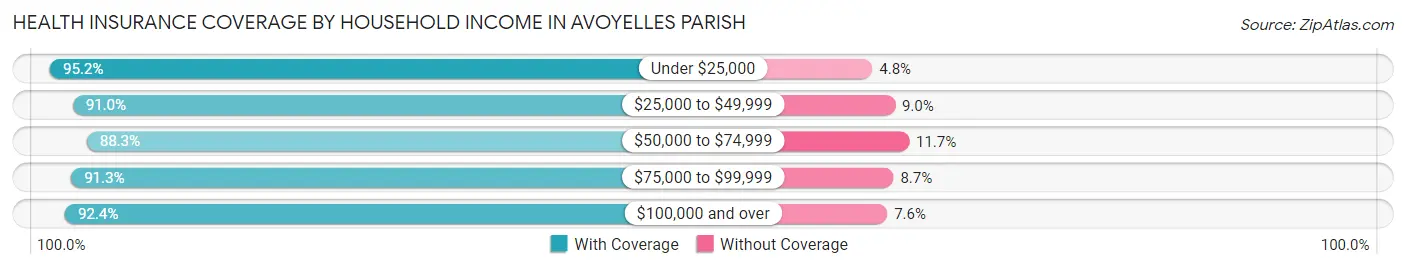
| Household Income | With Coverage | Without Coverage |
| Under $25,000 | 9,566 (95.2%) | 480 (4.8%) |
| $25,000 to $49,999 | 7,327 (91.0%) | 727 (9.0%) |
| $50,000 to $74,999 | 5,271 (88.3%) | 696 (11.7%) |
| $75,000 to $99,999 | 3,602 (91.3%) | 345 (8.7%) |
| $100,000 and over | 7,582 (92.4%) | 621 (7.6%) |
Public vs Private Health Insurance Coverage by Age in Avoyelles Parish
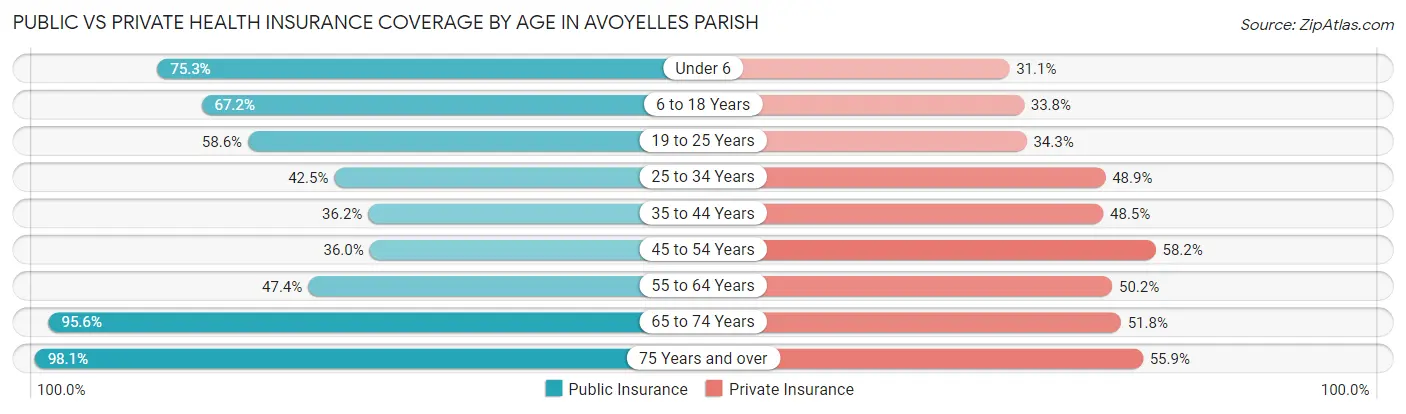
| Age Bracket | Public Insurance | Private Insurance |
| Under 6 | 2,349 (75.3%) | 969 (31.1%) |
| 6 to 18 Years | 4,470 (67.1%) | 2,249 (33.8%) |
| 19 to 25 Years | 1,872 (58.6%) | 1,096 (34.3%) |
| 25 to 34 Years | 1,562 (42.5%) | 1,796 (48.9%) |
| 35 to 44 Years | 1,601 (36.2%) | 2,143 (48.5%) |
| 45 to 54 Years | 1,548 (36.0%) | 2,505 (58.2%) |
| 55 to 64 Years | 2,246 (47.4%) | 2,378 (50.2%) |
| 65 to 74 Years | 3,652 (95.6%) | 1,979 (51.8%) |
| 75 Years and over | 2,394 (98.1%) | 1,363 (55.9%) |
| Total | 21,694 (59.7%) | 16,478 (45.3%) |
Disability Status by Sex by Age in Avoyelles Parish
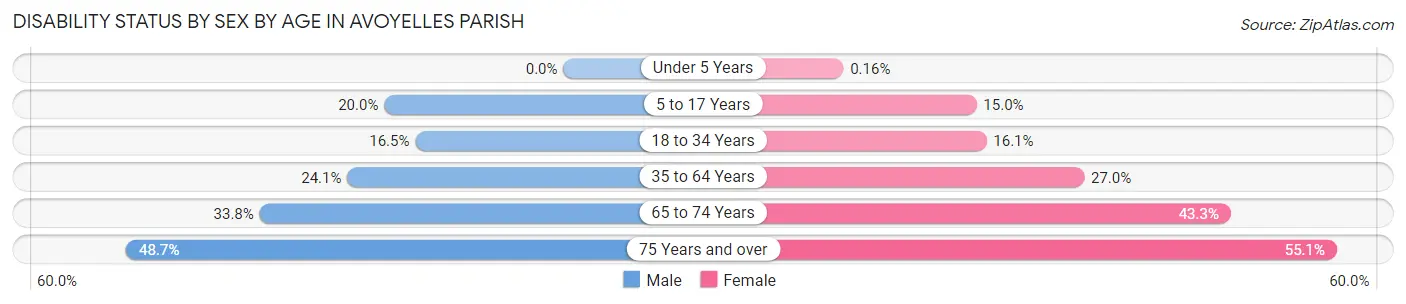
| Age Bracket | Male | Female |
| Under 5 Years | 0 (0.0%) | 2 (0.2%) |
| 5 to 17 Years | 696 (20.0%) | 493 (15.0%) |
| 18 to 34 Years | 557 (16.5%) | 631 (16.1%) |
| 35 to 64 Years | 1,492 (24.1%) | 1,959 (27.0%) |
| 65 to 74 Years | 608 (33.8%) | 877 (43.3%) |
| 75 Years and over | 523 (48.7%) | 753 (55.1%) |
Disability Class by Sex by Age in Avoyelles Parish
Disability Class: Hearing Difficulty
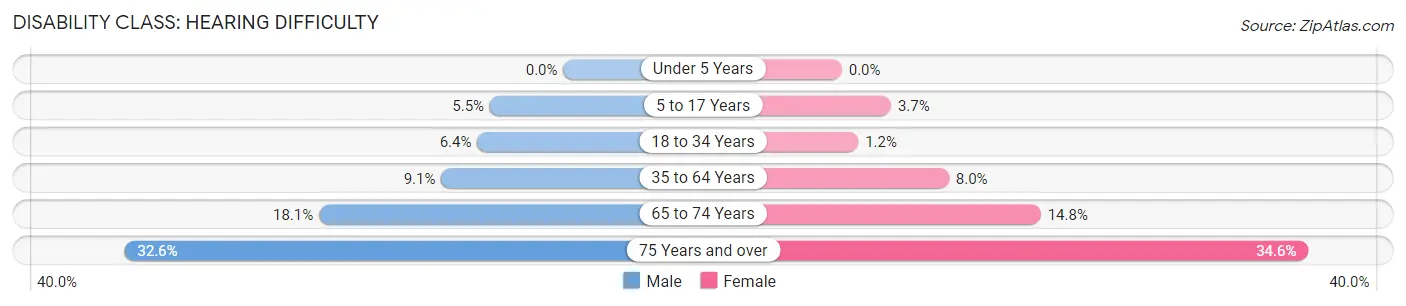
| Age Bracket | Male | Female |
| Under 5 Years | 0 (0.0%) | 0 (0.0%) |
| 5 to 17 Years | 190 (5.4%) | 120 (3.6%) |
| 18 to 34 Years | 216 (6.4%) | 48 (1.2%) |
| 35 to 64 Years | 562 (9.1%) | 577 (8.0%) |
| 65 to 74 Years | 326 (18.1%) | 299 (14.8%) |
| 75 Years and over | 350 (32.6%) | 473 (34.6%) |
Disability Class: Vision Difficulty
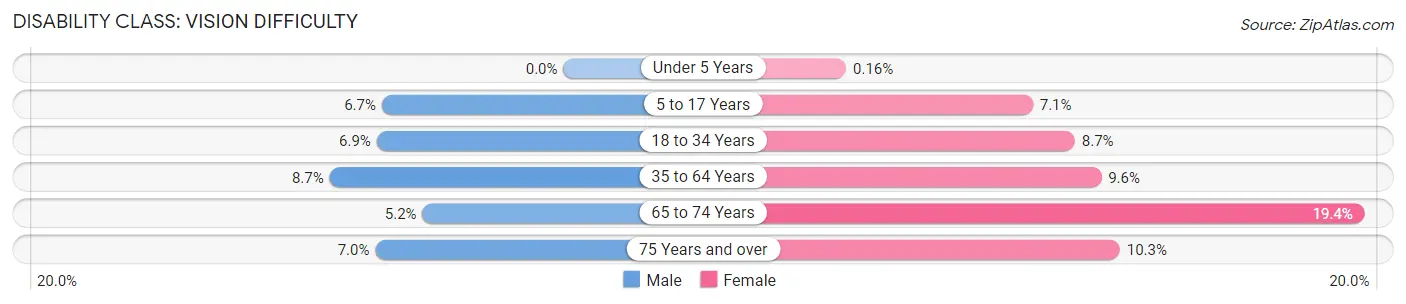
| Age Bracket | Male | Female |
| Under 5 Years | 0 (0.0%) | 2 (0.2%) |
| 5 to 17 Years | 235 (6.7%) | 233 (7.1%) |
| 18 to 34 Years | 234 (6.9%) | 339 (8.6%) |
| 35 to 64 Years | 538 (8.7%) | 699 (9.6%) |
| 65 to 74 Years | 94 (5.2%) | 393 (19.4%) |
| 75 Years and over | 75 (7.0%) | 141 (10.3%) |
Disability Class: Cognitive Difficulty
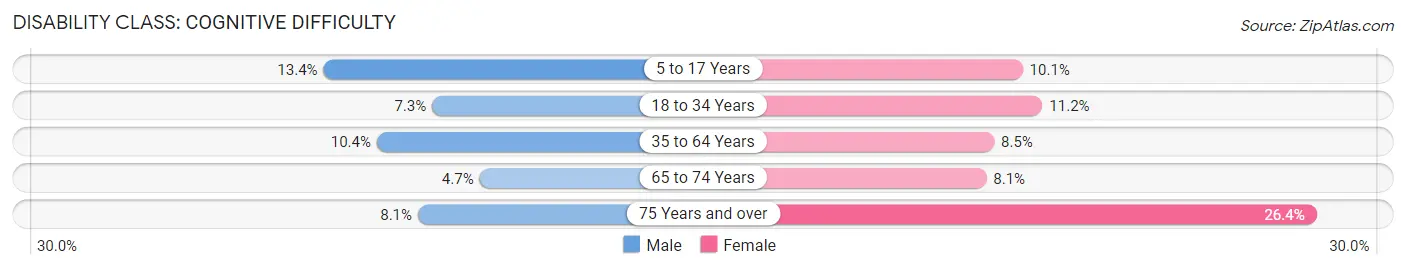
| Age Bracket | Male | Female |
| 5 to 17 Years | 466 (13.4%) | 331 (10.1%) |
| 18 to 34 Years | 247 (7.3%) | 438 (11.2%) |
| 35 to 64 Years | 644 (10.4%) | 616 (8.5%) |
| 65 to 74 Years | 84 (4.7%) | 163 (8.1%) |
| 75 Years and over | 87 (8.1%) | 361 (26.4%) |
Disability Class: Ambulatory Difficulty
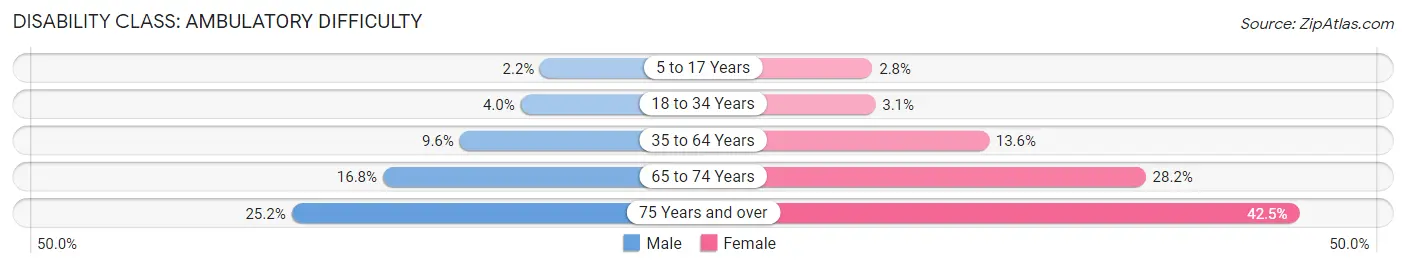
| Age Bracket | Male | Female |
| 5 to 17 Years | 75 (2.1%) | 93 (2.8%) |
| 18 to 34 Years | 134 (4.0%) | 122 (3.1%) |
| 35 to 64 Years | 597 (9.6%) | 990 (13.6%) |
| 65 to 74 Years | 301 (16.8%) | 571 (28.2%) |
| 75 Years and over | 271 (25.2%) | 580 (42.5%) |
Disability Class: Self-Care Difficulty
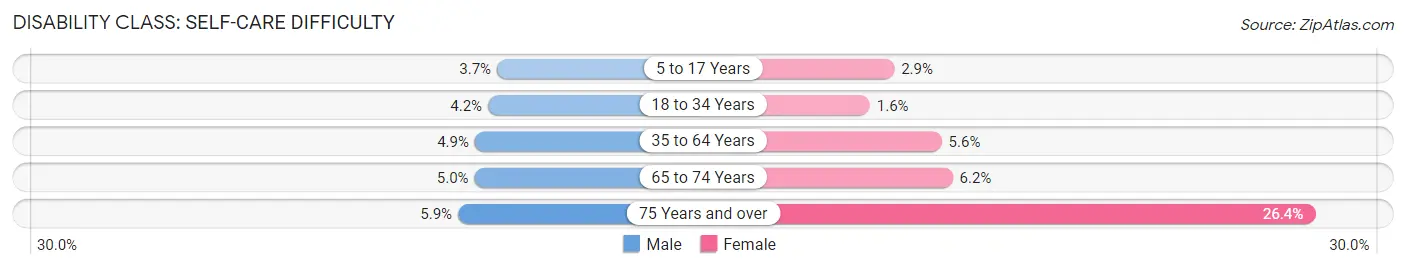
| Age Bracket | Male | Female |
| 5 to 17 Years | 129 (3.7%) | 96 (2.9%) |
| 18 to 34 Years | 142 (4.2%) | 61 (1.6%) |
| 35 to 64 Years | 306 (4.9%) | 404 (5.6%) |
| 65 to 74 Years | 89 (5.0%) | 125 (6.2%) |
| 75 Years and over | 63 (5.9%) | 360 (26.4%) |
Technology Access in Avoyelles Parish
Computing Device Access in Avoyelles Parish
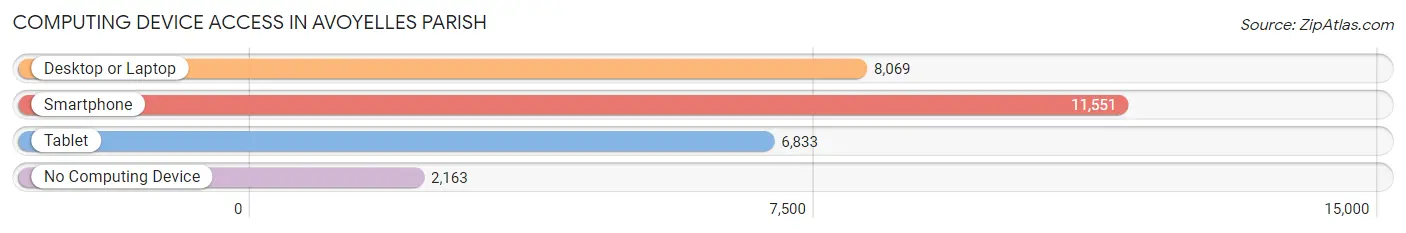
| Device Type | # Households | % Households |
| Desktop or Laptop | 8,069 | 55.3% |
| Smartphone | 11,551 | 79.1% |
| Tablet | 6,833 | 46.8% |
| No Computing Device | 2,163 | 14.8% |
| Total | 14,600 | 100.0% |
Internet Access in Avoyelles Parish

| Internet Type | # Households | % Households |
| Dial-Up Internet | 23 | 0.2% |
| Broadband Home | 6,744 | 46.2% |
| Cellular Data Only | 2,478 | 17.0% |
| Satellite Internet | 1,737 | 11.9% |
| No Internet | 3,748 | 25.7% |
| Total | 14,600 | 100.0% |
Avoyelles Parish Summary
Avoyelles Parish is located in the central region of Louisiana, and is part of the Alexandria metropolitan area. The parish is bordered by Rapides Parish to the north, Concordia Parish to the east, Pointe Coupee Parish to the south, and Catahoula Parish to the west. Avoyelles Parish is home to a population of approximately 42,000 people, and covers an area of 811 square miles.
History
Avoyelles Parish was established in 1807, and is named after the Avoyel Native American tribe. The parish was originally part of Rapides Parish, but was split off in 1807. The parish was originally home to a large population of French-speaking settlers, and the area was heavily influenced by French culture. The parish was also home to a large population of African-American slaves, who were brought to the area to work on the plantations.
During the Civil War, Avoyelles Parish was the site of several battles, including the Battle of Mansura in 1864. After the war, the parish was home to a large population of freed slaves, who established their own communities in the area.
Geography
Avoyelles Parish is located in the central region of Louisiana, and is part of the Alexandria metropolitan area. The parish is bordered by Rapides Parish to the north, Concordia Parish to the east, Pointe Coupee Parish to the south, and Catahoula Parish to the west. Avoyelles Parish is home to a population of approximately 42,000 people, and covers an area of 811 square miles.
The parish is located in the Mississippi River Delta region, and is home to a variety of wetlands and swamps. The parish is also home to several rivers, including the Red River, the Atchafalaya River, and the Bayou des Glaises. The parish is also home to several lakes, including Lake Ophelia, Lake Kincaid, and Lake Bistineau.
Economy
Avoyelles Parish is home to a variety of industries, including agriculture, manufacturing, and tourism. The parish is home to several large agricultural operations, including rice, soybeans, and cotton. The parish is also home to several manufacturing plants, including a paper mill and a chemical plant.
The parish is also home to a variety of tourist attractions, including the Marksville State Historic Site, the Tunica-Biloxi Indian Reservation, and the Tunica-Biloxi Cultural and Educational Center. The parish is also home to several casinos, including the Paragon Casino Resort and the Coushatta Casino Resort.
Demographics
As of the 2010 census, Avoyelles Parish had a population of 42,073 people. The racial makeup of the parish was 68.3% White, 28.2% African American, 0.5% Native American, 0.3% Asian, 0.1% Pacific Islander, 0.7% from other races, and 1.9% from two or more races. Hispanic or Latino of any race were 2.2% of the population.
The median income for a household in the parish was $35,945, and the median income for a family was $43,945. The per capita income for the parish was $17,845. About 17.2% of families and 21.3% of the population were below the poverty line, including 28.2% of those under age 18 and 17.2% of those age 65 or over.
Common Questions
What is the Total Population of Avoyelles Parish?
Total Population of Avoyelles Parish is 39,529.
What is the Total Male Population of Avoyelles Parish?
Total Male Population of Avoyelles Parish is 19,774.
What is the Total Female Population of Avoyelles Parish?
Total Female Population of Avoyelles Parish is 19,755.
What is the Ratio of Males per 100 Females in Avoyelles Parish?
There are 100.10 Males per 100 Females in Avoyelles Parish.
What is the Ratio of Females per 100 Males in Avoyelles Parish?
There are 99.90 Females per 100 Males in Avoyelles Parish.
What is the Median Population Age in Avoyelles Parish?
Median Population Age in Avoyelles Parish is 38.6 Years.
What is the Average Family Size in Avoyelles Parish
Average Family Size in Avoyelles Parish is 3.1 People.
What is the Average Household Size in Avoyelles Parish
Average Household Size in Avoyelles Parish is 2.5 People.
What is Per Capita Income in Avoyelles Parish?
Per Capita income in Avoyelles Parish is $23,597.
What is the Median Family Income in Avoyelles Parish?
Median Family Income in Avoyelles Parish is $48,982.
What is the Median Household income in Avoyelles Parish?
Median Household Income in Avoyelles Parish is $38,696.
What is Income or Wage Gap in Avoyelles Parish?
Income or Wage Gap in Avoyelles Parish is 33.3%.
Women in Avoyelles Parish earn 66.7 cents for every dollar earned by a man.
What is Family Income Deficit in Avoyelles Parish?
Family Income Deficit in Avoyelles Parish is $12,400.
Families that are below poverty line in Avoyelles Parish earn $12,400 less on average than the poverty threshold level.
What is Inequality or Gini Index in Avoyelles Parish?
Inequality or Gini Index in Avoyelles Parish is 0.51.
How Large is the Labor Force in Avoyelles Parish?
There are 16,163 People in the Labor Forcein in Avoyelles Parish.
What is the Percentage of People in the Labor Force in Avoyelles Parish?
51.6% of People are in the Labor Force in Avoyelles Parish.
What is the Unemployment Rate in Avoyelles Parish?
Unemployment Rate in Avoyelles Parish is 7.5%.