Assumption Parish, LA
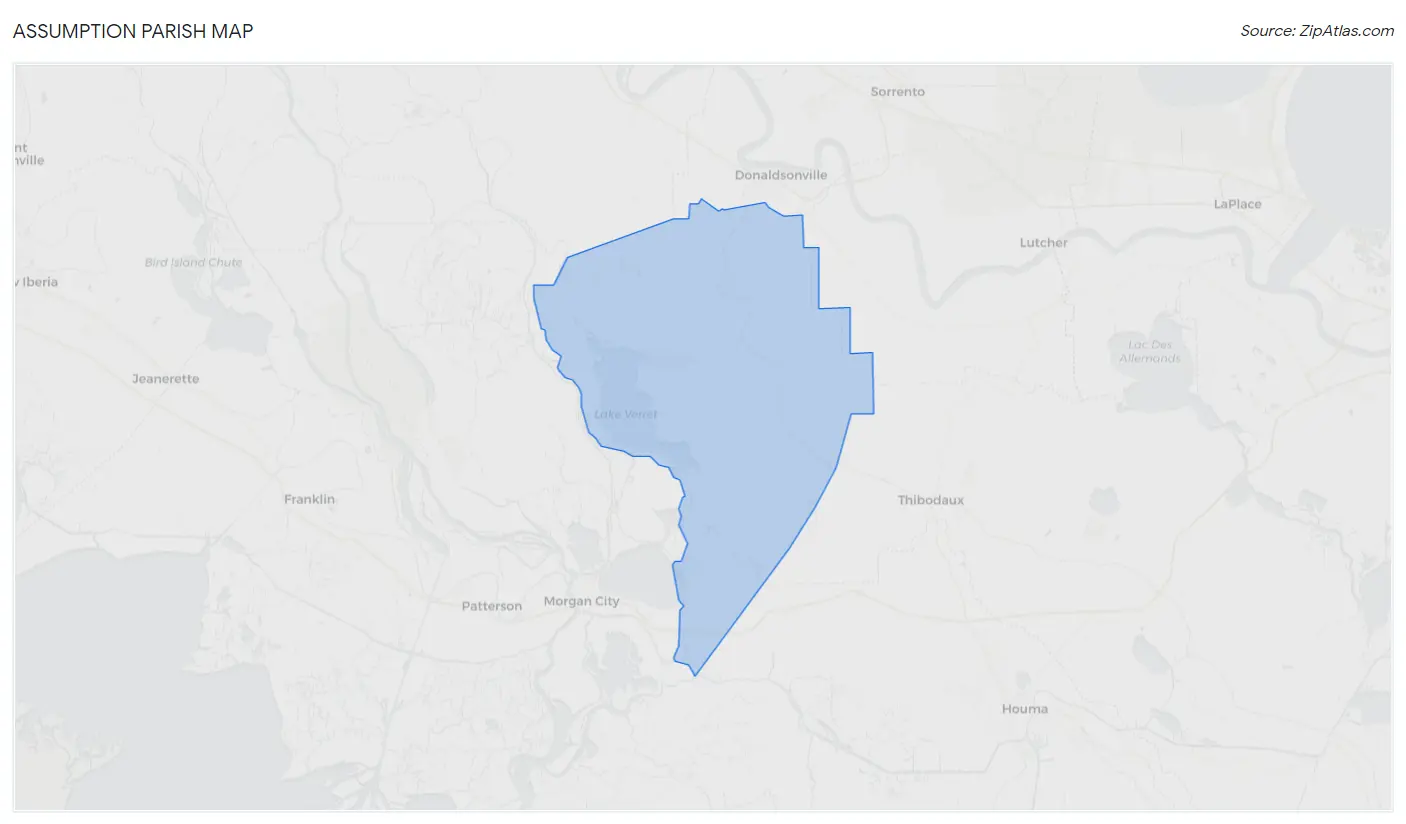
Assumption Parish Map
Assumption Parish Overview
21,067
TOTAL POPULATION
10,039
MALE POPULATION
11,028
FEMALE POPULATION
91.03
MALES / 100 FEMALES
109.85
FEMALES / 100 MALES
41.9
MEDIAN AGE
3.1
AVG FAMILY SIZE
2.5
AVG HOUSEHOLD SIZE
$28,758
PER CAPITA INCOME
$69,477
AVG FAMILY INCOME
$47,023
AVG HOUSEHOLD INCOME
47.9%
WAGE / INCOME GAP [ % ]
52.1¢/ $1
WAGE / INCOME GAP [ $ ]
$9,866
FAMILY INCOME DEFICIT
0.48
INEQUALITY / GINI INDEX
9,369
LABOR FORCE [ PEOPLE ]
54.4%
PERCENT IN LABOR FORCE
8.0%
UNEMPLOYMENT RATE
Race in Assumption Parish
The most populous races in Assumption Parish are White / Caucasian (13,836 | 65.7%), Black / African American (6,091 | 28.9%), and Two or more Races (938 | 4.4%).
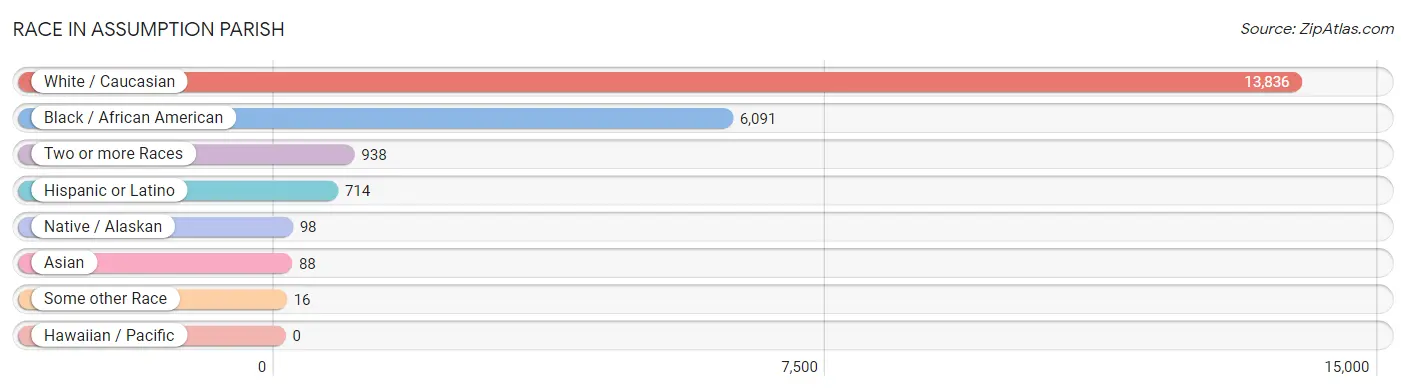
| Race | # Population | % Population |
| Asian | 88 | 0.4% |
| Black / African American | 6,091 | 28.9% |
| Hawaiian / Pacific | 0 | 0.0% |
| Hispanic or Latino | 714 | 3.4% |
| Native / Alaskan | 98 | 0.5% |
| White / Caucasian | 13,836 | 65.7% |
| Two or more Races | 938 | 4.4% |
| Some other Race | 16 | 0.1% |
| Total | 21,067 | 100.0% |
Ancestry in Assumption Parish
The most populous ancestries reported in Assumption Parish are French (3,601 | 17.1%), American (1,530 | 7.3%), French Canadian (1,033 | 4.9%), German (925 | 4.4%), and English (666 | 3.2%), together accounting for 36.8% of all Assumption Parish residents.
| Ancestry | # Population | % Population |
| African | 41 | 0.2% |
| American | 1,530 | 7.3% |
| Arab | 153 | 0.7% |
| Belgian | 9 | 0.0% |
| British | 107 | 0.5% |
| Cajun | 622 | 2.9% |
| Canadian | 2 | 0.0% |
| Central American | 12 | 0.1% |
| Cherokee | 21 | 0.1% |
| Chippewa | 9 | 0.0% |
| Choctaw | 9 | 0.0% |
| Danish | 11 | 0.1% |
| English | 666 | 3.2% |
| European | 24 | 0.1% |
| French | 3,601 | 17.1% |
| French Canadian | 1,033 | 4.9% |
| German | 925 | 4.4% |
| Houma | 45 | 0.2% |
| Hungarian | 20 | 0.1% |
| Irish | 481 | 2.3% |
| Italian | 402 | 1.9% |
| Korean | 189 | 0.9% |
| Mexican | 60 | 0.3% |
| Northern European | 64 | 0.3% |
| Norwegian | 25 | 0.1% |
| Polish | 10 | 0.1% |
| Portuguese | 60 | 0.3% |
| Scotch-Irish | 23 | 0.1% |
| Scottish | 76 | 0.4% |
| Spaniard | 2 | 0.0% |
| Spanish | 533 | 2.5% |
| Sri Lankan | 80 | 0.4% |
| Subsaharan African | 41 | 0.2% |
| Swedish | 9 | 0.0% |
| Thai | 8 | 0.0% | View All 35 Rows |
Immigrants in Assumption Parish
The most numerous immigrant groups reported in Assumption Parish came from Asia (249 | 1.2%), Western Asia (153 | 0.7%), Yemen (153 | 0.7%), South Eastern Asia (80 | 0.4%), and Vietnam (80 | 0.4%), together accounting for 3.4% of all Assumption Parish residents.
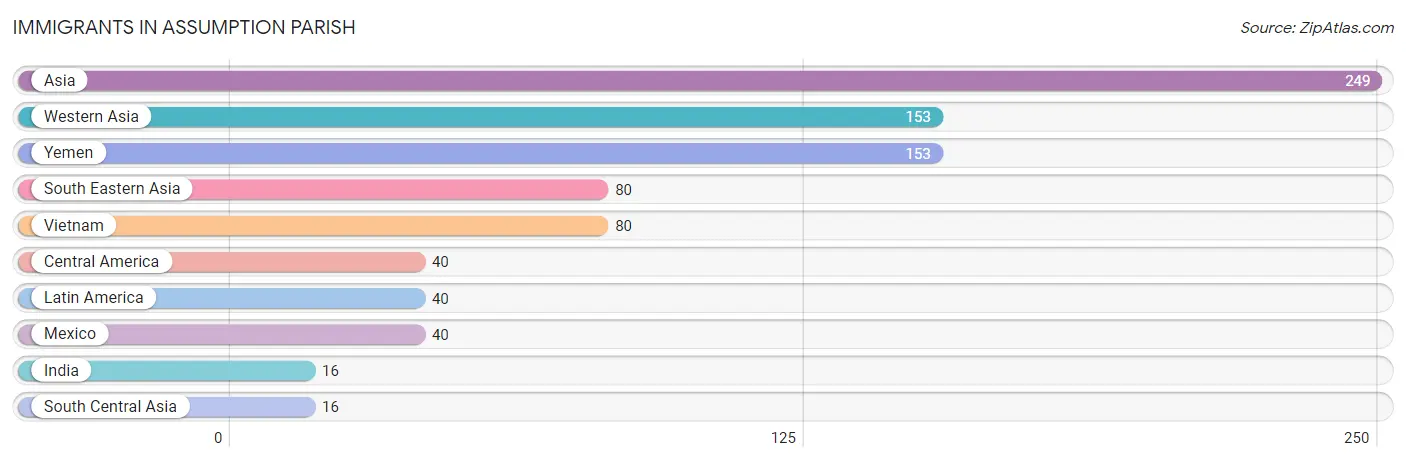
| Immigration Origin | # Population | % Population |
| Asia | 249 | 1.2% |
| Central America | 40 | 0.2% |
| India | 16 | 0.1% |
| Latin America | 40 | 0.2% |
| Mexico | 40 | 0.2% |
| South Central Asia | 16 | 0.1% |
| South Eastern Asia | 80 | 0.4% |
| Vietnam | 80 | 0.4% |
| Western Asia | 153 | 0.7% |
| Yemen | 153 | 0.7% | View All 10 Rows |
Sex and Age in Assumption Parish
Sex and Age in Assumption Parish
The most populous age groups in Assumption Parish are 10 to 14 Years (818 | 8.2%) for men and 55 to 59 Years (861 | 7.8%) for women.

| Age Bracket | Male | Female |
| Under 5 Years | 498 (5.0%) | 616 (5.6%) |
| 5 to 9 Years | 364 (3.6%) | 582 (5.3%) |
| 10 to 14 Years | 818 (8.2%) | 770 (7.0%) |
| 15 to 19 Years | 671 (6.7%) | 667 (6.0%) |
| 20 to 24 Years | 687 (6.8%) | 611 (5.5%) |
| 25 to 29 Years | 520 (5.2%) | 595 (5.4%) |
| 30 to 34 Years | 503 (5.0%) | 609 (5.5%) |
| 35 to 39 Years | 744 (7.4%) | 585 (5.3%) |
| 40 to 44 Years | 494 (4.9%) | 716 (6.5%) |
| 45 to 49 Years | 667 (6.6%) | 690 (6.3%) |
| 50 to 54 Years | 667 (6.6%) | 776 (7.0%) |
| 55 to 59 Years | 703 (7.0%) | 861 (7.8%) |
| 60 to 64 Years | 717 (7.1%) | 846 (7.7%) |
| 65 to 69 Years | 758 (7.5%) | 610 (5.5%) |
| 70 to 74 Years | 538 (5.4%) | 528 (4.8%) |
| 75 to 79 Years | 376 (3.7%) | 508 (4.6%) |
| 80 to 84 Years | 191 (1.9%) | 205 (1.9%) |
| 85 Years and over | 123 (1.2%) | 253 (2.3%) |
| Total | 10,039 (100.0%) | 11,028 (100.0%) |
Families and Households in Assumption Parish
Median Family Size in Assumption Parish
The median family size in Assumption Parish is 3.15 persons per family, with single female/mother families (1,166 | 21.0%) accounting for the largest median family size of 3.58 persons per family. On the other hand, married-couple families (4,096 | 73.7%) represent the smallest median family size with 3.03 persons per family.
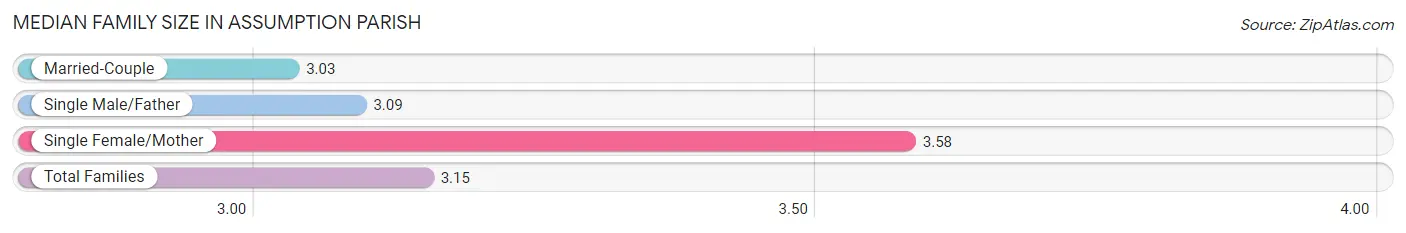
| Family Type | # Families | Family Size |
| Married-Couple | 4,096 (73.7%) | 3.03 |
| Single Male/Father | 299 (5.4%) | 3.09 |
| Single Female/Mother | 1,166 (21.0%) | 3.58 |
| Total Families | 5,561 (100.0%) | 3.15 |
Median Household Size in Assumption Parish
The median household size in Assumption Parish is 2.50 persons per household, with single female/mother households (1,166 | 13.9%) accounting for the largest median household size of 3.69 persons per household. non-family households (2,807 | 33.5%) represent the smallest median household size with 1.14 persons per household.
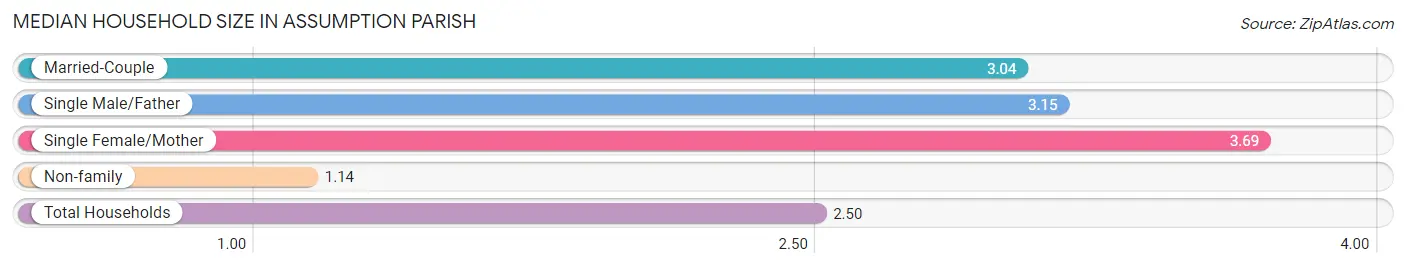
| Household Type | # Households | Household Size |
| Married-Couple | 4,096 (48.9%) | 3.04 |
| Single Male/Father | 299 (3.6%) | 3.15 |
| Single Female/Mother | 1,166 (13.9%) | 3.69 |
| Non-family | 2,807 (33.5%) | 1.14 |
| Total Households | 8,368 (100.0%) | 2.50 |
Household Size by Marriage Status in Assumption Parish
Out of a total of 8,368 households in Assumption Parish, 5,561 (66.5%) are family households, while 2,807 (33.5%) are nonfamily households. The most numerous type of family households are 2-person households, comprising 2,496, and the most common type of nonfamily households are 1-person households, comprising 2,397.
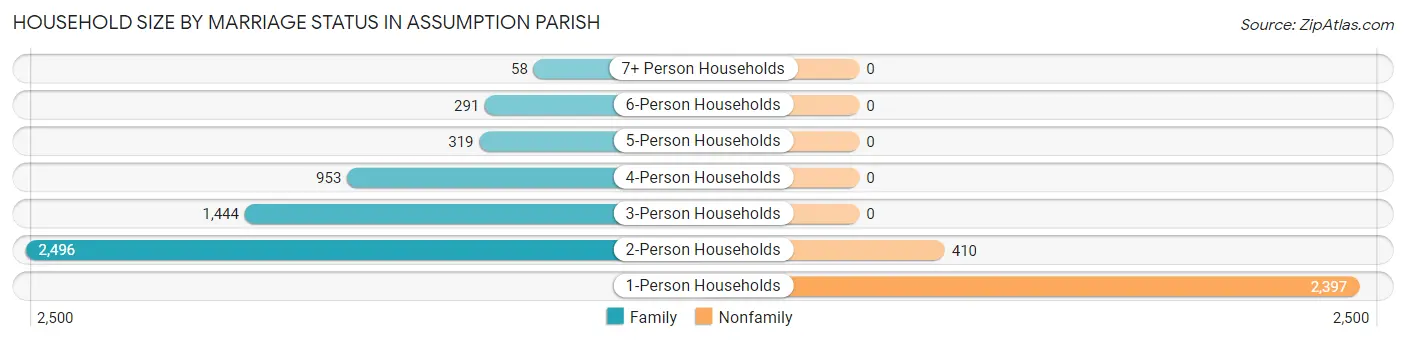
| Household Size | Family Households | Nonfamily Households |
| 1-Person Households | - | 2,397 (28.6%) |
| 2-Person Households | 2,496 (29.8%) | 410 (4.9%) |
| 3-Person Households | 1,444 (17.3%) | 0 (0.0%) |
| 4-Person Households | 953 (11.4%) | 0 (0.0%) |
| 5-Person Households | 319 (3.8%) | 0 (0.0%) |
| 6-Person Households | 291 (3.5%) | 0 (0.0%) |
| 7+ Person Households | 58 (0.7%) | 0 (0.0%) |
| Total | 5,561 (66.5%) | 2,807 (33.5%) |
Female Fertility in Assumption Parish
Fertility by Age in Assumption Parish
Average fertility rate in Assumption Parish is 38.0 births per 1,000 women. Women in the age bracket of 35 to 50 years have the highest fertility rate with 70.0 births per 1,000 women. Women in the age bracket of 35 to 50 years acount for 84.1% of all women with births.
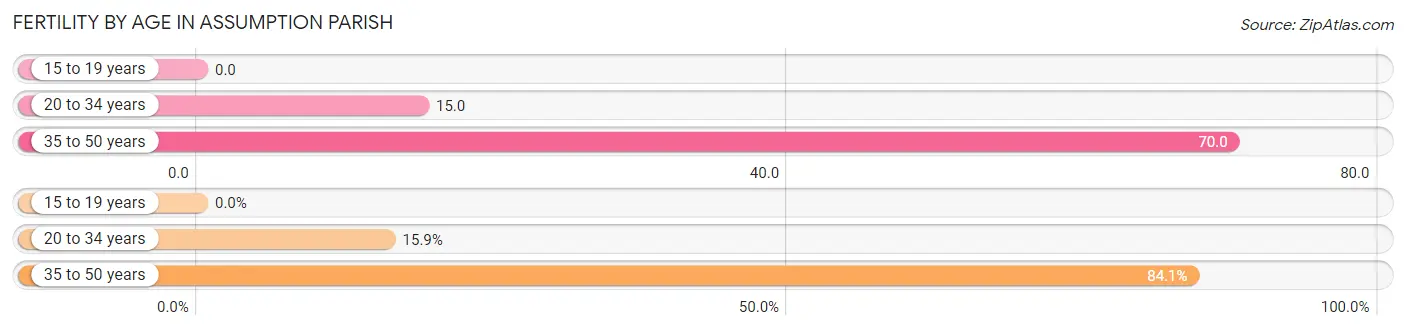
| Age Bracket | Women with Births | Births / 1,000 Women |
| 15 to 19 years | 0 (0.0%) | 0.0 |
| 20 to 34 years | 28 (15.9%) | 15.0 |
| 35 to 50 years | 148 (84.1%) | 70.0 |
| Total | 176 (100.0%) | 38.0 |
Fertility by Age by Marriage Status in Assumption Parish
72.7% of women with births (176) in Assumption Parish are married. The highest percentage of unmarried women with births falls into 35 to 50 years age bracket with 32.4% of them unmarried at the time of birth, while the lowest percentage of unmarried women with births belong to 20 to 34 years age bracket with 0.0% of them unmarried.
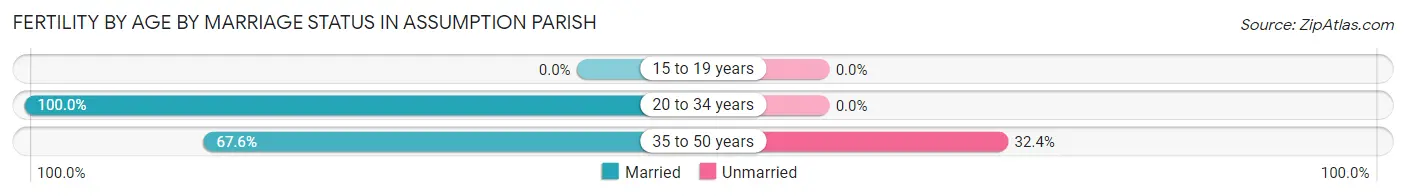
| Age Bracket | Married | Unmarried |
| 15 to 19 years | 0 (0.0%) | 0 (0.0%) |
| 20 to 34 years | 28 (100.0%) | 0 (0.0%) |
| 35 to 50 years | 100 (67.6%) | 48 (32.4%) |
| Total | 128 (72.7%) | 48 (27.3%) |
Fertility by Education in Assumption Parish
Average fertility rate in Assumption Parish is 38.0 births per 1,000 women. Women with the education attainment of bachelor's degree have the highest fertility rate of 79.0 births per 1,000 women, while women with the education attainment of graduate degree have the lowest fertility at 13.0 births per 1,000 women. Women with the education attainment of high school diploma represent 34.1% of all women with births.

| Educational Attainment | Women with Births | Births / 1,000 Women |
| Less than High School | 30 (17.1%) | 35.0 |
| High School Diploma | 60 (34.1%) | 44.0 |
| College or Associate's Degree | 24 (13.6%) | 18.0 |
| Bachelor's Degree | 58 (33.0%) | 79.0 |
| Graduate Degree | 4 (2.3%) | 13.0 |
| Total | 176 (100.0%) | 38.0 |
Fertility by Education by Marriage Status in Assumption Parish
27.3% of women with births in Assumption Parish are unmarried. Women with the educational attainment of less than high school are most likely to be married with 100.0% of them married at childbirth, while women with the educational attainment of bachelor's degree are least likely to be married with 82.8% of them unmarried at childbirth.
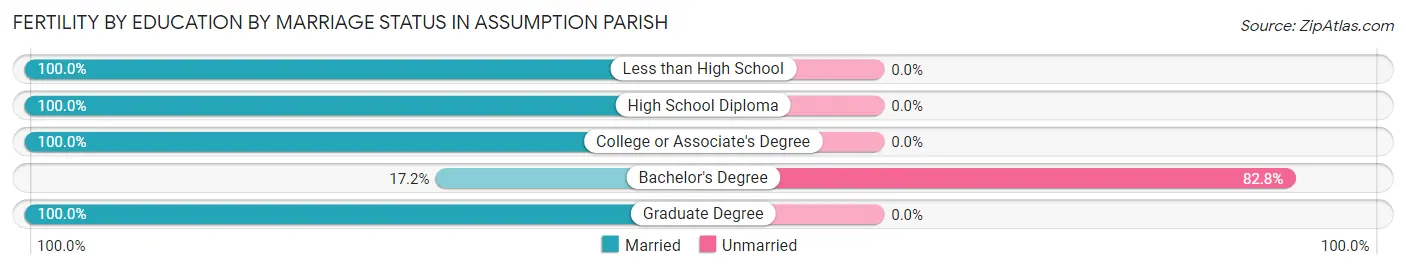
| Educational Attainment | Married | Unmarried |
| Less than High School | 30 (100.0%) | 0 (0.0%) |
| High School Diploma | 60 (100.0%) | 0 (0.0%) |
| College or Associate's Degree | 24 (100.0%) | 0 (0.0%) |
| Bachelor's Degree | 10 (17.2%) | 48 (82.8%) |
| Graduate Degree | 4 (100.0%) | 0 (0.0%) |
| Total | 128 (72.7%) | 48 (27.3%) |
Income in Assumption Parish
Income Overview in Assumption Parish
Per Capita Income in Assumption Parish is $28,758, while median incomes of families and households are $69,477 and $47,023 respectively.
| Characteristic | Number | Measure |
| Per Capita Income | 21,067 | $28,758 |
| Median Family Income | 5,561 | $69,477 |
| Mean Family Income | 5,561 | $90,913 |
| Median Household Income | 8,368 | $47,023 |
| Mean Household Income | 8,368 | $71,916 |
| Income Deficit | 5,561 | $9,866 |
| Wage / Income Gap (%) | 21,067 | 47.89% |
| Wage / Income Gap ($) | 21,067 | 52.11¢ per $1 |
| Gini / Inequality Index | 21,067 | 0.48 |
Earnings by Sex in Assumption Parish
Average Earnings in Assumption Parish are $40,424, $49,846 for men and $25,973 for women, a difference of 47.9%.
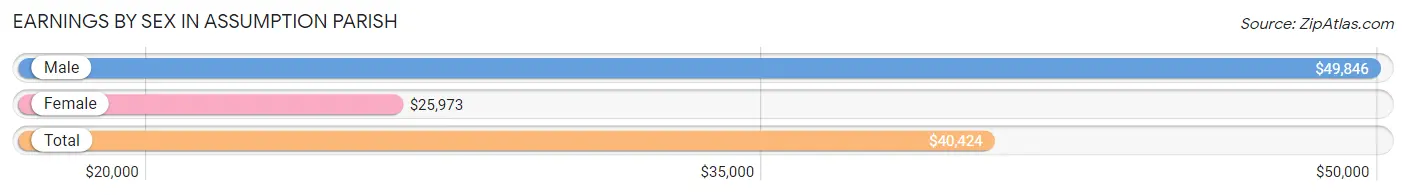
| Sex | Number | Average Earnings |
| Male | 4,882 (51.3%) | $49,846 |
| Female | 4,628 (48.7%) | $25,973 |
| Total | 9,510 (100.0%) | $40,424 |
Earnings by Sex by Income Bracket in Assumption Parish
The most common earnings brackets in Assumption Parish are $100,000+ for men (934 | 19.1%) and $45,000 to $49,999 for women (419 | 9.0%).
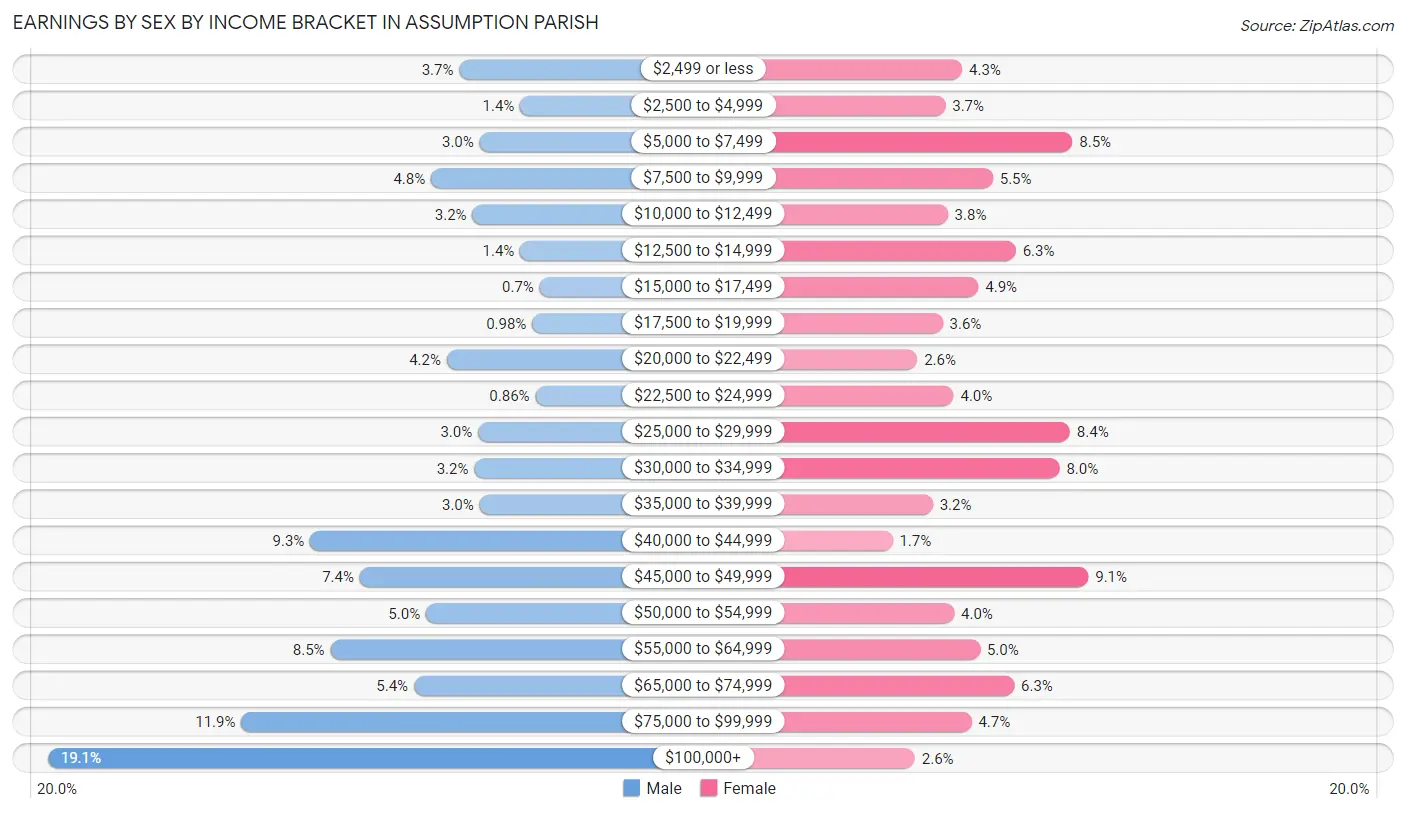
| Income | Male | Female |
| $2,499 or less | 181 (3.7%) | 200 (4.3%) |
| $2,500 to $4,999 | 70 (1.4%) | 171 (3.7%) |
| $5,000 to $7,499 | 144 (2.9%) | 391 (8.5%) |
| $7,500 to $9,999 | 233 (4.8%) | 253 (5.5%) |
| $10,000 to $12,499 | 157 (3.2%) | 175 (3.8%) |
| $12,500 to $14,999 | 70 (1.4%) | 293 (6.3%) |
| $15,000 to $17,499 | 34 (0.7%) | 228 (4.9%) |
| $17,500 to $19,999 | 48 (1.0%) | 166 (3.6%) |
| $20,000 to $22,499 | 204 (4.2%) | 122 (2.6%) |
| $22,500 to $24,999 | 42 (0.9%) | 185 (4.0%) |
| $25,000 to $29,999 | 147 (3.0%) | 387 (8.4%) |
| $30,000 to $34,999 | 154 (3.2%) | 369 (8.0%) |
| $35,000 to $39,999 | 144 (2.9%) | 149 (3.2%) |
| $40,000 to $44,999 | 454 (9.3%) | 79 (1.7%) |
| $45,000 to $49,999 | 363 (7.4%) | 419 (9.0%) |
| $50,000 to $54,999 | 242 (5.0%) | 186 (4.0%) |
| $55,000 to $64,999 | 417 (8.5%) | 231 (5.0%) |
| $65,000 to $74,999 | 264 (5.4%) | 290 (6.3%) |
| $75,000 to $99,999 | 580 (11.9%) | 216 (4.7%) |
| $100,000+ | 934 (19.1%) | 118 (2.5%) |
| Total | 4,882 (100.0%) | 4,628 (100.0%) |
Earnings by Sex by Educational Attainment in Assumption Parish
Average earnings in Assumption Parish are $54,042 for men and $30,144 for women, a difference of 44.2%. Men with an educational attainment of bachelor's degree enjoy the highest average annual earnings of $116,442, while those with less than high school education earn the least with $41,846. Women with an educational attainment of graduate degree earn the most with the average annual earnings of $50,000, while those with less than high school education have the smallest earnings of $16,806.
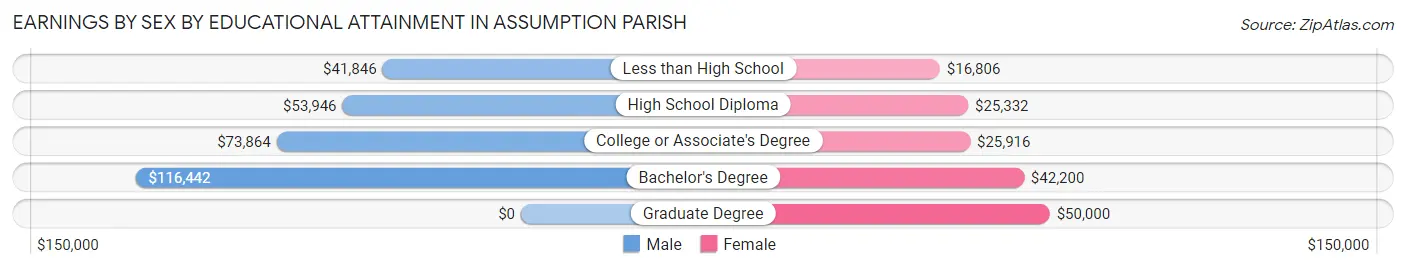
| Educational Attainment | Male Income | Female Income |
| Less than High School | $41,846 | $16,806 |
| High School Diploma | $53,946 | $25,332 |
| College or Associate's Degree | $73,864 | $25,916 |
| Bachelor's Degree | $116,442 | $42,200 |
| Graduate Degree | - | - |
| Total | $54,042 | $30,144 |
Family Income in Assumption Parish
Family Income Brackets in Assumption Parish
According to the Assumption Parish family income data, there are 1,079 families falling into the $100,000 to $149,999 income range, which is the most common income bracket and makes up 19.4% of all families. Conversely, the $10,000 to $14,999 income bracket is the least frequent group with only 111 families (2.0%) belonging to this category.
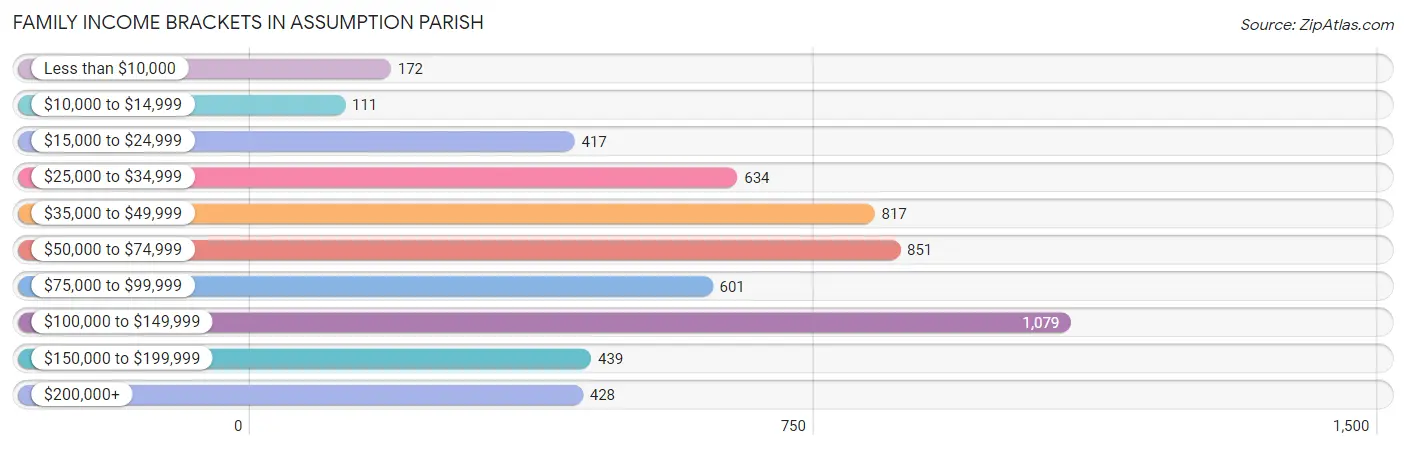
| Income Bracket | # Families | % Families |
| Less than $10,000 | 172 | 3.1% |
| $10,000 to $14,999 | 111 | 2.0% |
| $15,000 to $24,999 | 417 | 7.5% |
| $25,000 to $34,999 | 634 | 11.4% |
| $35,000 to $49,999 | 817 | 14.7% |
| $50,000 to $74,999 | 851 | 15.3% |
| $75,000 to $99,999 | 601 | 10.8% |
| $100,000 to $149,999 | 1,079 | 19.4% |
| $150,000 to $199,999 | 439 | 7.9% |
| $200,000+ | 428 | 7.7% |
Family Income by Famaliy Size in Assumption Parish
5-person families (306 | 5.5%) account for the highest median family income in Assumption Parish with $138,393 per family, while 2-person families (2,592 | 46.6%) have the highest median income of $27,744 per family member.
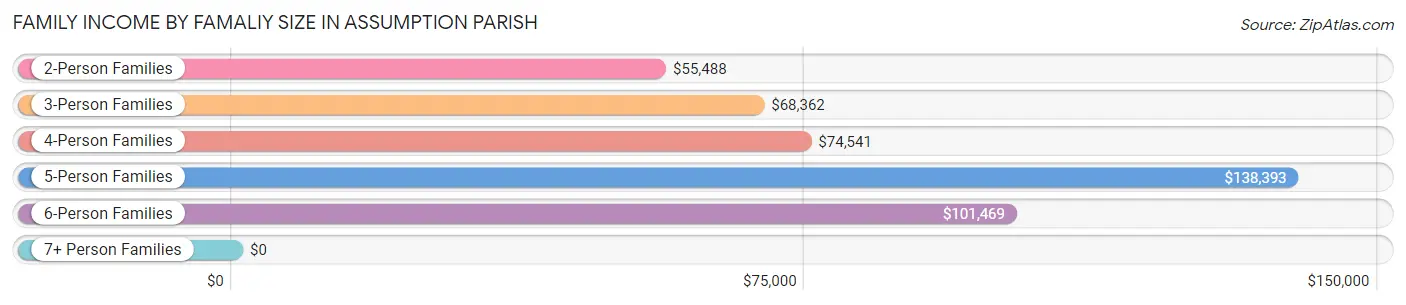
| Income Bracket | # Families | Median Income |
| 2-Person Families | 2,592 (46.6%) | $55,488 |
| 3-Person Families | 1,413 (25.4%) | $68,362 |
| 4-Person Families | 901 (16.2%) | $74,541 |
| 5-Person Families | 306 (5.5%) | $138,393 |
| 6-Person Families | 291 (5.2%) | $101,469 |
| 7+ Person Families | 58 (1.0%) | $0 |
| Total | 5,561 (100.0%) | $69,477 |
Family Income by Number of Earners in Assumption Parish
The median family income in Assumption Parish is $69,477, with families comprising 3+ earners (462) having the highest median family income of $136,154, while families with no earners (1,173) have the lowest median family income of $33,718, accounting for 8.3% and 21.1% of families, respectively.
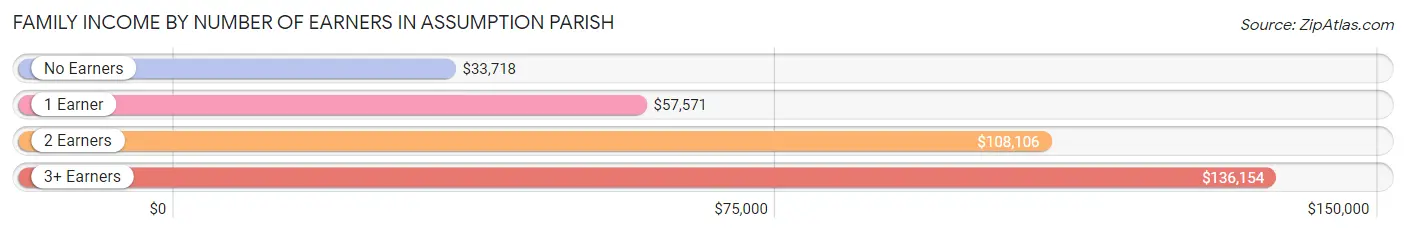
| Number of Earners | # Families | Median Income |
| No Earners | 1,173 (21.1%) | $33,718 |
| 1 Earner | 1,924 (34.6%) | $57,571 |
| 2 Earners | 2,002 (36.0%) | $108,106 |
| 3+ Earners | 462 (8.3%) | $136,154 |
| Total | 5,561 (100.0%) | $69,477 |
Household Income in Assumption Parish
Household Income Brackets in Assumption Parish
With 1,331 households falling in the category, the $35,000 to $49,999 income range is the most frequent in Assumption Parish, accounting for 15.9% of all households. In contrast, only 435 households (5.2%) fall into the $200,000+ income bracket, making it the least populous group.
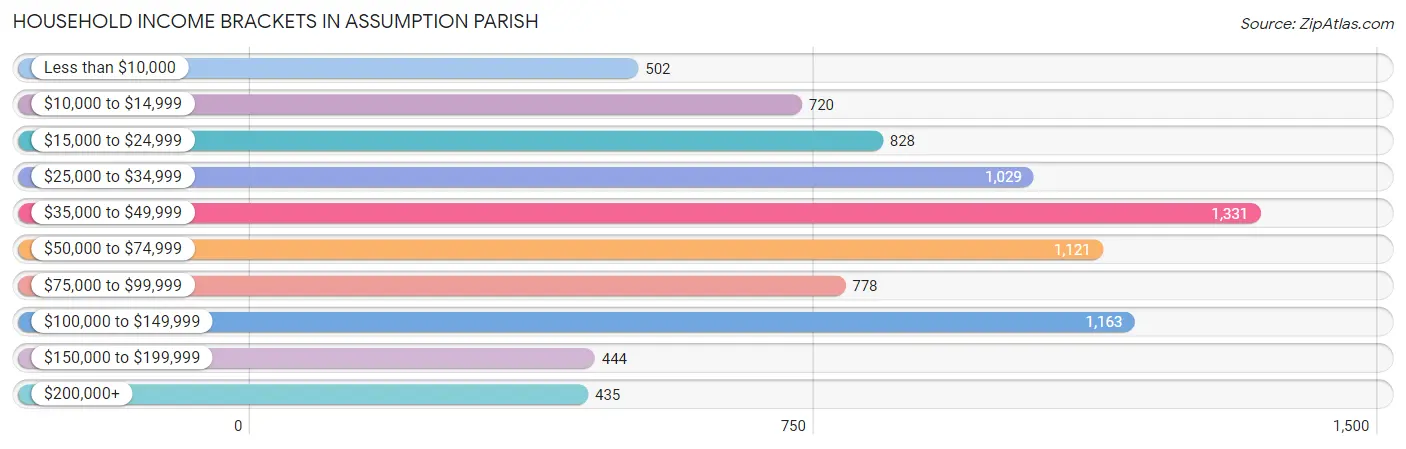
| Income Bracket | # Households | % Households |
| Less than $10,000 | 502 | 6.0% |
| $10,000 to $14,999 | 720 | 8.6% |
| $15,000 to $24,999 | 828 | 9.9% |
| $25,000 to $34,999 | 1,029 | 12.3% |
| $35,000 to $49,999 | 1,331 | 15.9% |
| $50,000 to $74,999 | 1,121 | 13.4% |
| $75,000 to $99,999 | 778 | 9.3% |
| $100,000 to $149,999 | 1,163 | 13.9% |
| $150,000 to $199,999 | 444 | 5.3% |
| $200,000+ | 435 | 5.2% |
Household Income by Householder Age in Assumption Parish
The median household income in Assumption Parish is $47,023, with the highest median household income of $75,060 found in the 25 to 44 years age bracket for the primary householder. A total of 2,067 households (24.7%) fall into this category. Meanwhile, the 15 to 24 years age bracket for the primary householder has the lowest median household income of $0, with 307 households (3.7%) in this group.
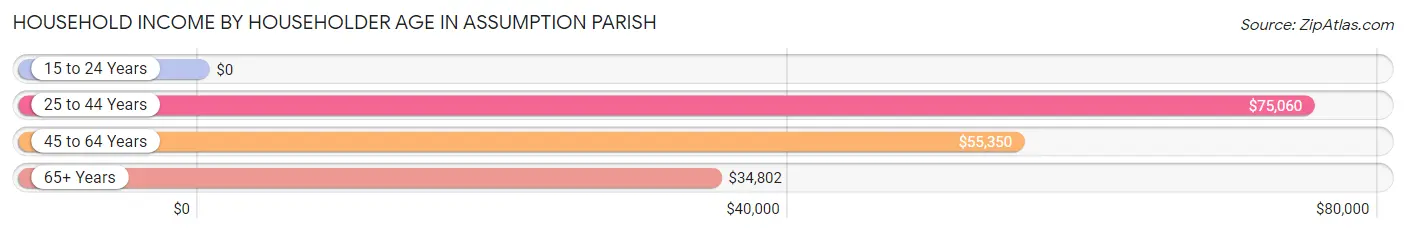
| Income Bracket | # Households | Median Income |
| 15 to 24 Years | 307 (3.7%) | $0 |
| 25 to 44 Years | 2,067 (24.7%) | $75,060 |
| 45 to 64 Years | 3,481 (41.6%) | $55,350 |
| 65+ Years | 2,513 (30.0%) | $34,802 |
| Total | 8,368 (100.0%) | $47,023 |
Poverty in Assumption Parish
Income Below Poverty by Sex and Age in Assumption Parish
With 13.5% poverty level for males and 18.3% for females among the residents of Assumption Parish, 15 year old males and 18 to 24 year old females are the most vulnerable to poverty, with 65 males (43.9%) and 361 females (40.6%) in their respective age groups living below the poverty level.
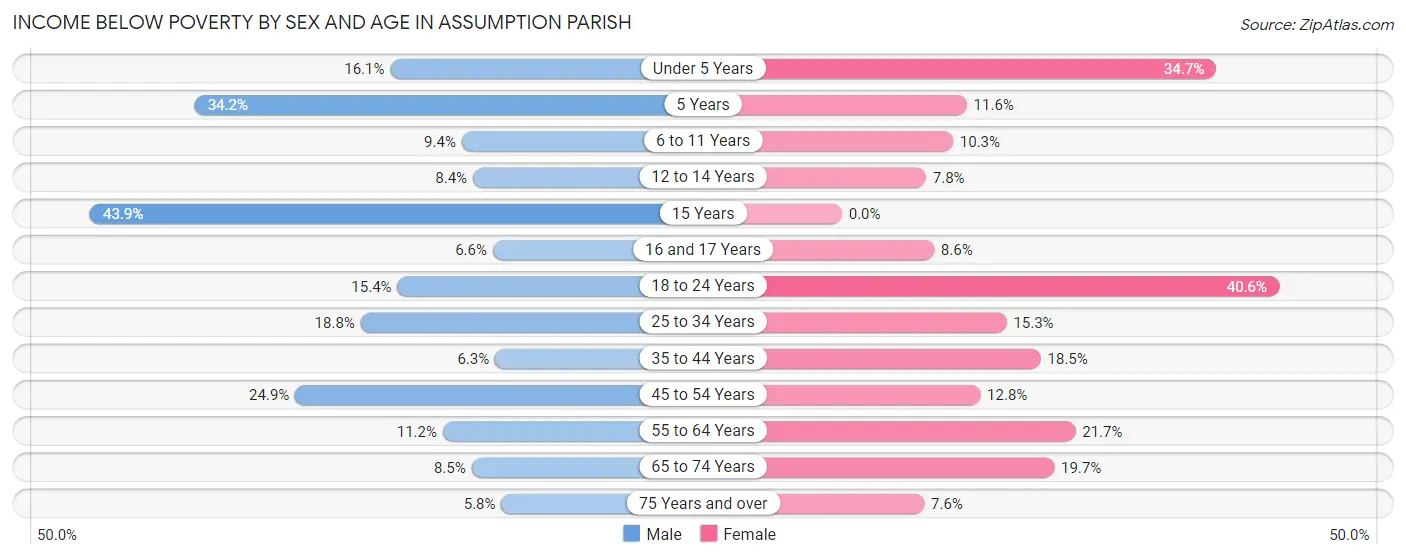
| Age Bracket | Male | Female |
| Under 5 Years | 80 (16.1%) | 214 (34.7%) |
| 5 Years | 39 (34.2%) | 8 (11.6%) |
| 6 to 11 Years | 58 (9.4%) | 90 (10.3%) |
| 12 to 14 Years | 38 (8.4%) | 32 (7.8%) |
| 15 Years | 65 (43.9%) | 0 (0.0%) |
| 16 and 17 Years | 15 (6.6%) | 29 (8.6%) |
| 18 to 24 Years | 148 (15.4%) | 361 (40.6%) |
| 25 to 34 Years | 187 (18.8%) | 184 (15.3%) |
| 35 to 44 Years | 77 (6.3%) | 240 (18.4%) |
| 45 to 54 Years | 330 (24.9%) | 188 (12.8%) |
| 55 to 64 Years | 158 (11.2%) | 369 (21.7%) |
| 65 to 74 Years | 110 (8.5%) | 223 (19.7%) |
| 75 Years and over | 39 (5.8%) | 72 (7.6%) |
| Total | 1,344 (13.5%) | 2,010 (18.3%) |
Income Above Poverty by Sex and Age in Assumption Parish
According to the poverty statistics in Assumption Parish, males aged 75 years and over and females aged 15 years are the age groups that are most secure financially, with 94.3% of males and 100.0% of females in these age groups living above the poverty line.
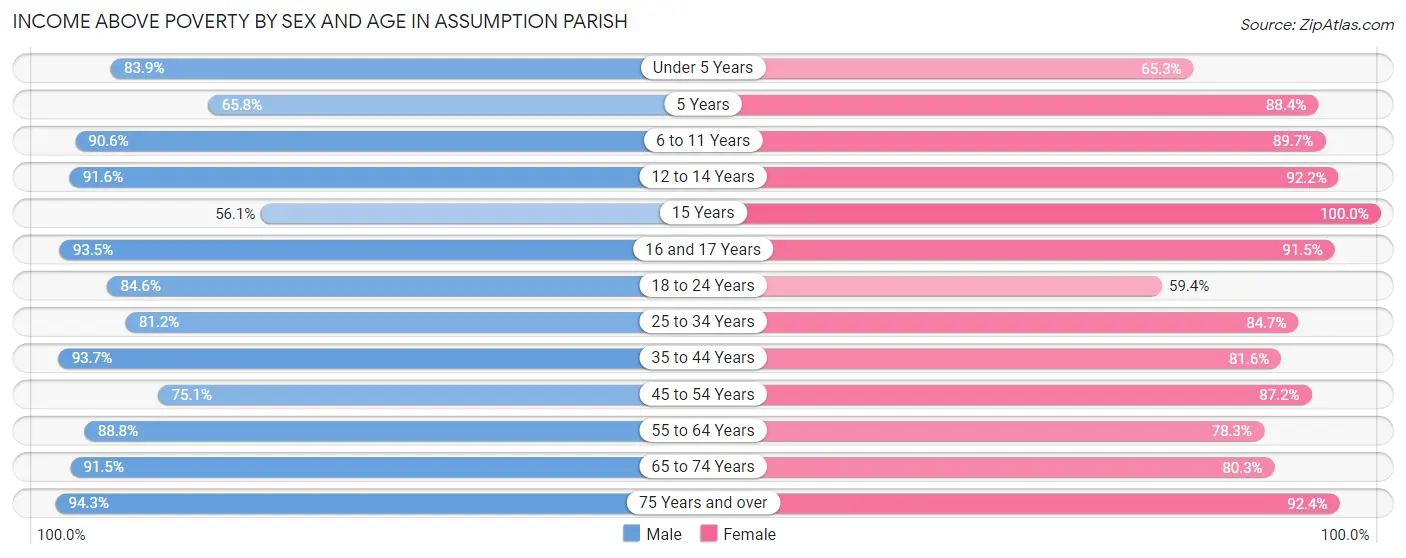
| Age Bracket | Male | Female |
| Under 5 Years | 418 (83.9%) | 402 (65.3%) |
| 5 Years | 75 (65.8%) | 61 (88.4%) |
| 6 to 11 Years | 557 (90.6%) | 783 (89.7%) |
| 12 to 14 Years | 415 (91.6%) | 378 (92.2%) |
| 15 Years | 83 (56.1%) | 49 (100.0%) |
| 16 and 17 Years | 214 (93.4%) | 310 (91.4%) |
| 18 to 24 Years | 813 (84.6%) | 529 (59.4%) |
| 25 to 34 Years | 807 (81.2%) | 1,020 (84.7%) |
| 35 to 44 Years | 1,137 (93.7%) | 1,061 (81.6%) |
| 45 to 54 Years | 996 (75.1%) | 1,276 (87.2%) |
| 55 to 64 Years | 1,254 (88.8%) | 1,334 (78.3%) |
| 65 to 74 Years | 1,181 (91.5%) | 909 (80.3%) |
| 75 Years and over | 639 (94.3%) | 870 (92.4%) |
| Total | 8,589 (86.5%) | 8,982 (81.7%) |
Income Below Poverty Among Married-Couple Families in Assumption Parish
The poverty statistics for married-couple families in Assumption Parish show that 8.6% or 353 of the total 4,096 families live below the poverty line. Families with 1 or 2 children have the highest poverty rate of 11.0%, comprising of 143 families. On the other hand, families with 3 or 4 children have the lowest poverty rate of 5.6%, which includes 14 families.
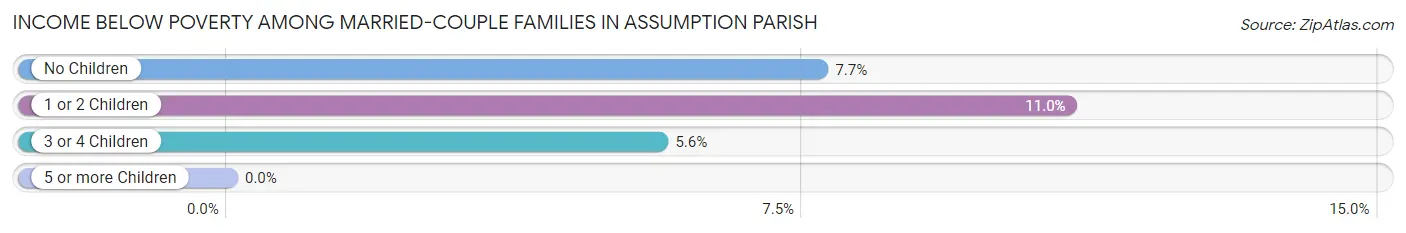
| Children | Above Poverty | Below Poverty |
| No Children | 2,346 (92.3%) | 196 (7.7%) |
| 1 or 2 Children | 1,162 (89.0%) | 143 (11.0%) |
| 3 or 4 Children | 235 (94.4%) | 14 (5.6%) |
| 5 or more Children | 0 (0.0%) | 0 (0.0%) |
| Total | 3,743 (91.4%) | 353 (8.6%) |
Income Below Poverty Among Single-Parent Households in Assumption Parish
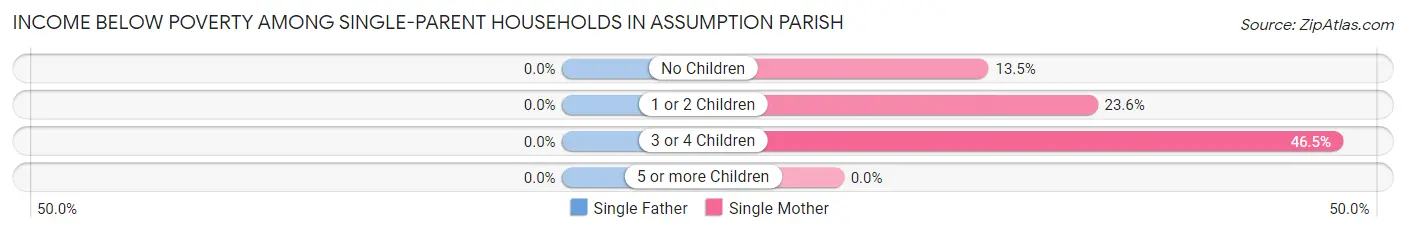
| Children | Single Father | Single Mother |
| No Children | 0 (0.0%) | 41 (13.5%) |
| 1 or 2 Children | 0 (0.0%) | 187 (23.6%) |
| 3 or 4 Children | 0 (0.0%) | 33 (46.5%) |
| 5 or more Children | 0 (0.0%) | 0 (0.0%) |
| Total | 0 (0.0%) | 261 (22.4%) |
Income Below Poverty Among Married-Couple vs Single-Parent Households in Assumption Parish
The poverty data for Assumption Parish shows that 353 of the married-couple family households (8.6%) and 261 of the single-parent households (17.8%) are living below the poverty level. Within the married-couple family households, those with 1 or 2 children have the highest poverty rate, with 143 households (11.0%) falling below the poverty line. Among the single-parent households, those with 3 or 4 children have the highest poverty rate, with 33 household (46.5%) living below poverty.
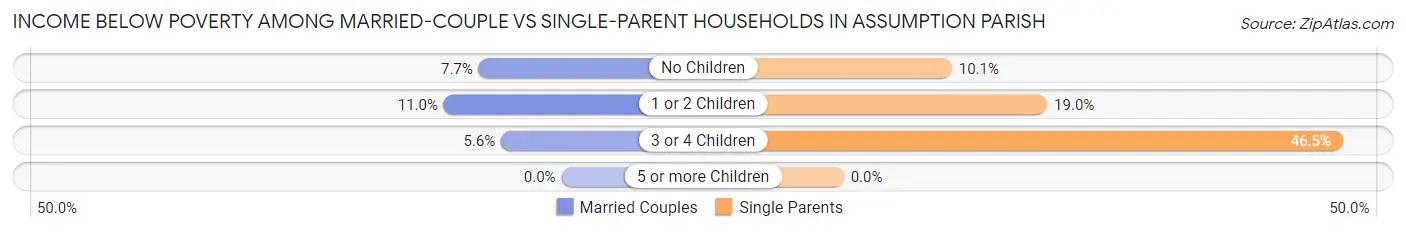
| Children | Married-Couple Families | Single-Parent Households |
| No Children | 196 (7.7%) | 41 (10.1%) |
| 1 or 2 Children | 143 (11.0%) | 187 (19.0%) |
| 3 or 4 Children | 14 (5.6%) | 33 (46.5%) |
| 5 or more Children | 0 (0.0%) | 0 (0.0%) |
| Total | 353 (8.6%) | 261 (17.8%) |
Employment Characteristics in Assumption Parish
Employment by Class of Employer in Assumption Parish
Among the 8,361 employed individuals in Assumption Parish, private company employees (5,938 | 71.0%), state government employees (726 | 8.7%), and local government employees (528 | 6.3%) make up the most common classes of employment.
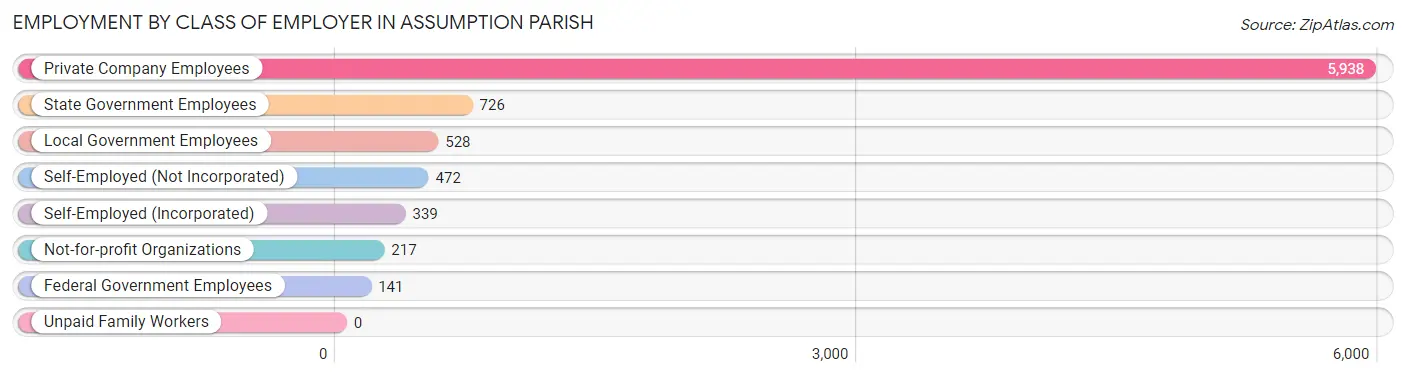
| Employer Class | # Employees | % Employees |
| Private Company Employees | 5,938 | 71.0% |
| Self-Employed (Incorporated) | 339 | 4.1% |
| Self-Employed (Not Incorporated) | 472 | 5.7% |
| Not-for-profit Organizations | 217 | 2.6% |
| Local Government Employees | 528 | 6.3% |
| State Government Employees | 726 | 8.7% |
| Federal Government Employees | 141 | 1.7% |
| Unpaid Family Workers | 0 | 0.0% |
| Total | 8,361 | 100.0% |
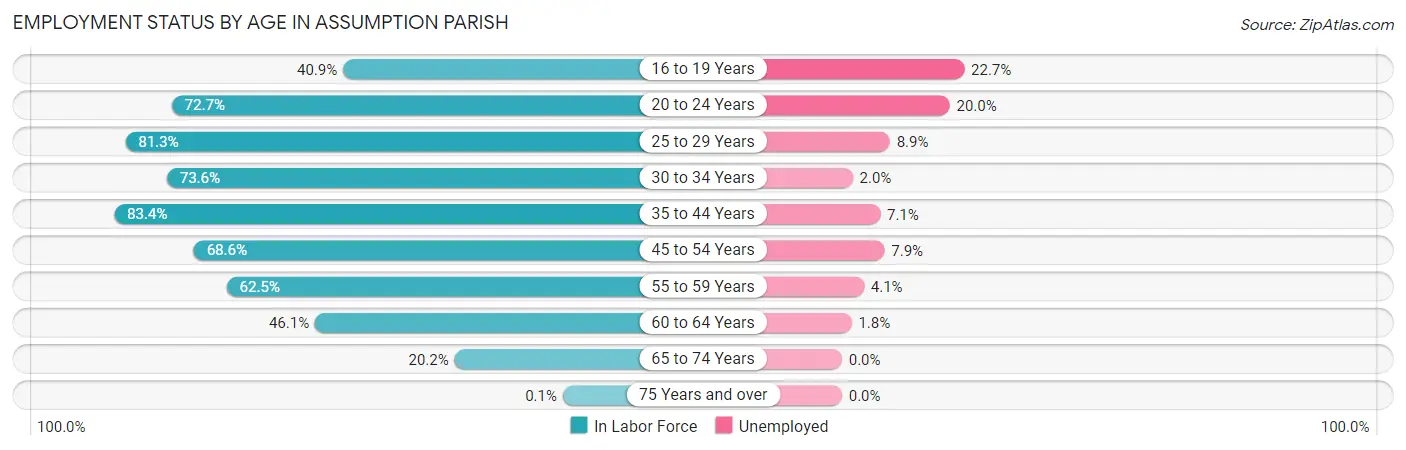
Employment Status by Age in Assumption Parish
According to the labor force statistics for Assumption Parish, out of the total population over 16 years of age (17,222), 54.4% or 9,369 individuals are in the labor force, with 8.0% or 750 of them unemployed. The age group with the highest labor force participation rate is 35 to 44 years, with 83.4% or 2,118 individuals in the labor force. Within the labor force, the 16 to 19 years age range has the highest percentage of unemployed individuals, with 22.7% or 106 of them being unemployed.
| Age Bracket | In Labor Force | Unemployed |
| 16 to 19 Years | 467 (40.9%) | 106 (22.7%) |
| 20 to 24 Years | 944 (72.7%) | 189 (20.0%) |
| 25 to 29 Years | 906 (81.3%) | 81 (8.9%) |
| 30 to 34 Years | 818 (73.6%) | 16 (2.0%) |
| 35 to 44 Years | 2,118 (83.4%) | 150 (7.1%) |
| 45 to 54 Years | 1,921 (68.6%) | 152 (7.9%) |
| 55 to 59 Years | 978 (62.5%) | 40 (4.1%) |
| 60 to 64 Years | 721 (46.1%) | 13 (1.8%) |
| 65 to 74 Years | 492 (20.2%) | 0 (0.0%) |
| 75 Years and over | 2 (0.1%) | 0 (0.0%) |
| Total | 9,369 (54.4%) | 750 (8.0%) |
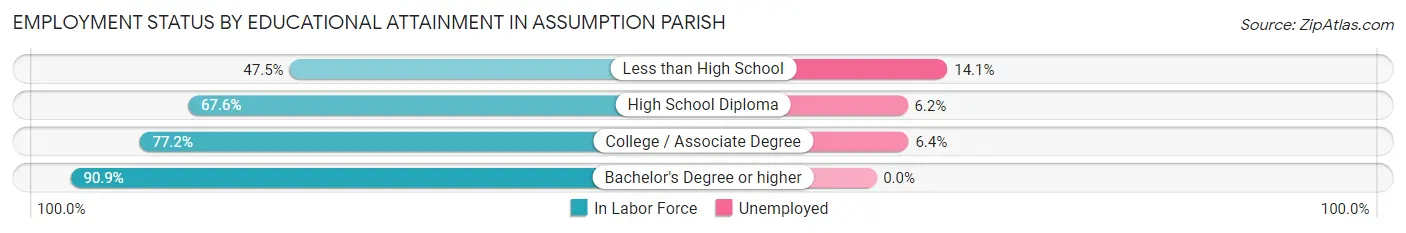
Employment Status by Educational Attainment in Assumption Parish
According to labor force statistics for Assumption Parish, 69.8% of individuals (7,464) out of the total population between 25 and 64 years of age (10,693) are in the labor force, with 6.1% or 455 of them being unemployed. The group with the highest labor force participation rate are those with the educational attainment of bachelor's degree or higher, with 90.9% or 1,474 individuals in the labor force. Within the labor force, individuals with less than high school education have the highest percentage of unemployment, with 14.1% or 132 of them being unemployed.
| Educational Attainment | In Labor Force | Unemployed |
| Less than High School | 938 (47.5%) | 278 (14.1%) |
| High School Diploma | 3,044 (67.6%) | 279 (6.2%) |
| College / Associate Degree | 2,002 (77.2%) | 166 (6.4%) |
| Bachelor's Degree or higher | 1,474 (90.9%) | 0 (0.0%) |
| Total | 7,464 (69.8%) | 652 (6.1%) |
Employment Occupations by Sex in Assumption Parish
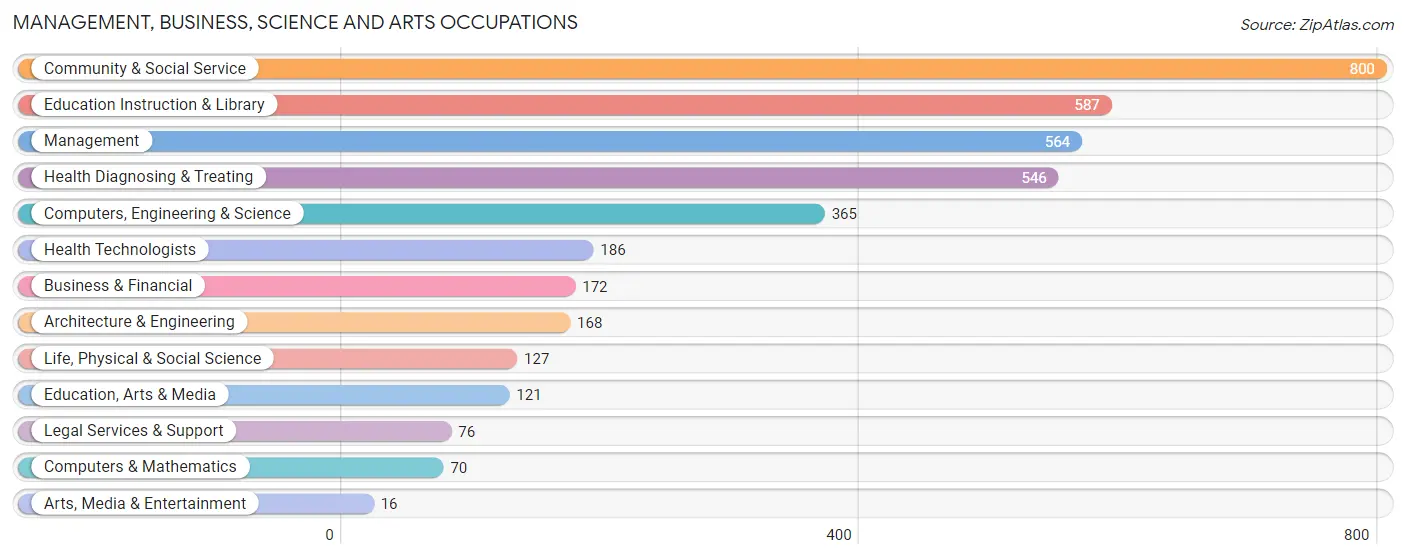
Management, Business, Science and Arts Occupations
The most common Management, Business, Science and Arts occupations in Assumption Parish are Community & Social Service (800 | 9.3%), Education Instruction & Library (587 | 6.8%), Management (564 | 6.6%), Health Diagnosing & Treating (546 | 6.4%), and Computers, Engineering & Science (365 | 4.3%).
Management, Business, Science and Arts Occupations by Sex
Within the Management, Business, Science and Arts occupations in Assumption Parish, the most male-oriented occupations are Architecture & Engineering (100.0%), Arts, Media & Entertainment (100.0%), and Computers & Mathematics (94.3%), while the most female-oriented occupations are Education, Arts & Media (100.0%), Legal Services & Support (100.0%), and Health Diagnosing & Treating (92.3%).
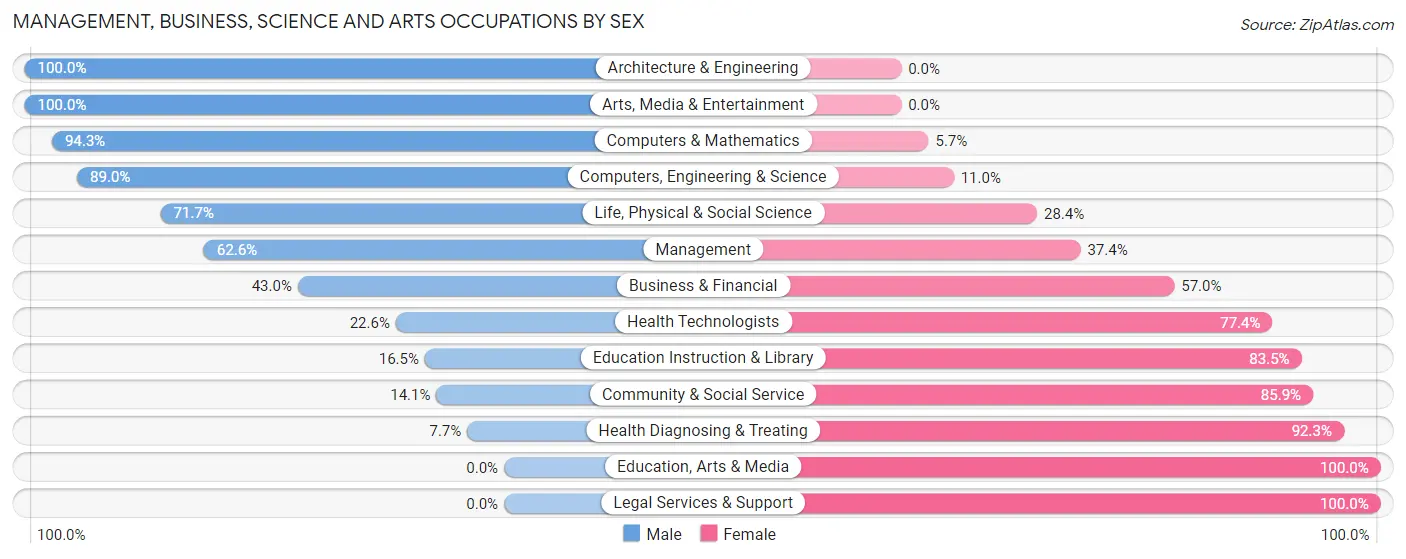
| Occupation | Male | Female |
| Management | 353 (62.6%) | 211 (37.4%) |
| Business & Financial | 74 (43.0%) | 98 (57.0%) |
| Computers, Engineering & Science | 325 (89.0%) | 40 (11.0%) |
| Computers & Mathematics | 66 (94.3%) | 4 (5.7%) |
| Architecture & Engineering | 168 (100.0%) | 0 (0.0%) |
| Life, Physical & Social Science | 91 (71.7%) | 36 (28.3%) |
| Community & Social Service | 113 (14.1%) | 687 (85.9%) |
| Education, Arts & Media | 0 (0.0%) | 121 (100.0%) |
| Legal Services & Support | 0 (0.0%) | 76 (100.0%) |
| Education Instruction & Library | 97 (16.5%) | 490 (83.5%) |
| Arts, Media & Entertainment | 16 (100.0%) | 0 (0.0%) |
| Health Diagnosing & Treating | 42 (7.7%) | 504 (92.3%) |
| Health Technologists | 42 (22.6%) | 144 (77.4%) |
| Total (Category) | 907 (37.1%) | 1,540 (62.9%) |
| Total (Overall) | 4,327 (50.4%) | 4,252 (49.6%) |
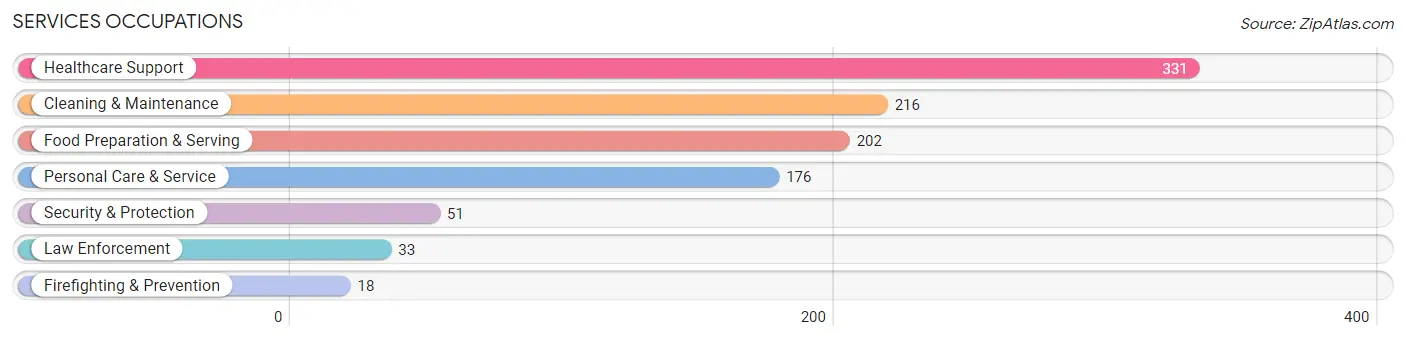
Services Occupations
The most common Services occupations in Assumption Parish are Healthcare Support (331 | 3.9%), Cleaning & Maintenance (216 | 2.5%), Food Preparation & Serving (202 | 2.4%), Personal Care & Service (176 | 2.1%), and Security & Protection (51 | 0.6%).
Services Occupations by Sex
Within the Services occupations in Assumption Parish, the most male-oriented occupations are Law Enforcement (100.0%), Security & Protection (90.2%), and Firefighting & Prevention (72.2%), while the most female-oriented occupations are Healthcare Support (96.4%), Food Preparation & Serving (63.4%), and Personal Care & Service (63.1%).
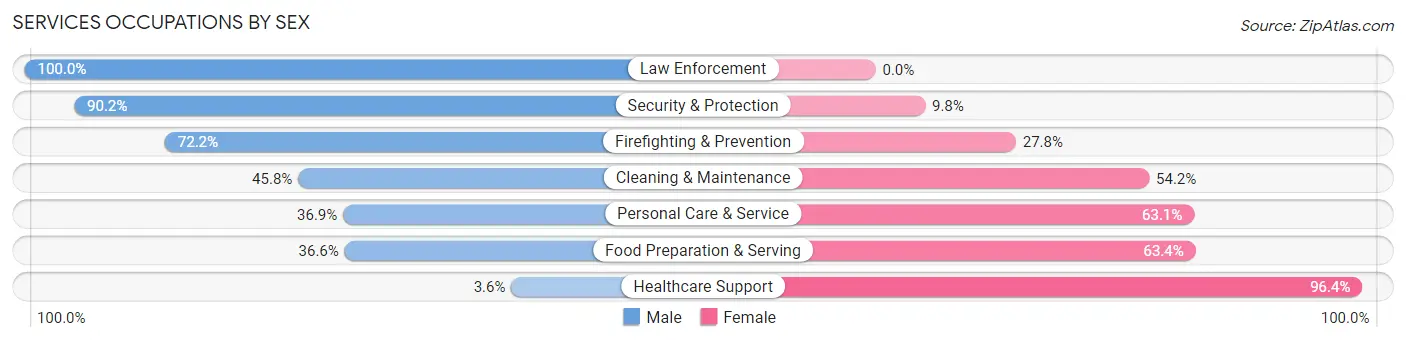
| Occupation | Male | Female |
| Healthcare Support | 12 (3.6%) | 319 (96.4%) |
| Security & Protection | 46 (90.2%) | 5 (9.8%) |
| Firefighting & Prevention | 13 (72.2%) | 5 (27.8%) |
| Law Enforcement | 33 (100.0%) | 0 (0.0%) |
| Food Preparation & Serving | 74 (36.6%) | 128 (63.4%) |
| Cleaning & Maintenance | 99 (45.8%) | 117 (54.2%) |
| Personal Care & Service | 65 (36.9%) | 111 (63.1%) |
| Total (Category) | 296 (30.3%) | 680 (69.7%) |
| Total (Overall) | 4,327 (50.4%) | 4,252 (49.6%) |
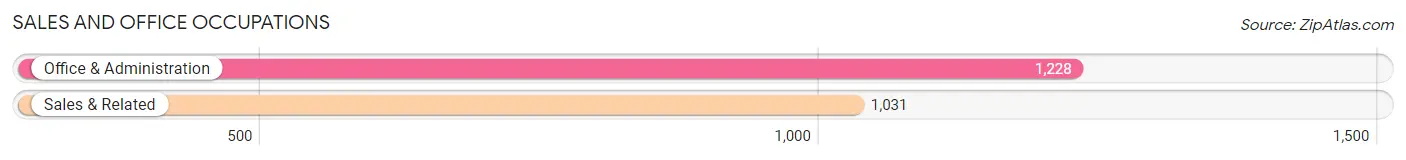
Sales and Office Occupations
The most common Sales and Office occupations in Assumption Parish are Office & Administration (1,228 | 14.3%), and Sales & Related (1,031 | 12.0%).
Sales and Office Occupations by Sex
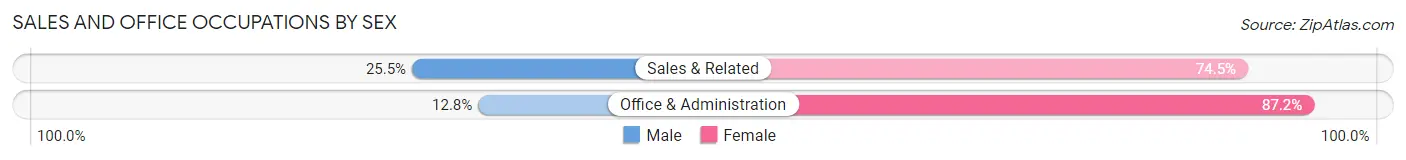
| Occupation | Male | Female |
| Sales & Related | 263 (25.5%) | 768 (74.5%) |
| Office & Administration | 157 (12.8%) | 1,071 (87.2%) |
| Total (Category) | 420 (18.6%) | 1,839 (81.4%) |
| Total (Overall) | 4,327 (50.4%) | 4,252 (49.6%) |
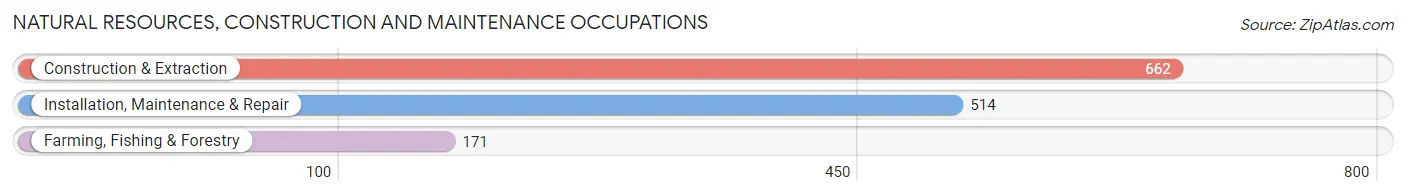
Natural Resources, Construction and Maintenance Occupations
The most common Natural Resources, Construction and Maintenance occupations in Assumption Parish are Construction & Extraction (662 | 7.7%), Installation, Maintenance & Repair (514 | 6.0%), and Farming, Fishing & Forestry (171 | 2.0%).
Natural Resources, Construction and Maintenance Occupations by Sex
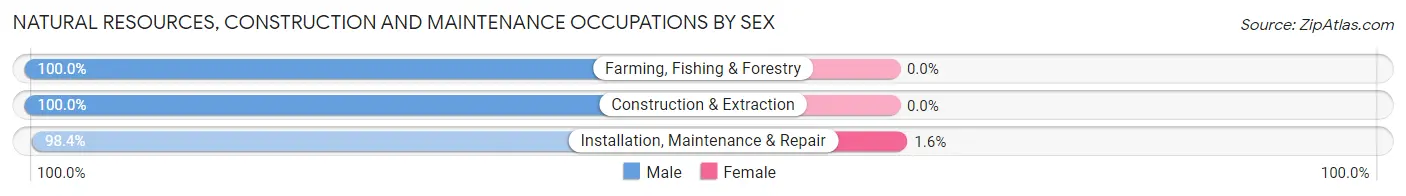
| Occupation | Male | Female |
| Farming, Fishing & Forestry | 171 (100.0%) | 0 (0.0%) |
| Construction & Extraction | 662 (100.0%) | 0 (0.0%) |
| Installation, Maintenance & Repair | 506 (98.4%) | 8 (1.6%) |
| Total (Category) | 1,339 (99.4%) | 8 (0.6%) |
| Total (Overall) | 4,327 (50.4%) | 4,252 (49.6%) |
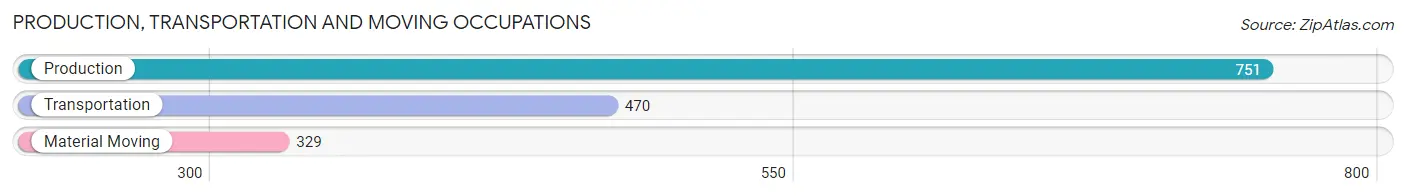
Production, Transportation and Moving Occupations
The most common Production, Transportation and Moving occupations in Assumption Parish are Production (751 | 8.7%), Transportation (470 | 5.5%), and Material Moving (329 | 3.8%).
Production, Transportation and Moving Occupations by Sex
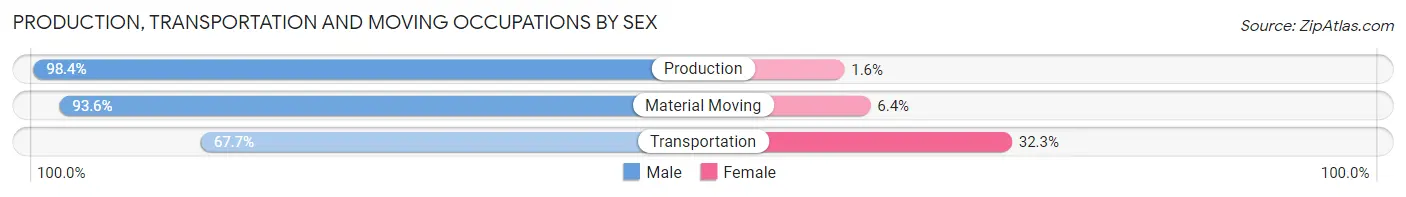
| Occupation | Male | Female |
| Production | 739 (98.4%) | 12 (1.6%) |
| Transportation | 318 (67.7%) | 152 (32.3%) |
| Material Moving | 308 (93.6%) | 21 (6.4%) |
| Total (Category) | 1,365 (88.1%) | 185 (11.9%) |
| Total (Overall) | 4,327 (50.4%) | 4,252 (49.6%) |
Employment Industries by Sex in Assumption Parish
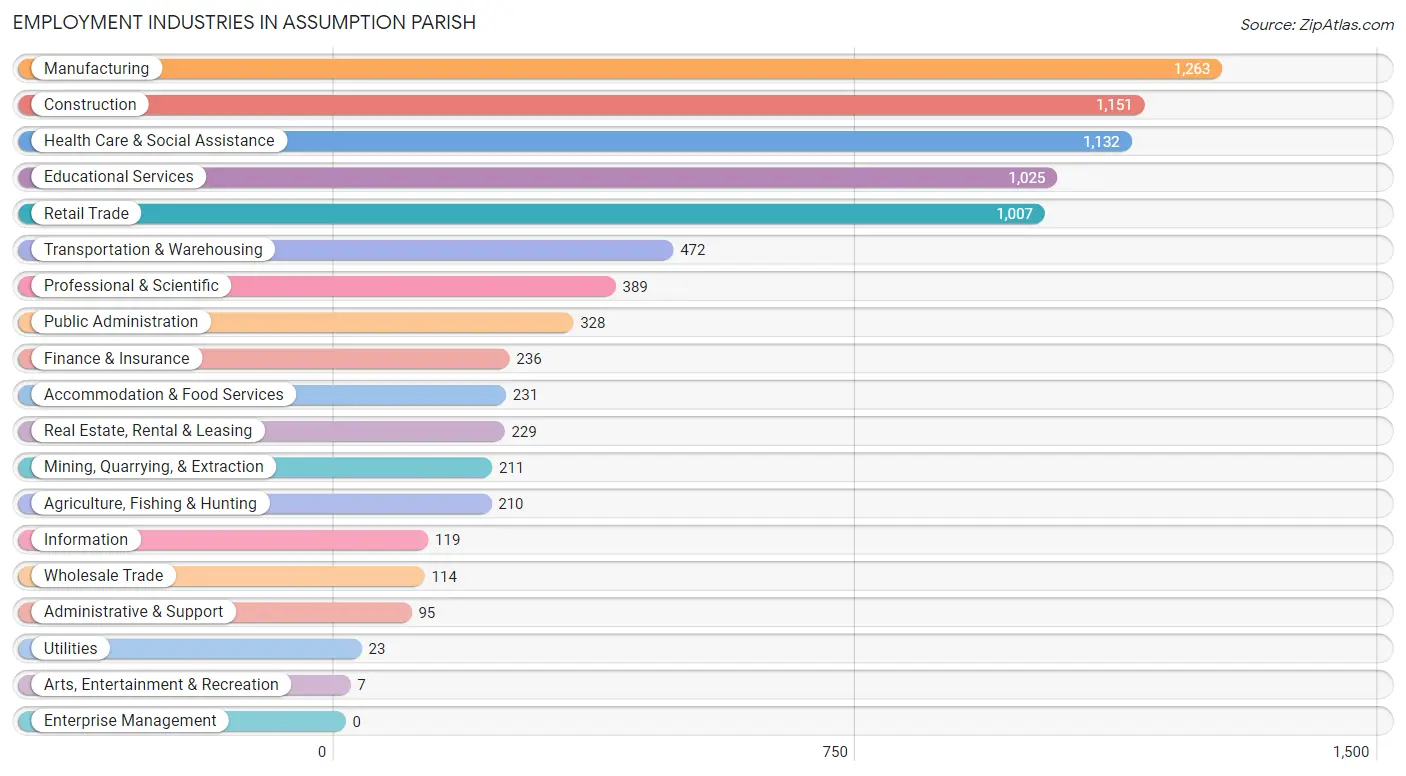
Employment Industries in Assumption Parish
The major employment industries in Assumption Parish include Manufacturing (1,263 | 14.7%), Construction (1,151 | 13.4%), Health Care & Social Assistance (1,132 | 13.2%), Educational Services (1,025 | 11.9%), and Retail Trade (1,007 | 11.7%).
Employment Industries by Sex in Assumption Parish
The Assumption Parish industries that see more men than women are Agriculture, Fishing & Hunting (100.0%), Utilities (100.0%), and Real Estate, Rental & Leasing (100.0%), whereas the industries that tend to have a higher number of women are Arts, Entertainment & Recreation (100.0%), Educational Services (90.4%), and Finance & Insurance (88.1%).
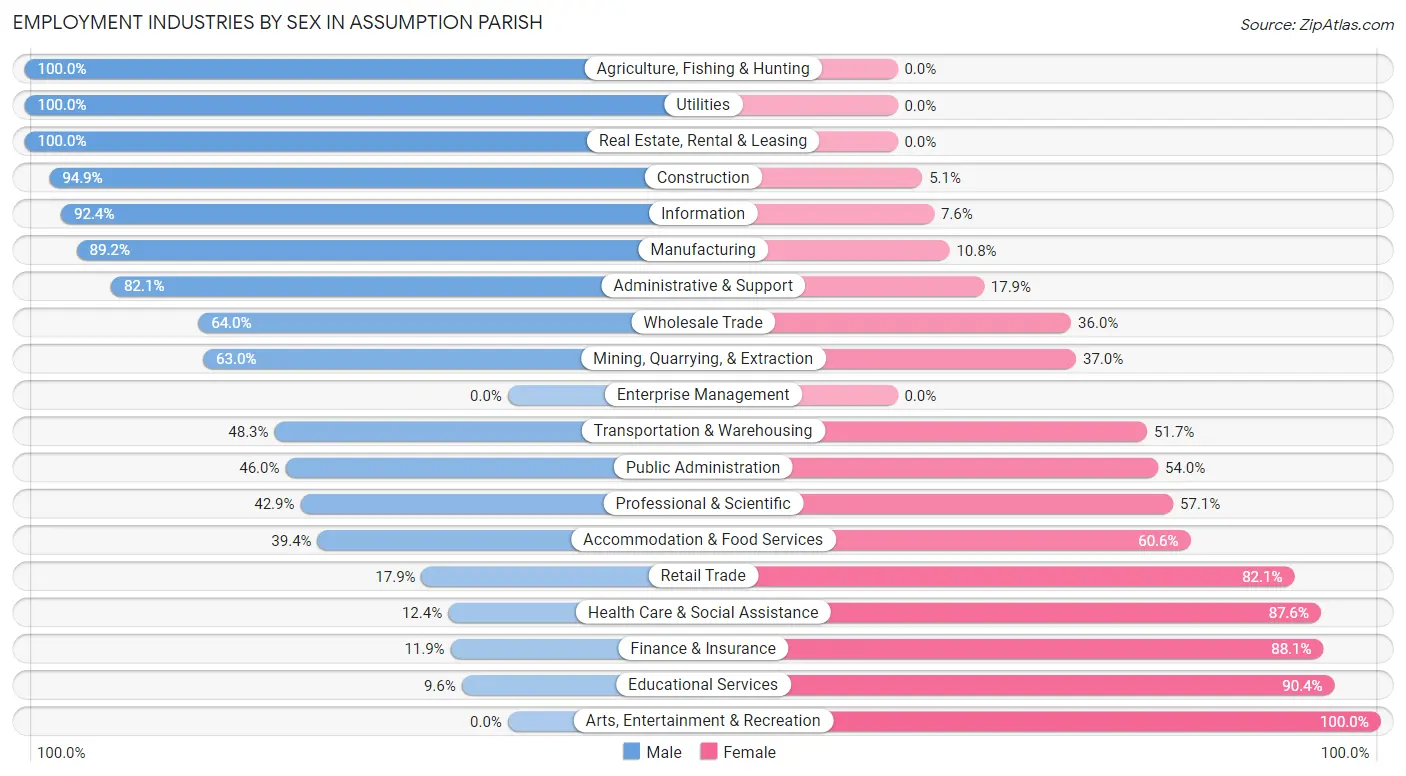
| Industry | Male | Female |
| Agriculture, Fishing & Hunting | 210 (100.0%) | 0 (0.0%) |
| Mining, Quarrying, & Extraction | 133 (63.0%) | 78 (37.0%) |
| Construction | 1,092 (94.9%) | 59 (5.1%) |
| Manufacturing | 1,127 (89.2%) | 136 (10.8%) |
| Wholesale Trade | 73 (64.0%) | 41 (36.0%) |
| Retail Trade | 180 (17.9%) | 827 (82.1%) |
| Transportation & Warehousing | 228 (48.3%) | 244 (51.7%) |
| Utilities | 23 (100.0%) | 0 (0.0%) |
| Information | 110 (92.4%) | 9 (7.6%) |
| Finance & Insurance | 28 (11.9%) | 208 (88.1%) |
| Real Estate, Rental & Leasing | 229 (100.0%) | 0 (0.0%) |
| Professional & Scientific | 167 (42.9%) | 222 (57.1%) |
| Enterprise Management | 0 (0.0%) | 0 (0.0%) |
| Administrative & Support | 78 (82.1%) | 17 (17.9%) |
| Educational Services | 98 (9.6%) | 927 (90.4%) |
| Health Care & Social Assistance | 140 (12.4%) | 992 (87.6%) |
| Arts, Entertainment & Recreation | 0 (0.0%) | 7 (100.0%) |
| Accommodation & Food Services | 91 (39.4%) | 140 (60.6%) |
| Public Administration | 151 (46.0%) | 177 (54.0%) |
| Total | 4,327 (50.4%) | 4,252 (49.6%) |
Education in Assumption Parish
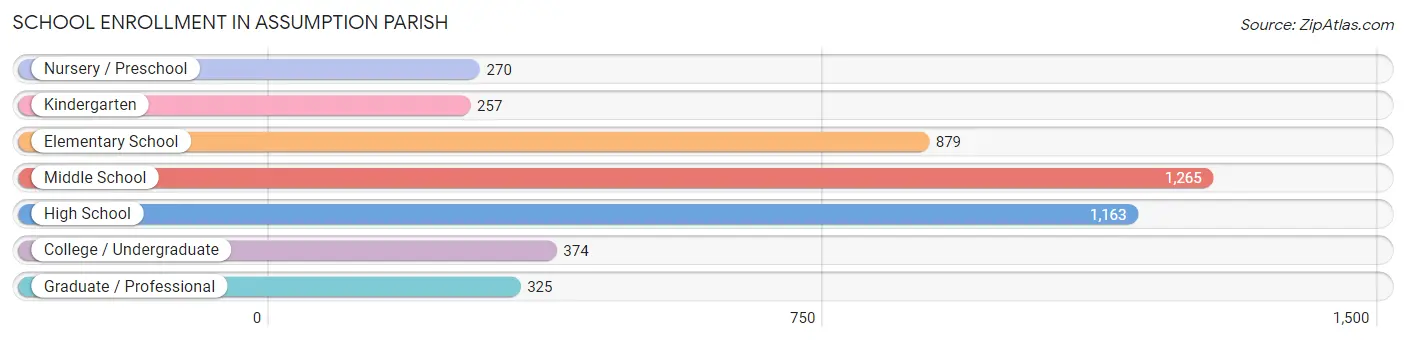
School Enrollment in Assumption Parish
The most common levels of schooling among the 4,533 students in Assumption Parish are middle school (1,265 | 27.9%), high school (1,163 | 25.7%), and elementary school (879 | 19.4%).
| School Level | # Students | % Students |
| Nursery / Preschool | 270 | 6.0% |
| Kindergarten | 257 | 5.7% |
| Elementary School | 879 | 19.4% |
| Middle School | 1,265 | 27.9% |
| High School | 1,163 | 25.7% |
| College / Undergraduate | 374 | 8.3% |
| Graduate / Professional | 325 | 7.2% |
| Total | 4,533 | 100.0% |
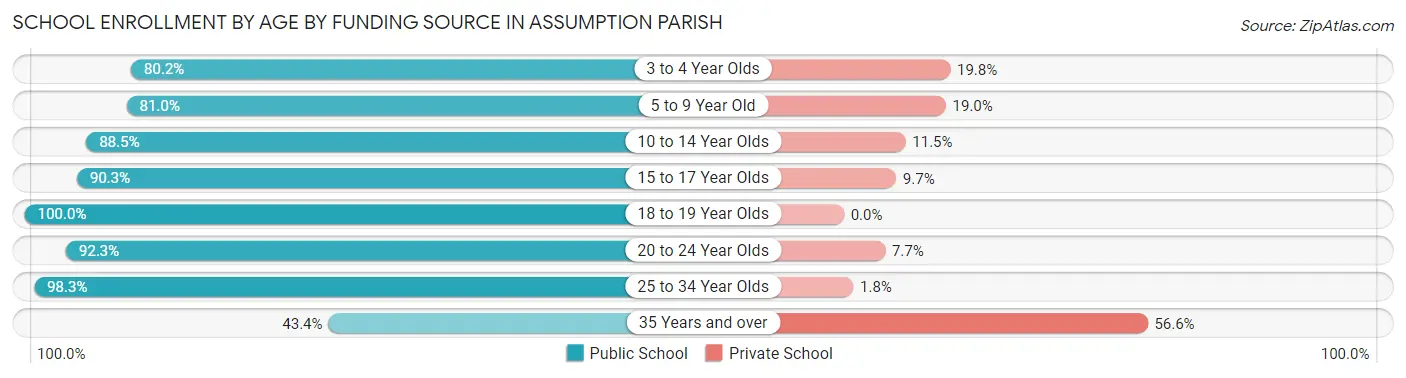
School Enrollment by Age by Funding Source in Assumption Parish
Out of a total of 4,533 students who are enrolled in schools in Assumption Parish, 671 (14.8%) attend a private institution, while the remaining 3,862 (85.2%) are enrolled in public schools. The age group of 35 years and over has the highest likelihood of being enrolled in private schools, with 159 (56.6% in the age bracket) enrolled. Conversely, the age group of 18 to 19 year olds has the lowest likelihood of being enrolled in a private school, with 330 (100.0% in the age bracket) attending a public institution.
| Age Bracket | Public School | Private School |
| 3 to 4 Year Olds | 251 (80.2%) | 62 (19.8%) |
| 5 to 9 Year Old | 751 (81.0%) | 176 (19.0%) |
| 10 to 14 Year Olds | 1,394 (88.5%) | 181 (11.5%) |
| 15 to 17 Year Olds | 603 (90.3%) | 65 (9.7%) |
| 18 to 19 Year Olds | 330 (100.0%) | 0 (0.0%) |
| 20 to 24 Year Olds | 300 (92.3%) | 25 (7.7%) |
| 25 to 34 Year Olds | 112 (98.3%) | 2 (1.8%) |
| 35 Years and over | 122 (43.4%) | 159 (56.6%) |
| Total | 3,862 (85.2%) | 671 (14.8%) |
Educational Attainment by Field of Study in Assumption Parish
Education (747 | 35.2%), science & technology (284 | 13.4%), business (277 | 13.1%), arts & humanities (190 | 9.0%), and engineering (157 | 7.4%) are the most common fields of study among 2,119 individuals in Assumption Parish who have obtained a bachelor's degree or higher.
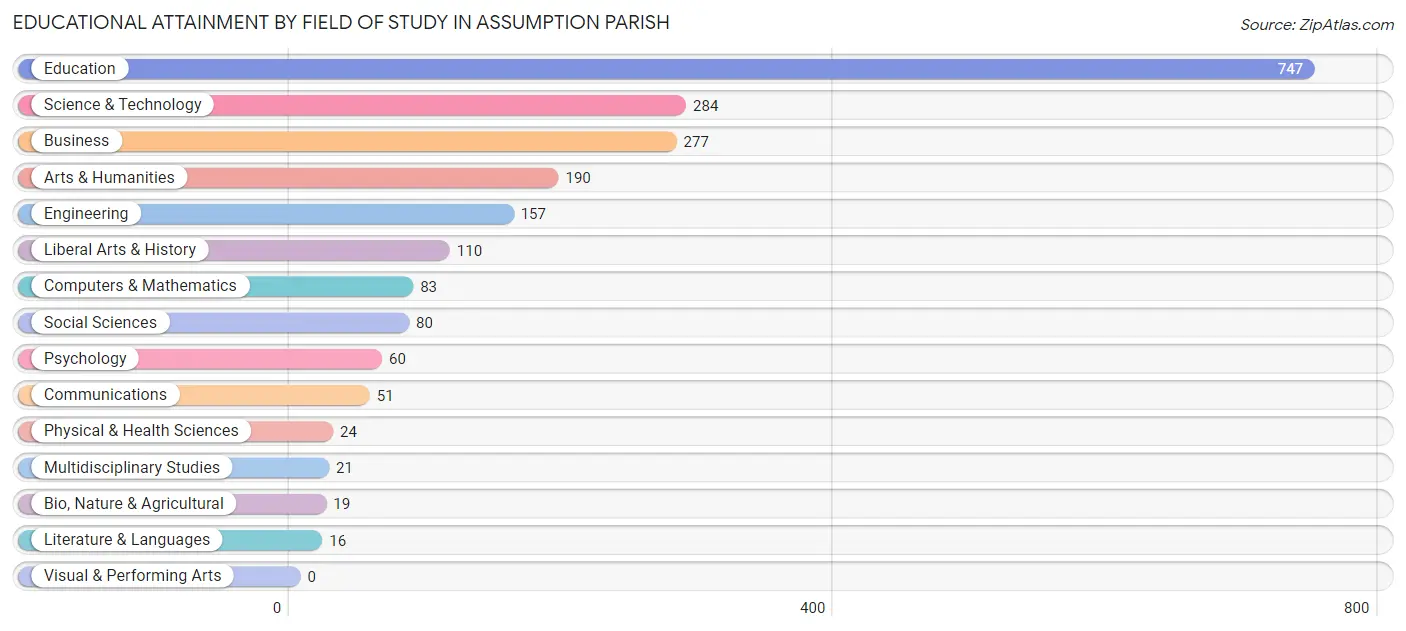
| Field of Study | # Graduates | % Graduates |
| Computers & Mathematics | 83 | 3.9% |
| Bio, Nature & Agricultural | 19 | 0.9% |
| Physical & Health Sciences | 24 | 1.1% |
| Psychology | 60 | 2.8% |
| Social Sciences | 80 | 3.8% |
| Engineering | 157 | 7.4% |
| Multidisciplinary Studies | 21 | 1.0% |
| Science & Technology | 284 | 13.4% |
| Business | 277 | 13.1% |
| Education | 747 | 35.2% |
| Literature & Languages | 16 | 0.8% |
| Liberal Arts & History | 110 | 5.2% |
| Visual & Performing Arts | 0 | 0.0% |
| Communications | 51 | 2.4% |
| Arts & Humanities | 190 | 9.0% |
| Total | 2,119 | 100.0% |
Transportation & Commute in Assumption Parish
Vehicle Availability by Sex in Assumption Parish
The most prevalent vehicle ownership categories in Assumption Parish are males with 2 vehicles (2,038, accounting for 48.2%) and females with 2 vehicles (2,012, making up 49.4%).
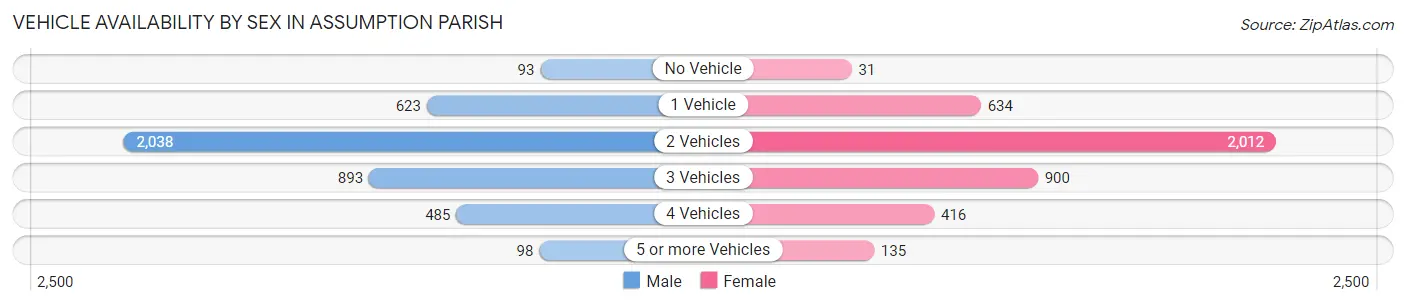
| Vehicles Available | Male | Female |
| No Vehicle | 93 (2.2%) | 31 (0.7%) |
| 1 Vehicle | 623 (14.7%) | 634 (15.4%) |
| 2 Vehicles | 2,038 (48.2%) | 2,012 (48.7%) |
| 3 Vehicles | 893 (21.1%) | 900 (21.8%) |
| 4 Vehicles | 485 (11.5%) | 416 (10.1%) |
| 5 or more Vehicles | 98 (2.3%) | 135 (3.3%) |
| Total | 4,230 (100.0%) | 4,128 (100.0%) |
Commute Time in Assumption Parish
The most frequently occuring commute durations in Assumption Parish are 30 to 34 minutes (1,694 commuters, 21.3%), 20 to 24 minutes (929 commuters, 11.7%), and 10 to 14 minutes (746 commuters, 9.4%).
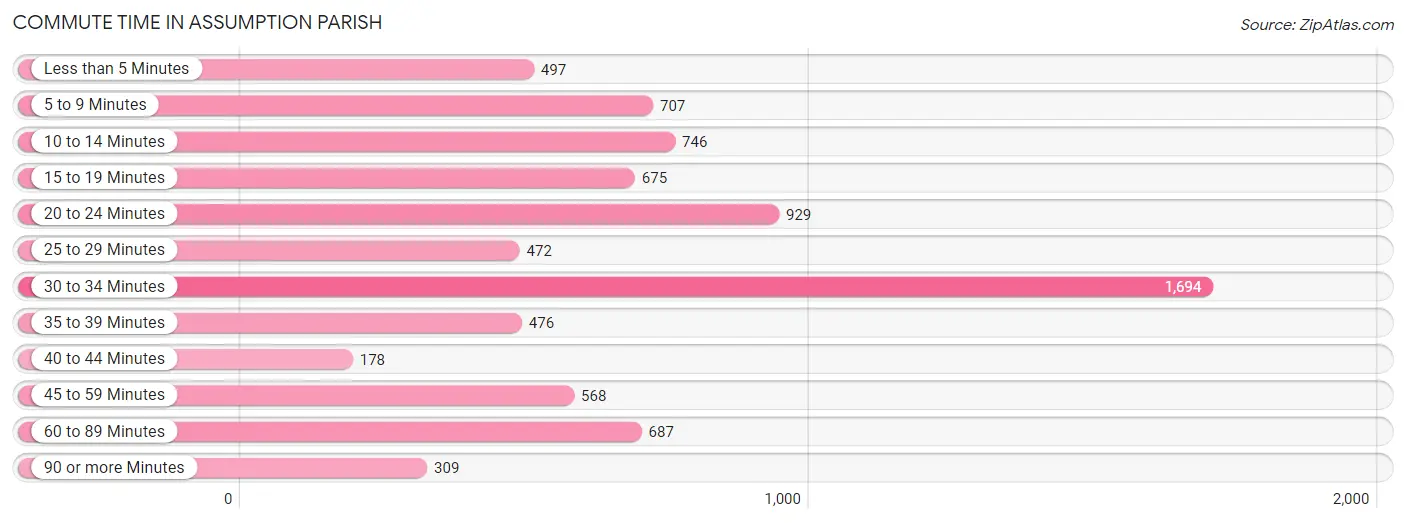
| Commute Time | # Commuters | % Commuters |
| Less than 5 Minutes | 497 | 6.3% |
| 5 to 9 Minutes | 707 | 8.9% |
| 10 to 14 Minutes | 746 | 9.4% |
| 15 to 19 Minutes | 675 | 8.5% |
| 20 to 24 Minutes | 929 | 11.7% |
| 25 to 29 Minutes | 472 | 5.9% |
| 30 to 34 Minutes | 1,694 | 21.3% |
| 35 to 39 Minutes | 476 | 6.0% |
| 40 to 44 Minutes | 178 | 2.2% |
| 45 to 59 Minutes | 568 | 7.2% |
| 60 to 89 Minutes | 687 | 8.6% |
| 90 or more Minutes | 309 | 3.9% |
Commute Time by Sex in Assumption Parish
The most common commute times in Assumption Parish are 30 to 34 minutes (737 commuters, 18.1%) for males and 30 to 34 minutes (957 commuters, 24.7%) for females.
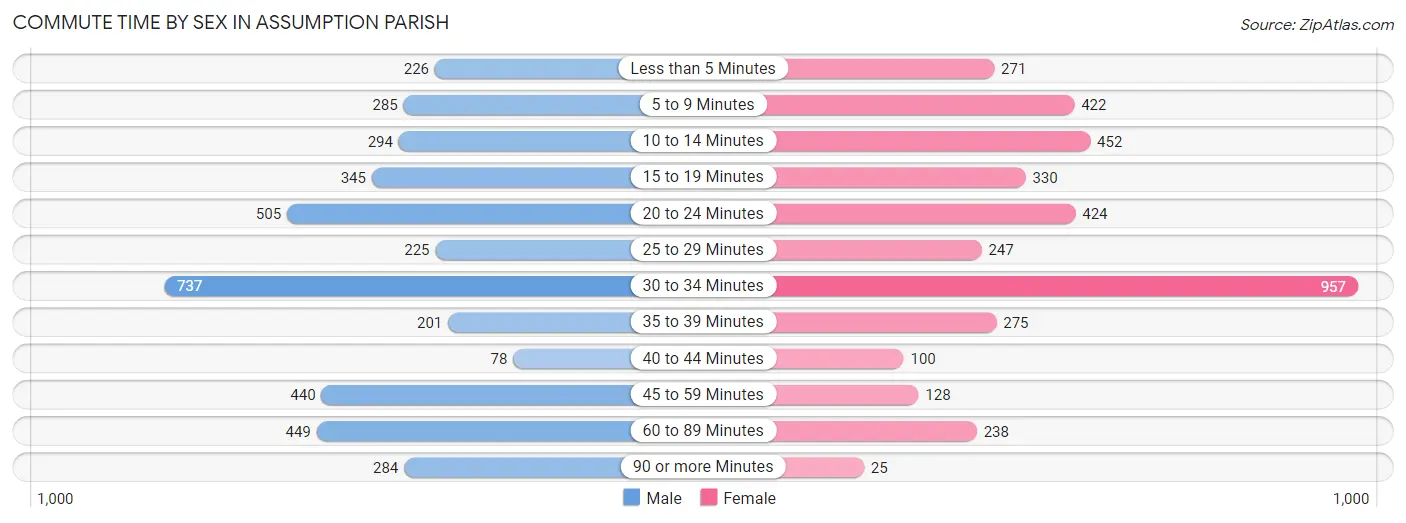
| Commute Time | Male | Female |
| Less than 5 Minutes | 226 (5.6%) | 271 (7.0%) |
| 5 to 9 Minutes | 285 (7.0%) | 422 (10.9%) |
| 10 to 14 Minutes | 294 (7.2%) | 452 (11.7%) |
| 15 to 19 Minutes | 345 (8.5%) | 330 (8.5%) |
| 20 to 24 Minutes | 505 (12.4%) | 424 (11.0%) |
| 25 to 29 Minutes | 225 (5.5%) | 247 (6.4%) |
| 30 to 34 Minutes | 737 (18.1%) | 957 (24.7%) |
| 35 to 39 Minutes | 201 (4.9%) | 275 (7.1%) |
| 40 to 44 Minutes | 78 (1.9%) | 100 (2.6%) |
| 45 to 59 Minutes | 440 (10.8%) | 128 (3.3%) |
| 60 to 89 Minutes | 449 (11.0%) | 238 (6.1%) |
| 90 or more Minutes | 284 (7.0%) | 25 (0.6%) |
Time of Departure to Work by Sex in Assumption Parish
The most frequent times of departure to work in Assumption Parish are 12:00 AM to 4:59 AM (1,111, 27.3%) for males and 7:00 AM to 7:29 AM (876, 22.6%) for females.
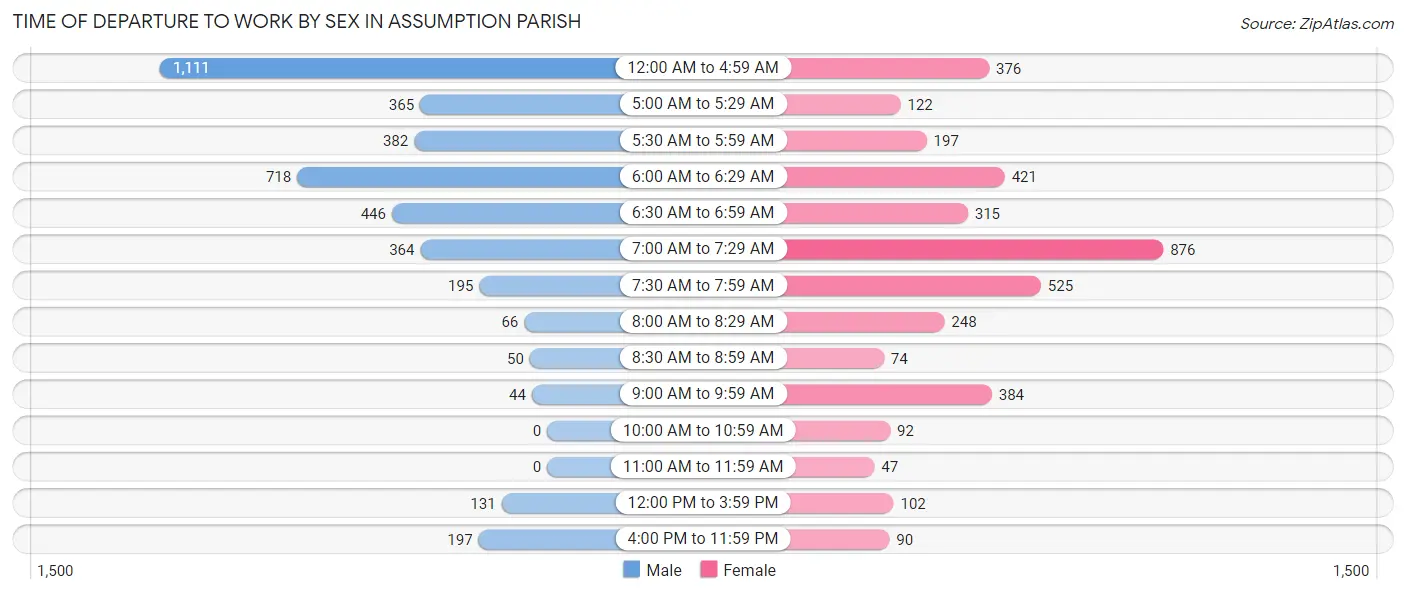
| Time of Departure | Male | Female |
| 12:00 AM to 4:59 AM | 1,111 (27.3%) | 376 (9.7%) |
| 5:00 AM to 5:29 AM | 365 (9.0%) | 122 (3.2%) |
| 5:30 AM to 5:59 AM | 382 (9.4%) | 197 (5.1%) |
| 6:00 AM to 6:29 AM | 718 (17.6%) | 421 (10.9%) |
| 6:30 AM to 6:59 AM | 446 (11.0%) | 315 (8.1%) |
| 7:00 AM to 7:29 AM | 364 (8.9%) | 876 (22.6%) |
| 7:30 AM to 7:59 AM | 195 (4.8%) | 525 (13.6%) |
| 8:00 AM to 8:29 AM | 66 (1.6%) | 248 (6.4%) |
| 8:30 AM to 8:59 AM | 50 (1.2%) | 74 (1.9%) |
| 9:00 AM to 9:59 AM | 44 (1.1%) | 384 (9.9%) |
| 10:00 AM to 10:59 AM | 0 (0.0%) | 92 (2.4%) |
| 11:00 AM to 11:59 AM | 0 (0.0%) | 47 (1.2%) |
| 12:00 PM to 3:59 PM | 131 (3.2%) | 102 (2.6%) |
| 4:00 PM to 11:59 PM | 197 (4.8%) | 90 (2.3%) |
| Total | 4,069 (100.0%) | 3,869 (100.0%) |
Housing Occupancy in Assumption Parish
Occupancy by Ownership in Assumption Parish
Of the total 8,368 dwellings in Assumption Parish, owner-occupied units account for 6,938 (82.9%), while renter-occupied units make up 1,430 (17.1%).
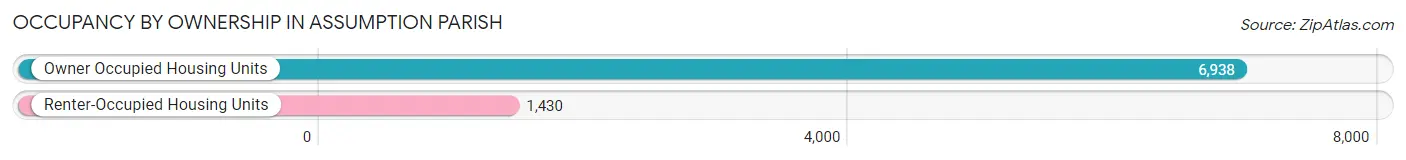
| Occupancy | # Housing Units | % Housing Units |
| Owner Occupied Housing Units | 6,938 | 82.9% |
| Renter-Occupied Housing Units | 1,430 | 17.1% |
| Total Occupied Housing Units | 8,368 | 100.0% |
Occupancy by Household Size in Assumption Parish
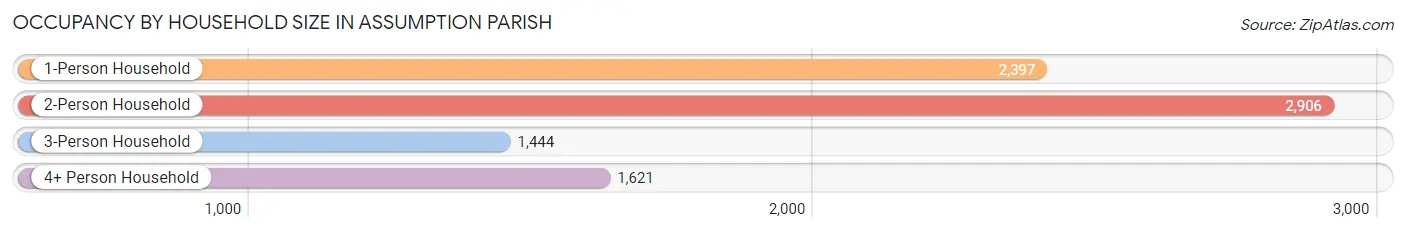
| Household Size | # Housing Units | % Housing Units |
| 1-Person Household | 2,397 | 28.6% |
| 2-Person Household | 2,906 | 34.7% |
| 3-Person Household | 1,444 | 17.3% |
| 4+ Person Household | 1,621 | 19.4% |
| Total Housing Units | 8,368 | 100.0% |
Occupancy by Ownership by Household Size in Assumption Parish
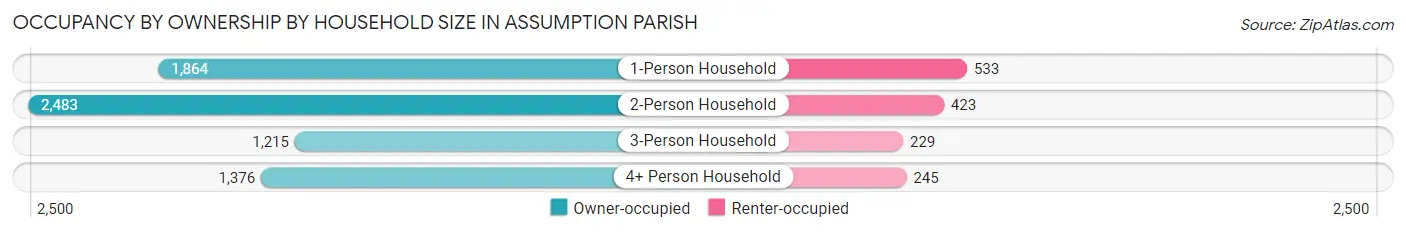
| Household Size | Owner-occupied | Renter-occupied |
| 1-Person Household | 1,864 (77.8%) | 533 (22.2%) |
| 2-Person Household | 2,483 (85.4%) | 423 (14.6%) |
| 3-Person Household | 1,215 (84.1%) | 229 (15.9%) |
| 4+ Person Household | 1,376 (84.9%) | 245 (15.1%) |
| Total Housing Units | 6,938 (82.9%) | 1,430 (17.1%) |
Occupancy by Educational Attainment in Assumption Parish
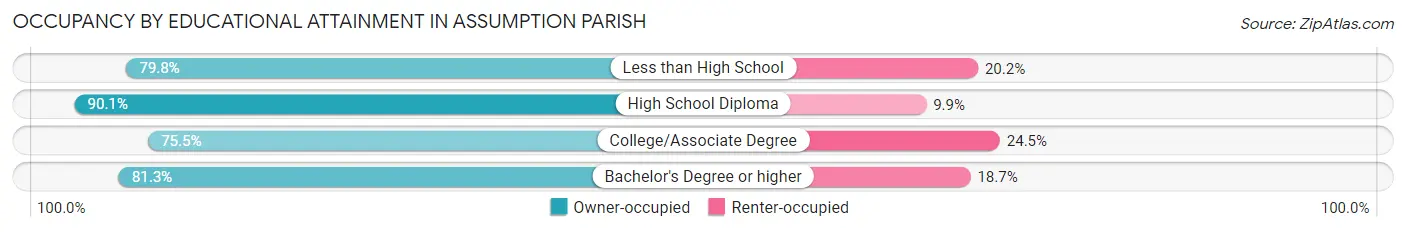
| Household Size | Owner-occupied | Renter-occupied |
| Less than High School | 1,399 (79.8%) | 354 (20.2%) |
| High School Diploma | 2,932 (90.1%) | 323 (9.9%) |
| College/Associate Degree | 1,616 (75.5%) | 525 (24.5%) |
| Bachelor's Degree or higher | 991 (81.3%) | 228 (18.7%) |
Occupancy by Age of Householder in Assumption Parish
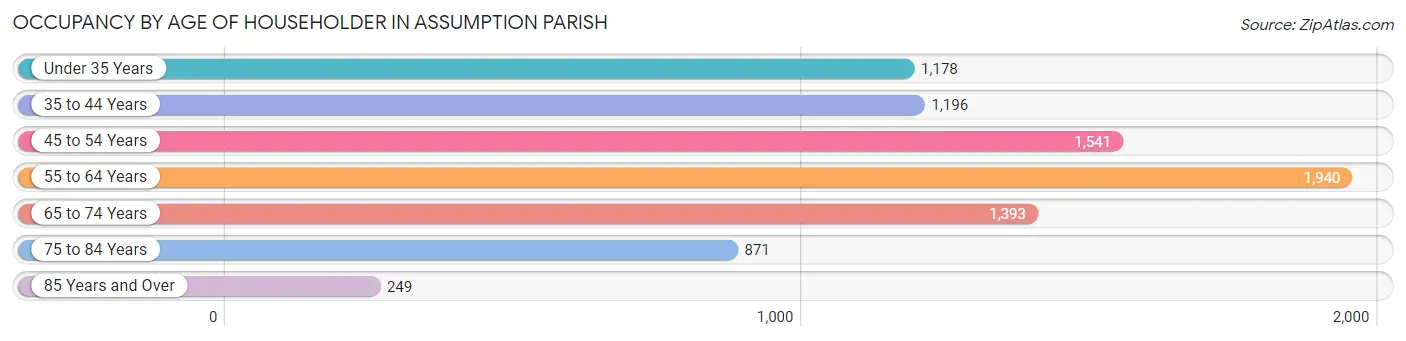
| Age Bracket | # Households | % Households |
| Under 35 Years | 1,178 | 14.1% |
| 35 to 44 Years | 1,196 | 14.3% |
| 45 to 54 Years | 1,541 | 18.4% |
| 55 to 64 Years | 1,940 | 23.2% |
| 65 to 74 Years | 1,393 | 16.7% |
| 75 to 84 Years | 871 | 10.4% |
| 85 Years and Over | 249 | 3.0% |
| Total | 8,368 | 100.0% |
Housing Finances in Assumption Parish
Median Income by Occupancy in Assumption Parish
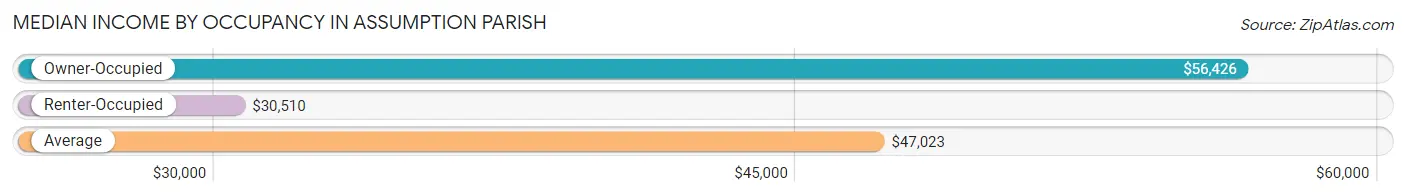
| Occupancy Type | # Households | Median Income |
| Owner-Occupied | 6,938 (82.9%) | $56,426 |
| Renter-Occupied | 1,430 (17.1%) | $30,510 |
| Average | 8,368 (100.0%) | $47,023 |
Occupancy by Householder Income Bracket in Assumption Parish
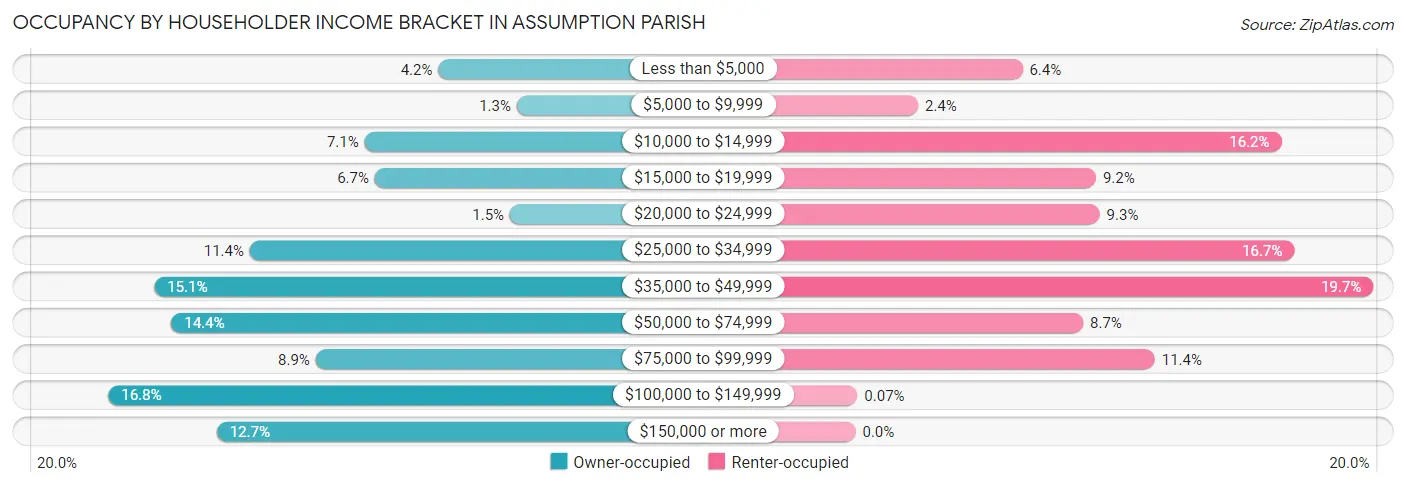
| Income Bracket | Owner-occupied | Renter-occupied |
| Less than $5,000 | 294 (4.2%) | 91 (6.4%) |
| $5,000 to $9,999 | 87 (1.3%) | 34 (2.4%) |
| $10,000 to $14,999 | 489 (7.0%) | 232 (16.2%) |
| $15,000 to $19,999 | 462 (6.7%) | 131 (9.2%) |
| $20,000 to $24,999 | 105 (1.5%) | 133 (9.3%) |
| $25,000 to $34,999 | 792 (11.4%) | 239 (16.7%) |
| $35,000 to $49,999 | 1,045 (15.1%) | 282 (19.7%) |
| $50,000 to $74,999 | 1,000 (14.4%) | 124 (8.7%) |
| $75,000 to $99,999 | 618 (8.9%) | 163 (11.4%) |
| $100,000 to $149,999 | 1,166 (16.8%) | 1 (0.1%) |
| $150,000 or more | 880 (12.7%) | 0 (0.0%) |
| Total | 6,938 (100.0%) | 1,430 (100.0%) |
Monthly Housing Cost Tiers in Assumption Parish
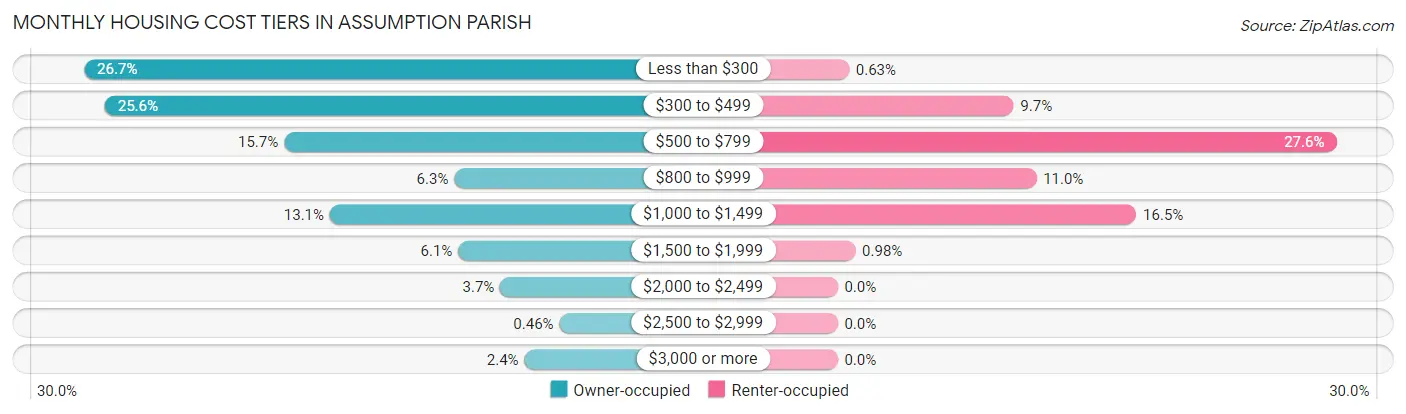
| Monthly Cost | Owner-occupied | Renter-occupied |
| Less than $300 | 1,853 (26.7%) | 9 (0.6%) |
| $300 to $499 | 1,774 (25.6%) | 139 (9.7%) |
| $500 to $799 | 1,087 (15.7%) | 394 (27.6%) |
| $800 to $999 | 435 (6.3%) | 157 (11.0%) |
| $1,000 to $1,499 | 912 (13.1%) | 236 (16.5%) |
| $1,500 to $1,999 | 420 (6.0%) | 14 (1.0%) |
| $2,000 to $2,499 | 259 (3.7%) | 0 (0.0%) |
| $2,500 to $2,999 | 32 (0.5%) | 0 (0.0%) |
| $3,000 or more | 166 (2.4%) | 0 (0.0%) |
| Total | 6,938 (100.0%) | 1,430 (100.0%) |
Physical Housing Characteristics in Assumption Parish
Housing Structures in Assumption Parish
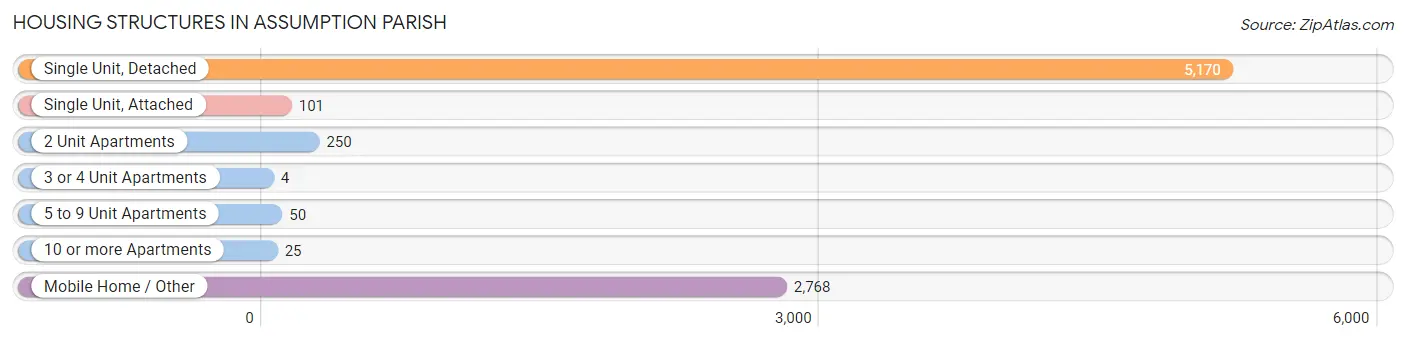
| Structure Type | # Housing Units | % Housing Units |
| Single Unit, Detached | 5,170 | 61.8% |
| Single Unit, Attached | 101 | 1.2% |
| 2 Unit Apartments | 250 | 3.0% |
| 3 or 4 Unit Apartments | 4 | 0.1% |
| 5 to 9 Unit Apartments | 50 | 0.6% |
| 10 or more Apartments | 25 | 0.3% |
| Mobile Home / Other | 2,768 | 33.1% |
| Total | 8,368 | 100.0% |
Housing Structures by Occupancy in Assumption Parish
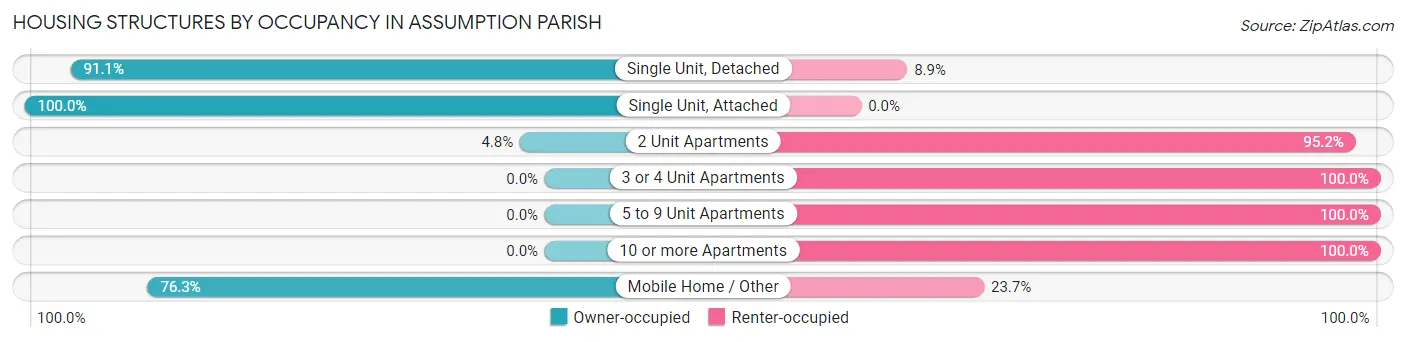
| Structure Type | Owner-occupied | Renter-occupied |
| Single Unit, Detached | 4,712 (91.1%) | 458 (8.9%) |
| Single Unit, Attached | 101 (100.0%) | 0 (0.0%) |
| 2 Unit Apartments | 12 (4.8%) | 238 (95.2%) |
| 3 or 4 Unit Apartments | 0 (0.0%) | 4 (100.0%) |
| 5 to 9 Unit Apartments | 0 (0.0%) | 50 (100.0%) |
| 10 or more Apartments | 0 (0.0%) | 25 (100.0%) |
| Mobile Home / Other | 2,113 (76.3%) | 655 (23.7%) |
| Total | 6,938 (82.9%) | 1,430 (17.1%) |
Housing Structures by Number of Rooms in Assumption Parish
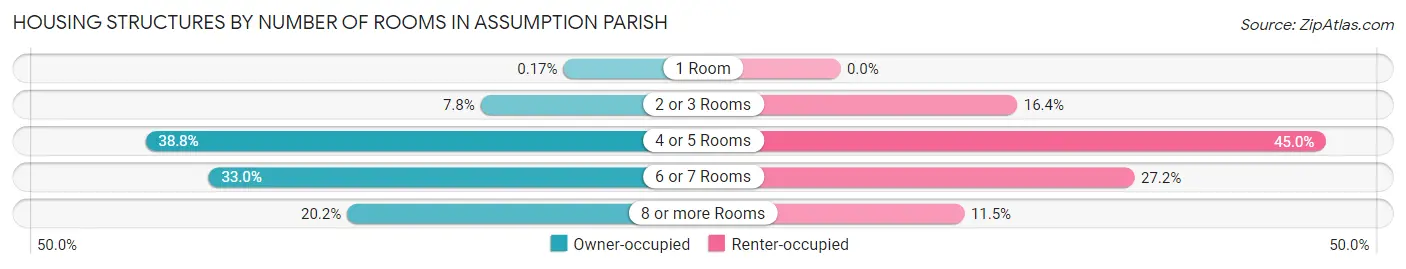
| Number of Rooms | Owner-occupied | Renter-occupied |
| 1 Room | 12 (0.2%) | 0 (0.0%) |
| 2 or 3 Rooms | 543 (7.8%) | 234 (16.4%) |
| 4 or 5 Rooms | 2,694 (38.8%) | 643 (45.0%) |
| 6 or 7 Rooms | 2,289 (33.0%) | 389 (27.2%) |
| 8 or more Rooms | 1,400 (20.2%) | 164 (11.5%) |
| Total | 6,938 (100.0%) | 1,430 (100.0%) |
Housing Structure by Heating Type in Assumption Parish
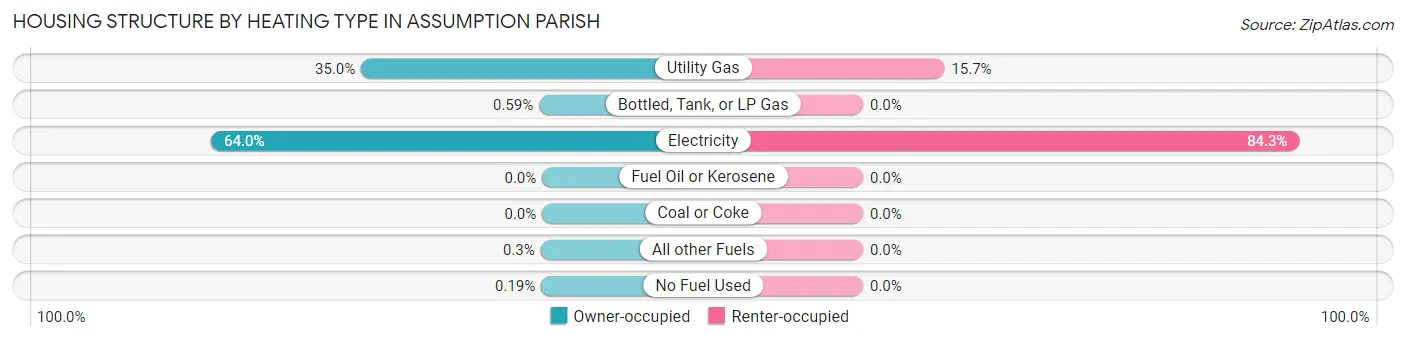
| Heating Type | Owner-occupied | Renter-occupied |
| Utility Gas | 2,426 (35.0%) | 225 (15.7%) |
| Bottled, Tank, or LP Gas | 41 (0.6%) | 0 (0.0%) |
| Electricity | 4,437 (63.9%) | 1,205 (84.3%) |
| Fuel Oil or Kerosene | 0 (0.0%) | 0 (0.0%) |
| Coal or Coke | 0 (0.0%) | 0 (0.0%) |
| All other Fuels | 21 (0.3%) | 0 (0.0%) |
| No Fuel Used | 13 (0.2%) | 0 (0.0%) |
| Total | 6,938 (100.0%) | 1,430 (100.0%) |
Household Vehicle Usage in Assumption Parish
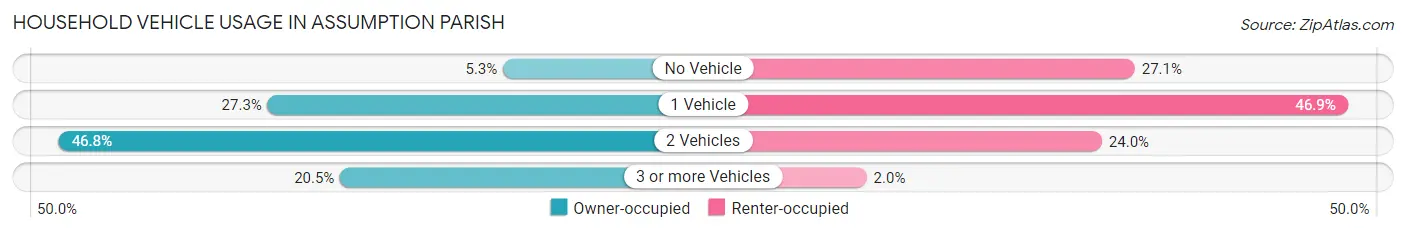
| Vehicles per Household | Owner-occupied | Renter-occupied |
| No Vehicle | 370 (5.3%) | 387 (27.1%) |
| 1 Vehicle | 1,895 (27.3%) | 671 (46.9%) |
| 2 Vehicles | 3,248 (46.8%) | 343 (24.0%) |
| 3 or more Vehicles | 1,425 (20.5%) | 29 (2.0%) |
| Total | 6,938 (100.0%) | 1,430 (100.0%) |
Real Estate & Mortgages in Assumption Parish
Real Estate and Mortgage Overview in Assumption Parish
| Characteristic | Without Mortgage | With Mortgage |
| Housing Units | 4,600 | 2,338 |
| Median Property Value | $94,700 | $190,700 |
| Median Household Income | $44,468 | $477 |
| Monthly Housing Costs | $348 | $166 |
| Real Estate Taxes | $395 | $419 |
Property Value by Mortgage Status in Assumption Parish
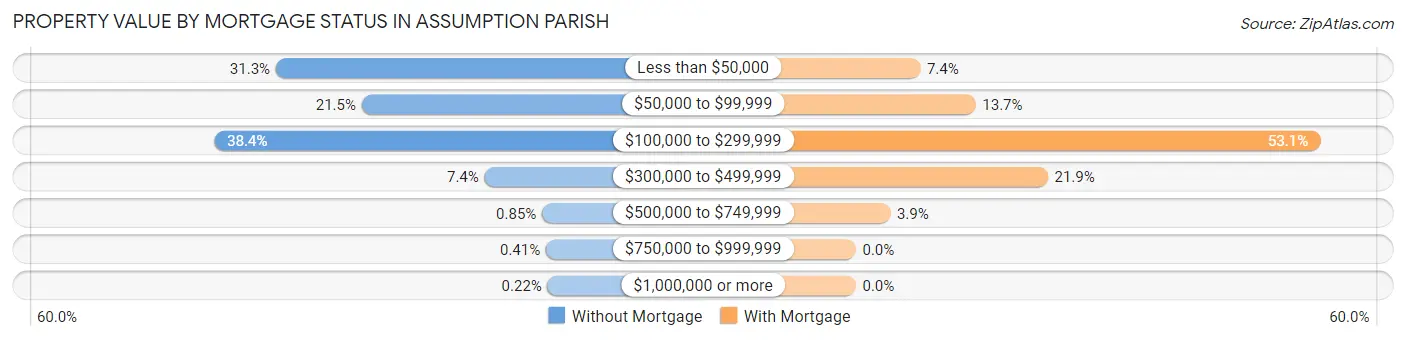
| Property Value | Without Mortgage | With Mortgage |
| Less than $50,000 | 1,439 (31.3%) | 172 (7.4%) |
| $50,000 to $99,999 | 987 (21.5%) | 320 (13.7%) |
| $100,000 to $299,999 | 1,764 (38.4%) | 1,241 (53.1%) |
| $300,000 to $499,999 | 342 (7.4%) | 513 (21.9%) |
| $500,000 to $749,999 | 39 (0.9%) | 92 (3.9%) |
| $750,000 to $999,999 | 19 (0.4%) | 0 (0.0%) |
| $1,000,000 or more | 10 (0.2%) | 0 (0.0%) |
| Total | 4,600 (100.0%) | 2,338 (100.0%) |
Household Income by Mortgage Status in Assumption Parish
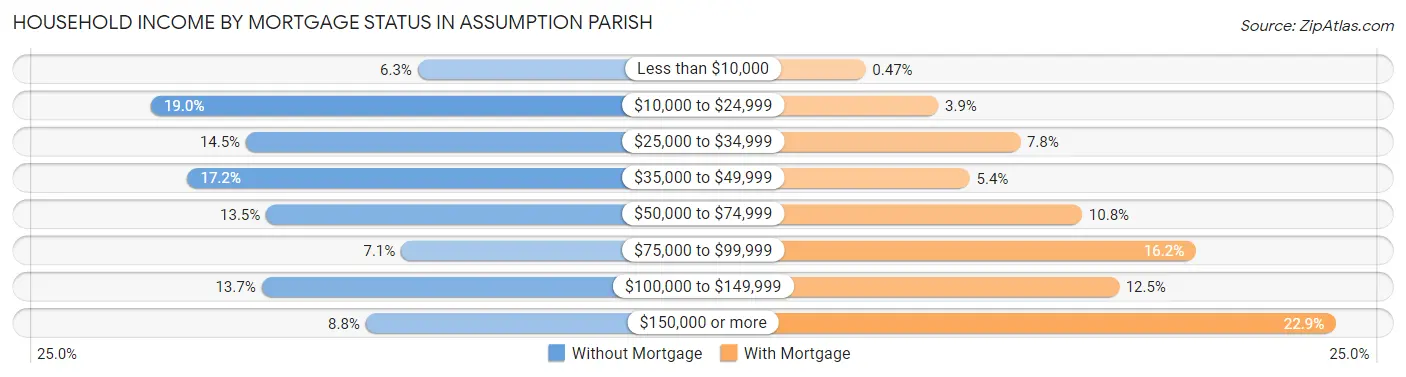
| Household Income | Without Mortgage | With Mortgage |
| Less than $10,000 | 289 (6.3%) | 11 (0.5%) |
| $10,000 to $24,999 | 873 (19.0%) | 92 (3.9%) |
| $25,000 to $34,999 | 665 (14.5%) | 183 (7.8%) |
| $35,000 to $49,999 | 793 (17.2%) | 127 (5.4%) |
| $50,000 to $74,999 | 621 (13.5%) | 252 (10.8%) |
| $75,000 to $99,999 | 325 (7.1%) | 379 (16.2%) |
| $100,000 to $149,999 | 631 (13.7%) | 293 (12.5%) |
| $150,000 or more | 403 (8.8%) | 535 (22.9%) |
| Total | 4,600 (100.0%) | 2,338 (100.0%) |
Property Value to Household Income Ratio in Assumption Parish
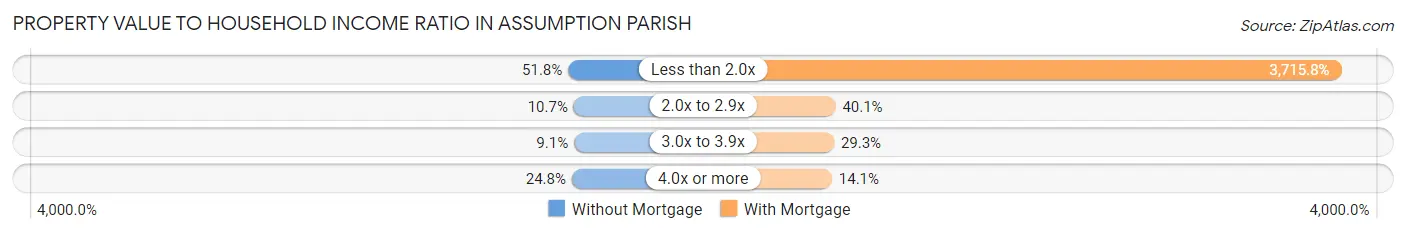
| Value-to-Income Ratio | Without Mortgage | With Mortgage |
| Less than 2.0x | 2,382 (51.8%) | 86,875 (3,715.8%) |
| 2.0x to 2.9x | 490 (10.6%) | 937 (40.1%) |
| 3.0x to 3.9x | 417 (9.1%) | 686 (29.3%) |
| 4.0x or more | 1,140 (24.8%) | 329 (14.1%) |
| Total | 4,600 (100.0%) | 2,338 (100.0%) |
Real Estate Taxes by Mortgage Status in Assumption Parish
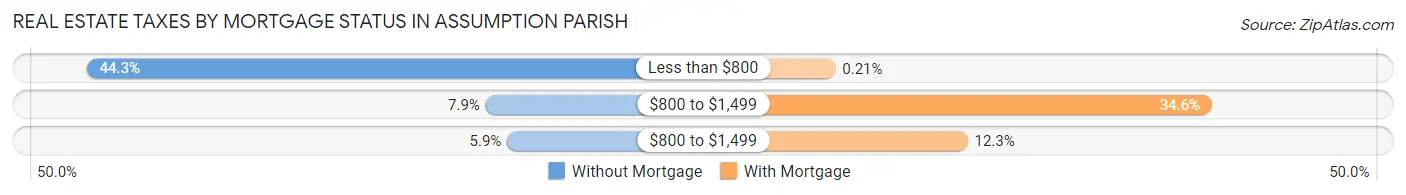
| Property Taxes | Without Mortgage | With Mortgage |
| Less than $800 | 2,039 (44.3%) | 5 (0.2%) |
| $800 to $1,499 | 363 (7.9%) | 809 (34.6%) |
| $800 to $1,499 | 273 (5.9%) | 287 (12.3%) |
| Total | 4,600 (100.0%) | 2,338 (100.0%) |
Health & Disability in Assumption Parish
Health Insurance Coverage by Age in Assumption Parish
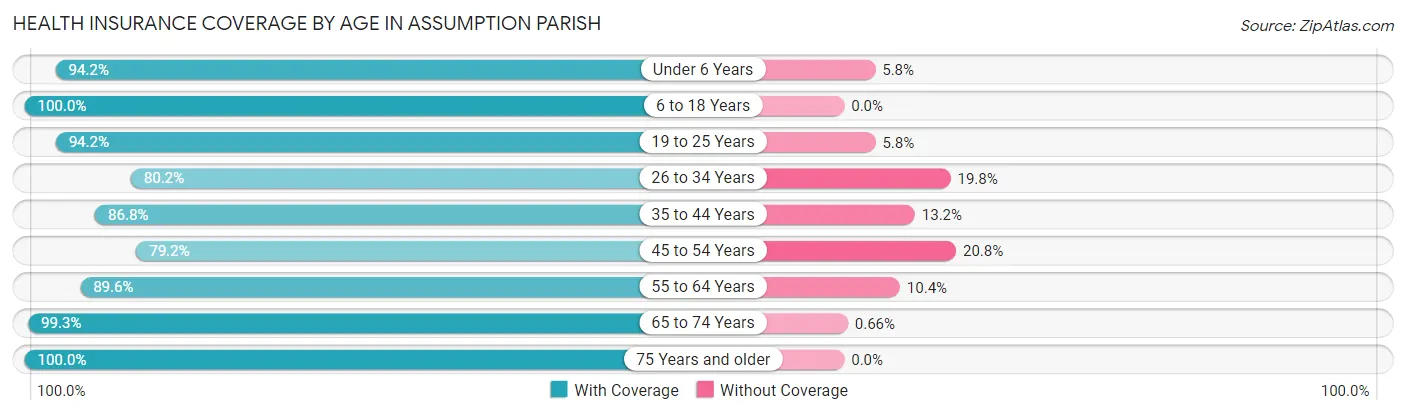
| Age Bracket | With Coverage | Without Coverage |
| Under 6 Years | 1,222 (94.2%) | 75 (5.8%) |
| 6 to 18 Years | 3,406 (100.0%) | 0 (0.0%) |
| 19 to 25 Years | 1,588 (94.2%) | 98 (5.8%) |
| 26 to 34 Years | 1,651 (80.2%) | 408 (19.8%) |
| 35 to 44 Years | 2,184 (86.8%) | 331 (13.2%) |
| 45 to 54 Years | 2,188 (79.2%) | 576 (20.8%) |
| 55 to 64 Years | 2,792 (89.6%) | 323 (10.4%) |
| 65 to 74 Years | 2,407 (99.3%) | 16 (0.7%) |
| 75 Years and older | 1,620 (100.0%) | 0 (0.0%) |
| Total | 19,058 (91.2%) | 1,827 (8.7%) |
Health Insurance Coverage by Citizenship Status in Assumption Parish
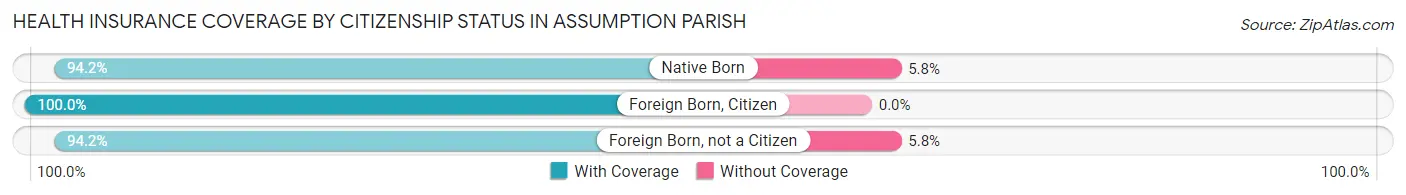
| Citizenship Status | With Coverage | Without Coverage |
| Native Born | 1,222 (94.2%) | 75 (5.8%) |
| Foreign Born, Citizen | 3,406 (100.0%) | 0 (0.0%) |
| Foreign Born, not a Citizen | 1,588 (94.2%) | 98 (5.8%) |
Health Insurance Coverage by Household Income in Assumption Parish
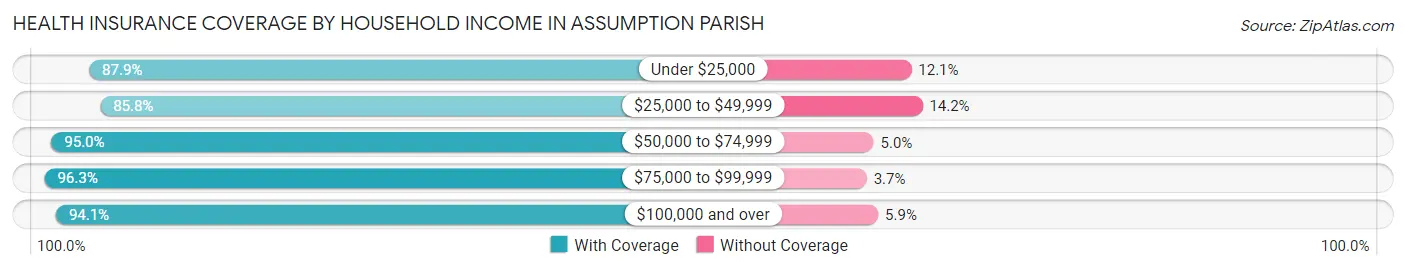
| Household Income | With Coverage | Without Coverage |
| Under $25,000 | 2,833 (87.9%) | 390 (12.1%) |
| $25,000 to $49,999 | 4,853 (85.8%) | 801 (14.2%) |
| $50,000 to $74,999 | 3,026 (95.0%) | 160 (5.0%) |
| $75,000 to $99,999 | 1,987 (96.3%) | 77 (3.7%) |
| $100,000 and over | 6,336 (94.1%) | 396 (5.9%) |
Public vs Private Health Insurance Coverage by Age in Assumption Parish
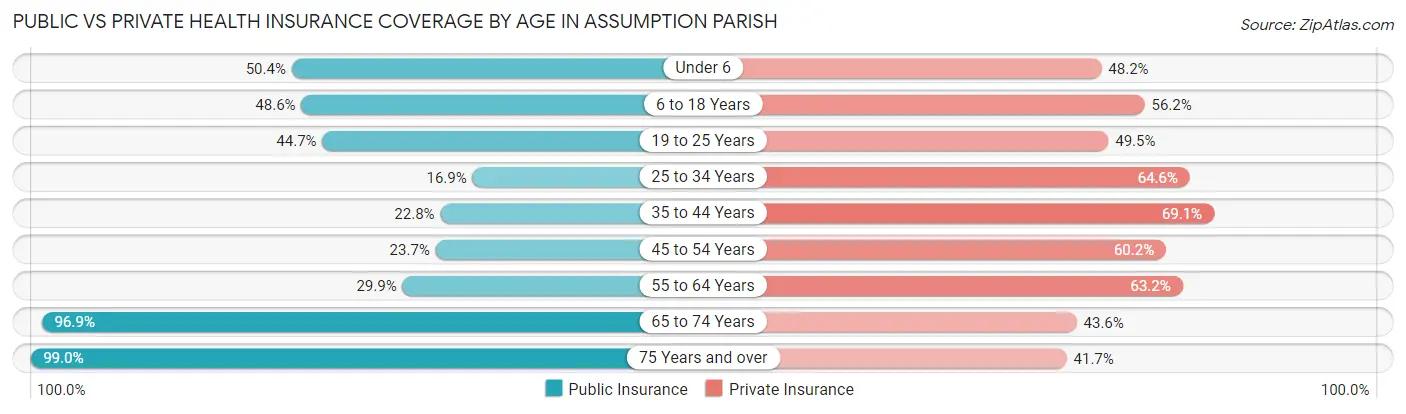
| Age Bracket | Public Insurance | Private Insurance |
| Under 6 | 654 (50.4%) | 625 (48.2%) |
| 6 to 18 Years | 1,656 (48.6%) | 1,914 (56.2%) |
| 19 to 25 Years | 754 (44.7%) | 834 (49.5%) |
| 25 to 34 Years | 347 (16.9%) | 1,330 (64.6%) |
| 35 to 44 Years | 574 (22.8%) | 1,737 (69.1%) |
| 45 to 54 Years | 655 (23.7%) | 1,663 (60.2%) |
| 55 to 64 Years | 930 (29.9%) | 1,970 (63.2%) |
| 65 to 74 Years | 2,347 (96.9%) | 1,056 (43.6%) |
| 75 Years and over | 1,603 (99.0%) | 676 (41.7%) |
| Total | 9,520 (45.6%) | 11,805 (56.5%) |
Disability Status by Sex by Age in Assumption Parish
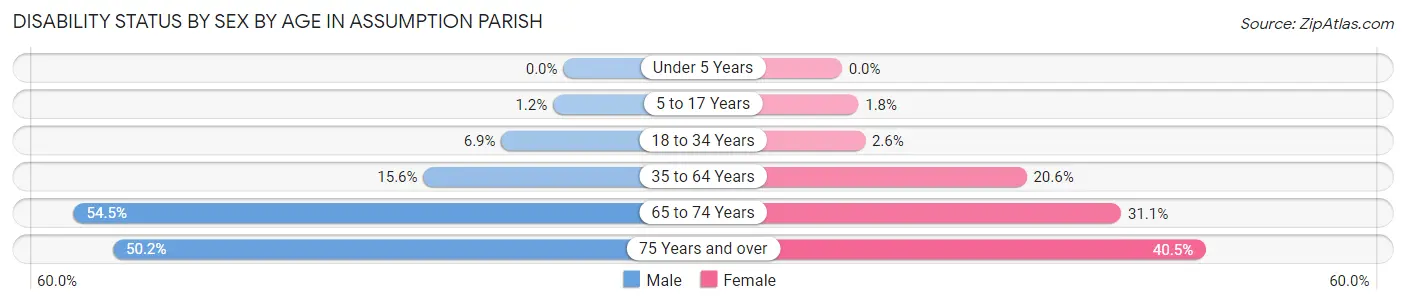
| Age Bracket | Male | Female |
| Under 5 Years | 0 (0.0%) | 0 (0.0%) |
| 5 to 17 Years | 18 (1.1%) | 32 (1.8%) |
| 18 to 34 Years | 134 (6.9%) | 54 (2.6%) |
| 35 to 64 Years | 612 (15.6%) | 919 (20.6%) |
| 65 to 74 Years | 704 (54.5%) | 352 (31.1%) |
| 75 Years and over | 340 (50.1%) | 381 (40.5%) |
Disability Class by Sex by Age in Assumption Parish
Disability Class: Hearing Difficulty
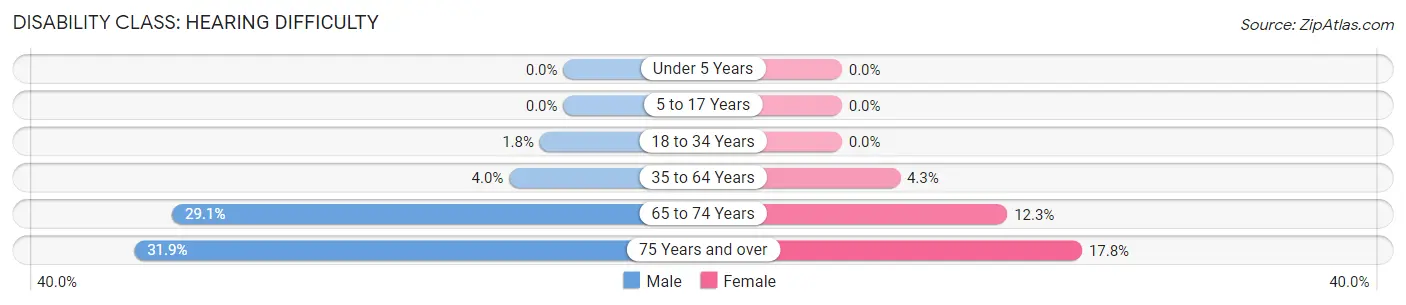
| Age Bracket | Male | Female |
| Under 5 Years | 0 (0.0%) | 0 (0.0%) |
| 5 to 17 Years | 0 (0.0%) | 0 (0.0%) |
| 18 to 34 Years | 34 (1.8%) | 0 (0.0%) |
| 35 to 64 Years | 158 (4.0%) | 193 (4.3%) |
| 65 to 74 Years | 375 (29.0%) | 139 (12.3%) |
| 75 Years and over | 216 (31.9%) | 168 (17.8%) |
Disability Class: Vision Difficulty
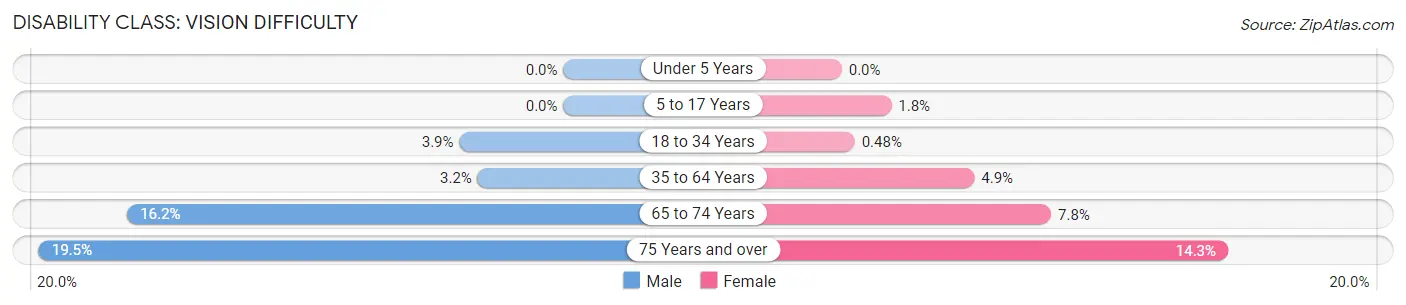
| Age Bracket | Male | Female |
| Under 5 Years | 0 (0.0%) | 0 (0.0%) |
| 5 to 17 Years | 0 (0.0%) | 32 (1.8%) |
| 18 to 34 Years | 75 (3.9%) | 10 (0.5%) |
| 35 to 64 Years | 125 (3.2%) | 220 (4.9%) |
| 65 to 74 Years | 209 (16.2%) | 88 (7.8%) |
| 75 Years and over | 132 (19.5%) | 135 (14.3%) |
Disability Class: Cognitive Difficulty
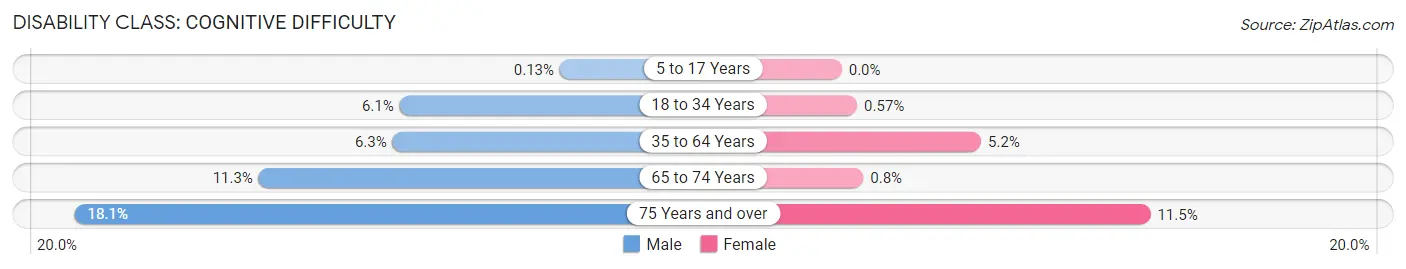
| Age Bracket | Male | Female |
| 5 to 17 Years | 2 (0.1%) | 0 (0.0%) |
| 18 to 34 Years | 118 (6.1%) | 12 (0.6%) |
| 35 to 64 Years | 249 (6.3%) | 231 (5.2%) |
| 65 to 74 Years | 146 (11.3%) | 9 (0.8%) |
| 75 Years and over | 123 (18.1%) | 108 (11.5%) |
Disability Class: Ambulatory Difficulty

| Age Bracket | Male | Female |
| 5 to 17 Years | 16 (1.0%) | 0 (0.0%) |
| 18 to 34 Years | 11 (0.6%) | 0 (0.0%) |
| 35 to 64 Years | 273 (7.0%) | 471 (10.5%) |
| 65 to 74 Years | 223 (17.3%) | 166 (14.7%) |
| 75 Years and over | 191 (28.2%) | 165 (17.5%) |
Disability Class: Self-Care Difficulty
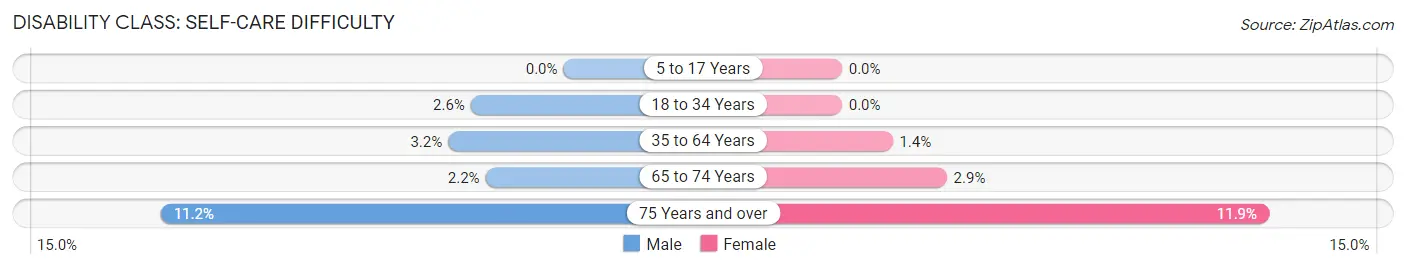
| Age Bracket | Male | Female |
| 5 to 17 Years | 0 (0.0%) | 0 (0.0%) |
| 18 to 34 Years | 50 (2.6%) | 0 (0.0%) |
| 35 to 64 Years | 126 (3.2%) | 63 (1.4%) |
| 65 to 74 Years | 28 (2.2%) | 33 (2.9%) |
| 75 Years and over | 76 (11.2%) | 112 (11.9%) |
Technology Access in Assumption Parish
Computing Device Access in Assumption Parish
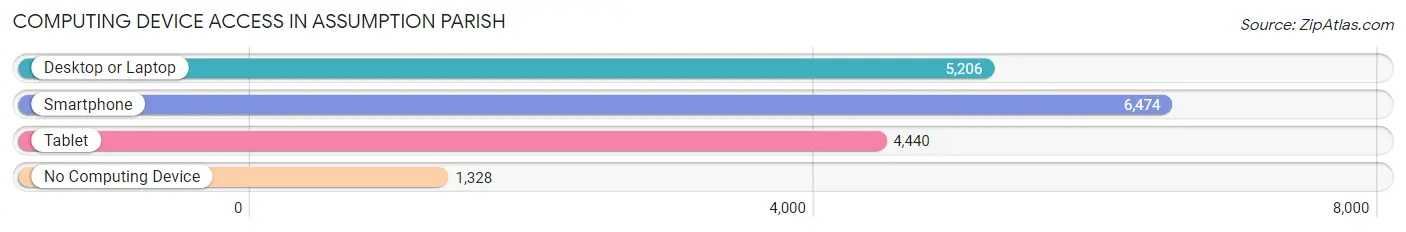
| Device Type | # Households | % Households |
| Desktop or Laptop | 5,206 | 62.2% |
| Smartphone | 6,474 | 77.4% |
| Tablet | 4,440 | 53.1% |
| No Computing Device | 1,328 | 15.9% |
| Total | 8,368 | 100.0% |
Internet Access in Assumption Parish
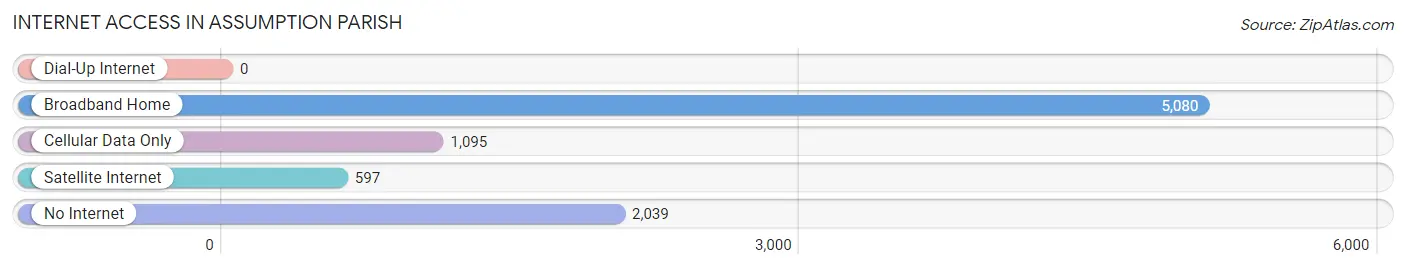
| Internet Type | # Households | % Households |
| Dial-Up Internet | 0 | 0.0% |
| Broadband Home | 5,080 | 60.7% |
| Cellular Data Only | 1,095 | 13.1% |
| Satellite Internet | 597 | 7.1% |
| No Internet | 2,039 | 24.4% |
| Total | 8,368 | 100.0% |
Assumption Parish Summary
Assumption Parish is located in the southeastern part of Louisiana, and is part of the Baton Rouge Metropolitan Statistical Area. It is bordered by Ascension Parish to the north, St. James Parish to the east, Lafourche Parish to the south, and Iberville Parish to the west. The parish seat is Napoleonville, and the largest city is Pierre Part.
History
Assumption Parish was established in 1807, and was named after the Assumption of the Blessed Virgin Mary. The parish was originally part of the German Coast, an area of Louisiana that was settled by German immigrants in the early 1700s. The parish was also home to many Acadian settlers who had been expelled from Nova Scotia in the mid-1700s.
In the early 1800s, the parish was home to a large sugar cane industry, and many of the plantations in the area were owned by wealthy planters. During the Civil War, the parish was the site of several battles, including the Battle of Labadieville in 1863.
Geography
Assumption Parish is located in the southeastern part of Louisiana, and is part of the Baton Rouge Metropolitan Statistical Area. It is bordered by Ascension Parish to the north, St. James Parish to the east, Lafourche Parish to the south, and Iberville Parish to the west. The parish has a total area of 545 square miles, of which 543 square miles is land and 2 square miles is water.
The parish is located in the Mississippi River Delta region, and is home to several bayous, including Bayou Lafourche, Bayou L'Ours, and Bayou Terrebonne. The parish is also home to several lakes, including Lake Verret, Lake Palourde, and Lake Fausse Pointe.
Economy
The economy of Assumption Parish is largely based on agriculture and oil and gas production. The parish is home to several large sugar cane plantations, and is also a major producer of crawfish, shrimp, and oysters.
The parish is also home to several oil and gas production facilities, and is a major producer of natural gas. The parish is also home to several chemical plants, including the Dow Chemical plant in Plaquemine.
Demographics
As of the 2010 census, the population of Assumption Parish was 23,421, with a population density of 43 people per square mile. The racial makeup of the parish was 79.3% White, 17.7% African American, 0.4% Native American, 0.3% Asian, 0.1% Pacific Islander, 0.7% from other races, and 1.5% from two or more races. Hispanic or Latino of any race were 2.3% of the population.
The median income for a household in the parish was $37,945, and the median income for a family was $45,945. The per capita income for the parish was $18,945. About 17.3% of families and 21.2% of the population were below the poverty line, including 28.3% of those under age 18 and 16.2% of those age 65 or over.
Common Questions
What is the Total Population of Assumption Parish?
Total Population of Assumption Parish is 21,067.
What is the Total Male Population of Assumption Parish?
Total Male Population of Assumption Parish is 10,039.
What is the Total Female Population of Assumption Parish?
Total Female Population of Assumption Parish is 11,028.
What is the Ratio of Males per 100 Females in Assumption Parish?
There are 91.03 Males per 100 Females in Assumption Parish.
What is the Ratio of Females per 100 Males in Assumption Parish?
There are 109.85 Females per 100 Males in Assumption Parish.
What is the Median Population Age in Assumption Parish?
Median Population Age in Assumption Parish is 41.9 Years.
What is the Average Family Size in Assumption Parish
Average Family Size in Assumption Parish is 3.1 People.
What is the Average Household Size in Assumption Parish
Average Household Size in Assumption Parish is 2.5 People.
What is Per Capita Income in Assumption Parish?
Per Capita income in Assumption Parish is $28,758.
What is the Median Family Income in Assumption Parish?
Median Family Income in Assumption Parish is $69,477.
What is the Median Household income in Assumption Parish?
Median Household Income in Assumption Parish is $47,023.
What is Income or Wage Gap in Assumption Parish?
Income or Wage Gap in Assumption Parish is 47.9%.
Women in Assumption Parish earn 52.1 cents for every dollar earned by a man.
What is Family Income Deficit in Assumption Parish?
Family Income Deficit in Assumption Parish is $9,866.
Families that are below poverty line in Assumption Parish earn $9,866 less on average than the poverty threshold level.
What is Inequality or Gini Index in Assumption Parish?
Inequality or Gini Index in Assumption Parish is 0.48.
How Large is the Labor Force in Assumption Parish?
There are 9,369 People in the Labor Forcein in Assumption Parish.
What is the Percentage of People in the Labor Force in Assumption Parish?
54.4% of People are in the Labor Force in Assumption Parish.
What is the Unemployment Rate in Assumption Parish?
Unemployment Rate in Assumption Parish is 8.0%.