Allen Parish, LA
Allen Parish Map
Allen Parish Overview
22,798
TOTAL POPULATION
12,751
MALE POPULATION
10,047
FEMALE POPULATION
126.91
MALES / 100 FEMALES
78.79
FEMALES / 100 MALES
38.5
MEDIAN AGE
3.0
AVG FAMILY SIZE
2.5
AVG HOUSEHOLD SIZE
$23,971
PER CAPITA INCOME
$61,779
AVG FAMILY INCOME
$52,755
AVG HOUSEHOLD INCOME
29.5%
WAGE / INCOME GAP [ % ]
70.5¢/ $1
WAGE / INCOME GAP [ $ ]
$10,958
FAMILY INCOME DEFICIT
0.46
INEQUALITY / GINI INDEX
8,563
LABOR FORCE [ PEOPLE ]
47.1%
PERCENT IN LABOR FORCE
8.9%
UNEMPLOYMENT RATE
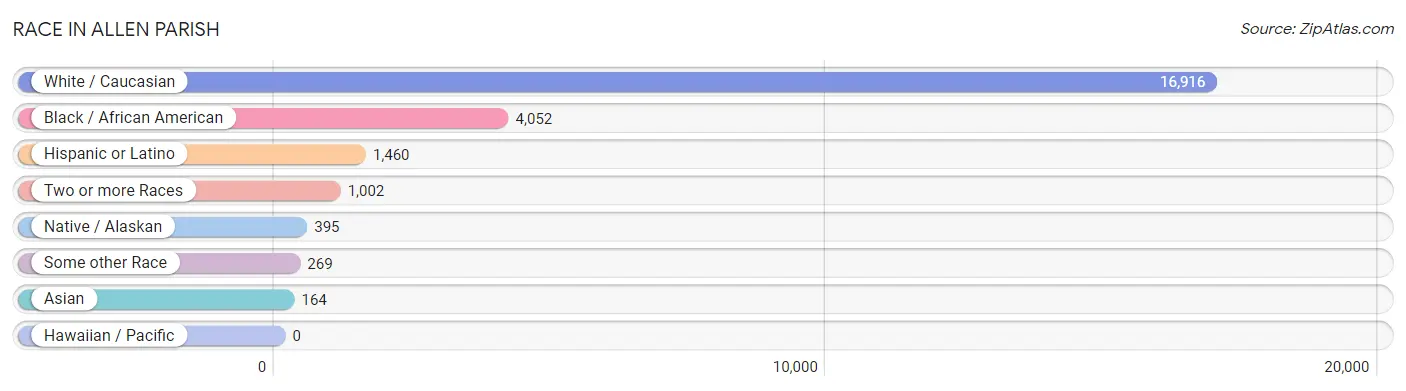
Race in Allen Parish
The most populous races in Allen Parish are White / Caucasian (16,916 | 74.2%), Black / African American (4,052 | 17.8%), and Hispanic or Latino (1,460 | 6.4%).
| Race | # Population | % Population |
| Asian | 164 | 0.7% |
| Black / African American | 4,052 | 17.8% |
| Hawaiian / Pacific | 0 | 0.0% |
| Hispanic or Latino | 1,460 | 6.4% |
| Native / Alaskan | 395 | 1.7% |
| White / Caucasian | 16,916 | 74.2% |
| Two or more Races | 1,002 | 4.4% |
| Some other Race | 269 | 1.2% |
| Total | 22,798 | 100.0% |
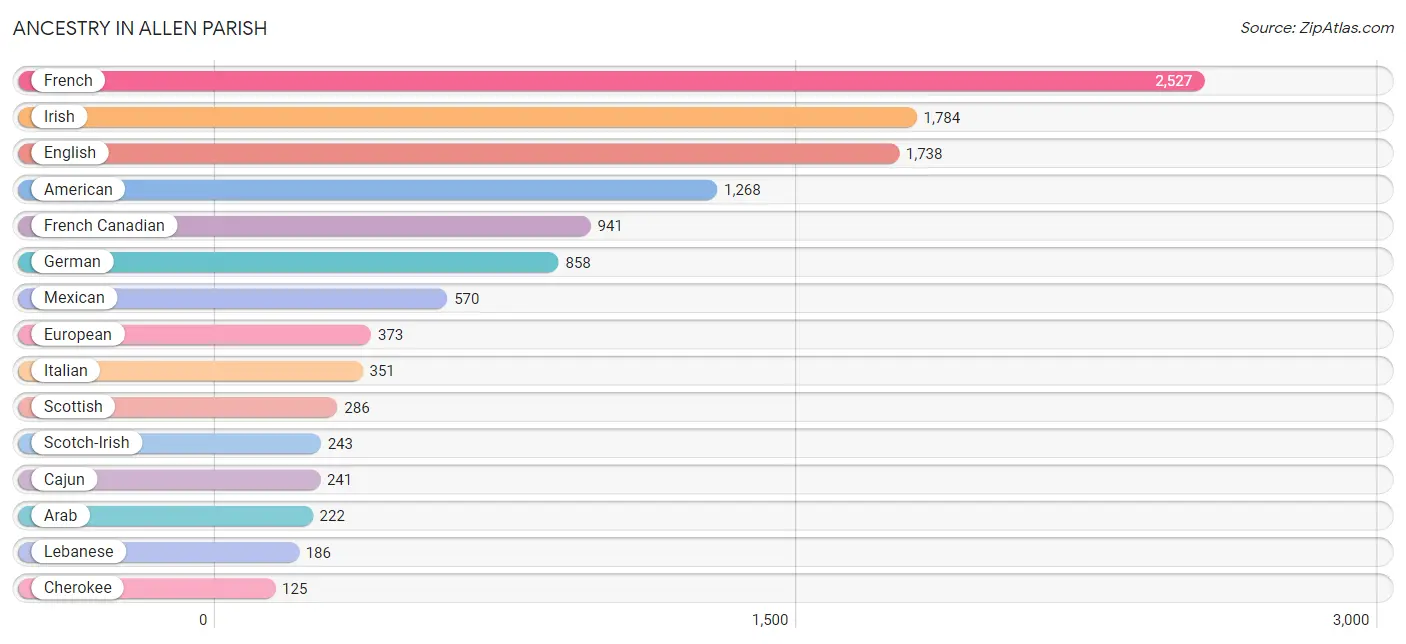
Ancestry in Allen Parish
The most populous ancestries reported in Allen Parish are French (2,527 | 11.1%), Irish (1,784 | 7.8%), English (1,738 | 7.6%), American (1,268 | 5.6%), and French Canadian (941 | 4.1%), together accounting for 36.2% of all Allen Parish residents.
| Ancestry | # Population | % Population |
| African | 50 | 0.2% |
| Albanian | 21 | 0.1% |
| American | 1,268 | 5.6% |
| Apache | 9 | 0.0% |
| Arab | 222 | 1.0% |
| Belgian | 6 | 0.0% |
| Bhutanese | 111 | 0.5% |
| Blackfeet | 1 | 0.0% |
| British | 37 | 0.2% |
| Burmese | 5 | 0.0% |
| Cajun | 241 | 1.1% |
| Central American | 27 | 0.1% |
| Cherokee | 125 | 0.5% |
| Choctaw | 23 | 0.1% |
| Colombian | 47 | 0.2% |
| Croatian | 1 | 0.0% |
| Dutch | 25 | 0.1% |
| Eastern European | 32 | 0.1% |
| English | 1,738 | 7.6% |
| European | 373 | 1.6% |
| French | 2,527 | 11.1% |
| French Canadian | 941 | 4.1% |
| German | 858 | 3.8% |
| Greek | 60 | 0.3% |
| Honduran | 13 | 0.1% |
| Hungarian | 47 | 0.2% |
| Iranian | 12 | 0.1% |
| Irish | 1,784 | 7.8% |
| Italian | 351 | 1.5% |
| Jamaican | 7 | 0.0% |
| Korean | 9 | 0.0% |
| Lebanese | 186 | 0.8% |
| Mexican | 570 | 2.5% |
| Norwegian | 12 | 0.1% |
| Pakistani | 9 | 0.0% |
| Panamanian | 14 | 0.1% |
| Polish | 29 | 0.1% |
| Portuguese | 40 | 0.2% |
| Puerto Rican | 76 | 0.3% |
| Russian | 71 | 0.3% |
| Scotch-Irish | 243 | 1.1% |
| Scottish | 286 | 1.3% |
| South American | 47 | 0.2% |
| Spaniard | 2 | 0.0% |
| Spanish | 25 | 0.1% |
| Subsaharan African | 50 | 0.2% |
| Swedish | 91 | 0.4% |
| Swiss | 2 | 0.0% |
| Syrian | 66 | 0.3% |
| Welsh | 62 | 0.3% | View All 50 Rows |
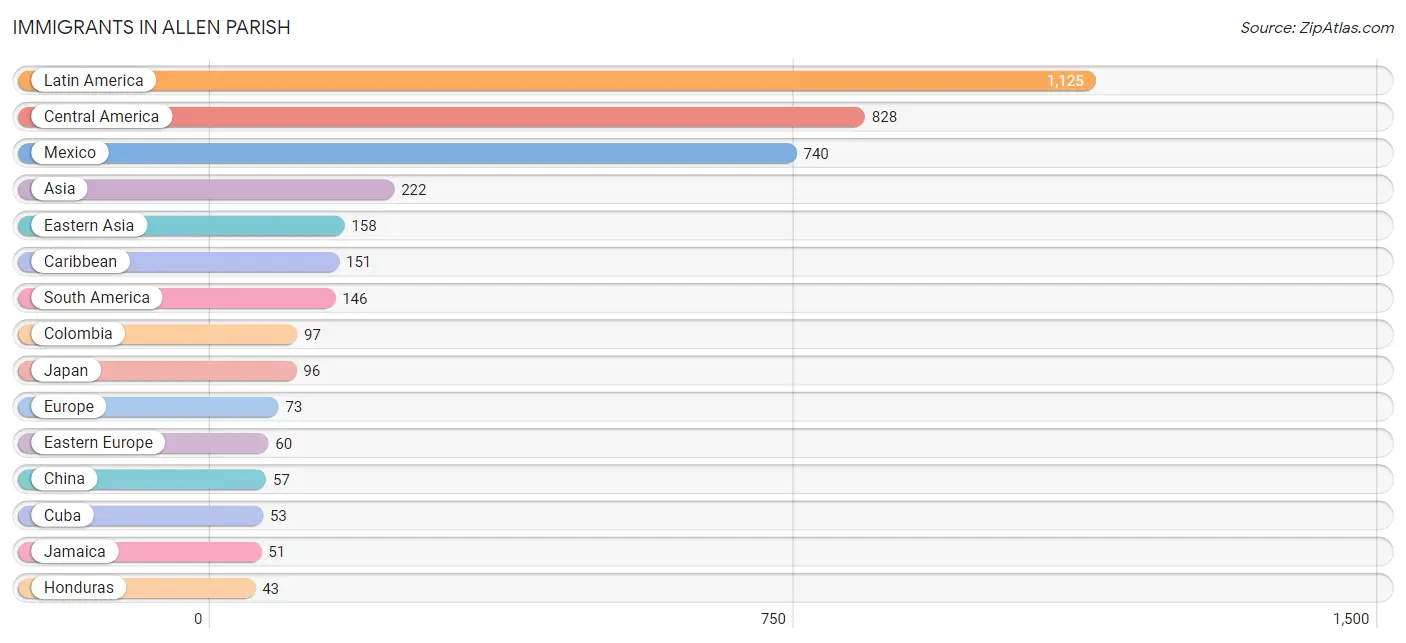
Immigrants in Allen Parish
The most numerous immigrant groups reported in Allen Parish came from Latin America (1,125 | 4.9%), Central America (828 | 3.6%), Mexico (740 | 3.3%), Asia (222 | 1.0%), and Eastern Asia (158 | 0.7%), together accounting for 13.5% of all Allen Parish residents.
| Immigration Origin | # Population | % Population |
| Africa | 41 | 0.2% |
| Asia | 222 | 1.0% |
| Australia | 14 | 0.1% |
| Bangladesh | 13 | 0.1% |
| Brazil | 15 | 0.1% |
| Canada | 9 | 0.0% |
| Caribbean | 151 | 0.7% |
| Central America | 828 | 3.6% |
| China | 57 | 0.3% |
| Colombia | 97 | 0.4% |
| Cuba | 53 | 0.2% |
| Dominican Republic | 38 | 0.2% |
| Eastern Africa | 7 | 0.0% |
| Eastern Asia | 158 | 0.7% |
| Eastern Europe | 60 | 0.3% |
| El Salvador | 15 | 0.1% |
| Europe | 73 | 0.3% |
| Germany | 13 | 0.1% |
| Guatemala | 9 | 0.0% |
| Guyana | 1 | 0.0% |
| Haiti | 7 | 0.0% |
| Honduras | 43 | 0.2% |
| Iran | 12 | 0.1% |
| Jamaica | 51 | 0.2% |
| Japan | 96 | 0.4% |
| Korea | 5 | 0.0% |
| Laos | 8 | 0.0% |
| Latin America | 1,125 | 4.9% |
| Mexico | 740 | 3.3% |
| Nicaragua | 7 | 0.0% |
| Nigeria | 16 | 0.1% |
| Oceania | 14 | 0.1% |
| Pakistan | 5 | 0.0% |
| Panama | 14 | 0.1% |
| Peru | 7 | 0.0% |
| Philippines | 12 | 0.1% |
| Romania | 35 | 0.2% |
| South Africa | 18 | 0.1% |
| South America | 146 | 0.6% |
| South Central Asia | 30 | 0.1% |
| South Eastern Asia | 34 | 0.2% |
| Thailand | 7 | 0.0% |
| Venezuela | 26 | 0.1% |
| Vietnam | 7 | 0.0% |
| Western Africa | 16 | 0.1% |
| Western Europe | 13 | 0.1% |
| Zimbabwe | 7 | 0.0% | View All 47 Rows |
Sex and Age in Allen Parish
Sex and Age in Allen Parish
The most populous age groups in Allen Parish are 40 to 44 Years (1,104 | 8.7%) for men and 5 to 9 Years (735 | 7.3%) for women.
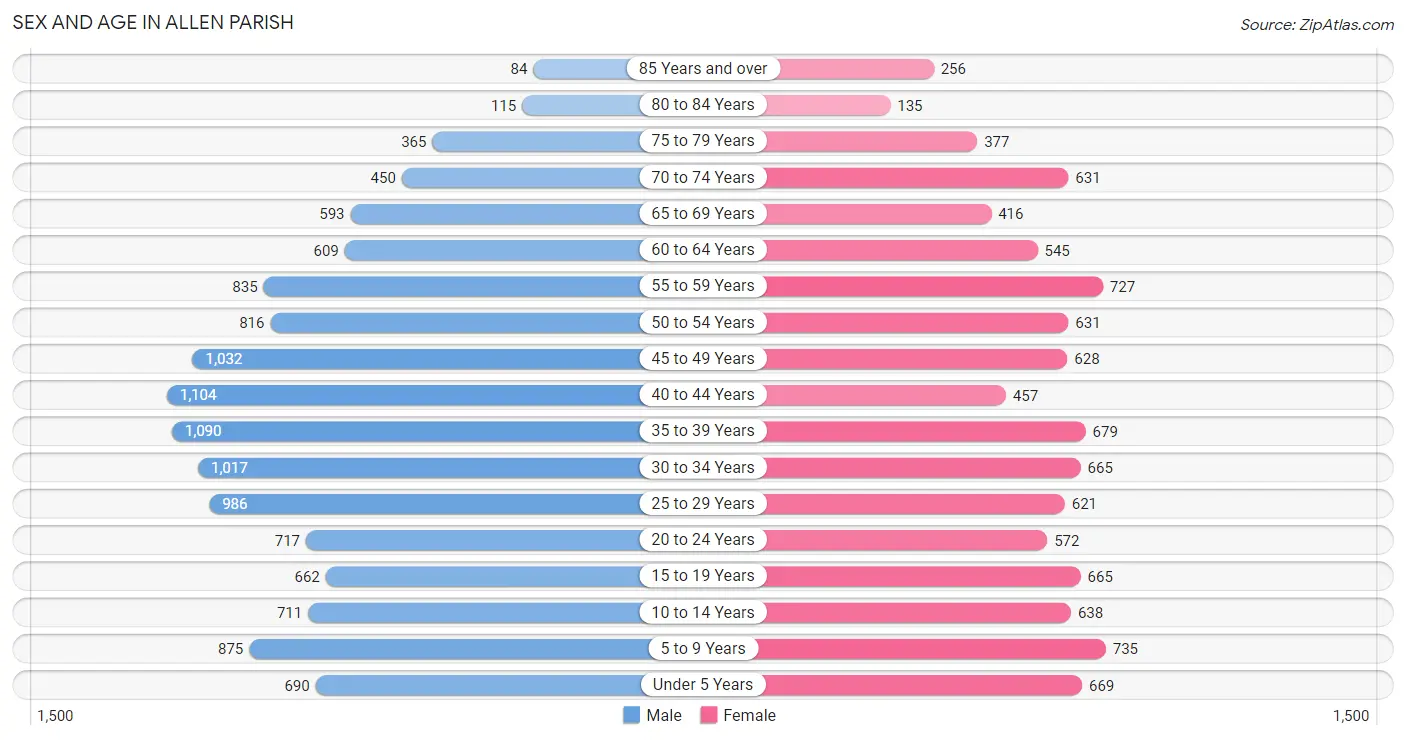
| Age Bracket | Male | Female |
| Under 5 Years | 690 (5.4%) | 669 (6.7%) |
| 5 to 9 Years | 875 (6.9%) | 735 (7.3%) |
| 10 to 14 Years | 711 (5.6%) | 638 (6.4%) |
| 15 to 19 Years | 662 (5.2%) | 665 (6.6%) |
| 20 to 24 Years | 717 (5.6%) | 572 (5.7%) |
| 25 to 29 Years | 986 (7.7%) | 621 (6.2%) |
| 30 to 34 Years | 1,017 (8.0%) | 665 (6.6%) |
| 35 to 39 Years | 1,090 (8.6%) | 679 (6.8%) |
| 40 to 44 Years | 1,104 (8.7%) | 457 (4.5%) |
| 45 to 49 Years | 1,032 (8.1%) | 628 (6.2%) |
| 50 to 54 Years | 816 (6.4%) | 631 (6.3%) |
| 55 to 59 Years | 835 (6.6%) | 727 (7.2%) |
| 60 to 64 Years | 609 (4.8%) | 545 (5.4%) |
| 65 to 69 Years | 593 (4.6%) | 416 (4.1%) |
| 70 to 74 Years | 450 (3.5%) | 631 (6.3%) |
| 75 to 79 Years | 365 (2.9%) | 377 (3.7%) |
| 80 to 84 Years | 115 (0.9%) | 135 (1.3%) |
| 85 Years and over | 84 (0.7%) | 256 (2.5%) |
| Total | 12,751 (100.0%) | 10,047 (100.0%) |
Families and Households in Allen Parish
Median Family Size in Allen Parish
The median family size in Allen Parish is 2.95 persons per family, with single female/mother families (1,193 | 22.2%) accounting for the largest median family size of 2.96 persons per family. On the other hand, single male/father families (587 | 10.9%) represent the smallest median family size with 2.94 persons per family.
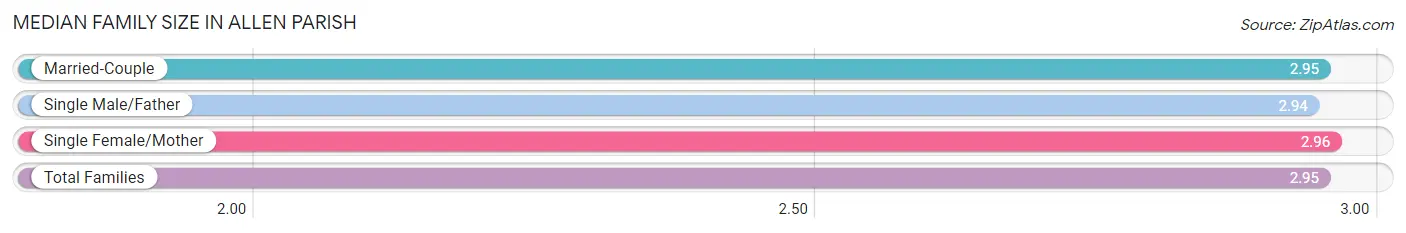
| Family Type | # Families | Family Size |
| Married-Couple | 3,590 (66.8%) | 2.95 |
| Single Male/Father | 587 (10.9%) | 2.94 |
| Single Female/Mother | 1,193 (22.2%) | 2.96 |
| Total Families | 5,370 (100.0%) | 2.95 |
Median Household Size in Allen Parish
The median household size in Allen Parish is 2.52 persons per household, with single male/father households (587 | 7.7%) accounting for the largest median household size of 4.05 persons per household. non-family households (2,266 | 29.7%) represent the smallest median household size with 1.10 persons per household.
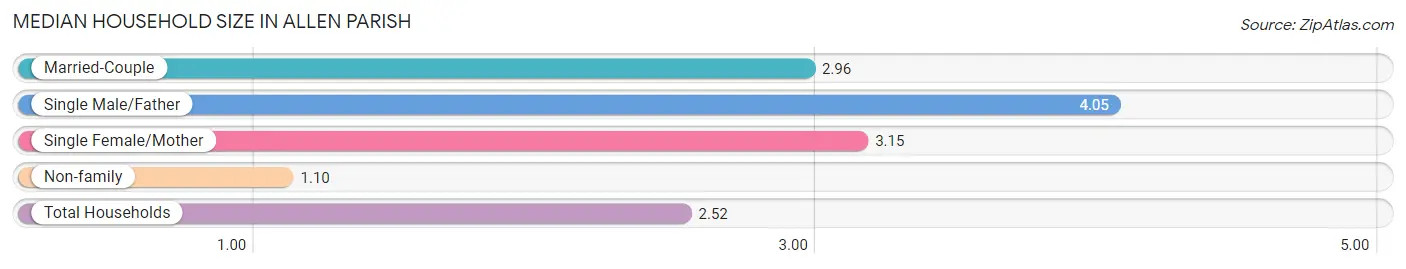
| Household Type | # Households | Household Size |
| Married-Couple | 3,590 (47.0%) | 2.96 |
| Single Male/Father | 587 (7.7%) | 4.05 |
| Single Female/Mother | 1,193 (15.6%) | 3.15 |
| Non-family | 2,266 (29.7%) | 1.10 |
| Total Households | 7,636 (100.0%) | 2.52 |
Household Size by Marriage Status in Allen Parish
Out of a total of 7,636 households in Allen Parish, 5,370 (70.3%) are family households, while 2,266 (29.7%) are nonfamily households. The most numerous type of family households are 2-person households, comprising 2,329, and the most common type of nonfamily households are 1-person households, comprising 2,111.
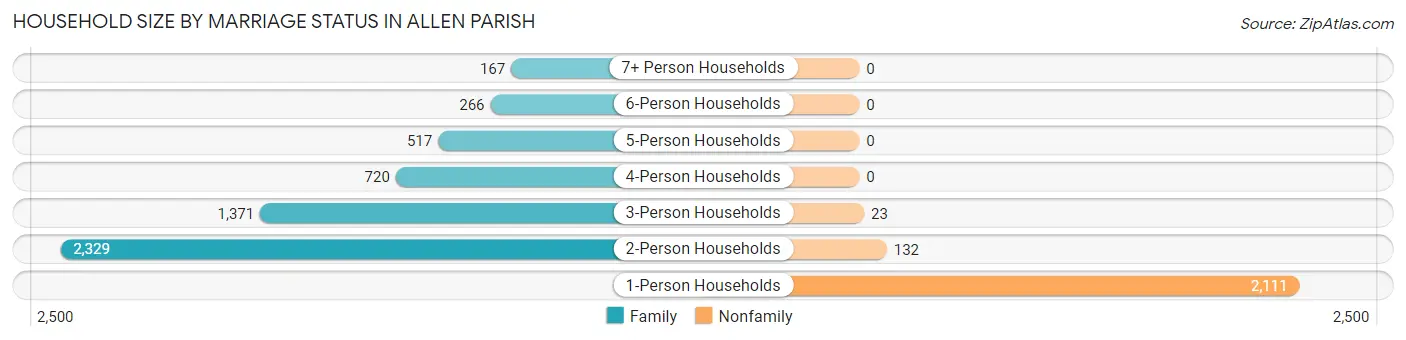
| Household Size | Family Households | Nonfamily Households |
| 1-Person Households | - | 2,111 (27.7%) |
| 2-Person Households | 2,329 (30.5%) | 132 (1.7%) |
| 3-Person Households | 1,371 (17.9%) | 23 (0.3%) |
| 4-Person Households | 720 (9.4%) | 0 (0.0%) |
| 5-Person Households | 517 (6.8%) | 0 (0.0%) |
| 6-Person Households | 266 (3.5%) | 0 (0.0%) |
| 7+ Person Households | 167 (2.2%) | 0 (0.0%) |
| Total | 5,370 (70.3%) | 2,266 (29.7%) |
Female Fertility in Allen Parish
Fertility by Age in Allen Parish
Average fertility rate in Allen Parish is 84.0 births per 1,000 women. Women in the age bracket of 20 to 34 years have the highest fertility rate with 162.0 births per 1,000 women. Women in the age bracket of 20 to 34 years acount for 81.4% of all women with births.
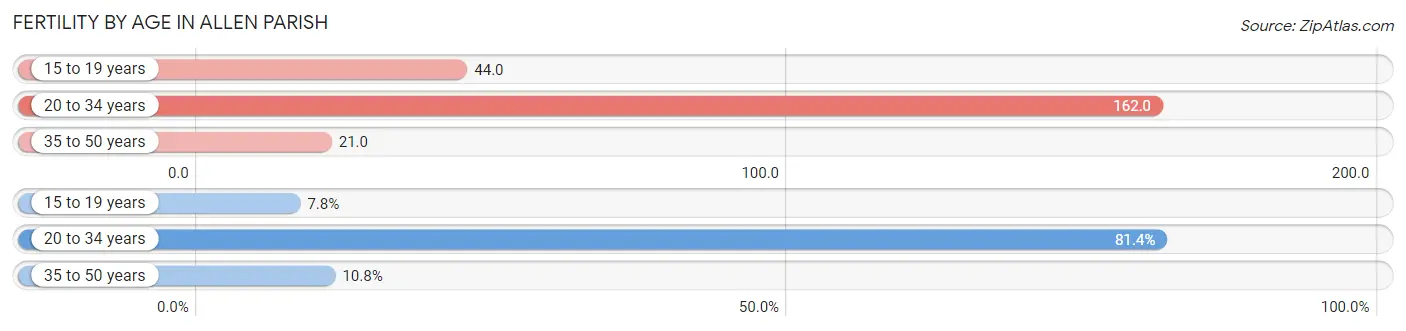
| Age Bracket | Women with Births | Births / 1,000 Women |
| 15 to 19 years | 29 (7.8%) | 44.0 |
| 20 to 34 years | 301 (81.4%) | 162.0 |
| 35 to 50 years | 40 (10.8%) | 21.0 |
| Total | 370 (100.0%) | 84.0 |
Fertility by Age by Marriage Status in Allen Parish
56.5% of women with births (370) in Allen Parish are married. The highest percentage of unmarried women with births falls into 15 to 19 years age bracket with 100.0% of them unmarried at the time of birth, while the lowest percentage of unmarried women with births belong to 20 to 34 years age bracket with 32.2% of them unmarried.
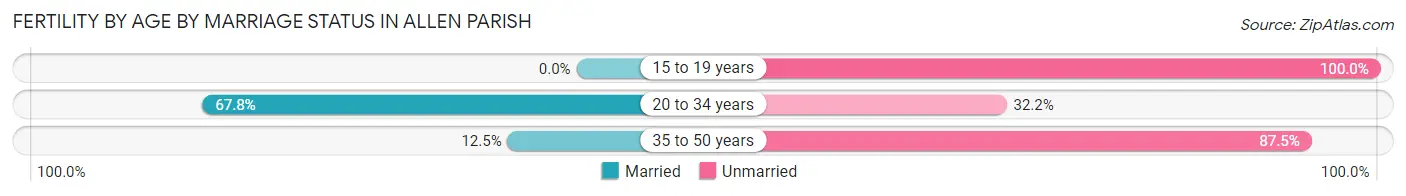
| Age Bracket | Married | Unmarried |
| 15 to 19 years | 0 (0.0%) | 29 (100.0%) |
| 20 to 34 years | 204 (67.8%) | 97 (32.2%) |
| 35 to 50 years | 5 (12.5%) | 35 (87.5%) |
| Total | 209 (56.5%) | 161 (43.5%) |
Fertility by Education in Allen Parish
Average fertility rate in Allen Parish is 84.0 births per 1,000 women. Women with the education attainment of graduate degree have the highest fertility rate of 119.0 births per 1,000 women, while women with the education attainment of bachelor's degree have the lowest fertility at 31.0 births per 1,000 women. Women with the education attainment of high school diploma represent 39.7% of all women with births.
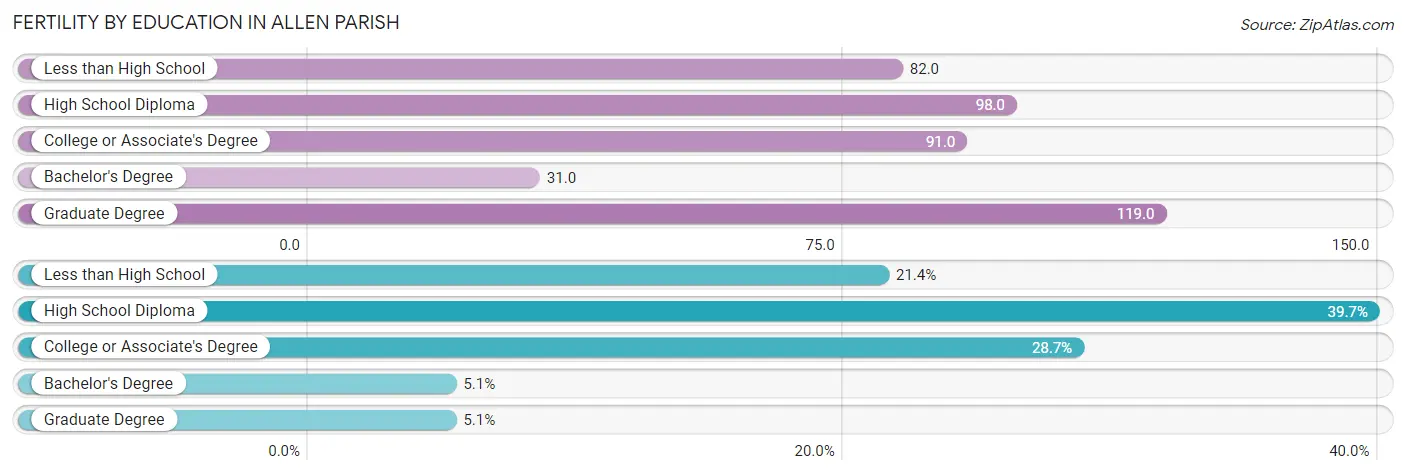
| Educational Attainment | Women with Births | Births / 1,000 Women |
| Less than High School | 79 (21.3%) | 82.0 |
| High School Diploma | 147 (39.7%) | 98.0 |
| College or Associate's Degree | 106 (28.6%) | 91.0 |
| Bachelor's Degree | 19 (5.1%) | 31.0 |
| Graduate Degree | 19 (5.1%) | 119.0 |
| Total | 370 (100.0%) | 84.0 |
Fertility by Education by Marriage Status in Allen Parish
43.5% of women with births in Allen Parish are unmarried. Women with the educational attainment of bachelor's degree are most likely to be married with 100.0% of them married at childbirth, while women with the educational attainment of less than high school are least likely to be married with 58.2% of them unmarried at childbirth.
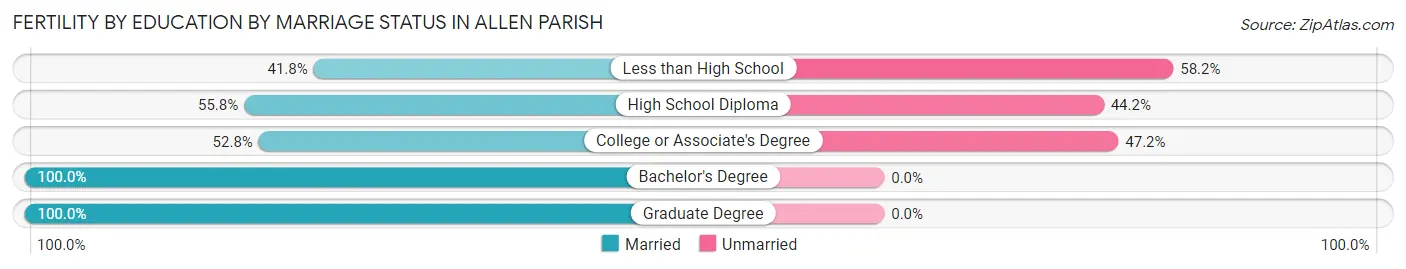
| Educational Attainment | Married | Unmarried |
| Less than High School | 33 (41.8%) | 46 (58.2%) |
| High School Diploma | 82 (55.8%) | 65 (44.2%) |
| College or Associate's Degree | 56 (52.8%) | 50 (47.2%) |
| Bachelor's Degree | 19 (100.0%) | 0 (0.0%) |
| Graduate Degree | 19 (100.0%) | 0 (0.0%) |
| Total | 209 (56.5%) | 161 (43.5%) |
Income in Allen Parish
Income Overview in Allen Parish
Per Capita Income in Allen Parish is $23,971, while median incomes of families and households are $61,779 and $52,755 respectively.
| Characteristic | Number | Measure |
| Per Capita Income | 22,798 | $23,971 |
| Median Family Income | 5,370 | $61,779 |
| Mean Family Income | 5,370 | $81,189 |
| Median Household Income | 7,636 | $52,755 |
| Mean Household Income | 7,636 | $68,154 |
| Income Deficit | 5,370 | $10,958 |
| Wage / Income Gap (%) | 22,798 | 29.47% |
| Wage / Income Gap ($) | 22,798 | 70.53¢ per $1 |
| Gini / Inequality Index | 22,798 | 0.46 |
Earnings by Sex in Allen Parish
Average Earnings in Allen Parish are $28,878, $35,963 for men and $25,364 for women, a difference of 29.5%.
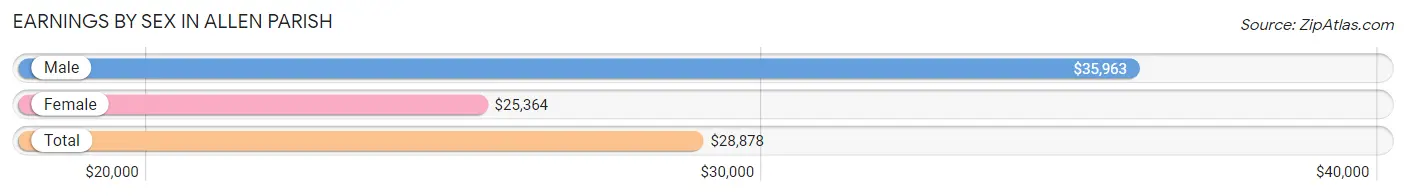
| Sex | Number | Average Earnings |
| Male | 5,530 (55.7%) | $35,963 |
| Female | 4,400 (44.3%) | $25,364 |
| Total | 9,930 (100.0%) | $28,878 |
Earnings by Sex by Income Bracket in Allen Parish
The most common earnings brackets in Allen Parish are $100,000+ for men (888 | 16.1%) and $25,000 to $29,999 for women (553 | 12.6%).
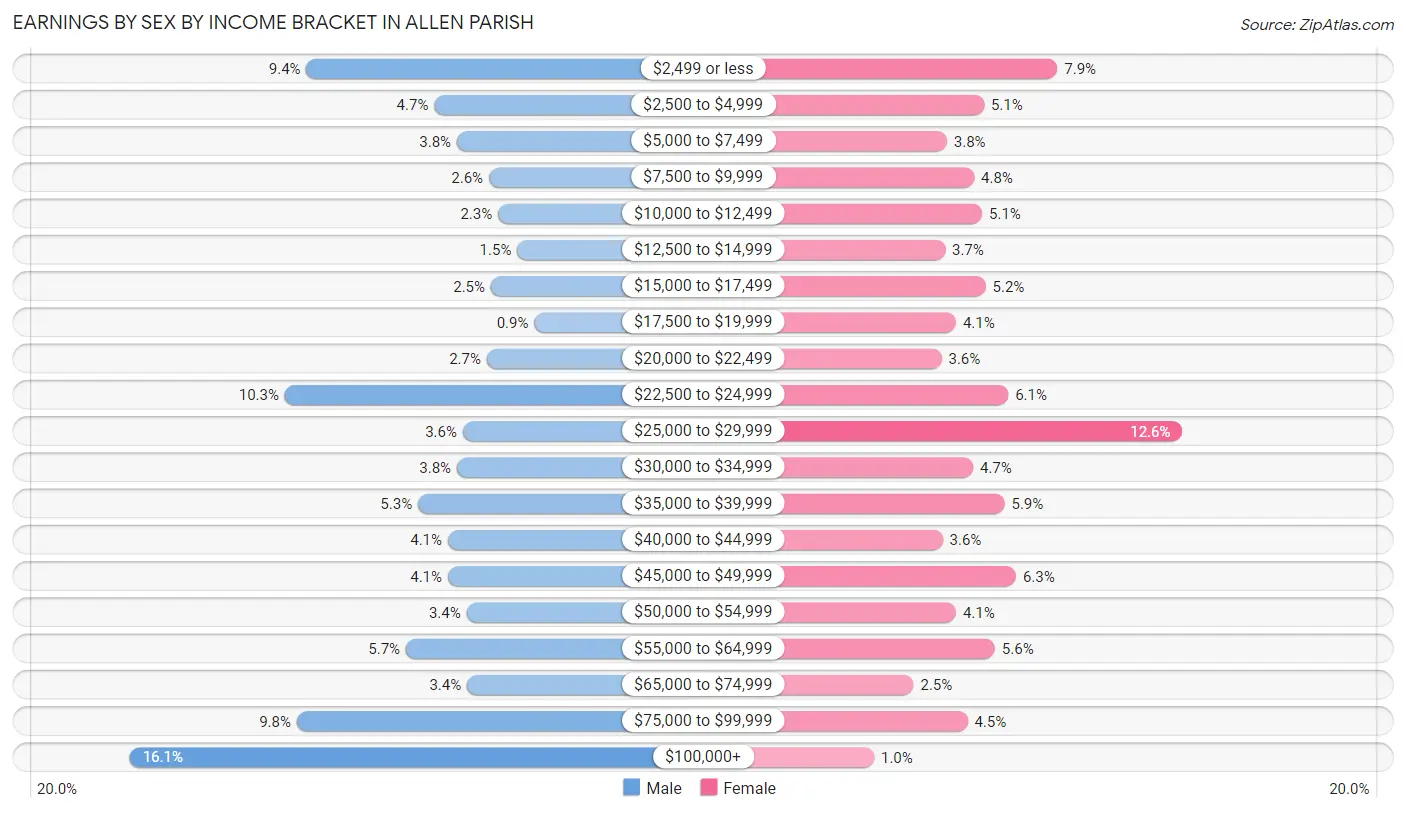
| Income | Male | Female |
| $2,499 or less | 522 (9.4%) | 347 (7.9%) |
| $2,500 to $4,999 | 257 (4.6%) | 226 (5.1%) |
| $5,000 to $7,499 | 210 (3.8%) | 165 (3.7%) |
| $7,500 to $9,999 | 144 (2.6%) | 210 (4.8%) |
| $10,000 to $12,499 | 125 (2.3%) | 223 (5.1%) |
| $12,500 to $14,999 | 85 (1.5%) | 162 (3.7%) |
| $15,000 to $17,499 | 140 (2.5%) | 229 (5.2%) |
| $17,500 to $19,999 | 50 (0.9%) | 180 (4.1%) |
| $20,000 to $22,499 | 148 (2.7%) | 156 (3.5%) |
| $22,500 to $24,999 | 567 (10.2%) | 266 (6.0%) |
| $25,000 to $29,999 | 198 (3.6%) | 553 (12.6%) |
| $30,000 to $34,999 | 210 (3.8%) | 208 (4.7%) |
| $35,000 to $39,999 | 291 (5.3%) | 260 (5.9%) |
| $40,000 to $44,999 | 229 (4.1%) | 158 (3.6%) |
| $45,000 to $49,999 | 229 (4.1%) | 279 (6.3%) |
| $50,000 to $54,999 | 190 (3.4%) | 180 (4.1%) |
| $55,000 to $64,999 | 316 (5.7%) | 244 (5.6%) |
| $65,000 to $74,999 | 189 (3.4%) | 110 (2.5%) |
| $75,000 to $99,999 | 542 (9.8%) | 199 (4.5%) |
| $100,000+ | 888 (16.1%) | 45 (1.0%) |
| Total | 5,530 (100.0%) | 4,400 (100.0%) |
Earnings by Sex by Educational Attainment in Allen Parish
Average earnings in Allen Parish are $42,510 for men and $27,742 for women, a difference of 34.7%. Men with an educational attainment of graduate degree enjoy the highest average annual earnings of $84,805, while those with less than high school education earn the least with $23,693. Women with an educational attainment of graduate degree earn the most with the average annual earnings of $55,250, while those with less than high school education have the smallest earnings of $23,079.
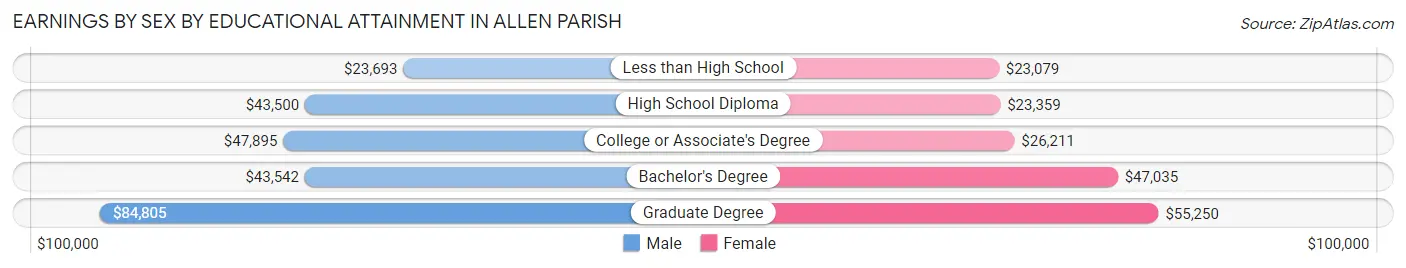
| Educational Attainment | Male Income | Female Income |
| Less than High School | $23,693 | $23,079 |
| High School Diploma | $43,500 | $23,359 |
| College or Associate's Degree | $47,895 | $26,211 |
| Bachelor's Degree | $43,542 | $47,035 |
| Graduate Degree | $84,805 | $55,250 |
| Total | $42,510 | $27,742 |
Family Income in Allen Parish
Family Income Brackets in Allen Parish
According to the Allen Parish family income data, there are 1,112 families falling into the $50,000 to $74,999 income range, which is the most common income bracket and makes up 20.7% of all families. Conversely, the $10,000 to $14,999 income bracket is the least frequent group with only 140 families (2.6%) belonging to this category.
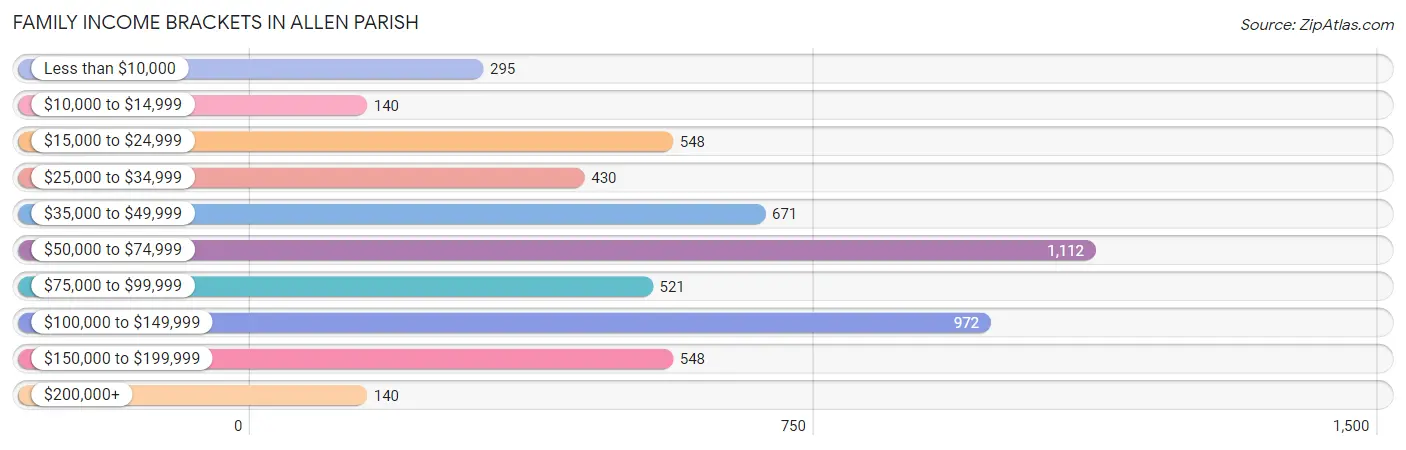
| Income Bracket | # Families | % Families |
| Less than $10,000 | 295 | 5.5% |
| $10,000 to $14,999 | 140 | 2.6% |
| $15,000 to $24,999 | 548 | 10.2% |
| $25,000 to $34,999 | 430 | 8.0% |
| $35,000 to $49,999 | 671 | 12.5% |
| $50,000 to $74,999 | 1,112 | 20.7% |
| $75,000 to $99,999 | 521 | 9.7% |
| $100,000 to $149,999 | 972 | 18.1% |
| $150,000 to $199,999 | 548 | 10.2% |
| $200,000+ | 140 | 2.6% |
Family Income by Famaliy Size in Allen Parish
7+ person families (86 | 1.6%) account for the highest median family income in Allen Parish with $250,001 per family, while 7+ person families (86 | 1.6%) have the highest median income of $35,714 per family member.
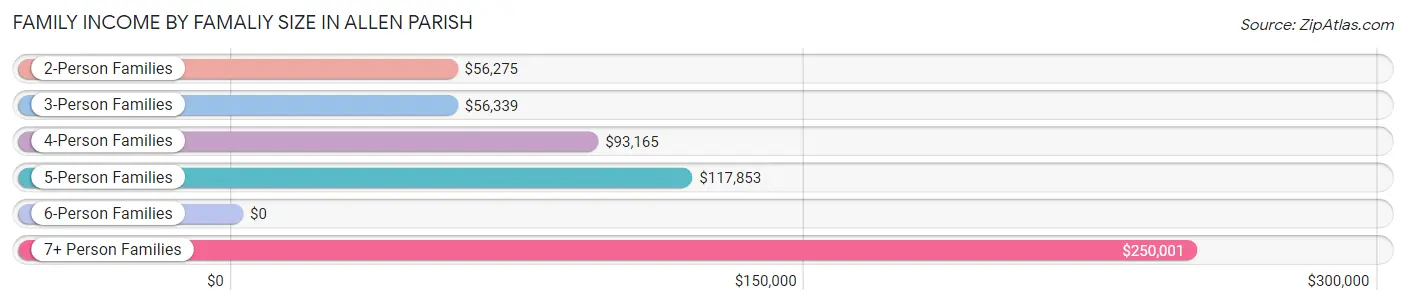
| Income Bracket | # Families | Median Income |
| 2-Person Families | 2,494 (46.4%) | $56,275 |
| 3-Person Families | 1,363 (25.4%) | $56,339 |
| 4-Person Families | 692 (12.9%) | $93,165 |
| 5-Person Families | 535 (10.0%) | $117,853 |
| 6-Person Families | 200 (3.7%) | $0 |
| 7+ Person Families | 86 (1.6%) | $250,001 |
| Total | 5,370 (100.0%) | $61,779 |
Family Income by Number of Earners in Allen Parish
The median family income in Allen Parish is $61,779, with families comprising 3+ earners (519) having the highest median family income of $142,804, while families with no earners (914) have the lowest median family income of $35,592, accounting for 9.7% and 17.0% of families, respectively.
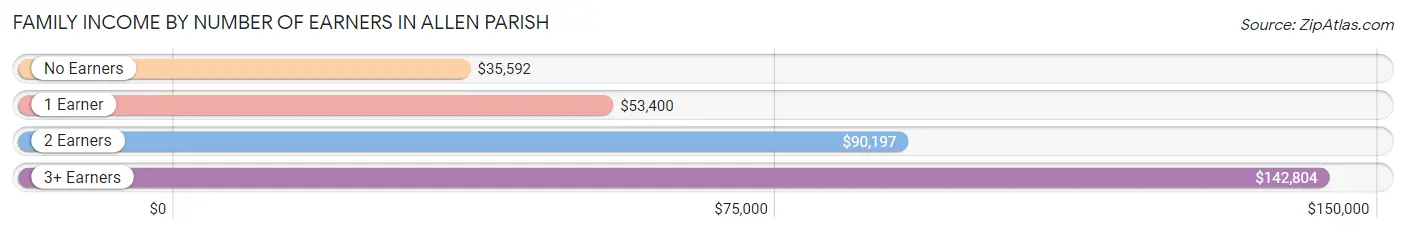
| Number of Earners | # Families | Median Income |
| No Earners | 914 (17.0%) | $35,592 |
| 1 Earner | 2,134 (39.7%) | $53,400 |
| 2 Earners | 1,803 (33.6%) | $90,197 |
| 3+ Earners | 519 (9.7%) | $142,804 |
| Total | 5,370 (100.0%) | $61,779 |
Household Income in Allen Parish
Household Income Brackets in Allen Parish
With 1,458 households falling in the category, the $50,000 to $74,999 income range is the most frequent in Allen Parish, accounting for 19.1% of all households. In contrast, only 160 households (2.1%) fall into the $200,000+ income bracket, making it the least populous group.
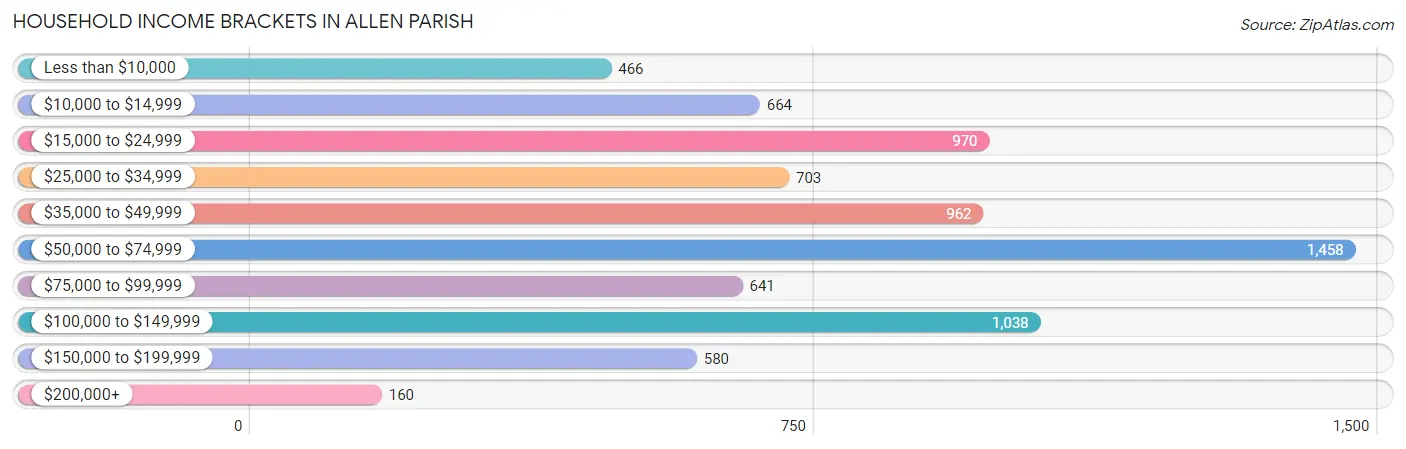
| Income Bracket | # Households | % Households |
| Less than $10,000 | 466 | 6.1% |
| $10,000 to $14,999 | 664 | 8.7% |
| $15,000 to $24,999 | 970 | 12.7% |
| $25,000 to $34,999 | 703 | 9.2% |
| $35,000 to $49,999 | 962 | 12.6% |
| $50,000 to $74,999 | 1,458 | 19.1% |
| $75,000 to $99,999 | 641 | 8.4% |
| $100,000 to $149,999 | 1,038 | 13.6% |
| $150,000 to $199,999 | 580 | 7.6% |
| $200,000+ | 160 | 2.1% |
Household Income by Householder Age in Allen Parish
The median household income in Allen Parish is $52,755, with the highest median household income of $65,958 found in the 15 to 24 years age bracket for the primary householder. A total of 197 households (2.6%) fall into this category. Meanwhile, the 65+ years age bracket for the primary householder has the lowest median household income of $36,040, with 2,050 households (26.9%) in this group.
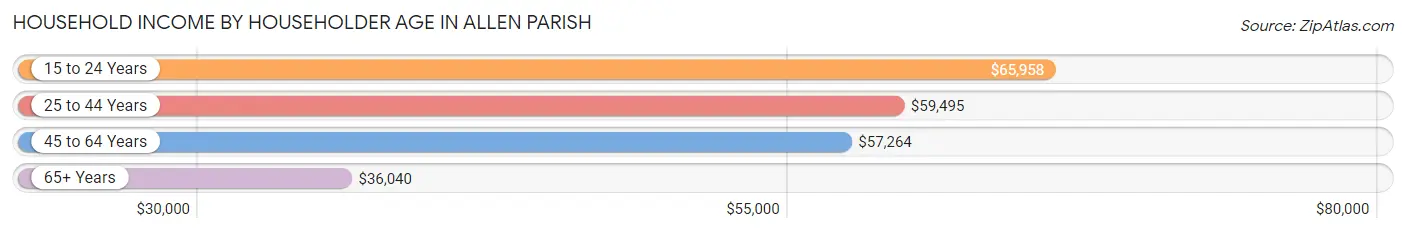
| Income Bracket | # Households | Median Income |
| 15 to 24 Years | 197 (2.6%) | $65,958 |
| 25 to 44 Years | 2,435 (31.9%) | $59,495 |
| 45 to 64 Years | 2,954 (38.7%) | $57,264 |
| 65+ Years | 2,050 (26.9%) | $36,040 |
| Total | 7,636 (100.0%) | $52,755 |
Poverty in Allen Parish
Income Below Poverty by Sex and Age in Allen Parish
With 17.0% poverty level for males and 22.0% for females among the residents of Allen Parish, 6 to 11 year old males and 5 year old females are the most vulnerable to poverty, with 352 males (37.8%) and 134 females (79.3%) in their respective age groups living below the poverty level.
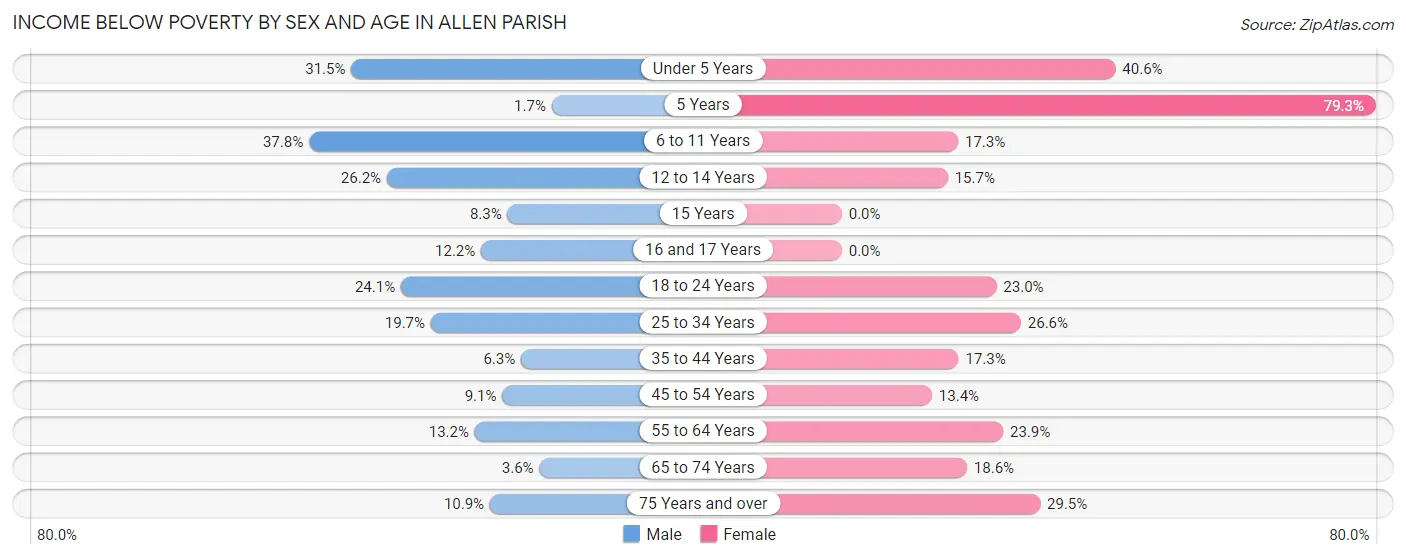
| Age Bracket | Male | Female |
| Under 5 Years | 217 (31.5%) | 258 (40.6%) |
| 5 Years | 1 (1.7%) | 134 (79.3%) |
| 6 to 11 Years | 352 (37.8%) | 127 (17.3%) |
| 12 to 14 Years | 115 (26.2%) | 56 (15.7%) |
| 15 Years | 18 (8.3%) | 0 (0.0%) |
| 16 and 17 Years | 26 (12.2%) | 0 (0.0%) |
| 18 to 24 Years | 190 (24.1%) | 174 (23.0%) |
| 25 to 34 Years | 254 (19.7%) | 342 (26.6%) |
| 35 to 44 Years | 65 (6.3%) | 197 (17.3%) |
| 45 to 54 Years | 98 (9.1%) | 168 (13.4%) |
| 55 to 64 Years | 136 (13.2%) | 304 (23.9%) |
| 65 to 74 Years | 32 (3.5%) | 194 (18.6%) |
| 75 Years and over | 51 (10.9%) | 202 (29.4%) |
| Total | 1,555 (17.0%) | 2,156 (22.0%) |
Income Above Poverty by Sex and Age in Allen Parish
According to the poverty statistics in Allen Parish, males aged 5 years and females aged 15 years are the age groups that are most secure financially, with 98.3% of males and 100.0% of females in these age groups living above the poverty line.
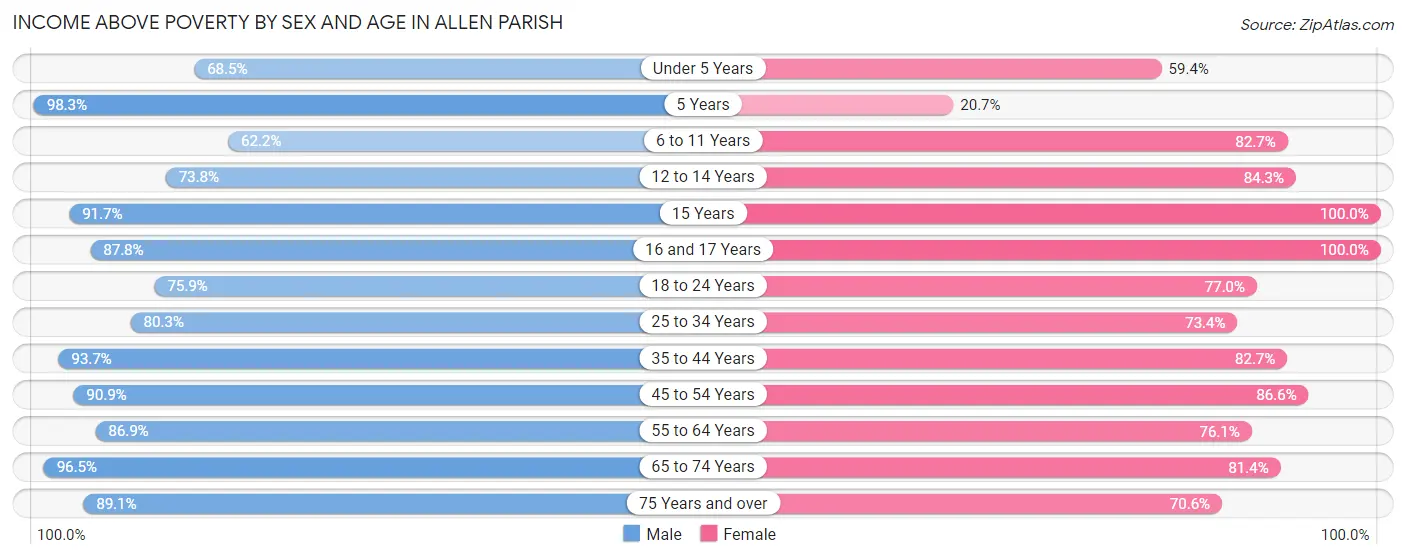
| Age Bracket | Male | Female |
| Under 5 Years | 472 (68.5%) | 377 (59.4%) |
| 5 Years | 57 (98.3%) | 35 (20.7%) |
| 6 to 11 Years | 580 (62.2%) | 609 (82.7%) |
| 12 to 14 Years | 324 (73.8%) | 300 (84.3%) |
| 15 Years | 199 (91.7%) | 82 (100.0%) |
| 16 and 17 Years | 187 (87.8%) | 394 (100.0%) |
| 18 to 24 Years | 598 (75.9%) | 584 (77.0%) |
| 25 to 34 Years | 1,037 (80.3%) | 944 (73.4%) |
| 35 to 44 Years | 970 (93.7%) | 939 (82.7%) |
| 45 to 54 Years | 983 (90.9%) | 1,088 (86.6%) |
| 55 to 64 Years | 898 (86.9%) | 966 (76.1%) |
| 65 to 74 Years | 870 (96.5%) | 850 (81.4%) |
| 75 Years and over | 417 (89.1%) | 484 (70.6%) |
| Total | 7,592 (83.0%) | 7,652 (78.0%) |
Income Below Poverty Among Married-Couple Families in Allen Parish
The poverty statistics for married-couple families in Allen Parish show that 7.0% or 250 of the total 3,590 families live below the poverty line. Families with 3 or 4 children have the highest poverty rate of 18.3%, comprising of 61 families. On the other hand, families with 5 or more children have the lowest poverty rate of 0.0%, which includes 0 families.
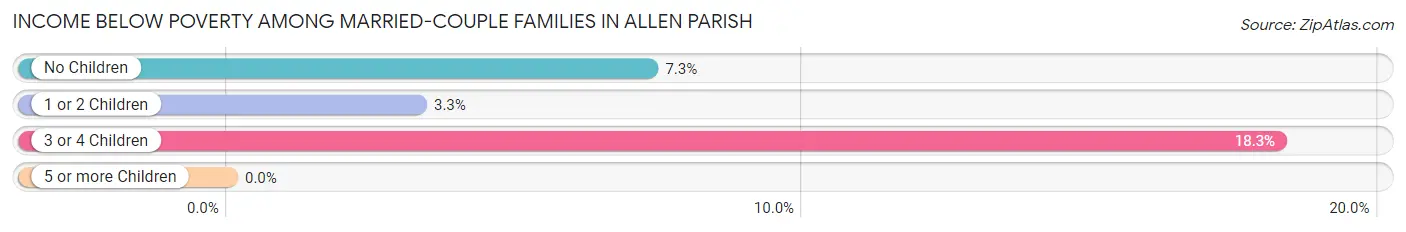
| Children | Above Poverty | Below Poverty |
| No Children | 1,887 (92.7%) | 149 (7.3%) |
| 1 or 2 Children | 1,175 (96.7%) | 40 (3.3%) |
| 3 or 4 Children | 273 (81.7%) | 61 (18.3%) |
| 5 or more Children | 5 (100.0%) | 0 (0.0%) |
| Total | 3,340 (93.0%) | 250 (7.0%) |
Income Below Poverty Among Single-Parent Households in Allen Parish
According to the poverty data in Allen Parish, 19.1% or 112 single-father households and 42.5% or 507 single-mother households are living below the poverty line. Among single-father households, those with 3 or 4 children have the highest poverty rate, with 73 households (94.8%) experiencing poverty. Likewise, among single-mother households, those with 5 or more children have the highest poverty rate, with 85 households (100.0%) falling below the poverty line.
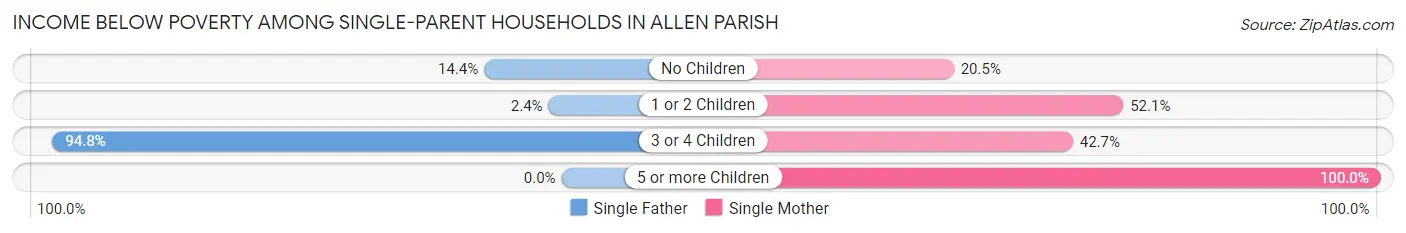
| Children | Single Father | Single Mother |
| No Children | 32 (14.4%) | 91 (20.5%) |
| 1 or 2 Children | 7 (2.4%) | 264 (52.1%) |
| 3 or 4 Children | 73 (94.8%) | 67 (42.7%) |
| 5 or more Children | 0 (0.0%) | 85 (100.0%) |
| Total | 112 (19.1%) | 507 (42.5%) |
Income Below Poverty Among Married-Couple vs Single-Parent Households in Allen Parish
The poverty data for Allen Parish shows that 250 of the married-couple family households (7.0%) and 619 of the single-parent households (34.8%) are living below the poverty level. Within the married-couple family households, those with 3 or 4 children have the highest poverty rate, with 61 households (18.3%) falling below the poverty line. Among the single-parent households, those with 5 or more children have the highest poverty rate, with 85 household (100.0%) living below poverty.
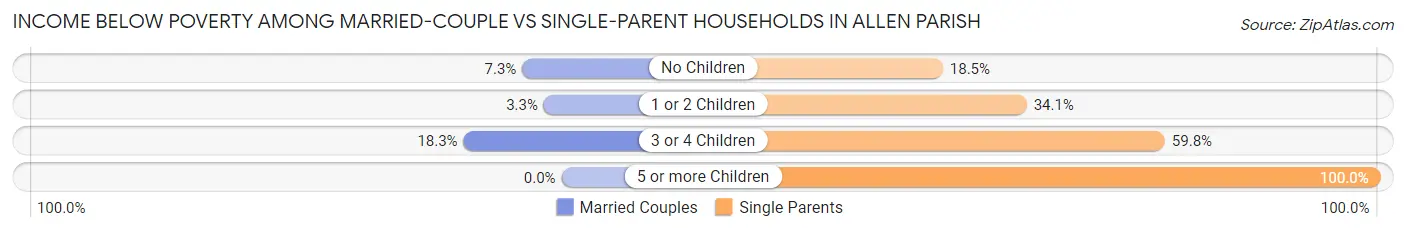
| Children | Married-Couple Families | Single-Parent Households |
| No Children | 149 (7.3%) | 123 (18.5%) |
| 1 or 2 Children | 40 (3.3%) | 271 (34.1%) |
| 3 or 4 Children | 61 (18.3%) | 140 (59.8%) |
| 5 or more Children | 0 (0.0%) | 85 (100.0%) |
| Total | 250 (7.0%) | 619 (34.8%) |
Employment Characteristics in Allen Parish
Employment by Class of Employer in Allen Parish
Among the 7,720 employed individuals in Allen Parish, private company employees (4,831 | 62.6%), local government employees (877 | 11.4%), and federal government employees (502 | 6.5%) make up the most common classes of employment.
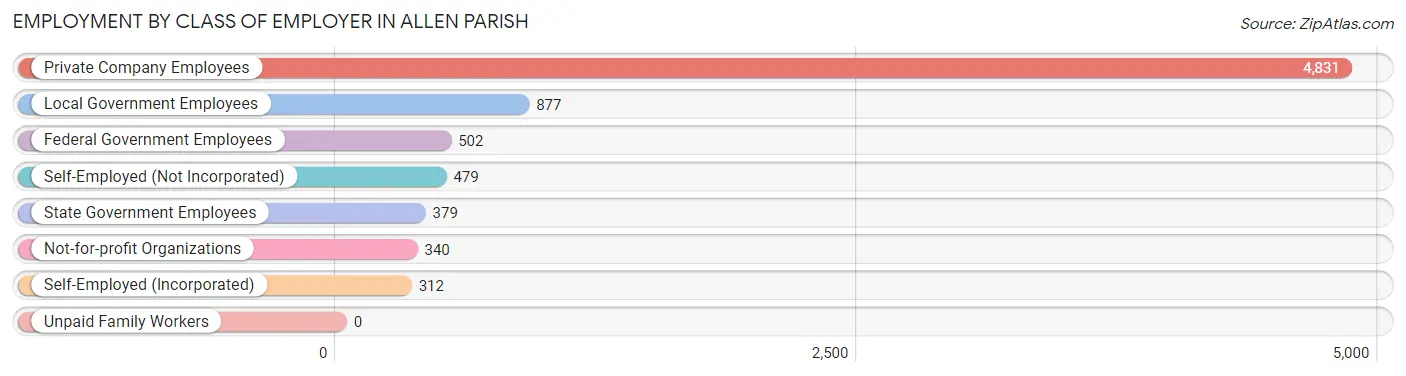
| Employer Class | # Employees | % Employees |
| Private Company Employees | 4,831 | 62.6% |
| Self-Employed (Incorporated) | 312 | 4.0% |
| Self-Employed (Not Incorporated) | 479 | 6.2% |
| Not-for-profit Organizations | 340 | 4.4% |
| Local Government Employees | 877 | 11.4% |
| State Government Employees | 379 | 4.9% |
| Federal Government Employees | 502 | 6.5% |
| Unpaid Family Workers | 0 | 0.0% |
| Total | 7,720 | 100.0% |
Employment Status by Age in Allen Parish
According to the labor force statistics for Allen Parish, out of the total population over 16 years of age (18,180), 47.1% or 8,563 individuals are in the labor force, with 8.9% or 762 of them unemployed. The age group with the highest labor force participation rate is 25 to 29 years, with 74.1% or 1,191 individuals in the labor force. Within the labor force, the 16 to 19 years age range has the highest percentage of unemployed individuals, with 34.2% or 134 of them being unemployed.
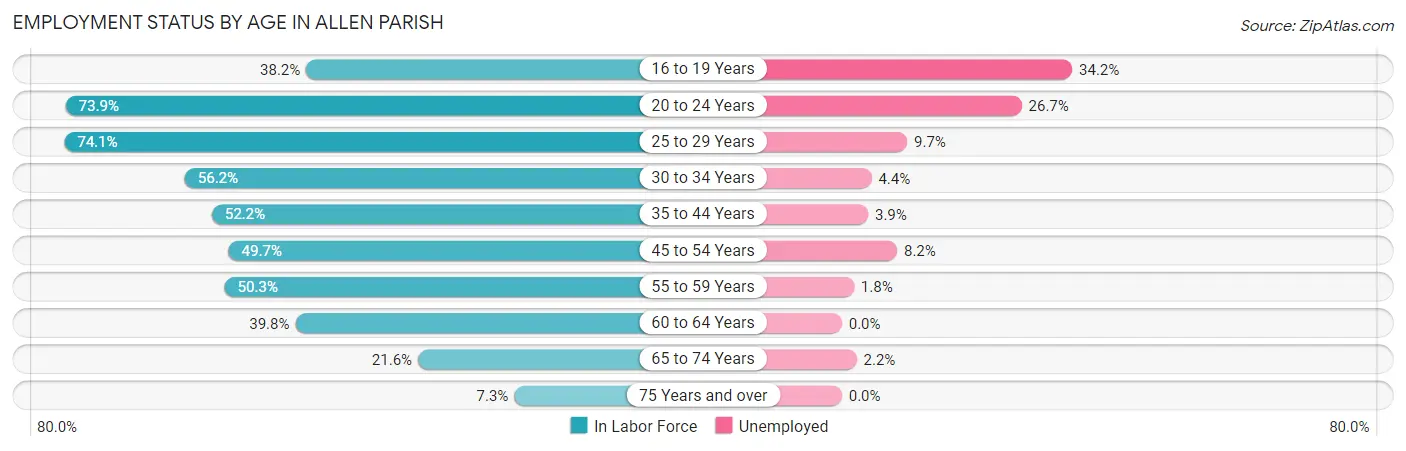
| Age Bracket | In Labor Force | Unemployed |
| 16 to 19 Years | 392 (38.2%) | 134 (34.2%) |
| 20 to 24 Years | 953 (73.9%) | 254 (26.7%) |
| 25 to 29 Years | 1,191 (74.1%) | 116 (9.7%) |
| 30 to 34 Years | 945 (56.2%) | 42 (4.4%) |
| 35 to 44 Years | 1,738 (52.2%) | 68 (3.9%) |
| 45 to 54 Years | 1,544 (49.7%) | 127 (8.2%) |
| 55 to 59 Years | 786 (50.3%) | 14 (1.8%) |
| 60 to 64 Years | 459 (39.8%) | 0 (0.0%) |
| 65 to 74 Years | 451 (21.6%) | 10 (2.2%) |
| 75 Years and over | 97 (7.3%) | 0 (0.0%) |
| Total | 8,563 (47.1%) | 762 (8.9%) |
Employment Status by Educational Attainment in Allen Parish
According to labor force statistics for Allen Parish, 53.5% of individuals (6,656) out of the total population between 25 and 64 years of age (12,442) are in the labor force, with 5.5% or 366 of them being unemployed. The group with the highest labor force participation rate are those with the educational attainment of bachelor's degree or higher, with 80.3% or 1,213 individuals in the labor force. Within the labor force, individuals with bachelor's degree or higher education have the highest percentage of unemployment, with 11.3% or 137 of them being unemployed.
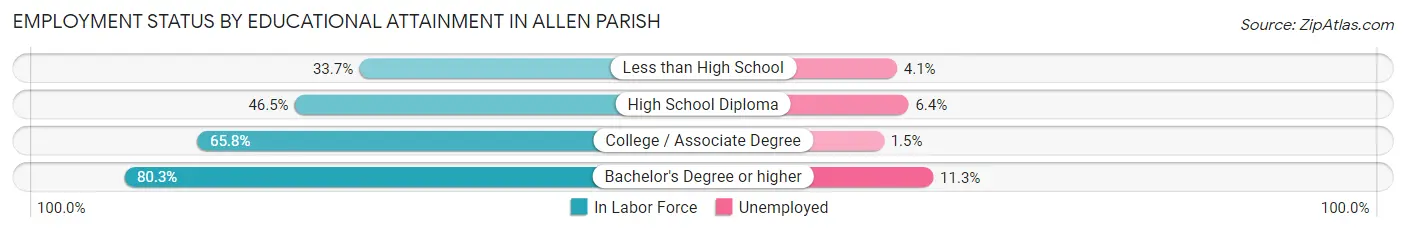
| Educational Attainment | In Labor Force | Unemployed |
| Less than High School | 704 (33.7%) | 86 (4.1%) |
| High School Diploma | 2,594 (46.5%) | 357 (6.4%) |
| College / Associate Degree | 2,148 (65.8%) | 49 (1.5%) |
| Bachelor's Degree or higher | 1,213 (80.3%) | 171 (11.3%) |
| Total | 6,656 (53.5%) | 684 (5.5%) |
Employment Occupations by Sex in Allen Parish
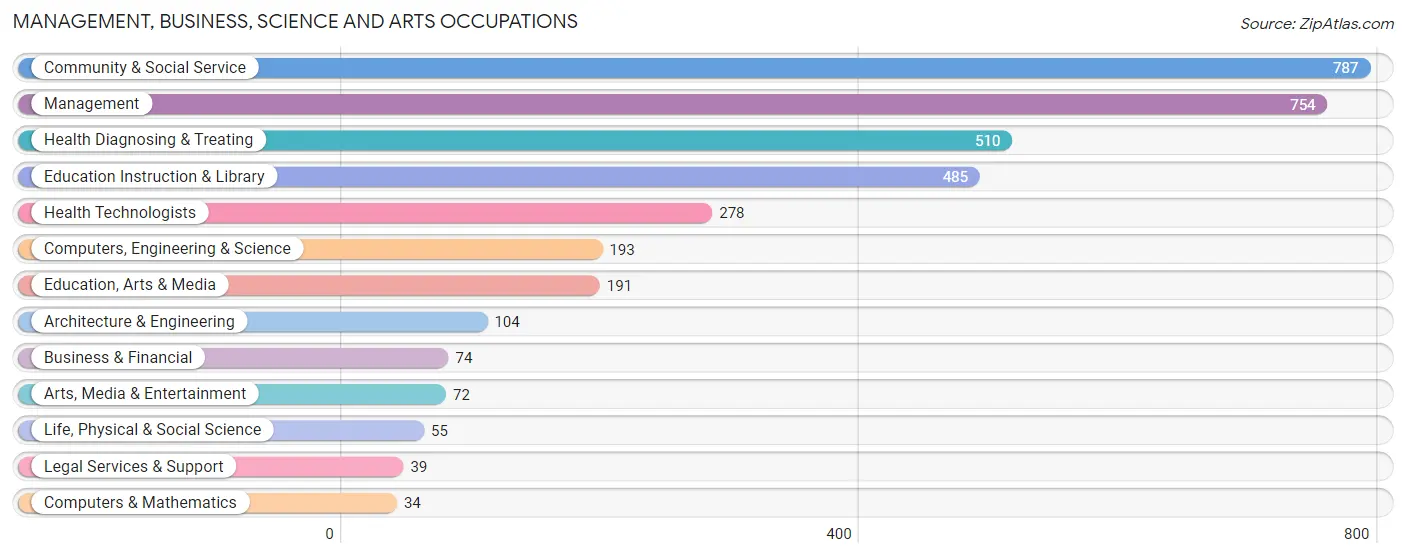
Management, Business, Science and Arts Occupations
The most common Management, Business, Science and Arts occupations in Allen Parish are Community & Social Service (787 | 10.1%), Management (754 | 9.7%), Health Diagnosing & Treating (510 | 6.6%), Education Instruction & Library (485 | 6.2%), and Health Technologists (278 | 3.6%).
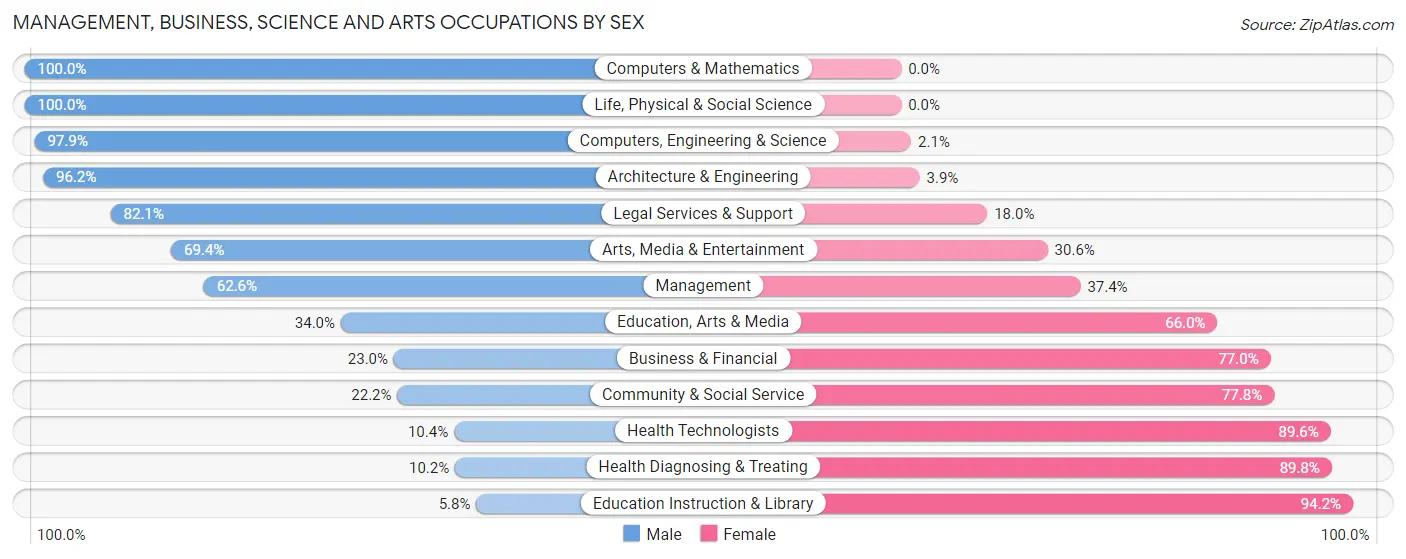
Management, Business, Science and Arts Occupations by Sex
Within the Management, Business, Science and Arts occupations in Allen Parish, the most male-oriented occupations are Computers & Mathematics (100.0%), Life, Physical & Social Science (100.0%), and Computers, Engineering & Science (97.9%), while the most female-oriented occupations are Education Instruction & Library (94.2%), Health Diagnosing & Treating (89.8%), and Health Technologists (89.6%).
| Occupation | Male | Female |
| Management | 472 (62.6%) | 282 (37.4%) |
| Business & Financial | 17 (23.0%) | 57 (77.0%) |
| Computers, Engineering & Science | 189 (97.9%) | 4 (2.1%) |
| Computers & Mathematics | 34 (100.0%) | 0 (0.0%) |
| Architecture & Engineering | 100 (96.2%) | 4 (3.8%) |
| Life, Physical & Social Science | 55 (100.0%) | 0 (0.0%) |
| Community & Social Service | 175 (22.2%) | 612 (77.8%) |
| Education, Arts & Media | 65 (34.0%) | 126 (66.0%) |
| Legal Services & Support | 32 (82.1%) | 7 (17.9%) |
| Education Instruction & Library | 28 (5.8%) | 457 (94.2%) |
| Arts, Media & Entertainment | 50 (69.4%) | 22 (30.6%) |
| Health Diagnosing & Treating | 52 (10.2%) | 458 (89.8%) |
| Health Technologists | 29 (10.4%) | 249 (89.6%) |
| Total (Category) | 905 (39.0%) | 1,413 (61.0%) |
| Total (Overall) | 4,104 (52.7%) | 3,678 (47.3%) |
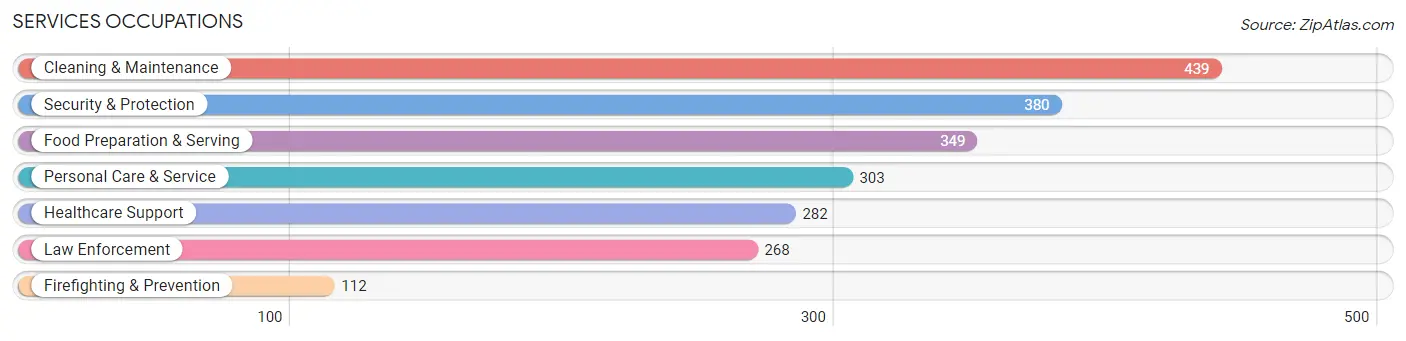
Services Occupations
The most common Services occupations in Allen Parish are Cleaning & Maintenance (439 | 5.6%), Security & Protection (380 | 4.9%), Food Preparation & Serving (349 | 4.5%), Personal Care & Service (303 | 3.9%), and Healthcare Support (282 | 3.6%).
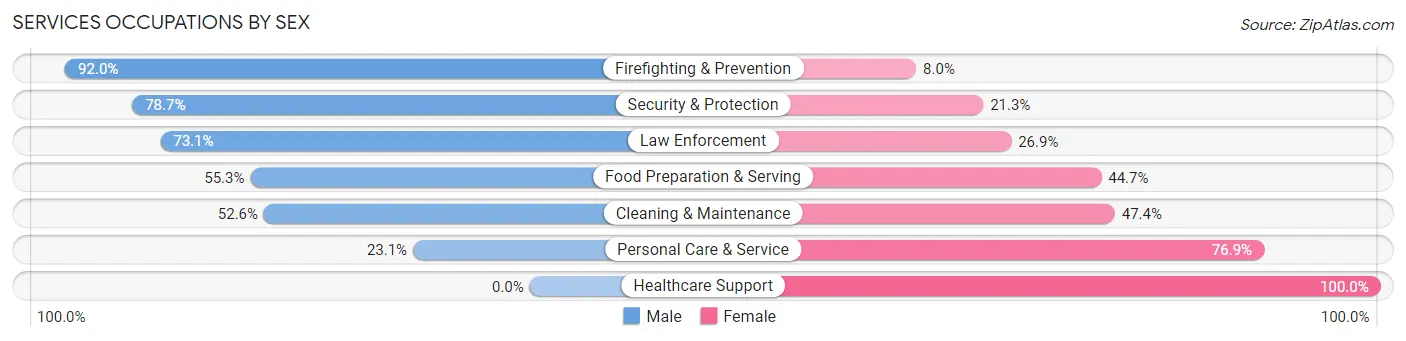
Services Occupations by Sex
Within the Services occupations in Allen Parish, the most male-oriented occupations are Firefighting & Prevention (92.0%), Security & Protection (78.7%), and Law Enforcement (73.1%), while the most female-oriented occupations are Healthcare Support (100.0%), Personal Care & Service (76.9%), and Cleaning & Maintenance (47.4%).
| Occupation | Male | Female |
| Healthcare Support | 0 (0.0%) | 282 (100.0%) |
| Security & Protection | 299 (78.7%) | 81 (21.3%) |
| Firefighting & Prevention | 103 (92.0%) | 9 (8.0%) |
| Law Enforcement | 196 (73.1%) | 72 (26.9%) |
| Food Preparation & Serving | 193 (55.3%) | 156 (44.7%) |
| Cleaning & Maintenance | 231 (52.6%) | 208 (47.4%) |
| Personal Care & Service | 70 (23.1%) | 233 (76.9%) |
| Total (Category) | 793 (45.2%) | 960 (54.8%) |
| Total (Overall) | 4,104 (52.7%) | 3,678 (47.3%) |
Sales and Office Occupations
The most common Sales and Office occupations in Allen Parish are Office & Administration (857 | 11.0%), and Sales & Related (542 | 7.0%).
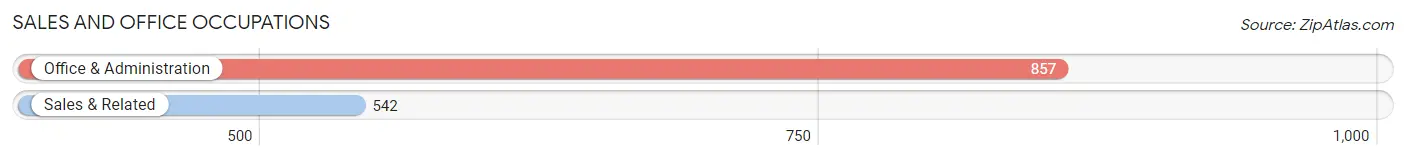
Sales and Office Occupations by Sex
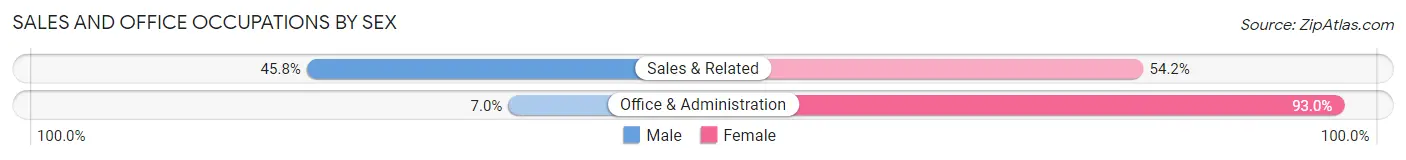
| Occupation | Male | Female |
| Sales & Related | 248 (45.8%) | 294 (54.2%) |
| Office & Administration | 60 (7.0%) | 797 (93.0%) |
| Total (Category) | 308 (22.0%) | 1,091 (78.0%) |
| Total (Overall) | 4,104 (52.7%) | 3,678 (47.3%) |
Natural Resources, Construction and Maintenance Occupations
The most common Natural Resources, Construction and Maintenance occupations in Allen Parish are Construction & Extraction (617 | 7.9%), Installation, Maintenance & Repair (456 | 5.9%), and Farming, Fishing & Forestry (35 | 0.4%).
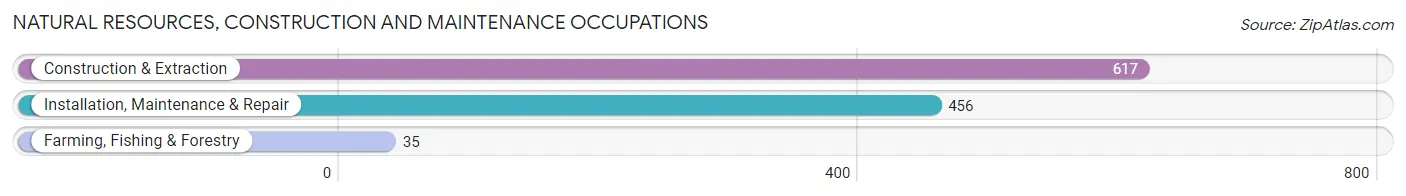
Natural Resources, Construction and Maintenance Occupations by Sex
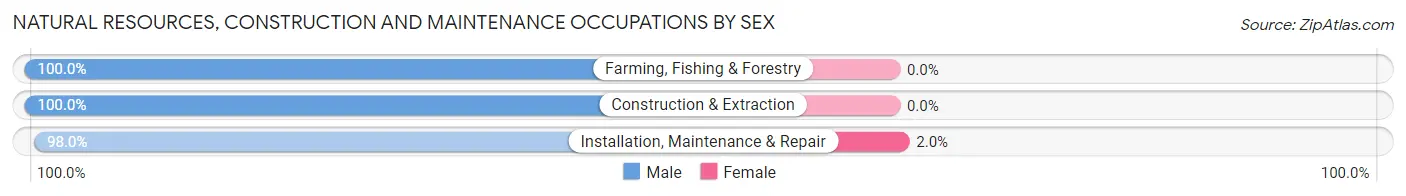
| Occupation | Male | Female |
| Farming, Fishing & Forestry | 35 (100.0%) | 0 (0.0%) |
| Construction & Extraction | 617 (100.0%) | 0 (0.0%) |
| Installation, Maintenance & Repair | 447 (98.0%) | 9 (2.0%) |
| Total (Category) | 1,099 (99.2%) | 9 (0.8%) |
| Total (Overall) | 4,104 (52.7%) | 3,678 (47.3%) |
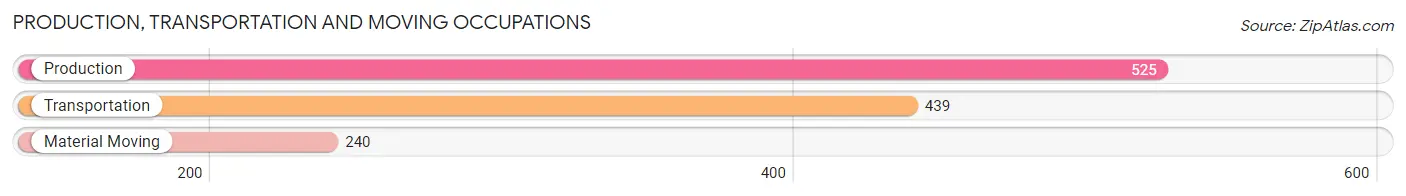
Production, Transportation and Moving Occupations
The most common Production, Transportation and Moving occupations in Allen Parish are Production (525 | 6.8%), Transportation (439 | 5.6%), and Material Moving (240 | 3.1%).
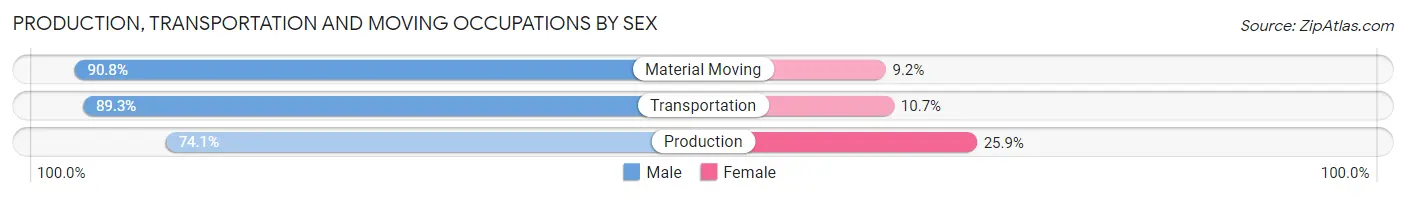
Production, Transportation and Moving Occupations by Sex
| Occupation | Male | Female |
| Production | 389 (74.1%) | 136 (25.9%) |
| Transportation | 392 (89.3%) | 47 (10.7%) |
| Material Moving | 218 (90.8%) | 22 (9.2%) |
| Total (Category) | 999 (83.0%) | 205 (17.0%) |
| Total (Overall) | 4,104 (52.7%) | 3,678 (47.3%) |
Employment Industries by Sex in Allen Parish
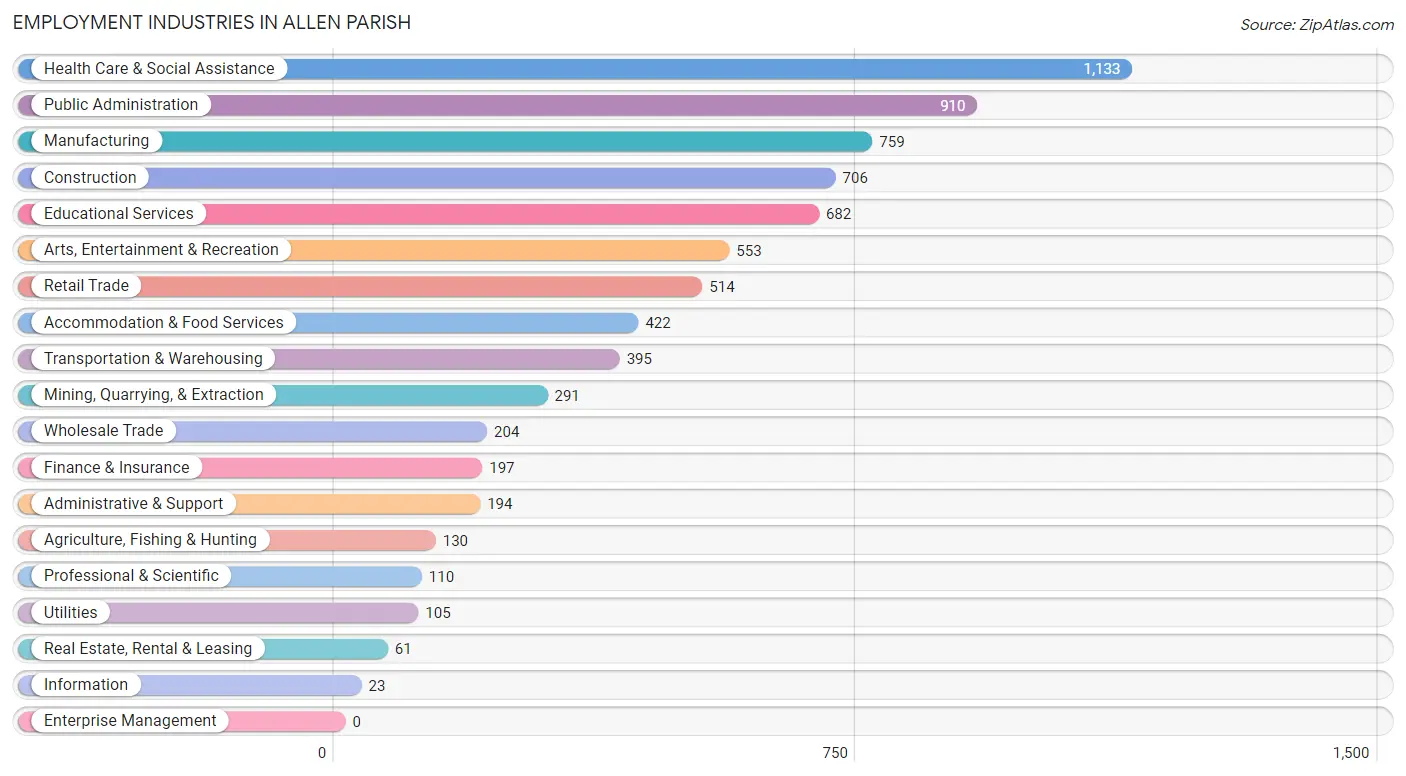
Employment Industries in Allen Parish
The major employment industries in Allen Parish include Health Care & Social Assistance (1,133 | 14.6%), Public Administration (910 | 11.7%), Manufacturing (759 | 9.8%), Construction (706 | 9.1%), and Educational Services (682 | 8.8%).
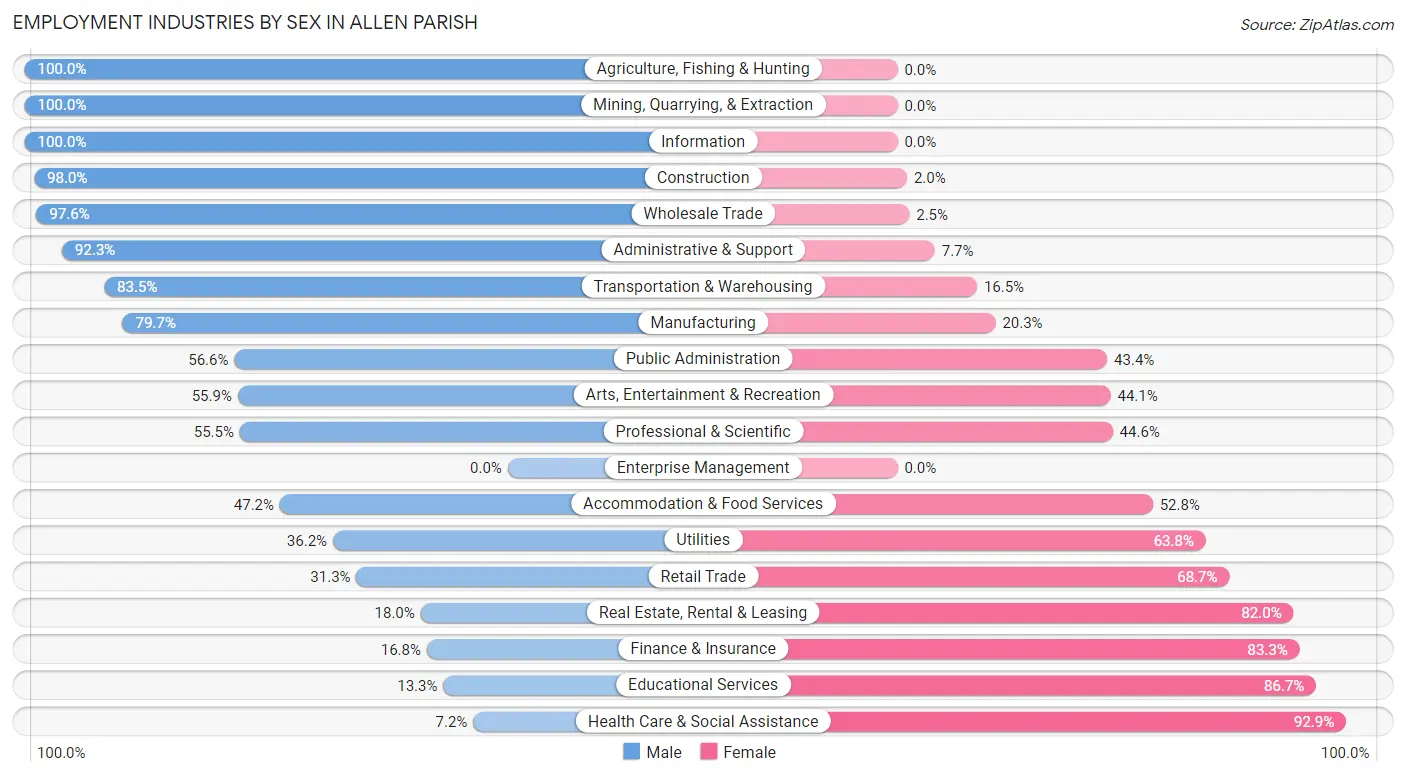
Employment Industries by Sex in Allen Parish
The Allen Parish industries that see more men than women are Agriculture, Fishing & Hunting (100.0%), Mining, Quarrying, & Extraction (100.0%), and Information (100.0%), whereas the industries that tend to have a higher number of women are Health Care & Social Assistance (92.8%), Educational Services (86.7%), and Finance & Insurance (83.3%).
| Industry | Male | Female |
| Agriculture, Fishing & Hunting | 130 (100.0%) | 0 (0.0%) |
| Mining, Quarrying, & Extraction | 291 (100.0%) | 0 (0.0%) |
| Construction | 692 (98.0%) | 14 (2.0%) |
| Manufacturing | 605 (79.7%) | 154 (20.3%) |
| Wholesale Trade | 199 (97.6%) | 5 (2.5%) |
| Retail Trade | 161 (31.3%) | 353 (68.7%) |
| Transportation & Warehousing | 330 (83.5%) | 65 (16.5%) |
| Utilities | 38 (36.2%) | 67 (63.8%) |
| Information | 23 (100.0%) | 0 (0.0%) |
| Finance & Insurance | 33 (16.8%) | 164 (83.3%) |
| Real Estate, Rental & Leasing | 11 (18.0%) | 50 (82.0%) |
| Professional & Scientific | 61 (55.4%) | 49 (44.6%) |
| Enterprise Management | 0 (0.0%) | 0 (0.0%) |
| Administrative & Support | 179 (92.3%) | 15 (7.7%) |
| Educational Services | 91 (13.3%) | 591 (86.7%) |
| Health Care & Social Assistance | 81 (7.1%) | 1,052 (92.8%) |
| Arts, Entertainment & Recreation | 309 (55.9%) | 244 (44.1%) |
| Accommodation & Food Services | 199 (47.2%) | 223 (52.8%) |
| Public Administration | 515 (56.6%) | 395 (43.4%) |
| Total | 4,104 (52.7%) | 3,678 (47.3%) |
Education in Allen Parish
School Enrollment in Allen Parish
The most common levels of schooling among the 4,531 students in Allen Parish are elementary school (1,361 | 30.0%), high school (1,095 | 24.2%), and middle school (1,043 | 23.0%).
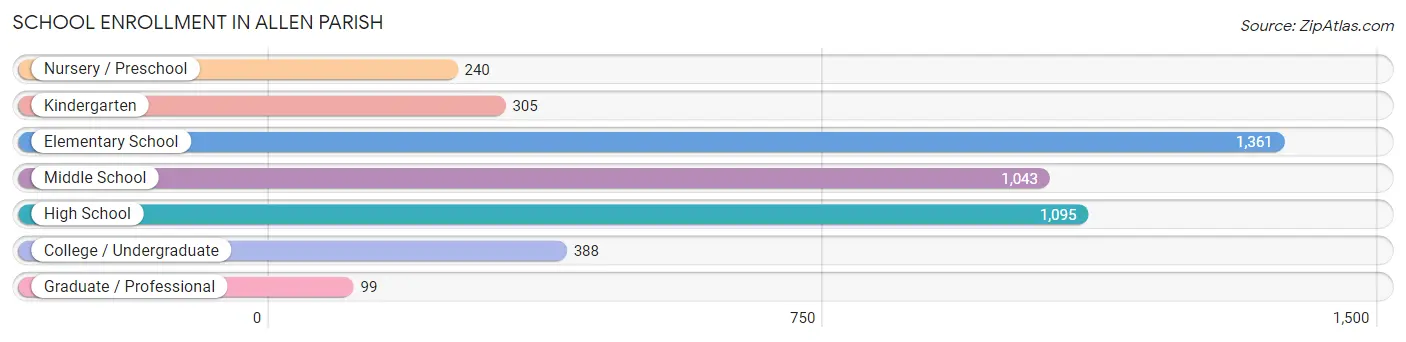
| School Level | # Students | % Students |
| Nursery / Preschool | 240 | 5.3% |
| Kindergarten | 305 | 6.7% |
| Elementary School | 1,361 | 30.0% |
| Middle School | 1,043 | 23.0% |
| High School | 1,095 | 24.2% |
| College / Undergraduate | 388 | 8.6% |
| Graduate / Professional | 99 | 2.2% |
| Total | 4,531 | 100.0% |
School Enrollment by Age by Funding Source in Allen Parish
Out of a total of 4,531 students who are enrolled in schools in Allen Parish, 394 (8.7%) attend a private institution, while the remaining 4,137 (91.3%) are enrolled in public schools. The age group of 25 to 34 year olds has the highest likelihood of being enrolled in private schools, with 41 (28.3% in the age bracket) enrolled. Conversely, the age group of 20 to 24 year olds has the lowest likelihood of being enrolled in a private school, with 131 (100.0% in the age bracket) attending a public institution.
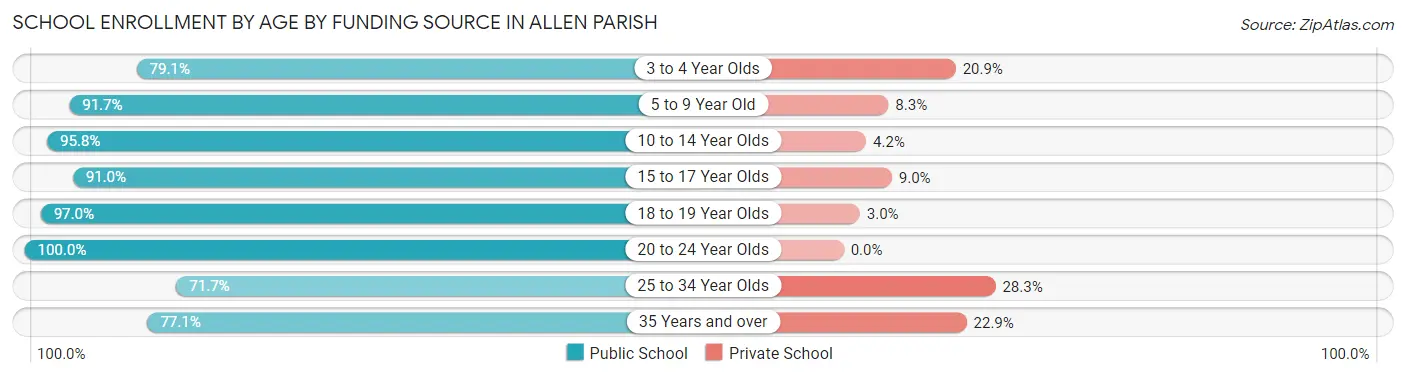
| Age Bracket | Public School | Private School |
| 3 to 4 Year Olds | 163 (79.1%) | 43 (20.9%) |
| 5 to 9 Year Old | 1,376 (91.7%) | 125 (8.3%) |
| 10 to 14 Year Olds | 1,234 (95.8%) | 54 (4.2%) |
| 15 to 17 Year Olds | 801 (91.0%) | 79 (9.0%) |
| 18 to 19 Year Olds | 161 (97.0%) | 5 (3.0%) |
| 20 to 24 Year Olds | 131 (100.0%) | 0 (0.0%) |
| 25 to 34 Year Olds | 104 (71.7%) | 41 (28.3%) |
| 35 Years and over | 165 (77.1%) | 49 (22.9%) |
| Total | 4,137 (91.3%) | 394 (8.7%) |
Educational Attainment by Field of Study in Allen Parish
Education (455 | 22.7%), business (341 | 17.0%), arts & humanities (281 | 14.0%), bio, nature & agricultural (204 | 10.2%), and science & technology (169 | 8.4%) are the most common fields of study among 2,003 individuals in Allen Parish who have obtained a bachelor's degree or higher.
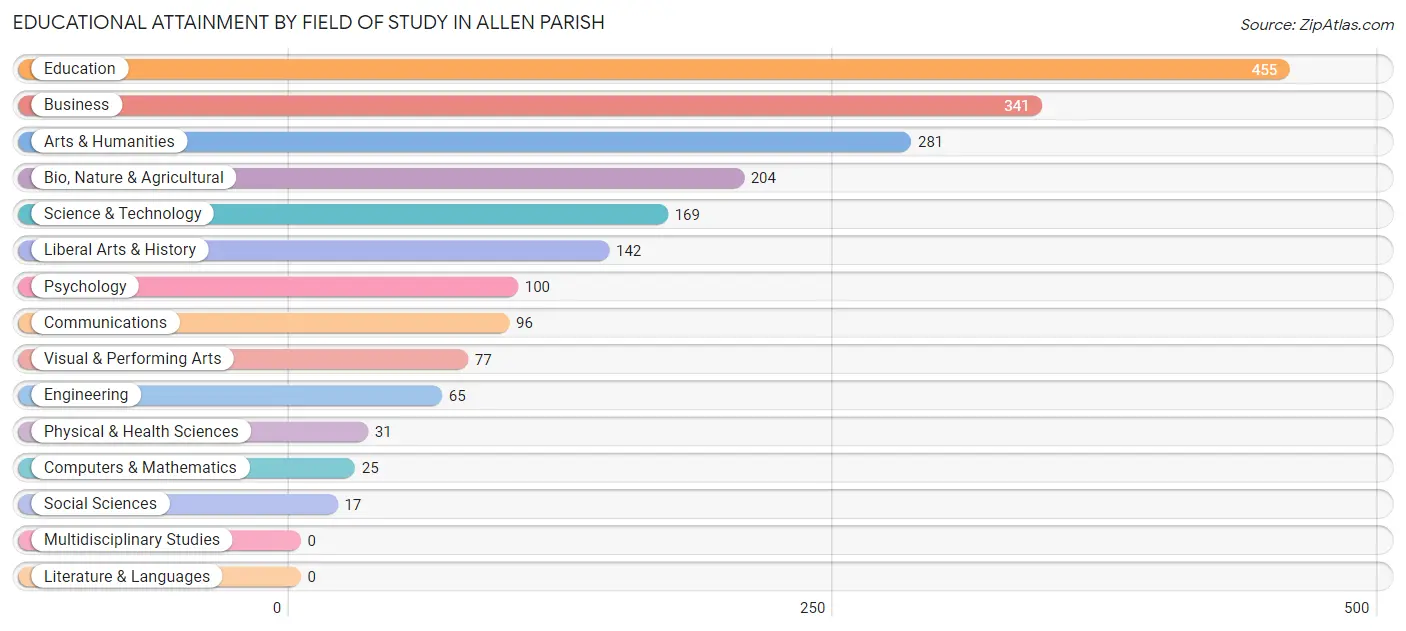
| Field of Study | # Graduates | % Graduates |
| Computers & Mathematics | 25 | 1.3% |
| Bio, Nature & Agricultural | 204 | 10.2% |
| Physical & Health Sciences | 31 | 1.5% |
| Psychology | 100 | 5.0% |
| Social Sciences | 17 | 0.9% |
| Engineering | 65 | 3.3% |
| Multidisciplinary Studies | 0 | 0.0% |
| Science & Technology | 169 | 8.4% |
| Business | 341 | 17.0% |
| Education | 455 | 22.7% |
| Literature & Languages | 0 | 0.0% |
| Liberal Arts & History | 142 | 7.1% |
| Visual & Performing Arts | 77 | 3.8% |
| Communications | 96 | 4.8% |
| Arts & Humanities | 281 | 14.0% |
| Total | 2,003 | 100.0% |
Transportation & Commute in Allen Parish
Vehicle Availability by Sex in Allen Parish
The most prevalent vehicle ownership categories in Allen Parish are males with 2 vehicles (1,634, accounting for 39.8%) and females with 2 vehicles (1,584, making up 45.2%).
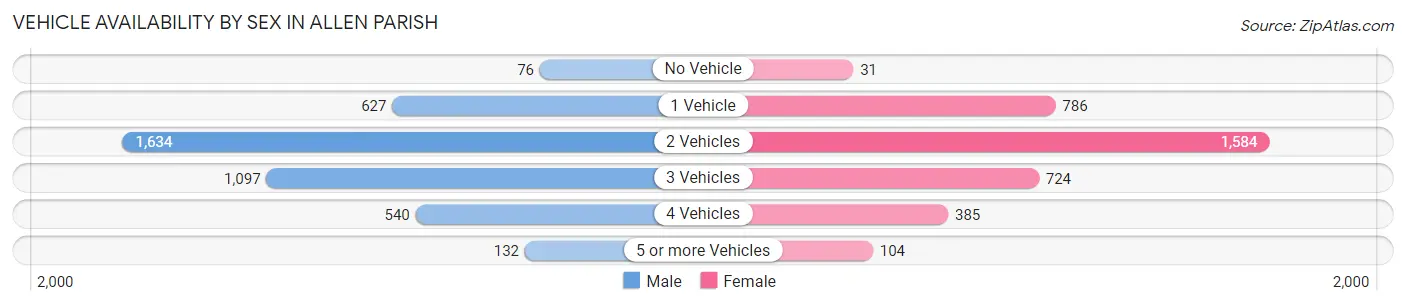
| Vehicles Available | Male | Female |
| No Vehicle | 76 (1.8%) | 31 (0.9%) |
| 1 Vehicle | 627 (15.3%) | 786 (21.7%) |
| 2 Vehicles | 1,634 (39.8%) | 1,584 (43.8%) |
| 3 Vehicles | 1,097 (26.7%) | 724 (20.0%) |
| 4 Vehicles | 540 (13.2%) | 385 (10.6%) |
| 5 or more Vehicles | 132 (3.2%) | 104 (2.9%) |
| Total | 4,106 (100.0%) | 3,614 (100.0%) |
Commute Time in Allen Parish
The most frequently occuring commute durations in Allen Parish are 5 to 9 minutes (1,138 commuters, 15.4%), 10 to 14 minutes (955 commuters, 12.9%), and 30 to 34 minutes (749 commuters, 10.1%).
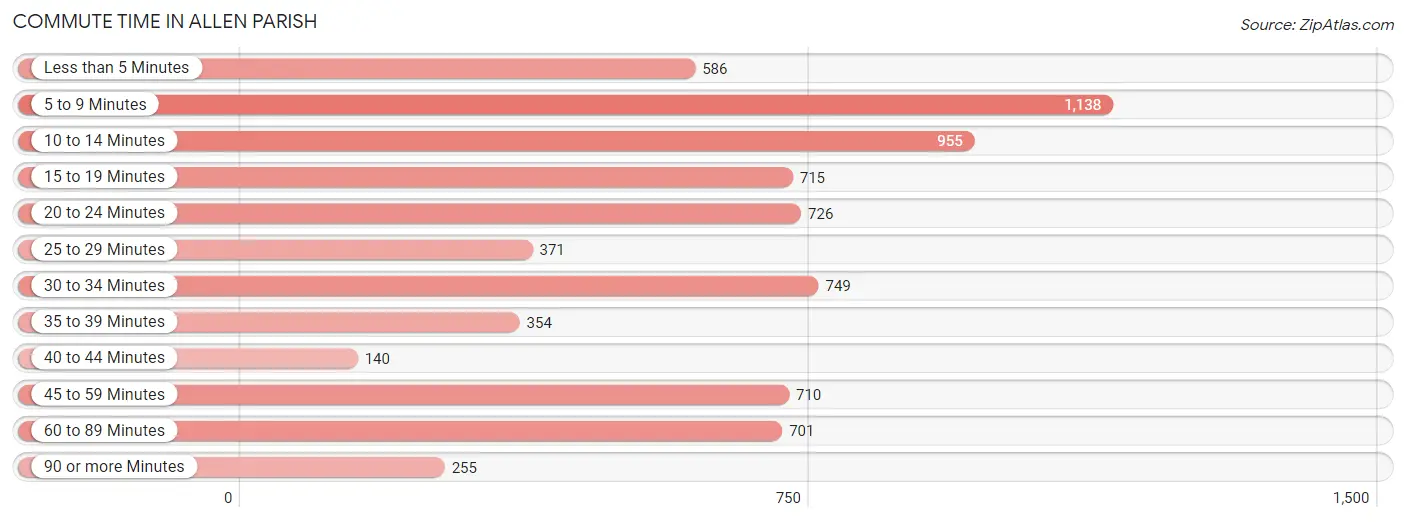
| Commute Time | # Commuters | % Commuters |
| Less than 5 Minutes | 586 | 7.9% |
| 5 to 9 Minutes | 1,138 | 15.4% |
| 10 to 14 Minutes | 955 | 12.9% |
| 15 to 19 Minutes | 715 | 9.7% |
| 20 to 24 Minutes | 726 | 9.8% |
| 25 to 29 Minutes | 371 | 5.0% |
| 30 to 34 Minutes | 749 | 10.1% |
| 35 to 39 Minutes | 354 | 4.8% |
| 40 to 44 Minutes | 140 | 1.9% |
| 45 to 59 Minutes | 710 | 9.6% |
| 60 to 89 Minutes | 701 | 9.5% |
| 90 or more Minutes | 255 | 3.5% |
Commute Time by Sex in Allen Parish
The most common commute times in Allen Parish are 30 to 34 minutes (528 commuters, 13.4%) for males and 5 to 9 minutes (665 commuters, 19.3%) for females.
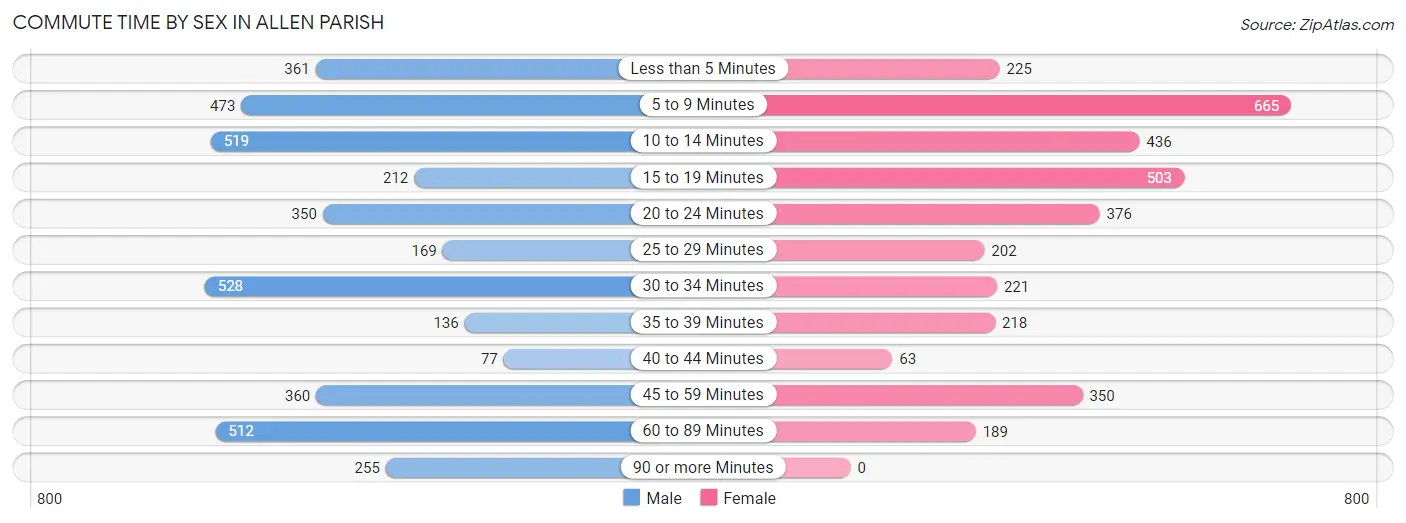
| Commute Time | Male | Female |
| Less than 5 Minutes | 361 (9.1%) | 225 (6.5%) |
| 5 to 9 Minutes | 473 (12.0%) | 665 (19.3%) |
| 10 to 14 Minutes | 519 (13.1%) | 436 (12.7%) |
| 15 to 19 Minutes | 212 (5.4%) | 503 (14.6%) |
| 20 to 24 Minutes | 350 (8.9%) | 376 (10.9%) |
| 25 to 29 Minutes | 169 (4.3%) | 202 (5.9%) |
| 30 to 34 Minutes | 528 (13.4%) | 221 (6.4%) |
| 35 to 39 Minutes | 136 (3.4%) | 218 (6.3%) |
| 40 to 44 Minutes | 77 (1.9%) | 63 (1.8%) |
| 45 to 59 Minutes | 360 (9.1%) | 350 (10.2%) |
| 60 to 89 Minutes | 512 (13.0%) | 189 (5.5%) |
| 90 or more Minutes | 255 (6.5%) | 0 (0.0%) |
Time of Departure to Work by Sex in Allen Parish
The most frequent times of departure to work in Allen Parish are 5:30 AM to 5:59 AM (643, 16.3%) for males and 7:00 AM to 7:29 AM (817, 23.7%) for females.
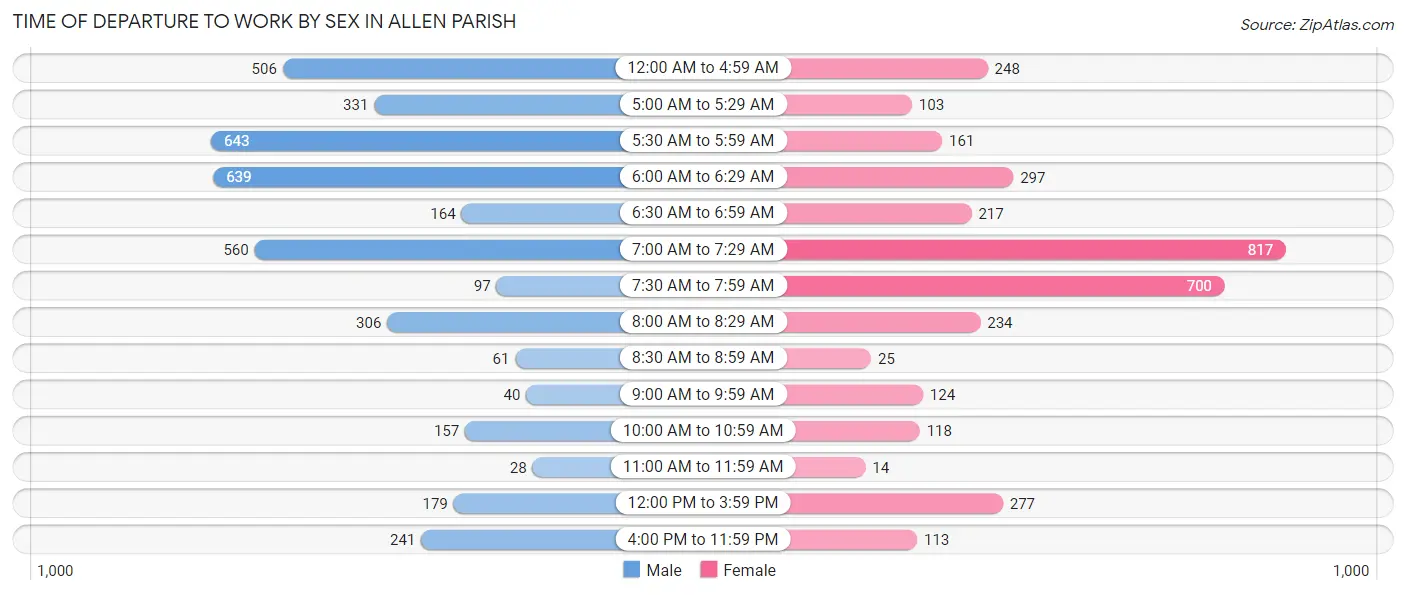
| Time of Departure | Male | Female |
| 12:00 AM to 4:59 AM | 506 (12.8%) | 248 (7.2%) |
| 5:00 AM to 5:29 AM | 331 (8.4%) | 103 (3.0%) |
| 5:30 AM to 5:59 AM | 643 (16.3%) | 161 (4.7%) |
| 6:00 AM to 6:29 AM | 639 (16.2%) | 297 (8.6%) |
| 6:30 AM to 6:59 AM | 164 (4.2%) | 217 (6.3%) |
| 7:00 AM to 7:29 AM | 560 (14.2%) | 817 (23.7%) |
| 7:30 AM to 7:59 AM | 97 (2.5%) | 700 (20.3%) |
| 8:00 AM to 8:29 AM | 306 (7.7%) | 234 (6.8%) |
| 8:30 AM to 8:59 AM | 61 (1.5%) | 25 (0.7%) |
| 9:00 AM to 9:59 AM | 40 (1.0%) | 124 (3.6%) |
| 10:00 AM to 10:59 AM | 157 (4.0%) | 118 (3.4%) |
| 11:00 AM to 11:59 AM | 28 (0.7%) | 14 (0.4%) |
| 12:00 PM to 3:59 PM | 179 (4.5%) | 277 (8.0%) |
| 4:00 PM to 11:59 PM | 241 (6.1%) | 113 (3.3%) |
| Total | 3,952 (100.0%) | 3,448 (100.0%) |
Housing Occupancy in Allen Parish
Occupancy by Ownership in Allen Parish
Of the total 7,636 dwellings in Allen Parish, owner-occupied units account for 5,804 (76.0%), while renter-occupied units make up 1,832 (24.0%).
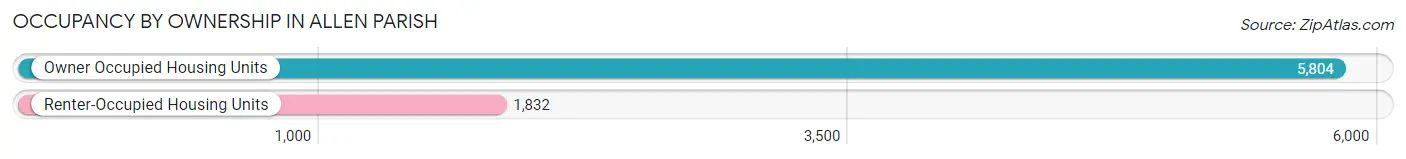
| Occupancy | # Housing Units | % Housing Units |
| Owner Occupied Housing Units | 5,804 | 76.0% |
| Renter-Occupied Housing Units | 1,832 | 24.0% |
| Total Occupied Housing Units | 7,636 | 100.0% |
Occupancy by Household Size in Allen Parish
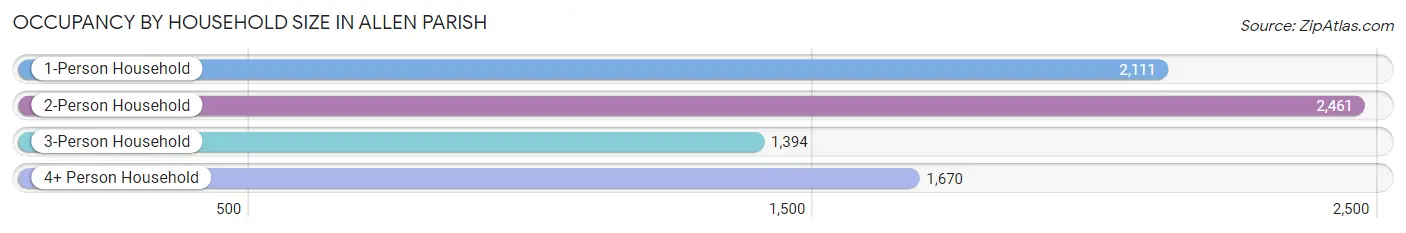
| Household Size | # Housing Units | % Housing Units |
| 1-Person Household | 2,111 | 27.7% |
| 2-Person Household | 2,461 | 32.2% |
| 3-Person Household | 1,394 | 18.3% |
| 4+ Person Household | 1,670 | 21.9% |
| Total Housing Units | 7,636 | 100.0% |
Occupancy by Ownership by Household Size in Allen Parish
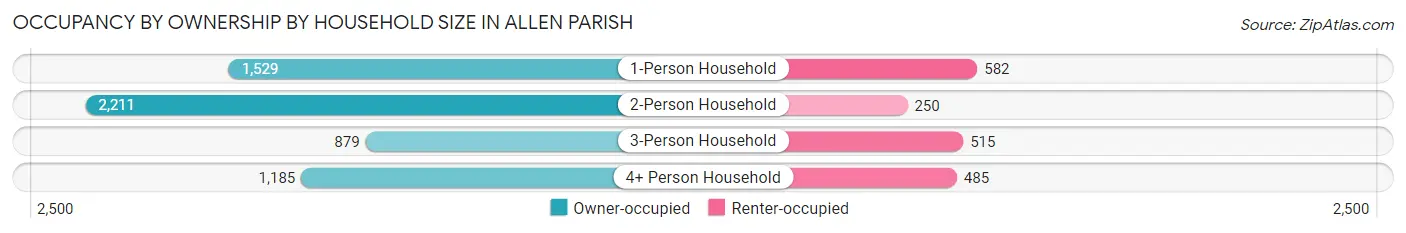
| Household Size | Owner-occupied | Renter-occupied |
| 1-Person Household | 1,529 (72.4%) | 582 (27.6%) |
| 2-Person Household | 2,211 (89.8%) | 250 (10.2%) |
| 3-Person Household | 879 (63.1%) | 515 (36.9%) |
| 4+ Person Household | 1,185 (71.0%) | 485 (29.0%) |
| Total Housing Units | 5,804 (76.0%) | 1,832 (24.0%) |
Occupancy by Educational Attainment in Allen Parish
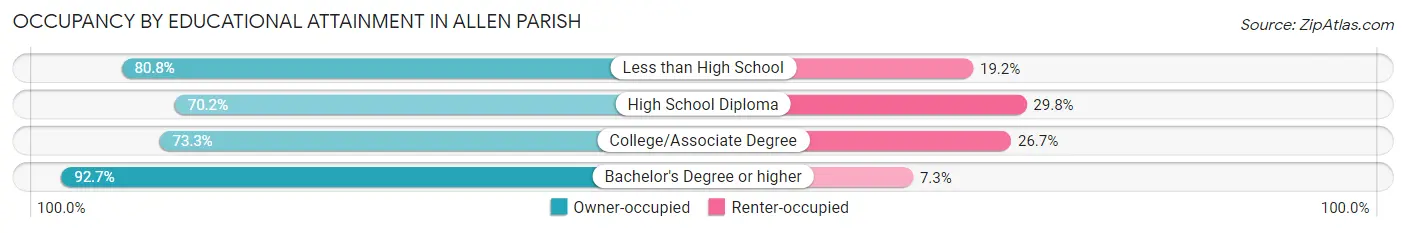
| Household Size | Owner-occupied | Renter-occupied |
| Less than High School | 1,043 (80.8%) | 248 (19.2%) |
| High School Diploma | 2,260 (70.2%) | 959 (29.8%) |
| College/Associate Degree | 1,496 (73.3%) | 546 (26.7%) |
| Bachelor's Degree or higher | 1,005 (92.7%) | 79 (7.3%) |
Occupancy by Age of Householder in Allen Parish
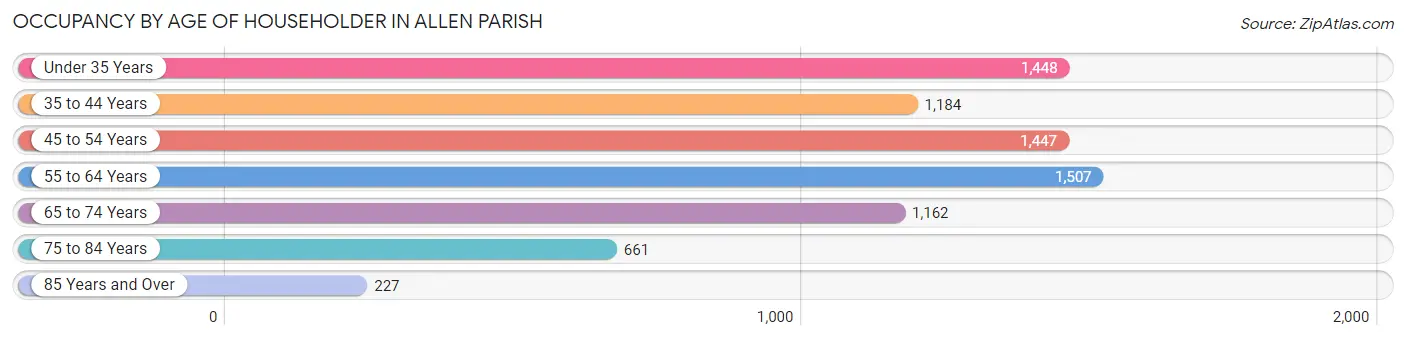
| Age Bracket | # Households | % Households |
| Under 35 Years | 1,448 | 19.0% |
| 35 to 44 Years | 1,184 | 15.5% |
| 45 to 54 Years | 1,447 | 19.0% |
| 55 to 64 Years | 1,507 | 19.7% |
| 65 to 74 Years | 1,162 | 15.2% |
| 75 to 84 Years | 661 | 8.7% |
| 85 Years and Over | 227 | 3.0% |
| Total | 7,636 | 100.0% |
Housing Finances in Allen Parish
Median Income by Occupancy in Allen Parish
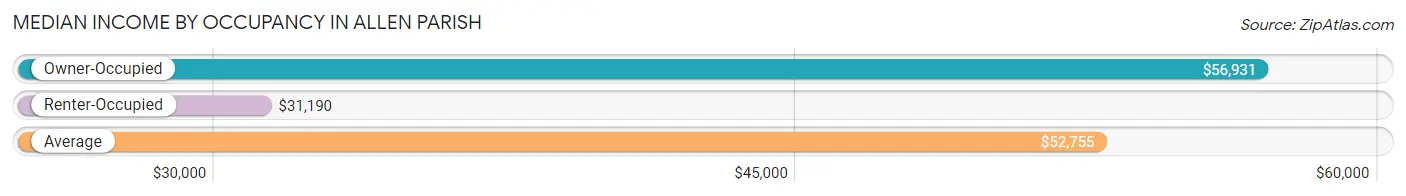
| Occupancy Type | # Households | Median Income |
| Owner-Occupied | 5,804 (76.0%) | $56,931 |
| Renter-Occupied | 1,832 (24.0%) | $31,190 |
| Average | 7,636 (100.0%) | $52,755 |
Occupancy by Householder Income Bracket in Allen Parish
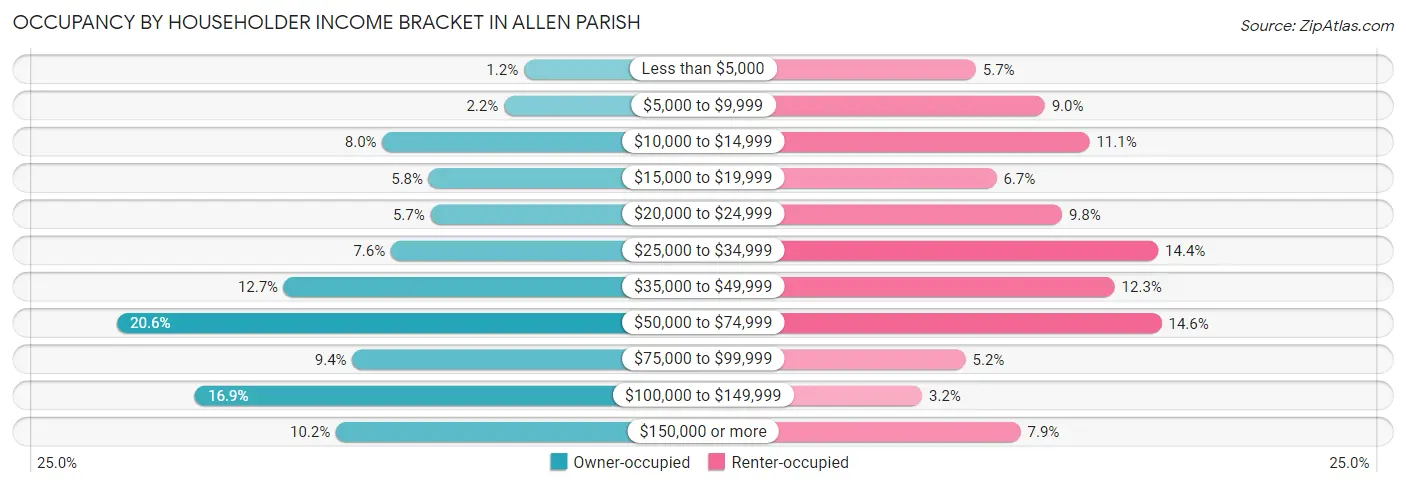
| Income Bracket | Owner-occupied | Renter-occupied |
| Less than $5,000 | 71 (1.2%) | 105 (5.7%) |
| $5,000 to $9,999 | 126 (2.2%) | 165 (9.0%) |
| $10,000 to $14,999 | 462 (8.0%) | 204 (11.1%) |
| $15,000 to $19,999 | 334 (5.8%) | 123 (6.7%) |
| $20,000 to $24,999 | 329 (5.7%) | 180 (9.8%) |
| $25,000 to $34,999 | 438 (7.5%) | 264 (14.4%) |
| $35,000 to $49,999 | 734 (12.7%) | 226 (12.3%) |
| $50,000 to $74,999 | 1,195 (20.6%) | 267 (14.6%) |
| $75,000 to $99,999 | 545 (9.4%) | 96 (5.2%) |
| $100,000 to $149,999 | 980 (16.9%) | 58 (3.2%) |
| $150,000 or more | 590 (10.2%) | 144 (7.9%) |
| Total | 5,804 (100.0%) | 1,832 (100.0%) |
Monthly Housing Cost Tiers in Allen Parish
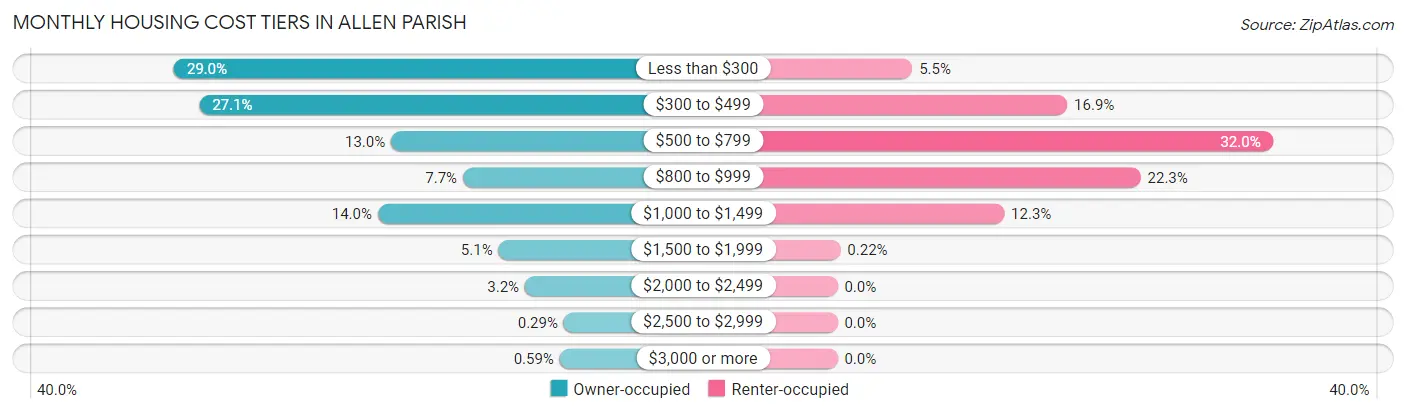
| Monthly Cost | Owner-occupied | Renter-occupied |
| Less than $300 | 1,684 (29.0%) | 101 (5.5%) |
| $300 to $499 | 1,575 (27.1%) | 310 (16.9%) |
| $500 to $799 | 755 (13.0%) | 587 (32.0%) |
| $800 to $999 | 448 (7.7%) | 409 (22.3%) |
| $1,000 to $1,499 | 812 (14.0%) | 225 (12.3%) |
| $1,500 to $1,999 | 296 (5.1%) | 4 (0.2%) |
| $2,000 to $2,499 | 183 (3.2%) | 0 (0.0%) |
| $2,500 to $2,999 | 17 (0.3%) | 0 (0.0%) |
| $3,000 or more | 34 (0.6%) | 0 (0.0%) |
| Total | 5,804 (100.0%) | 1,832 (100.0%) |
Physical Housing Characteristics in Allen Parish
Housing Structures in Allen Parish
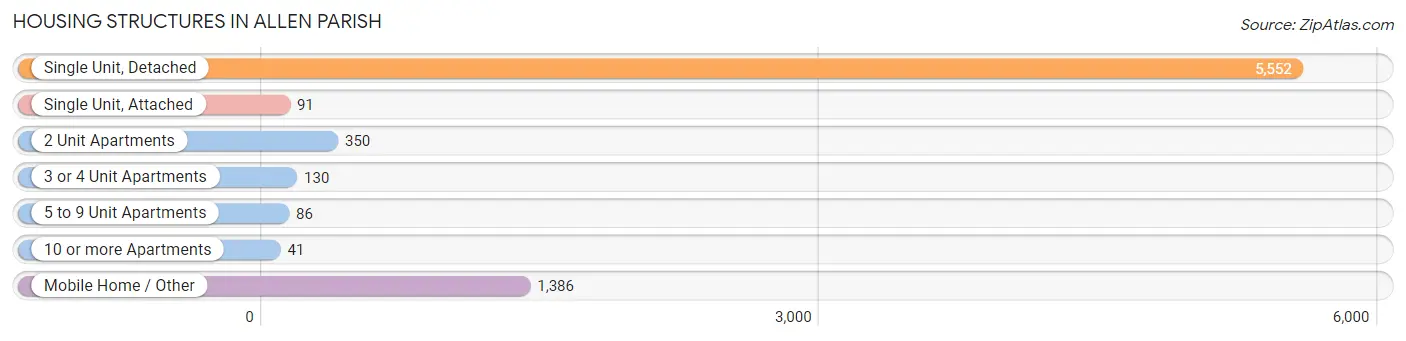
| Structure Type | # Housing Units | % Housing Units |
| Single Unit, Detached | 5,552 | 72.7% |
| Single Unit, Attached | 91 | 1.2% |
| 2 Unit Apartments | 350 | 4.6% |
| 3 or 4 Unit Apartments | 130 | 1.7% |
| 5 to 9 Unit Apartments | 86 | 1.1% |
| 10 or more Apartments | 41 | 0.5% |
| Mobile Home / Other | 1,386 | 18.1% |
| Total | 7,636 | 100.0% |
Housing Structures by Occupancy in Allen Parish
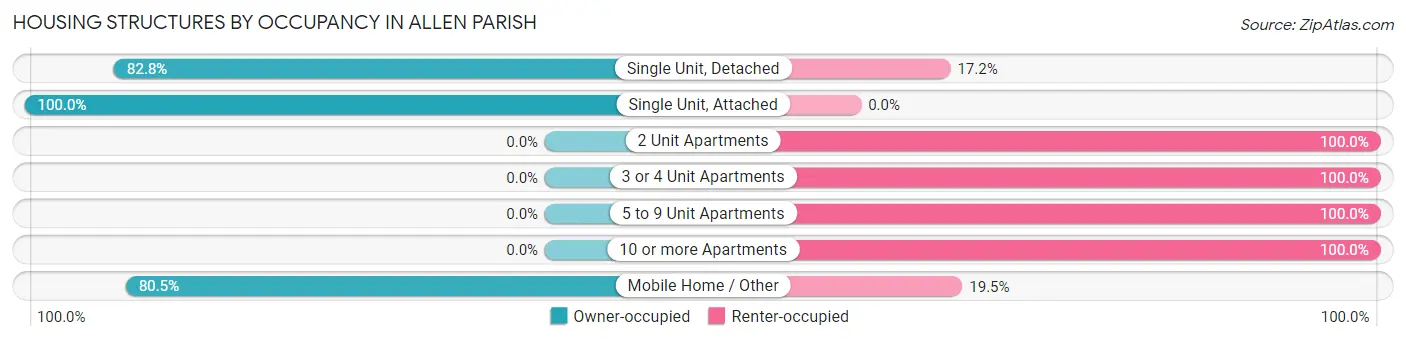
| Structure Type | Owner-occupied | Renter-occupied |
| Single Unit, Detached | 4,597 (82.8%) | 955 (17.2%) |
| Single Unit, Attached | 91 (100.0%) | 0 (0.0%) |
| 2 Unit Apartments | 0 (0.0%) | 350 (100.0%) |
| 3 or 4 Unit Apartments | 0 (0.0%) | 130 (100.0%) |
| 5 to 9 Unit Apartments | 0 (0.0%) | 86 (100.0%) |
| 10 or more Apartments | 0 (0.0%) | 41 (100.0%) |
| Mobile Home / Other | 1,116 (80.5%) | 270 (19.5%) |
| Total | 5,804 (76.0%) | 1,832 (24.0%) |
Housing Structures by Number of Rooms in Allen Parish
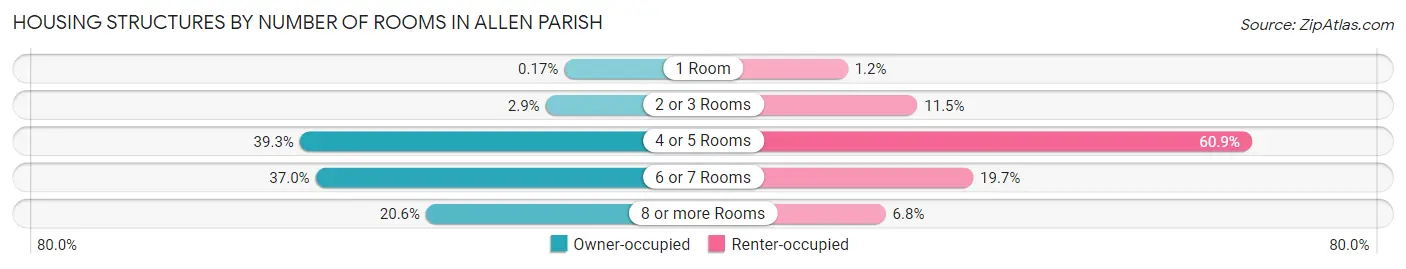
| Number of Rooms | Owner-occupied | Renter-occupied |
| 1 Room | 10 (0.2%) | 21 (1.1%) |
| 2 or 3 Rooms | 170 (2.9%) | 210 (11.5%) |
| 4 or 5 Rooms | 2,281 (39.3%) | 1,116 (60.9%) |
| 6 or 7 Rooms | 2,146 (37.0%) | 361 (19.7%) |
| 8 or more Rooms | 1,197 (20.6%) | 124 (6.8%) |
| Total | 5,804 (100.0%) | 1,832 (100.0%) |
Housing Structure by Heating Type in Allen Parish
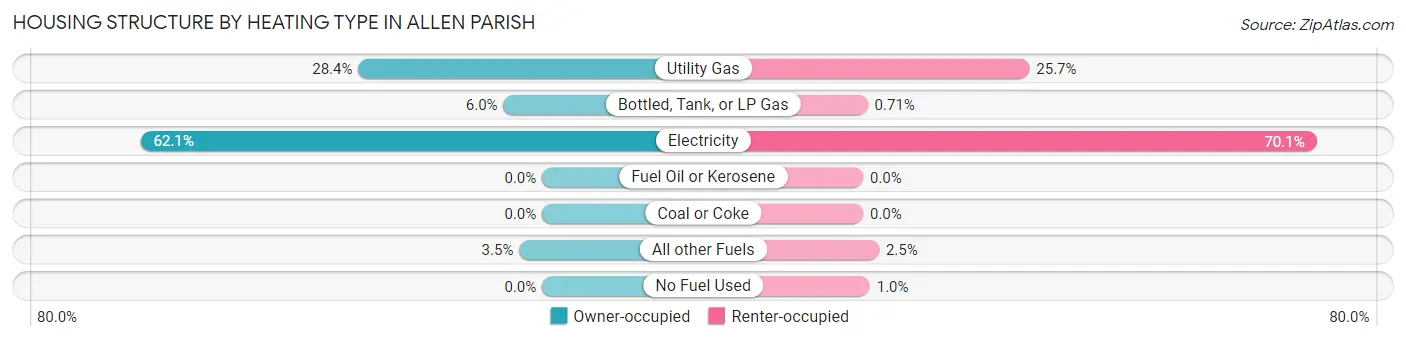
| Heating Type | Owner-occupied | Renter-occupied |
| Utility Gas | 1,649 (28.4%) | 471 (25.7%) |
| Bottled, Tank, or LP Gas | 347 (6.0%) | 13 (0.7%) |
| Electricity | 3,603 (62.1%) | 1,284 (70.1%) |
| Fuel Oil or Kerosene | 0 (0.0%) | 0 (0.0%) |
| Coal or Coke | 0 (0.0%) | 0 (0.0%) |
| All other Fuels | 205 (3.5%) | 45 (2.5%) |
| No Fuel Used | 0 (0.0%) | 19 (1.0%) |
| Total | 5,804 (100.0%) | 1,832 (100.0%) |
Household Vehicle Usage in Allen Parish
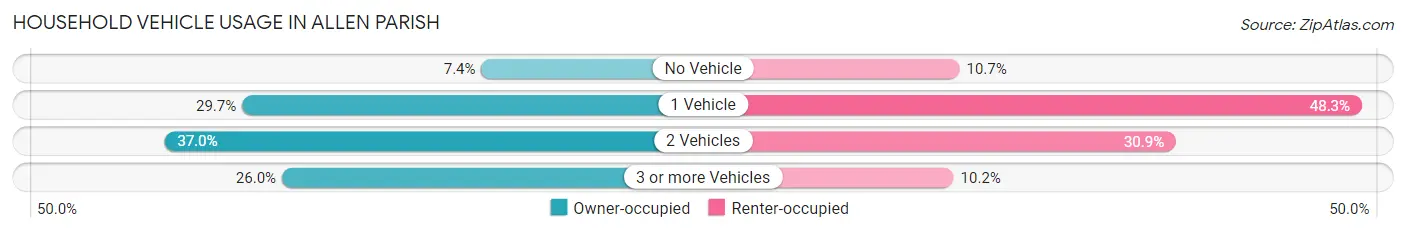
| Vehicles per Household | Owner-occupied | Renter-occupied |
| No Vehicle | 427 (7.4%) | 196 (10.7%) |
| 1 Vehicle | 1,724 (29.7%) | 884 (48.2%) |
| 2 Vehicles | 2,145 (37.0%) | 566 (30.9%) |
| 3 or more Vehicles | 1,508 (26.0%) | 186 (10.2%) |
| Total | 5,804 (100.0%) | 1,832 (100.0%) |
Real Estate & Mortgages in Allen Parish
Real Estate and Mortgage Overview in Allen Parish
| Characteristic | Without Mortgage | With Mortgage |
| Housing Units | 3,904 | 1,900 |
| Median Property Value | $89,600 | $165,000 |
| Median Household Income | $47,348 | $233 |
| Monthly Housing Costs | $327 | $21 |
| Real Estate Taxes | $199 | $440 |
Property Value by Mortgage Status in Allen Parish
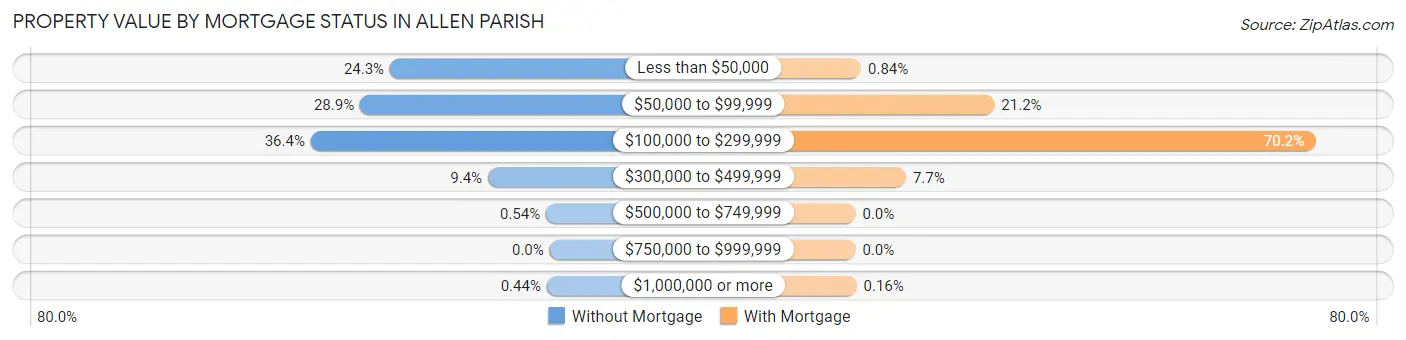
| Property Value | Without Mortgage | With Mortgage |
| Less than $50,000 | 950 (24.3%) | 16 (0.8%) |
| $50,000 to $99,999 | 1,128 (28.9%) | 402 (21.2%) |
| $100,000 to $299,999 | 1,421 (36.4%) | 1,333 (70.2%) |
| $300,000 to $499,999 | 367 (9.4%) | 146 (7.7%) |
| $500,000 to $749,999 | 21 (0.5%) | 0 (0.0%) |
| $750,000 to $999,999 | 0 (0.0%) | 0 (0.0%) |
| $1,000,000 or more | 17 (0.4%) | 3 (0.2%) |
| Total | 3,904 (100.0%) | 1,900 (100.0%) |
Household Income by Mortgage Status in Allen Parish
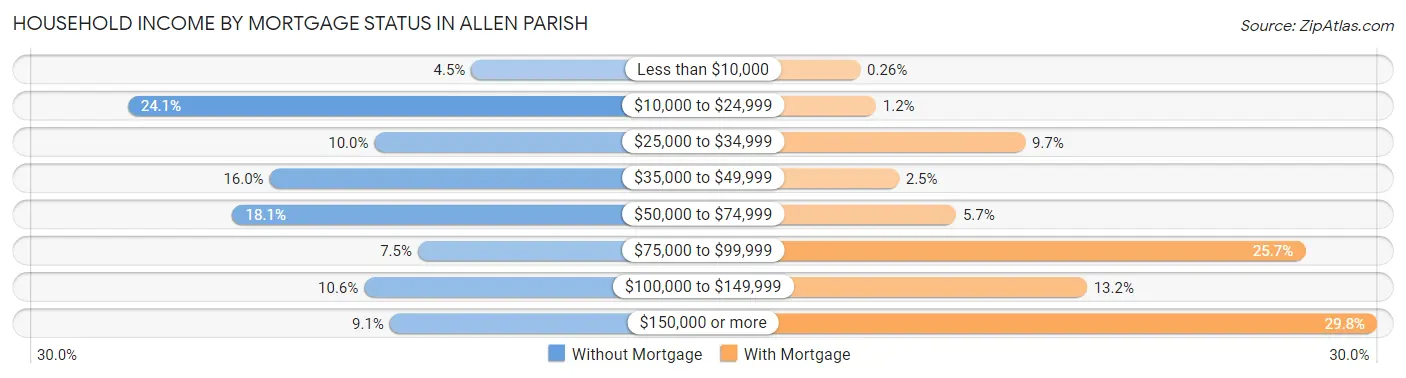
| Household Income | Without Mortgage | With Mortgage |
| Less than $10,000 | 175 (4.5%) | 5 (0.3%) |
| $10,000 to $24,999 | 941 (24.1%) | 22 (1.2%) |
| $25,000 to $34,999 | 391 (10.0%) | 184 (9.7%) |
| $35,000 to $49,999 | 625 (16.0%) | 47 (2.5%) |
| $50,000 to $74,999 | 707 (18.1%) | 109 (5.7%) |
| $75,000 to $99,999 | 294 (7.5%) | 488 (25.7%) |
| $100,000 to $149,999 | 414 (10.6%) | 251 (13.2%) |
| $150,000 or more | 357 (9.1%) | 566 (29.8%) |
| Total | 3,904 (100.0%) | 1,900 (100.0%) |
Property Value to Household Income Ratio in Allen Parish
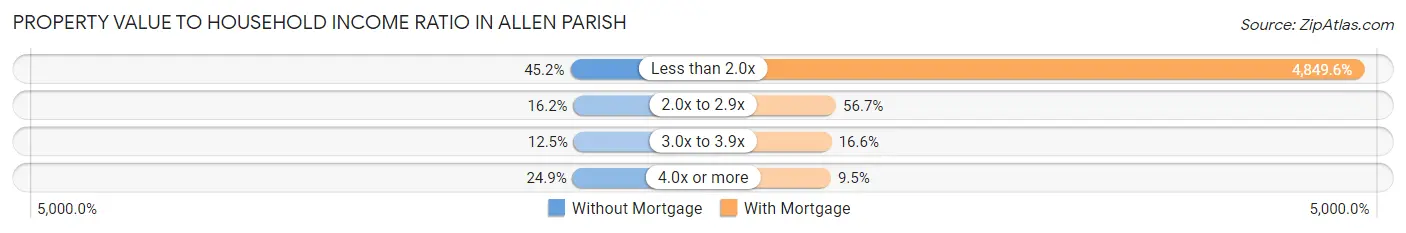
| Value-to-Income Ratio | Without Mortgage | With Mortgage |
| Less than 2.0x | 1,763 (45.2%) | 92,143 (4,849.6%) |
| 2.0x to 2.9x | 633 (16.2%) | 1,077 (56.7%) |
| 3.0x to 3.9x | 488 (12.5%) | 316 (16.6%) |
| 4.0x or more | 971 (24.9%) | 180 (9.5%) |
| Total | 3,904 (100.0%) | 1,900 (100.0%) |
Real Estate Taxes by Mortgage Status in Allen Parish
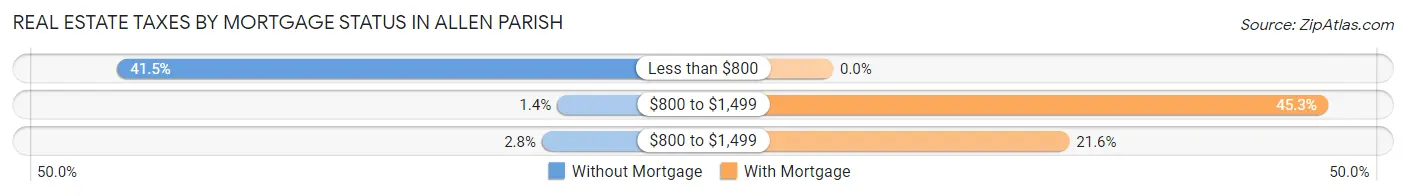
| Property Taxes | Without Mortgage | With Mortgage |
| Less than $800 | 1,621 (41.5%) | 0 (0.0%) |
| $800 to $1,499 | 54 (1.4%) | 860 (45.3%) |
| $800 to $1,499 | 108 (2.8%) | 410 (21.6%) |
| Total | 3,904 (100.0%) | 1,900 (100.0%) |
Health & Disability in Allen Parish
Health Insurance Coverage by Age in Allen Parish
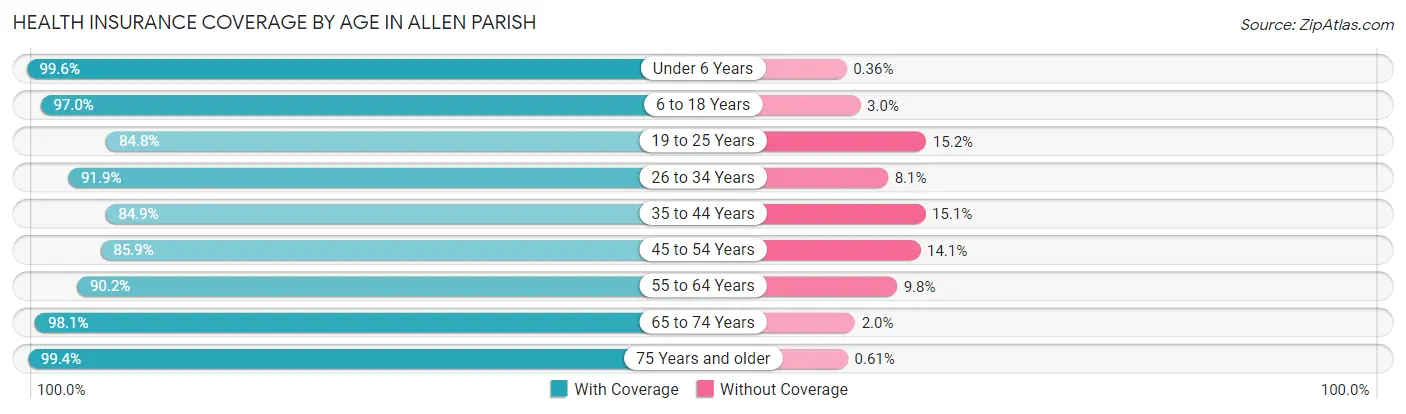
| Age Bracket | With Coverage | Without Coverage |
| Under 6 Years | 1,646 (99.6%) | 6 (0.4%) |
| 6 to 18 Years | 3,641 (97.0%) | 111 (3.0%) |
| 19 to 25 Years | 1,298 (84.8%) | 233 (15.2%) |
| 26 to 34 Years | 2,201 (91.9%) | 194 (8.1%) |
| 35 to 44 Years | 1,844 (84.9%) | 327 (15.1%) |
| 45 to 54 Years | 2,007 (85.9%) | 330 (14.1%) |
| 55 to 64 Years | 2,079 (90.2%) | 225 (9.8%) |
| 65 to 74 Years | 1,908 (98.1%) | 38 (1.9%) |
| 75 Years and older | 1,147 (99.4%) | 7 (0.6%) |
| Total | 17,771 (92.4%) | 1,471 (7.6%) |
Health Insurance Coverage by Citizenship Status in Allen Parish
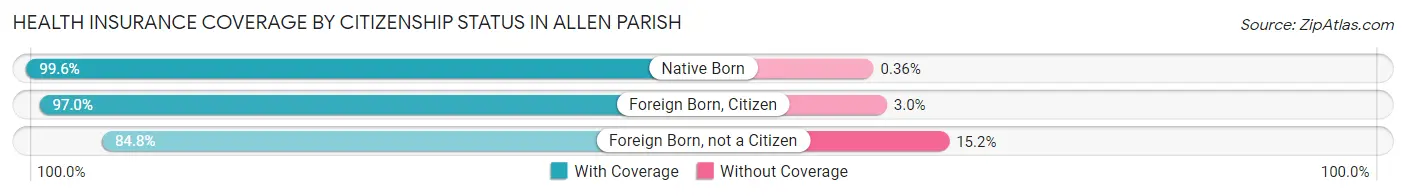
| Citizenship Status | With Coverage | Without Coverage |
| Native Born | 1,646 (99.6%) | 6 (0.4%) |
| Foreign Born, Citizen | 3,641 (97.0%) | 111 (3.0%) |
| Foreign Born, not a Citizen | 1,298 (84.8%) | 233 (15.2%) |
Health Insurance Coverage by Household Income in Allen Parish
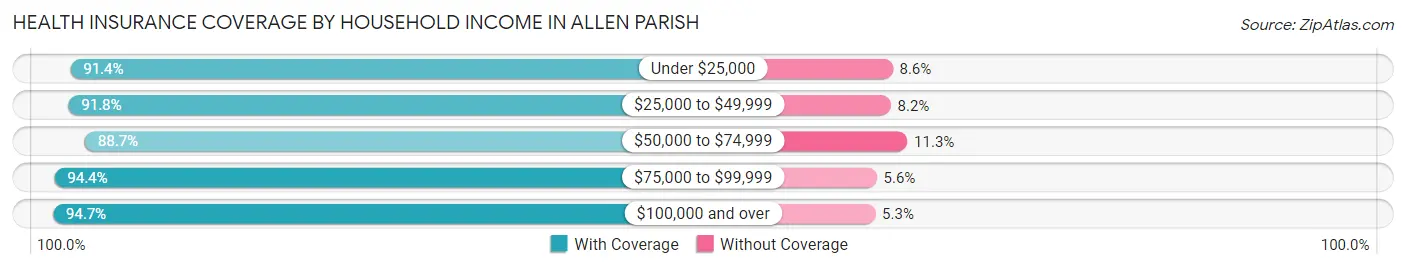
| Household Income | With Coverage | Without Coverage |
| Under $25,000 | 3,381 (91.4%) | 317 (8.6%) |
| $25,000 to $49,999 | 3,602 (91.8%) | 322 (8.2%) |
| $50,000 to $74,999 | 3,083 (88.7%) | 393 (11.3%) |
| $75,000 to $99,999 | 2,200 (94.4%) | 130 (5.6%) |
| $100,000 and over | 5,505 (94.7%) | 309 (5.3%) |
Public vs Private Health Insurance Coverage by Age in Allen Parish
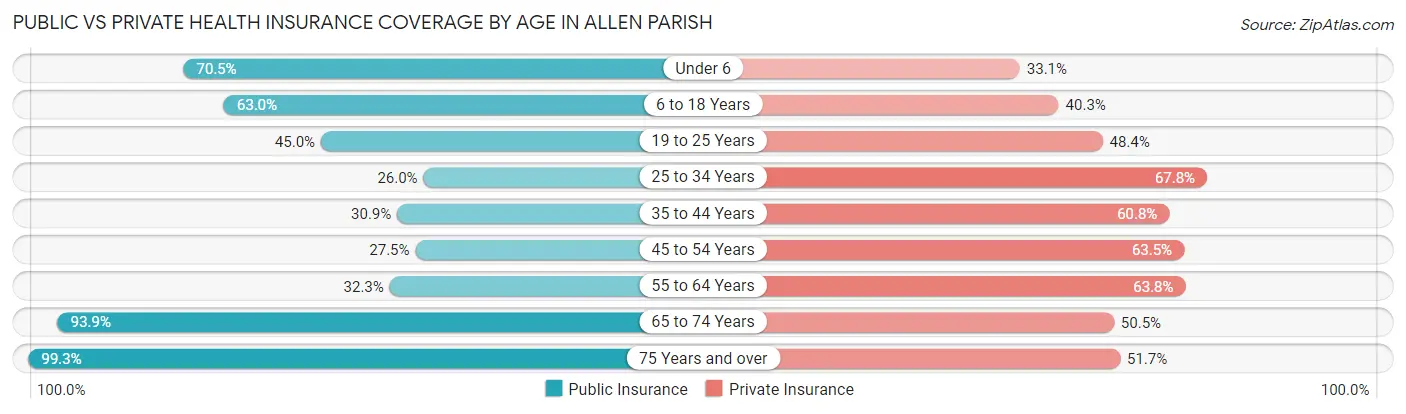
| Age Bracket | Public Insurance | Private Insurance |
| Under 6 | 1,165 (70.5%) | 546 (33.1%) |
| 6 to 18 Years | 2,364 (63.0%) | 1,510 (40.3%) |
| 19 to 25 Years | 689 (45.0%) | 741 (48.4%) |
| 25 to 34 Years | 622 (26.0%) | 1,623 (67.8%) |
| 35 to 44 Years | 670 (30.9%) | 1,319 (60.8%) |
| 45 to 54 Years | 642 (27.5%) | 1,484 (63.5%) |
| 55 to 64 Years | 743 (32.3%) | 1,469 (63.8%) |
| 65 to 74 Years | 1,827 (93.9%) | 983 (50.5%) |
| 75 Years and over | 1,146 (99.3%) | 596 (51.6%) |
| Total | 9,868 (51.3%) | 10,271 (53.4%) |
Disability Status by Sex by Age in Allen Parish
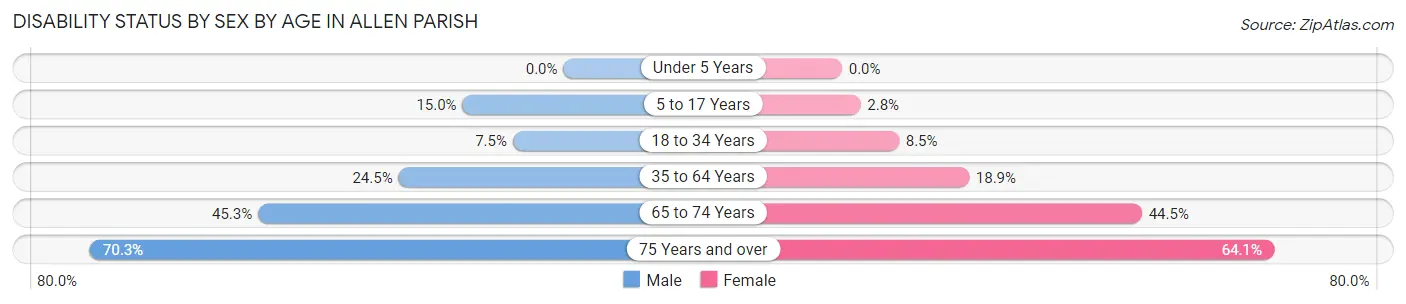
| Age Bracket | Male | Female |
| Under 5 Years | 0 (0.0%) | 0 (0.0%) |
| 5 to 17 Years | 302 (15.0%) | 51 (2.8%) |
| 18 to 34 Years | 155 (7.5%) | 173 (8.5%) |
| 35 to 64 Years | 771 (24.5%) | 691 (18.9%) |
| 65 to 74 Years | 409 (45.3%) | 465 (44.5%) |
| 75 Years and over | 329 (70.3%) | 440 (64.1%) |
Disability Class by Sex by Age in Allen Parish
Disability Class: Hearing Difficulty
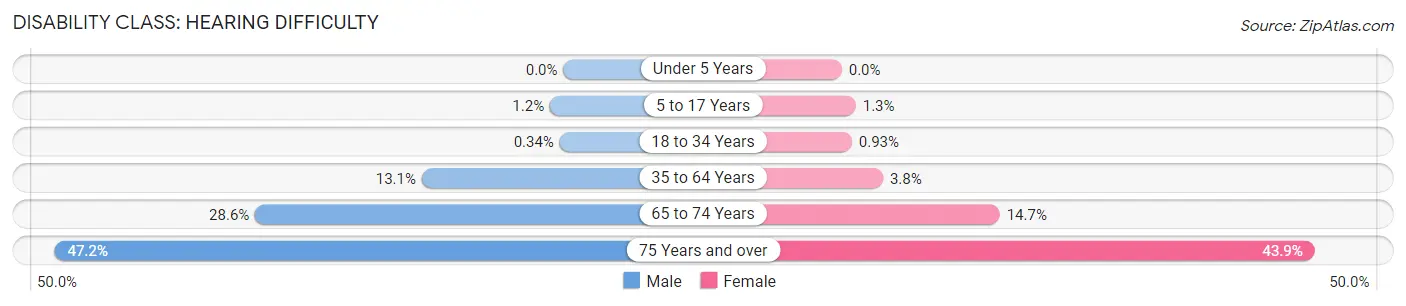
| Age Bracket | Male | Female |
| Under 5 Years | 0 (0.0%) | 0 (0.0%) |
| 5 to 17 Years | 25 (1.2%) | 24 (1.3%) |
| 18 to 34 Years | 7 (0.3%) | 19 (0.9%) |
| 35 to 64 Years | 414 (13.1%) | 140 (3.8%) |
| 65 to 74 Years | 258 (28.6%) | 153 (14.7%) |
| 75 Years and over | 221 (47.2%) | 301 (43.9%) |
Disability Class: Vision Difficulty
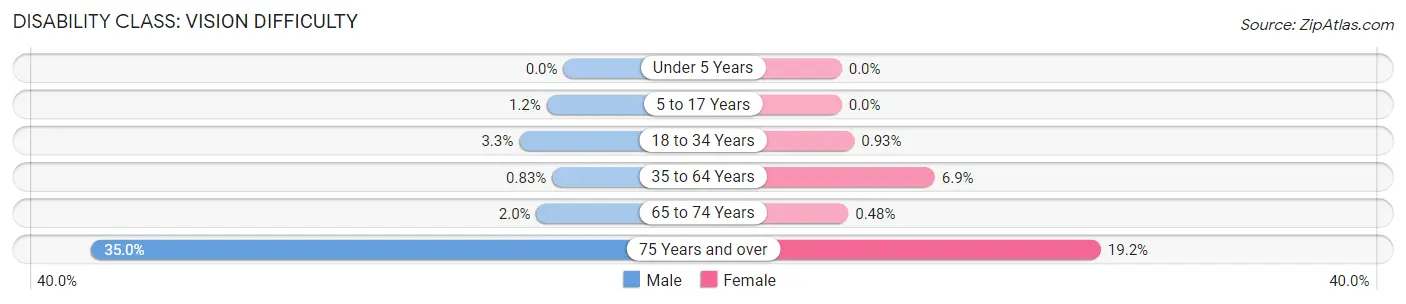
| Age Bracket | Male | Female |
| Under 5 Years | 0 (0.0%) | 0 (0.0%) |
| 5 to 17 Years | 25 (1.2%) | 0 (0.0%) |
| 18 to 34 Years | 68 (3.3%) | 19 (0.9%) |
| 35 to 64 Years | 26 (0.8%) | 253 (6.9%) |
| 65 to 74 Years | 18 (2.0%) | 5 (0.5%) |
| 75 Years and over | 164 (35.0%) | 132 (19.2%) |
Disability Class: Cognitive Difficulty
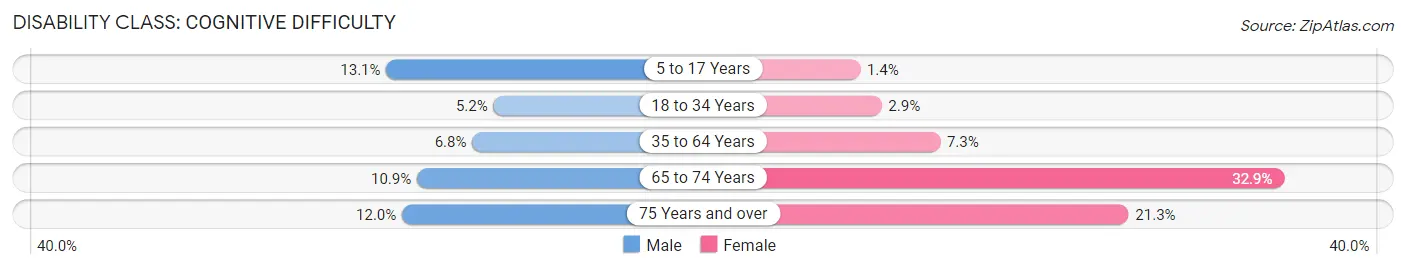
| Age Bracket | Male | Female |
| 5 to 17 Years | 265 (13.1%) | 25 (1.3%) |
| 18 to 34 Years | 107 (5.2%) | 60 (2.9%) |
| 35 to 64 Years | 213 (6.8%) | 267 (7.3%) |
| 65 to 74 Years | 98 (10.9%) | 343 (32.9%) |
| 75 Years and over | 56 (12.0%) | 146 (21.3%) |
Disability Class: Ambulatory Difficulty
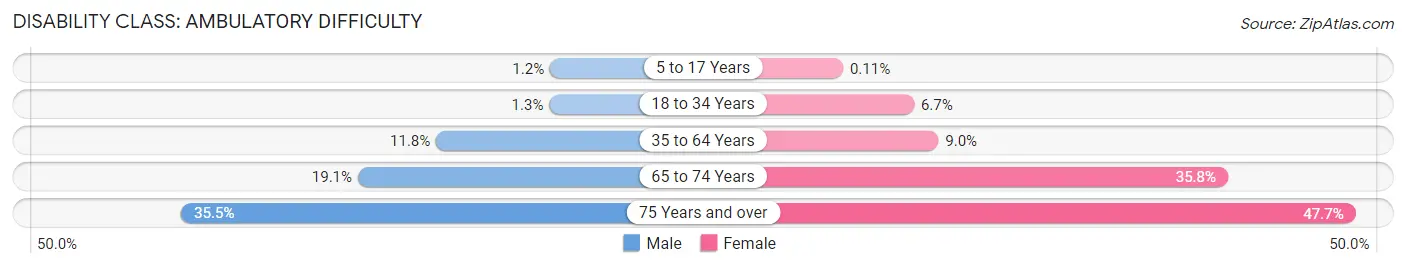
| Age Bracket | Male | Female |
| 5 to 17 Years | 25 (1.2%) | 2 (0.1%) |
| 18 to 34 Years | 27 (1.3%) | 137 (6.7%) |
| 35 to 64 Years | 372 (11.8%) | 328 (9.0%) |
| 65 to 74 Years | 172 (19.1%) | 374 (35.8%) |
| 75 Years and over | 166 (35.5%) | 327 (47.7%) |
Disability Class: Self-Care Difficulty
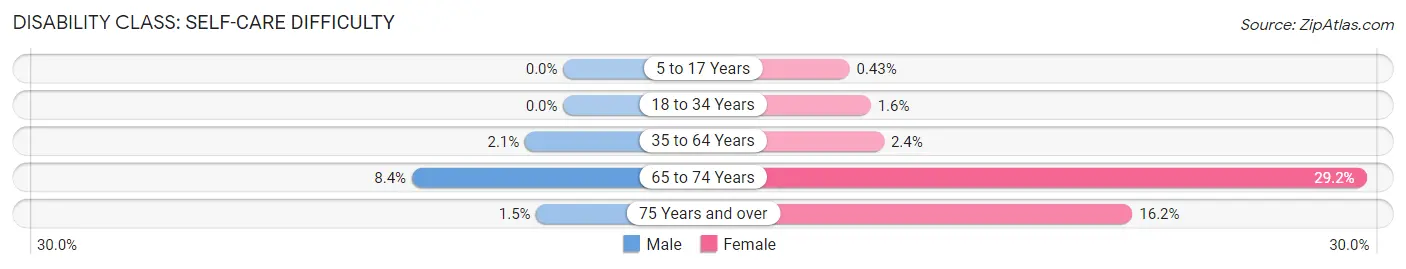
| Age Bracket | Male | Female |
| 5 to 17 Years | 0 (0.0%) | 8 (0.4%) |
| 18 to 34 Years | 0 (0.0%) | 33 (1.6%) |
| 35 to 64 Years | 67 (2.1%) | 86 (2.4%) |
| 65 to 74 Years | 76 (8.4%) | 305 (29.2%) |
| 75 Years and over | 7 (1.5%) | 111 (16.2%) |
Technology Access in Allen Parish
Computing Device Access in Allen Parish
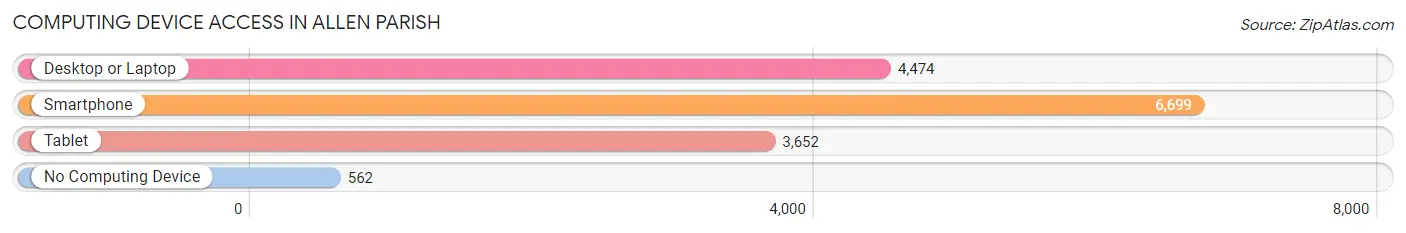
| Device Type | # Households | % Households |
| Desktop or Laptop | 4,474 | 58.6% |
| Smartphone | 6,699 | 87.7% |
| Tablet | 3,652 | 47.8% |
| No Computing Device | 562 | 7.4% |
| Total | 7,636 | 100.0% |
Internet Access in Allen Parish
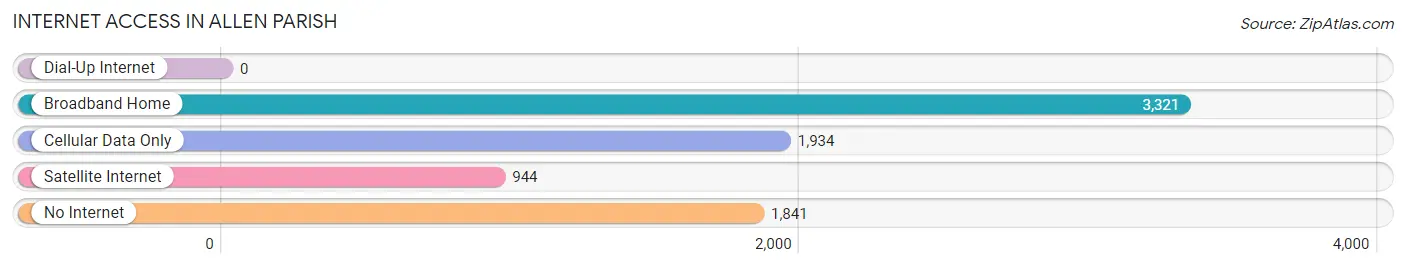
| Internet Type | # Households | % Households |
| Dial-Up Internet | 0 | 0.0% |
| Broadband Home | 3,321 | 43.5% |
| Cellular Data Only | 1,934 | 25.3% |
| Satellite Internet | 944 | 12.4% |
| No Internet | 1,841 | 24.1% |
| Total | 7,636 | 100.0% |
Allen Parish Summary
Introduction
Allen Parish is a parish located in the southwestern part of Louisiana. It is bordered by Beauregard Parish to the north, Calcasieu Parish to the east, and Jefferson Davis Parish to the south. The parish seat is Oberlin. The parish was created in 1912 from a portion of Calcasieu Parish. It is named for former Confederate States of America General and Governor Henry Watkins Allen.
History
The area that is now Allen Parish was originally inhabited by the Atakapa Indians. The first European settlers in the area were French and Spanish colonists who arrived in the late 1700s. The area was part of the Spanish colony of Louisiana until 1803 when it became part of the United States.
In 1843, the area was organized as Calcasieu Parish. In 1912, Allen Parish was created from a portion of Calcasieu Parish. The parish was named for former Confederate States of America General and Governor Henry Watkins Allen.
Geography
Allen Parish is located in the southwestern part of Louisiana. It is bordered by Beauregard Parish to the north, Calcasieu Parish to the east, and Jefferson Davis Parish to the south. The parish seat is Oberlin.
The parish has a total area of 590 square miles, of which 588 square miles is land and 2 square miles (0.3%) is water. The parish is mostly flat with some rolling hills. The highest point in the parish is an unnamed hill in the northern part of the parish, which has an elevation of 200 feet.
Economy
The economy of Allen Parish is largely based on agriculture. The main crops grown in the parish are cotton, soybeans, corn, and rice. The parish also has a large timber industry.
The parish is also home to several oil and gas production companies. The parish is home to the Oberlin Oil Field, which is one of the largest oil fields in the state.
Demographics
As of the 2010 census, the population of Allen Parish was 25,764. The racial makeup of the parish was 79.3% White, 17.7% African American, 0.3% Native American, 0.3% Asian, 0.1% Pacific Islander, 1.2% from other races, and 1.2% from two or more races. Hispanic or Latino of any race were 3.2% of the population.
The median household income in the parish was $37,945 and the median family income was $45,945. The per capita income was $17,945. About 17.2% of families and 21.2% of the population were below the poverty line, including 28.2% of those under age 18 and 16.2% of those age 65 or over.
Conclusion
Allen Parish is a parish located in the southwestern part of Louisiana. It was created in 1912 from a portion of Calcasieu Parish and is named for former Confederate States of America General and Governor Henry Watkins Allen. The parish has a total area of 590 square miles and is mostly flat with some rolling hills. The economy of Allen Parish is largely based on agriculture and the timber industry. As of the 2010 census, the population of Allen Parish was 25,764. The median household income in the parish was $37,945 and the median family income was $45,945.
Common Questions
What is the Total Population of Allen Parish?
Total Population of Allen Parish is 22,798.
What is the Total Male Population of Allen Parish?
Total Male Population of Allen Parish is 12,751.
What is the Total Female Population of Allen Parish?
Total Female Population of Allen Parish is 10,047.
What is the Ratio of Males per 100 Females in Allen Parish?
There are 126.91 Males per 100 Females in Allen Parish.
What is the Ratio of Females per 100 Males in Allen Parish?
There are 78.79 Females per 100 Males in Allen Parish.
What is the Median Population Age in Allen Parish?
Median Population Age in Allen Parish is 38.5 Years.
What is the Average Family Size in Allen Parish
Average Family Size in Allen Parish is 3.0 People.
What is the Average Household Size in Allen Parish
Average Household Size in Allen Parish is 2.5 People.
What is Per Capita Income in Allen Parish?
Per Capita income in Allen Parish is $23,971.
What is the Median Family Income in Allen Parish?
Median Family Income in Allen Parish is $61,779.
What is the Median Household income in Allen Parish?
Median Household Income in Allen Parish is $52,755.
What is Income or Wage Gap in Allen Parish?
Income or Wage Gap in Allen Parish is 29.5%.
Women in Allen Parish earn 70.5 cents for every dollar earned by a man.
What is Family Income Deficit in Allen Parish?
Family Income Deficit in Allen Parish is $10,958.
Families that are below poverty line in Allen Parish earn $10,958 less on average than the poverty threshold level.
What is Inequality or Gini Index in Allen Parish?
Inequality or Gini Index in Allen Parish is 0.46.
How Large is the Labor Force in Allen Parish?
There are 8,563 People in the Labor Forcein in Allen Parish.
What is the Percentage of People in the Labor Force in Allen Parish?
47.1% of People are in the Labor Force in Allen Parish.
What is the Unemployment Rate in Allen Parish?
Unemployment Rate in Allen Parish is 8.9%.