Ball, LA
Ball Map
Ball Overview
3,926
TOTAL POPULATION
2,089
MALE POPULATION
1,837
FEMALE POPULATION
113.72
MALES / 100 FEMALES
87.94
FEMALES / 100 MALES
31.1
MEDIAN AGE
3.6
AVG FAMILY SIZE
2.9
AVG HOUSEHOLD SIZE
$32,443
PER CAPITA INCOME
$81,250
AVG FAMILY INCOME
$76,198
AVG HOUSEHOLD INCOME
46.2%
WAGE / INCOME GAP [ % ]
53.8¢/ $1
WAGE / INCOME GAP [ $ ]
0.38
INEQUALITY / GINI INDEX
2,058
LABOR FORCE [ PEOPLE ]
68.3%
PERCENT IN LABOR FORCE
5.8%
UNEMPLOYMENT RATE
Ball Zip Codes
Ball Area Codes
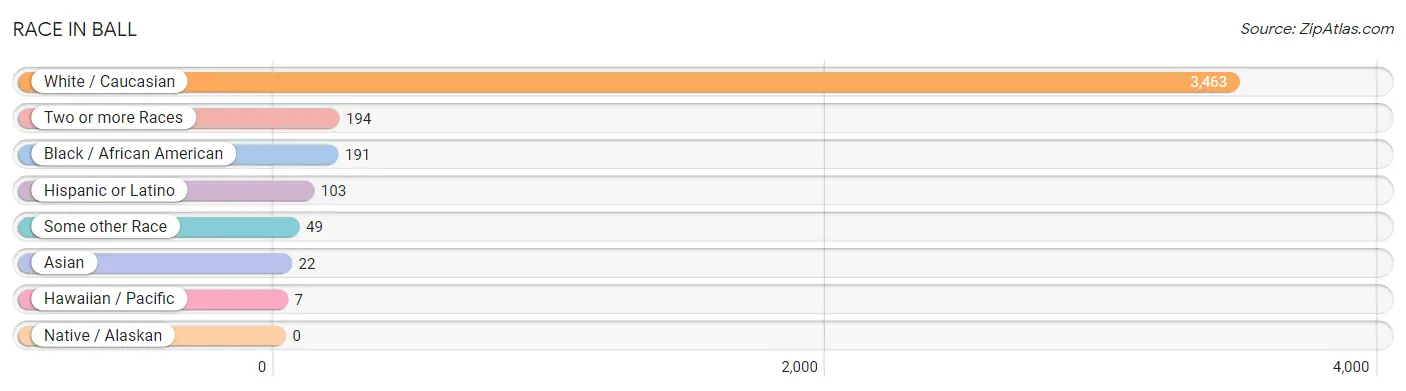
Race in Ball
The most populous races in Ball are White / Caucasian (3,463 | 88.2%), Two or more Races (194 | 4.9%), and Black / African American (191 | 4.9%).
| Race | # Population | % Population |
| Asian | 22 | 0.6% |
| Black / African American | 191 | 4.9% |
| Hawaiian / Pacific | 7 | 0.2% |
| Hispanic or Latino | 103 | 2.6% |
| Native / Alaskan | 0 | 0.0% |
| White / Caucasian | 3,463 | 88.2% |
| Two or more Races | 194 | 4.9% |
| Some other Race | 49 | 1.3% |
| Total | 3,926 | 100.0% |
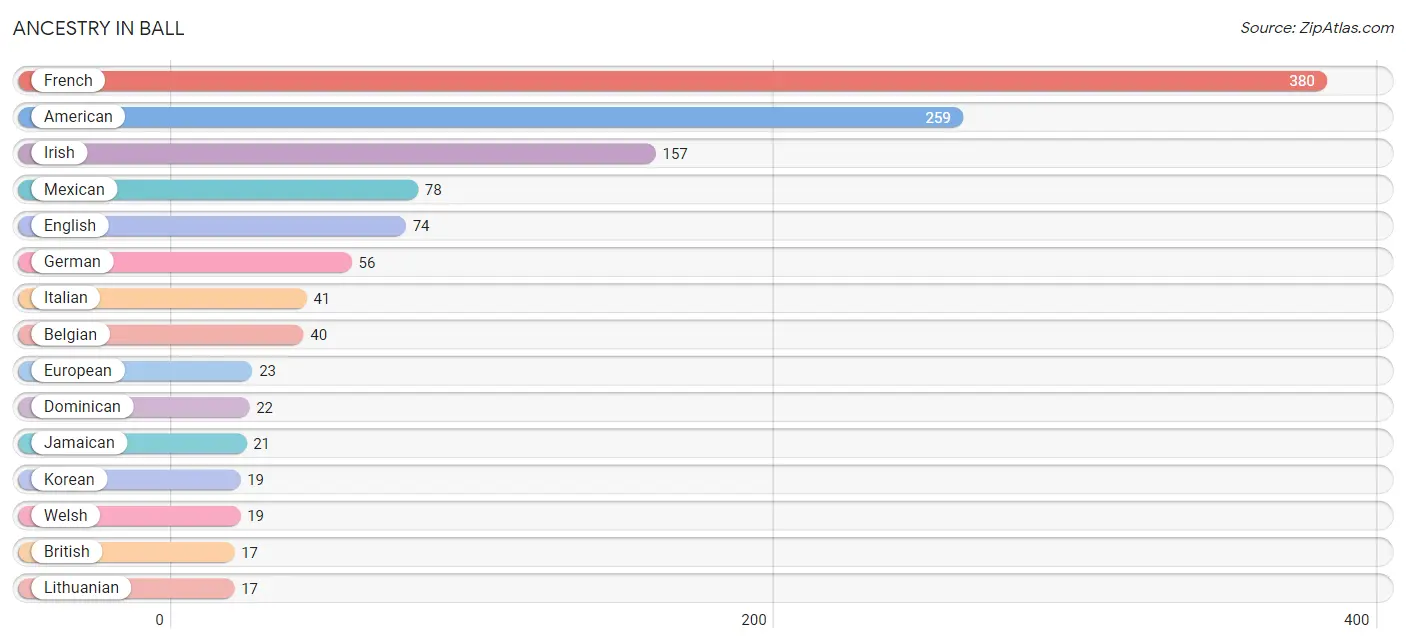
Ancestry in Ball
The most populous ancestries reported in Ball are French (380 | 9.7%), American (259 | 6.6%), Irish (157 | 4.0%), Mexican (78 | 2.0%), and English (74 | 1.9%), together accounting for 24.2% of all Ball residents.
| Ancestry | # Population | % Population |
| American | 259 | 6.6% |
| Belgian | 40 | 1.0% |
| Bhutanese | 13 | 0.3% |
| British | 17 | 0.4% |
| Canadian | 5 | 0.1% |
| Central American | 3 | 0.1% |
| Dominican | 22 | 0.6% |
| Dutch | 11 | 0.3% |
| Eastern European | 10 | 0.3% |
| English | 74 | 1.9% |
| European | 23 | 0.6% |
| French | 380 | 9.7% |
| French Canadian | 13 | 0.3% |
| German | 56 | 1.4% |
| Greek | 12 | 0.3% |
| Irish | 157 | 4.0% |
| Italian | 41 | 1.0% |
| Jamaican | 21 | 0.5% |
| Korean | 19 | 0.5% |
| Lithuanian | 17 | 0.4% |
| Mexican | 78 | 2.0% |
| Native Hawaiian | 7 | 0.2% |
| Northern European | 3 | 0.1% |
| Panamanian | 3 | 0.1% |
| Polish | 6 | 0.2% |
| Russian | 14 | 0.4% |
| Scotch-Irish | 12 | 0.3% |
| Scottish | 17 | 0.4% |
| Thai | 5 | 0.1% |
| Welsh | 19 | 0.5% | View All 30 Rows |
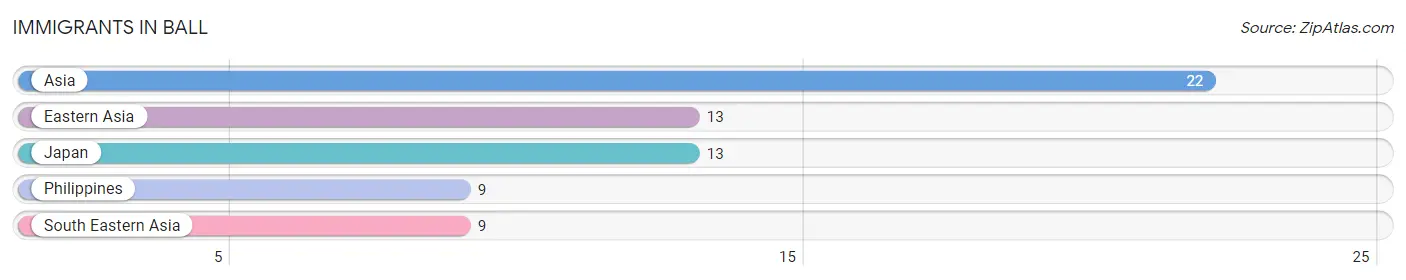
Immigrants in Ball
The most numerous immigrant groups reported in Ball came from Asia (22 | 0.6%), Eastern Asia (13 | 0.3%), Japan (13 | 0.3%), Philippines (9 | 0.2%), and South Eastern Asia (9 | 0.2%), together accounting for 1.7% of all Ball residents.
| Immigration Origin | # Population | % Population |
| Asia | 22 | 0.6% |
| Eastern Asia | 13 | 0.3% |
| Japan | 13 | 0.3% |
| Philippines | 9 | 0.2% |
| South Eastern Asia | 9 | 0.2% | View All 5 Rows |
Sex and Age in Ball
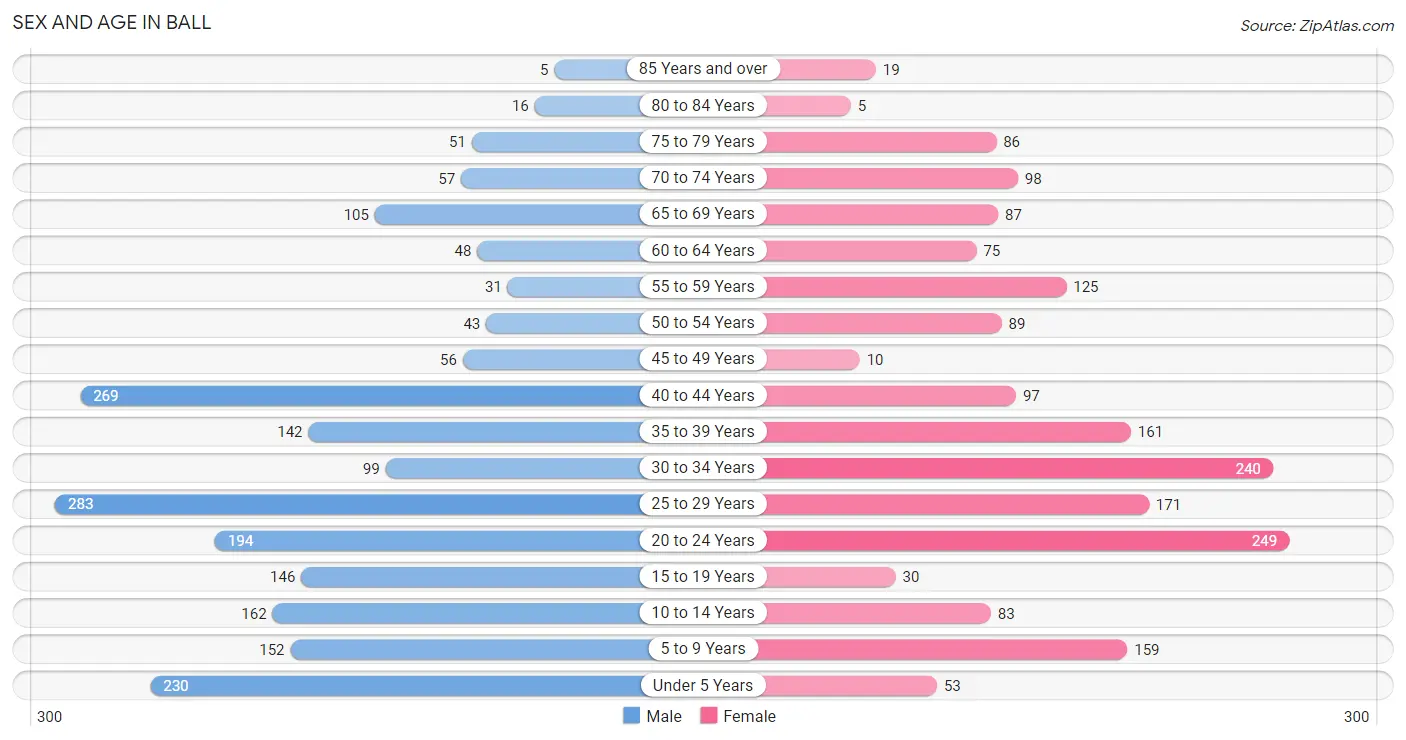
Sex and Age in Ball
The most populous age groups in Ball are 25 to 29 Years (283 | 13.6%) for men and 20 to 24 Years (249 | 13.6%) for women.
| Age Bracket | Male | Female |
| Under 5 Years | 230 (11.0%) | 53 (2.9%) |
| 5 to 9 Years | 152 (7.3%) | 159 (8.7%) |
| 10 to 14 Years | 162 (7.7%) | 83 (4.5%) |
| 15 to 19 Years | 146 (7.0%) | 30 (1.6%) |
| 20 to 24 Years | 194 (9.3%) | 249 (13.6%) |
| 25 to 29 Years | 283 (13.6%) | 171 (9.3%) |
| 30 to 34 Years | 99 (4.7%) | 240 (13.1%) |
| 35 to 39 Years | 142 (6.8%) | 161 (8.8%) |
| 40 to 44 Years | 269 (12.9%) | 97 (5.3%) |
| 45 to 49 Years | 56 (2.7%) | 10 (0.5%) |
| 50 to 54 Years | 43 (2.1%) | 89 (4.8%) |
| 55 to 59 Years | 31 (1.5%) | 125 (6.8%) |
| 60 to 64 Years | 48 (2.3%) | 75 (4.1%) |
| 65 to 69 Years | 105 (5.0%) | 87 (4.7%) |
| 70 to 74 Years | 57 (2.7%) | 98 (5.3%) |
| 75 to 79 Years | 51 (2.4%) | 86 (4.7%) |
| 80 to 84 Years | 16 (0.8%) | 5 (0.3%) |
| 85 Years and over | 5 (0.2%) | 19 (1.0%) |
| Total | 2,089 (100.0%) | 1,837 (100.0%) |
Families and Households in Ball
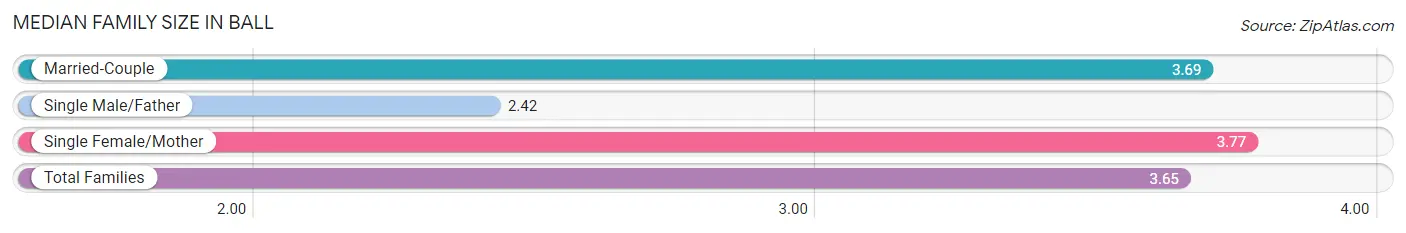
Median Family Size in Ball
The median family size in Ball is 3.65 persons per family, with single female/mother families (199 | 22.9%) accounting for the largest median family size of 3.77 persons per family. On the other hand, single male/father families (38 | 4.4%) represent the smallest median family size with 2.42 persons per family.
| Family Type | # Families | Family Size |
| Married-Couple | 632 (72.7%) | 3.69 |
| Single Male/Father | 38 (4.4%) | 2.42 |
| Single Female/Mother | 199 (22.9%) | 3.77 |
| Total Families | 869 (100.0%) | 3.65 |
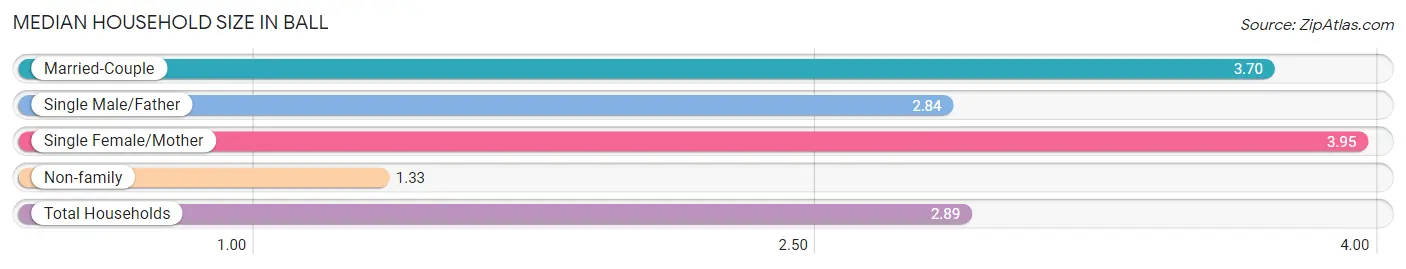
Median Household Size in Ball
The median household size in Ball is 2.89 persons per household, with single female/mother households (199 | 15.0%) accounting for the largest median household size of 3.95 persons per household. non-family households (460 | 34.6%) represent the smallest median household size with 1.33 persons per household.
| Household Type | # Households | Household Size |
| Married-Couple | 632 (47.5%) | 3.70 |
| Single Male/Father | 38 (2.9%) | 2.84 |
| Single Female/Mother | 199 (15.0%) | 3.95 |
| Non-family | 460 (34.6%) | 1.33 |
| Total Households | 1,329 (100.0%) | 2.89 |
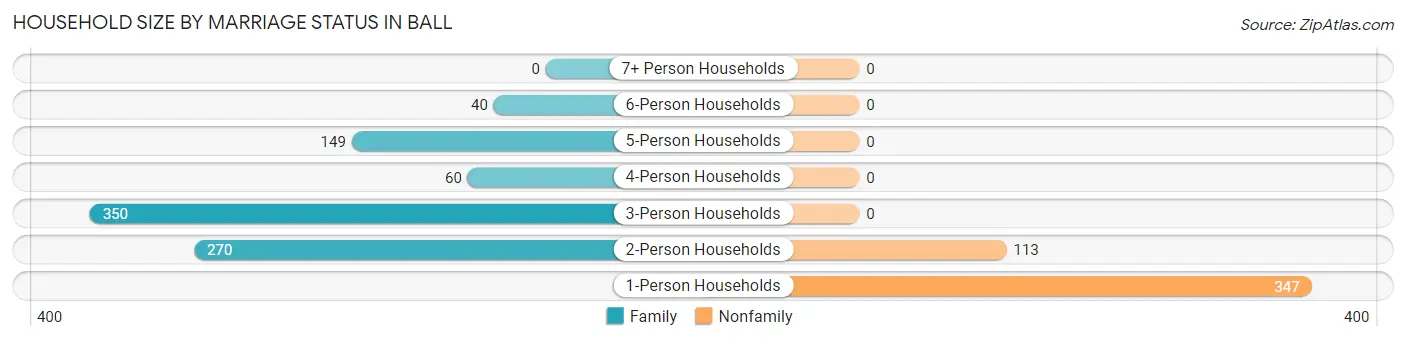
Household Size by Marriage Status in Ball
Out of a total of 1,329 households in Ball, 869 (65.4%) are family households, while 460 (34.6%) are nonfamily households. The most numerous type of family households are 3-person households, comprising 350, and the most common type of nonfamily households are 1-person households, comprising 347.
| Household Size | Family Households | Nonfamily Households |
| 1-Person Households | - | 347 (26.1%) |
| 2-Person Households | 270 (20.3%) | 113 (8.5%) |
| 3-Person Households | 350 (26.3%) | 0 (0.0%) |
| 4-Person Households | 60 (4.5%) | 0 (0.0%) |
| 5-Person Households | 149 (11.2%) | 0 (0.0%) |
| 6-Person Households | 40 (3.0%) | 0 (0.0%) |
| 7+ Person Households | 0 (0.0%) | 0 (0.0%) |
| Total | 869 (65.4%) | 460 (34.6%) |
Female Fertility in Ball
Fertility by Age in Ball
Average fertility rate in Ball is 28.0 births per 1,000 women. Women in the age bracket of 20 to 34 years have the highest fertility rate with 41.0 births per 1,000 women. Women in the age bracket of 20 to 34 years acount for 100.0% of all women with births.
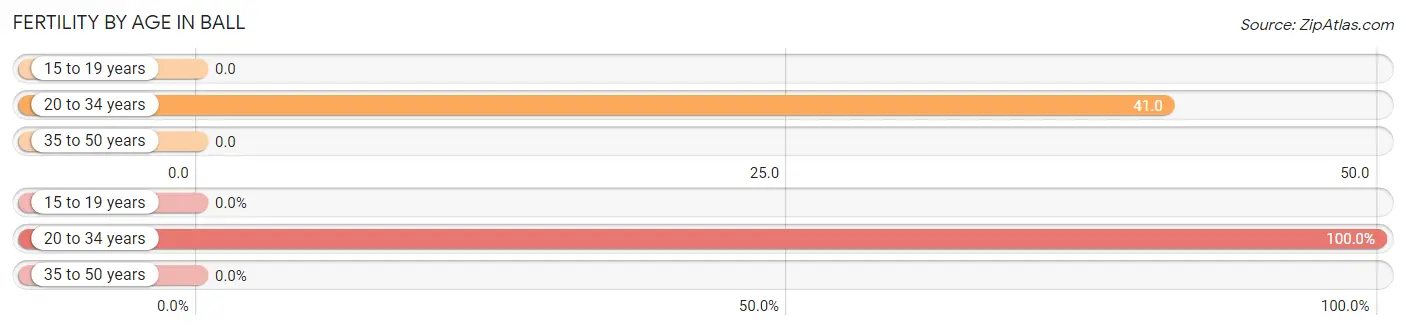
| Age Bracket | Women with Births | Births / 1,000 Women |
| 15 to 19 years | 0 (0.0%) | 0.0 |
| 20 to 34 years | 27 (100.0%) | 41.0 |
| 35 to 50 years | 0 (0.0%) | 0.0 |
| Total | 27 (100.0%) | 28.0 |
Fertility by Age by Marriage Status in Ball
40.7% of women with births (27) in Ball are married. The highest percentage of unmarried women with births falls into 20 to 34 years age bracket with 59.3% of them unmarried at the time of birth, while the lowest percentage of unmarried women with births belong to 20 to 34 years age bracket with 59.3% of them unmarried.
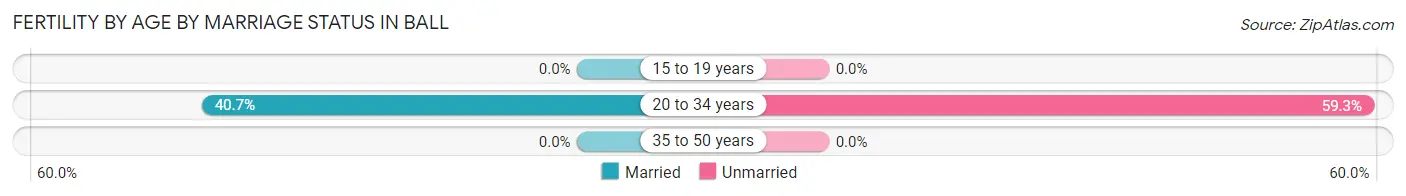
| Age Bracket | Married | Unmarried |
| 15 to 19 years | 0 (0.0%) | 0 (0.0%) |
| 20 to 34 years | 11 (40.7%) | 16 (59.3%) |
| 35 to 50 years | 0 (0.0%) | 0 (0.0%) |
| Total | 11 (40.7%) | 16 (59.3%) |
Fertility by Education in Ball
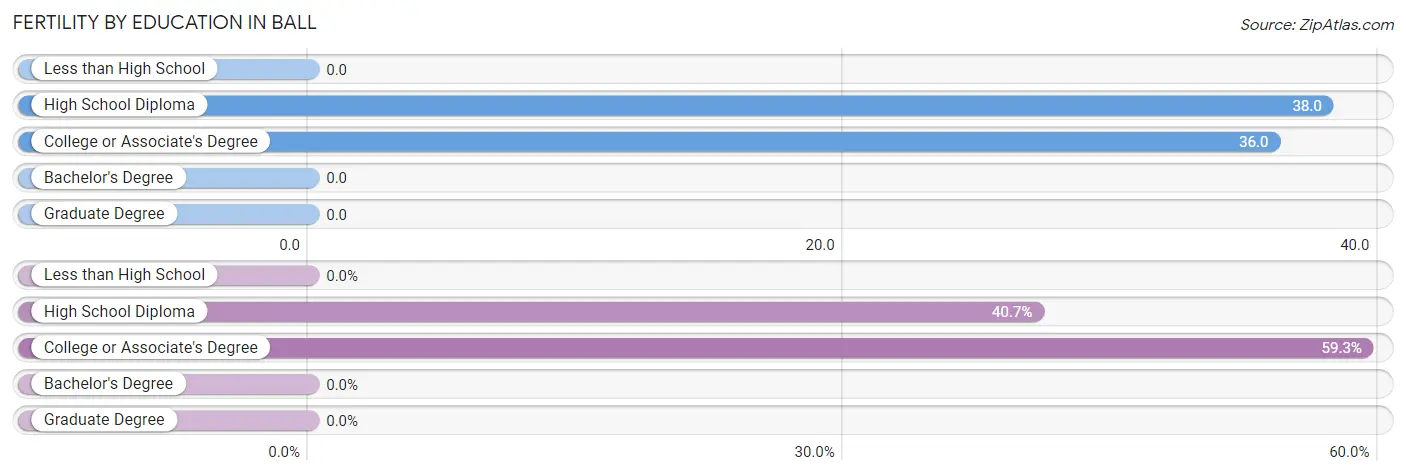
| Educational Attainment | Women with Births | Births / 1,000 Women |
| Less than High School | 0 (0.0%) | 0.0 |
| High School Diploma | 11 (40.7%) | 38.0 |
| College or Associate's Degree | 16 (59.3%) | 36.0 |
| Bachelor's Degree | 0 (0.0%) | 0.0 |
| Graduate Degree | 0 (0.0%) | 0.0 |
| Total | 27 (100.0%) | 28.0 |
Fertility by Education by Marriage Status in Ball
59.3% of women with births in Ball are unmarried. Women with the educational attainment of high school diploma are most likely to be married with 100.0% of them married at childbirth, while women with the educational attainment of college or associate's degree are least likely to be married with 100.0% of them unmarried at childbirth.
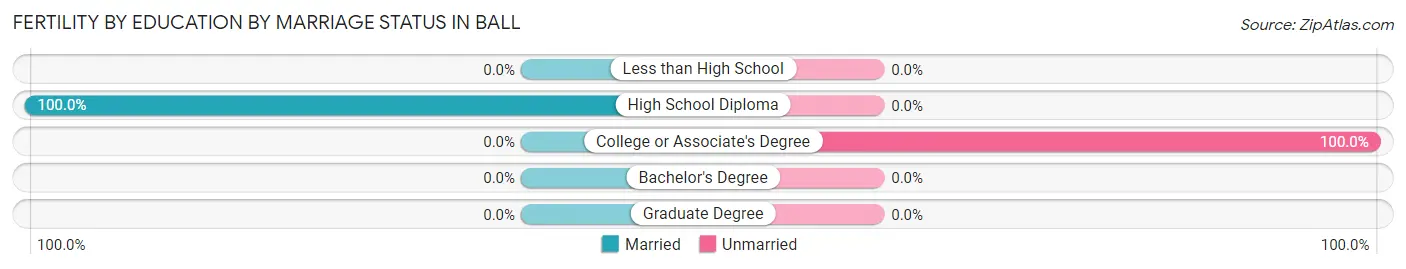
| Educational Attainment | Married | Unmarried |
| Less than High School | 0 (0.0%) | 0 (0.0%) |
| High School Diploma | 11 (100.0%) | 0 (0.0%) |
| College or Associate's Degree | 0 (0.0%) | 16 (100.0%) |
| Bachelor's Degree | 0 (0.0%) | 0 (0.0%) |
| Graduate Degree | 0 (0.0%) | 0 (0.0%) |
| Total | 11 (40.7%) | 16 (59.3%) |
Income in Ball
Income Overview in Ball
Per Capita Income in Ball is $32,443, while median incomes of families and households are $81,250 and $76,198 respectively.
| Characteristic | Number | Measure |
| Per Capita Income | 3,926 | $32,443 |
| Median Family Income | 869 | $81,250 |
| Mean Family Income | 869 | $95,347 |
| Median Household Income | 1,329 | $76,198 |
| Mean Household Income | 1,329 | $89,384 |
| Income Deficit | 869 | $0 |
| Wage / Income Gap (%) | 3,926 | 46.24% |
| Wage / Income Gap ($) | 3,926 | 53.76¢ per $1 |
| Gini / Inequality Index | 3,926 | 0.38 |
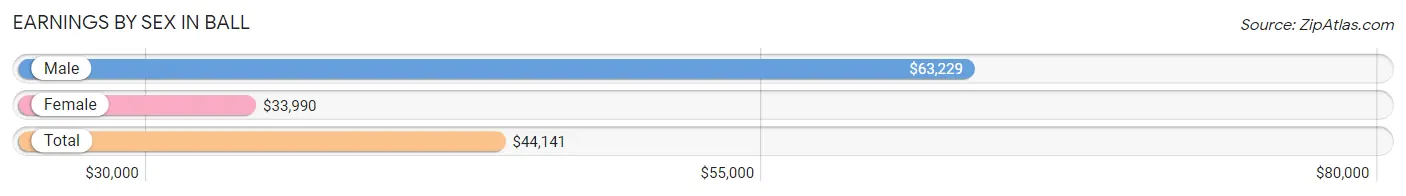
Earnings by Sex in Ball
Average Earnings in Ball are $44,141, $63,229 for men and $33,990 for women, a difference of 46.2%.
| Sex | Number | Average Earnings |
| Male | 1,106 (52.5%) | $63,229 |
| Female | 1,000 (47.5%) | $33,990 |
| Total | 2,106 (100.0%) | $44,141 |
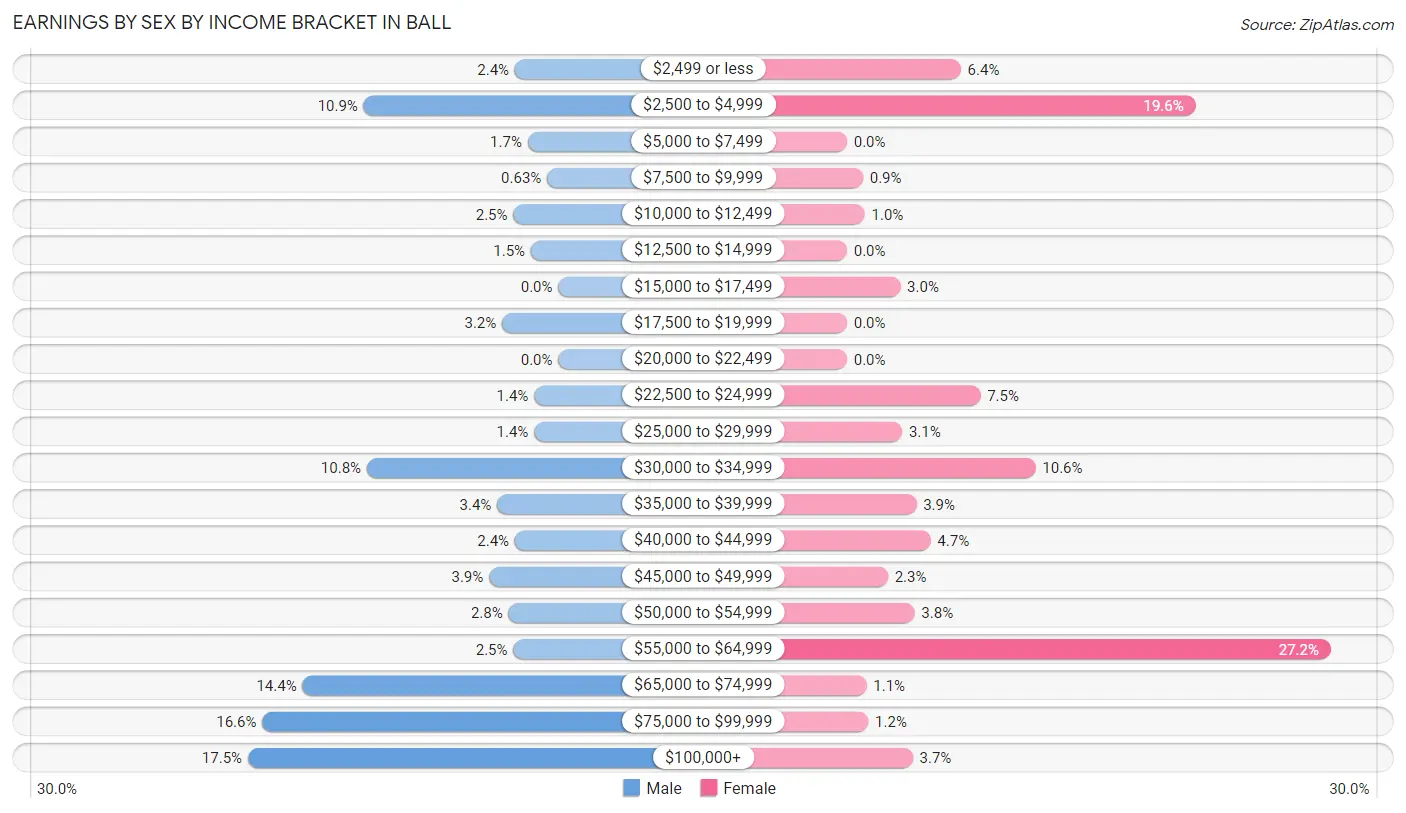
Earnings by Sex by Income Bracket in Ball
The most common earnings brackets in Ball are $100,000+ for men (193 | 17.4%) and $55,000 to $64,999 for women (272 | 27.2%).
| Income | Male | Female |
| $2,499 or less | 27 (2.4%) | 64 (6.4%) |
| $2,500 to $4,999 | 121 (10.9%) | 196 (19.6%) |
| $5,000 to $7,499 | 19 (1.7%) | 0 (0.0%) |
| $7,500 to $9,999 | 7 (0.6%) | 9 (0.9%) |
| $10,000 to $12,499 | 28 (2.5%) | 10 (1.0%) |
| $12,500 to $14,999 | 17 (1.5%) | 0 (0.0%) |
| $15,000 to $17,499 | 0 (0.0%) | 30 (3.0%) |
| $17,500 to $19,999 | 35 (3.2%) | 0 (0.0%) |
| $20,000 to $22,499 | 0 (0.0%) | 0 (0.0%) |
| $22,500 to $24,999 | 15 (1.4%) | 75 (7.5%) |
| $25,000 to $29,999 | 15 (1.4%) | 31 (3.1%) |
| $30,000 to $34,999 | 119 (10.8%) | 106 (10.6%) |
| $35,000 to $39,999 | 38 (3.4%) | 39 (3.9%) |
| $40,000 to $44,999 | 27 (2.4%) | 47 (4.7%) |
| $45,000 to $49,999 | 43 (3.9%) | 23 (2.3%) |
| $50,000 to $54,999 | 31 (2.8%) | 38 (3.8%) |
| $55,000 to $64,999 | 28 (2.5%) | 272 (27.2%) |
| $65,000 to $74,999 | 159 (14.4%) | 11 (1.1%) |
| $75,000 to $99,999 | 184 (16.6%) | 12 (1.2%) |
| $100,000+ | 193 (17.4%) | 37 (3.7%) |
| Total | 1,106 (100.0%) | 1,000 (100.0%) |
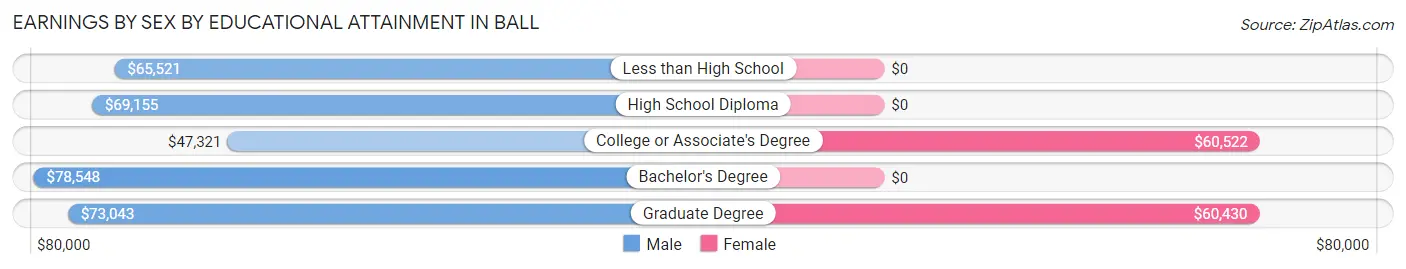
Earnings by Sex by Educational Attainment in Ball
Average earnings in Ball are $68,917 for men and $44,889 for women, a difference of 34.9%. Men with an educational attainment of bachelor's degree enjoy the highest average annual earnings of $78,548, while those with college or associate's degree education earn the least with $47,321. Women with an educational attainment of college or associate's degree earn the most with the average annual earnings of $60,522, while those with graduate degree education have the smallest earnings of $60,430.
| Educational Attainment | Male Income | Female Income |
| Less than High School | $65,521 | $0 |
| High School Diploma | $69,155 | $0 |
| College or Associate's Degree | $47,321 | $60,522 |
| Bachelor's Degree | $78,548 | $0 |
| Graduate Degree | $73,043 | $60,430 |
| Total | $68,917 | $44,889 |
Family Income in Ball
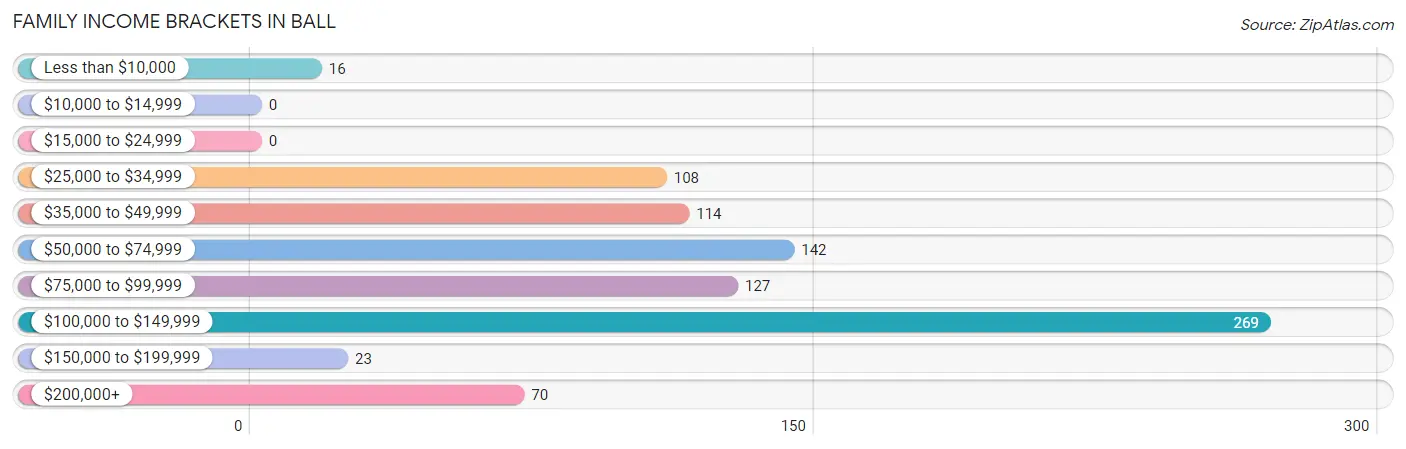
Family Income Brackets in Ball
According to the Ball family income data, there are 269 families falling into the $100,000 to $149,999 income range, which is the most common income bracket and makes up 31.0% of all families.
| Income Bracket | # Families | % Families |
| Less than $10,000 | 16 | 1.8% |
| $10,000 to $14,999 | 0 | 0.0% |
| $15,000 to $24,999 | 0 | 0.0% |
| $25,000 to $34,999 | 108 | 12.4% |
| $35,000 to $49,999 | 114 | 13.1% |
| $50,000 to $74,999 | 142 | 16.3% |
| $75,000 to $99,999 | 127 | 14.6% |
| $100,000 to $149,999 | 269 | 31.0% |
| $150,000 to $199,999 | 23 | 2.6% |
| $200,000+ | 70 | 8.1% |
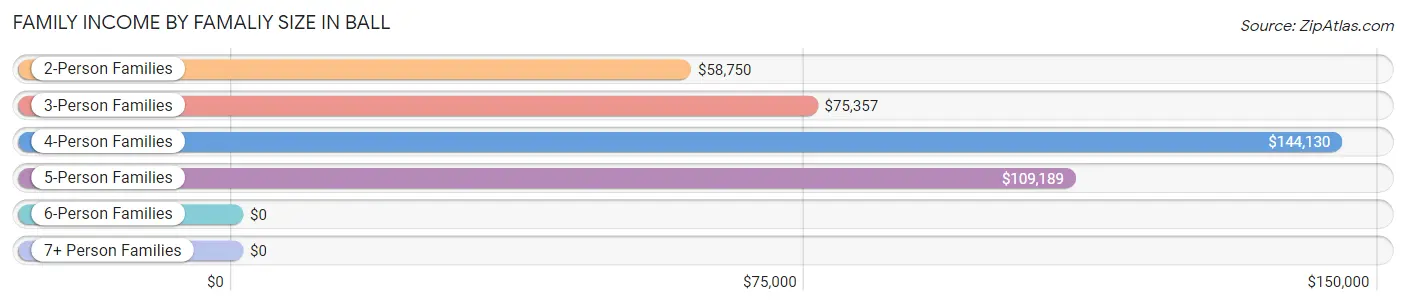
Family Income by Famaliy Size in Ball
4-person families (60 | 6.9%) account for the highest median family income in Ball with $144,130 per family, while 4-person families (60 | 6.9%) have the highest median income of $36,032 per family member.
| Income Bracket | # Families | Median Income |
| 2-Person Families | 293 (33.7%) | $58,750 |
| 3-Person Families | 332 (38.2%) | $75,357 |
| 4-Person Families | 60 (6.9%) | $144,130 |
| 5-Person Families | 156 (17.9%) | $109,189 |
| 6-Person Families | 28 (3.2%) | $0 |
| 7+ Person Families | 0 (0.0%) | $0 |
| Total | 869 (100.0%) | $81,250 |
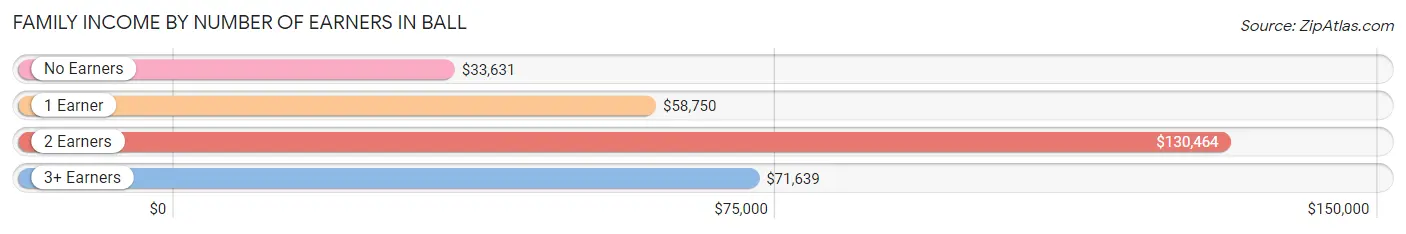
Family Income by Number of Earners in Ball
The median family income in Ball is $81,250, with families comprising 2 earners (385) having the highest median family income of $130,464, while families with no earners (125) have the lowest median family income of $33,631, accounting for 44.3% and 14.4% of families, respectively.
| Number of Earners | # Families | Median Income |
| No Earners | 125 (14.4%) | $33,631 |
| 1 Earner | 279 (32.1%) | $58,750 |
| 2 Earners | 385 (44.3%) | $130,464 |
| 3+ Earners | 80 (9.2%) | $71,639 |
| Total | 869 (100.0%) | $81,250 |
Household Income in Ball
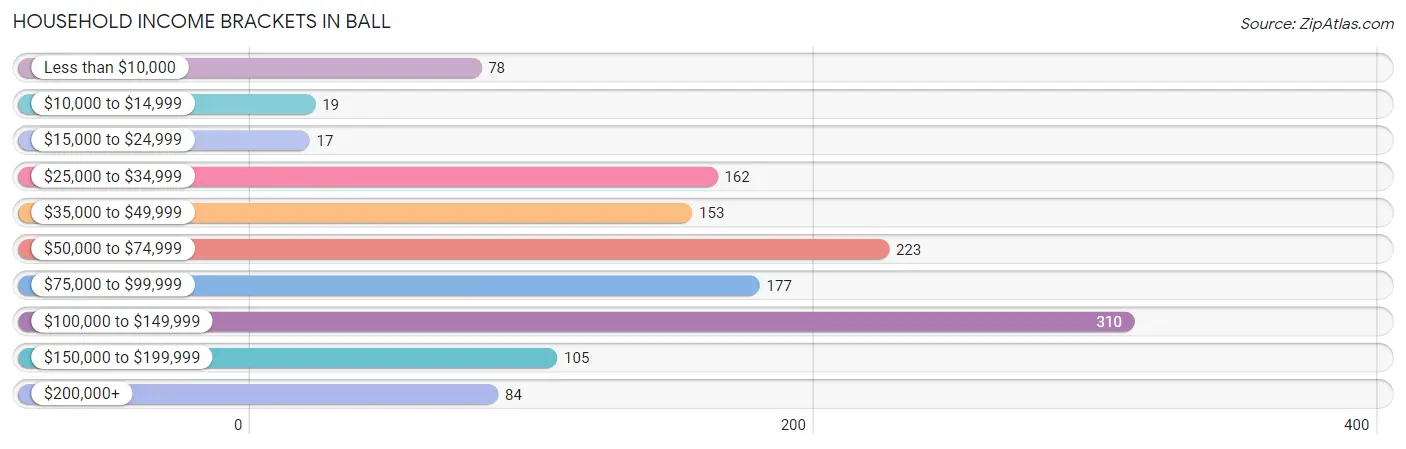
Household Income Brackets in Ball
With 310 households falling in the category, the $100,000 to $149,999 income range is the most frequent in Ball, accounting for 23.3% of all households. In contrast, only 17 households (1.3%) fall into the $15,000 to $24,999 income bracket, making it the least populous group.
| Income Bracket | # Households | % Households |
| Less than $10,000 | 78 | 5.9% |
| $10,000 to $14,999 | 19 | 1.4% |
| $15,000 to $24,999 | 17 | 1.3% |
| $25,000 to $34,999 | 162 | 12.2% |
| $35,000 to $49,999 | 153 | 11.5% |
| $50,000 to $74,999 | 223 | 16.8% |
| $75,000 to $99,999 | 177 | 13.3% |
| $100,000 to $149,999 | 310 | 23.3% |
| $150,000 to $199,999 | 105 | 7.9% |
| $200,000+ | 84 | 6.3% |
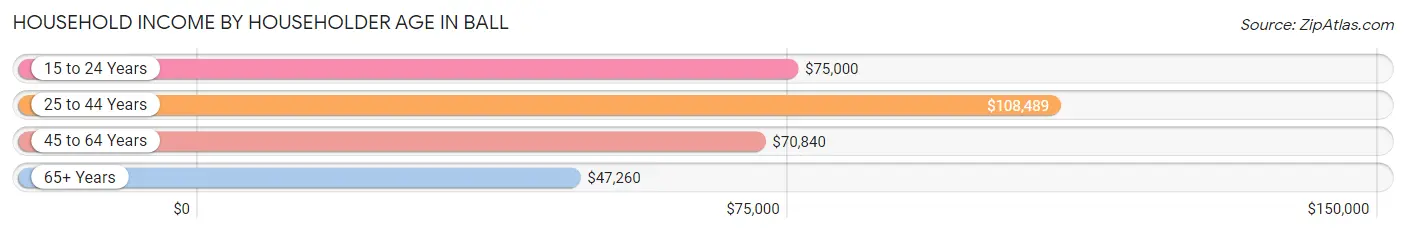
Household Income by Householder Age in Ball
The median household income in Ball is $76,198, with the highest median household income of $108,489 found in the 25 to 44 years age bracket for the primary householder. A total of 719 households (54.1%) fall into this category. Meanwhile, the 65+ years age bracket for the primary householder has the lowest median household income of $47,260, with 313 households (23.5%) in this group.
| Income Bracket | # Households | Median Income |
| 15 to 24 Years | 28 (2.1%) | $75,000 |
| 25 to 44 Years | 719 (54.1%) | $108,489 |
| 45 to 64 Years | 269 (20.2%) | $70,840 |
| 65+ Years | 313 (23.5%) | $47,260 |
| Total | 1,329 (100.0%) | $76,198 |
Poverty in Ball
Income Below Poverty by Sex and Age in Ball
With 5.5% poverty level for males and 6.9% for females among the residents of Ball, 55 to 64 year old males and 15 year old females are the most vulnerable to poverty, with 22 males (27.9%) and 3 females (42.9%) in their respective age groups living below the poverty level.
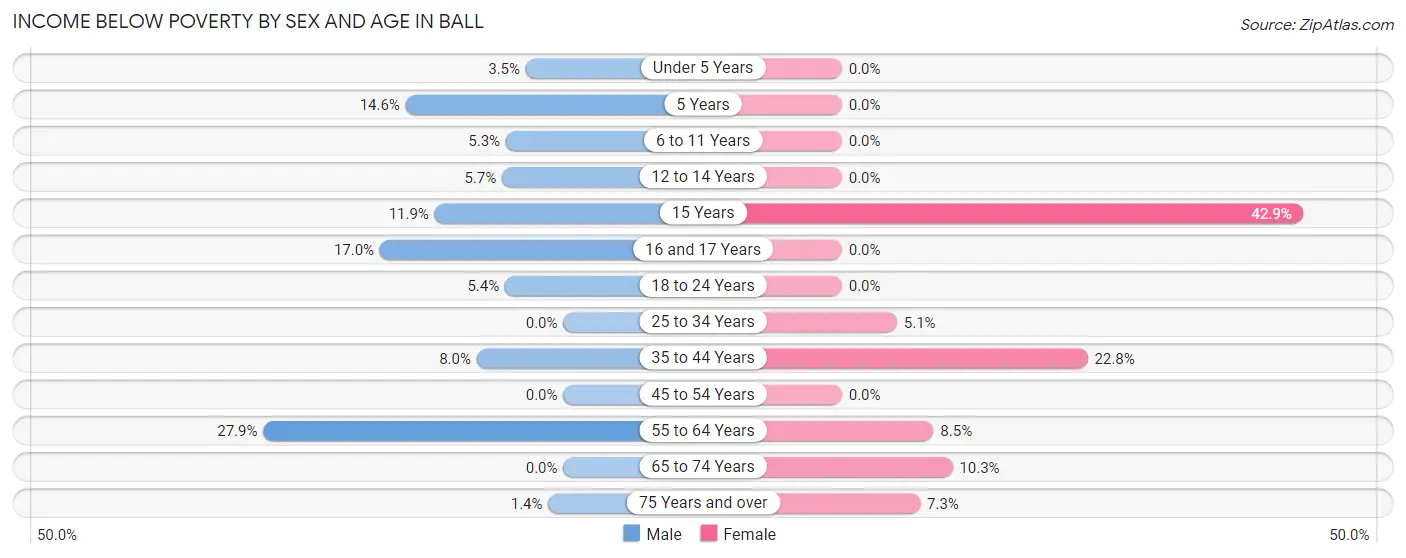
| Age Bracket | Male | Female |
| Under 5 Years | 8 (3.5%) | 0 (0.0%) |
| 5 Years | 6 (14.6%) | 0 (0.0%) |
| 6 to 11 Years | 8 (5.3%) | 0 (0.0%) |
| 12 to 14 Years | 7 (5.7%) | 0 (0.0%) |
| 15 Years | 8 (11.9%) | 3 (42.9%) |
| 16 and 17 Years | 8 (17.0%) | 0 (0.0%) |
| 18 to 24 Years | 10 (5.4%) | 0 (0.0%) |
| 25 to 34 Years | 0 (0.0%) | 21 (5.1%) |
| 35 to 44 Years | 33 (8.0%) | 57 (22.8%) |
| 45 to 54 Years | 0 (0.0%) | 0 (0.0%) |
| 55 to 64 Years | 22 (27.9%) | 17 (8.5%) |
| 65 to 74 Years | 0 (0.0%) | 19 (10.3%) |
| 75 Years and over | 1 (1.4%) | 8 (7.3%) |
| Total | 111 (5.5%) | 125 (6.9%) |
Income Above Poverty by Sex and Age in Ball
According to the poverty statistics in Ball, males aged 25 to 34 years and females aged under 5 years are the age groups that are most secure financially, with 100.0% of males and 100.0% of females in these age groups living above the poverty line.
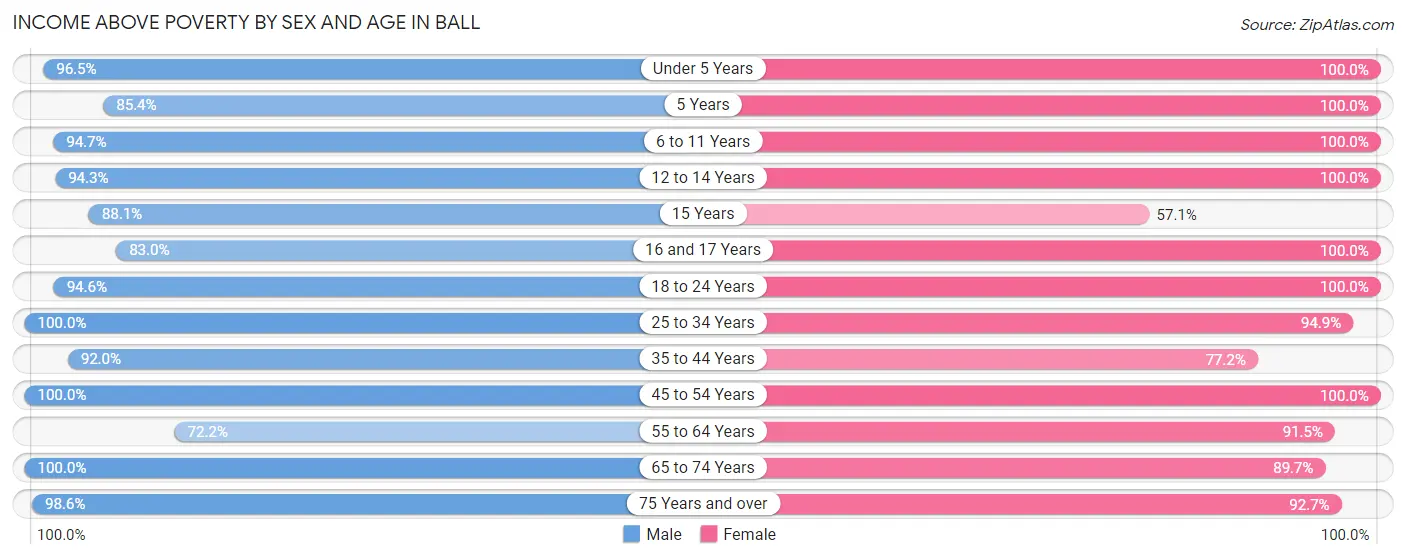
| Age Bracket | Male | Female |
| Under 5 Years | 222 (96.5%) | 53 (100.0%) |
| 5 Years | 35 (85.4%) | 26 (100.0%) |
| 6 to 11 Years | 142 (94.7%) | 151 (100.0%) |
| 12 to 14 Years | 116 (94.3%) | 65 (100.0%) |
| 15 Years | 59 (88.1%) | 4 (57.1%) |
| 16 and 17 Years | 39 (83.0%) | 12 (100.0%) |
| 18 to 24 Years | 175 (94.6%) | 253 (100.0%) |
| 25 to 34 Years | 368 (100.0%) | 390 (94.9%) |
| 35 to 44 Years | 378 (92.0%) | 193 (77.2%) |
| 45 to 54 Years | 99 (100.0%) | 99 (100.0%) |
| 55 to 64 Years | 57 (72.2%) | 183 (91.5%) |
| 65 to 74 Years | 162 (100.0%) | 166 (89.7%) |
| 75 Years and over | 71 (98.6%) | 102 (92.7%) |
| Total | 1,923 (94.5%) | 1,697 (93.1%) |
Income Below Poverty Among Married-Couple Families in Ball
The poverty statistics for married-couple families in Ball show that 1.1% or 7 of the total 632 families live below the poverty line. Families with 1 or 2 children have the highest poverty rate of 3.0%, comprising of 7 families. On the other hand, families with no children have the lowest poverty rate of 0.0%, which includes 0 families.
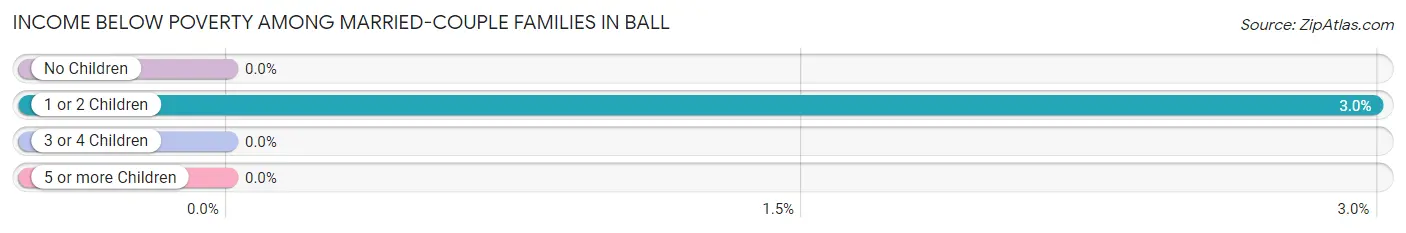
| Children | Above Poverty | Below Poverty |
| No Children | 263 (100.0%) | 0 (0.0%) |
| 1 or 2 Children | 227 (97.0%) | 7 (3.0%) |
| 3 or 4 Children | 135 (100.0%) | 0 (0.0%) |
| 5 or more Children | 0 (0.0%) | 0 (0.0%) |
| Total | 625 (98.9%) | 7 (1.1%) |
Income Below Poverty Among Single-Parent Households in Ball
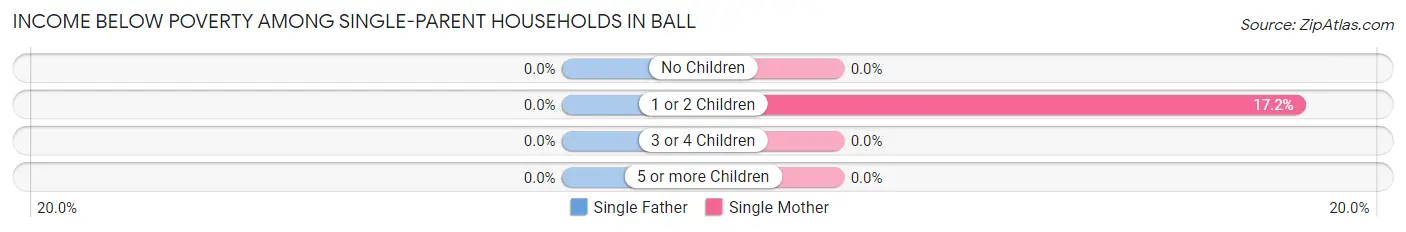
| Children | Single Father | Single Mother |
| No Children | 0 (0.0%) | 0 (0.0%) |
| 1 or 2 Children | 0 (0.0%) | 16 (17.2%) |
| 3 or 4 Children | 0 (0.0%) | 0 (0.0%) |
| 5 or more Children | 0 (0.0%) | 0 (0.0%) |
| Total | 0 (0.0%) | 16 (8.0%) |
Income Below Poverty Among Married-Couple vs Single-Parent Households in Ball
The poverty data for Ball shows that 7 of the married-couple family households (1.1%) and 16 of the single-parent households (6.8%) are living below the poverty level. Within the married-couple family households, those with 1 or 2 children have the highest poverty rate, with 7 households (3.0%) falling below the poverty line. Among the single-parent households, those with 1 or 2 children have the highest poverty rate, with 16 household (12.2%) living below poverty.
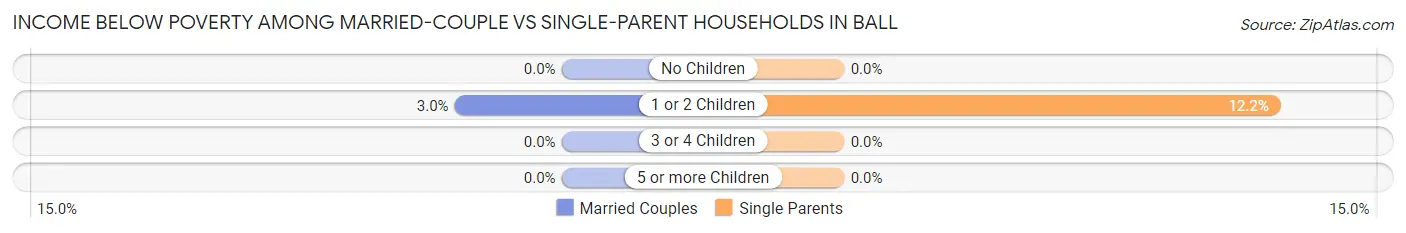
| Children | Married-Couple Families | Single-Parent Households |
| No Children | 0 (0.0%) | 0 (0.0%) |
| 1 or 2 Children | 7 (3.0%) | 16 (12.2%) |
| 3 or 4 Children | 0 (0.0%) | 0 (0.0%) |
| 5 or more Children | 0 (0.0%) | 0 (0.0%) |
| Total | 7 (1.1%) | 16 (6.8%) |
Employment Characteristics in Ball
Employment by Class of Employer in Ball
Among the 1,692 employed individuals in Ball, private company employees (763 | 45.1%), state government employees (400 | 23.6%), and local government employees (171 | 10.1%) make up the most common classes of employment.
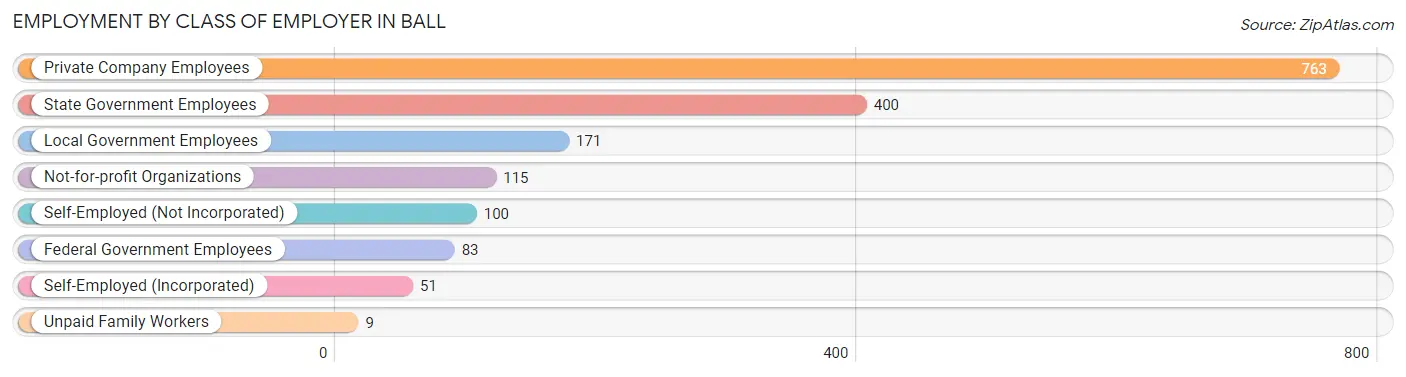
| Employer Class | # Employees | % Employees |
| Private Company Employees | 763 | 45.1% |
| Self-Employed (Incorporated) | 51 | 3.0% |
| Self-Employed (Not Incorporated) | 100 | 5.9% |
| Not-for-profit Organizations | 115 | 6.8% |
| Local Government Employees | 171 | 10.1% |
| State Government Employees | 400 | 23.6% |
| Federal Government Employees | 83 | 4.9% |
| Unpaid Family Workers | 9 | 0.5% |
| Total | 1,692 | 100.0% |
Employment Status by Age in Ball
According to the labor force statistics for Ball, out of the total population over 16 years of age (3,013), 68.3% or 2,058 individuals are in the labor force, with 5.8% or 119 of them unemployed. The age group with the highest labor force participation rate is 25 to 29 years, with 89.6% or 407 individuals in the labor force. Within the labor force, the 25 to 29 years age range has the highest percentage of unemployed individuals, with 27.7% or 113 of them being unemployed.
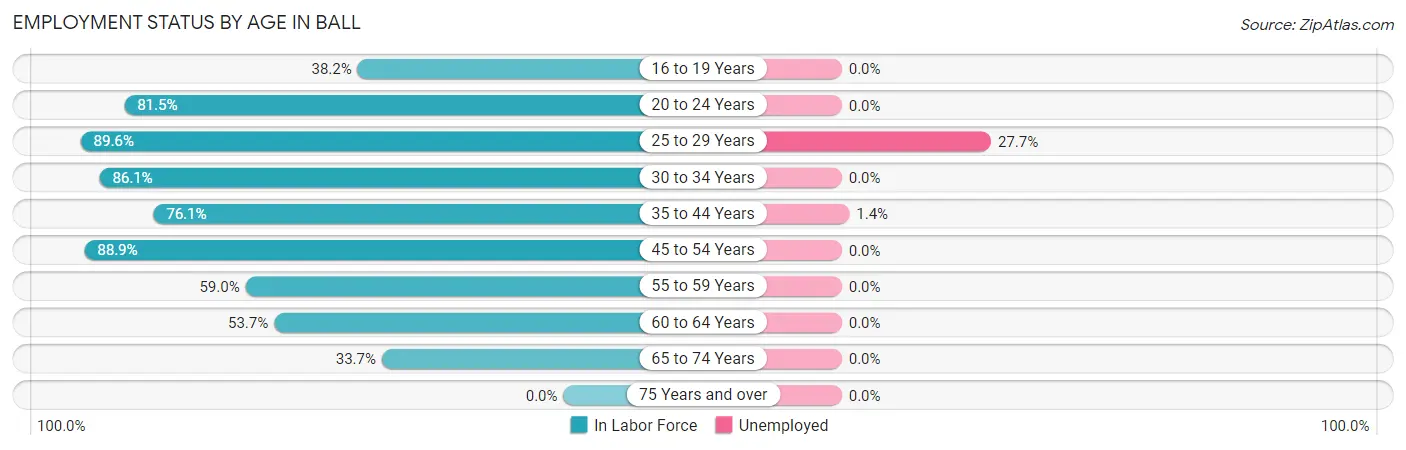
| Age Bracket | In Labor Force | Unemployed |
| 16 to 19 Years | 39 (38.2%) | 0 (0.0%) |
| 20 to 24 Years | 361 (81.5%) | 0 (0.0%) |
| 25 to 29 Years | 407 (89.6%) | 113 (27.7%) |
| 30 to 34 Years | 292 (86.1%) | 0 (0.0%) |
| 35 to 44 Years | 509 (76.1%) | 7 (1.4%) |
| 45 to 54 Years | 176 (88.9%) | 0 (0.0%) |
| 55 to 59 Years | 92 (59.0%) | 0 (0.0%) |
| 60 to 64 Years | 66 (53.7%) | 0 (0.0%) |
| 65 to 74 Years | 117 (33.7%) | 0 (0.0%) |
| 75 Years and over | 0 (0.0%) | 0 (0.0%) |
| Total | 2,058 (68.3%) | 119 (5.8%) |
Employment Status by Educational Attainment in Ball
According to labor force statistics for Ball, 79.5% of individuals (1,542) out of the total population between 25 and 64 years of age (1,939) are in the labor force, with 7.6% or 117 of them being unemployed. The group with the highest labor force participation rate are those with the educational attainment of bachelor's degree or higher, with 90.4% or 443 individuals in the labor force. Within the labor force, individuals with high school diploma education have the highest percentage of unemployment, with 20.0% or 117 of them being unemployed.
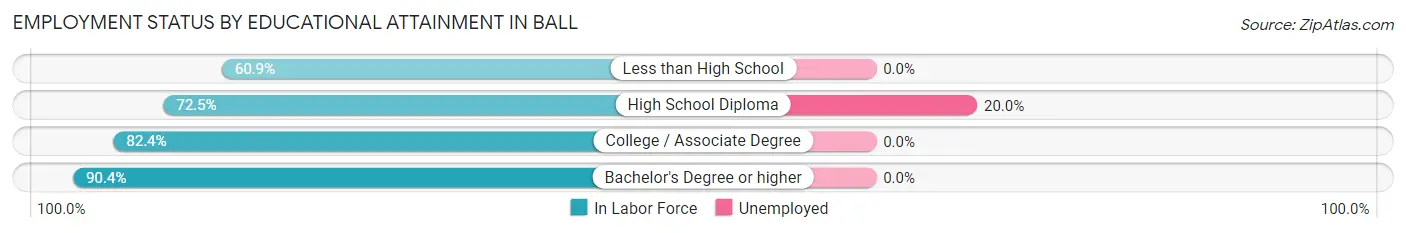
| Educational Attainment | In Labor Force | Unemployed |
| Less than High School | 42 (60.9%) | 0 (0.0%) |
| High School Diploma | 584 (72.5%) | 161 (20.0%) |
| College / Associate Degree | 473 (82.4%) | 0 (0.0%) |
| Bachelor's Degree or higher | 443 (90.4%) | 0 (0.0%) |
| Total | 1,542 (79.5%) | 147 (7.6%) |
Employment Occupations by Sex in Ball
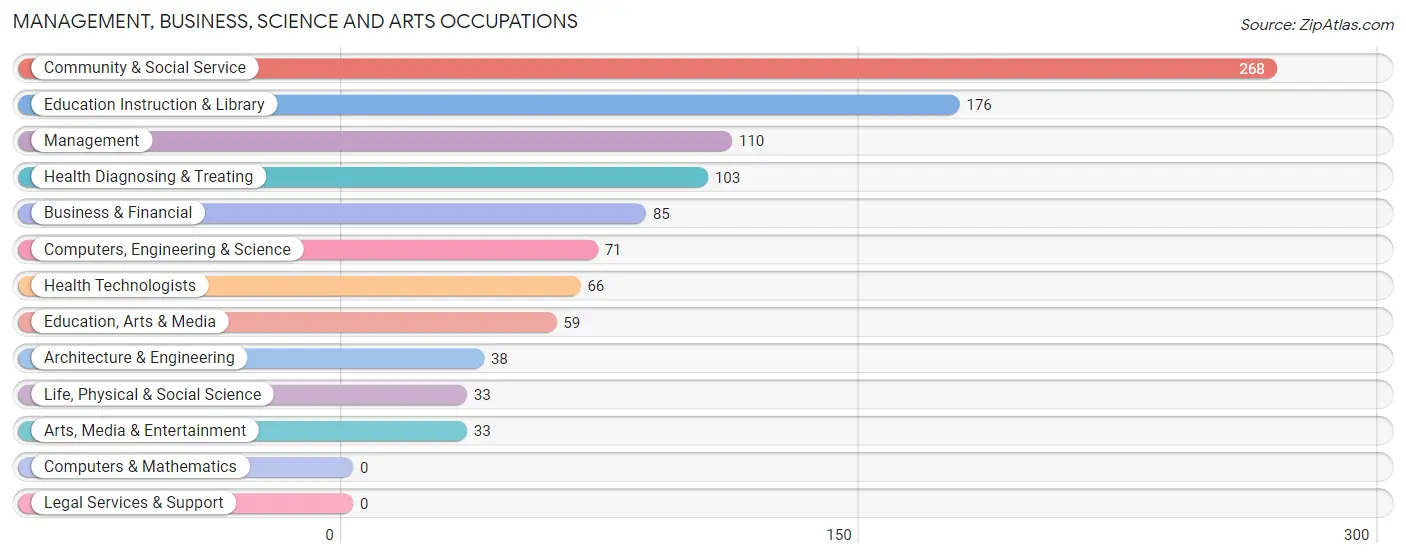
Management, Business, Science and Arts Occupations
The most common Management, Business, Science and Arts occupations in Ball are Community & Social Service (268 | 14.3%), Education Instruction & Library (176 | 9.4%), Management (110 | 5.9%), Health Diagnosing & Treating (103 | 5.5%), and Business & Financial (85 | 4.5%).
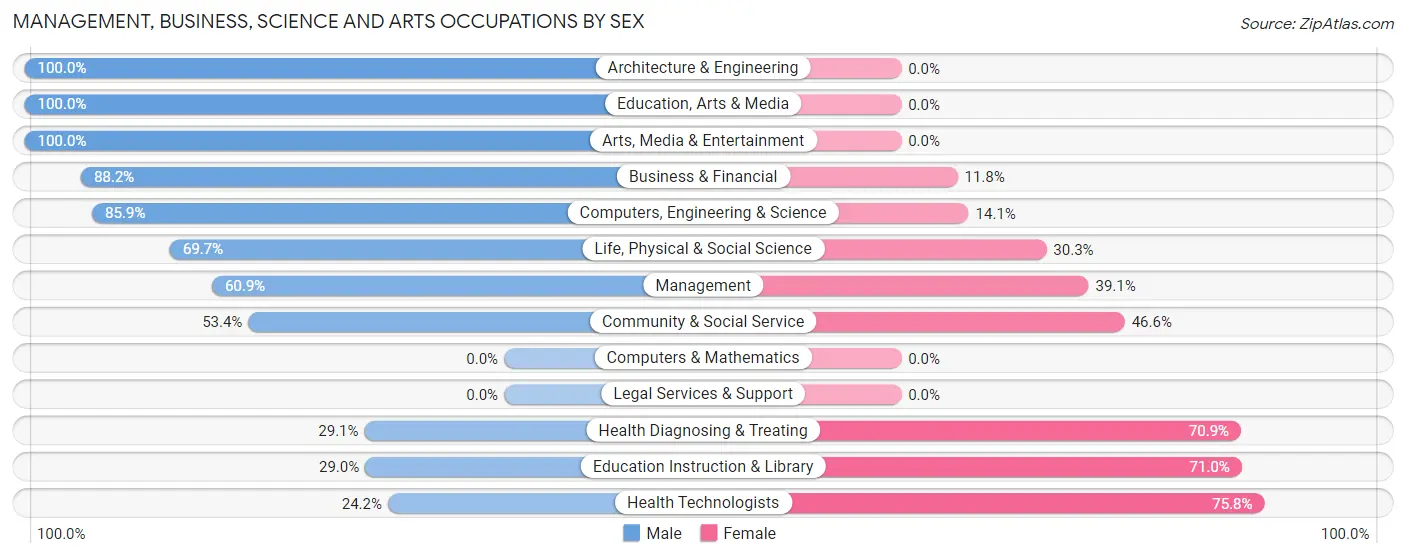
Management, Business, Science and Arts Occupations by Sex
Within the Management, Business, Science and Arts occupations in Ball, the most male-oriented occupations are Architecture & Engineering (100.0%), Education, Arts & Media (100.0%), and Arts, Media & Entertainment (100.0%), while the most female-oriented occupations are Health Technologists (75.8%), Education Instruction & Library (71.0%), and Health Diagnosing & Treating (70.9%).
| Occupation | Male | Female |
| Management | 67 (60.9%) | 43 (39.1%) |
| Business & Financial | 75 (88.2%) | 10 (11.8%) |
| Computers, Engineering & Science | 61 (85.9%) | 10 (14.1%) |
| Computers & Mathematics | 0 (0.0%) | 0 (0.0%) |
| Architecture & Engineering | 38 (100.0%) | 0 (0.0%) |
| Life, Physical & Social Science | 23 (69.7%) | 10 (30.3%) |
| Community & Social Service | 143 (53.4%) | 125 (46.6%) |
| Education, Arts & Media | 59 (100.0%) | 0 (0.0%) |
| Legal Services & Support | 0 (0.0%) | 0 (0.0%) |
| Education Instruction & Library | 51 (29.0%) | 125 (71.0%) |
| Arts, Media & Entertainment | 33 (100.0%) | 0 (0.0%) |
| Health Diagnosing & Treating | 30 (29.1%) | 73 (70.9%) |
| Health Technologists | 16 (24.2%) | 50 (75.8%) |
| Total (Category) | 376 (59.0%) | 261 (41.0%) |
| Total (Overall) | 938 (50.1%) | 935 (49.9%) |
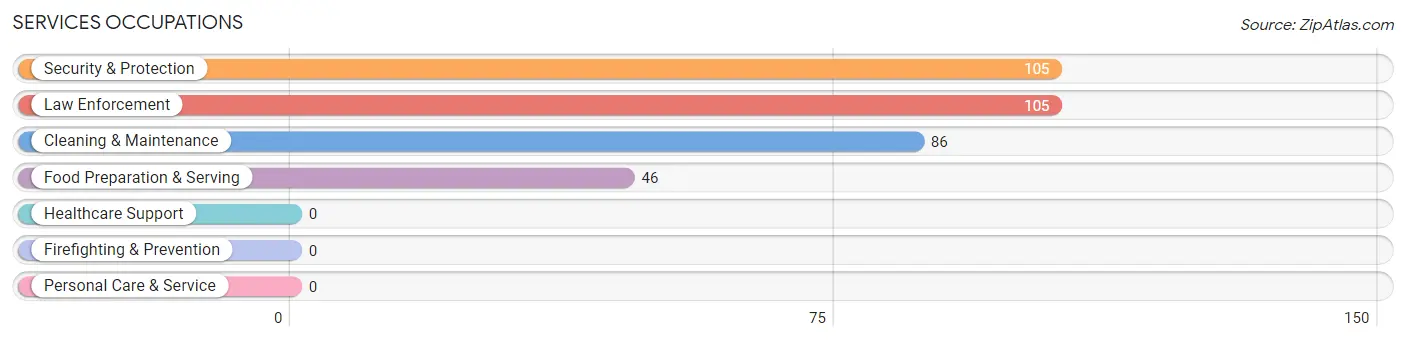
Services Occupations
The most common Services occupations in Ball are Security & Protection (105 | 5.6%), Law Enforcement (105 | 5.6%), Cleaning & Maintenance (86 | 4.6%), and Food Preparation & Serving (46 | 2.5%).
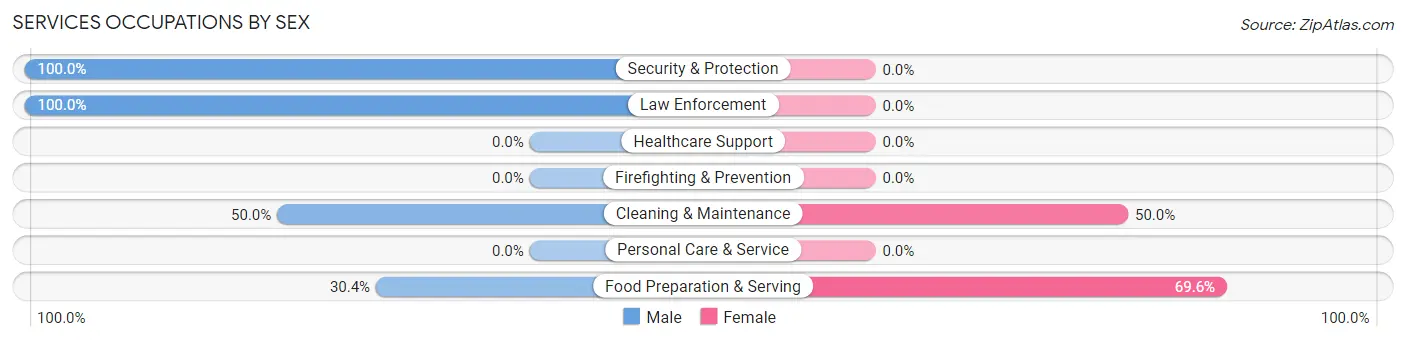
Services Occupations by Sex
Within the Services occupations in Ball, the most male-oriented occupations are Security & Protection (100.0%), Law Enforcement (100.0%), and Cleaning & Maintenance (50.0%), while the most female-oriented occupations are Food Preparation & Serving (69.6%), and Cleaning & Maintenance (50.0%).
| Occupation | Male | Female |
| Healthcare Support | 0 (0.0%) | 0 (0.0%) |
| Security & Protection | 105 (100.0%) | 0 (0.0%) |
| Firefighting & Prevention | 0 (0.0%) | 0 (0.0%) |
| Law Enforcement | 105 (100.0%) | 0 (0.0%) |
| Food Preparation & Serving | 14 (30.4%) | 32 (69.6%) |
| Cleaning & Maintenance | 43 (50.0%) | 43 (50.0%) |
| Personal Care & Service | 0 (0.0%) | 0 (0.0%) |
| Total (Category) | 162 (68.3%) | 75 (31.7%) |
| Total (Overall) | 938 (50.1%) | 935 (49.9%) |
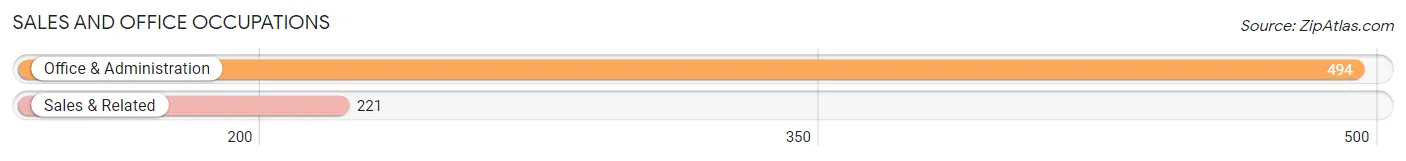
Sales and Office Occupations
The most common Sales and Office occupations in Ball are Office & Administration (494 | 26.4%), and Sales & Related (221 | 11.8%).
Sales and Office Occupations by Sex
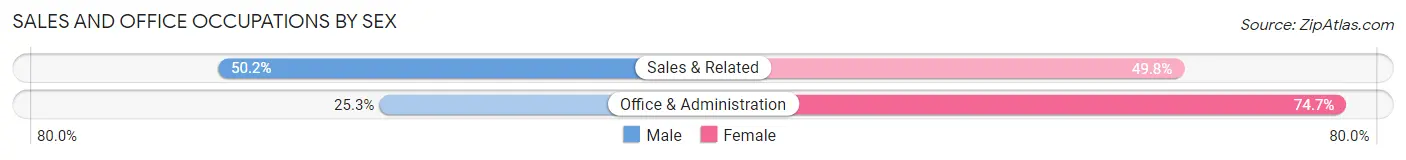
| Occupation | Male | Female |
| Sales & Related | 111 (50.2%) | 110 (49.8%) |
| Office & Administration | 125 (25.3%) | 369 (74.7%) |
| Total (Category) | 236 (33.0%) | 479 (67.0%) |
| Total (Overall) | 938 (50.1%) | 935 (49.9%) |
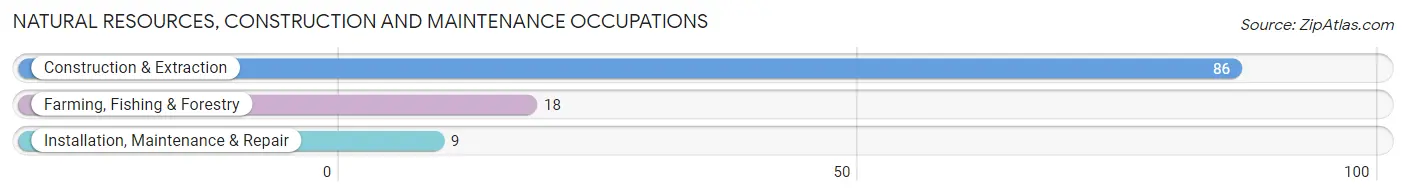
Natural Resources, Construction and Maintenance Occupations
The most common Natural Resources, Construction and Maintenance occupations in Ball are Construction & Extraction (86 | 4.6%), Farming, Fishing & Forestry (18 | 1.0%), and Installation, Maintenance & Repair (9 | 0.5%).
Natural Resources, Construction and Maintenance Occupations by Sex
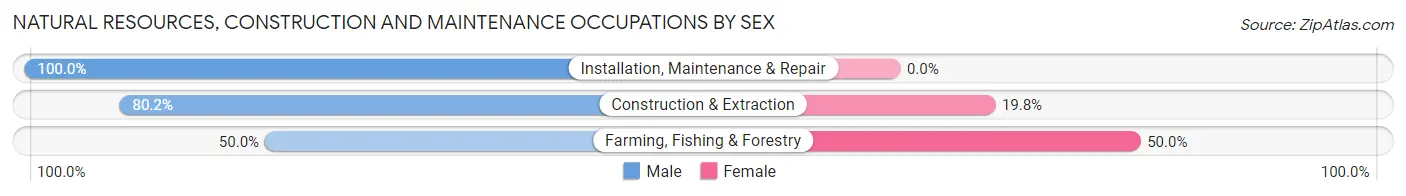
| Occupation | Male | Female |
| Farming, Fishing & Forestry | 9 (50.0%) | 9 (50.0%) |
| Construction & Extraction | 69 (80.2%) | 17 (19.8%) |
| Installation, Maintenance & Repair | 9 (100.0%) | 0 (0.0%) |
| Total (Category) | 87 (77.0%) | 26 (23.0%) |
| Total (Overall) | 938 (50.1%) | 935 (49.9%) |
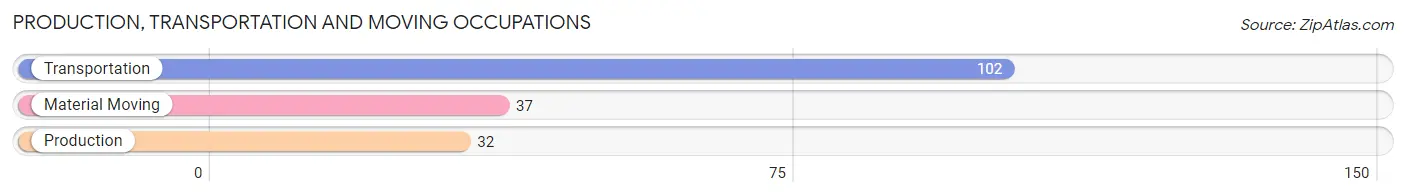
Production, Transportation and Moving Occupations
The most common Production, Transportation and Moving occupations in Ball are Transportation (102 | 5.4%), Material Moving (37 | 2.0%), and Production (32 | 1.7%).
Production, Transportation and Moving Occupations by Sex
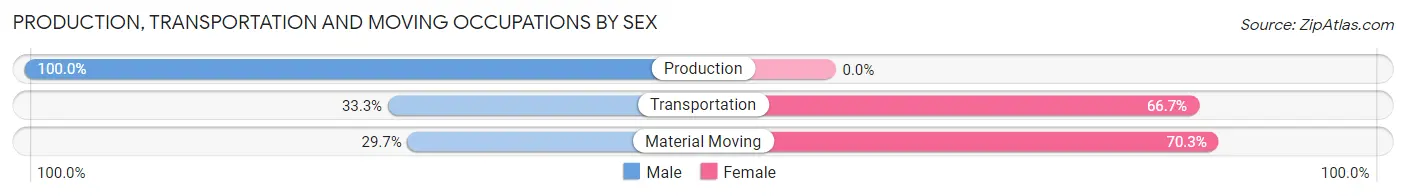
| Occupation | Male | Female |
| Production | 32 (100.0%) | 0 (0.0%) |
| Transportation | 34 (33.3%) | 68 (66.7%) |
| Material Moving | 11 (29.7%) | 26 (70.3%) |
| Total (Category) | 77 (45.0%) | 94 (55.0%) |
| Total (Overall) | 938 (50.1%) | 935 (49.9%) |
Employment Industries by Sex in Ball
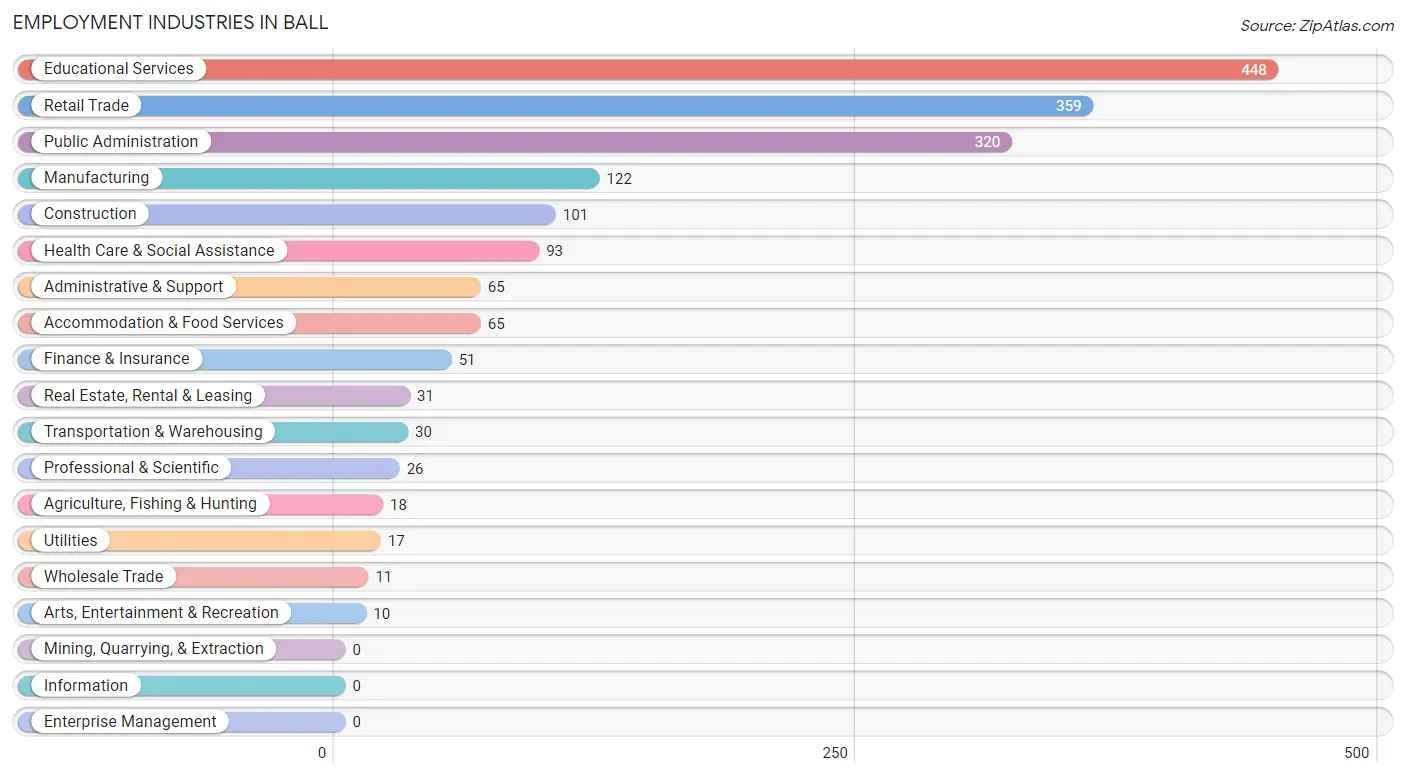
Employment Industries in Ball
The major employment industries in Ball include Educational Services (448 | 23.9%), Retail Trade (359 | 19.2%), Public Administration (320 | 17.1%), Manufacturing (122 | 6.5%), and Construction (101 | 5.4%).
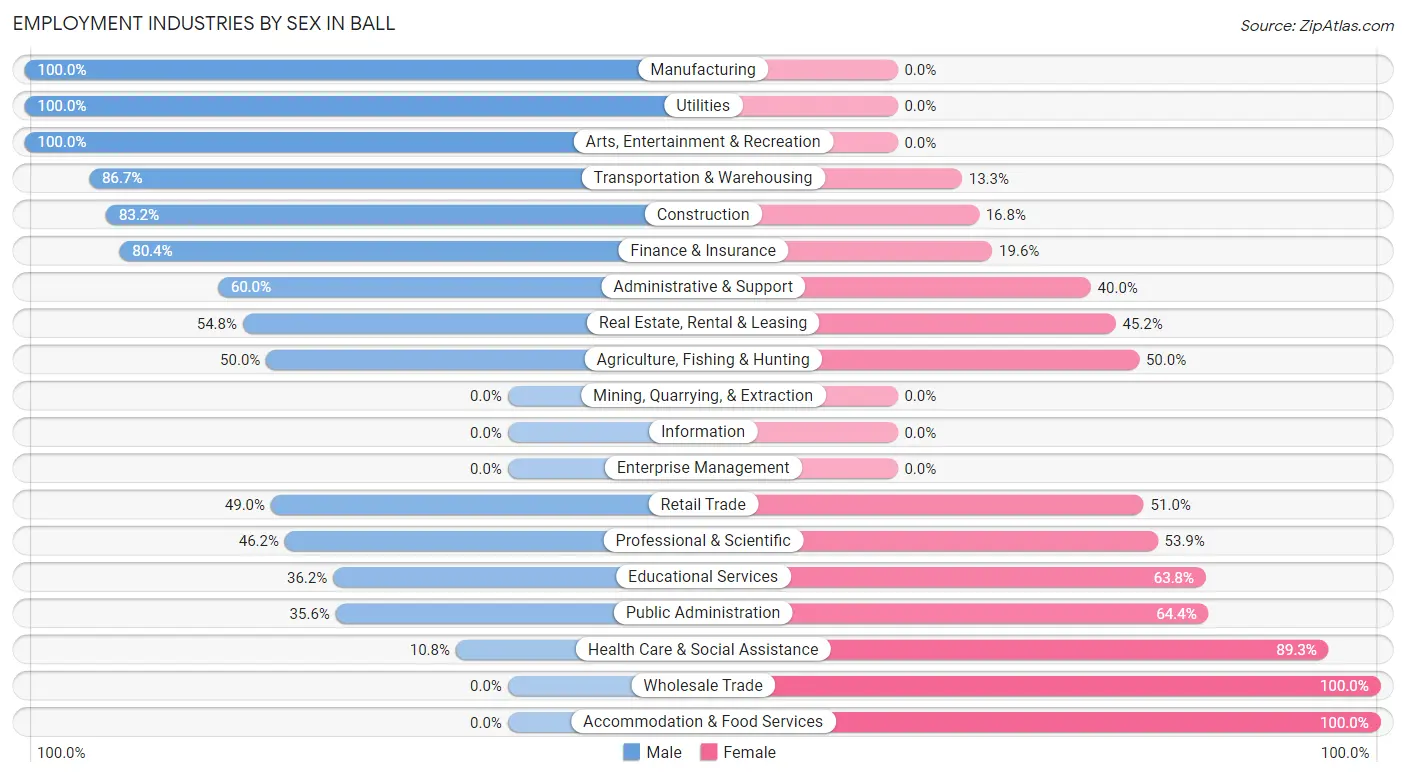
Employment Industries by Sex in Ball
The Ball industries that see more men than women are Manufacturing (100.0%), Utilities (100.0%), and Arts, Entertainment & Recreation (100.0%), whereas the industries that tend to have a higher number of women are Wholesale Trade (100.0%), Accommodation & Food Services (100.0%), and Health Care & Social Assistance (89.2%).
| Industry | Male | Female |
| Agriculture, Fishing & Hunting | 9 (50.0%) | 9 (50.0%) |
| Mining, Quarrying, & Extraction | 0 (0.0%) | 0 (0.0%) |
| Construction | 84 (83.2%) | 17 (16.8%) |
| Manufacturing | 122 (100.0%) | 0 (0.0%) |
| Wholesale Trade | 0 (0.0%) | 11 (100.0%) |
| Retail Trade | 176 (49.0%) | 183 (51.0%) |
| Transportation & Warehousing | 26 (86.7%) | 4 (13.3%) |
| Utilities | 17 (100.0%) | 0 (0.0%) |
| Information | 0 (0.0%) | 0 (0.0%) |
| Finance & Insurance | 41 (80.4%) | 10 (19.6%) |
| Real Estate, Rental & Leasing | 17 (54.8%) | 14 (45.2%) |
| Professional & Scientific | 12 (46.2%) | 14 (53.8%) |
| Enterprise Management | 0 (0.0%) | 0 (0.0%) |
| Administrative & Support | 39 (60.0%) | 26 (40.0%) |
| Educational Services | 162 (36.2%) | 286 (63.8%) |
| Health Care & Social Assistance | 10 (10.7%) | 83 (89.2%) |
| Arts, Entertainment & Recreation | 10 (100.0%) | 0 (0.0%) |
| Accommodation & Food Services | 0 (0.0%) | 65 (100.0%) |
| Public Administration | 114 (35.6%) | 206 (64.4%) |
| Total | 938 (50.1%) | 935 (49.9%) |
Education in Ball
School Enrollment in Ball
The most common levels of schooling among the 1,021 students in Ball are college / undergraduate (327 | 32.0%), elementary school (248 | 24.3%), and high school (231 | 22.6%).
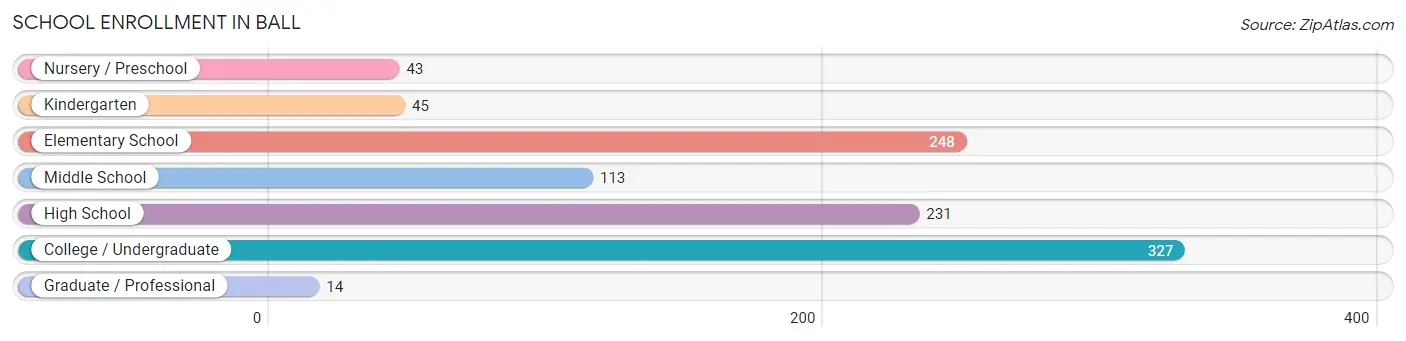
| School Level | # Students | % Students |
| Nursery / Preschool | 43 | 4.2% |
| Kindergarten | 45 | 4.4% |
| Elementary School | 248 | 24.3% |
| Middle School | 113 | 11.1% |
| High School | 231 | 22.6% |
| College / Undergraduate | 327 | 32.0% |
| Graduate / Professional | 14 | 1.4% |
| Total | 1,021 | 100.0% |
School Enrollment by Age by Funding Source in Ball
Out of a total of 1,021 students who are enrolled in schools in Ball, 32 (3.1%) attend a private institution, while the remaining 989 (96.9%) are enrolled in public schools. The age group of 15 to 17 year olds has the highest likelihood of being enrolled in private schools, with 11 (8.3% in the age bracket) enrolled. Conversely, the age group of 3 to 4 year olds has the lowest likelihood of being enrolled in a private school, with 17 (100.0% in the age bracket) attending a public institution.
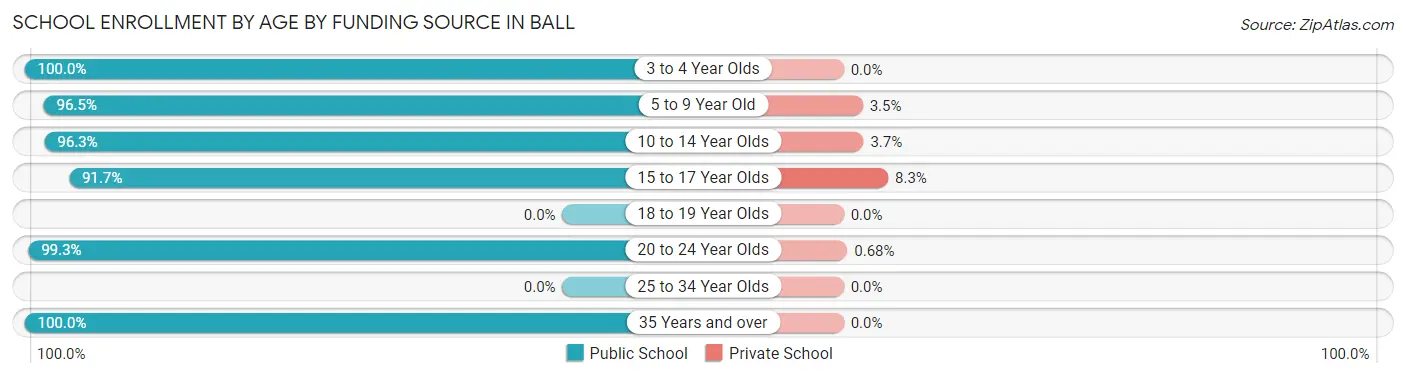
| Age Bracket | Public School | Private School |
| 3 to 4 Year Olds | 17 (100.0%) | 0 (0.0%) |
| 5 to 9 Year Old | 300 (96.5%) | 11 (3.5%) |
| 10 to 14 Year Olds | 209 (96.3%) | 8 (3.7%) |
| 15 to 17 Year Olds | 122 (91.7%) | 11 (8.3%) |
| 18 to 19 Year Olds | 0 (0.0%) | 0 (0.0%) |
| 20 to 24 Year Olds | 292 (99.3%) | 2 (0.7%) |
| 25 to 34 Year Olds | 0 (0.0%) | 0 (0.0%) |
| 35 Years and over | 49 (100.0%) | 0 (0.0%) |
| Total | 989 (96.9%) | 32 (3.1%) |
Educational Attainment by Field of Study in Ball
Science & technology (110 | 20.1%), education (110 | 20.1%), arts & humanities (94 | 17.2%), social sciences (64 | 11.7%), and liberal arts & history (63 | 11.5%) are the most common fields of study among 548 individuals in Ball who have obtained a bachelor's degree or higher.
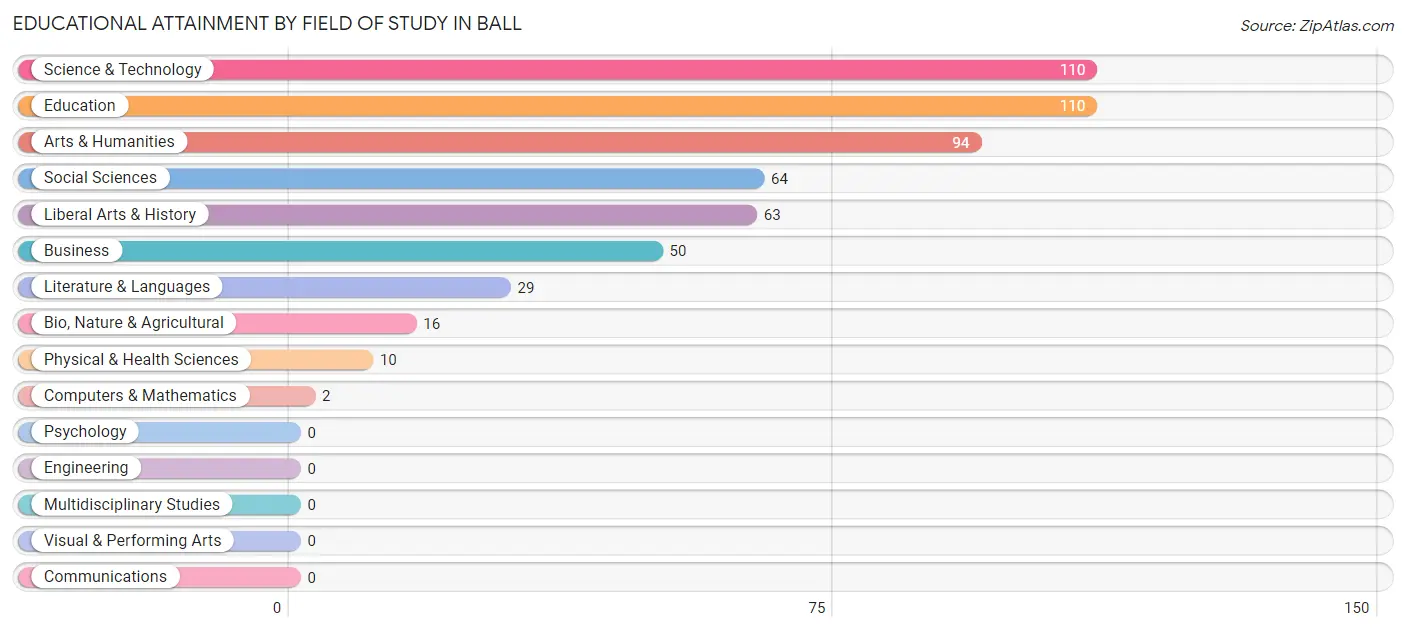
| Field of Study | # Graduates | % Graduates |
| Computers & Mathematics | 2 | 0.4% |
| Bio, Nature & Agricultural | 16 | 2.9% |
| Physical & Health Sciences | 10 | 1.8% |
| Psychology | 0 | 0.0% |
| Social Sciences | 64 | 11.7% |
| Engineering | 0 | 0.0% |
| Multidisciplinary Studies | 0 | 0.0% |
| Science & Technology | 110 | 20.1% |
| Business | 50 | 9.1% |
| Education | 110 | 20.1% |
| Literature & Languages | 29 | 5.3% |
| Liberal Arts & History | 63 | 11.5% |
| Visual & Performing Arts | 0 | 0.0% |
| Communications | 0 | 0.0% |
| Arts & Humanities | 94 | 17.2% |
| Total | 548 | 100.0% |
Transportation & Commute in Ball
Vehicle Availability by Sex in Ball
The most prevalent vehicle ownership categories in Ball are males with 2 vehicles (556, accounting for 67.0%) and females with 2 vehicles (498, making up 70.5%).
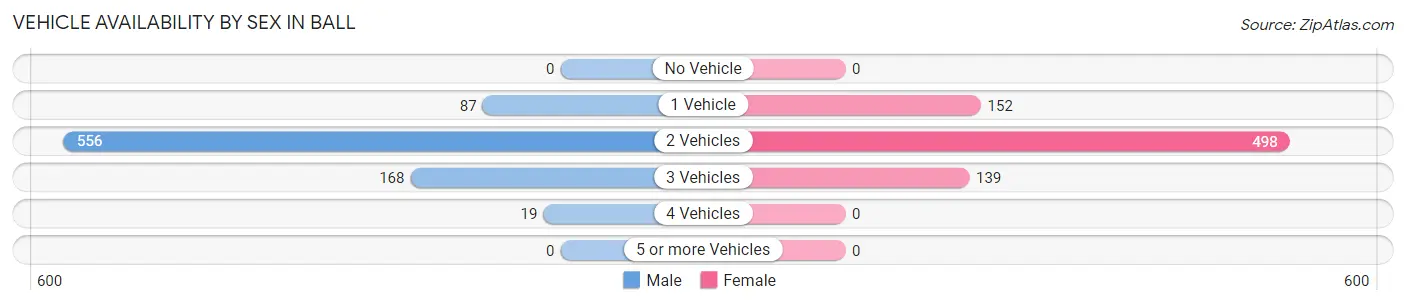
| Vehicles Available | Male | Female |
| No Vehicle | 0 (0.0%) | 0 (0.0%) |
| 1 Vehicle | 87 (10.5%) | 152 (19.3%) |
| 2 Vehicles | 556 (67.0%) | 498 (63.1%) |
| 3 Vehicles | 168 (20.2%) | 139 (17.6%) |
| 4 Vehicles | 19 (2.3%) | 0 (0.0%) |
| 5 or more Vehicles | 0 (0.0%) | 0 (0.0%) |
| Total | 830 (100.0%) | 789 (100.0%) |
Commute Time in Ball
The most frequently occuring commute durations in Ball are 10 to 14 minutes (538 commuters, 33.3%), 20 to 24 minutes (407 commuters, 25.2%), and 15 to 19 minutes (239 commuters, 14.8%).
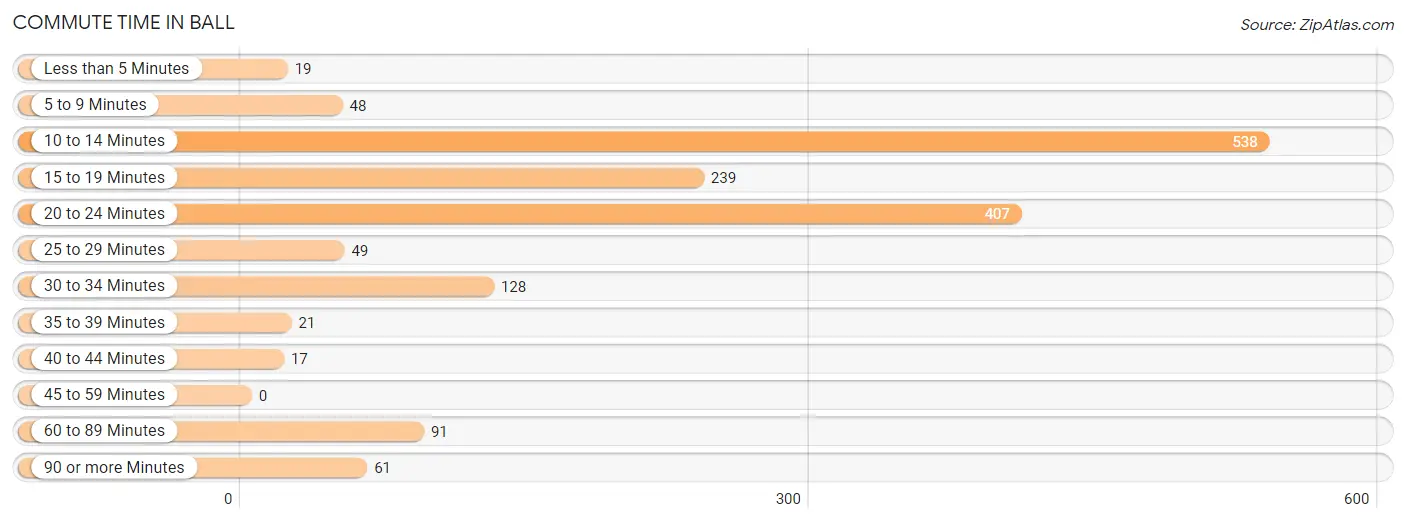
| Commute Time | # Commuters | % Commuters |
| Less than 5 Minutes | 19 | 1.2% |
| 5 to 9 Minutes | 48 | 3.0% |
| 10 to 14 Minutes | 538 | 33.3% |
| 15 to 19 Minutes | 239 | 14.8% |
| 20 to 24 Minutes | 407 | 25.2% |
| 25 to 29 Minutes | 49 | 3.0% |
| 30 to 34 Minutes | 128 | 7.9% |
| 35 to 39 Minutes | 21 | 1.3% |
| 40 to 44 Minutes | 17 | 1.1% |
| 45 to 59 Minutes | 0 | 0.0% |
| 60 to 89 Minutes | 91 | 5.6% |
| 90 or more Minutes | 61 | 3.8% |
Commute Time by Sex in Ball
The most common commute times in Ball are 10 to 14 minutes (300 commuters, 35.1%) for males and 10 to 14 minutes (238 commuters, 31.1%) for females.
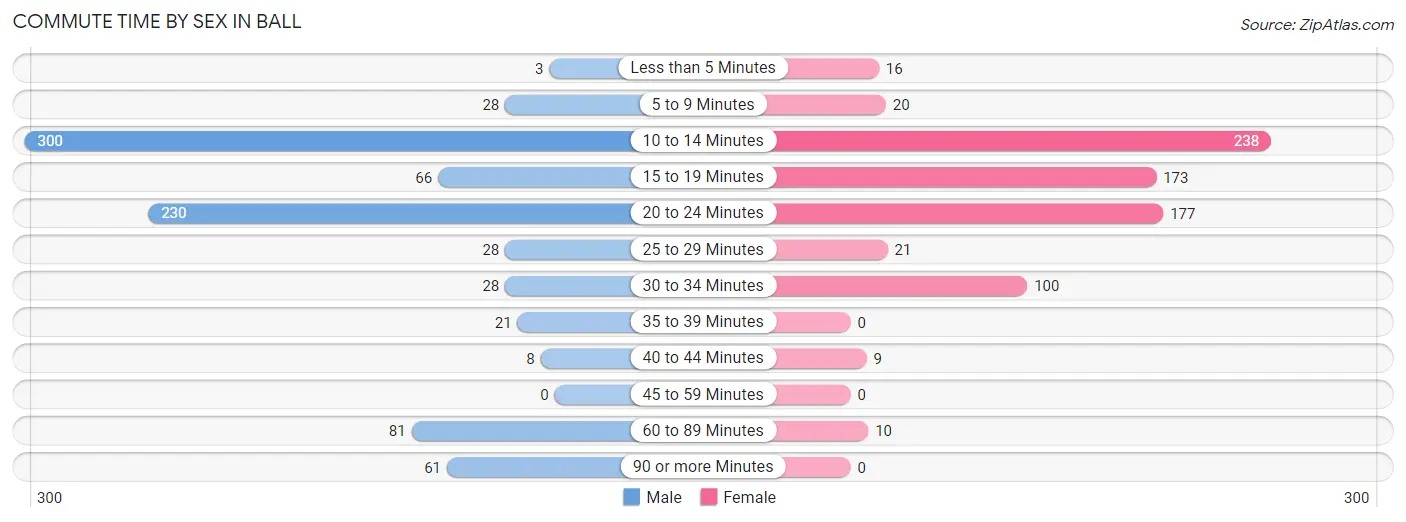
| Commute Time | Male | Female |
| Less than 5 Minutes | 3 (0.4%) | 16 (2.1%) |
| 5 to 9 Minutes | 28 (3.3%) | 20 (2.6%) |
| 10 to 14 Minutes | 300 (35.1%) | 238 (31.1%) |
| 15 to 19 Minutes | 66 (7.7%) | 173 (22.6%) |
| 20 to 24 Minutes | 230 (26.9%) | 177 (23.2%) |
| 25 to 29 Minutes | 28 (3.3%) | 21 (2.8%) |
| 30 to 34 Minutes | 28 (3.3%) | 100 (13.1%) |
| 35 to 39 Minutes | 21 (2.5%) | 0 (0.0%) |
| 40 to 44 Minutes | 8 (0.9%) | 9 (1.2%) |
| 45 to 59 Minutes | 0 (0.0%) | 0 (0.0%) |
| 60 to 89 Minutes | 81 (9.5%) | 10 (1.3%) |
| 90 or more Minutes | 61 (7.1%) | 0 (0.0%) |
Time of Departure to Work by Sex in Ball
The most frequent times of departure to work in Ball are 12:00 PM to 3:59 PM (141, 16.5%) for males and 7:30 AM to 7:59 AM (229, 30.0%) for females.
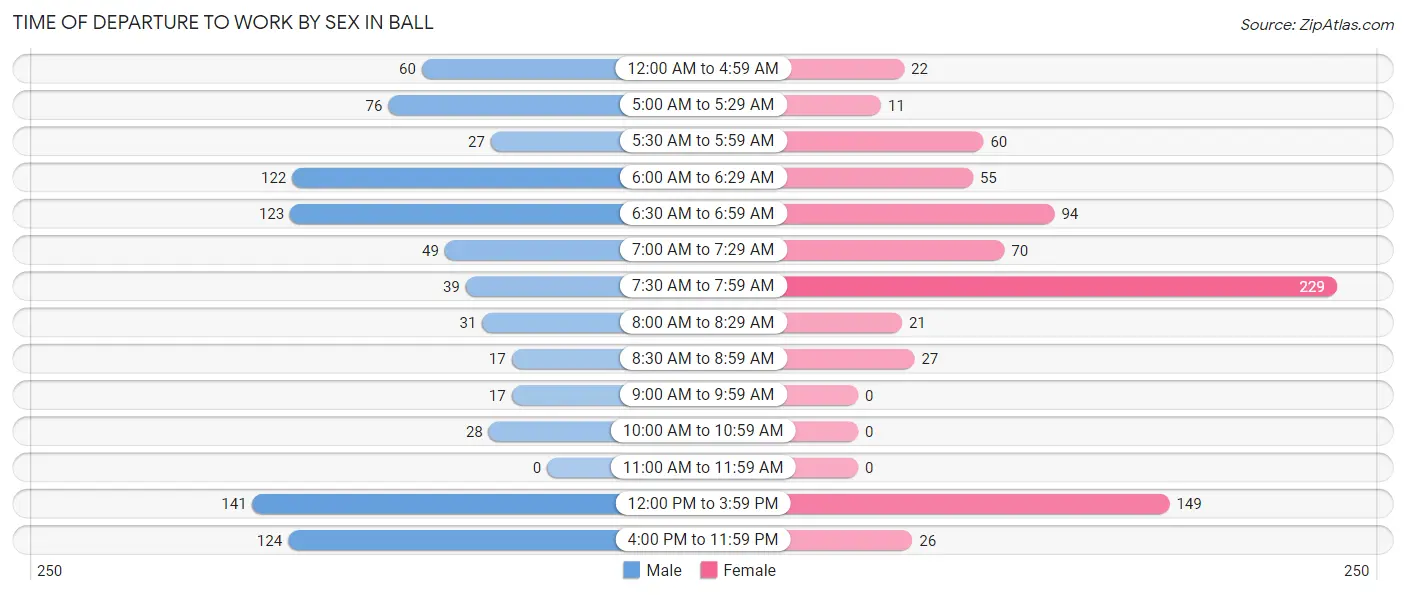
| Time of Departure | Male | Female |
| 12:00 AM to 4:59 AM | 60 (7.0%) | 22 (2.9%) |
| 5:00 AM to 5:29 AM | 76 (8.9%) | 11 (1.4%) |
| 5:30 AM to 5:59 AM | 27 (3.2%) | 60 (7.9%) |
| 6:00 AM to 6:29 AM | 122 (14.3%) | 55 (7.2%) |
| 6:30 AM to 6:59 AM | 123 (14.4%) | 94 (12.3%) |
| 7:00 AM to 7:29 AM | 49 (5.7%) | 70 (9.2%) |
| 7:30 AM to 7:59 AM | 39 (4.6%) | 229 (30.0%) |
| 8:00 AM to 8:29 AM | 31 (3.6%) | 21 (2.8%) |
| 8:30 AM to 8:59 AM | 17 (2.0%) | 27 (3.5%) |
| 9:00 AM to 9:59 AM | 17 (2.0%) | 0 (0.0%) |
| 10:00 AM to 10:59 AM | 28 (3.3%) | 0 (0.0%) |
| 11:00 AM to 11:59 AM | 0 (0.0%) | 0 (0.0%) |
| 12:00 PM to 3:59 PM | 141 (16.5%) | 149 (19.5%) |
| 4:00 PM to 11:59 PM | 124 (14.5%) | 26 (3.4%) |
| Total | 854 (100.0%) | 764 (100.0%) |
Housing Occupancy in Ball
Occupancy by Ownership in Ball
Of the total 1,329 dwellings in Ball, owner-occupied units account for 1,098 (82.6%), while renter-occupied units make up 231 (17.4%).
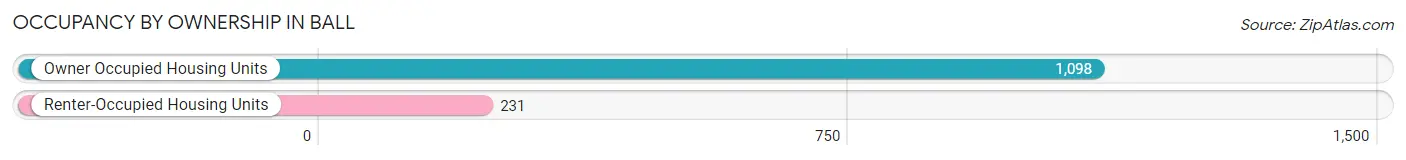
| Occupancy | # Housing Units | % Housing Units |
| Owner Occupied Housing Units | 1,098 | 82.6% |
| Renter-Occupied Housing Units | 231 | 17.4% |
| Total Occupied Housing Units | 1,329 | 100.0% |
Occupancy by Household Size in Ball
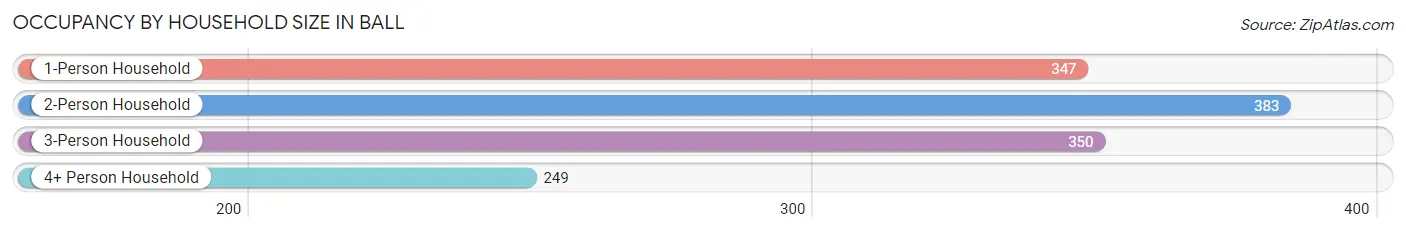
| Household Size | # Housing Units | % Housing Units |
| 1-Person Household | 347 | 26.1% |
| 2-Person Household | 383 | 28.8% |
| 3-Person Household | 350 | 26.3% |
| 4+ Person Household | 249 | 18.7% |
| Total Housing Units | 1,329 | 100.0% |
Occupancy by Ownership by Household Size in Ball
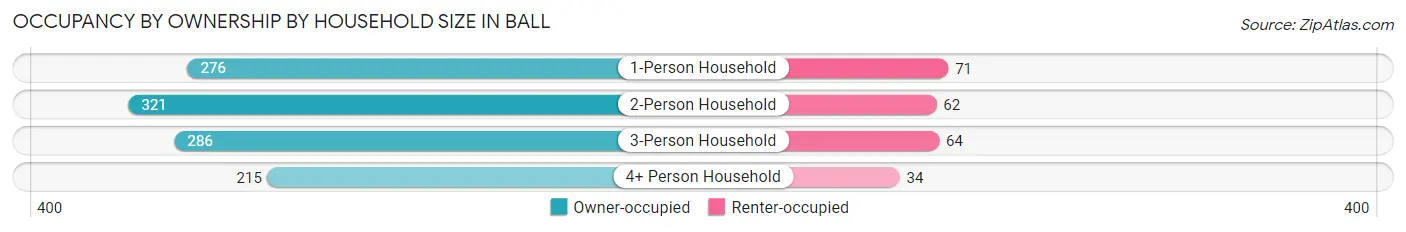
| Household Size | Owner-occupied | Renter-occupied |
| 1-Person Household | 276 (79.5%) | 71 (20.5%) |
| 2-Person Household | 321 (83.8%) | 62 (16.2%) |
| 3-Person Household | 286 (81.7%) | 64 (18.3%) |
| 4+ Person Household | 215 (86.4%) | 34 (13.7%) |
| Total Housing Units | 1,098 (82.6%) | 231 (17.4%) |
Occupancy by Educational Attainment in Ball
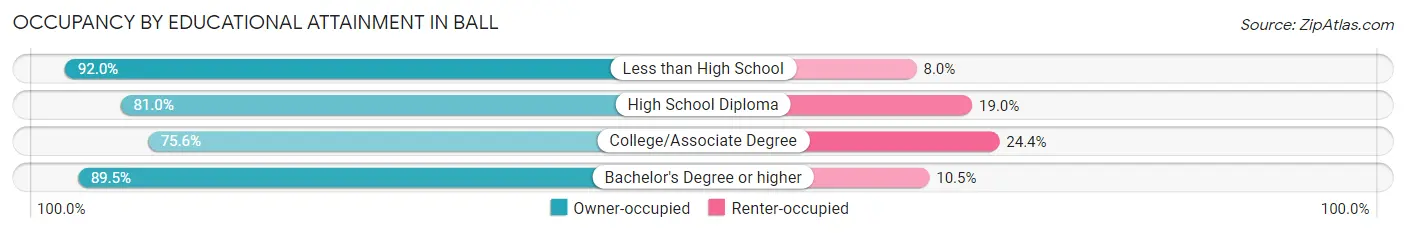
| Household Size | Owner-occupied | Renter-occupied |
| Less than High School | 69 (92.0%) | 6 (8.0%) |
| High School Diploma | 545 (81.0%) | 128 (19.0%) |
| College/Associate Degree | 195 (75.6%) | 63 (24.4%) |
| Bachelor's Degree or higher | 289 (89.5%) | 34 (10.5%) |
Occupancy by Age of Householder in Ball
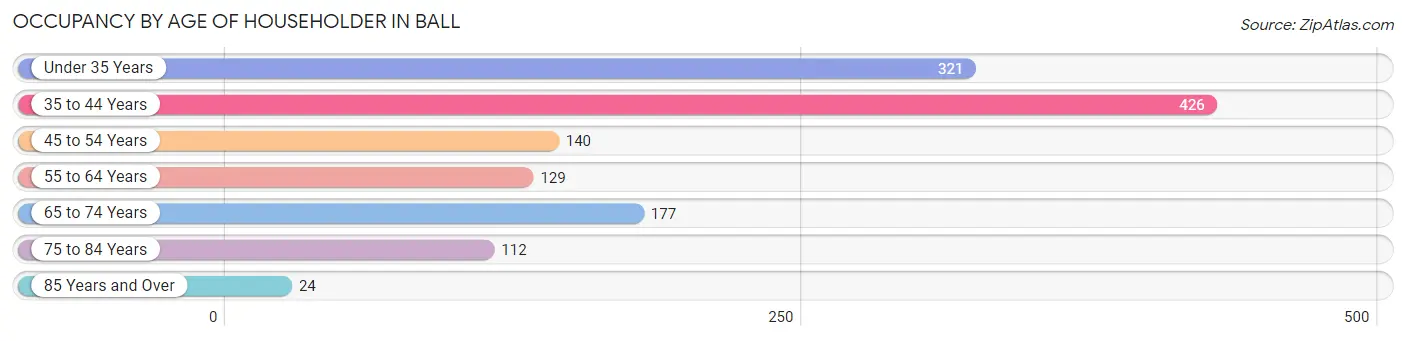
| Age Bracket | # Households | % Households |
| Under 35 Years | 321 | 24.1% |
| 35 to 44 Years | 426 | 32.1% |
| 45 to 54 Years | 140 | 10.5% |
| 55 to 64 Years | 129 | 9.7% |
| 65 to 74 Years | 177 | 13.3% |
| 75 to 84 Years | 112 | 8.4% |
| 85 Years and Over | 24 | 1.8% |
| Total | 1,329 | 100.0% |
Housing Finances in Ball
Median Income by Occupancy in Ball
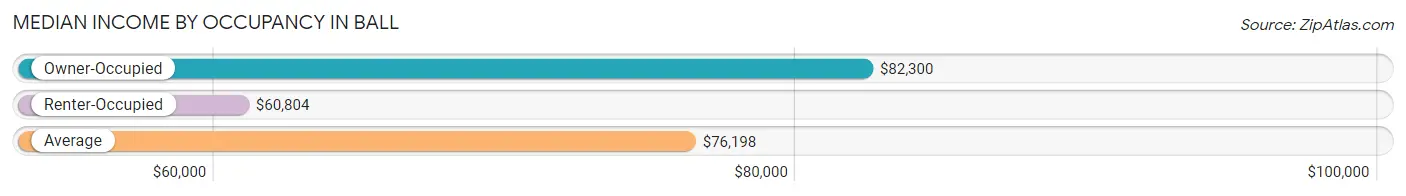
| Occupancy Type | # Households | Median Income |
| Owner-Occupied | 1,098 (82.6%) | $82,300 |
| Renter-Occupied | 231 (17.4%) | $60,804 |
| Average | 1,329 (100.0%) | $76,198 |
Occupancy by Householder Income Bracket in Ball
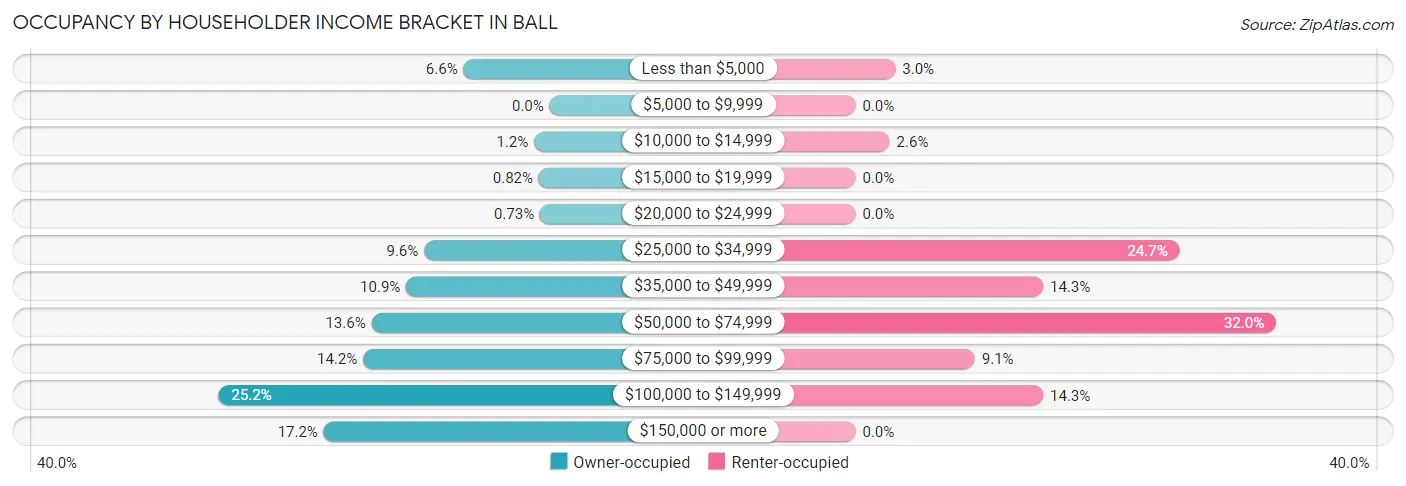
| Income Bracket | Owner-occupied | Renter-occupied |
| Less than $5,000 | 72 (6.6%) | 7 (3.0%) |
| $5,000 to $9,999 | 0 (0.0%) | 0 (0.0%) |
| $10,000 to $14,999 | 13 (1.2%) | 6 (2.6%) |
| $15,000 to $19,999 | 9 (0.8%) | 0 (0.0%) |
| $20,000 to $24,999 | 8 (0.7%) | 0 (0.0%) |
| $25,000 to $34,999 | 105 (9.6%) | 57 (24.7%) |
| $35,000 to $49,999 | 120 (10.9%) | 33 (14.3%) |
| $50,000 to $74,999 | 149 (13.6%) | 74 (32.0%) |
| $75,000 to $99,999 | 156 (14.2%) | 21 (9.1%) |
| $100,000 to $149,999 | 277 (25.2%) | 33 (14.3%) |
| $150,000 or more | 189 (17.2%) | 0 (0.0%) |
| Total | 1,098 (100.0%) | 231 (100.0%) |
Monthly Housing Cost Tiers in Ball
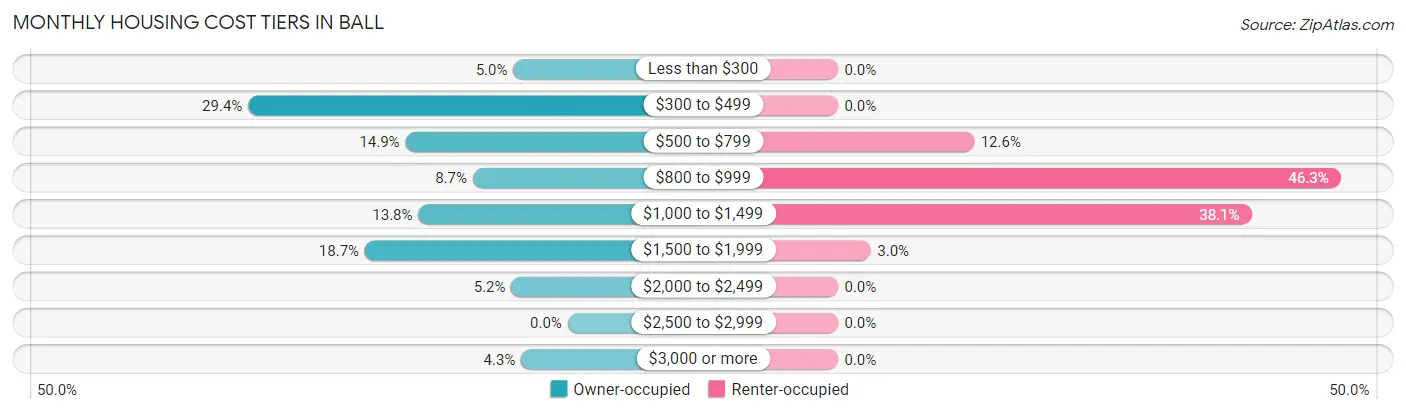
| Monthly Cost | Owner-occupied | Renter-occupied |
| Less than $300 | 55 (5.0%) | 0 (0.0%) |
| $300 to $499 | 323 (29.4%) | 0 (0.0%) |
| $500 to $799 | 164 (14.9%) | 29 (12.6%) |
| $800 to $999 | 96 (8.7%) | 107 (46.3%) |
| $1,000 to $1,499 | 151 (13.8%) | 88 (38.1%) |
| $1,500 to $1,999 | 205 (18.7%) | 7 (3.0%) |
| $2,000 to $2,499 | 57 (5.2%) | 0 (0.0%) |
| $2,500 to $2,999 | 0 (0.0%) | 0 (0.0%) |
| $3,000 or more | 47 (4.3%) | 0 (0.0%) |
| Total | 1,098 (100.0%) | 231 (100.0%) |
Physical Housing Characteristics in Ball
Housing Structures in Ball
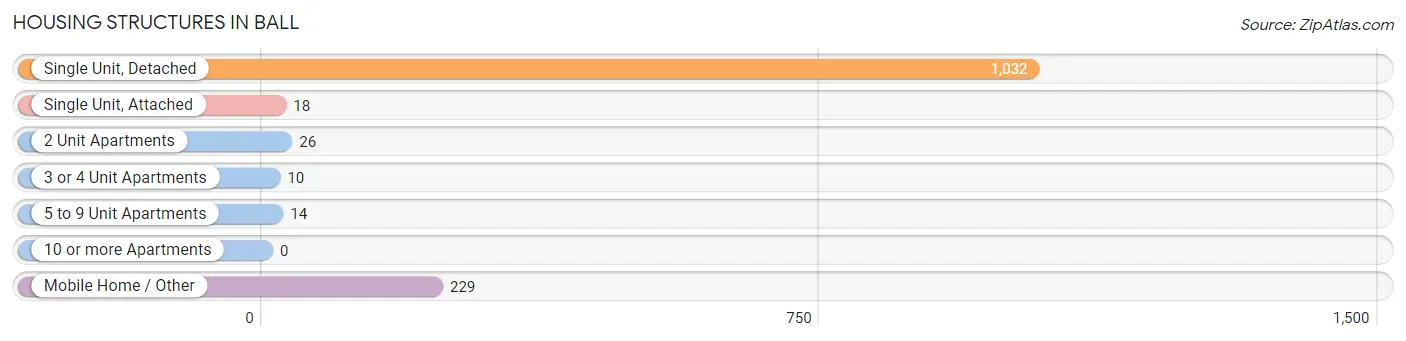
| Structure Type | # Housing Units | % Housing Units |
| Single Unit, Detached | 1,032 | 77.6% |
| Single Unit, Attached | 18 | 1.3% |
| 2 Unit Apartments | 26 | 2.0% |
| 3 or 4 Unit Apartments | 10 | 0.7% |
| 5 to 9 Unit Apartments | 14 | 1.1% |
| 10 or more Apartments | 0 | 0.0% |
| Mobile Home / Other | 229 | 17.2% |
| Total | 1,329 | 100.0% |
Housing Structures by Occupancy in Ball
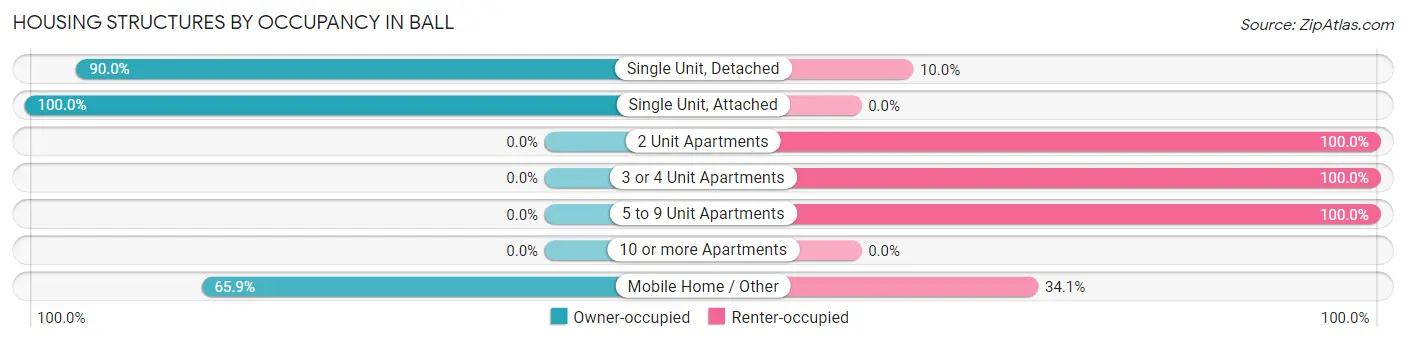
| Structure Type | Owner-occupied | Renter-occupied |
| Single Unit, Detached | 929 (90.0%) | 103 (10.0%) |
| Single Unit, Attached | 18 (100.0%) | 0 (0.0%) |
| 2 Unit Apartments | 0 (0.0%) | 26 (100.0%) |
| 3 or 4 Unit Apartments | 0 (0.0%) | 10 (100.0%) |
| 5 to 9 Unit Apartments | 0 (0.0%) | 14 (100.0%) |
| 10 or more Apartments | 0 (0.0%) | 0 (0.0%) |
| Mobile Home / Other | 151 (65.9%) | 78 (34.1%) |
| Total | 1,098 (82.6%) | 231 (17.4%) |
Housing Structures by Number of Rooms in Ball
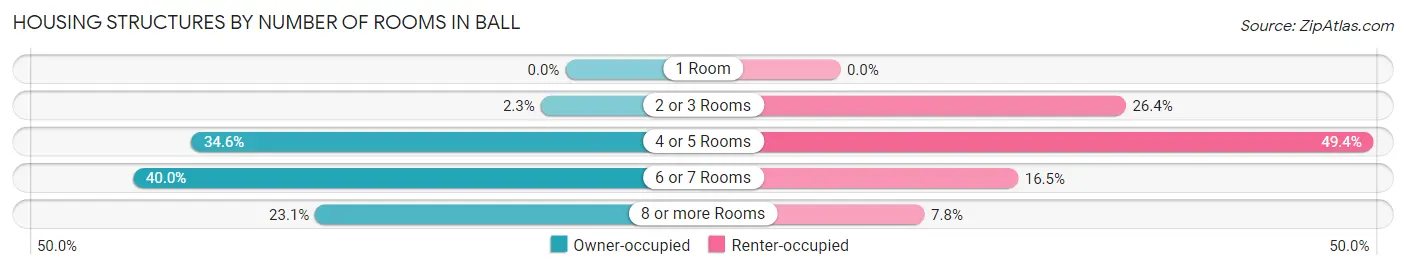
| Number of Rooms | Owner-occupied | Renter-occupied |
| 1 Room | 0 (0.0%) | 0 (0.0%) |
| 2 or 3 Rooms | 25 (2.3%) | 61 (26.4%) |
| 4 or 5 Rooms | 380 (34.6%) | 114 (49.3%) |
| 6 or 7 Rooms | 439 (40.0%) | 38 (16.5%) |
| 8 or more Rooms | 254 (23.1%) | 18 (7.8%) |
| Total | 1,098 (100.0%) | 231 (100.0%) |
Housing Structure by Heating Type in Ball
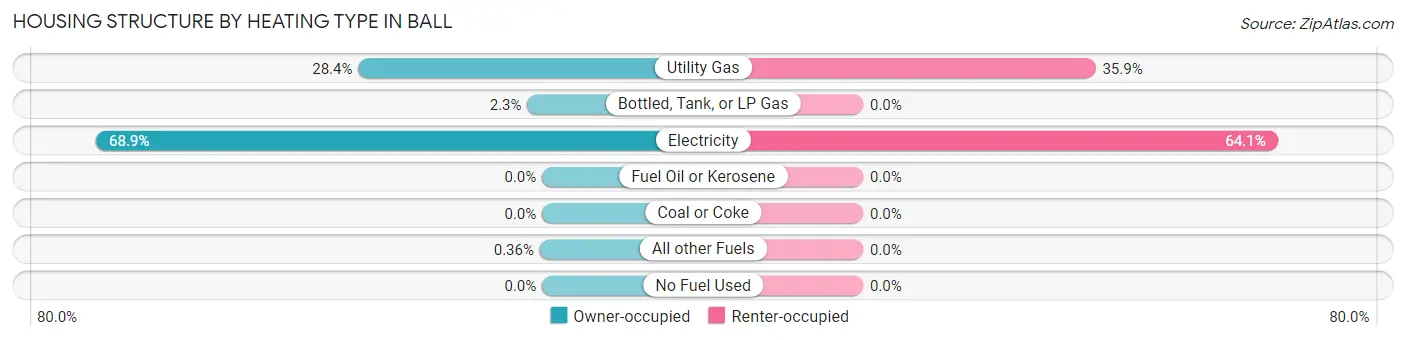
| Heating Type | Owner-occupied | Renter-occupied |
| Utility Gas | 312 (28.4%) | 83 (35.9%) |
| Bottled, Tank, or LP Gas | 25 (2.3%) | 0 (0.0%) |
| Electricity | 757 (68.9%) | 148 (64.1%) |
| Fuel Oil or Kerosene | 0 (0.0%) | 0 (0.0%) |
| Coal or Coke | 0 (0.0%) | 0 (0.0%) |
| All other Fuels | 4 (0.4%) | 0 (0.0%) |
| No Fuel Used | 0 (0.0%) | 0 (0.0%) |
| Total | 1,098 (100.0%) | 231 (100.0%) |
Household Vehicle Usage in Ball
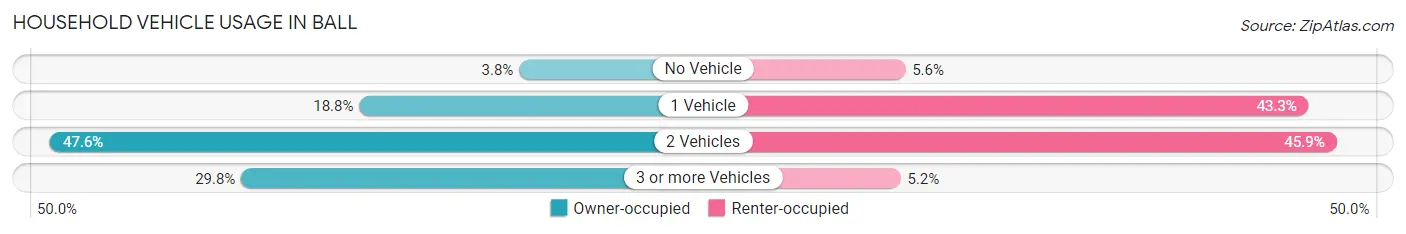
| Vehicles per Household | Owner-occupied | Renter-occupied |
| No Vehicle | 42 (3.8%) | 13 (5.6%) |
| 1 Vehicle | 206 (18.8%) | 100 (43.3%) |
| 2 Vehicles | 523 (47.6%) | 106 (45.9%) |
| 3 or more Vehicles | 327 (29.8%) | 12 (5.2%) |
| Total | 1,098 (100.0%) | 231 (100.0%) |
Real Estate & Mortgages in Ball
Real Estate and Mortgage Overview in Ball
| Characteristic | Without Mortgage | With Mortgage |
| Housing Units | 475 | 623 |
| Median Property Value | $161,900 | $203,300 |
| Median Household Income | $70,172 | $165 |
| Monthly Housing Costs | $394 | $47 |
| Real Estate Taxes | - | - |
Property Value by Mortgage Status in Ball
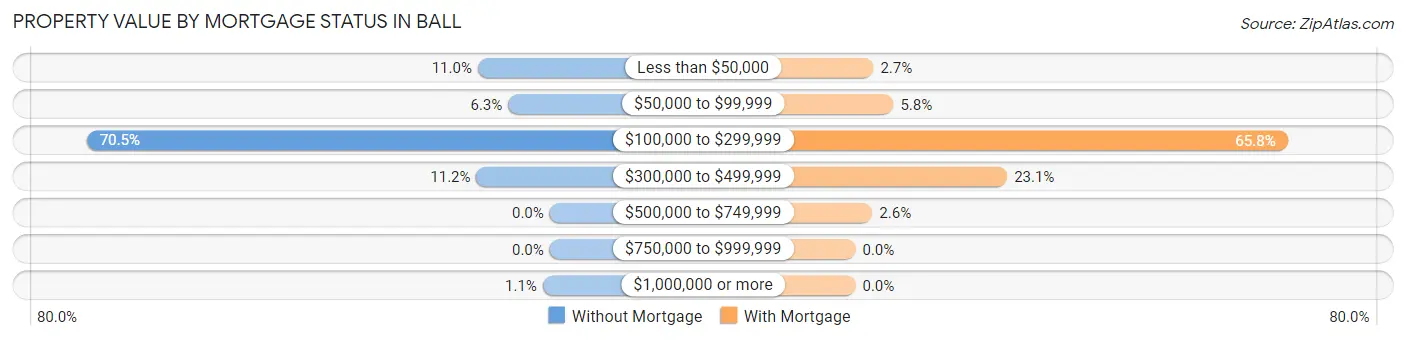
| Property Value | Without Mortgage | With Mortgage |
| Less than $50,000 | 52 (11.0%) | 17 (2.7%) |
| $50,000 to $99,999 | 30 (6.3%) | 36 (5.8%) |
| $100,000 to $299,999 | 335 (70.5%) | 410 (65.8%) |
| $300,000 to $499,999 | 53 (11.2%) | 144 (23.1%) |
| $500,000 to $749,999 | 0 (0.0%) | 16 (2.6%) |
| $750,000 to $999,999 | 0 (0.0%) | 0 (0.0%) |
| $1,000,000 or more | 5 (1.1%) | 0 (0.0%) |
| Total | 475 (100.0%) | 623 (100.0%) |
Household Income by Mortgage Status in Ball
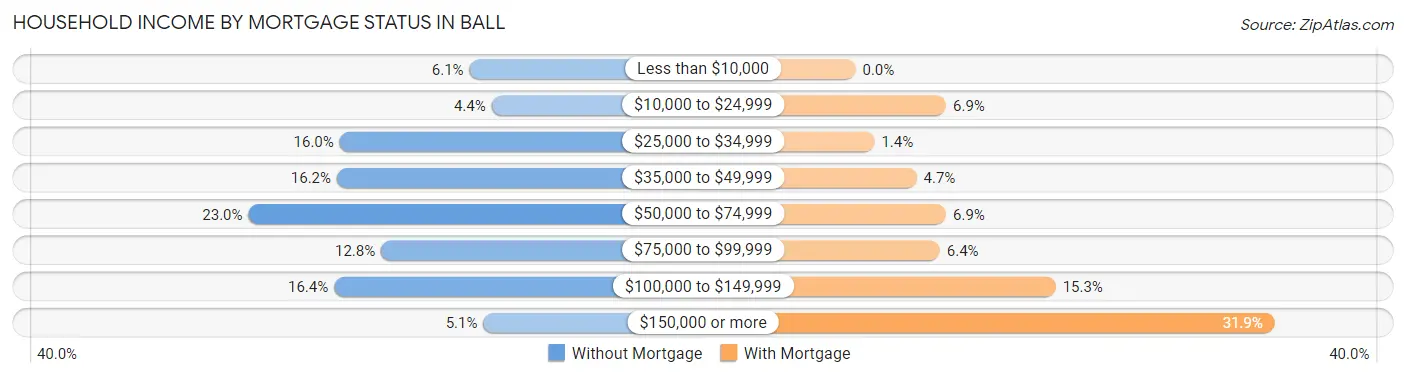
| Household Income | Without Mortgage | With Mortgage |
| Less than $10,000 | 29 (6.1%) | 0 (0.0%) |
| $10,000 to $24,999 | 21 (4.4%) | 43 (6.9%) |
| $25,000 to $34,999 | 76 (16.0%) | 9 (1.4%) |
| $35,000 to $49,999 | 77 (16.2%) | 29 (4.6%) |
| $50,000 to $74,999 | 109 (23.0%) | 43 (6.9%) |
| $75,000 to $99,999 | 61 (12.8%) | 40 (6.4%) |
| $100,000 to $149,999 | 78 (16.4%) | 95 (15.2%) |
| $150,000 or more | 24 (5.1%) | 199 (31.9%) |
| Total | 475 (100.0%) | 623 (100.0%) |
Property Value to Household Income Ratio in Ball
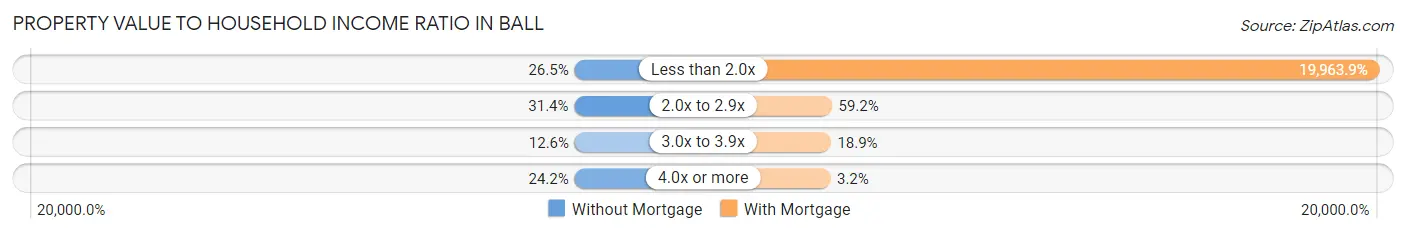
| Value-to-Income Ratio | Without Mortgage | With Mortgage |
| Less than 2.0x | 126 (26.5%) | 124,375 (19,963.9%) |
| 2.0x to 2.9x | 149 (31.4%) | 369 (59.2%) |
| 3.0x to 3.9x | 60 (12.6%) | 118 (18.9%) |
| 4.0x or more | 115 (24.2%) | 20 (3.2%) |
| Total | 475 (100.0%) | 623 (100.0%) |
Real Estate Taxes by Mortgage Status in Ball
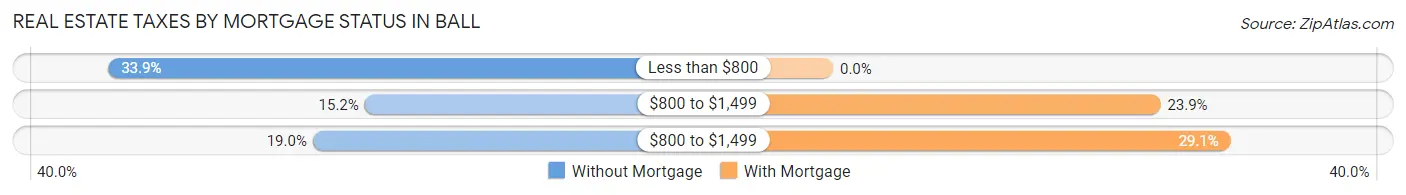
| Property Taxes | Without Mortgage | With Mortgage |
| Less than $800 | 161 (33.9%) | 0 (0.0%) |
| $800 to $1,499 | 72 (15.2%) | 149 (23.9%) |
| $800 to $1,499 | 90 (19.0%) | 181 (29.0%) |
| Total | 475 (100.0%) | 623 (100.0%) |
Health & Disability in Ball
Health Insurance Coverage by Age in Ball
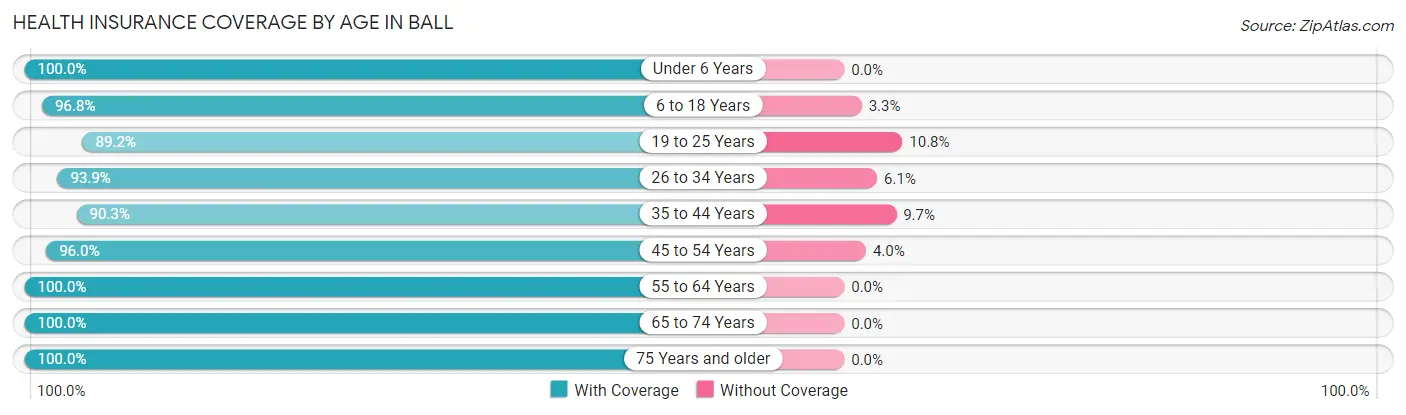
| Age Bracket | With Coverage | Without Coverage |
| Under 6 Years | 350 (100.0%) | 0 (0.0%) |
| 6 to 18 Years | 625 (96.8%) | 21 (3.3%) |
| 19 to 25 Years | 453 (89.2%) | 55 (10.8%) |
| 26 to 34 Years | 643 (93.9%) | 42 (6.1%) |
| 35 to 44 Years | 597 (90.3%) | 64 (9.7%) |
| 45 to 54 Years | 190 (96.0%) | 8 (4.0%) |
| 55 to 64 Years | 279 (100.0%) | 0 (0.0%) |
| 65 to 74 Years | 347 (100.0%) | 0 (0.0%) |
| 75 Years and older | 182 (100.0%) | 0 (0.0%) |
| Total | 3,666 (95.1%) | 190 (4.9%) |
Health Insurance Coverage by Citizenship Status in Ball
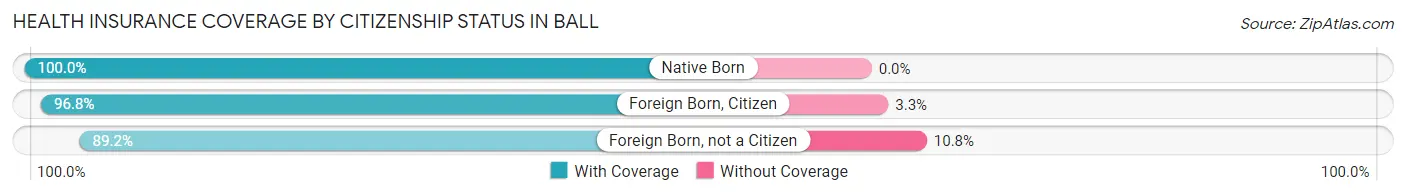
| Citizenship Status | With Coverage | Without Coverage |
| Native Born | 350 (100.0%) | 0 (0.0%) |
| Foreign Born, Citizen | 625 (96.8%) | 21 (3.3%) |
| Foreign Born, not a Citizen | 453 (89.2%) | 55 (10.8%) |
Health Insurance Coverage by Household Income in Ball
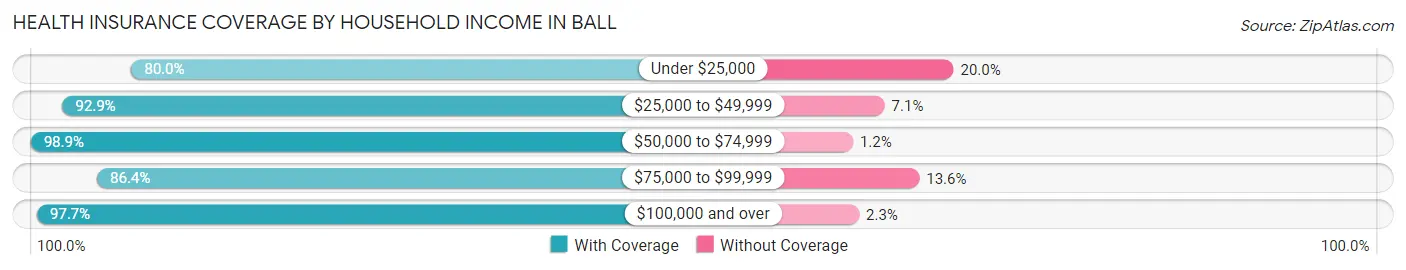
| Household Income | With Coverage | Without Coverage |
| Under $25,000 | 100 (80.0%) | 25 (20.0%) |
| $25,000 to $49,999 | 760 (92.9%) | 58 (7.1%) |
| $50,000 to $74,999 | 686 (98.9%) | 8 (1.1%) |
| $75,000 to $99,999 | 369 (86.4%) | 58 (13.6%) |
| $100,000 and over | 1,742 (97.7%) | 41 (2.3%) |
Public vs Private Health Insurance Coverage by Age in Ball
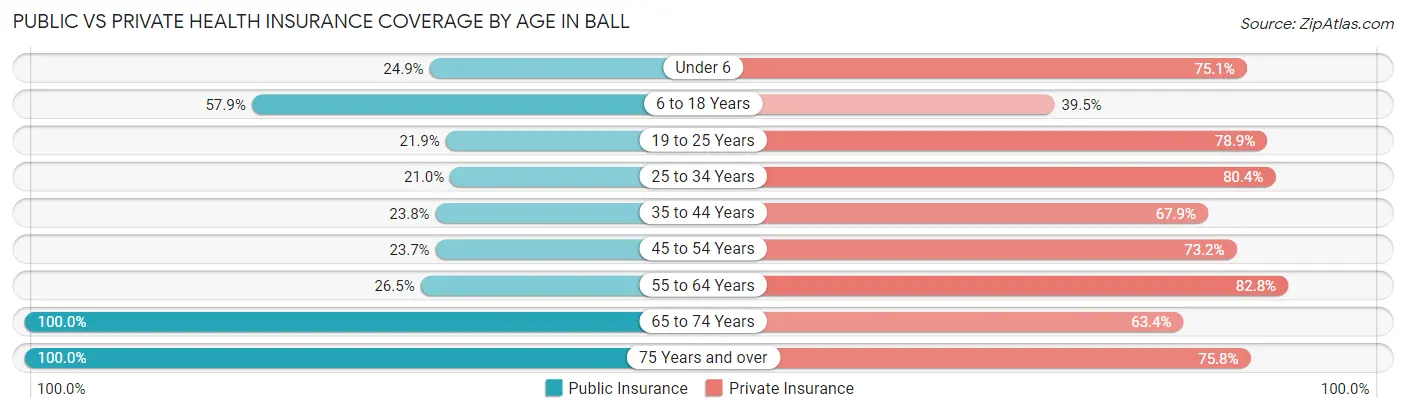
| Age Bracket | Public Insurance | Private Insurance |
| Under 6 | 87 (24.9%) | 263 (75.1%) |
| 6 to 18 Years | 374 (57.9%) | 255 (39.5%) |
| 19 to 25 Years | 111 (21.8%) | 401 (78.9%) |
| 25 to 34 Years | 144 (21.0%) | 551 (80.4%) |
| 35 to 44 Years | 157 (23.7%) | 449 (67.9%) |
| 45 to 54 Years | 47 (23.7%) | 145 (73.2%) |
| 55 to 64 Years | 74 (26.5%) | 231 (82.8%) |
| 65 to 74 Years | 347 (100.0%) | 220 (63.4%) |
| 75 Years and over | 182 (100.0%) | 138 (75.8%) |
| Total | 1,523 (39.5%) | 2,653 (68.8%) |
Disability Status by Sex by Age in Ball
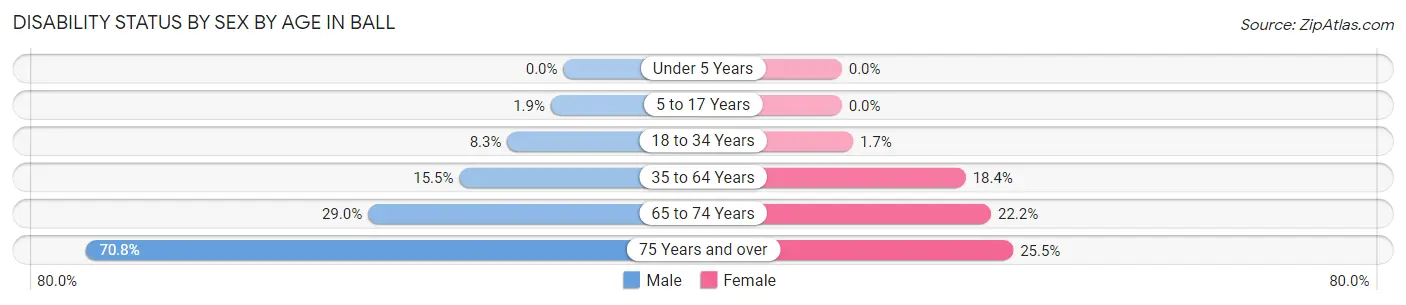
| Age Bracket | Male | Female |
| Under 5 Years | 0 (0.0%) | 0 (0.0%) |
| 5 to 17 Years | 8 (1.9%) | 0 (0.0%) |
| 18 to 34 Years | 46 (8.3%) | 11 (1.7%) |
| 35 to 64 Years | 91 (15.4%) | 101 (18.4%) |
| 65 to 74 Years | 47 (29.0%) | 41 (22.2%) |
| 75 Years and over | 51 (70.8%) | 28 (25.5%) |
Disability Class by Sex by Age in Ball
Disability Class: Hearing Difficulty
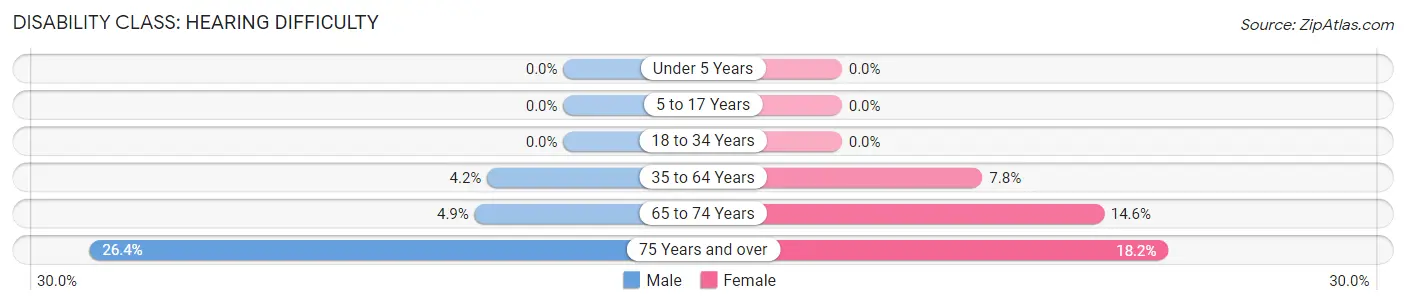
| Age Bracket | Male | Female |
| Under 5 Years | 0 (0.0%) | 0 (0.0%) |
| 5 to 17 Years | 0 (0.0%) | 0 (0.0%) |
| 18 to 34 Years | 0 (0.0%) | 0 (0.0%) |
| 35 to 64 Years | 25 (4.2%) | 43 (7.8%) |
| 65 to 74 Years | 8 (4.9%) | 27 (14.6%) |
| 75 Years and over | 19 (26.4%) | 20 (18.2%) |
Disability Class: Vision Difficulty
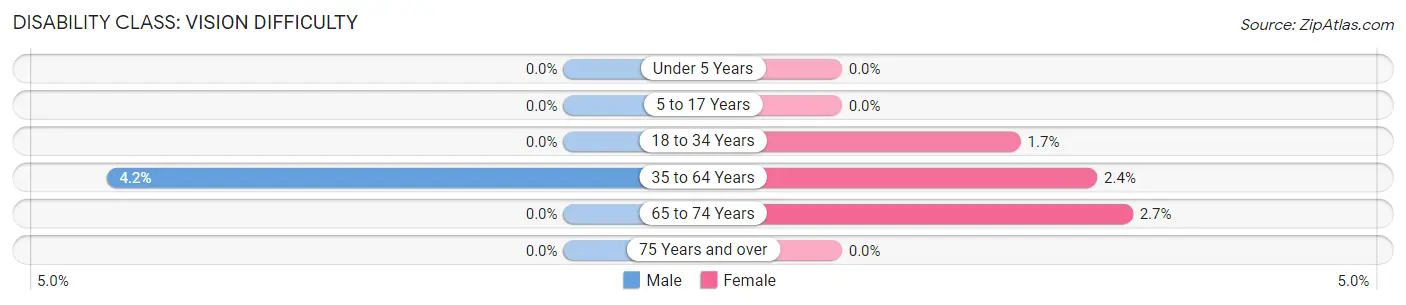
| Age Bracket | Male | Female |
| Under 5 Years | 0 (0.0%) | 0 (0.0%) |
| 5 to 17 Years | 0 (0.0%) | 0 (0.0%) |
| 18 to 34 Years | 0 (0.0%) | 11 (1.7%) |
| 35 to 64 Years | 25 (4.2%) | 13 (2.4%) |
| 65 to 74 Years | 0 (0.0%) | 5 (2.7%) |
| 75 Years and over | 0 (0.0%) | 0 (0.0%) |
Disability Class: Cognitive Difficulty
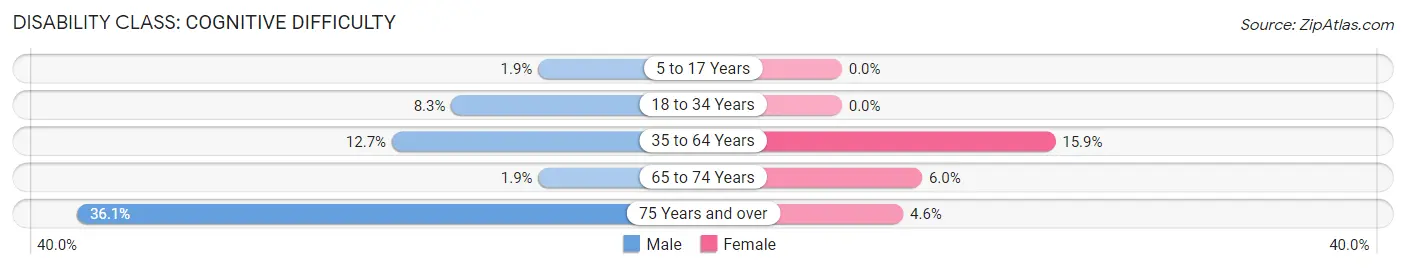
| Age Bracket | Male | Female |
| 5 to 17 Years | 8 (1.9%) | 0 (0.0%) |
| 18 to 34 Years | 46 (8.3%) | 0 (0.0%) |
| 35 to 64 Years | 75 (12.7%) | 87 (15.9%) |
| 65 to 74 Years | 3 (1.8%) | 11 (5.9%) |
| 75 Years and over | 26 (36.1%) | 5 (4.5%) |
Disability Class: Ambulatory Difficulty
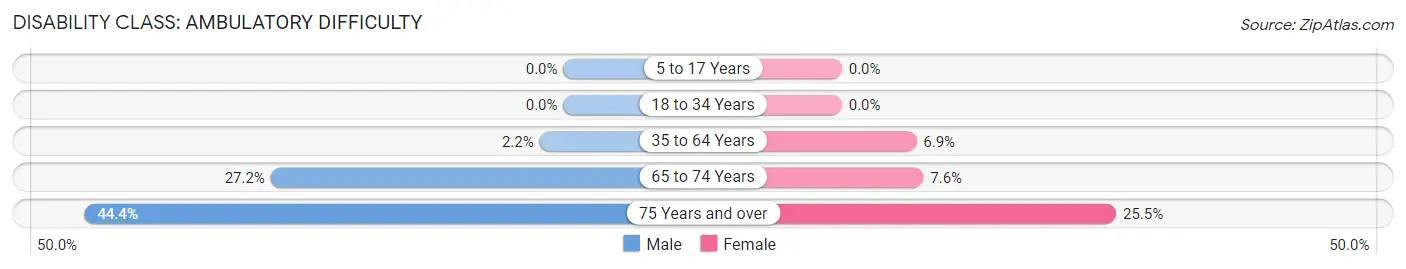
| Age Bracket | Male | Female |
| 5 to 17 Years | 0 (0.0%) | 0 (0.0%) |
| 18 to 34 Years | 0 (0.0%) | 0 (0.0%) |
| 35 to 64 Years | 13 (2.2%) | 38 (6.9%) |
| 65 to 74 Years | 44 (27.2%) | 14 (7.6%) |
| 75 Years and over | 32 (44.4%) | 28 (25.5%) |
Disability Class: Self-Care Difficulty
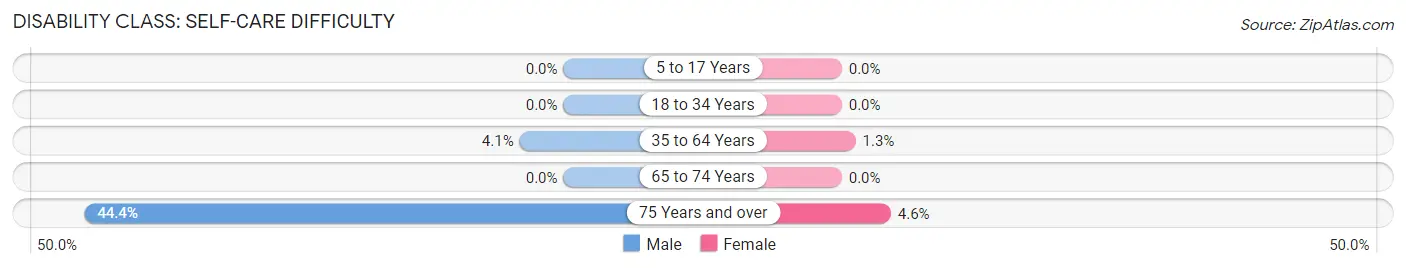
| Age Bracket | Male | Female |
| 5 to 17 Years | 0 (0.0%) | 0 (0.0%) |
| 18 to 34 Years | 0 (0.0%) | 0 (0.0%) |
| 35 to 64 Years | 24 (4.1%) | 7 (1.3%) |
| 65 to 74 Years | 0 (0.0%) | 0 (0.0%) |
| 75 Years and over | 32 (44.4%) | 5 (4.5%) |
Technology Access in Ball
Computing Device Access in Ball
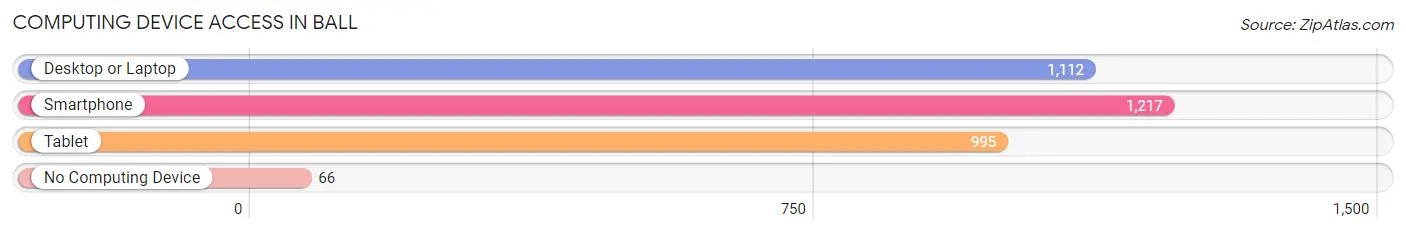
| Device Type | # Households | % Households |
| Desktop or Laptop | 1,112 | 83.7% |
| Smartphone | 1,217 | 91.6% |
| Tablet | 995 | 74.9% |
| No Computing Device | 66 | 5.0% |
| Total | 1,329 | 100.0% |
Internet Access in Ball
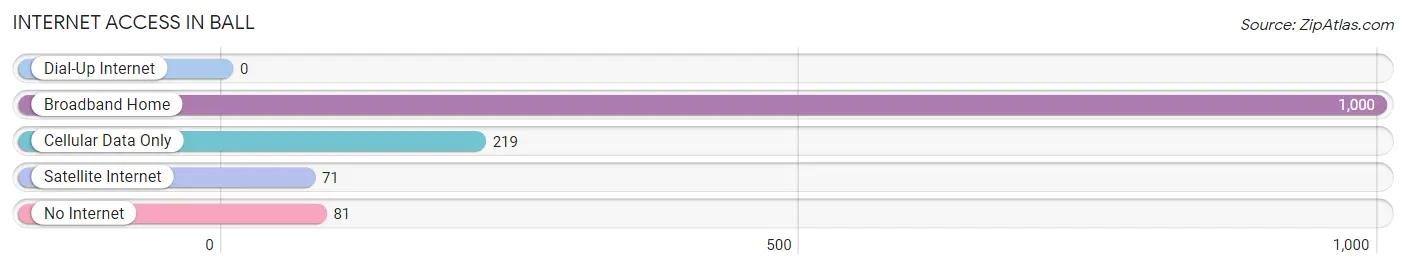
| Internet Type | # Households | % Households |
| Dial-Up Internet | 0 | 0.0% |
| Broadband Home | 1,000 | 75.2% |
| Cellular Data Only | 219 | 16.5% |
| Satellite Internet | 71 | 5.3% |
| No Internet | 81 | 6.1% |
| Total | 1,329 | 100.0% |
Ball Summary
Los Angeles is the second-largest city in the United States and the largest city in California. It is located in the southern part of the state, along the Pacific Ocean. Los Angeles is a major cultural, economic, and transportation hub in the United States. It is home to Hollywood, the entertainment capital of the world, and is a major center of the motion picture industry.
History
Los Angeles was founded in 1781 by Spanish governor Felipe de Neve. It was originally a small pueblo, or village, and was named El Pueblo de Nuestra Señora la Reina de los Angeles de Porciuncula. The city grew rapidly in the 19th century, becoming a major port and commercial center. In the early 20th century, Los Angeles became a major center of the motion picture industry, and it remains so today.
Geography
Los Angeles is located in the southern part of California, along the Pacific Ocean. It is bordered by the San Gabriel Mountains to the north, the Santa Monica Mountains to the west, and the San Fernando Valley to the east. The city covers an area of 469 square miles and has a population of over four million people.
Economy
Los Angeles is a major economic center in the United States. It is home to many large corporations, including the Walt Disney Company, Universal Studios, and Warner Bros. Entertainment. The city is also a major center of the motion picture industry, and it is home to many television and film production companies. Additionally, Los Angeles is a major center of international trade, and it is home to the Los Angeles International Airport, the busiest airport in the United States.
Demographics
Los Angeles is a diverse city, with a population of over four million people. The city is home to many different ethnic and racial groups, including African Americans, Latinos, Asians, and whites. The city also has a large immigrant population, with over one million immigrants living in the city. The median household income in Los Angeles is $53,000, and the median home value is $539,000.
Conclusion
Los Angeles is a major cultural, economic, and transportation hub in the United States. It is home to Hollywood, the entertainment capital of the world, and is a major center of the motion picture industry. The city is located in the southern part of California, along the Pacific Ocean, and it covers an area of 469 square miles. Los Angeles is a diverse city, with a population of over four million people, and it is a major economic center in the United States.
Common Questions
What is the Total Population of Ball?
Total Population of Ball is 3,926.
What is the Total Male Population of Ball?
Total Male Population of Ball is 2,089.
What is the Total Female Population of Ball?
Total Female Population of Ball is 1,837.
What is the Ratio of Males per 100 Females in Ball?
There are 113.72 Males per 100 Females in Ball.
What is the Ratio of Females per 100 Males in Ball?
There are 87.94 Females per 100 Males in Ball.
What is the Median Population Age in Ball?
Median Population Age in Ball is 31.1 Years.
What is the Average Family Size in Ball
Average Family Size in Ball is 3.6 People.
What is the Average Household Size in Ball
Average Household Size in Ball is 2.9 People.
What is Per Capita Income in Ball?
Per Capita income in Ball is $32,443.
What is the Median Family Income in Ball?
Median Family Income in Ball is $81,250.
What is the Median Household income in Ball?
Median Household Income in Ball is $76,198.
What is Income or Wage Gap in Ball?
Income or Wage Gap in Ball is 46.2%.
Women in Ball earn 53.8 cents for every dollar earned by a man.
What is Inequality or Gini Index in Ball?
Inequality or Gini Index in Ball is 0.38.
How Large is the Labor Force in Ball?
There are 2,058 People in the Labor Forcein in Ball.
What is the Percentage of People in the Labor Force in Ball?
68.3% of People are in the Labor Force in Ball.
What is the Unemployment Rate in Ball?
Unemployment Rate in Ball is 5.8%.