Zip Codes with the Highest Percentage of Population Employed in Office & Administration in Wheaton, IL
RELATED REPORTS & OPTIONS
Office & Administration
Wheaton
Compare Zip Codes
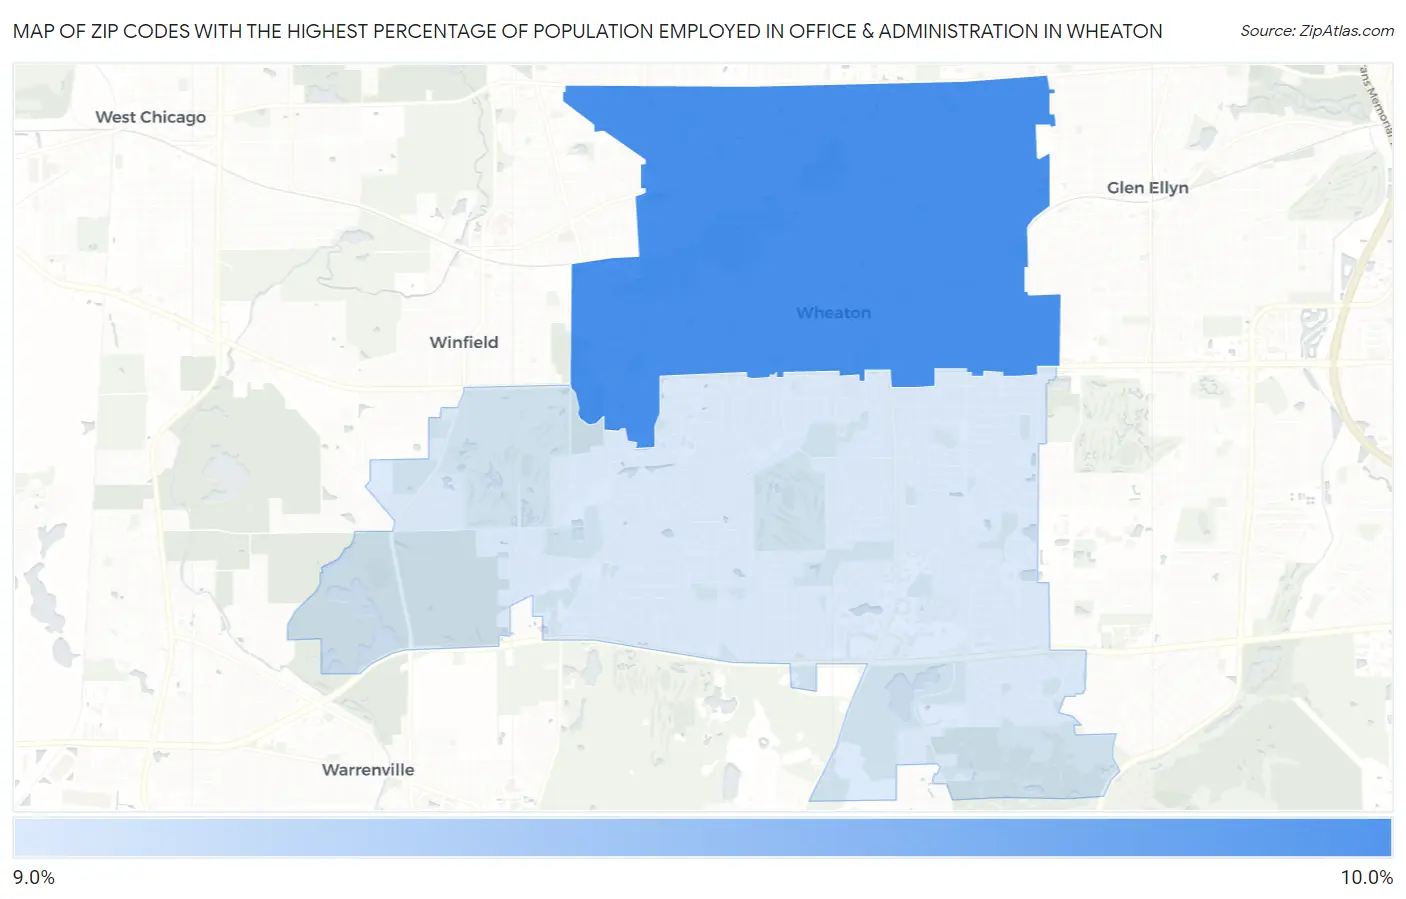
Map of Zip Codes with the Highest Percentage of Population Employed in Office & Administration in Wheaton
0.0%
10.0%
Zip Codes with the Highest Percentage of Population Employed in Office & Administration in Wheaton, IL
| Zip Code | % Employed | vs State | vs National | |
| 1. | 60187 | 9.6% | 10.8%(-1.21)#835 | 10.9%(-1.30)#18,560 |
| 2. | 60189 | 9.2% | 10.8%(-1.55)#886 | 10.9%(-1.64)#19,615 |
1
Common Questions
What are the Top Zip Codes with the Highest Percentage of Population Employed in Office & Administration in Wheaton, IL?
Top Zip Codes with the Highest Percentage of Population Employed in Office & Administration in Wheaton, IL are:
What zip code has the Highest Percentage of Population Employed in Office & Administration in Wheaton, IL?
60187 has the Highest Percentage of Population Employed in Office & Administration in Wheaton, IL with 9.6%.
What is the Percentage of Population Employed in Office & Administration in Wheaton, IL?
Percentage of Population Employed in Office & Administration in Wheaton is 9.5%.
What is the Percentage of Population Employed in Office & Administration in Illinois?
Percentage of Population Employed in Office & Administration in Illinois is 10.8%.
What is the Percentage of Population Employed in Office & Administration in the United States?
Percentage of Population Employed in Office & Administration in the United States is 10.9%.