Zip Codes with the Highest Percentage of Immigrants from South Central Asia in East Saint Louis, IL
RELATED REPORTS & OPTIONS
South Central Asia
East Saint Louis
Compare Zip Codes
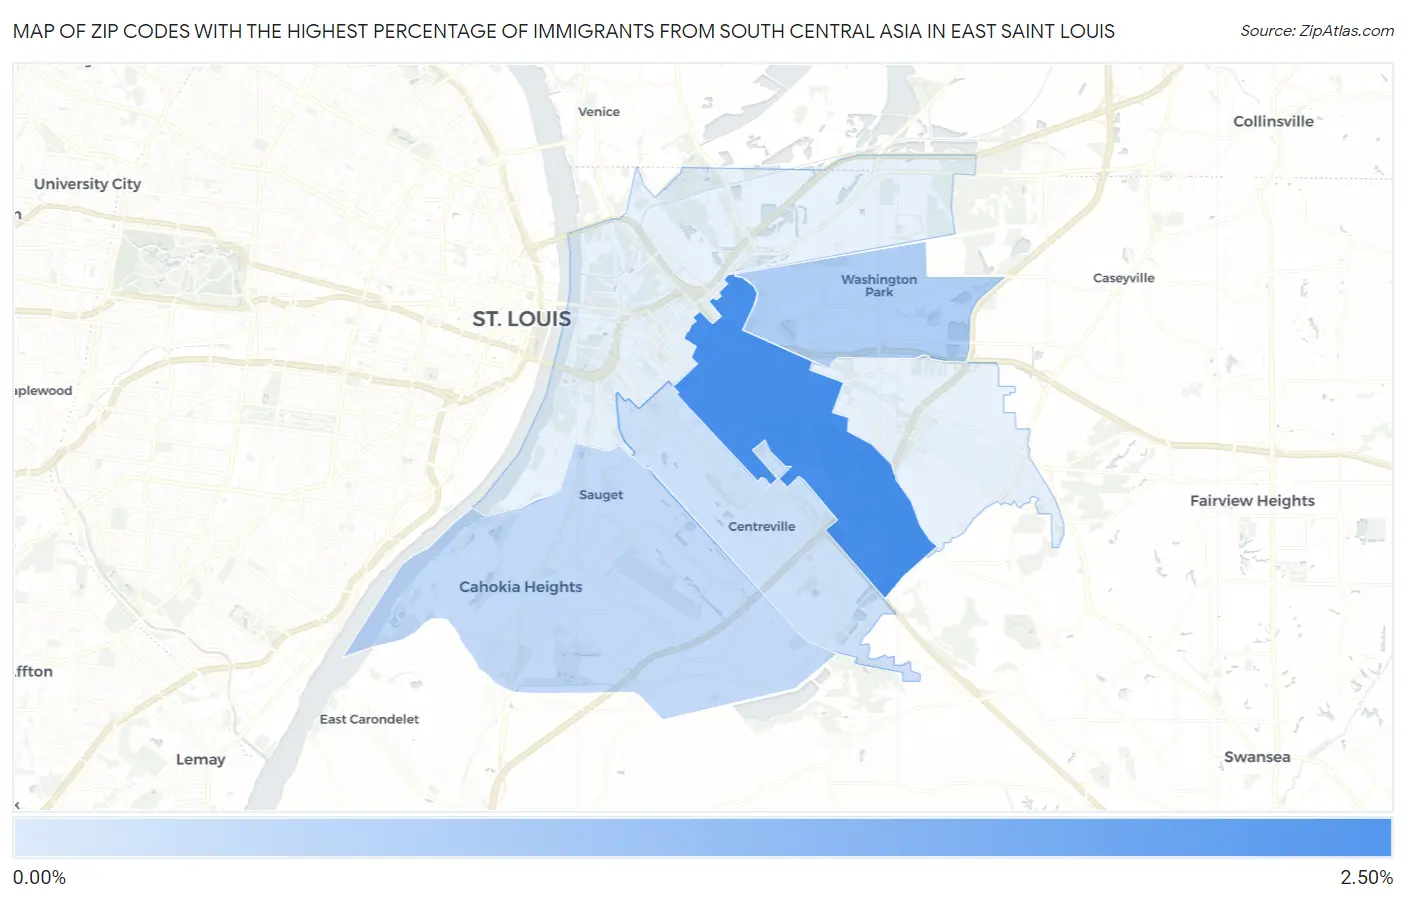
Map of Zip Codes with the Highest Percentage of Immigrants from South Central Asia in East Saint Louis
0.00%
2.50%
Zip Codes with the Highest Percentage of Immigrants from South Central Asia in East Saint Louis, IL
| Zip Code | South Central Asia | vs State | vs National | |
| 1. | 62205 | 2.14% | 1.71%(+0.423)#111 | 1.31%(+0.830)#2,032 |
| 2. | 62204 | 0.64% | 1.71%(-1.07)#246 | 1.31%(-0.665)#5,242 |
| 3. | 62206 | 0.38% | 1.71%(-1.34)#302 | 1.31%(-0.930)#6,848 |
| 4. | 62207 | 0.24% | 1.71%(-1.47)#353 | 1.31%(-1.07)#8,085 |
1
Common Questions
What are the Top 5 Zip Codes with the Highest Percentage of Immigrants from South Central Asia in East Saint Louis, IL?
Top 5 Zip Codes with the Highest Percentage of Immigrants from South Central Asia in East Saint Louis, IL are:
What zip code has the Highest Percentage of Immigrants from South Central Asia in East Saint Louis, IL?
62205 has the Highest Percentage of Immigrants from South Central Asia in East Saint Louis, IL with 2.14%.
What is the Percentage of Immigrants from South Central Asia in Illinois?
Percentage of Immigrants from South Central Asia in Illinois is 1.71%.
What is the Percentage of Immigrants from South Central Asia in the United States?
Percentage of Immigrants from South Central Asia in the United States is 1.31%.