Indian (Asian) vs Venezuelan Family Households with Children
COMPARE
Indian (Asian)
Venezuelan
Family Households with Children
Family Households with Children Comparison
Indians (Asian)
Venezuelans
27.6%
FAMILY HOUSEHOLDS WITH CHILDREN
71.6/ 100
METRIC RATING
157th/ 347
METRIC RANK
29.4%
FAMILY HOUSEHOLDS WITH CHILDREN
100.0/ 100
METRIC RATING
33rd/ 347
METRIC RANK
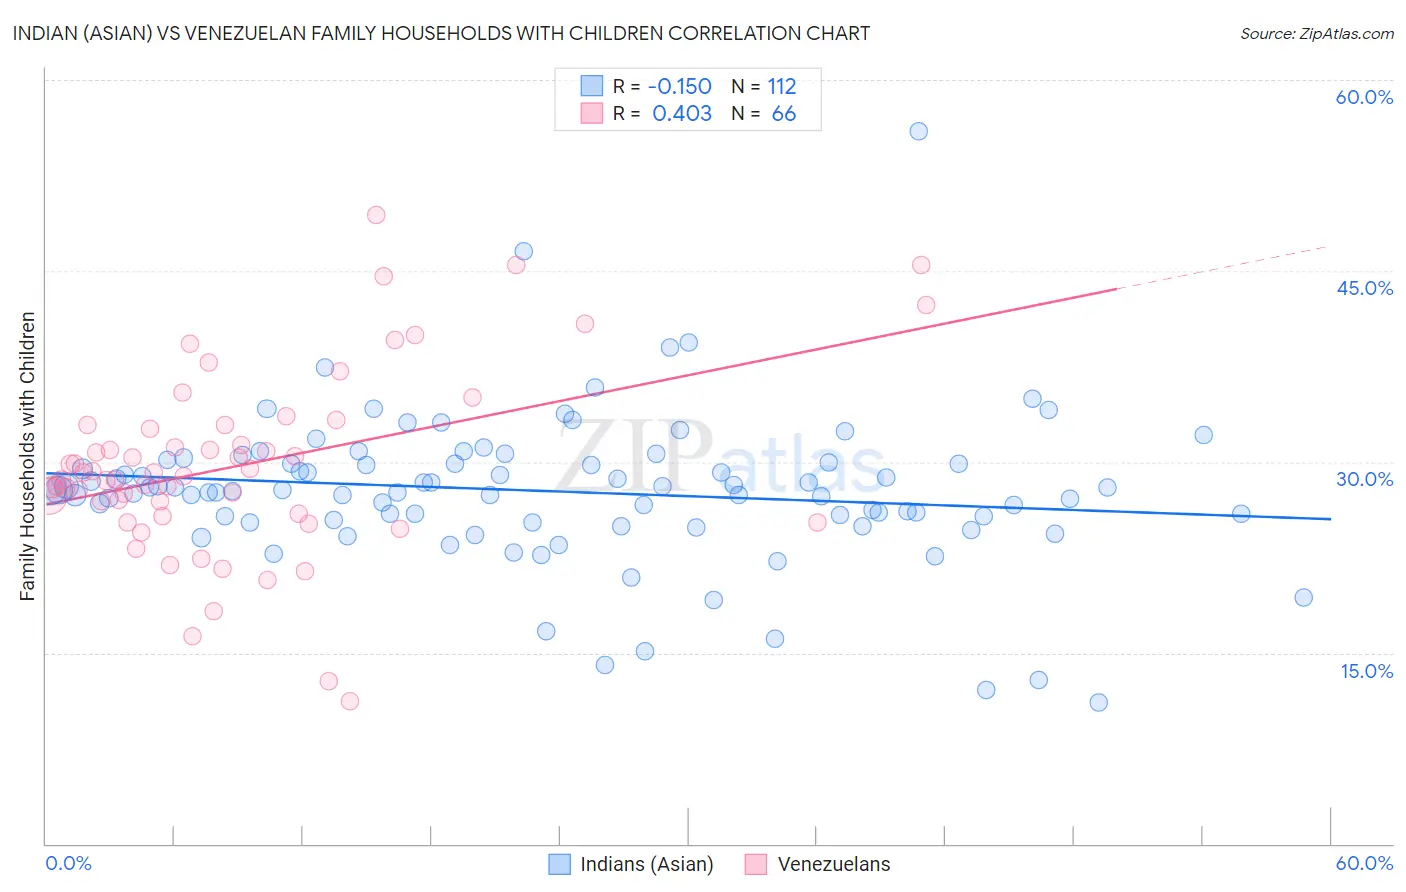
Indian (Asian) vs Venezuelan Family Households with Children Correlation Chart
The statistical analysis conducted on geographies consisting of 494,524,246 people shows a poor negative correlation between the proportion of Indians (Asian) and percentage of family households with children in the United States with a correlation coefficient (R) of -0.150 and weighted average of 27.6%. Similarly, the statistical analysis conducted on geographies consisting of 306,091,961 people shows a moderate positive correlation between the proportion of Venezuelans and percentage of family households with children in the United States with a correlation coefficient (R) of 0.403 and weighted average of 29.4%, a difference of 6.5%.
Family Households with Children Correlation Summary
| Measurement | Indian (Asian) | Venezuelan |
| Minimum | 11.1% | 11.2% |
| Maximum | 55.9% | 49.4% |
| Range | 44.9% | 38.2% |
| Mean | 27.7% | 29.8% |
| Median | 27.8% | 29.0% |
| Interquartile 25% (IQ1) | 25.6% | 25.9% |
| Interquartile 75% (IQ3) | 29.9% | 32.9% |
| Interquartile Range (IQR) | 4.3% | 7.0% |
| Standard Deviation (Sample) | 5.9% | 7.3% |
| Standard Deviation (Population) | 5.9% | 7.2% |
Similar Demographics by Family Households with Children
Demographics Similar to Indians (Asian) by Family Households with Children
In terms of family households with children, the demographic groups most similar to Indians (Asian) are Romanian (27.6%, a difference of 0.020%), Mongolian (27.6%, a difference of 0.020%), Hungarian (27.6%, a difference of 0.080%), Comanche (27.6%, a difference of 0.090%), and Icelander (27.6%, a difference of 0.10%).
| Demographics | Rating | Rank | Family Households with Children |
| Argentineans | 78.5 /100 | #150 | Good 27.6% |
| Portuguese | 77.8 /100 | #151 | Good 27.6% |
| Ethiopians | 77.0 /100 | #152 | Good 27.6% |
| Immigrants | Cabo Verde | 75.6 /100 | #153 | Good 27.6% |
| Icelanders | 75.3 /100 | #154 | Good 27.6% |
| Comanche | 74.8 /100 | #155 | Good 27.6% |
| Hungarians | 74.6 /100 | #156 | Good 27.6% |
| Indians (Asian) | 71.6 /100 | #157 | Good 27.6% |
| Romanians | 70.8 /100 | #158 | Good 27.6% |
| Mongolians | 70.7 /100 | #159 | Good 27.6% |
| Sub-Saharan Africans | 67.5 /100 | #160 | Good 27.6% |
| Alaskan Athabascans | 67.1 /100 | #161 | Good 27.6% |
| Immigrants | Bangladesh | 67.0 /100 | #162 | Good 27.6% |
| Czechs | 65.3 /100 | #163 | Good 27.5% |
| Immigrants | Hong Kong | 64.9 /100 | #164 | Good 27.5% |
Demographics Similar to Venezuelans by Family Households with Children
In terms of family households with children, the demographic groups most similar to Venezuelans are Immigrants from Bolivia (29.3%, a difference of 0.060%), Immigrants from Yemen (29.4%, a difference of 0.20%), Immigrants from Sierra Leone (29.3%, a difference of 0.22%), Immigrants from Venezuela (29.3%, a difference of 0.23%), and Japanese (29.4%, a difference of 0.26%).
| Demographics | Rating | Rank | Family Households with Children |
| Sri Lankans | 100.0 /100 | #26 | Exceptional 29.5% |
| Immigrants | Vietnam | 100.0 /100 | #27 | Exceptional 29.5% |
| Samoans | 100.0 /100 | #28 | Exceptional 29.5% |
| Bolivians | 100.0 /100 | #29 | Exceptional 29.5% |
| Yuman | 100.0 /100 | #30 | Exceptional 29.5% |
| Japanese | 100.0 /100 | #31 | Exceptional 29.4% |
| Immigrants | Yemen | 100.0 /100 | #32 | Exceptional 29.4% |
| Venezuelans | 100.0 /100 | #33 | Exceptional 29.4% |
| Immigrants | Bolivia | 100.0 /100 | #34 | Exceptional 29.3% |
| Immigrants | Sierra Leone | 100.0 /100 | #35 | Exceptional 29.3% |
| Immigrants | Venezuela | 100.0 /100 | #36 | Exceptional 29.3% |
| Immigrants | Cameroon | 100.0 /100 | #37 | Exceptional 29.2% |
| Koreans | 100.0 /100 | #38 | Exceptional 29.2% |
| Yaqui | 100.0 /100 | #39 | Exceptional 29.1% |
| Central Americans | 100.0 /100 | #40 | Exceptional 29.1% |