Shoshone vs Immigrants from Egypt Married-couple Households

COMPARE

Shoshone
Race
Ancestry
AfghanAfricanAlaska NativeAlaskan AthabascanAlbanianAleutAlsatianAmericanApacheArabArapahoArgentineanArmenianAssyrian/Chaldean/SyriacAustralianAustrianBahamianBangladeshiBarbadianBasqueBelgianBelizeanBermudanBhutaneseBlackfeetBolivianBrazilianBritishBritish West IndianBulgarianBurmeseCajunCambodianCanadianCape VerdeanCarpatho RusynCelticCentral AmericanCentral American IndianCherokeeCheyenneChickasawChileanChineseChippewaChoctawColombianColvilleComancheCosta RicanCreeCreekCroatianCrowCubanCypriotCzechCzechoslovakianDanishDelawareDominicanDutchDutch West IndianEastern EuropeanEcuadorianEgyptianEnglishEstonianEthiopianEuropeanFijianFilipinoFinnishFrenchFrench American IndianFrench CanadianGermanGerman RussianGhanaianGreekGuamanian/ChamorroGuatemalanGuyaneseHaitianHmongHonduranHopiHoumaHungarianIcelanderIndian (Asian)IndonesianInupiatIranianIraqiIrishIroquoisIsraeliItalianJamaicanJapaneseJordanianKenyanKiowaKoreanLaotianLatvianLebaneseLiberianLithuanianLumbeeLuxembourgerMacedonianMalaysianMalteseMarshalleseMenomineeMexicanMexican American IndianMongolianMoroccanNative HawaiianNavajoNepaleseNew ZealanderNicaraguanNigerianNorthern EuropeanNorwegianOkinawanOsageOttawaPaiutePakistaniPalestinianPanamanianParaguayanPennsylvania GermanPeruvianPimaPolishPortuguesePotawatomiPuebloPuerto RicanPuget Sound SalishRomanianRussianSalvadoranSamoanScandinavianScotch-IrishScottishSeminoleSenegaleseSerbianShoshoneSierra LeoneanSiouxSlavicSlovakSloveneSomaliSouth AfricanSouth AmericanSouth American IndianSoviet UnionSpaniardSpanishSpanish AmericanSpanish American IndianSri LankanSubsaharan AfricanSudaneseSwedishSwissSyrianTaiwaneseThaiTlingit-HaidaTohono O'OdhamTonganTrinidadian and TobagonianTsimshianTurkishU.S. Virgin IslanderUgandanUkrainianUruguayanUteVenezuelanVietnameseWelshWest IndianYakamaYaquiYugoslavianYumanYup'ikZimbabwean
Immigration
NonimmigrantsImmigrantsAfghanistanAfricaAlbaniaArgentinaArmeniaAsiaAustraliaAustriaBahamasBangladeshBarbadosBelarusBelgiumBelizeBoliviaBosnia and HerzegovinaBrazilBulgariaBurma/MyanmarCabo VerdeCambodiaCameroonCanadaCaribbeanCentral AmericaChileChinaColombiaCongoCosta RicaCroatiaCubaCzechoslovakiaDenmarkDominicaDominican RepublicEastern AfricaEastern AsiaEastern EuropeEcuadorEl SalvadorEnglandEritreaEthiopiaEuropeFijiFranceGermanyGhanaGreeceGrenadaGuatemalaGuyanaHaitiHondurasHong KongHungaryIndiaIndonesiaIranIraqIrelandIsraelItalyJamaicaJapanJordanKazakhstanKenyaKoreaKuwaitLaosLatin AmericaLatviaLebanonLiberiaLithuaniaMalaysiaMexicoMicronesiaMiddle AfricaMoldovaMoroccoNepalNetherlandsNicaraguaNigeriaNorth AmericaNorth MacedoniaNorthern AfricaNorthern EuropeNorwayOceaniaPakistanPanamaPeruPhilippinesPolandPortugalRomaniaRussiaSaudi ArabiaScotlandSenegalSerbiaSierra LeoneSingaporeSomaliaSouth AfricaSouth AmericaSouth Central AsiaSouth Eastern AsiaSouthern EuropeSpainSri LankaSt. Vincent and the GrenadinesSudanSwedenSwitzerlandSyriaTaiwanThailandTrinidad and TobagoTurkeyUgandaUkraineUruguayUzbekistanVenezuelaVietnamWest IndiesWestern AfricaWestern AsiaWestern EuropeYemenZaireZimbabweAzores
Immigrants from Egypt
Race
Ancestry
AfghanAfricanAlaska NativeAlaskan AthabascanAlbanianAleutAlsatianAmericanApacheArabArapahoArgentineanArmenianAssyrian/Chaldean/SyriacAustralianAustrianBahamianBangladeshiBarbadianBasqueBelgianBelizeanBermudanBhutaneseBlackfeetBolivianBrazilianBritishBritish West IndianBulgarianBurmeseCajunCambodianCanadianCape VerdeanCarpatho RusynCelticCentral AmericanCentral American IndianCherokeeCheyenneChickasawChileanChineseChippewaChoctawColombianColvilleComancheCosta RicanCreeCreekCroatianCrowCubanCypriotCzechCzechoslovakianDanishDelawareDominicanDutchDutch West IndianEastern EuropeanEcuadorianEgyptianEnglishEstonianEthiopianEuropeanFijianFilipinoFinnishFrenchFrench American IndianFrench CanadianGermanGerman RussianGhanaianGreekGuamanian/ChamorroGuatemalanGuyaneseHaitianHmongHonduranHopiHoumaHungarianIcelanderIndian (Asian)IndonesianInupiatIranianIraqiIrishIroquoisIsraeliItalianJamaicanJapaneseJordanianKenyanKiowaKoreanLaotianLatvianLebaneseLiberianLithuanianLumbeeLuxembourgerMacedonianMalaysianMalteseMarshalleseMenomineeMexicanMexican American IndianMongolianMoroccanNative HawaiianNavajoNepaleseNew ZealanderNicaraguanNigerianNorthern EuropeanNorwegianOkinawanOsageOttawaPaiutePakistaniPalestinianPanamanianParaguayanPennsylvania GermanPeruvianPimaPolishPortuguesePotawatomiPuebloPuerto RicanPuget Sound SalishRomanianRussianSalvadoranSamoanScandinavianScotch-IrishScottishSeminoleSenegaleseSerbianSierra LeoneanSiouxSlavicSlovakSloveneSomaliSouth AfricanSouth AmericanSouth American IndianSoviet UnionSpaniardSpanishSpanish AmericanSpanish American IndianSri LankanSubsaharan AfricanSudaneseSwedishSwissSyrianTaiwaneseThaiTlingit-HaidaTohono O'OdhamTonganTrinidadian and TobagonianTsimshianTurkishU.S. Virgin IslanderUgandanUkrainianUruguayanUteVenezuelanVietnameseWelshWest IndianYakamaYaquiYugoslavianYumanYup'ikZimbabwean
Immigration
NonimmigrantsImmigrantsAfghanistanAfricaAlbaniaArgentinaArmeniaAsiaAustraliaAustriaBahamasBangladeshBarbadosBelarusBelgiumBelizeBoliviaBosnia and HerzegovinaBrazilBulgariaBurma/MyanmarCabo VerdeCambodiaCameroonCanadaCaribbeanCentral AmericaChileChinaColombiaCongoCosta RicaCroatiaCubaCzechoslovakiaDenmarkDominicaDominican RepublicEastern AfricaEastern AsiaEastern EuropeEcuadorEgyptEl SalvadorEnglandEritreaEthiopiaEuropeFijiFranceGermanyGhanaGreeceGrenadaGuatemalaGuyanaHaitiHondurasHong KongHungaryIndiaIndonesiaIranIraqIrelandIsraelItalyJamaicaJapanJordanKazakhstanKenyaKoreaKuwaitLaosLatin AmericaLatviaLebanonLiberiaLithuaniaMalaysiaMexicoMicronesiaMiddle AfricaMoldovaMoroccoNepalNetherlandsNicaraguaNigeriaNorth AmericaNorth MacedoniaNorthern AfricaNorthern EuropeNorwayOceaniaPakistanPanamaPeruPhilippinesPolandPortugalRomaniaRussiaSaudi ArabiaScotlandSenegalSerbiaSierra LeoneSingaporeSomaliaSouth AfricaSouth AmericaSouth Central AsiaSouth Eastern AsiaSouthern EuropeSpainSri LankaSt. Vincent and the GrenadinesSudanSwedenSwitzerlandSyriaTaiwanThailandTrinidad and TobagoTurkeyUgandaUkraineUruguayUzbekistanVenezuelaVietnamWest IndiesWestern AfricaWestern AsiaWestern EuropeYemenZaireZimbabweAzores
Married-couple Households
Income
Poverty
Unemployment
Labor Participation
Family Structure
Vehicle Availability
Education Level
Disability

Married-couple Households Comparison

Shoshone

Immigrants from Egypt

Tragic
Exceptional
43.9%
MARRIED-COUPLE HOUSEHOLDS
0.3/ 100
METRIC RATING
255th/ 347
METRIC RANK
47.9%
MARRIED-COUPLE HOUSEHOLDS
96.6/ 100
METRIC RATING
96th/ 347
METRIC RANK

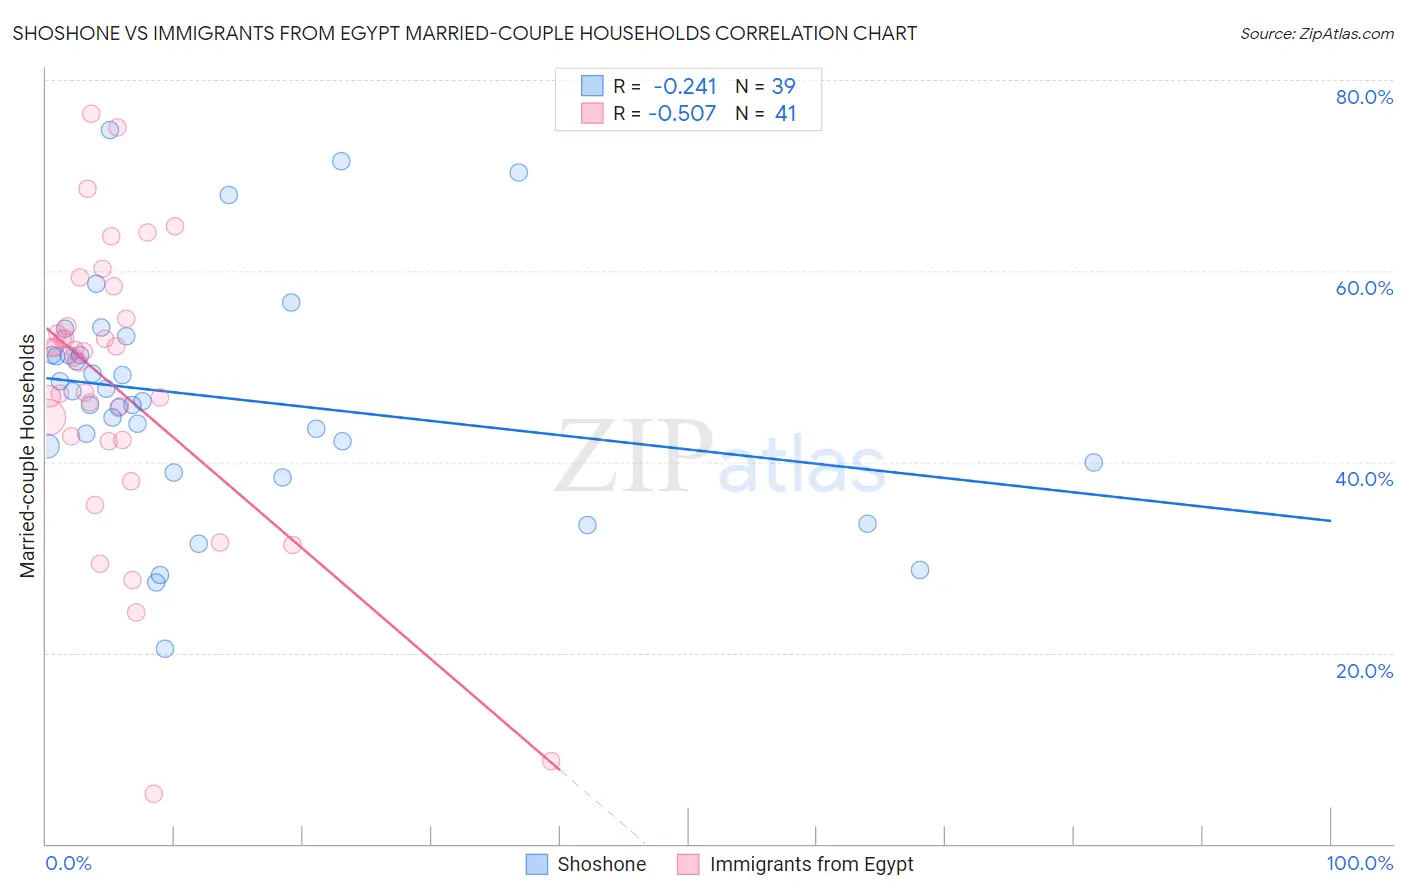
Shoshone vs Immigrants from Egypt Married-couple Households Correlation Chart

The statistical analysis conducted on geographies consisting of 66,615,808 people shows a weak negative correlation between the proportion of Shoshone and percentage of married-couple family households in the United States with a correlation coefficient (R) of -0.241 and weighted average of 43.9%. Similarly, the statistical analysis conducted on geographies consisting of 245,425,004 people shows a substantial negative correlation between the proportion of Immigrants from Egypt and percentage of married-couple family households in the United States with a correlation coefficient (R) of -0.507 and weighted average of 47.9%, a difference of 9.1%.
Shoshone vs Immigrants from Egypt Married-couple Households

Married-couple Households Correlation Summary

MeasurementShoshoneImmigrants from Egypt
Minimum20.5%5.3%
Maximum74.8%76.5%
Range54.3%71.2%
Mean46.7%47.7%
Median46.4%51.0%
Interquartile 25% (IQ1)40.0%42.2%
Interquartile 75% (IQ3)51.3%54.6%
Interquartile Range (IQR)11.3%12.3%
Standard Deviation (Sample)12.0%15.0%
Standard Deviation (Population)11.9%14.8%

Similar Demographics by Married-couple Households

Demographics Similar to Shoshone by Married-couple Households

In terms of married-couple households, the demographic groups most similar to Shoshone are Apache (43.9%, a difference of 0.020%), Central American (43.9%, a difference of 0.070%), Ugandan (43.8%, a difference of 0.14%), Seminole (44.0%, a difference of 0.19%), and German Russian (44.0%, a difference of 0.26%).
DemographicsRating | RankMarried-couple Households
Yup'ik
0.4
/100
|
#248
Tragic
44.1%
Immigrants | Kenya
0.4
/100
|
#249
Tragic
44.1%
French American Indians
0.4
/100
|
#250
Tragic
44.1%
German Russians
0.4
/100
|
#251
Tragic
44.0%
Seminole
0.4
/100
|
#252
Tragic
44.0%
Central Americans
0.3
/100
|
#253
Tragic
43.9%
Apache
0.3
/100
|
#254
Tragic
43.9%
Shoshone
0.3
/100
|
#255
Tragic
43.9%
Ugandans
0.3
/100
|
#256
Tragic
43.8%
Blackfeet
0.2
/100
|
#257
Tragic
43.8%
Central American Indians
0.2
/100
|
#258
Tragic
43.8%
Iroquois
0.2
/100
|
#259
Tragic
43.7%
Immigrants | Cameroon
0.2
/100
|
#260
Tragic
43.7%
Alaskan Athabascans
0.2
/100
|
#261
Tragic
43.6%
Vietnamese
0.2
/100
|
#262
Tragic
43.6%

Demographics Similar to Immigrants from Egypt by Married-couple Households

In terms of married-couple households, the demographic groups most similar to Immigrants from Egypt are Latvian (47.9%, a difference of 0.030%), Immigrants from North Macedonia (47.9%, a difference of 0.040%), Immigrants from Belgium (47.9%, a difference of 0.050%), Immigrants from Austria (47.9%, a difference of 0.050%), and Immigrants from Italy (47.9%, a difference of 0.060%).
DemographicsRating | RankMarried-couple Households
Cypriots
97.2
/100
|
#89
Exceptional
48.0%
French
97.2
/100
|
#90
Exceptional
48.0%
Immigrants | Moldova
97.0
/100
|
#91
Exceptional
48.0%
Palestinians
96.9
/100
|
#92
Exceptional
48.0%
Lebanese
96.9
/100
|
#93
Exceptional
47.9%
Americans
96.9
/100
|
#94
Exceptional
47.9%
Immigrants | Belgium
96.8
/100
|
#95
Exceptional
47.9%
Immigrants | Egypt
96.6
/100
|
#96
Exceptional
47.9%
Latvians
96.5
/100
|
#97
Exceptional
47.9%
Immigrants | North Macedonia
96.4
/100
|
#98
Exceptional
47.9%
Immigrants | Austria
96.4
/100
|
#99
Exceptional
47.9%
Immigrants | Italy
96.3
/100
|
#100
Exceptional
47.9%
Turks
96.1
/100
|
#101
Exceptional
47.8%
Slavs
96.0
/100
|
#102
Exceptional
47.8%
Hawaiians
96.0
/100
|
#103
Exceptional
47.8%