Ottawa vs Immigrants from Turkey Married-couple Households

COMPARE

Ottawa
Race
Ancestry
AfghanAfricanAlaska NativeAlaskan AthabascanAlbanianAleutAlsatianAmericanApacheArabArapahoArgentineanArmenianAssyrian/Chaldean/SyriacAustralianAustrianBahamianBangladeshiBarbadianBasqueBelgianBelizeanBermudanBhutaneseBlackfeetBolivianBrazilianBritishBritish West IndianBulgarianBurmeseCajunCambodianCanadianCape VerdeanCarpatho RusynCelticCentral AmericanCentral American IndianCherokeeCheyenneChickasawChileanChineseChippewaChoctawColombianColvilleComancheCosta RicanCreeCreekCroatianCrowCubanCypriotCzechCzechoslovakianDanishDelawareDominicanDutchDutch West IndianEastern EuropeanEcuadorianEgyptianEnglishEstonianEthiopianEuropeanFijianFilipinoFinnishFrenchFrench American IndianFrench CanadianGermanGerman RussianGhanaianGreekGuamanian/ChamorroGuatemalanGuyaneseHaitianHmongHonduranHopiHoumaHungarianIcelanderIndian (Asian)IndonesianInupiatIranianIraqiIrishIroquoisIsraeliItalianJamaicanJapaneseJordanianKenyanKiowaKoreanLaotianLatvianLebaneseLiberianLithuanianLumbeeLuxembourgerMacedonianMalaysianMalteseMarshalleseMenomineeMexicanMexican American IndianMongolianMoroccanNative HawaiianNavajoNepaleseNew ZealanderNicaraguanNigerianNorthern EuropeanNorwegianOkinawanOsageOttawaPaiutePakistaniPalestinianPanamanianParaguayanPennsylvania GermanPeruvianPimaPolishPortuguesePotawatomiPuebloPuerto RicanPuget Sound SalishRomanianRussianSalvadoranSamoanScandinavianScotch-IrishScottishSeminoleSenegaleseSerbianShoshoneSierra LeoneanSiouxSlavicSlovakSloveneSomaliSouth AfricanSouth AmericanSouth American IndianSoviet UnionSpaniardSpanishSpanish AmericanSpanish American IndianSri LankanSubsaharan AfricanSudaneseSwedishSwissSyrianTaiwaneseThaiTlingit-HaidaTohono O'OdhamTonganTrinidadian and TobagonianTsimshianTurkishU.S. Virgin IslanderUgandanUkrainianUruguayanUteVenezuelanVietnameseWelshWest IndianYakamaYaquiYugoslavianYumanYup'ikZimbabwean
Immigration
NonimmigrantsImmigrantsAfghanistanAfricaAlbaniaArgentinaArmeniaAsiaAustraliaAustriaBahamasBangladeshBarbadosBelarusBelgiumBelizeBoliviaBosnia and HerzegovinaBrazilBulgariaBurma/MyanmarCabo VerdeCambodiaCameroonCanadaCaribbeanCentral AmericaChileChinaColombiaCongoCosta RicaCroatiaCubaCzechoslovakiaDenmarkDominicaDominican RepublicEastern AfricaEastern AsiaEastern EuropeEcuadorEgyptEl SalvadorEnglandEritreaEthiopiaEuropeFijiFranceGermanyGhanaGreeceGrenadaGuatemalaGuyanaHaitiHondurasHong KongHungaryIndiaIndonesiaIranIraqIrelandIsraelItalyJamaicaJapanJordanKazakhstanKenyaKoreaKuwaitLaosLatin AmericaLatviaLebanonLiberiaLithuaniaMalaysiaMexicoMicronesiaMiddle AfricaMoldovaMoroccoNepalNetherlandsNicaraguaNigeriaNorth AmericaNorth MacedoniaNorthern AfricaNorthern EuropeNorwayOceaniaPakistanPanamaPeruPhilippinesPolandPortugalRomaniaRussiaSaudi ArabiaScotlandSenegalSerbiaSierra LeoneSingaporeSomaliaSouth AfricaSouth AmericaSouth Central AsiaSouth Eastern AsiaSouthern EuropeSpainSri LankaSt. Vincent and the GrenadinesSudanSwedenSwitzerlandSyriaTaiwanThailandTrinidad and TobagoUgandaUkraineUruguayUzbekistanVenezuelaVietnamWest IndiesWestern AfricaWestern AsiaWestern EuropeYemenZaireZimbabweAzores
Immigrants from Turkey
Race
Ancestry
AfghanAfricanAlaska NativeAlaskan AthabascanAlbanianAleutAlsatianAmericanApacheArabArapahoArgentineanArmenianAssyrian/Chaldean/SyriacAustralianAustrianBahamianBangladeshiBarbadianBasqueBelgianBelizeanBermudanBhutaneseBlackfeetBolivianBrazilianBritishBritish West IndianBulgarianBurmeseCajunCambodianCanadianCape VerdeanCarpatho RusynCelticCentral AmericanCentral American IndianCherokeeCheyenneChickasawChileanChineseChippewaChoctawColombianColvilleComancheCosta RicanCreeCreekCroatianCrowCubanCypriotCzechCzechoslovakianDanishDelawareDominicanDutchDutch West IndianEastern EuropeanEcuadorianEgyptianEnglishEstonianEthiopianEuropeanFijianFilipinoFinnishFrenchFrench American IndianFrench CanadianGermanGerman RussianGhanaianGreekGuamanian/ChamorroGuatemalanGuyaneseHaitianHmongHonduranHopiHoumaHungarianIcelanderIndian (Asian)IndonesianInupiatIranianIraqiIrishIroquoisIsraeliItalianJamaicanJapaneseJordanianKenyanKiowaKoreanLaotianLatvianLebaneseLiberianLithuanianLumbeeLuxembourgerMacedonianMalaysianMalteseMarshalleseMenomineeMexicanMexican American IndianMongolianMoroccanNative HawaiianNavajoNepaleseNew ZealanderNicaraguanNigerianNorthern EuropeanNorwegianOkinawanOsagePaiutePakistaniPalestinianPanamanianParaguayanPennsylvania GermanPeruvianPimaPolishPortuguesePotawatomiPuebloPuerto RicanPuget Sound SalishRomanianRussianSalvadoranSamoanScandinavianScotch-IrishScottishSeminoleSenegaleseSerbianShoshoneSierra LeoneanSiouxSlavicSlovakSloveneSomaliSouth AfricanSouth AmericanSouth American IndianSoviet UnionSpaniardSpanishSpanish AmericanSpanish American IndianSri LankanSubsaharan AfricanSudaneseSwedishSwissSyrianTaiwaneseThaiTlingit-HaidaTohono O'OdhamTonganTrinidadian and TobagonianTsimshianTurkishU.S. Virgin IslanderUgandanUkrainianUruguayanUteVenezuelanVietnameseWelshWest IndianYakamaYaquiYugoslavianYumanYup'ikZimbabwean
Immigration
NonimmigrantsImmigrantsAfghanistanAfricaAlbaniaArgentinaArmeniaAsiaAustraliaAustriaBahamasBangladeshBarbadosBelarusBelgiumBelizeBoliviaBosnia and HerzegovinaBrazilBulgariaBurma/MyanmarCabo VerdeCambodiaCameroonCanadaCaribbeanCentral AmericaChileChinaColombiaCongoCosta RicaCroatiaCubaCzechoslovakiaDenmarkDominicaDominican RepublicEastern AfricaEastern AsiaEastern EuropeEcuadorEgyptEl SalvadorEnglandEritreaEthiopiaEuropeFijiFranceGermanyGhanaGreeceGrenadaGuatemalaGuyanaHaitiHondurasHong KongHungaryIndiaIndonesiaIranIraqIrelandIsraelItalyJamaicaJapanJordanKazakhstanKenyaKoreaKuwaitLaosLatin AmericaLatviaLebanonLiberiaLithuaniaMalaysiaMexicoMicronesiaMiddle AfricaMoldovaMoroccoNepalNetherlandsNicaraguaNigeriaNorth AmericaNorth MacedoniaNorthern AfricaNorthern EuropeNorwayOceaniaPakistanPanamaPeruPhilippinesPolandPortugalRomaniaRussiaSaudi ArabiaScotlandSenegalSerbiaSierra LeoneSingaporeSomaliaSouth AfricaSouth AmericaSouth Central AsiaSouth Eastern AsiaSouthern EuropeSpainSri LankaSt. Vincent and the GrenadinesSudanSwedenSwitzerlandSyriaTaiwanThailandTrinidad and TobagoTurkeyUgandaUkraineUruguayUzbekistanVenezuelaVietnamWest IndiesWestern AfricaWestern AsiaWestern EuropeYemenZaireZimbabweAzores
Married-couple Households
Income
Poverty
Unemployment
Labor Participation
Family Structure
Vehicle Availability
Education Level
Disability

Married-couple Households Comparison

Ottawa

Immigrants from Turkey

Poor
Good
45.8%
MARRIED-COUPLE HOUSEHOLDS
19.4/ 100
METRIC RATING
198th/ 347
METRIC RANK
46.8%
MARRIED-COUPLE HOUSEHOLDS
70.2/ 100
METRIC RATING
163rd/ 347
METRIC RANK

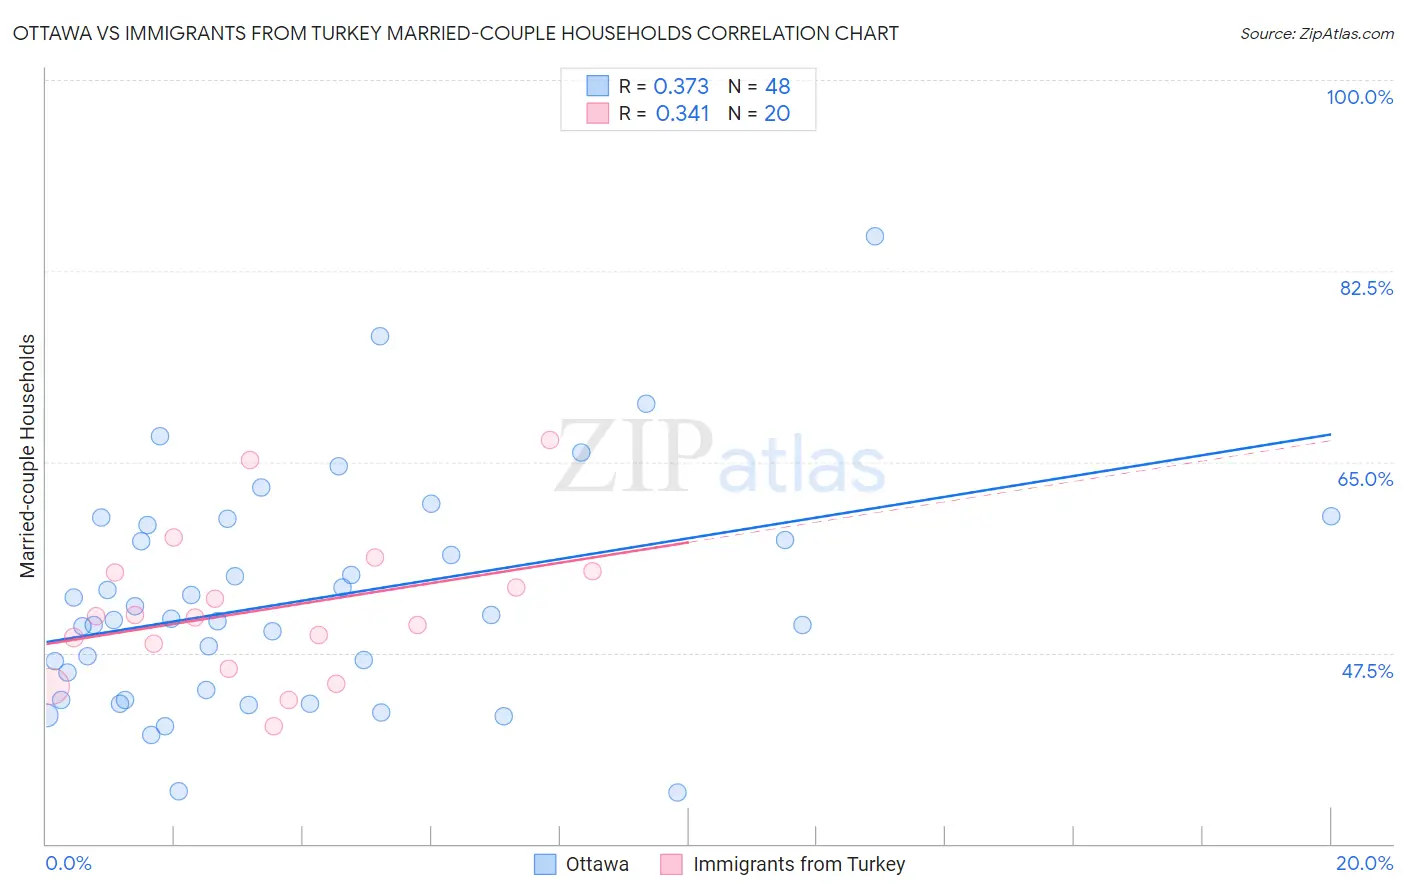
Ottawa vs Immigrants from Turkey Married-couple Households Correlation Chart

The statistical analysis conducted on geographies consisting of 49,944,544 people shows a mild positive correlation between the proportion of Ottawa and percentage of married-couple family households in the United States with a correlation coefficient (R) of 0.373 and weighted average of 45.8%. Similarly, the statistical analysis conducted on geographies consisting of 222,970,695 people shows a mild positive correlation between the proportion of Immigrants from Turkey and percentage of married-couple family households in the United States with a correlation coefficient (R) of 0.341 and weighted average of 46.8%, a difference of 2.2%.
Ottawa vs Immigrants from Turkey Married-couple Households

Married-couple Households Correlation Summary

MeasurementOttawaImmigrants from Turkey
Minimum34.7%40.7%
Maximum85.7%67.0%
Range51.0%26.2%
Mean52.3%51.5%
Median50.5%50.8%
Interquartile 25% (IQ1)43.7%47.2%
Interquartile 75% (IQ3)58.6%54.9%
Interquartile Range (IQR)14.9%7.7%
Standard Deviation (Sample)10.3%6.7%
Standard Deviation (Population)10.2%6.6%

Similar Demographics by Married-couple Households

Demographics Similar to Ottawa by Married-couple Households

In terms of married-couple households, the demographic groups most similar to Ottawa are Cambodian (45.9%, a difference of 0.11%), Immigrants from South America (45.9%, a difference of 0.16%), Chickasaw (45.9%, a difference of 0.19%), Mexican American Indian (45.9%, a difference of 0.22%), and Taiwanese (45.9%, a difference of 0.23%).
DemographicsRating | RankMarried-couple Households
Choctaw
24.9
/100
|
#191
Fair
46.0%
Immigrants | Northern Africa
24.6
/100
|
#192
Fair
46.0%
Taiwanese
23.4
/100
|
#193
Fair
45.9%
Mexican American Indians
23.3
/100
|
#194
Fair
45.9%
Chickasaw
22.7
/100
|
#195
Fair
45.9%
Immigrants | South America
22.2
/100
|
#196
Fair
45.9%
Cambodians
21.3
/100
|
#197
Fair
45.9%
Ottawa
19.4
/100
|
#198
Poor
45.8%
Carpatho Rusyns
15.7
/100
|
#199
Poor
45.7%
Potawatomi
15.6
/100
|
#200
Poor
45.7%
Immigrants | Serbia
15.2
/100
|
#201
Poor
45.7%
Immigrants | Central America
14.2
/100
|
#202
Poor
45.7%
Alaska Natives
13.0
/100
|
#203
Poor
45.6%
Aleuts
12.5
/100
|
#204
Poor
45.6%
Nepalese
11.9
/100
|
#205
Poor
45.6%

Demographics Similar to Immigrants from Turkey by Married-couple Households

In terms of married-couple households, the demographic groups most similar to Immigrants from Turkey are Immigrants from Kazakhstan (46.8%, a difference of 0.010%), Immigrants from Southern Europe (46.8%, a difference of 0.010%), Delaware (46.8%, a difference of 0.040%), Colombian (46.8%, a difference of 0.040%), and Iraqi (46.9%, a difference of 0.070%).
DemographicsRating | RankMarried-couple Households
Armenians
75.4
/100
|
#156
Good
46.9%
Immigrants | Oceania
74.8
/100
|
#157
Good
46.9%
Immigrants | Nonimmigrants
73.3
/100
|
#158
Good
46.9%
Osage
73.2
/100
|
#159
Good
46.9%
Iraqis
71.7
/100
|
#160
Good
46.9%
Delaware
71.2
/100
|
#161
Good
46.8%
Colombians
71.0
/100
|
#162
Good
46.8%
Immigrants | Turkey
70.2
/100
|
#163
Good
46.8%
Immigrants | Kazakhstan
70.0
/100
|
#164
Good
46.8%
Immigrants | Southern Europe
69.9
/100
|
#165
Good
46.8%
Cherokee
65.7
/100
|
#166
Good
46.7%
Immigrants | Croatia
64.2
/100
|
#167
Good
46.7%
Israelis
62.3
/100
|
#168
Good
46.7%
Spanish American Indians
59.4
/100
|
#169
Average
46.6%
South Americans
58.0
/100
|
#170
Average
46.6%