Immigrants from Denmark vs Immigrants from Cuba Births to Unmarried Women

COMPARE

Immigrants from Denmark
Race
Ancestry
AfghanAfricanAlaska NativeAlaskan AthabascanAlbanianAleutAlsatianAmericanApacheArabArapahoArgentineanArmenianAssyrian/Chaldean/SyriacAustralianAustrianBahamianBangladeshiBarbadianBasqueBelgianBelizeanBermudanBhutaneseBlackfeetBolivianBrazilianBritishBritish West IndianBulgarianBurmeseCajunCambodianCanadianCape VerdeanCarpatho RusynCelticCentral AmericanCentral American IndianCherokeeCheyenneChickasawChileanChineseChippewaChoctawColombianColvilleComancheCosta RicanCreeCreekCroatianCrowCubanCypriotCzechCzechoslovakianDanishDelawareDominicanDutchDutch West IndianEastern EuropeanEcuadorianEgyptianEnglishEstonianEthiopianEuropeanFijianFilipinoFinnishFrenchFrench American IndianFrench CanadianGermanGerman RussianGhanaianGreekGuamanian/ChamorroGuatemalanGuyaneseHaitianHmongHonduranHopiHoumaHungarianIcelanderIndian (Asian)IndonesianInupiatIranianIraqiIrishIroquoisIsraeliItalianJamaicanJapaneseJordanianKenyanKiowaKoreanLaotianLatvianLebaneseLiberianLithuanianLumbeeLuxembourgerMacedonianMalaysianMalteseMarshalleseMenomineeMexicanMexican American IndianMongolianMoroccanNative HawaiianNavajoNepaleseNew ZealanderNicaraguanNigerianNorthern EuropeanNorwegianOkinawanOsageOttawaPaiutePakistaniPalestinianPanamanianParaguayanPennsylvania GermanPeruvianPimaPolishPortuguesePotawatomiPuebloPuerto RicanPuget Sound SalishRomanianRussianSalvadoranSamoanScandinavianScotch-IrishScottishSeminoleSenegaleseSerbianShoshoneSierra LeoneanSiouxSlavicSlovakSloveneSomaliSouth AfricanSouth AmericanSouth American IndianSoviet UnionSpaniardSpanishSpanish AmericanSpanish American IndianSri LankanSubsaharan AfricanSudaneseSwedishSwissSyrianTaiwaneseThaiTlingit-HaidaTohono O'OdhamTonganTrinidadian and TobagonianTsimshianTurkishU.S. Virgin IslanderUgandanUkrainianUruguayanUteVenezuelanVietnameseWelshWest IndianYakamaYaquiYugoslavianYumanYup'ikZimbabwean
Immigration
NonimmigrantsImmigrantsAfghanistanAfricaAlbaniaArgentinaArmeniaAsiaAustraliaAustriaBahamasBangladeshBarbadosBelarusBelgiumBelizeBoliviaBosnia and HerzegovinaBrazilBulgariaBurma/MyanmarCabo VerdeCambodiaCameroonCanadaCaribbeanCentral AmericaChileChinaColombiaCongoCosta RicaCroatiaCzechoslovakiaDenmarkDominicaDominican RepublicEastern AfricaEastern AsiaEastern EuropeEcuadorEgyptEl SalvadorEnglandEritreaEthiopiaEuropeFijiFranceGermanyGhanaGreeceGrenadaGuatemalaGuyanaHaitiHondurasHong KongHungaryIndiaIndonesiaIranIraqIrelandIsraelItalyJamaicaJapanJordanKazakhstanKenyaKoreaKuwaitLaosLatin AmericaLatviaLebanonLiberiaLithuaniaMalaysiaMexicoMicronesiaMiddle AfricaMoldovaMoroccoNepalNetherlandsNicaraguaNigeriaNorth AmericaNorth MacedoniaNorthern AfricaNorthern EuropeNorwayOceaniaPakistanPanamaPeruPhilippinesPolandPortugalRomaniaRussiaSaudi ArabiaScotlandSenegalSerbiaSierra LeoneSingaporeSomaliaSouth AfricaSouth AmericaSouth Central AsiaSouth Eastern AsiaSouthern EuropeSpainSri LankaSt. Vincent and the GrenadinesSudanSwedenSwitzerlandSyriaTaiwanThailandTrinidad and TobagoTurkeyUgandaUkraineUruguayUzbekistanVenezuelaVietnamWest IndiesWestern AfricaWestern AsiaWestern EuropeYemenZaireZimbabweAzores
Immigrants from Cuba
Race
Ancestry
AfghanAfricanAlaska NativeAlaskan AthabascanAlbanianAleutAlsatianAmericanApacheArabArapahoArgentineanArmenianAssyrian/Chaldean/SyriacAustralianAustrianBahamianBangladeshiBarbadianBasqueBelgianBelizeanBermudanBhutaneseBlackfeetBolivianBrazilianBritishBritish West IndianBulgarianBurmeseCajunCambodianCanadianCape VerdeanCarpatho RusynCelticCentral AmericanCentral American IndianCherokeeCheyenneChickasawChileanChineseChippewaChoctawColombianColvilleComancheCosta RicanCreeCreekCroatianCrowCubanCypriotCzechCzechoslovakianDanishDelawareDominicanDutchDutch West IndianEastern EuropeanEcuadorianEgyptianEnglishEstonianEthiopianEuropeanFijianFilipinoFinnishFrenchFrench American IndianFrench CanadianGermanGerman RussianGhanaianGreekGuamanian/ChamorroGuatemalanGuyaneseHaitianHmongHonduranHopiHoumaHungarianIcelanderIndian (Asian)IndonesianInupiatIranianIraqiIrishIroquoisIsraeliItalianJamaicanJapaneseJordanianKenyanKiowaKoreanLaotianLatvianLebaneseLiberianLithuanianLumbeeLuxembourgerMacedonianMalaysianMalteseMarshalleseMenomineeMexicanMexican American IndianMongolianMoroccanNative HawaiianNavajoNepaleseNew ZealanderNicaraguanNigerianNorthern EuropeanNorwegianOkinawanOsageOttawaPaiutePakistaniPalestinianPanamanianParaguayanPennsylvania GermanPeruvianPimaPolishPortuguesePotawatomiPuebloPuerto RicanPuget Sound SalishRomanianRussianSalvadoranSamoanScandinavianScotch-IrishScottishSeminoleSenegaleseSerbianShoshoneSierra LeoneanSiouxSlavicSlovakSloveneSomaliSouth AfricanSouth AmericanSouth American IndianSoviet UnionSpaniardSpanishSpanish AmericanSpanish American IndianSri LankanSubsaharan AfricanSudaneseSwedishSwissSyrianTaiwaneseThaiTlingit-HaidaTohono O'OdhamTonganTrinidadian and TobagonianTsimshianTurkishU.S. Virgin IslanderUgandanUkrainianUruguayanUteVenezuelanVietnameseWelshWest IndianYakamaYaquiYugoslavianYumanYup'ikZimbabwean
Immigration
NonimmigrantsImmigrantsAfghanistanAfricaAlbaniaArgentinaArmeniaAsiaAustraliaAustriaBahamasBangladeshBarbadosBelarusBelgiumBelizeBoliviaBosnia and HerzegovinaBrazilBulgariaBurma/MyanmarCabo VerdeCambodiaCameroonCanadaCaribbeanCentral AmericaChileChinaColombiaCongoCosta RicaCroatiaCubaCzechoslovakiaDominicaDominican RepublicEastern AfricaEastern AsiaEastern EuropeEcuadorEgyptEl SalvadorEnglandEritreaEthiopiaEuropeFijiFranceGermanyGhanaGreeceGrenadaGuatemalaGuyanaHaitiHondurasHong KongHungaryIndiaIndonesiaIranIraqIrelandIsraelItalyJamaicaJapanJordanKazakhstanKenyaKoreaKuwaitLaosLatin AmericaLatviaLebanonLiberiaLithuaniaMalaysiaMexicoMicronesiaMiddle AfricaMoldovaMoroccoNepalNetherlandsNicaraguaNigeriaNorth AmericaNorth MacedoniaNorthern AfricaNorthern EuropeNorwayOceaniaPakistanPanamaPeruPhilippinesPolandPortugalRomaniaRussiaSaudi ArabiaScotlandSenegalSerbiaSierra LeoneSingaporeSomaliaSouth AfricaSouth AmericaSouth Central AsiaSouth Eastern AsiaSouthern EuropeSpainSri LankaSt. Vincent and the GrenadinesSudanSwedenSwitzerlandSyriaTaiwanThailandTrinidad and TobagoTurkeyUgandaUkraineUruguayUzbekistanVenezuelaVietnamWest IndiesWestern AfricaWestern AsiaWestern EuropeYemenZaireZimbabweAzores
Births to Unmarried Women
Income
Poverty
Unemployment
Labor Participation
Family Structure
Vehicle Availability
Education Level
Disability

Births to Unmarried Women Comparison

Immigrants from Denmark

Immigrants from Cuba

Exceptional
Tragic
29.4%
BIRTHS TO UNMARRIED WOMEN
95.3/ 100
METRIC RATING
99th/ 347
METRIC RANK
41.5%
BIRTHS TO UNMARRIED WOMEN
0.0/ 100
METRIC RATING
326th/ 347
METRIC RANK

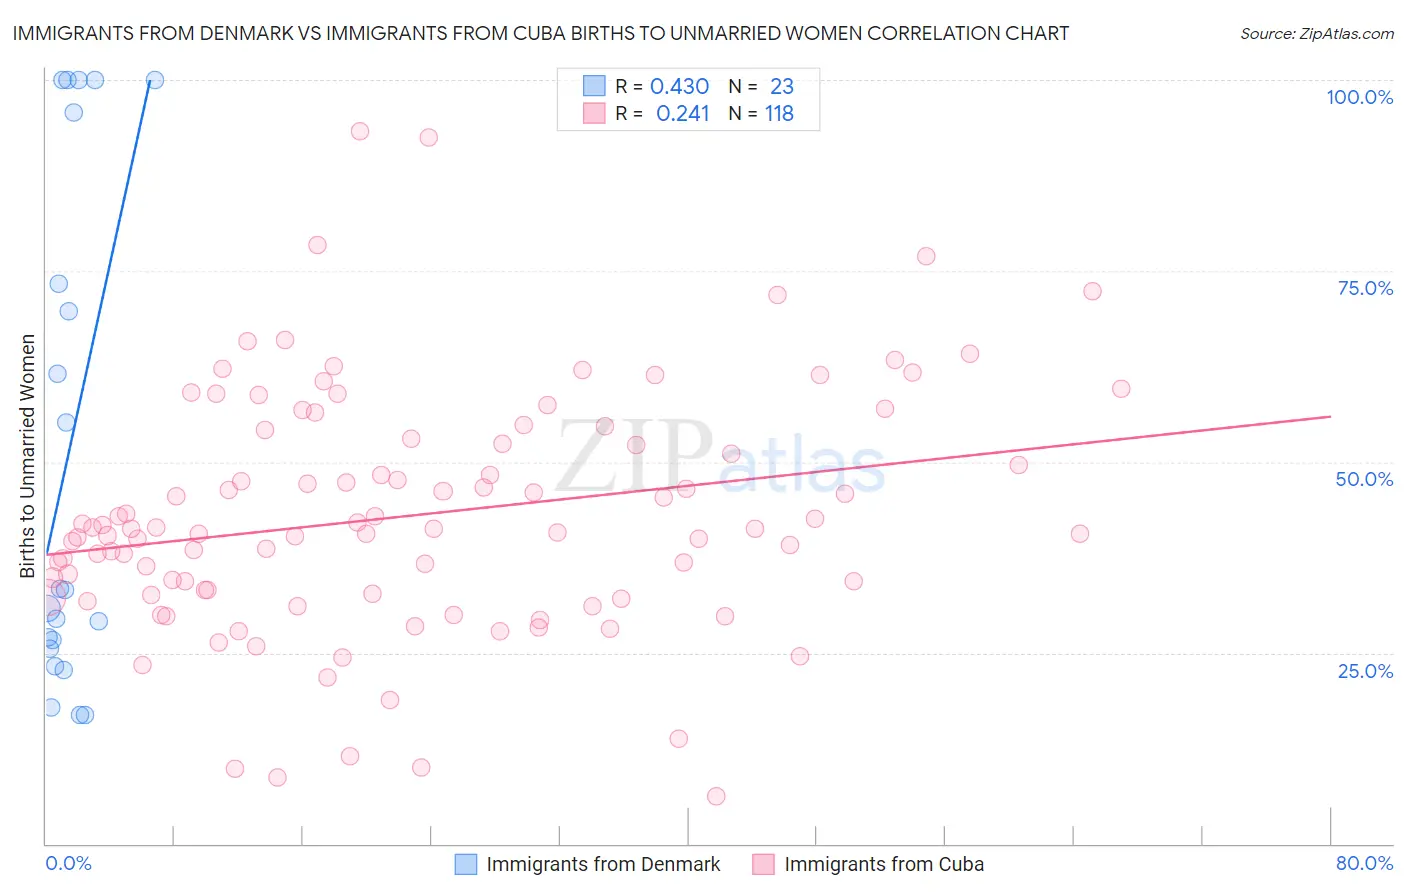
Immigrants from Denmark vs Immigrants from Cuba Births to Unmarried Women Correlation Chart

The statistical analysis conducted on geographies consisting of 130,476,189 people shows a moderate positive correlation between the proportion of Immigrants from Denmark and percentage of births to unmarried women in the United States with a correlation coefficient (R) of 0.430 and weighted average of 29.4%. Similarly, the statistical analysis conducted on geographies consisting of 308,833,039 people shows a weak positive correlation between the proportion of Immigrants from Cuba and percentage of births to unmarried women in the United States with a correlation coefficient (R) of 0.241 and weighted average of 41.5%, a difference of 40.9%.
Immigrants from Denmark vs Immigrants from Cuba Births to Unmarried Women

Births to Unmarried Women Correlation Summary

MeasurementImmigrants from DenmarkImmigrants from Cuba
Minimum16.9%6.3%
Maximum100.0%93.3%
Range83.1%87.0%
Mean51.7%43.0%
Median33.3%41.2%
Interquartile 25% (IQ1)25.6%32.8%
Interquartile 75% (IQ3)95.7%53.1%
Interquartile Range (IQR)70.1%20.3%
Standard Deviation (Sample)32.9%15.9%
Standard Deviation (Population)32.1%15.8%

Similar Demographics by Births to Unmarried Women

Demographics Similar to Immigrants from Denmark by Births to Unmarried Women

In terms of births to unmarried women, the demographic groups most similar to Immigrants from Denmark are Luxembourger (29.4%, a difference of 0.0%), Immigrants from Syria (29.4%, a difference of 0.24%), Immigrants from South Africa (29.3%, a difference of 0.26%), Immigrants from Northern Africa (29.5%, a difference of 0.29%), and Norwegian (29.3%, a difference of 0.30%).
DemographicsRating | RankBirths to Unmarried Women
Arabs
96.5
/100
|
#92
Exceptional
29.2%
Estonians
96.5
/100
|
#93
Exceptional
29.2%
Ukrainians
96.3
/100
|
#94
Exceptional
29.2%
Immigrants | Vietnam
96.1
/100
|
#95
Exceptional
29.3%
Norwegians
95.8
/100
|
#96
Exceptional
29.3%
Immigrants | South Africa
95.7
/100
|
#97
Exceptional
29.3%
Immigrants | Syria
95.7
/100
|
#98
Exceptional
29.4%
Immigrants | Denmark
95.3
/100
|
#99
Exceptional
29.4%
Luxembourgers
95.2
/100
|
#100
Exceptional
29.4%
Immigrants | Northern Africa
94.7
/100
|
#101
Exceptional
29.5%
Australians
94.6
/100
|
#102
Exceptional
29.5%
Lebanese
94.4
/100
|
#103
Exceptional
29.5%
Lithuanians
94.4
/100
|
#104
Exceptional
29.6%
Immigrants | Nepal
94.3
/100
|
#105
Exceptional
29.6%
Swedes
93.8
/100
|
#106
Exceptional
29.6%

Demographics Similar to Immigrants from Cuba by Births to Unmarried Women

In terms of births to unmarried women, the demographic groups most similar to Immigrants from Cuba are Cheyenne (41.3%, a difference of 0.27%), Cape Verdean (41.3%, a difference of 0.33%), Sioux (41.0%, a difference of 1.1%), Cajun (41.0%, a difference of 1.2%), and Tsimshian (42.2%, a difference of 1.7%).
DemographicsRating | RankBirths to Unmarried Women
Yakama
0.0
/100
|
#319
Tragic
40.3%
Crow
0.0
/100
|
#320
Tragic
40.4%
Bahamians
0.0
/100
|
#321
Tragic
40.8%
Cajuns
0.0
/100
|
#322
Tragic
41.0%
Sioux
0.0
/100
|
#323
Tragic
41.0%
Cape Verdeans
0.0
/100
|
#324
Tragic
41.3%
Cheyenne
0.0
/100
|
#325
Tragic
41.3%
Immigrants | Cuba
0.0
/100
|
#326
Tragic
41.5%
Tsimshian
0.0
/100
|
#327
Tragic
42.2%
Immigrants | Cabo Verde
0.0
/100
|
#328
Tragic
42.2%
Paiute
0.0
/100
|
#329
Tragic
42.5%
Chippewa
0.0
/100
|
#330
Tragic
42.6%
Natives/Alaskans
0.0
/100
|
#331
Tragic
43.0%
Kiowa
0.0
/100
|
#332
Tragic
43.1%
Blacks/African Americans
0.0
/100
|
#333
Tragic
44.3%