Immigrants from Denmark vs Immigrants from Greece Births to Unmarried Women
COMPARE
Immigrants from Denmark
Immigrants from Greece
Births to Unmarried Women
Births to Unmarried Women Comparison
Immigrants from Denmark
Immigrants from Greece
29.4%
BIRTHS TO UNMARRIED WOMEN
95.3/ 100
METRIC RATING
99th/ 347
METRIC RANK
27.8%
BIRTHS TO UNMARRIED WOMEN
99.4/ 100
METRIC RATING
49th/ 347
METRIC RANK
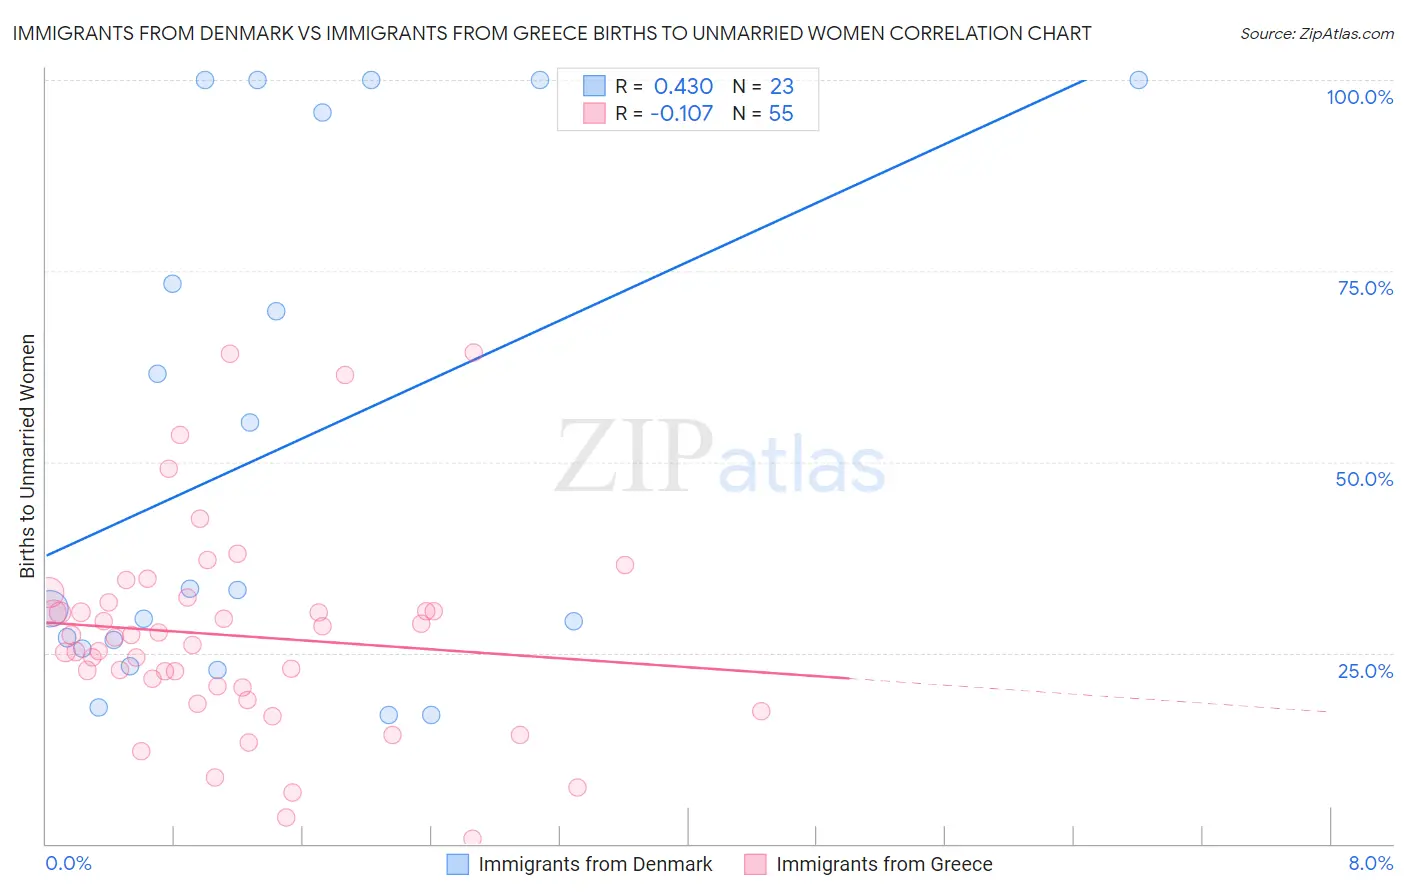
Immigrants from Denmark vs Immigrants from Greece Births to Unmarried Women Correlation Chart
The statistical analysis conducted on geographies consisting of 130,476,189 people shows a moderate positive correlation between the proportion of Immigrants from Denmark and percentage of births to unmarried women in the United States with a correlation coefficient (R) of 0.430 and weighted average of 29.4%. Similarly, the statistical analysis conducted on geographies consisting of 203,732,129 people shows a poor negative correlation between the proportion of Immigrants from Greece and percentage of births to unmarried women in the United States with a correlation coefficient (R) of -0.107 and weighted average of 27.8%, a difference of 5.9%.
Births to Unmarried Women Correlation Summary
| Measurement | Immigrants from Denmark | Immigrants from Greece |
| Minimum | 16.9% | 0.70% |
| Maximum | 100.0% | 64.4% |
| Range | 83.1% | 63.7% |
| Mean | 51.7% | 27.2% |
| Median | 33.3% | 27.1% |
| Interquartile 25% (IQ1) | 25.6% | 20.5% |
| Interquartile 75% (IQ3) | 95.7% | 31.6% |
| Interquartile Range (IQR) | 70.1% | 11.1% |
| Standard Deviation (Sample) | 32.9% | 13.4% |
| Standard Deviation (Population) | 32.1% | 13.3% |
Similar Demographics by Births to Unmarried Women
Demographics Similar to Immigrants from Denmark by Births to Unmarried Women
In terms of births to unmarried women, the demographic groups most similar to Immigrants from Denmark are Luxembourger (29.4%, a difference of 0.0%), Immigrants from Syria (29.4%, a difference of 0.24%), Immigrants from South Africa (29.3%, a difference of 0.26%), Immigrants from Northern Africa (29.5%, a difference of 0.29%), and Norwegian (29.3%, a difference of 0.30%).
| Demographics | Rating | Rank | Births to Unmarried Women |
| Arabs | 96.5 /100 | #92 | Exceptional 29.2% |
| Estonians | 96.5 /100 | #93 | Exceptional 29.2% |
| Ukrainians | 96.3 /100 | #94 | Exceptional 29.2% |
| Immigrants | Vietnam | 96.1 /100 | #95 | Exceptional 29.3% |
| Norwegians | 95.8 /100 | #96 | Exceptional 29.3% |
| Immigrants | South Africa | 95.7 /100 | #97 | Exceptional 29.3% |
| Immigrants | Syria | 95.7 /100 | #98 | Exceptional 29.4% |
| Immigrants | Denmark | 95.3 /100 | #99 | Exceptional 29.4% |
| Luxembourgers | 95.2 /100 | #100 | Exceptional 29.4% |
| Immigrants | Northern Africa | 94.7 /100 | #101 | Exceptional 29.5% |
| Australians | 94.6 /100 | #102 | Exceptional 29.5% |
| Lebanese | 94.4 /100 | #103 | Exceptional 29.5% |
| Lithuanians | 94.4 /100 | #104 | Exceptional 29.6% |
| Immigrants | Nepal | 94.3 /100 | #105 | Exceptional 29.6% |
| Swedes | 93.8 /100 | #106 | Exceptional 29.6% |
Demographics Similar to Immigrants from Greece by Births to Unmarried Women
In terms of births to unmarried women, the demographic groups most similar to Immigrants from Greece are Maltese (27.8%, a difference of 0.12%), Eastern European (27.7%, a difference of 0.19%), Immigrants from Lithuania (27.7%, a difference of 0.20%), Hmong (27.7%, a difference of 0.20%), and Latvian (27.7%, a difference of 0.24%).
| Demographics | Rating | Rank | Births to Unmarried Women |
| Immigrants | Eastern Europe | 99.6 /100 | #42 | Exceptional 27.6% |
| Immigrants | Bulgaria | 99.6 /100 | #43 | Exceptional 27.6% |
| Immigrants | Indonesia | 99.5 /100 | #44 | Exceptional 27.7% |
| Latvians | 99.5 /100 | #45 | Exceptional 27.7% |
| Immigrants | Lithuania | 99.5 /100 | #46 | Exceptional 27.7% |
| Hmong | 99.5 /100 | #47 | Exceptional 27.7% |
| Eastern Europeans | 99.5 /100 | #48 | Exceptional 27.7% |
| Immigrants | Greece | 99.4 /100 | #49 | Exceptional 27.8% |
| Maltese | 99.4 /100 | #50 | Exceptional 27.8% |
| Macedonians | 99.4 /100 | #51 | Exceptional 27.9% |
| Bhutanese | 99.4 /100 | #52 | Exceptional 27.9% |
| Immigrants | Romania | 99.4 /100 | #53 | Exceptional 27.9% |
| Afghans | 99.4 /100 | #54 | Exceptional 27.9% |
| Mongolians | 99.3 /100 | #55 | Exceptional 27.9% |
| Immigrants | Belgium | 99.3 /100 | #56 | Exceptional 28.0% |