Immigrants from Uruguay vs Immigrants from Cuba Births to Unmarried Women
COMPARE
Immigrants from Uruguay
Immigrants from Cuba
Births to Unmarried Women
Births to Unmarried Women Comparison
Immigrants from Uruguay
Immigrants from Cuba
33.9%
BIRTHS TO UNMARRIED WOMEN
4.8/ 100
METRIC RATING
222nd/ 347
METRIC RANK
41.5%
BIRTHS TO UNMARRIED WOMEN
0.0/ 100
METRIC RATING
326th/ 347
METRIC RANK
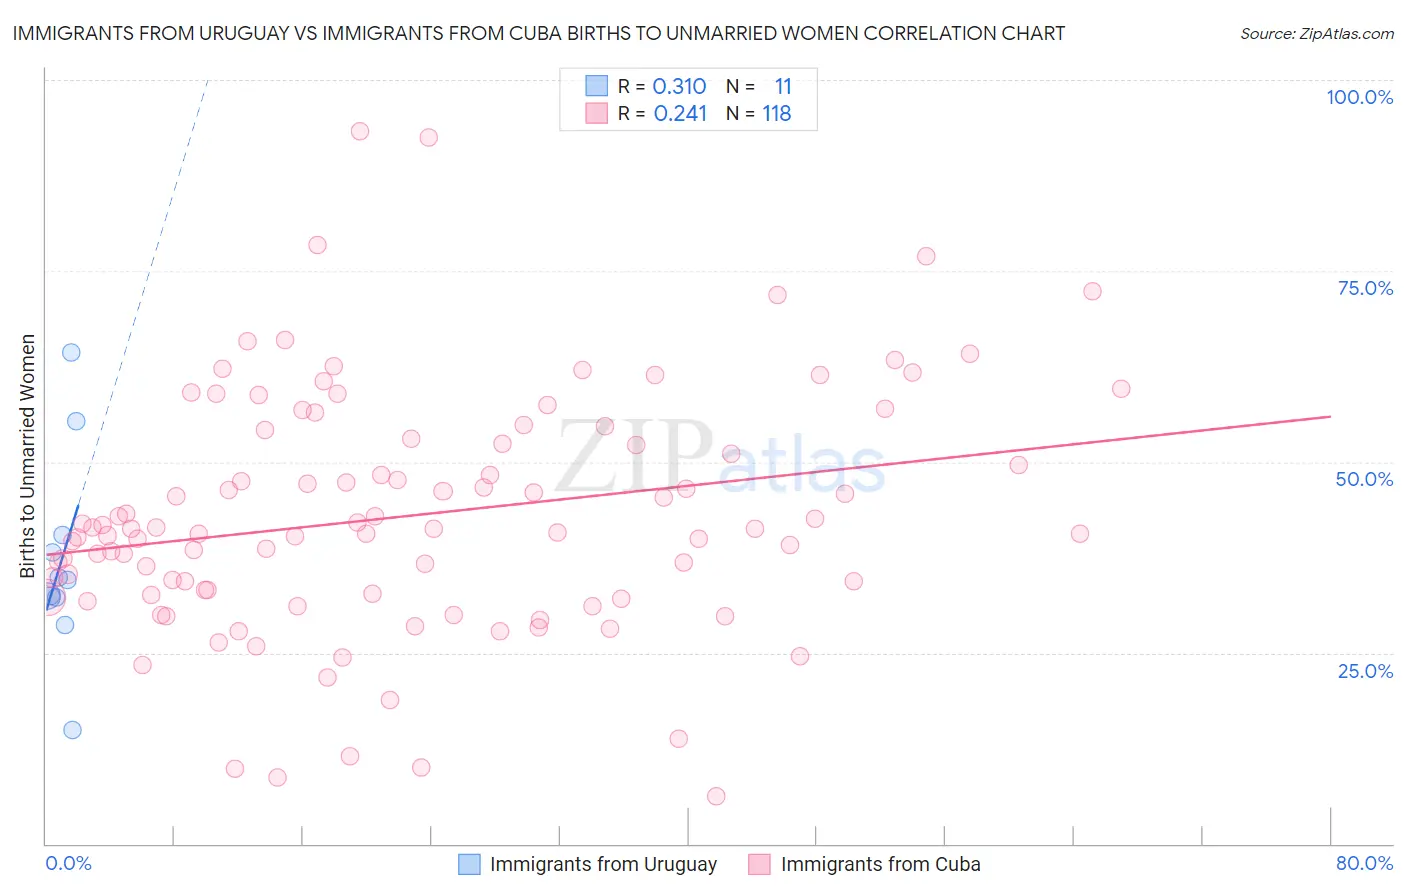
Immigrants from Uruguay vs Immigrants from Cuba Births to Unmarried Women Correlation Chart
The statistical analysis conducted on geographies consisting of 129,349,421 people shows a mild positive correlation between the proportion of Immigrants from Uruguay and percentage of births to unmarried women in the United States with a correlation coefficient (R) of 0.310 and weighted average of 33.9%. Similarly, the statistical analysis conducted on geographies consisting of 308,833,039 people shows a weak positive correlation between the proportion of Immigrants from Cuba and percentage of births to unmarried women in the United States with a correlation coefficient (R) of 0.241 and weighted average of 41.5%, a difference of 22.3%.
Births to Unmarried Women Correlation Summary
| Measurement | Immigrants from Uruguay | Immigrants from Cuba |
| Minimum | 14.9% | 6.3% |
| Maximum | 64.3% | 93.3% |
| Range | 49.4% | 87.0% |
| Mean | 37.1% | 43.0% |
| Median | 34.5% | 41.2% |
| Interquartile 25% (IQ1) | 32.2% | 32.8% |
| Interquartile 75% (IQ3) | 40.5% | 53.1% |
| Interquartile Range (IQR) | 8.2% | 20.3% |
| Standard Deviation (Sample) | 13.1% | 15.9% |
| Standard Deviation (Population) | 12.5% | 15.8% |
Similar Demographics by Births to Unmarried Women
Demographics Similar to Immigrants from Uruguay by Births to Unmarried Women
In terms of births to unmarried women, the demographic groups most similar to Immigrants from Uruguay are Malaysian (33.9%, a difference of 0.060%), Portuguese (33.8%, a difference of 0.24%), Alsatian (33.8%, a difference of 0.26%), Pennsylvania German (34.0%, a difference of 0.29%), and Immigrants from Laos (34.0%, a difference of 0.29%).
| Demographics | Rating | Rank | Births to Unmarried Women |
| French | 8.7 /100 | #215 | Tragic 33.4% |
| Nepalese | 7.8 /100 | #216 | Tragic 33.5% |
| Spaniards | 7.0 /100 | #217 | Tragic 33.6% |
| Immigrants | Ecuador | 5.9 /100 | #218 | Tragic 33.7% |
| Alsatians | 5.4 /100 | #219 | Tragic 33.8% |
| Portuguese | 5.4 /100 | #220 | Tragic 33.8% |
| Malaysians | 5.0 /100 | #221 | Tragic 33.9% |
| Immigrants | Uruguay | 4.8 /100 | #222 | Tragic 33.9% |
| Pennsylvania Germans | 4.3 /100 | #223 | Tragic 34.0% |
| Immigrants | Laos | 4.3 /100 | #224 | Tragic 34.0% |
| Spanish | 4.0 /100 | #225 | Tragic 34.1% |
| Delaware | 3.3 /100 | #226 | Tragic 34.2% |
| Immigrants | Panama | 3.3 /100 | #227 | Tragic 34.2% |
| Panamanians | 3.3 /100 | #228 | Tragic 34.2% |
| Immigrants | Sierra Leone | 3.1 /100 | #229 | Tragic 34.2% |
Demographics Similar to Immigrants from Cuba by Births to Unmarried Women
In terms of births to unmarried women, the demographic groups most similar to Immigrants from Cuba are Cheyenne (41.3%, a difference of 0.27%), Cape Verdean (41.3%, a difference of 0.33%), Sioux (41.0%, a difference of 1.1%), Cajun (41.0%, a difference of 1.2%), and Tsimshian (42.2%, a difference of 1.7%).
| Demographics | Rating | Rank | Births to Unmarried Women |
| Yakama | 0.0 /100 | #319 | Tragic 40.3% |
| Crow | 0.0 /100 | #320 | Tragic 40.4% |
| Bahamians | 0.0 /100 | #321 | Tragic 40.8% |
| Cajuns | 0.0 /100 | #322 | Tragic 41.0% |
| Sioux | 0.0 /100 | #323 | Tragic 41.0% |
| Cape Verdeans | 0.0 /100 | #324 | Tragic 41.3% |
| Cheyenne | 0.0 /100 | #325 | Tragic 41.3% |
| Immigrants | Cuba | 0.0 /100 | #326 | Tragic 41.5% |
| Tsimshian | 0.0 /100 | #327 | Tragic 42.2% |
| Immigrants | Cabo Verde | 0.0 /100 | #328 | Tragic 42.2% |
| Paiute | 0.0 /100 | #329 | Tragic 42.5% |
| Chippewa | 0.0 /100 | #330 | Tragic 42.6% |
| Natives/Alaskans | 0.0 /100 | #331 | Tragic 43.0% |
| Kiowa | 0.0 /100 | #332 | Tragic 43.1% |
| Blacks/African Americans | 0.0 /100 | #333 | Tragic 44.3% |