Immigrants from Costa Rica vs Immigrants from West Indies Married-couple Households
COMPARE
Immigrants from Costa Rica
Immigrants from West Indies
Married-couple Households
Married-couple Households Comparison
Immigrants from Costa Rica
Immigrants from West Indies
46.3%
MARRIED-COUPLE HOUSEHOLDS
43.4/ 100
METRIC RATING
178th/ 347
METRIC RANK
39.0%
MARRIED-COUPLE HOUSEHOLDS
0.0/ 100
METRIC RATING
333rd/ 347
METRIC RANK
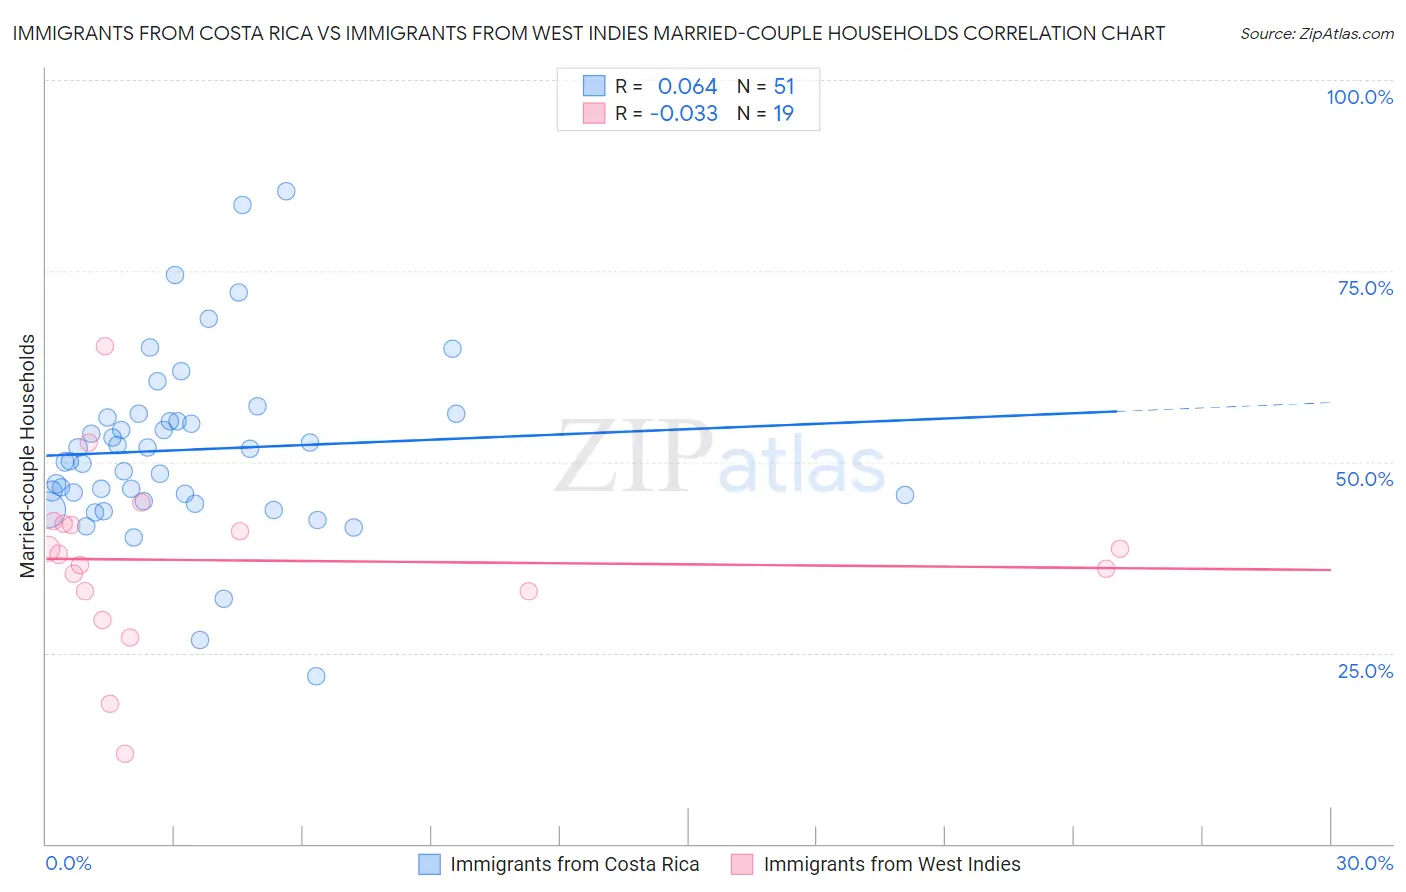
Immigrants from Costa Rica vs Immigrants from West Indies Married-couple Households Correlation Chart
The statistical analysis conducted on geographies consisting of 204,236,260 people shows a slight positive correlation between the proportion of Immigrants from Costa Rica and percentage of married-couple family households in the United States with a correlation coefficient (R) of 0.064 and weighted average of 46.3%. Similarly, the statistical analysis conducted on geographies consisting of 72,454,628 people shows no correlation between the proportion of Immigrants from West Indies and percentage of married-couple family households in the United States with a correlation coefficient (R) of -0.033 and weighted average of 39.0%, a difference of 18.8%.
Married-couple Households Correlation Summary
| Measurement | Immigrants from Costa Rica | Immigrants from West Indies |
| Minimum | 21.9% | 11.8% |
| Maximum | 85.4% | 65.1% |
| Range | 63.5% | 53.3% |
| Mean | 51.6% | 37.1% |
| Median | 50.0% | 37.9% |
| Interquartile 25% (IQ1) | 44.9% | 33.1% |
| Interquartile 75% (IQ3) | 55.9% | 41.9% |
| Interquartile Range (IQR) | 11.0% | 8.8% |
| Standard Deviation (Sample) | 11.8% | 11.5% |
| Standard Deviation (Population) | 11.7% | 11.1% |
Similar Demographics by Married-couple Households
Demographics Similar to Immigrants from Costa Rica by Married-couple Households
In terms of married-couple households, the demographic groups most similar to Immigrants from Costa Rica are Immigrants from Zimbabwe (46.3%, a difference of 0.010%), Immigrants (46.3%, a difference of 0.020%), Mongolian (46.3%, a difference of 0.050%), Malaysian (46.3%, a difference of 0.060%), and Cajun (46.4%, a difference of 0.070%).
| Demographics | Rating | Rank | Married-couple Households |
| Immigrants | Chile | 55.7 /100 | #171 | Average 46.5% |
| Immigrants | Australia | 54.6 /100 | #172 | Average 46.5% |
| Immigrants | Norway | 52.0 /100 | #173 | Average 46.5% |
| Immigrants | Mexico | 50.0 /100 | #174 | Average 46.4% |
| Immigrants | Colombia | 46.1 /100 | #175 | Average 46.4% |
| Cajuns | 45.2 /100 | #176 | Average 46.4% |
| Immigrants | Immigrants | 43.8 /100 | #177 | Average 46.3% |
| Immigrants | Costa Rica | 43.4 /100 | #178 | Average 46.3% |
| Immigrants | Zimbabwe | 43.0 /100 | #179 | Average 46.3% |
| Mongolians | 42.0 /100 | #180 | Average 46.3% |
| Malaysians | 41.8 /100 | #181 | Average 46.3% |
| Yugoslavians | 38.9 /100 | #182 | Fair 46.2% |
| Immigrants | Brazil | 38.3 /100 | #183 | Fair 46.2% |
| Immigrants | Switzerland | 36.9 /100 | #184 | Fair 46.2% |
| Brazilians | 35.9 /100 | #185 | Fair 46.2% |
Demographics Similar to Immigrants from West Indies by Married-couple Households
In terms of married-couple households, the demographic groups most similar to Immigrants from West Indies are Somali (39.0%, a difference of 0.030%), Immigrants from Congo (39.0%, a difference of 0.12%), Immigrants from Barbados (39.2%, a difference of 0.56%), Immigrants from St. Vincent and the Grenadines (38.7%, a difference of 0.78%), and Immigrants from Dominica (39.4%, a difference of 1.0%).
| Demographics | Rating | Rank | Married-couple Households |
| U.S. Virgin Islanders | 0.0 /100 | #326 | Tragic 39.8% |
| Lumbee | 0.0 /100 | #327 | Tragic 39.6% |
| Barbadians | 0.0 /100 | #328 | Tragic 39.4% |
| Immigrants | Dominica | 0.0 /100 | #329 | Tragic 39.4% |
| Immigrants | Barbados | 0.0 /100 | #330 | Tragic 39.2% |
| Immigrants | Congo | 0.0 /100 | #331 | Tragic 39.0% |
| Somalis | 0.0 /100 | #332 | Tragic 39.0% |
| Immigrants | West Indies | 0.0 /100 | #333 | Tragic 39.0% |
| Immigrants | St. Vincent and the Grenadines | 0.0 /100 | #334 | Tragic 38.7% |
| Senegalese | 0.0 /100 | #335 | Tragic 38.6% |
| Blacks/African Americans | 0.0 /100 | #336 | Tragic 38.5% |
| Immigrants | Somalia | 0.0 /100 | #337 | Tragic 38.4% |
| Immigrants | Senegal | 0.0 /100 | #338 | Tragic 38.4% |
| British West Indians | 0.0 /100 | #339 | Tragic 38.3% |
| Dominicans | 0.0 /100 | #340 | Tragic 38.2% |