Immigrants from Bosnia and Herzegovina vs Aleut Disability Age Under 5

COMPARE

Immigrants from Bosnia and Herzegovina
Race
Ancestry
AfghanAfricanAlaska NativeAlaskan AthabascanAlbanianAlsatianAmericanApacheArabArapahoArgentineanArmenianAssyrian/Chaldean/SyriacAustralianAustrianBahamianBangladeshiBarbadianBasqueBelgianBelizeanBermudanBhutaneseBlackfeetBolivianBrazilianBritishBritish West IndianBulgarianBurmeseCajunCambodianCanadianCape VerdeanCarpatho RusynCelticCentral AmericanCentral American IndianCherokeeCheyenneChickasawChileanChineseChippewaChoctawColombianColvilleComancheCosta RicanCreeCreekCroatianCrowCubanCypriotCzechCzechoslovakianDanishDelawareDominicanDutchDutch West IndianEastern EuropeanEcuadorianEgyptianEnglishEstonianEthiopianEuropeanFijianFilipinoFinnishFrenchFrench American IndianFrench CanadianGermanGerman RussianGhanaianGreekGuamanian/ChamorroGuatemalanGuyaneseHaitianHmongHonduranHopiHoumaHungarianIcelanderIndian (Asian)IndonesianInupiatIranianIraqiIrishIroquoisIsraeliItalianJamaicanJapaneseJordanianKenyanKiowaKoreanLaotianLatvianLebaneseLiberianLithuanianLumbeeLuxembourgerMacedonianMalaysianMalteseMarshalleseMenomineeMexicanMexican American IndianMongolianMoroccanNative HawaiianNavajoNepaleseNew ZealanderNicaraguanNigerianNorthern EuropeanNorwegianOkinawanOsageOttawaPaiutePakistaniPalestinianPanamanianParaguayanPennsylvania GermanPeruvianPimaPolishPortuguesePotawatomiPuebloPuerto RicanPuget Sound SalishRomanianRussianSalvadoranSamoanScandinavianScotch-IrishScottishSeminoleSenegaleseSerbianShoshoneSierra LeoneanSiouxSlavicSlovakSloveneSomaliSouth AfricanSouth AmericanSouth American IndianSoviet UnionSpaniardSpanishSpanish AmericanSpanish American IndianSri LankanSubsaharan AfricanSudaneseSwedishSwissSyrianTaiwaneseThaiTlingit-HaidaTohono O'OdhamTonganTrinidadian and TobagonianTsimshianTurkishU.S. Virgin IslanderUgandanUkrainianUruguayanUteVenezuelanVietnameseWelshWest IndianYakamaYaquiYugoslavianYumanYup'ikZimbabwean
Immigration
NonimmigrantsImmigrantsAfghanistanAfricaAlbaniaArgentinaArmeniaAsiaAustraliaAustriaBahamasBangladeshBarbadosBelarusBelgiumBelizeBoliviaBosnia and HerzegovinaBrazilBulgariaBurma/MyanmarCabo VerdeCambodiaCameroonCanadaCaribbeanCentral AmericaChileChinaColombiaCongoCosta RicaCroatiaCubaCzechoslovakiaDenmarkDominicaDominican RepublicEastern AfricaEastern AsiaEastern EuropeEcuadorEgyptEl SalvadorEnglandEritreaEthiopiaEuropeFijiFranceGermanyGhanaGreeceGrenadaGuatemalaGuyanaHaitiHondurasHong KongHungaryIndiaIndonesiaIranIraqIrelandIsraelItalyJamaicaJapanJordanKazakhstanKenyaKoreaKuwaitLaosLatin AmericaLatviaLebanonLiberiaLithuaniaMalaysiaMexicoMicronesiaMiddle AfricaMoldovaMoroccoNepalNetherlandsNicaraguaNigeriaNorth AmericaNorth MacedoniaNorthern AfricaNorthern EuropeNorwayOceaniaPakistanPanamaPeruPhilippinesPolandPortugalRomaniaRussiaSaudi ArabiaScotlandSenegalSerbiaSierra LeoneSingaporeSomaliaSouth AfricaSouth AmericaSouth Central AsiaSouth Eastern AsiaSouthern EuropeSpainSri LankaSt. Vincent and the GrenadinesSudanSwedenSwitzerlandSyriaTaiwanThailandTrinidad and TobagoTurkeyUgandaUkraineUruguayUzbekistanVenezuelaVietnamWest IndiesWestern AfricaWestern AsiaWestern EuropeYemenZaireZimbabweAzores
Aleut
Race
Ancestry
AfghanAfricanAlaska NativeAlaskan AthabascanAlbanianAleutAlsatianAmericanApacheArabArapahoArgentineanArmenianAssyrian/Chaldean/SyriacAustralianAustrianBahamianBangladeshiBarbadianBasqueBelgianBelizeanBermudanBhutaneseBlackfeetBolivianBrazilianBritishBritish West IndianBulgarianBurmeseCajunCambodianCanadianCape VerdeanCarpatho RusynCelticCentral AmericanCentral American IndianCherokeeCheyenneChickasawChileanChineseChippewaChoctawColombianColvilleComancheCosta RicanCreeCreekCroatianCrowCubanCypriotCzechCzechoslovakianDanishDelawareDominicanDutchDutch West IndianEastern EuropeanEcuadorianEgyptianEnglishEstonianEthiopianEuropeanFijianFilipinoFinnishFrenchFrench American IndianFrench CanadianGermanGerman RussianGhanaianGreekGuamanian/ChamorroGuatemalanGuyaneseHaitianHmongHonduranHopiHoumaHungarianIcelanderIndian (Asian)IndonesianInupiatIranianIraqiIrishIroquoisIsraeliItalianJamaicanJapaneseJordanianKenyanKiowaKoreanLaotianLatvianLebaneseLiberianLithuanianLumbeeLuxembourgerMacedonianMalaysianMalteseMarshalleseMenomineeMexicanMexican American IndianMongolianMoroccanNative HawaiianNavajoNepaleseNew ZealanderNicaraguanNigerianNorthern EuropeanNorwegianOkinawanOsageOttawaPaiutePakistaniPalestinianPanamanianParaguayanPennsylvania GermanPeruvianPimaPolishPortuguesePotawatomiPuebloPuerto RicanPuget Sound SalishRomanianRussianSalvadoranSamoanScandinavianScotch-IrishScottishSeminoleSenegaleseSerbianShoshoneSierra LeoneanSiouxSlavicSlovakSloveneSomaliSouth AfricanSouth AmericanSouth American IndianSoviet UnionSpaniardSpanishSpanish AmericanSpanish American IndianSri LankanSubsaharan AfricanSudaneseSwedishSwissSyrianTaiwaneseThaiTlingit-HaidaTohono O'OdhamTonganTrinidadian and TobagonianTsimshianTurkishU.S. Virgin IslanderUgandanUkrainianUruguayanUteVenezuelanVietnameseWelshWest IndianYakamaYaquiYugoslavianYumanYup'ikZimbabwean
Immigration
NonimmigrantsImmigrantsAfghanistanAfricaAlbaniaArgentinaArmeniaAsiaAustraliaAustriaBahamasBangladeshBarbadosBelarusBelgiumBelizeBoliviaBrazilBulgariaBurma/MyanmarCabo VerdeCambodiaCameroonCanadaCaribbeanCentral AmericaChileChinaColombiaCongoCosta RicaCroatiaCubaCzechoslovakiaDenmarkDominicaDominican RepublicEastern AfricaEastern AsiaEastern EuropeEcuadorEgyptEl SalvadorEnglandEritreaEthiopiaEuropeFijiFranceGermanyGhanaGreeceGrenadaGuatemalaGuyanaHaitiHondurasHong KongHungaryIndiaIndonesiaIranIraqIrelandIsraelItalyJamaicaJapanJordanKazakhstanKenyaKoreaKuwaitLaosLatin AmericaLatviaLebanonLiberiaLithuaniaMalaysiaMexicoMicronesiaMiddle AfricaMoldovaMoroccoNepalNetherlandsNicaraguaNigeriaNorth AmericaNorth MacedoniaNorthern AfricaNorthern EuropeNorwayOceaniaPakistanPanamaPeruPhilippinesPolandPortugalRomaniaRussiaSaudi ArabiaScotlandSenegalSerbiaSierra LeoneSingaporeSomaliaSouth AfricaSouth AmericaSouth Central AsiaSouth Eastern AsiaSouthern EuropeSpainSri LankaSt. Vincent and the GrenadinesSudanSwedenSwitzerlandSyriaTaiwanThailandTrinidad and TobagoTurkeyUgandaUkraineUruguayUzbekistanVenezuelaVietnamWest IndiesWestern AfricaWestern AsiaWestern EuropeYemenZaireZimbabweAzores
Disability Age Under 5
Income
Poverty
Unemployment
Labor Participation
Family Structure
Vehicle Availability
Education Level
Disability

Disability Age Under 5 Comparison

Immigrants from Bosnia and Herzegovina

Aleuts

Fair
Exceptional
1.3%
DISABILITY AGE UNDER 5
36.5/ 100
METRIC RATING
192nd/ 347
METRIC RANK
1.2%
DISABILITY AGE UNDER 5
90.7/ 100
METRIC RATING
122nd/ 347
METRIC RANK

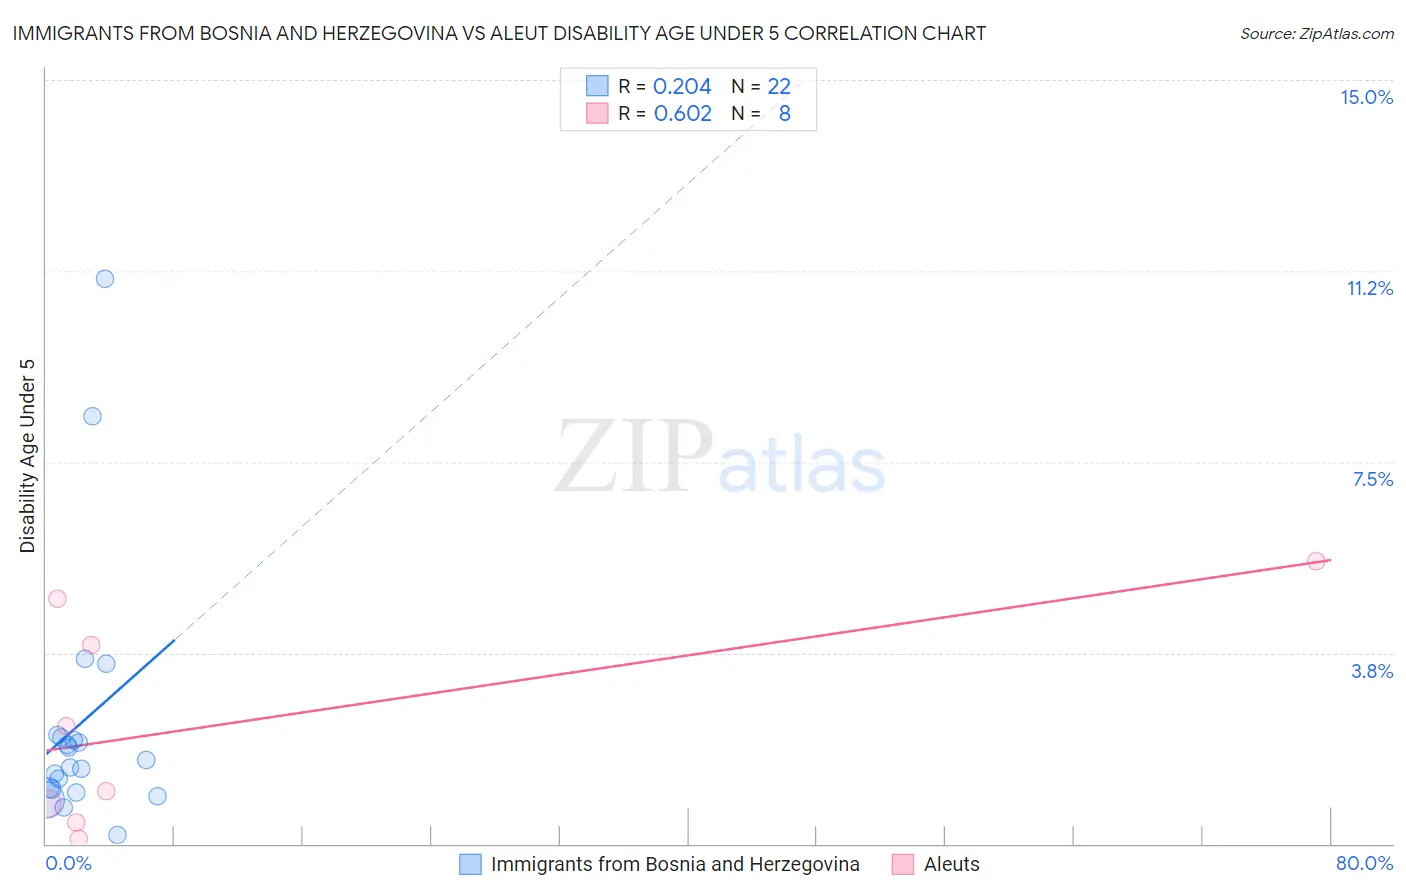
Immigrants from Bosnia and Herzegovina vs Aleut Disability Age Under 5 Correlation Chart

The statistical analysis conducted on geographies consisting of 106,812,268 people shows a weak positive correlation between the proportion of Immigrants from Bosnia and Herzegovina and percentage of population with a disability under the age of 5 in the United States with a correlation coefficient (R) of 0.204 and weighted average of 1.3%. Similarly, the statistical analysis conducted on geographies consisting of 51,541,789 people shows a significant positive correlation between the proportion of Aleuts and percentage of population with a disability under the age of 5 in the United States with a correlation coefficient (R) of 0.602 and weighted average of 1.2%, a difference of 6.8%.
Immigrants from Bosnia and Herzegovina vs Aleut Disability Age Under 5

Disability Age Under 5 Correlation Summary

MeasurementImmigrants from Bosnia and HerzegovinaAleut
Minimum0.18%0.11%
Maximum11.1%5.6%
Range10.9%5.4%
Mean2.4%2.4%
Median1.6%1.7%
Interquartile 25% (IQ1)1.1%0.61%
Interquartile 75% (IQ3)2.1%4.4%
Interquartile Range (IQR)1.0%3.7%
Standard Deviation (Sample)2.6%2.1%
Standard Deviation (Population)2.5%2.0%

Similar Demographics by Disability Age Under 5

Demographics Similar to Immigrants from Bosnia and Herzegovina by Disability Age Under 5

In terms of disability age under 5, the demographic groups most similar to Immigrants from Bosnia and Herzegovina are Mexican American Indian (1.3%, a difference of 0.0%), Immigrants from Sierra Leone (1.3%, a difference of 0.0%), Immigrants from Laos (1.3%, a difference of 0.010%), Peruvian (1.3%, a difference of 0.10%), and Immigrants from North Macedonia (1.3%, a difference of 0.18%).
DemographicsRating | RankDisability Age Under 5
Immigrants | Western Africa
42.5
/100
|
#185
Average
1.2%
Cubans
42.5
/100
|
#186
Average
1.2%
Immigrants | Haiti
40.2
/100
|
#187
Average
1.3%
Haitians
39.9
/100
|
#188
Fair
1.3%
Peruvians
37.6
/100
|
#189
Fair
1.3%
Immigrants | Laos
36.6
/100
|
#190
Fair
1.3%
Mexican American Indians
36.6
/100
|
#191
Fair
1.3%
Immigrants | Bosnia and Herzegovina
36.5
/100
|
#192
Fair
1.3%
Immigrants | Sierra Leone
36.5
/100
|
#193
Fair
1.3%
Immigrants | North Macedonia
34.7
/100
|
#194
Fair
1.3%
U.S. Virgin Islanders
34.4
/100
|
#195
Fair
1.3%
Immigrants | Belgium
31.4
/100
|
#196
Fair
1.3%
Immigrants | Somalia
31.3
/100
|
#197
Fair
1.3%
Immigrants | Norway
31.1
/100
|
#198
Fair
1.3%
Jamaicans
30.7
/100
|
#199
Fair
1.3%

Demographics Similar to Aleuts by Disability Age Under 5

In terms of disability age under 5, the demographic groups most similar to Aleuts are Zimbabwean (1.2%, a difference of 0.050%), Immigrants from Cambodia (1.2%, a difference of 0.070%), Japanese (1.2%, a difference of 0.13%), Immigrants from Senegal (1.2%, a difference of 0.19%), and Central American (1.2%, a difference of 0.29%).
DemographicsRating | RankDisability Age Under 5
Immigrants | Caribbean
93.8
/100
|
#115
Exceptional
1.2%
Immigrants | Northern Africa
93.8
/100
|
#116
Exceptional
1.2%
Immigrants | Philippines
93.5
/100
|
#117
Exceptional
1.2%
Immigrants | Venezuela
93.4
/100
|
#118
Exceptional
1.2%
Bhutanese
92.5
/100
|
#119
Exceptional
1.2%
Immigrants | Eritrea
92.3
/100
|
#120
Exceptional
1.2%
Immigrants | Senegal
91.4
/100
|
#121
Exceptional
1.2%
Aleuts
90.7
/100
|
#122
Exceptional
1.2%
Zimbabweans
90.6
/100
|
#123
Exceptional
1.2%
Immigrants | Cambodia
90.5
/100
|
#124
Exceptional
1.2%
Japanese
90.3
/100
|
#125
Exceptional
1.2%
Central Americans
89.7
/100
|
#126
Excellent
1.2%
Immigrants | Romania
88.4
/100
|
#127
Excellent
1.2%
Immigrants | France
88.4
/100
|
#128
Excellent
1.2%
Immigrants | Immigrants
88.0
/100
|
#129
Excellent
1.2%