Sussex County, DE
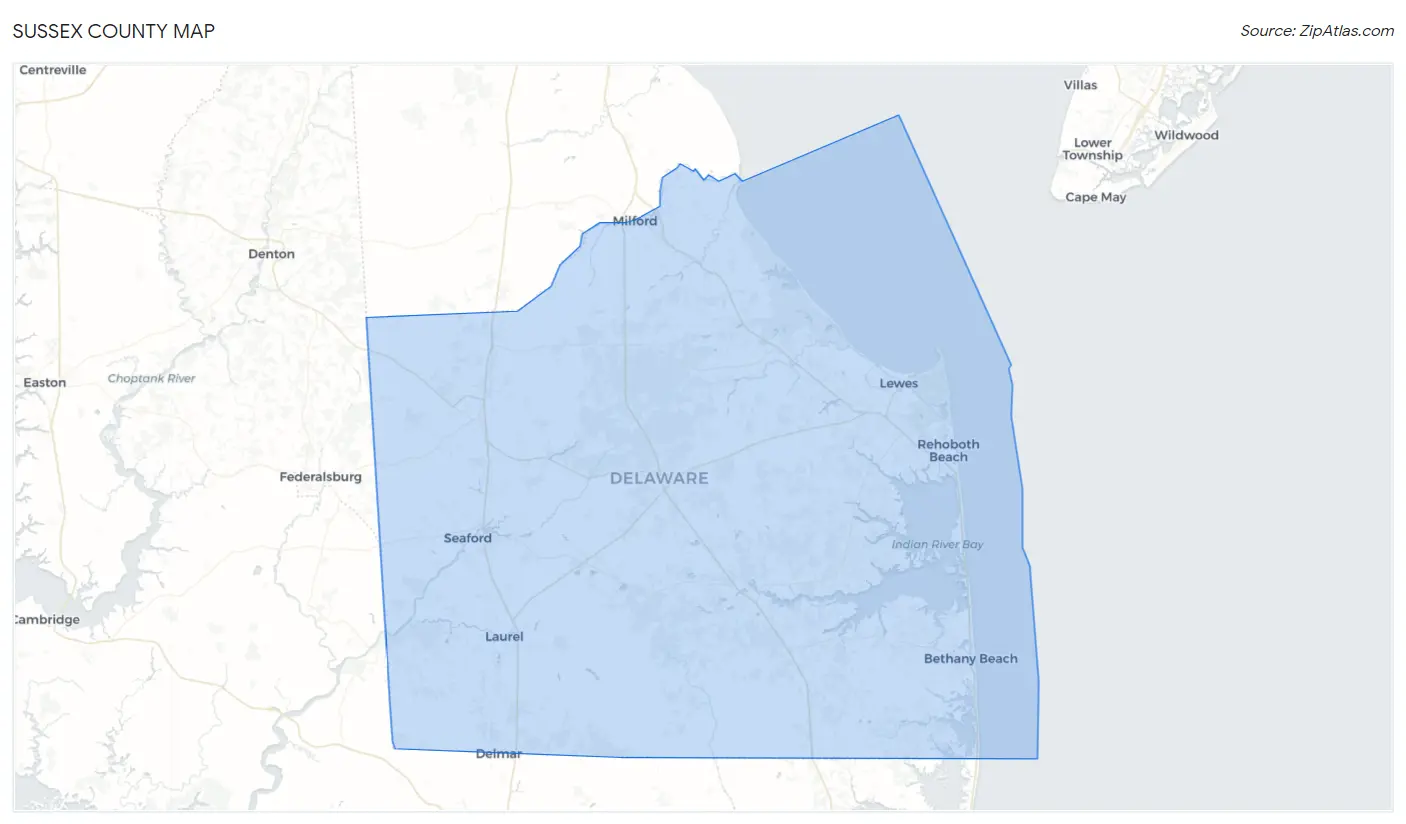
Sussex County Map
Sussex County Overview
240,668
TOTAL POPULATION
117,079
MALE POPULATION
123,589
FEMALE POPULATION
94.73
MALES / 100 FEMALES
105.56
FEMALES / 100 MALES
51.3
MEDIAN AGE
2.8
AVG FAMILY SIZE
2.4
AVG HOUSEHOLD SIZE
$42,958
PER CAPITA INCOME
$91,800
AVG FAMILY INCOME
$75,406
AVG HOUSEHOLD INCOME
24.5%
WAGE / INCOME GAP [ % ]
75.5¢/ $1
WAGE / INCOME GAP [ $ ]
$10,130
FAMILY INCOME DEFICIT
0.46
INEQUALITY / GINI INDEX
109,671
LABOR FORCE [ PEOPLE ]
54.3%
PERCENT IN LABOR FORCE
5.0%
UNEMPLOYMENT RATE
Sussex County Area Codes
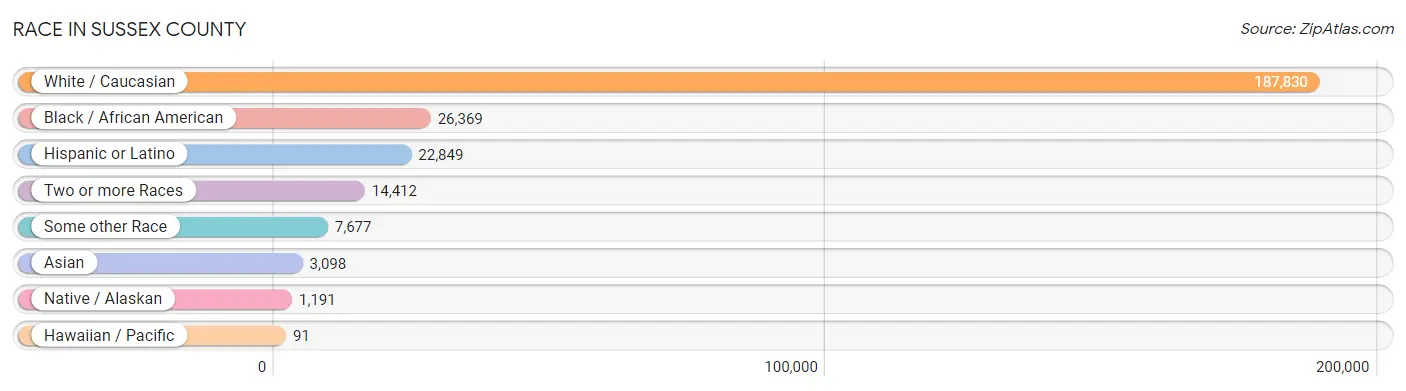
Race in Sussex County
The most populous races in Sussex County are White / Caucasian (187,830 | 78.0%), Black / African American (26,369 | 11.0%), and Hispanic or Latino (22,849 | 9.5%).
| Race | # Population | % Population |
| Asian | 3,098 | 1.3% |
| Black / African American | 26,369 | 11.0% |
| Hawaiian / Pacific | 91 | 0.0% |
| Hispanic or Latino | 22,849 | 9.5% |
| Native / Alaskan | 1,191 | 0.5% |
| White / Caucasian | 187,830 | 78.0% |
| Two or more Races | 14,412 | 6.0% |
| Some other Race | 7,677 | 3.2% |
| Total | 240,668 | 100.0% |
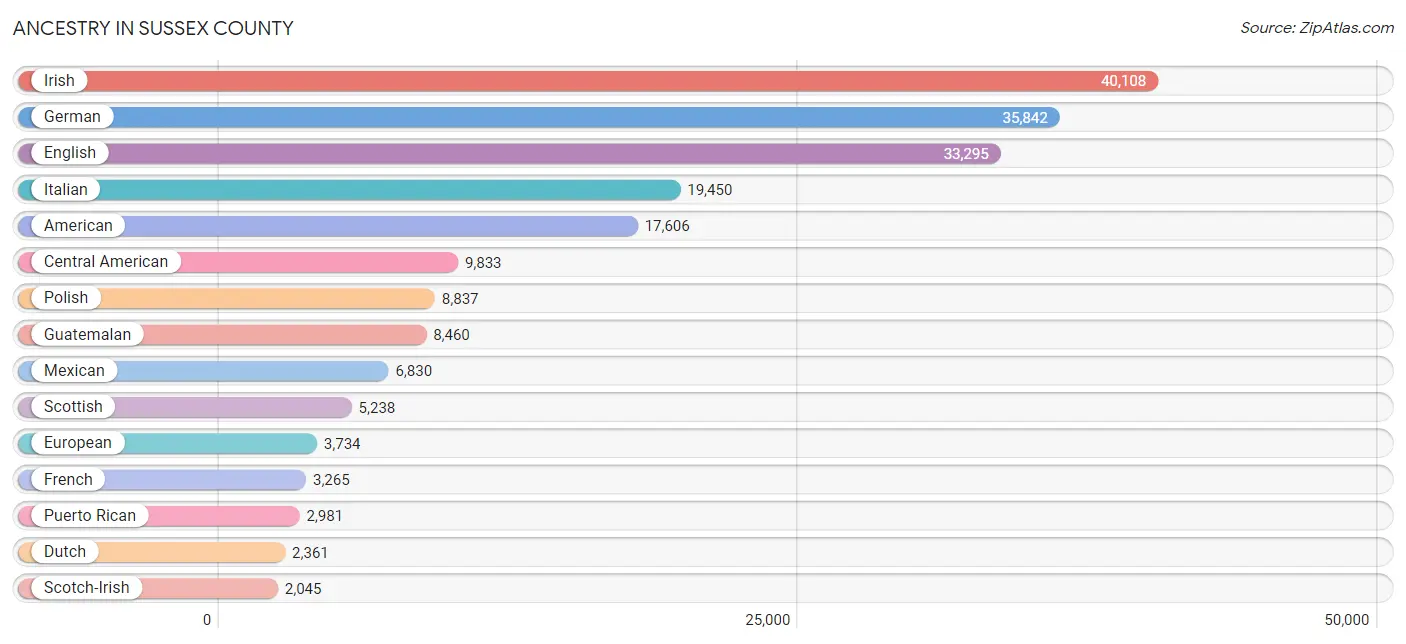
Ancestry in Sussex County
The most populous ancestries reported in Sussex County are Irish (40,108 | 16.7%), German (35,842 | 14.9%), English (33,295 | 13.8%), Italian (19,450 | 8.1%), and American (17,606 | 7.3%), together accounting for 60.8% of all Sussex County residents.
| Ancestry | # Population | % Population |
| African | 733 | 0.3% |
| Alsatian | 4 | 0.0% |
| American | 17,606 | 7.3% |
| Apache | 23 | 0.0% |
| Arab | 320 | 0.1% |
| Argentinean | 65 | 0.0% |
| Armenian | 85 | 0.0% |
| Assyrian / Chaldean / Syriac | 10 | 0.0% |
| Australian | 17 | 0.0% |
| Austrian | 424 | 0.2% |
| Belgian | 204 | 0.1% |
| Bhutanese | 206 | 0.1% |
| Blackfeet | 95 | 0.0% |
| Bolivian | 2 | 0.0% |
| Brazilian | 46 | 0.0% |
| British | 1,656 | 0.7% |
| Bulgarian | 44 | 0.0% |
| Burmese | 485 | 0.2% |
| Canadian | 515 | 0.2% |
| Cape Verdean | 27 | 0.0% |
| Celtic | 46 | 0.0% |
| Central American | 9,833 | 4.1% |
| Central American Indian | 242 | 0.1% |
| Cherokee | 354 | 0.2% |
| Chilean | 167 | 0.1% |
| Chippewa | 15 | 0.0% |
| Choctaw | 45 | 0.0% |
| Colombian | 265 | 0.1% |
| Costa Rican | 17 | 0.0% |
| Croatian | 97 | 0.0% |
| Crow | 11 | 0.0% |
| Cuban | 326 | 0.1% |
| Czech | 431 | 0.2% |
| Czechoslovakian | 93 | 0.0% |
| Danish | 403 | 0.2% |
| Delaware | 169 | 0.1% |
| Dominican | 903 | 0.4% |
| Dutch | 2,361 | 1.0% |
| Eastern European | 1,097 | 0.5% |
| Ecuadorian | 150 | 0.1% |
| Egyptian | 19 | 0.0% |
| English | 33,295 | 13.8% |
| Estonian | 118 | 0.1% |
| Ethiopian | 85 | 0.0% |
| European | 3,734 | 1.5% |
| Filipino | 32 | 0.0% |
| Finnish | 135 | 0.1% |
| French | 3,265 | 1.4% |
| French Canadian | 969 | 0.4% |
| German | 35,842 | 14.9% |
| German Russian | 41 | 0.0% |
| Greek | 1,117 | 0.5% |
| Guamanian / Chamorro | 92 | 0.0% |
| Guatemalan | 8,460 | 3.5% |
| Guyanese | 13 | 0.0% |
| Haitian | 2,015 | 0.8% |
| Honduran | 401 | 0.2% |
| Hungarian | 1,437 | 0.6% |
| Indian (Asian) | 405 | 0.2% |
| Indonesian | 8 | 0.0% |
| Inupiat | 72 | 0.0% |
| Iranian | 90 | 0.0% |
| Iraqi | 6 | 0.0% |
| Irish | 40,108 | 16.7% |
| Iroquois | 68 | 0.0% |
| Israeli | 18 | 0.0% |
| Italian | 19,450 | 8.1% |
| Jamaican | 543 | 0.2% |
| Japanese | 10 | 0.0% |
| Jordanian | 12 | 0.0% |
| Kenyan | 31 | 0.0% |
| Korean | 1,070 | 0.4% |
| Latvian | 180 | 0.1% |
| Lebanese | 134 | 0.1% |
| Lithuanian | 823 | 0.3% |
| Lumbee | 10 | 0.0% |
| Luxembourger | 8 | 0.0% |
| Macedonian | 16 | 0.0% |
| Malaysian | 126 | 0.1% |
| Maltese | 6 | 0.0% |
| Mexican | 6,830 | 2.8% |
| Mexican American Indian | 34 | 0.0% |
| Moroccan | 11 | 0.0% |
| Native Hawaiian | 87 | 0.0% |
| Navajo | 189 | 0.1% |
| New Zealander | 4 | 0.0% |
| Nicaraguan | 77 | 0.0% |
| Nigerian | 92 | 0.0% |
| Northern European | 217 | 0.1% |
| Norwegian | 1,414 | 0.6% |
| Osage | 22 | 0.0% |
| Ottawa | 3 | 0.0% |
| Paiute | 3 | 0.0% |
| Pakistani | 49 | 0.0% |
| Palestinian | 17 | 0.0% |
| Panamanian | 19 | 0.0% |
| Paraguayan | 44 | 0.0% |
| Pennsylvania German | 330 | 0.1% |
| Peruvian | 64 | 0.0% |
| Polish | 8,837 | 3.7% |
| Portuguese | 714 | 0.3% |
| Potawatomi | 38 | 0.0% |
| Puerto Rican | 2,981 | 1.2% |
| Romanian | 336 | 0.1% |
| Russian | 1,856 | 0.8% |
| Salvadoran | 859 | 0.4% |
| Samoan | 38 | 0.0% |
| Scandinavian | 272 | 0.1% |
| Scotch-Irish | 2,045 | 0.9% |
| Scottish | 5,238 | 2.2% |
| Seminole | 3 | 0.0% |
| Serbian | 20 | 0.0% |
| Shoshone | 2 | 0.0% |
| Sioux | 13 | 0.0% |
| Slavic | 141 | 0.1% |
| Slovak | 528 | 0.2% |
| Slovene | 49 | 0.0% |
| South African | 125 | 0.1% |
| South American | 864 | 0.4% |
| South American Indian | 14 | 0.0% |
| Soviet Union | 9 | 0.0% |
| Spaniard | 171 | 0.1% |
| Spanish | 386 | 0.2% |
| Sri Lankan | 773 | 0.3% |
| Subsaharan African | 1,158 | 0.5% |
| Swedish | 1,405 | 0.6% |
| Swiss | 797 | 0.3% |
| Syrian | 12 | 0.0% |
| Thai | 663 | 0.3% |
| Trinidadian and Tobagonian | 19 | 0.0% |
| Turkish | 290 | 0.1% |
| Ukrainian | 1,013 | 0.4% |
| Venezuelan | 99 | 0.0% |
| Welsh | 1,858 | 0.8% |
| West Indian | 75 | 0.0% |
| Yugoslavian | 155 | 0.1% | View All 136 Rows |
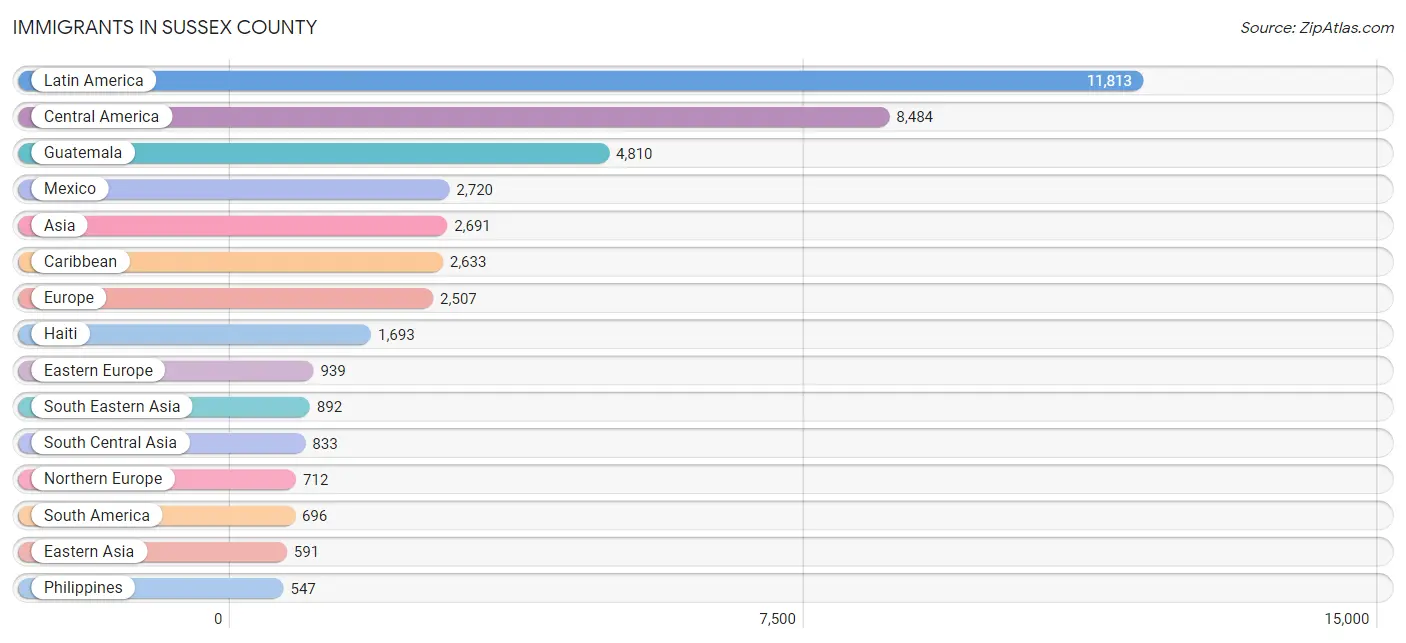
Immigrants in Sussex County
The most numerous immigrant groups reported in Sussex County came from Latin America (11,813 | 4.9%), Central America (8,484 | 3.5%), Guatemala (4,810 | 2.0%), Mexico (2,720 | 1.1%), and Asia (2,691 | 1.1%), together accounting for 12.7% of all Sussex County residents.
| Immigration Origin | # Population | % Population |
| Africa | 471 | 0.2% |
| Argentina | 102 | 0.0% |
| Asia | 2,691 | 1.1% |
| Australia | 23 | 0.0% |
| Austria | 4 | 0.0% |
| Barbados | 2 | 0.0% |
| Belarus | 19 | 0.0% |
| Belgium | 6 | 0.0% |
| Brazil | 55 | 0.0% |
| Bulgaria | 55 | 0.0% |
| Canada | 451 | 0.2% |
| Caribbean | 2,633 | 1.1% |
| Central America | 8,484 | 3.5% |
| Chile | 99 | 0.0% |
| China | 267 | 0.1% |
| Colombia | 136 | 0.1% |
| Costa Rica | 5 | 0.0% |
| Cuba | 84 | 0.0% |
| Czechoslovakia | 74 | 0.0% |
| Denmark | 10 | 0.0% |
| Dominica | 159 | 0.1% |
| Dominican Republic | 407 | 0.2% |
| Eastern Africa | 47 | 0.0% |
| Eastern Asia | 591 | 0.3% |
| Eastern Europe | 939 | 0.4% |
| Ecuador | 78 | 0.0% |
| Egypt | 17 | 0.0% |
| El Salvador | 542 | 0.2% |
| England | 349 | 0.2% |
| Europe | 2,507 | 1.0% |
| France | 58 | 0.0% |
| Germany | 271 | 0.1% |
| Ghana | 74 | 0.0% |
| Greece | 80 | 0.0% |
| Guatemala | 4,810 | 2.0% |
| Guyana | 84 | 0.0% |
| Haiti | 1,693 | 0.7% |
| Honduras | 331 | 0.1% |
| Hong Kong | 23 | 0.0% |
| Hungary | 129 | 0.1% |
| India | 387 | 0.2% |
| Iran | 99 | 0.0% |
| Iraq | 6 | 0.0% |
| Ireland | 63 | 0.0% |
| Israel | 51 | 0.0% |
| Italy | 285 | 0.1% |
| Jamaica | 249 | 0.1% |
| Japan | 25 | 0.0% |
| Jordan | 4 | 0.0% |
| Kazakhstan | 32 | 0.0% |
| Kenya | 24 | 0.0% |
| Korea | 299 | 0.1% |
| Laos | 92 | 0.0% |
| Latin America | 11,813 | 4.9% |
| Latvia | 95 | 0.0% |
| Lebanon | 2 | 0.0% |
| Lithuania | 39 | 0.0% |
| Mexico | 2,720 | 1.1% |
| Middle Africa | 72 | 0.0% |
| Moldova | 50 | 0.0% |
| Morocco | 24 | 0.0% |
| Netherlands | 75 | 0.0% |
| Nicaragua | 33 | 0.0% |
| Nigeria | 102 | 0.0% |
| North Macedonia | 8 | 0.0% |
| Northern Africa | 42 | 0.0% |
| Northern Europe | 712 | 0.3% |
| Norway | 12 | 0.0% |
| Oceania | 34 | 0.0% |
| Pakistan | 268 | 0.1% |
| Panama | 43 | 0.0% |
| Peru | 36 | 0.0% |
| Philippines | 547 | 0.2% |
| Poland | 62 | 0.0% |
| Portugal | 50 | 0.0% |
| Romania | 125 | 0.1% |
| Russia | 205 | 0.1% |
| Scotland | 43 | 0.0% |
| Sierra Leone | 3 | 0.0% |
| South Africa | 82 | 0.0% |
| South America | 696 | 0.3% |
| South Central Asia | 833 | 0.4% |
| South Eastern Asia | 892 | 0.4% |
| Southern Europe | 442 | 0.2% |
| Spain | 23 | 0.0% |
| Sri Lanka | 19 | 0.0% |
| Syria | 1 | 0.0% |
| Taiwan | 57 | 0.0% |
| Thailand | 76 | 0.0% |
| Trinidad and Tobago | 39 | 0.0% |
| Turkey | 246 | 0.1% |
| Uganda | 12 | 0.0% |
| Ukraine | 41 | 0.0% |
| Venezuela | 93 | 0.0% |
| Vietnam | 169 | 0.1% |
| Western Africa | 179 | 0.1% |
| Western Asia | 358 | 0.2% |
| Western Europe | 414 | 0.2% |
| Yemen | 13 | 0.0% |
| Zimbabwe | 11 | 0.0% | View All 100 Rows |
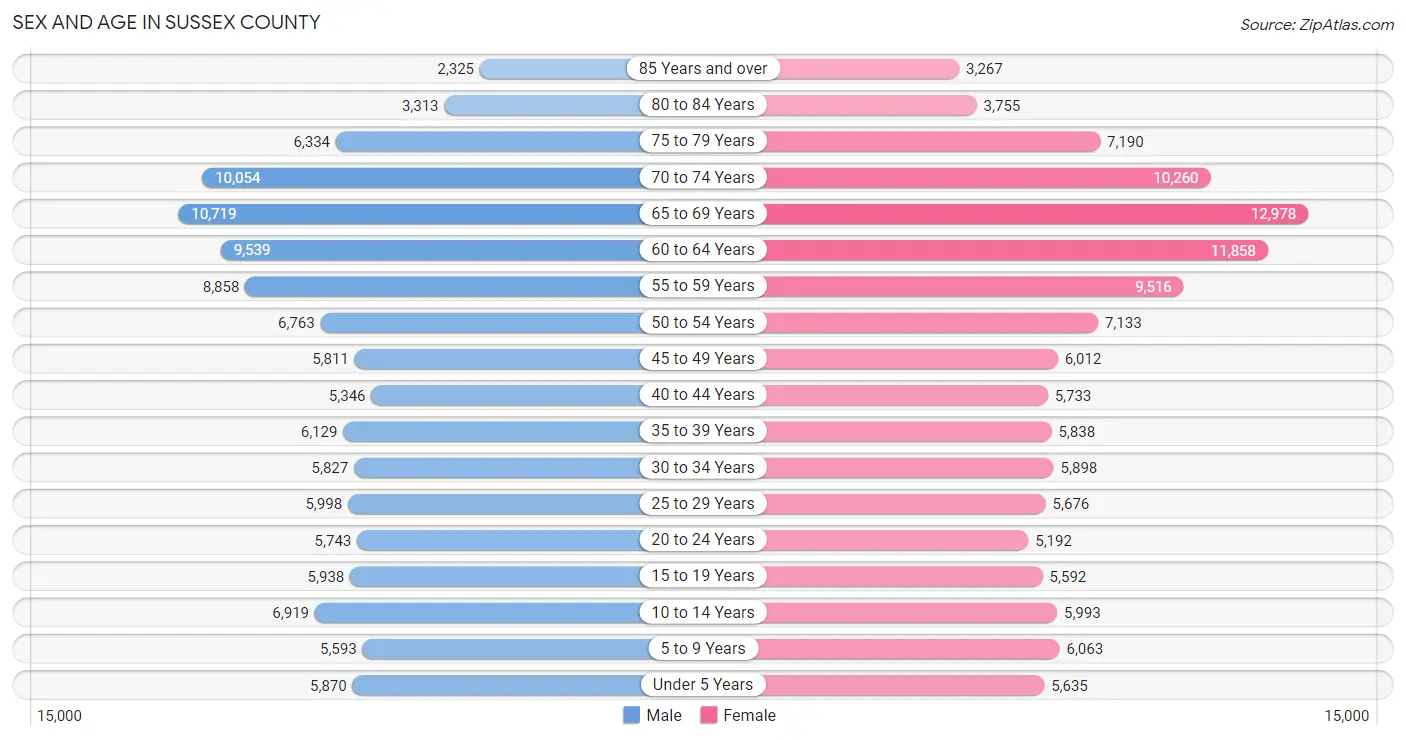
Sex and Age in Sussex County
Sex and Age in Sussex County
The most populous age groups in Sussex County are 65 to 69 Years (10,719 | 9.2%) for men and 65 to 69 Years (12,978 | 10.5%) for women.
| Age Bracket | Male | Female |
| Under 5 Years | 5,870 (5.0%) | 5,635 (4.6%) |
| 5 to 9 Years | 5,593 (4.8%) | 6,063 (4.9%) |
| 10 to 14 Years | 6,919 (5.9%) | 5,993 (4.9%) |
| 15 to 19 Years | 5,938 (5.1%) | 5,592 (4.5%) |
| 20 to 24 Years | 5,743 (4.9%) | 5,192 (4.2%) |
| 25 to 29 Years | 5,998 (5.1%) | 5,676 (4.6%) |
| 30 to 34 Years | 5,827 (5.0%) | 5,898 (4.8%) |
| 35 to 39 Years | 6,129 (5.2%) | 5,838 (4.7%) |
| 40 to 44 Years | 5,346 (4.6%) | 5,733 (4.6%) |
| 45 to 49 Years | 5,811 (5.0%) | 6,012 (4.9%) |
| 50 to 54 Years | 6,763 (5.8%) | 7,133 (5.8%) |
| 55 to 59 Years | 8,858 (7.6%) | 9,516 (7.7%) |
| 60 to 64 Years | 9,539 (8.2%) | 11,858 (9.6%) |
| 65 to 69 Years | 10,719 (9.2%) | 12,978 (10.5%) |
| 70 to 74 Years | 10,054 (8.6%) | 10,260 (8.3%) |
| 75 to 79 Years | 6,334 (5.4%) | 7,190 (5.8%) |
| 80 to 84 Years | 3,313 (2.8%) | 3,755 (3.0%) |
| 85 Years and over | 2,325 (2.0%) | 3,267 (2.6%) |
| Total | 117,079 (100.0%) | 123,589 (100.0%) |
Families and Households in Sussex County
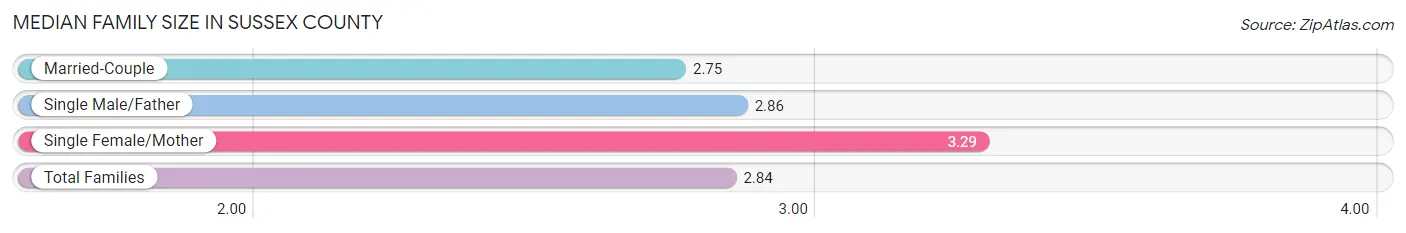
Median Family Size in Sussex County
The median family size in Sussex County is 2.84 persons per family, with single female/mother families (10,471 | 15.4%) accounting for the largest median family size of 3.29 persons per family. On the other hand, married-couple families (52,846 | 77.8%) represent the smallest median family size with 2.75 persons per family.
| Family Type | # Families | Family Size |
| Married-Couple | 52,846 (77.8%) | 2.75 |
| Single Male/Father | 4,607 (6.8%) | 2.86 |
| Single Female/Mother | 10,471 (15.4%) | 3.29 |
| Total Families | 67,924 (100.0%) | 2.84 |
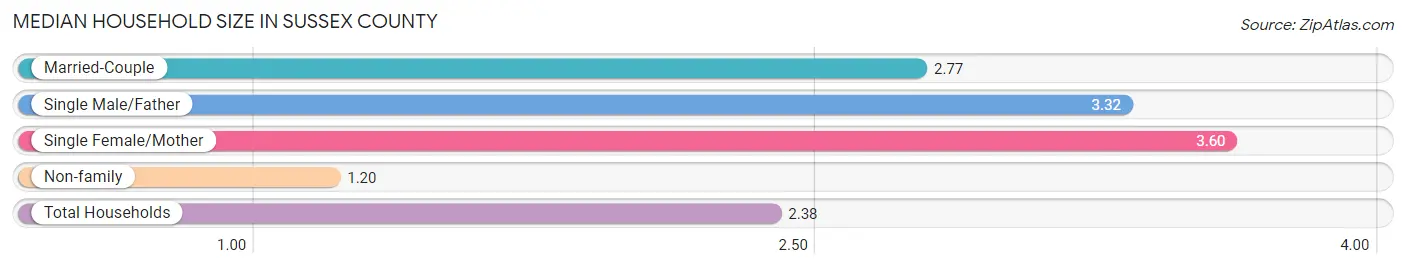
Median Household Size in Sussex County
The median household size in Sussex County is 2.38 persons per household, with single female/mother households (10,471 | 10.5%) accounting for the largest median household size of 3.6 persons per household. non-family households (31,934 | 32.0%) represent the smallest median household size with 1.20 persons per household.
| Household Type | # Households | Household Size |
| Married-Couple | 52,846 (52.9%) | 2.77 |
| Single Male/Father | 4,607 (4.6%) | 3.32 |
| Single Female/Mother | 10,471 (10.5%) | 3.60 |
| Non-family | 31,934 (32.0%) | 1.20 |
| Total Households | 99,858 (100.0%) | 2.38 |
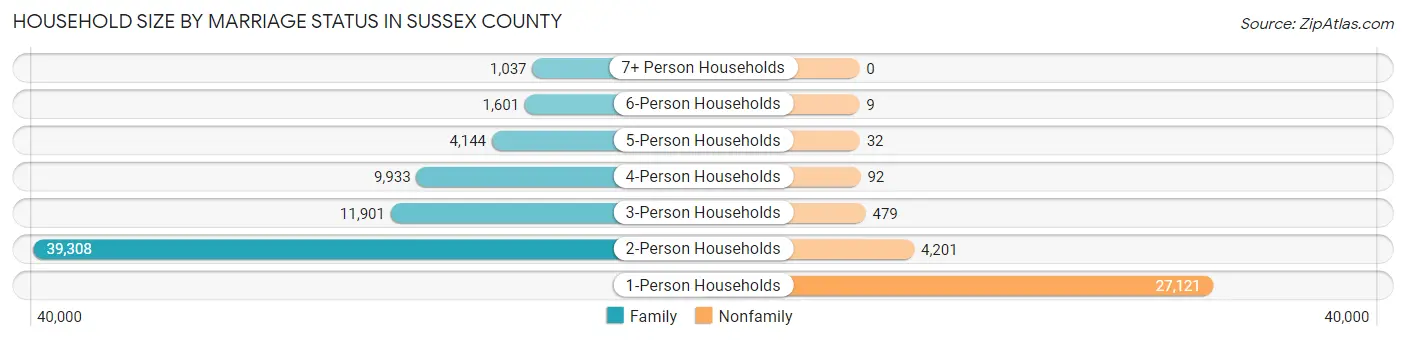
Household Size by Marriage Status in Sussex County
Out of a total of 99,858 households in Sussex County, 67,924 (68.0%) are family households, while 31,934 (32.0%) are nonfamily households. The most numerous type of family households are 2-person households, comprising 39,308, and the most common type of nonfamily households are 1-person households, comprising 27,121.
| Household Size | Family Households | Nonfamily Households |
| 1-Person Households | - | 27,121 (27.2%) |
| 2-Person Households | 39,308 (39.4%) | 4,201 (4.2%) |
| 3-Person Households | 11,901 (11.9%) | 479 (0.5%) |
| 4-Person Households | 9,933 (10.0%) | 92 (0.1%) |
| 5-Person Households | 4,144 (4.2%) | 32 (0.0%) |
| 6-Person Households | 1,601 (1.6%) | 9 (0.0%) |
| 7+ Person Households | 1,037 (1.0%) | 0 (0.0%) |
| Total | 67,924 (68.0%) | 31,934 (32.0%) |
Female Fertility in Sussex County
Fertility by Age in Sussex County
Average fertility rate in Sussex County is 55.0 births per 1,000 women. Women in the age bracket of 20 to 34 years have the highest fertility rate with 97.0 births per 1,000 women. Women in the age bracket of 20 to 34 years acount for 71.4% of all women with births.
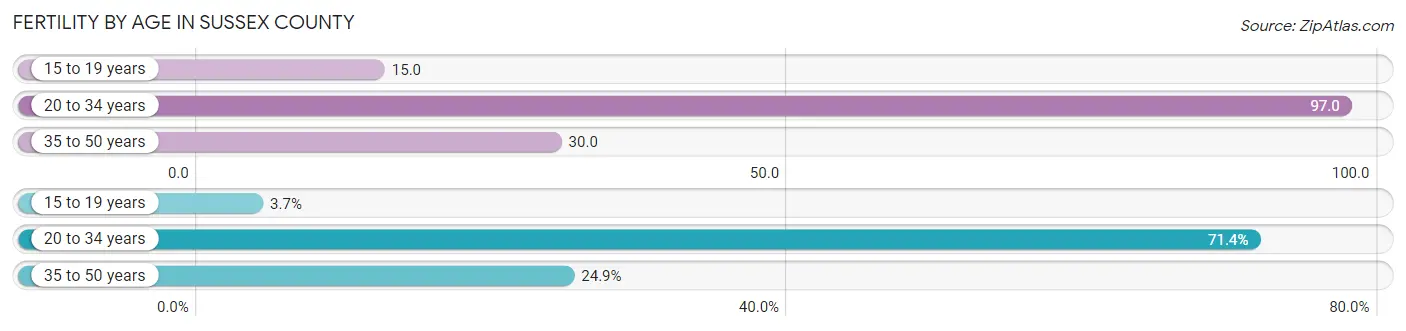
| Age Bracket | Women with Births | Births / 1,000 Women |
| 15 to 19 years | 85 (3.7%) | 15.0 |
| 20 to 34 years | 1,623 (71.4%) | 97.0 |
| 35 to 50 years | 565 (24.9%) | 30.0 |
| Total | 2,273 (100.0%) | 55.0 |
Fertility by Age by Marriage Status in Sussex County
58.7% of women with births (2,273) in Sussex County are married. The highest percentage of unmarried women with births falls into 15 to 19 years age bracket with 100.0% of them unmarried at the time of birth, while the lowest percentage of unmarried women with births belong to 35 to 50 years age bracket with 20.4% of them unmarried.
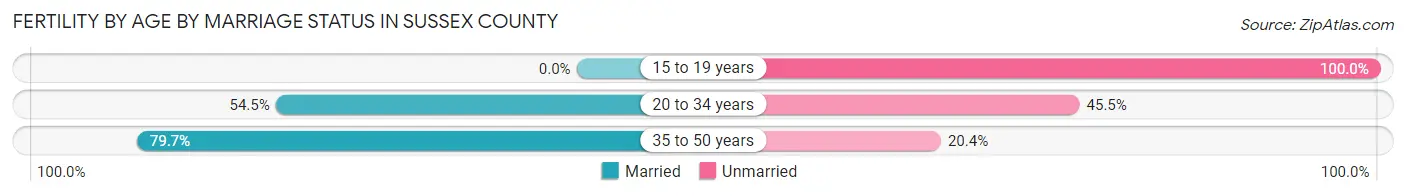
| Age Bracket | Married | Unmarried |
| 15 to 19 years | 0 (0.0%) | 85 (100.0%) |
| 20 to 34 years | 885 (54.5%) | 738 (45.5%) |
| 35 to 50 years | 450 (79.6%) | 115 (20.3%) |
| Total | 1,334 (58.7%) | 939 (41.3%) |
Fertility by Education in Sussex County
Average fertility rate in Sussex County is 55.0 births per 1,000 women. Women with the education attainment of less than high school have the highest fertility rate of 71.0 births per 1,000 women, while women with the education attainment of graduate degree have the lowest fertility at 37.0 births per 1,000 women. Women with the education attainment of college or associate's degree represent 31.0% of all women with births.
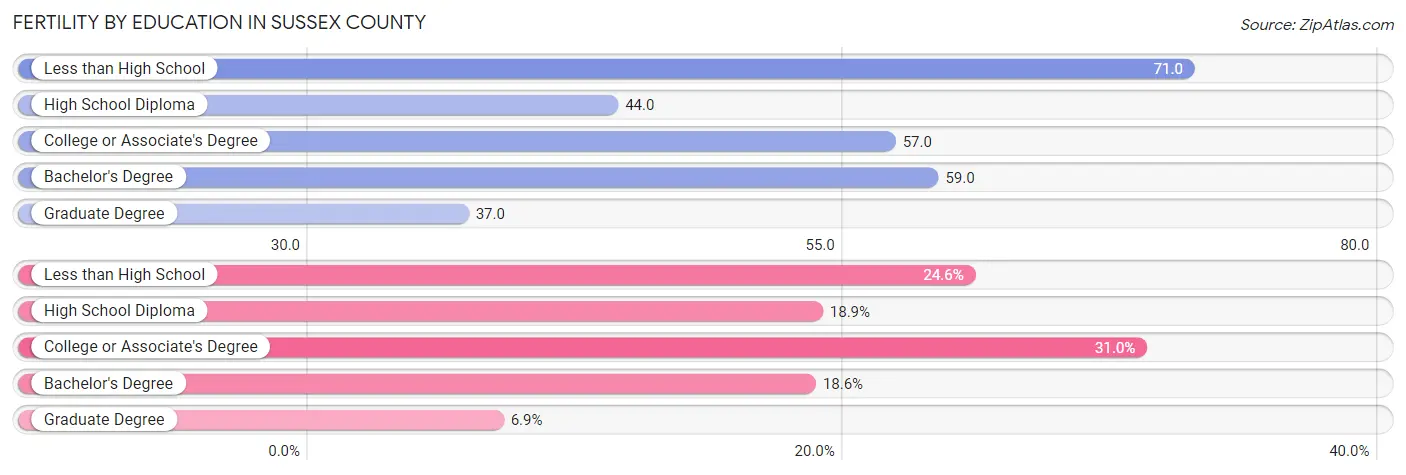
| Educational Attainment | Women with Births | Births / 1,000 Women |
| Less than High School | 559 (24.6%) | 71.0 |
| High School Diploma | 429 (18.9%) | 44.0 |
| College or Associate's Degree | 705 (31.0%) | 57.0 |
| Bachelor's Degree | 423 (18.6%) | 59.0 |
| Graduate Degree | 157 (6.9%) | 37.0 |
| Total | 2,273 (100.0%) | 55.0 |
Fertility by Education by Marriage Status in Sussex County
41.3% of women with births in Sussex County are unmarried. Women with the educational attainment of graduate degree are most likely to be married with 100.0% of them married at childbirth, while women with the educational attainment of high school diploma are least likely to be married with 67.8% of them unmarried at childbirth.
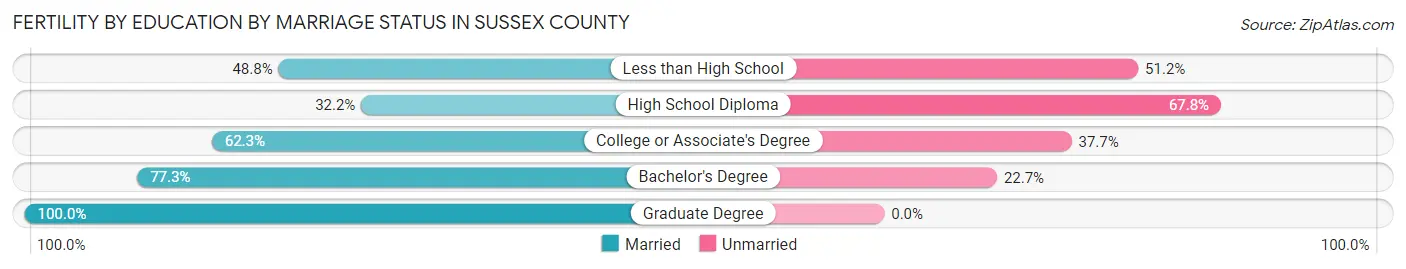
| Educational Attainment | Married | Unmarried |
| Less than High School | 273 (48.8%) | 286 (51.2%) |
| High School Diploma | 138 (32.2%) | 291 (67.8%) |
| College or Associate's Degree | 439 (62.3%) | 266 (37.7%) |
| Bachelor's Degree | 327 (77.3%) | 96 (22.7%) |
| Graduate Degree | 157 (100.0%) | 0 (0.0%) |
| Total | 1,334 (58.7%) | 939 (41.3%) |
Income in Sussex County
Income Overview in Sussex County
Per Capita Income in Sussex County is $42,958, while median incomes of families and households are $91,800 and $75,406 respectively.
| Characteristic | Number | Measure |
| Per Capita Income | 240,668 | $42,958 |
| Median Family Income | 67,924 | $91,800 |
| Mean Family Income | 67,924 | $117,384 |
| Median Household Income | 99,858 | $75,406 |
| Mean Household Income | 99,858 | $100,646 |
| Income Deficit | 67,924 | $10,130 |
| Wage / Income Gap (%) | 240,668 | 24.50% |
| Wage / Income Gap ($) | 240,668 | 75.50¢ per $1 |
| Gini / Inequality Index | 240,668 | 0.46 |
Earnings by Sex in Sussex County
Average Earnings in Sussex County are $37,736, $43,722 for men and $33,008 for women, a difference of 24.5%.
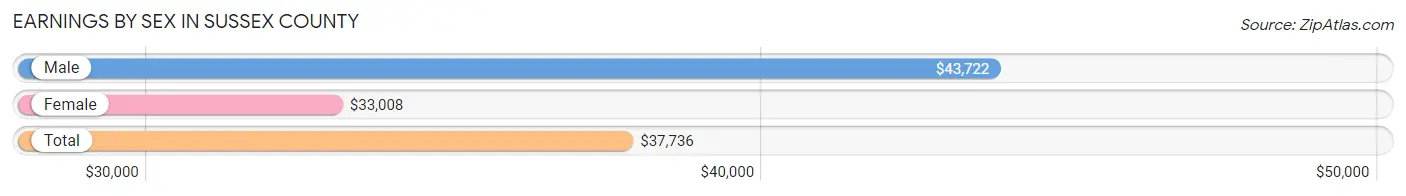
| Sex | Number | Average Earnings |
| Male | 60,439 (52.0%) | $43,722 |
| Female | 55,735 (48.0%) | $33,008 |
| Total | 116,174 (100.0%) | $37,736 |
Earnings by Sex by Income Bracket in Sussex County
The most common earnings brackets in Sussex County are $100,000+ for men (9,671 | 16.0%) and $75,000 to $99,999 for women (5,054 | 9.1%).
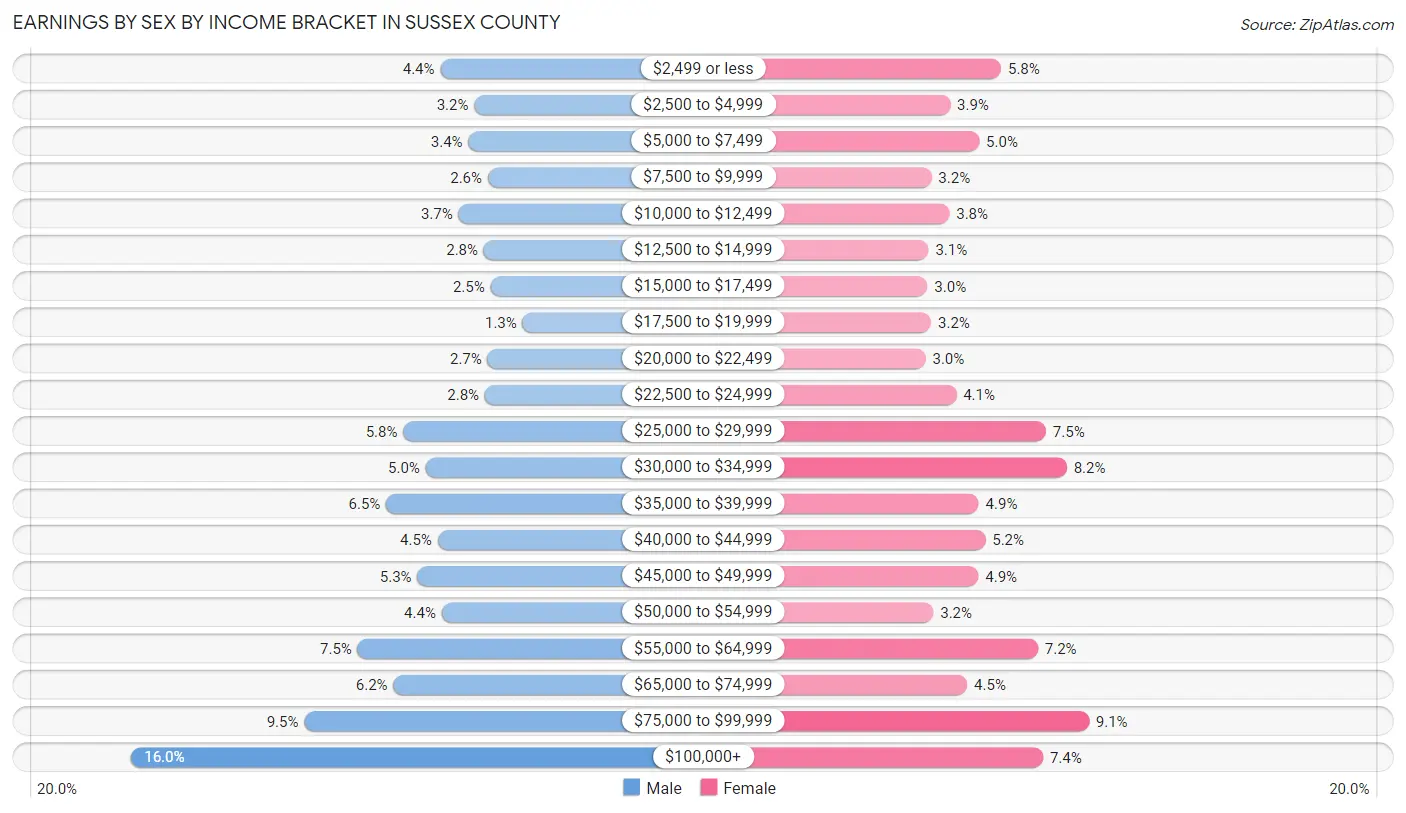
| Income | Male | Female |
| $2,499 or less | 2,671 (4.4%) | 3,223 (5.8%) |
| $2,500 to $4,999 | 1,904 (3.2%) | 2,156 (3.9%) |
| $5,000 to $7,499 | 2,034 (3.4%) | 2,766 (5.0%) |
| $7,500 to $9,999 | 1,597 (2.6%) | 1,766 (3.2%) |
| $10,000 to $12,499 | 2,259 (3.7%) | 2,143 (3.8%) |
| $12,500 to $14,999 | 1,686 (2.8%) | 1,703 (3.1%) |
| $15,000 to $17,499 | 1,536 (2.5%) | 1,683 (3.0%) |
| $17,500 to $19,999 | 811 (1.3%) | 1,759 (3.2%) |
| $20,000 to $22,499 | 1,603 (2.6%) | 1,642 (2.9%) |
| $22,500 to $24,999 | 1,661 (2.8%) | 2,287 (4.1%) |
| $25,000 to $29,999 | 3,513 (5.8%) | 4,157 (7.5%) |
| $30,000 to $34,999 | 3,004 (5.0%) | 4,595 (8.2%) |
| $35,000 to $39,999 | 3,900 (6.5%) | 2,755 (4.9%) |
| $40,000 to $44,999 | 2,730 (4.5%) | 2,890 (5.2%) |
| $45,000 to $49,999 | 3,189 (5.3%) | 2,750 (4.9%) |
| $50,000 to $54,999 | 2,639 (4.4%) | 1,808 (3.2%) |
| $55,000 to $64,999 | 4,544 (7.5%) | 3,990 (7.2%) |
| $65,000 to $74,999 | 3,733 (6.2%) | 2,512 (4.5%) |
| $75,000 to $99,999 | 5,754 (9.5%) | 5,054 (9.1%) |
| $100,000+ | 9,671 (16.0%) | 4,096 (7.3%) |
| Total | 60,439 (100.0%) | 55,735 (100.0%) |
Earnings by Sex by Educational Attainment in Sussex County
Average earnings in Sussex County are $49,042 for men and $36,801 for women, a difference of 25.0%. Men with an educational attainment of graduate degree enjoy the highest average annual earnings of $84,358, while those with less than high school education earn the least with $37,000. Women with an educational attainment of graduate degree earn the most with the average annual earnings of $66,234, while those with less than high school education have the smallest earnings of $25,117.
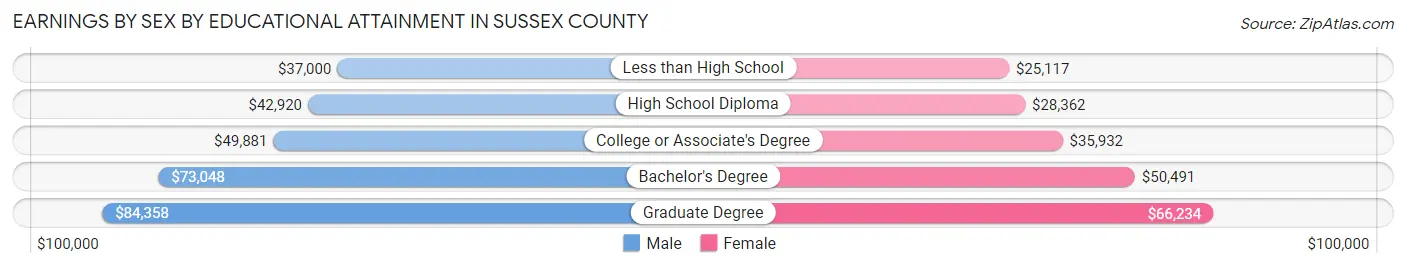
| Educational Attainment | Male Income | Female Income |
| Less than High School | $37,000 | $25,117 |
| High School Diploma | $42,920 | $28,362 |
| College or Associate's Degree | $49,881 | $35,932 |
| Bachelor's Degree | $73,048 | $50,491 |
| Graduate Degree | $84,358 | $66,234 |
| Total | $49,042 | $36,801 |
Family Income in Sussex County
Family Income Brackets in Sussex County
According to the Sussex County family income data, there are 14,468 families falling into the $100,000 to $149,999 income range, which is the most common income bracket and makes up 21.3% of all families. Conversely, the $10,000 to $14,999 income bracket is the least frequent group with only 1,155 families (1.7%) belonging to this category.
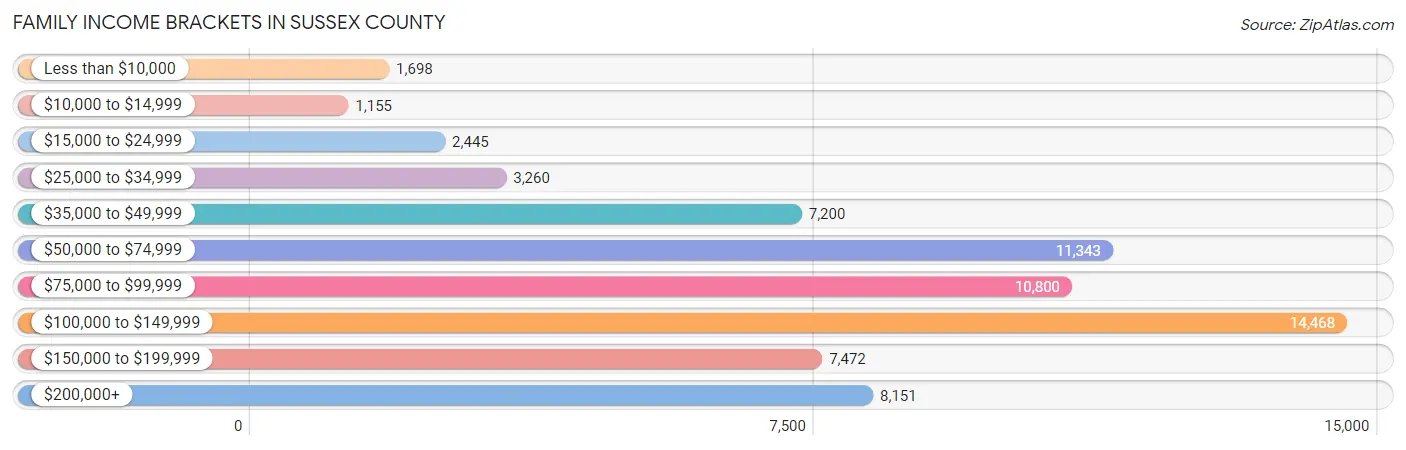
| Income Bracket | # Families | % Families |
| Less than $10,000 | 1,698 | 2.5% |
| $10,000 to $14,999 | 1,155 | 1.7% |
| $15,000 to $24,999 | 2,445 | 3.6% |
| $25,000 to $34,999 | 3,260 | 4.8% |
| $35,000 to $49,999 | 7,200 | 10.6% |
| $50,000 to $74,999 | 11,343 | 16.7% |
| $75,000 to $99,999 | 10,800 | 15.9% |
| $100,000 to $149,999 | 14,468 | 21.3% |
| $150,000 to $199,999 | 7,472 | 11.0% |
| $200,000+ | 8,151 | 12.0% |
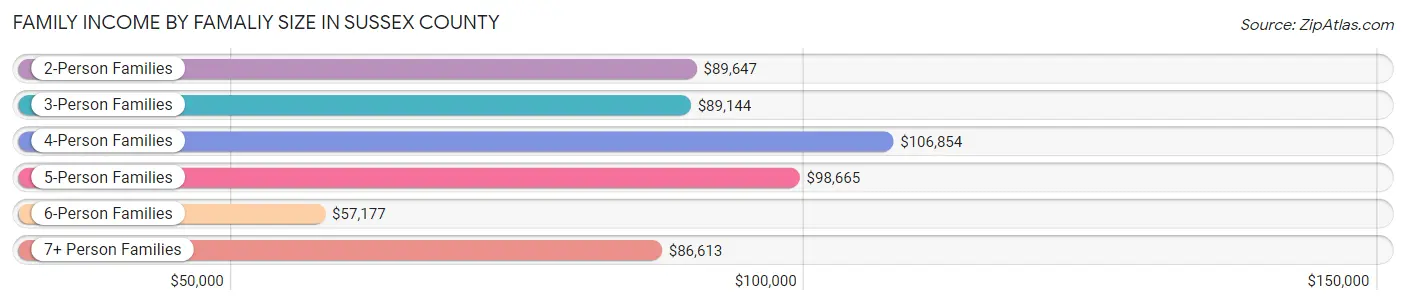
Family Income by Famaliy Size in Sussex County
4-person families (9,022 | 13.3%) account for the highest median family income in Sussex County with $106,854 per family, while 2-person families (41,229 | 60.7%) have the highest median income of $44,824 per family member.
| Income Bracket | # Families | Median Income |
| 2-Person Families | 41,229 (60.7%) | $89,647 |
| 3-Person Families | 11,929 (17.6%) | $89,144 |
| 4-Person Families | 9,022 (13.3%) | $106,854 |
| 5-Person Families | 3,690 (5.4%) | $98,665 |
| 6-Person Families | 1,306 (1.9%) | $57,177 |
| 7+ Person Families | 748 (1.1%) | $86,613 |
| Total | 67,924 (100.0%) | $91,800 |
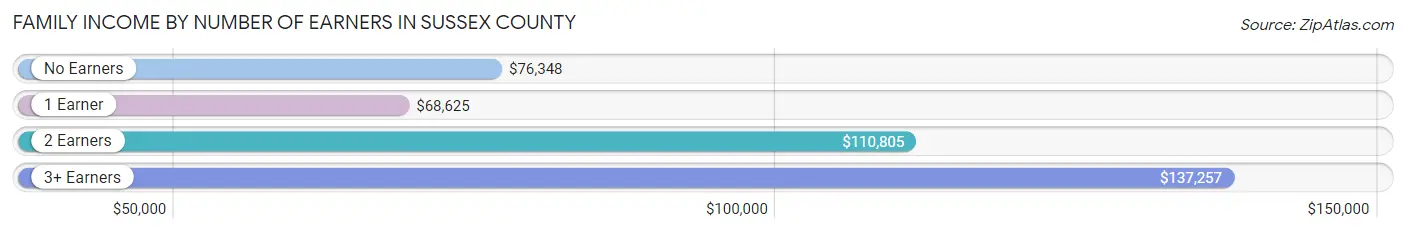
Family Income by Number of Earners in Sussex County
The median family income in Sussex County is $91,800, with families comprising 3+ earners (6,402) having the highest median family income of $137,257, while families with 1 earner (21,737) have the lowest median family income of $68,625, accounting for 9.4% and 32.0% of families, respectively.
| Number of Earners | # Families | Median Income |
| No Earners | 17,815 (26.2%) | $76,348 |
| 1 Earner | 21,737 (32.0%) | $68,625 |
| 2 Earners | 21,970 (32.3%) | $110,805 |
| 3+ Earners | 6,402 (9.4%) | $137,257 |
| Total | 67,924 (100.0%) | $91,800 |
Household Income in Sussex County
Household Income Brackets in Sussex County
With 17,375 households falling in the category, the $100,000 to $149,999 income range is the most frequent in Sussex County, accounting for 17.4% of all households. In contrast, only 3,595 households (3.6%) fall into the $10,000 to $14,999 income bracket, making it the least populous group.

| Income Bracket | # Households | % Households |
| Less than $10,000 | 3,894 | 3.9% |
| $10,000 to $14,999 | 3,595 | 3.6% |
| $15,000 to $24,999 | 6,591 | 6.6% |
| $25,000 to $34,999 | 7,290 | 7.3% |
| $35,000 to $49,999 | 11,683 | 11.7% |
| $50,000 to $74,999 | 16,676 | 16.7% |
| $75,000 to $99,999 | 14,579 | 14.6% |
| $100,000 to $149,999 | 17,375 | 17.4% |
| $150,000 to $199,999 | 8,788 | 8.8% |
| $200,000+ | 9,487 | 9.5% |
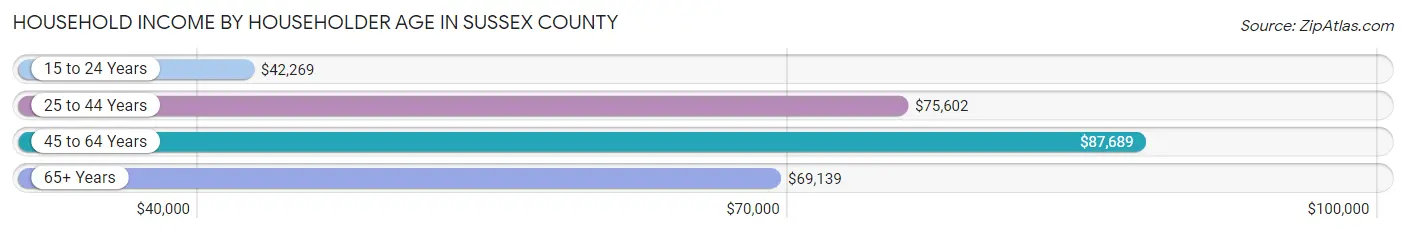
Household Income by Householder Age in Sussex County
The median household income in Sussex County is $75,406, with the highest median household income of $87,689 found in the 45 to 64 years age bracket for the primary householder. A total of 35,089 households (35.1%) fall into this category. Meanwhile, the 15 to 24 years age bracket for the primary householder has the lowest median household income of $42,269, with 1,498 households (1.5%) in this group.
| Income Bracket | # Households | Median Income |
| 15 to 24 Years | 1,498 (1.5%) | $42,269 |
| 25 to 44 Years | 20,297 (20.3%) | $75,602 |
| 45 to 64 Years | 35,089 (35.1%) | $87,689 |
| 65+ Years | 42,974 (43.0%) | $69,139 |
| Total | 99,858 (100.0%) | $75,406 |
Poverty in Sussex County
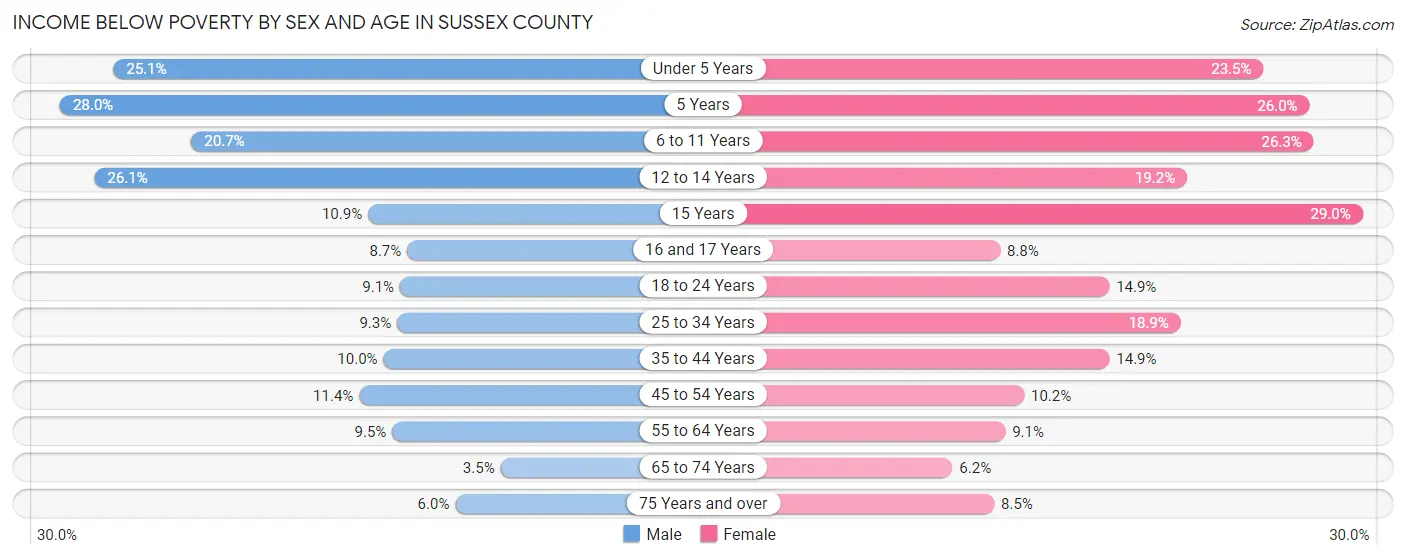
Income Below Poverty by Sex and Age in Sussex County
With 10.5% poverty level for males and 12.7% for females among the residents of Sussex County, 5 year old males and 15 year old females are the most vulnerable to poverty, with 245 males (28.0%) and 339 females (29.0%) in their respective age groups living below the poverty level.
| Age Bracket | Male | Female |
| Under 5 Years | 1,447 (25.1%) | 1,268 (23.5%) |
| 5 Years | 245 (28.0%) | 200 (26.0%) |
| 6 to 11 Years | 1,426 (20.7%) | 1,985 (26.3%) |
| 12 to 14 Years | 1,160 (26.1%) | 661 (19.2%) |
| 15 Years | 158 (10.9%) | 339 (29.0%) |
| 16 and 17 Years | 204 (8.7%) | 218 (8.8%) |
| 18 to 24 Years | 702 (9.1%) | 1,062 (14.9%) |
| 25 to 34 Years | 1,061 (9.3%) | 2,182 (18.9%) |
| 35 to 44 Years | 1,121 (10.0%) | 1,723 (14.9%) |
| 45 to 54 Years | 1,406 (11.4%) | 1,333 (10.2%) |
| 55 to 64 Years | 1,733 (9.5%) | 1,942 (9.1%) |
| 65 to 74 Years | 723 (3.5%) | 1,423 (6.2%) |
| 75 Years and over | 708 (6.0%) | 1,155 (8.5%) |
| Total | 12,094 (10.5%) | 15,491 (12.7%) |
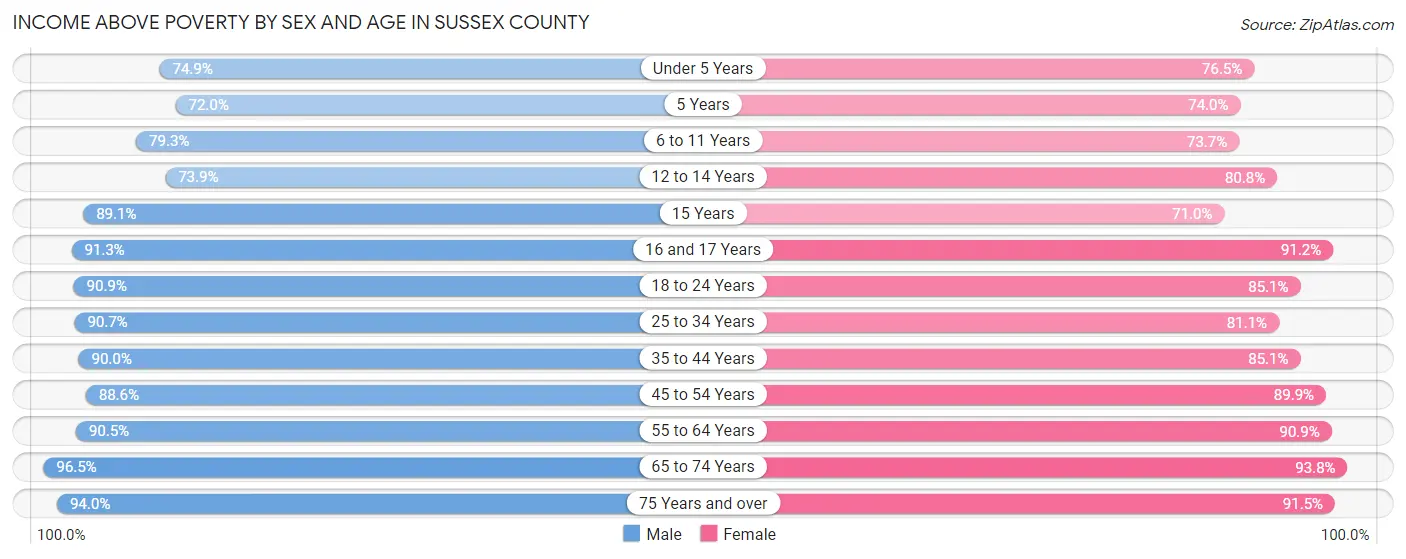
Income Above Poverty by Sex and Age in Sussex County
According to the poverty statistics in Sussex County, males aged 65 to 74 years and females aged 65 to 74 years are the age groups that are most secure financially, with 96.5% of males and 93.8% of females in these age groups living above the poverty line.
| Age Bracket | Male | Female |
| Under 5 Years | 4,326 (74.9%) | 4,134 (76.5%) |
| 5 Years | 629 (72.0%) | 568 (74.0%) |
| 6 to 11 Years | 5,461 (79.3%) | 5,570 (73.7%) |
| 12 to 14 Years | 3,283 (73.9%) | 2,779 (80.8%) |
| 15 Years | 1,294 (89.1%) | 830 (71.0%) |
| 16 and 17 Years | 2,140 (91.3%) | 2,256 (91.2%) |
| 18 to 24 Years | 7,009 (90.9%) | 6,071 (85.1%) |
| 25 to 34 Years | 10,402 (90.7%) | 9,379 (81.1%) |
| 35 to 44 Years | 10,062 (90.0%) | 9,843 (85.1%) |
| 45 to 54 Years | 10,955 (88.6%) | 11,796 (89.8%) |
| 55 to 64 Years | 16,461 (90.5%) | 19,389 (90.9%) |
| 65 to 74 Years | 19,905 (96.5%) | 21,666 (93.8%) |
| 75 Years and over | 11,054 (94.0%) | 12,468 (91.5%) |
| Total | 102,981 (89.5%) | 106,749 (87.3%) |
Income Below Poverty Among Married-Couple Families in Sussex County
The poverty statistics for married-couple families in Sussex County show that 4.3% or 2,272 of the total 52,846 families live below the poverty line. Families with 5 or more children have the highest poverty rate of 30.6%, comprising of 64 families. On the other hand, families with no children have the lowest poverty rate of 3.1%, which includes 1,221 families.

| Children | Above Poverty | Below Poverty |
| No Children | 38,223 (96.9%) | 1,221 (3.1%) |
| 1 or 2 Children | 10,139 (95.0%) | 531 (5.0%) |
| 3 or 4 Children | 2,067 (81.9%) | 456 (18.1%) |
| 5 or more Children | 145 (69.4%) | 64 (30.6%) |
| Total | 50,574 (95.7%) | 2,272 (4.3%) |
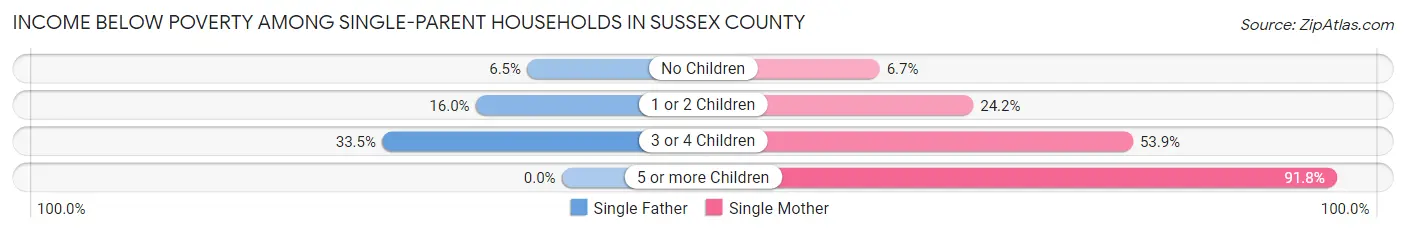
Income Below Poverty Among Single-Parent Households in Sussex County
According to the poverty data in Sussex County, 12.9% or 592 single-father households and 22.1% or 2,312 single-mother households are living below the poverty line. Among single-father households, those with 3 or 4 children have the highest poverty rate, with 82 households (33.5%) experiencing poverty. Likewise, among single-mother households, those with 5 or more children have the highest poverty rate, with 56 households (91.8%) falling below the poverty line.
| Children | Single Father | Single Mother |
| No Children | 123 (6.5%) | 267 (6.7%) |
| 1 or 2 Children | 387 (16.0%) | 1,198 (24.1%) |
| 3 or 4 Children | 82 (33.5%) | 791 (53.9%) |
| 5 or more Children | 0 (0.0%) | 56 (91.8%) |
| Total | 592 (12.9%) | 2,312 (22.1%) |
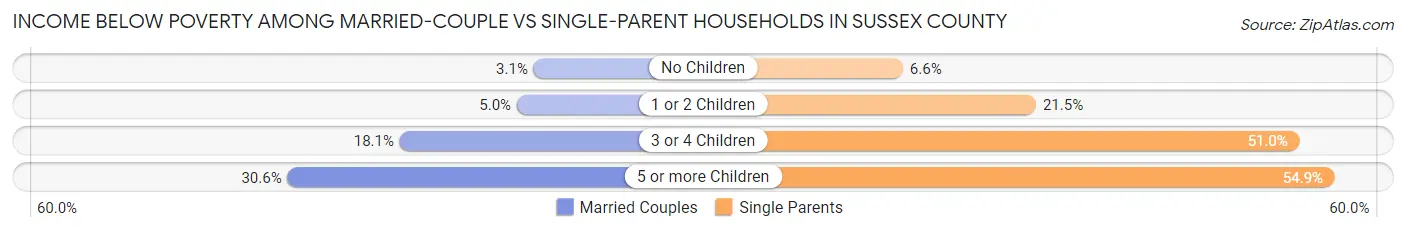
Income Below Poverty Among Married-Couple vs Single-Parent Households in Sussex County
The poverty data for Sussex County shows that 2,272 of the married-couple family households (4.3%) and 2,904 of the single-parent households (19.3%) are living below the poverty level. Within the married-couple family households, those with 5 or more children have the highest poverty rate, with 64 households (30.6%) falling below the poverty line. Among the single-parent households, those with 5 or more children have the highest poverty rate, with 56 household (54.9%) living below poverty.
| Children | Married-Couple Families | Single-Parent Households |
| No Children | 1,221 (3.1%) | 390 (6.6%) |
| 1 or 2 Children | 531 (5.0%) | 1,585 (21.5%) |
| 3 or 4 Children | 456 (18.1%) | 873 (51.0%) |
| 5 or more Children | 64 (30.6%) | 56 (54.9%) |
| Total | 2,272 (4.3%) | 2,904 (19.3%) |
Employment Characteristics in Sussex County
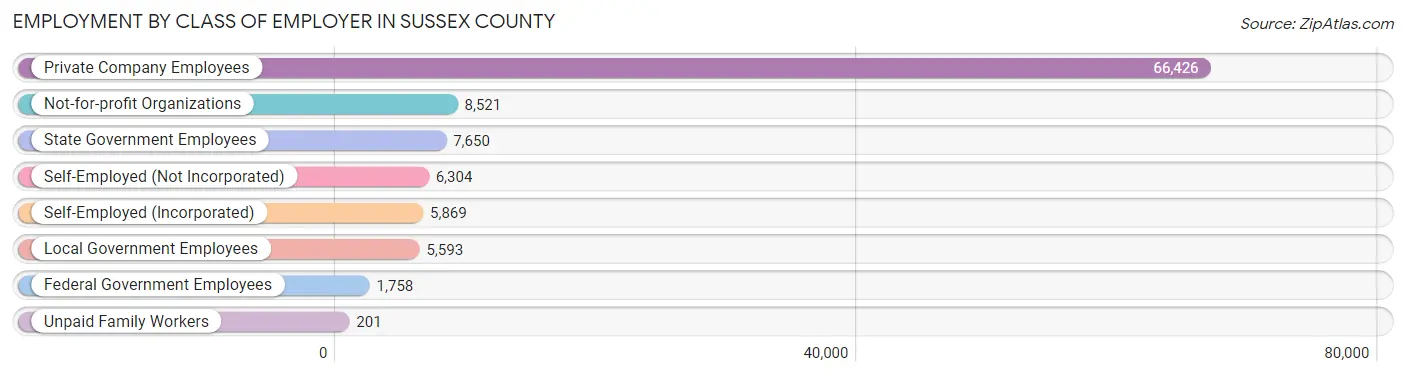
Employment by Class of Employer in Sussex County
Among the 102,322 employed individuals in Sussex County, private company employees (66,426 | 64.9%), not-for-profit organizations (8,521 | 8.3%), and state government employees (7,650 | 7.5%) make up the most common classes of employment.
| Employer Class | # Employees | % Employees |
| Private Company Employees | 66,426 | 64.9% |
| Self-Employed (Incorporated) | 5,869 | 5.7% |
| Self-Employed (Not Incorporated) | 6,304 | 6.2% |
| Not-for-profit Organizations | 8,521 | 8.3% |
| Local Government Employees | 5,593 | 5.5% |
| State Government Employees | 7,650 | 7.5% |
| Federal Government Employees | 1,758 | 1.7% |
| Unpaid Family Workers | 201 | 0.2% |
| Total | 102,322 | 100.0% |
Employment Status by Age in Sussex County
According to the labor force statistics for Sussex County, out of the total population over 16 years of age (201,972), 54.3% or 109,671 individuals are in the labor force, with 5.0% or 5,484 of them unemployed. The age group with the highest labor force participation rate is 25 to 29 years, with 85.6% or 9,993 individuals in the labor force. Within the labor force, the 16 to 19 years age range has the highest percentage of unemployed individuals, with 15.1% or 714 of them being unemployed.
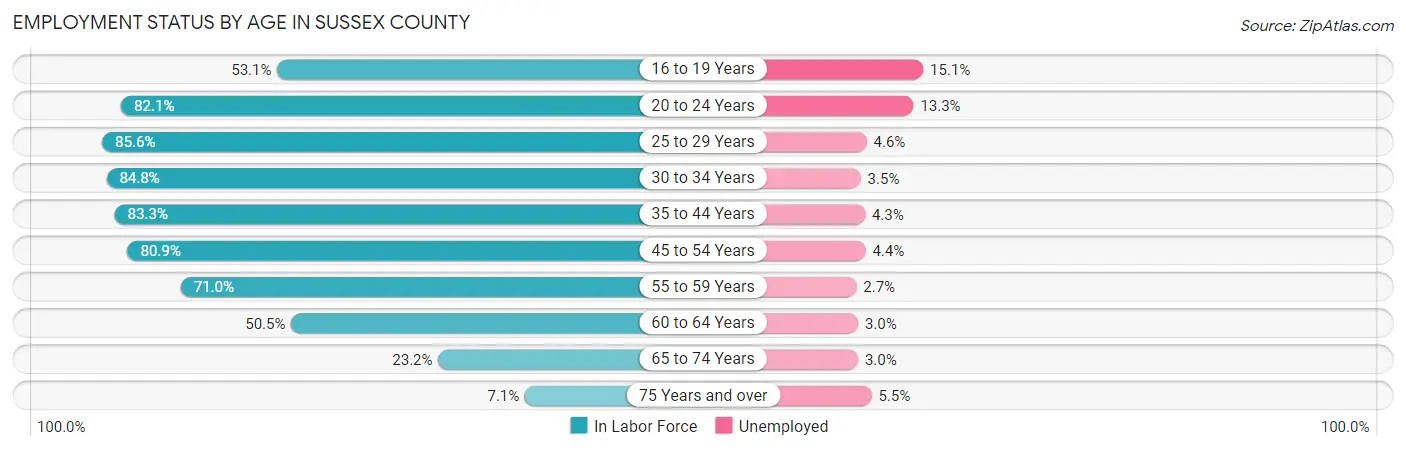
| Age Bracket | In Labor Force | Unemployed |
| 16 to 19 Years | 4,730 (53.1%) | 714 (15.1%) |
| 20 to 24 Years | 8,978 (82.1%) | 1,194 (13.3%) |
| 25 to 29 Years | 9,993 (85.6%) | 460 (4.6%) |
| 30 to 34 Years | 9,943 (84.8%) | 348 (3.5%) |
| 35 to 44 Years | 19,197 (83.3%) | 825 (4.3%) |
| 45 to 54 Years | 20,807 (80.9%) | 916 (4.4%) |
| 55 to 59 Years | 13,046 (71.0%) | 352 (2.7%) |
| 60 to 64 Years | 10,805 (50.5%) | 324 (3.0%) |
| 65 to 74 Years | 10,211 (23.2%) | 306 (3.0%) |
| 75 Years and over | 1,859 (7.1%) | 102 (5.5%) |
| Total | 109,671 (54.3%) | 5,484 (5.0%) |
Employment Status by Educational Attainment in Sussex County
According to labor force statistics for Sussex County, 74.9% of individuals (83,839) out of the total population between 25 and 64 years of age (111,935) are in the labor force, with 3.8% or 3,186 of them being unemployed. The group with the highest labor force participation rate are those with the educational attainment of bachelor's degree or higher, with 79.7% or 26,248 individuals in the labor force. Within the labor force, individuals with high school diploma education have the highest percentage of unemployment, with 5.4% or 1,343 of them being unemployed.
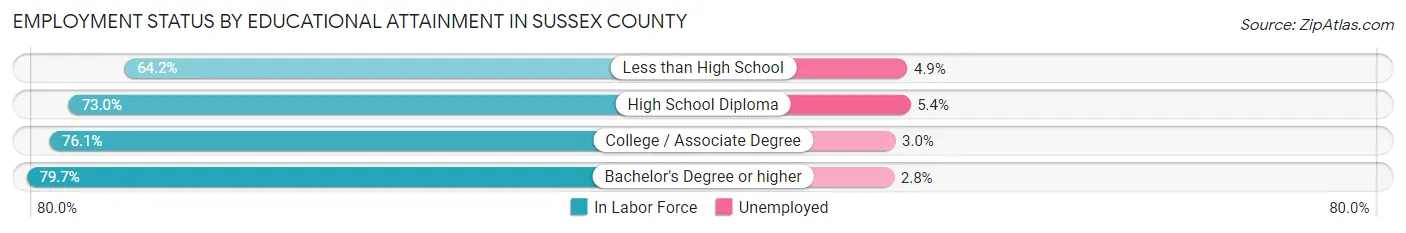
| Educational Attainment | In Labor Force | Unemployed |
| Less than High School | 8,268 (64.2%) | 631 (4.9%) |
| High School Diploma | 24,862 (73.0%) | 1,839 (5.4%) |
| College / Associate Degree | 24,401 (76.1%) | 962 (3.0%) |
| Bachelor's Degree or higher | 26,248 (79.7%) | 922 (2.8%) |
| Total | 83,839 (74.9%) | 4,254 (3.8%) |
Employment Occupations by Sex in Sussex County
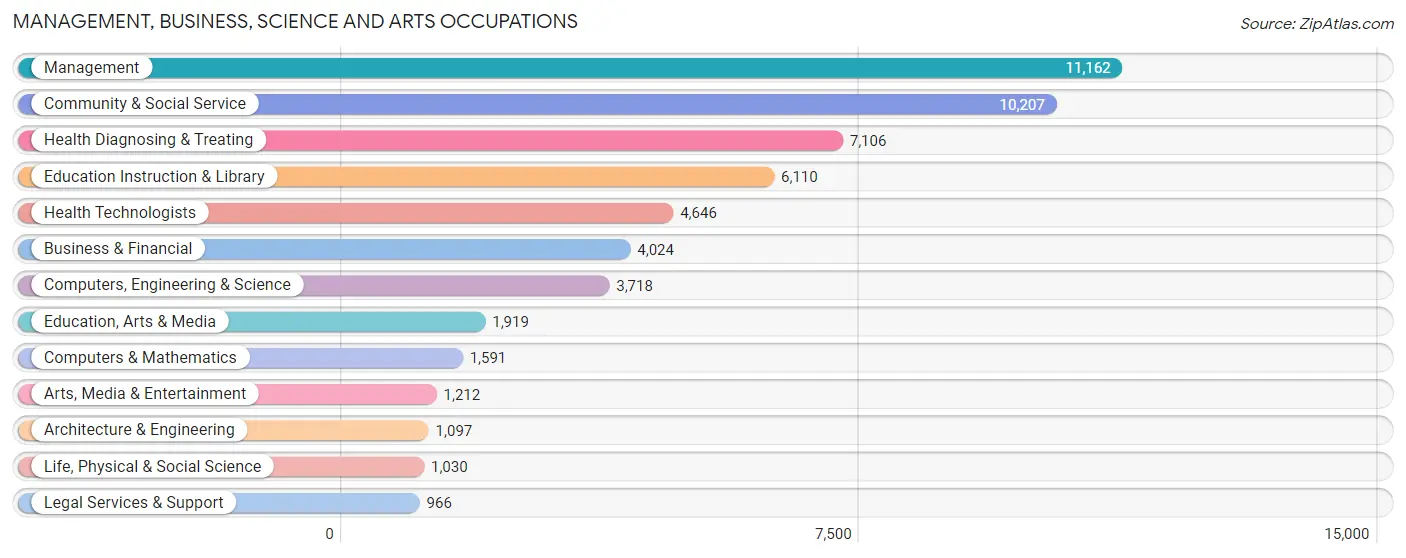
Management, Business, Science and Arts Occupations
The most common Management, Business, Science and Arts occupations in Sussex County are Management (11,162 | 10.7%), Community & Social Service (10,207 | 9.8%), Health Diagnosing & Treating (7,106 | 6.8%), Education Instruction & Library (6,110 | 5.9%), and Health Technologists (4,646 | 4.5%).
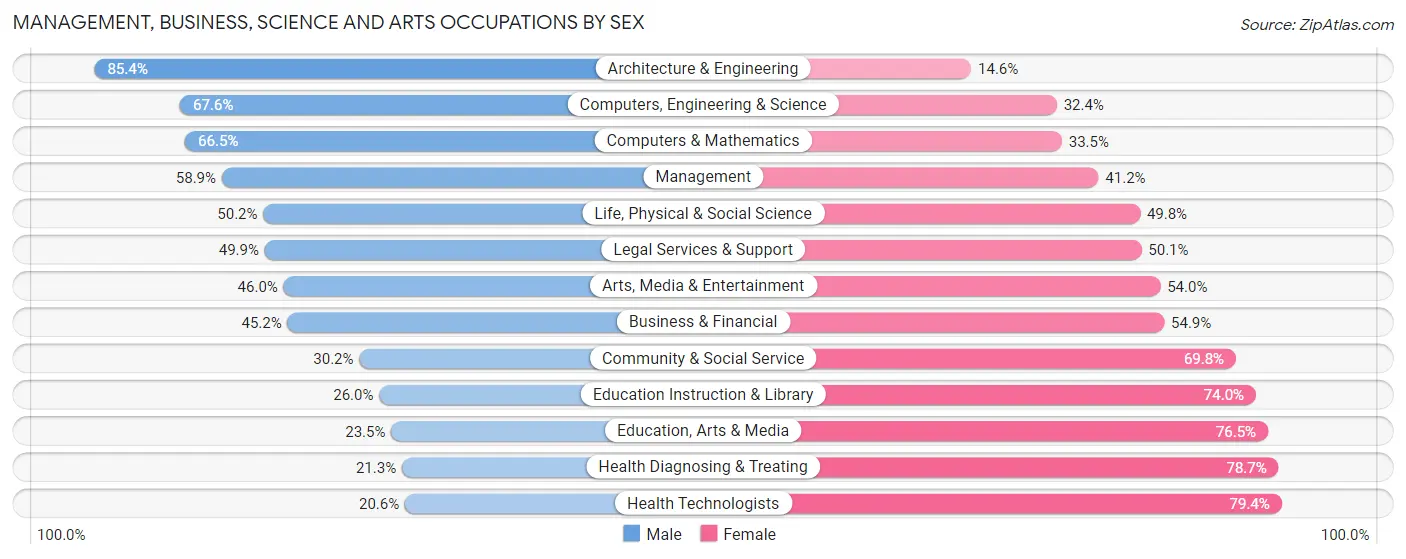
Management, Business, Science and Arts Occupations by Sex
Within the Management, Business, Science and Arts occupations in Sussex County, the most male-oriented occupations are Architecture & Engineering (85.4%), Computers, Engineering & Science (67.6%), and Computers & Mathematics (66.5%), while the most female-oriented occupations are Health Technologists (79.4%), Health Diagnosing & Treating (78.7%), and Education, Arts & Media (76.5%).
| Occupation | Male | Female |
| Management | 6,569 (58.9%) | 4,593 (41.1%) |
| Business & Financial | 1,817 (45.2%) | 2,207 (54.8%) |
| Computers, Engineering & Science | 2,512 (67.6%) | 1,206 (32.4%) |
| Computers & Mathematics | 1,058 (66.5%) | 533 (33.5%) |
| Architecture & Engineering | 937 (85.4%) | 160 (14.6%) |
| Life, Physical & Social Science | 517 (50.2%) | 513 (49.8%) |
| Community & Social Service | 3,079 (30.2%) | 7,128 (69.8%) |
| Education, Arts & Media | 451 (23.5%) | 1,468 (76.5%) |
| Legal Services & Support | 482 (49.9%) | 484 (50.1%) |
| Education Instruction & Library | 1,589 (26.0%) | 4,521 (74.0%) |
| Arts, Media & Entertainment | 557 (46.0%) | 655 (54.0%) |
| Health Diagnosing & Treating | 1,512 (21.3%) | 5,594 (78.7%) |
| Health Technologists | 959 (20.6%) | 3,687 (79.4%) |
| Total (Category) | 15,489 (42.8%) | 20,728 (57.2%) |
| Total (Overall) | 54,310 (52.3%) | 49,551 (47.7%) |
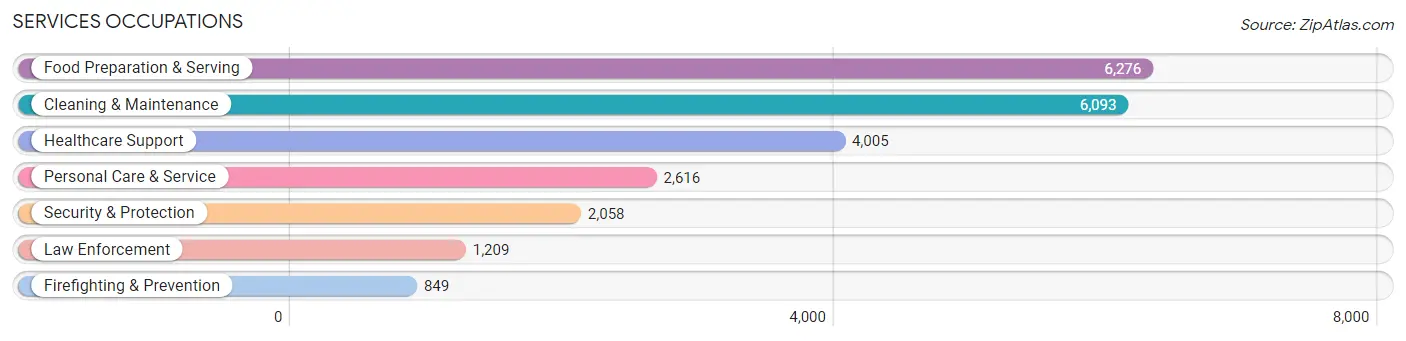
Services Occupations
The most common Services occupations in Sussex County are Food Preparation & Serving (6,276 | 6.0%), Cleaning & Maintenance (6,093 | 5.9%), Healthcare Support (4,005 | 3.9%), Personal Care & Service (2,616 | 2.5%), and Security & Protection (2,058 | 2.0%).
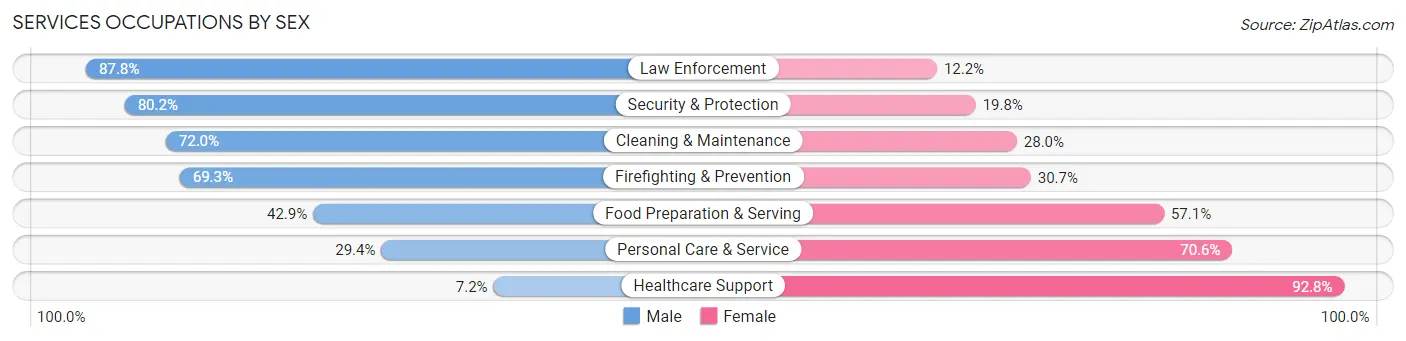
Services Occupations by Sex
Within the Services occupations in Sussex County, the most male-oriented occupations are Law Enforcement (87.8%), Security & Protection (80.2%), and Cleaning & Maintenance (72.0%), while the most female-oriented occupations are Healthcare Support (92.8%), Personal Care & Service (70.6%), and Food Preparation & Serving (57.1%).
| Occupation | Male | Female |
| Healthcare Support | 287 (7.2%) | 3,718 (92.8%) |
| Security & Protection | 1,650 (80.2%) | 408 (19.8%) |
| Firefighting & Prevention | 588 (69.3%) | 261 (30.7%) |
| Law Enforcement | 1,062 (87.8%) | 147 (12.2%) |
| Food Preparation & Serving | 2,691 (42.9%) | 3,585 (57.1%) |
| Cleaning & Maintenance | 4,388 (72.0%) | 1,705 (28.0%) |
| Personal Care & Service | 768 (29.4%) | 1,848 (70.6%) |
| Total (Category) | 9,784 (46.5%) | 11,264 (53.5%) |
| Total (Overall) | 54,310 (52.3%) | 49,551 (47.7%) |
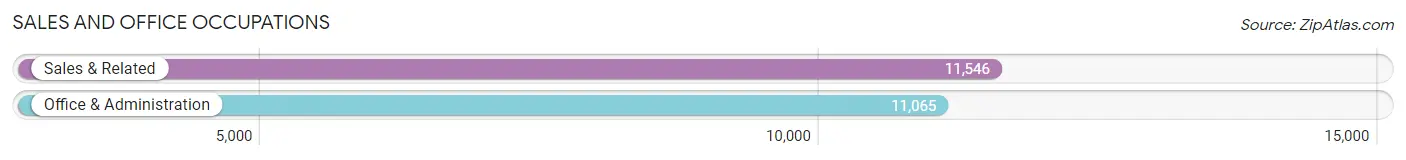
Sales and Office Occupations
The most common Sales and Office occupations in Sussex County are Sales & Related (11,546 | 11.1%), and Office & Administration (11,065 | 10.6%).
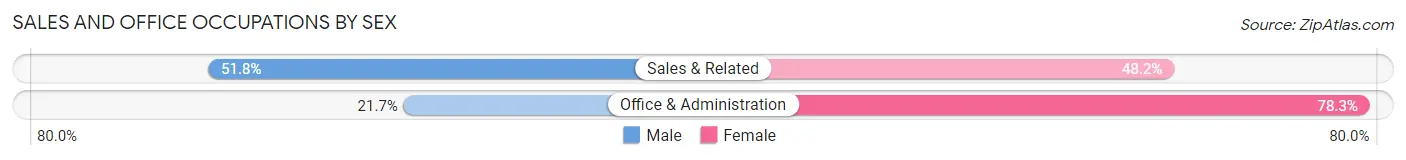
Sales and Office Occupations by Sex
| Occupation | Male | Female |
| Sales & Related | 5,976 (51.8%) | 5,570 (48.2%) |
| Office & Administration | 2,399 (21.7%) | 8,666 (78.3%) |
| Total (Category) | 8,375 (37.0%) | 14,236 (63.0%) |
| Total (Overall) | 54,310 (52.3%) | 49,551 (47.7%) |
Natural Resources, Construction and Maintenance Occupations
The most common Natural Resources, Construction and Maintenance occupations in Sussex County are Construction & Extraction (7,057 | 6.8%), Installation, Maintenance & Repair (3,915 | 3.8%), and Farming, Fishing & Forestry (801 | 0.8%).
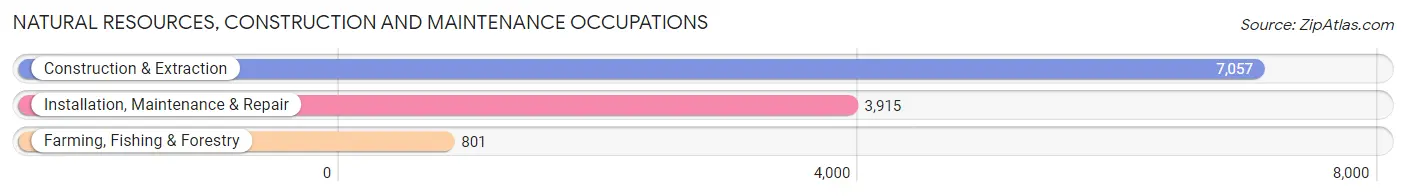
Natural Resources, Construction and Maintenance Occupations by Sex
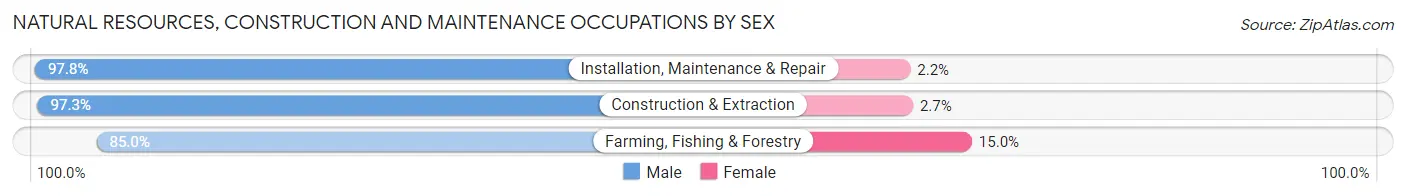
| Occupation | Male | Female |
| Farming, Fishing & Forestry | 681 (85.0%) | 120 (15.0%) |
| Construction & Extraction | 6,865 (97.3%) | 192 (2.7%) |
| Installation, Maintenance & Repair | 3,830 (97.8%) | 85 (2.2%) |
| Total (Category) | 11,376 (96.6%) | 397 (3.4%) |
| Total (Overall) | 54,310 (52.3%) | 49,551 (47.7%) |
Production, Transportation and Moving Occupations
The most common Production, Transportation and Moving occupations in Sussex County are Production (4,700 | 4.5%), Transportation (4,114 | 4.0%), and Material Moving (3,398 | 3.3%).
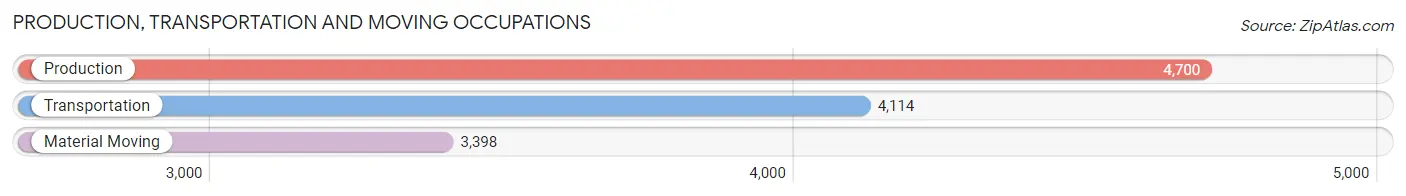
Production, Transportation and Moving Occupations by Sex
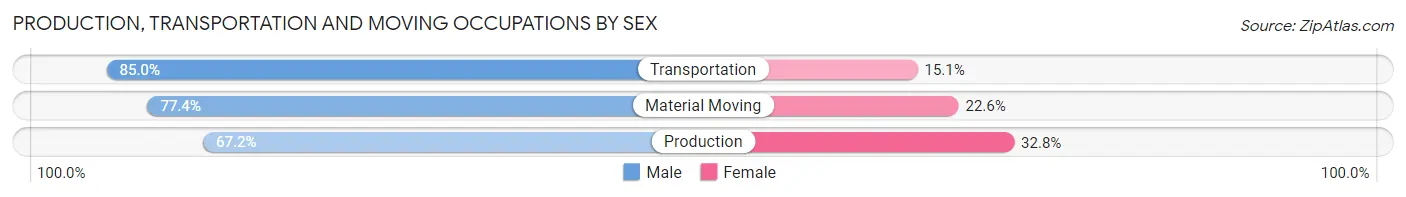
| Occupation | Male | Female |
| Production | 3,160 (67.2%) | 1,540 (32.8%) |
| Transportation | 3,495 (85.0%) | 619 (15.0%) |
| Material Moving | 2,631 (77.4%) | 767 (22.6%) |
| Total (Category) | 9,286 (76.0%) | 2,926 (24.0%) |
| Total (Overall) | 54,310 (52.3%) | 49,551 (47.7%) |
Employment Industries by Sex in Sussex County
Employment Industries in Sussex County
The major employment industries in Sussex County include Health Care & Social Assistance (15,243 | 14.7%), Retail Trade (13,227 | 12.7%), Construction (10,358 | 10.0%), Educational Services (8,756 | 8.4%), and Manufacturing (8,171 | 7.9%).

Employment Industries by Sex in Sussex County
The Sussex County industries that see more men than women are Mining, Quarrying, & Extraction (95.0%), Construction (87.2%), and Agriculture, Fishing & Hunting (80.4%), whereas the industries that tend to have a higher number of women are Enterprise Management (85.7%), Health Care & Social Assistance (83.5%), and Educational Services (70.2%).
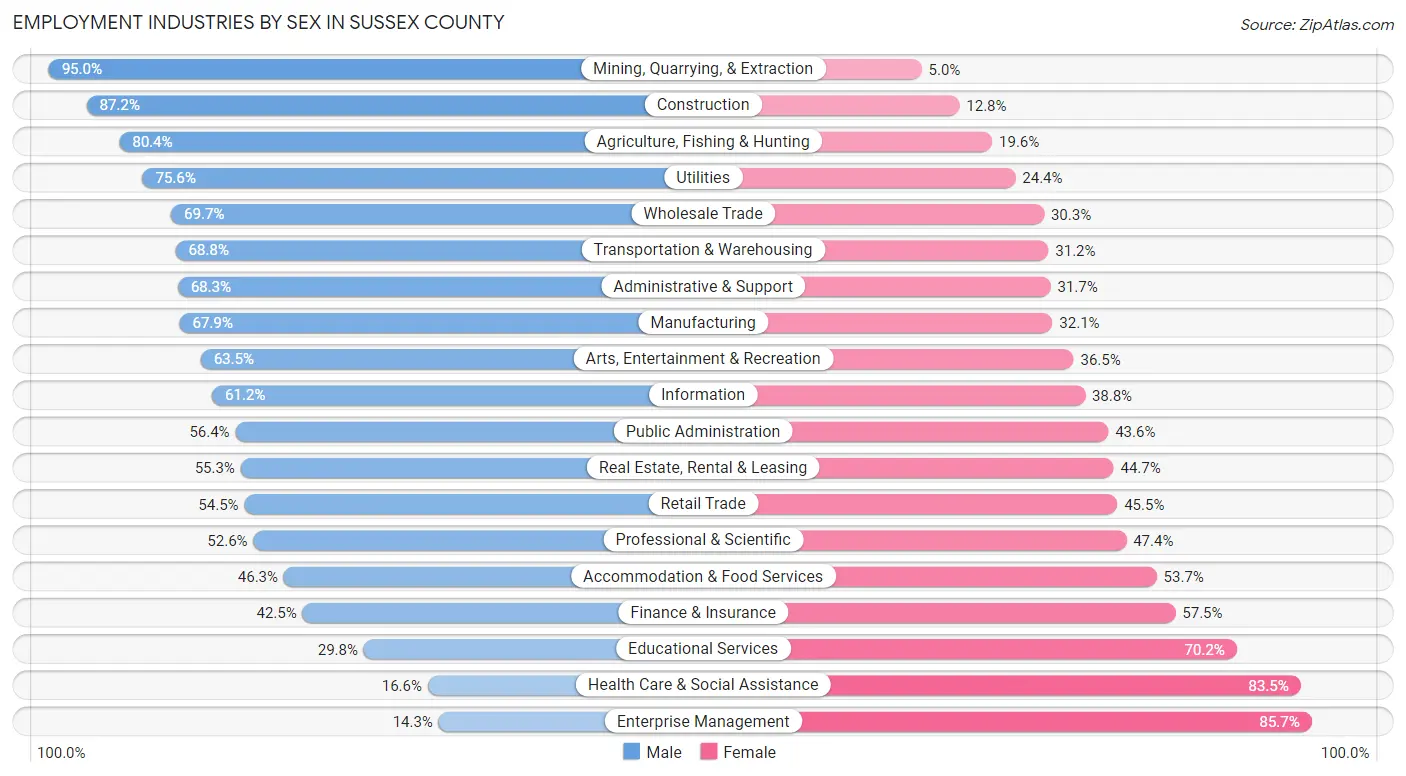
| Industry | Male | Female |
| Agriculture, Fishing & Hunting | 1,920 (80.4%) | 468 (19.6%) |
| Mining, Quarrying, & Extraction | 76 (95.0%) | 4 (5.0%) |
| Construction | 9,030 (87.2%) | 1,328 (12.8%) |
| Manufacturing | 5,550 (67.9%) | 2,621 (32.1%) |
| Wholesale Trade | 1,320 (69.7%) | 575 (30.3%) |
| Retail Trade | 7,209 (54.5%) | 6,018 (45.5%) |
| Transportation & Warehousing | 2,754 (68.8%) | 1,251 (31.2%) |
| Utilities | 573 (75.6%) | 185 (24.4%) |
| Information | 648 (61.2%) | 411 (38.8%) |
| Finance & Insurance | 1,573 (42.5%) | 2,131 (57.5%) |
| Real Estate, Rental & Leasing | 1,421 (55.3%) | 1,150 (44.7%) |
| Professional & Scientific | 3,039 (52.6%) | 2,734 (47.4%) |
| Enterprise Management | 8 (14.3%) | 48 (85.7%) |
| Administrative & Support | 3,816 (68.3%) | 1,771 (31.7%) |
| Educational Services | 2,608 (29.8%) | 6,148 (70.2%) |
| Health Care & Social Assistance | 2,523 (16.6%) | 12,720 (83.5%) |
| Arts, Entertainment & Recreation | 1,241 (63.5%) | 712 (36.5%) |
| Accommodation & Food Services | 3,637 (46.3%) | 4,211 (53.7%) |
| Public Administration | 2,997 (56.4%) | 2,321 (43.6%) |
| Total | 54,310 (52.3%) | 49,551 (47.7%) |
Education in Sussex County
School Enrollment in Sussex County
The most common levels of schooling among the 42,593 students in Sussex County are high school (10,044 | 23.6%), middle school (9,848 | 23.1%), and elementary school (9,097 | 21.4%).
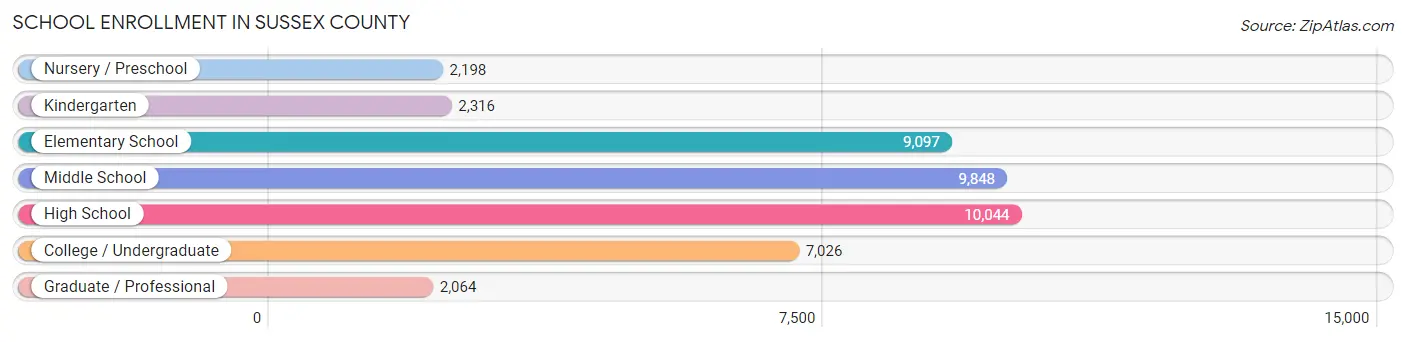
| School Level | # Students | % Students |
| Nursery / Preschool | 2,198 | 5.2% |
| Kindergarten | 2,316 | 5.4% |
| Elementary School | 9,097 | 21.4% |
| Middle School | 9,848 | 23.1% |
| High School | 10,044 | 23.6% |
| College / Undergraduate | 7,026 | 16.5% |
| Graduate / Professional | 2,064 | 4.9% |
| Total | 42,593 | 100.0% |
School Enrollment by Age by Funding Source in Sussex County
Out of a total of 42,593 students who are enrolled in schools in Sussex County, 4,941 (11.6%) attend a private institution, while the remaining 37,652 (88.4%) are enrolled in public schools. The age group of 3 to 4 year olds has the highest likelihood of being enrolled in private schools, with 638 (35.9% in the age bracket) enrolled. Conversely, the age group of 10 to 14 year olds has the lowest likelihood of being enrolled in a private school, with 11,474 (93.2% in the age bracket) attending a public institution.
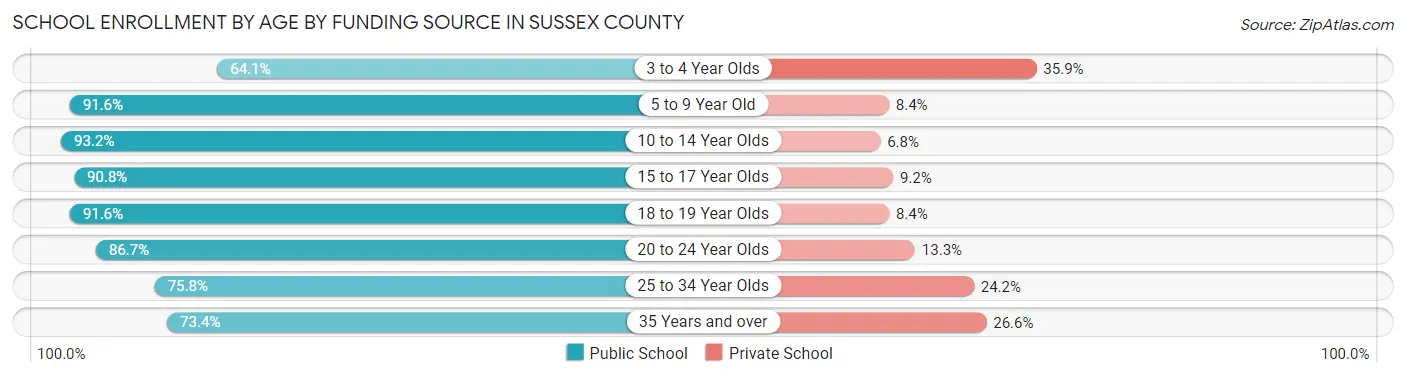
| Age Bracket | Public School | Private School |
| 3 to 4 Year Olds | 1,139 (64.1%) | 638 (35.9%) |
| 5 to 9 Year Old | 9,856 (91.6%) | 906 (8.4%) |
| 10 to 14 Year Olds | 11,474 (93.2%) | 839 (6.8%) |
| 15 to 17 Year Olds | 6,533 (90.8%) | 662 (9.2%) |
| 18 to 19 Year Olds | 2,202 (91.6%) | 203 (8.4%) |
| 20 to 24 Year Olds | 2,699 (86.7%) | 413 (13.3%) |
| 25 to 34 Year Olds | 1,619 (75.8%) | 518 (24.2%) |
| 35 Years and over | 2,124 (73.4%) | 768 (26.6%) |
| Total | 37,652 (88.4%) | 4,941 (11.6%) |
Educational Attainment by Field of Study in Sussex County
Business (12,601 | 20.4%), education (9,841 | 15.9%), science & technology (6,362 | 10.3%), social sciences (5,489 | 8.9%), and arts & humanities (4,069 | 6.6%) are the most common fields of study among 61,781 individuals in Sussex County who have obtained a bachelor's degree or higher.
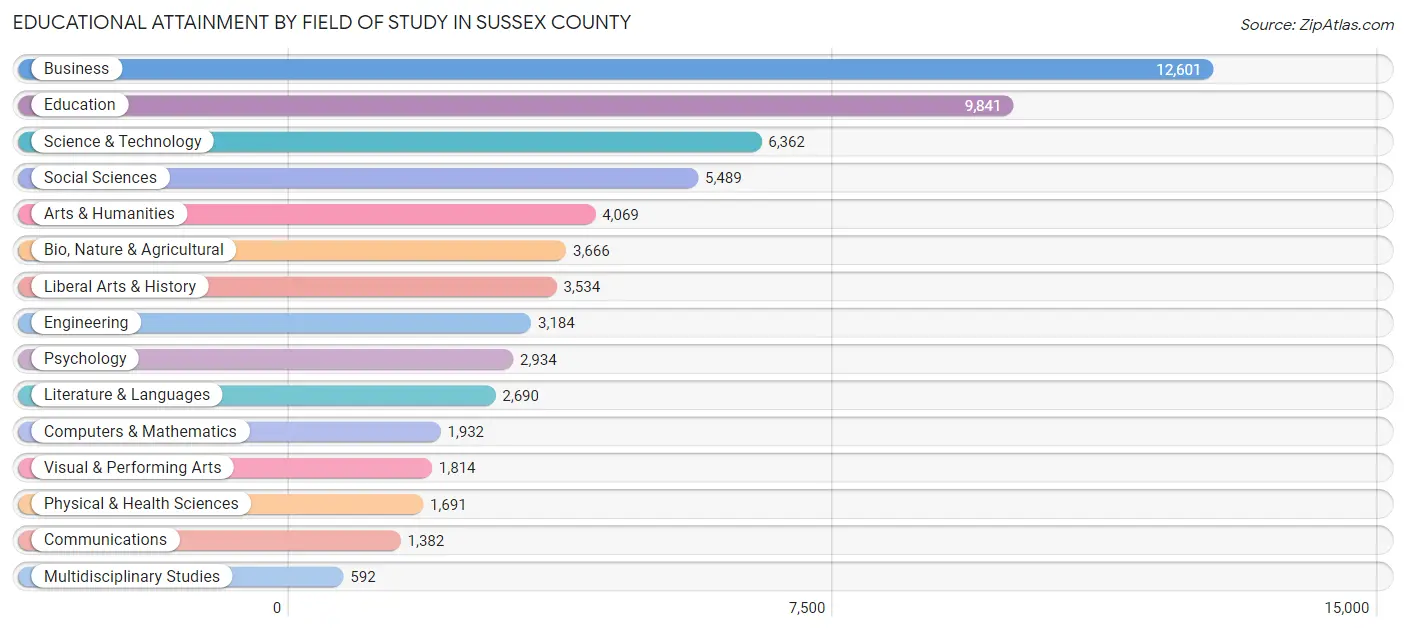
| Field of Study | # Graduates | % Graduates |
| Computers & Mathematics | 1,932 | 3.1% |
| Bio, Nature & Agricultural | 3,666 | 5.9% |
| Physical & Health Sciences | 1,691 | 2.7% |
| Psychology | 2,934 | 4.8% |
| Social Sciences | 5,489 | 8.9% |
| Engineering | 3,184 | 5.1% |
| Multidisciplinary Studies | 592 | 1.0% |
| Science & Technology | 6,362 | 10.3% |
| Business | 12,601 | 20.4% |
| Education | 9,841 | 15.9% |
| Literature & Languages | 2,690 | 4.3% |
| Liberal Arts & History | 3,534 | 5.7% |
| Visual & Performing Arts | 1,814 | 2.9% |
| Communications | 1,382 | 2.2% |
| Arts & Humanities | 4,069 | 6.6% |
| Total | 61,781 | 100.0% |
Transportation & Commute in Sussex County
Vehicle Availability by Sex in Sussex County
The most prevalent vehicle ownership categories in Sussex County are males with 2 vehicles (21,595, accounting for 40.4%) and females with 2 vehicles (18,952, making up 44.3%).
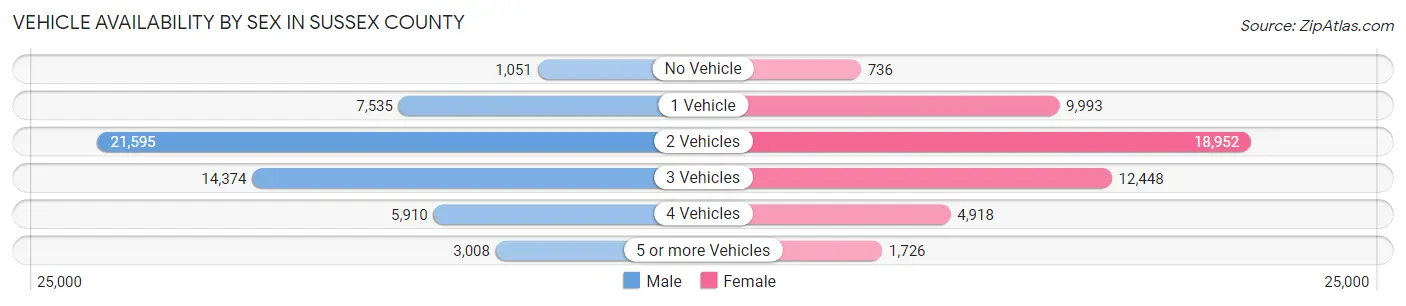
| Vehicles Available | Male | Female |
| No Vehicle | 1,051 (2.0%) | 736 (1.5%) |
| 1 Vehicle | 7,535 (14.1%) | 9,993 (20.5%) |
| 2 Vehicles | 21,595 (40.4%) | 18,952 (38.9%) |
| 3 Vehicles | 14,374 (26.9%) | 12,448 (25.5%) |
| 4 Vehicles | 5,910 (11.1%) | 4,918 (10.1%) |
| 5 or more Vehicles | 3,008 (5.6%) | 1,726 (3.5%) |
| Total | 53,473 (100.0%) | 48,773 (100.0%) |
Commute Time in Sussex County
The most frequently occuring commute durations in Sussex County are 20 to 24 minutes (14,085 commuters, 15.4%), 30 to 34 minutes (13,322 commuters, 14.5%), and 15 to 19 minutes (13,321 commuters, 14.5%).
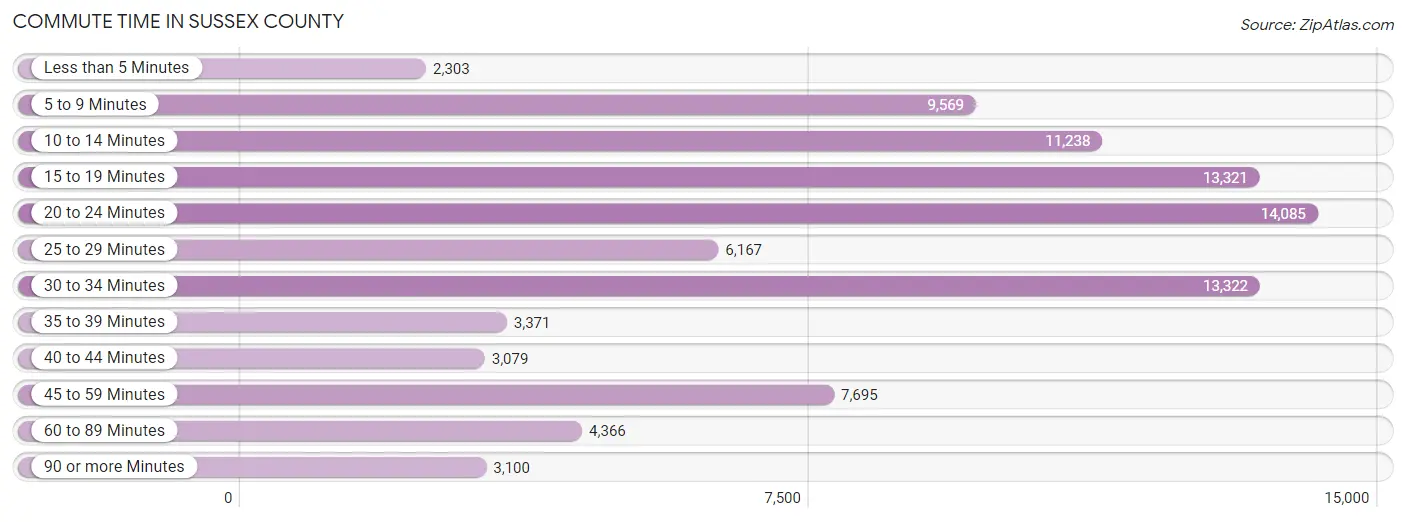
| Commute Time | # Commuters | % Commuters |
| Less than 5 Minutes | 2,303 | 2.5% |
| 5 to 9 Minutes | 9,569 | 10.4% |
| 10 to 14 Minutes | 11,238 | 12.3% |
| 15 to 19 Minutes | 13,321 | 14.5% |
| 20 to 24 Minutes | 14,085 | 15.4% |
| 25 to 29 Minutes | 6,167 | 6.7% |
| 30 to 34 Minutes | 13,322 | 14.5% |
| 35 to 39 Minutes | 3,371 | 3.7% |
| 40 to 44 Minutes | 3,079 | 3.4% |
| 45 to 59 Minutes | 7,695 | 8.4% |
| 60 to 89 Minutes | 4,366 | 4.8% |
| 90 or more Minutes | 3,100 | 3.4% |
Commute Time by Sex in Sussex County
The most common commute times in Sussex County are 20 to 24 minutes (7,439 commuters, 15.6%) for males and 20 to 24 minutes (6,646 commuters, 15.1%) for females.

| Commute Time | Male | Female |
| Less than 5 Minutes | 1,195 (2.5%) | 1,108 (2.5%) |
| 5 to 9 Minutes | 4,519 (9.5%) | 5,050 (11.5%) |
| 10 to 14 Minutes | 5,655 (11.9%) | 5,583 (12.7%) |
| 15 to 19 Minutes | 6,791 (14.2%) | 6,530 (14.8%) |
| 20 to 24 Minutes | 7,439 (15.6%) | 6,646 (15.1%) |
| 25 to 29 Minutes | 3,147 (6.6%) | 3,020 (6.9%) |
| 30 to 34 Minutes | 6,866 (14.4%) | 6,456 (14.7%) |
| 35 to 39 Minutes | 1,610 (3.4%) | 1,761 (4.0%) |
| 40 to 44 Minutes | 1,453 (3.0%) | 1,626 (3.7%) |
| 45 to 59 Minutes | 3,888 (8.2%) | 3,807 (8.7%) |
| 60 to 89 Minutes | 2,865 (6.0%) | 1,501 (3.4%) |
| 90 or more Minutes | 2,220 (4.7%) | 880 (2.0%) |
Time of Departure to Work by Sex in Sussex County
The most frequent times of departure to work in Sussex County are 7:00 AM to 7:29 AM (7,369, 15.5%) for males and 7:00 AM to 7:29 AM (7,914, 18.0%) for females.
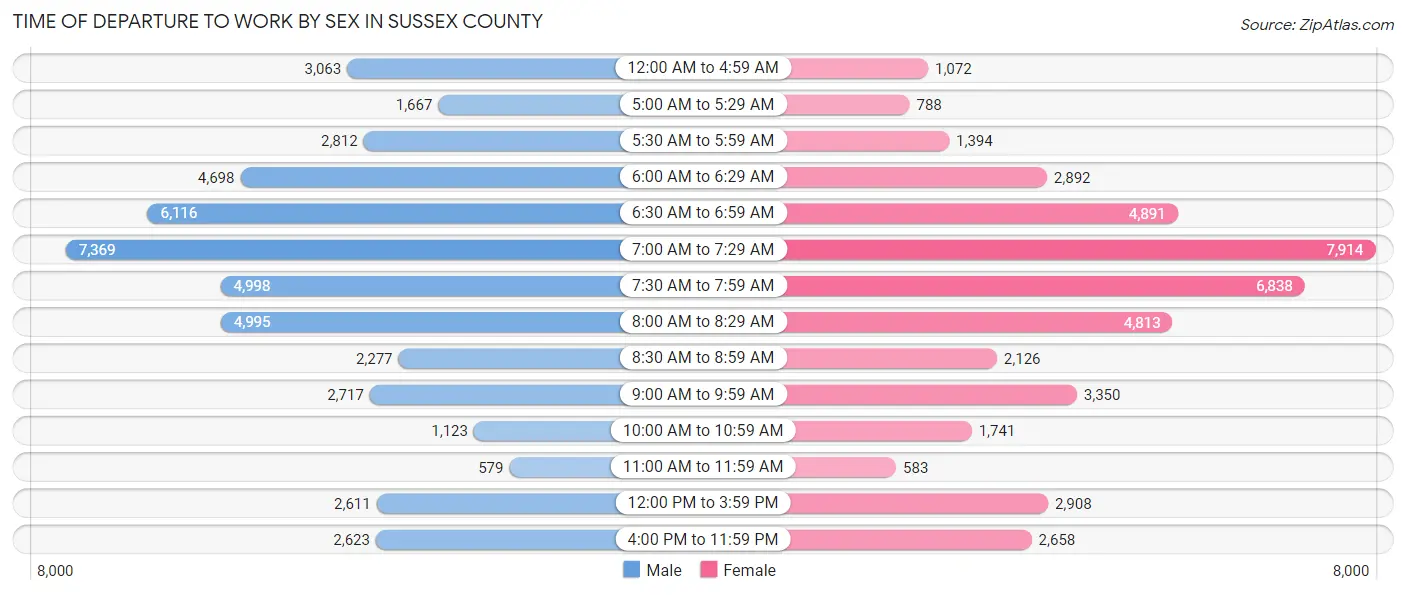
| Time of Departure | Male | Female |
| 12:00 AM to 4:59 AM | 3,063 (6.4%) | 1,072 (2.4%) |
| 5:00 AM to 5:29 AM | 1,667 (3.5%) | 788 (1.8%) |
| 5:30 AM to 5:59 AM | 2,812 (5.9%) | 1,394 (3.2%) |
| 6:00 AM to 6:29 AM | 4,698 (9.9%) | 2,892 (6.6%) |
| 6:30 AM to 6:59 AM | 6,116 (12.8%) | 4,891 (11.1%) |
| 7:00 AM to 7:29 AM | 7,369 (15.5%) | 7,914 (18.0%) |
| 7:30 AM to 7:59 AM | 4,998 (10.5%) | 6,838 (15.5%) |
| 8:00 AM to 8:29 AM | 4,995 (10.5%) | 4,813 (11.0%) |
| 8:30 AM to 8:59 AM | 2,277 (4.8%) | 2,126 (4.8%) |
| 9:00 AM to 9:59 AM | 2,717 (5.7%) | 3,350 (7.6%) |
| 10:00 AM to 10:59 AM | 1,123 (2.4%) | 1,741 (4.0%) |
| 11:00 AM to 11:59 AM | 579 (1.2%) | 583 (1.3%) |
| 12:00 PM to 3:59 PM | 2,611 (5.5%) | 2,908 (6.6%) |
| 4:00 PM to 11:59 PM | 2,623 (5.5%) | 2,658 (6.0%) |
| Total | 47,648 (100.0%) | 43,968 (100.0%) |
Housing Occupancy in Sussex County
Occupancy by Ownership in Sussex County
Of the total 99,858 dwellings in Sussex County, owner-occupied units account for 81,325 (81.4%), while renter-occupied units make up 18,533 (18.6%).
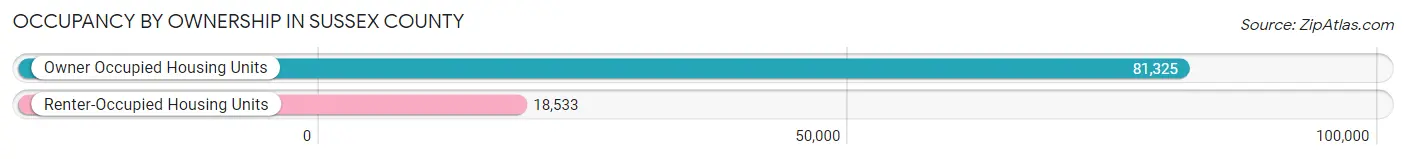
| Occupancy | # Housing Units | % Housing Units |
| Owner Occupied Housing Units | 81,325 | 81.4% |
| Renter-Occupied Housing Units | 18,533 | 18.6% |
| Total Occupied Housing Units | 99,858 | 100.0% |
Occupancy by Household Size in Sussex County
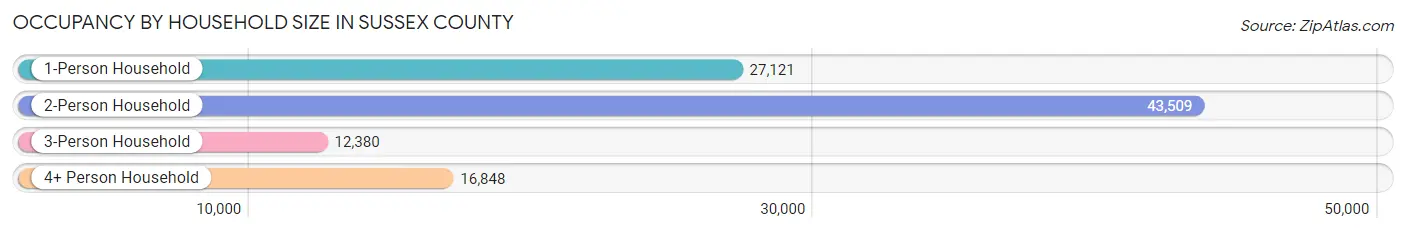
| Household Size | # Housing Units | % Housing Units |
| 1-Person Household | 27,121 | 27.2% |
| 2-Person Household | 43,509 | 43.6% |
| 3-Person Household | 12,380 | 12.4% |
| 4+ Person Household | 16,848 | 16.9% |
| Total Housing Units | 99,858 | 100.0% |
Occupancy by Ownership by Household Size in Sussex County
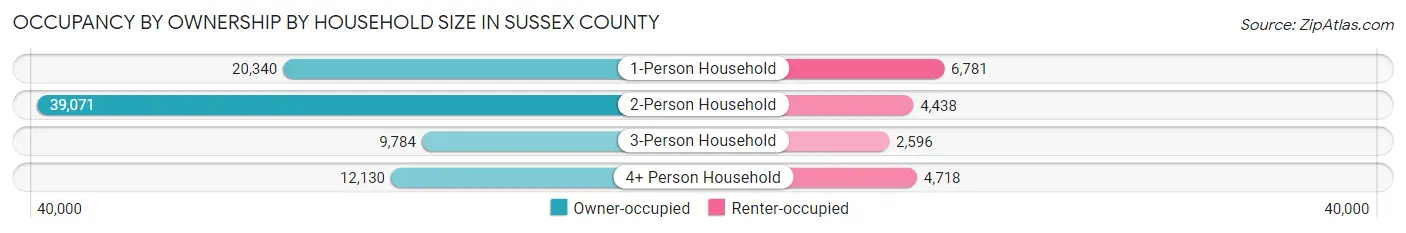
| Household Size | Owner-occupied | Renter-occupied |
| 1-Person Household | 20,340 (75.0%) | 6,781 (25.0%) |
| 2-Person Household | 39,071 (89.8%) | 4,438 (10.2%) |
| 3-Person Household | 9,784 (79.0%) | 2,596 (21.0%) |
| 4+ Person Household | 12,130 (72.0%) | 4,718 (28.0%) |
| Total Housing Units | 81,325 (81.4%) | 18,533 (18.6%) |
Occupancy by Educational Attainment in Sussex County
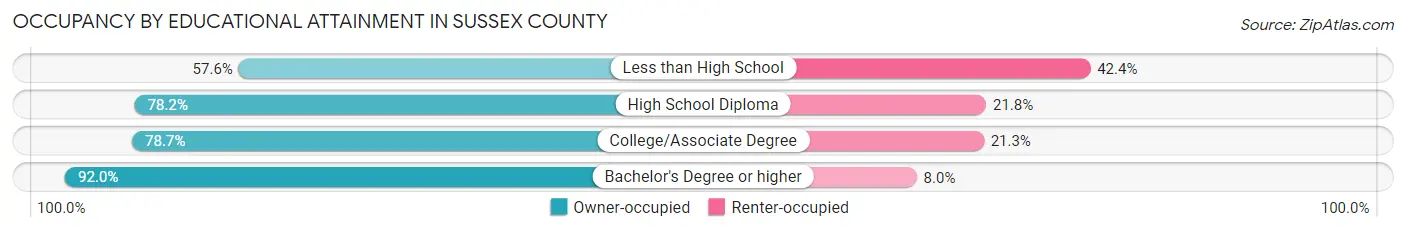
| Household Size | Owner-occupied | Renter-occupied |
| Less than High School | 4,677 (57.6%) | 3,448 (42.4%) |
| High School Diploma | 21,594 (78.2%) | 6,018 (21.8%) |
| College/Associate Degree | 23,187 (78.7%) | 6,283 (21.3%) |
| Bachelor's Degree or higher | 31,867 (92.0%) | 2,784 (8.0%) |
Occupancy by Age of Householder in Sussex County
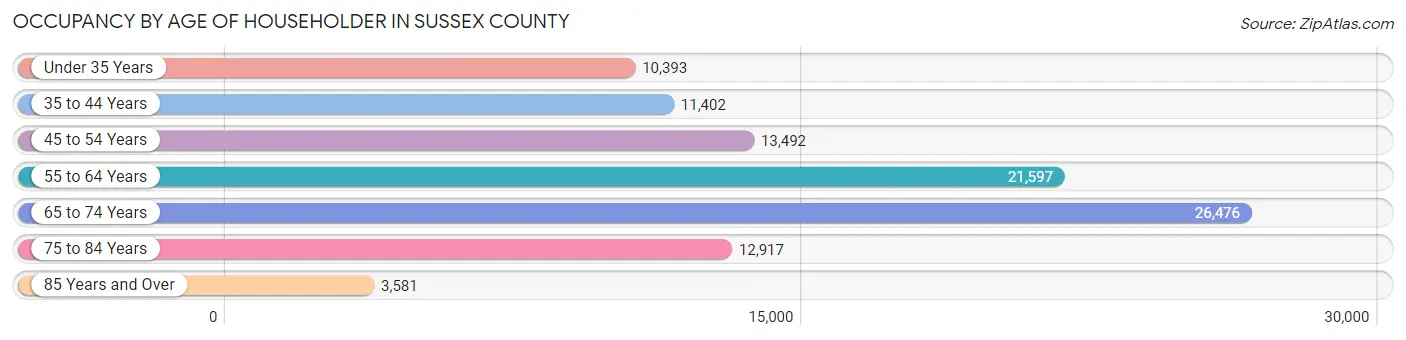
| Age Bracket | # Households | % Households |
| Under 35 Years | 10,393 | 10.4% |
| 35 to 44 Years | 11,402 | 11.4% |
| 45 to 54 Years | 13,492 | 13.5% |
| 55 to 64 Years | 21,597 | 21.6% |
| 65 to 74 Years | 26,476 | 26.5% |
| 75 to 84 Years | 12,917 | 12.9% |
| 85 Years and Over | 3,581 | 3.6% |
| Total | 99,858 | 100.0% |
Housing Finances in Sussex County
Median Income by Occupancy in Sussex County
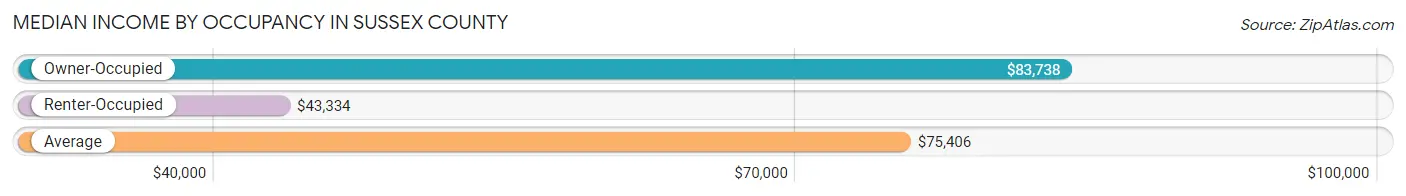
| Occupancy Type | # Households | Median Income |
| Owner-Occupied | 81,325 (81.4%) | $83,738 |
| Renter-Occupied | 18,533 (18.6%) | $43,334 |
| Average | 99,858 (100.0%) | $75,406 |
Occupancy by Householder Income Bracket in Sussex County
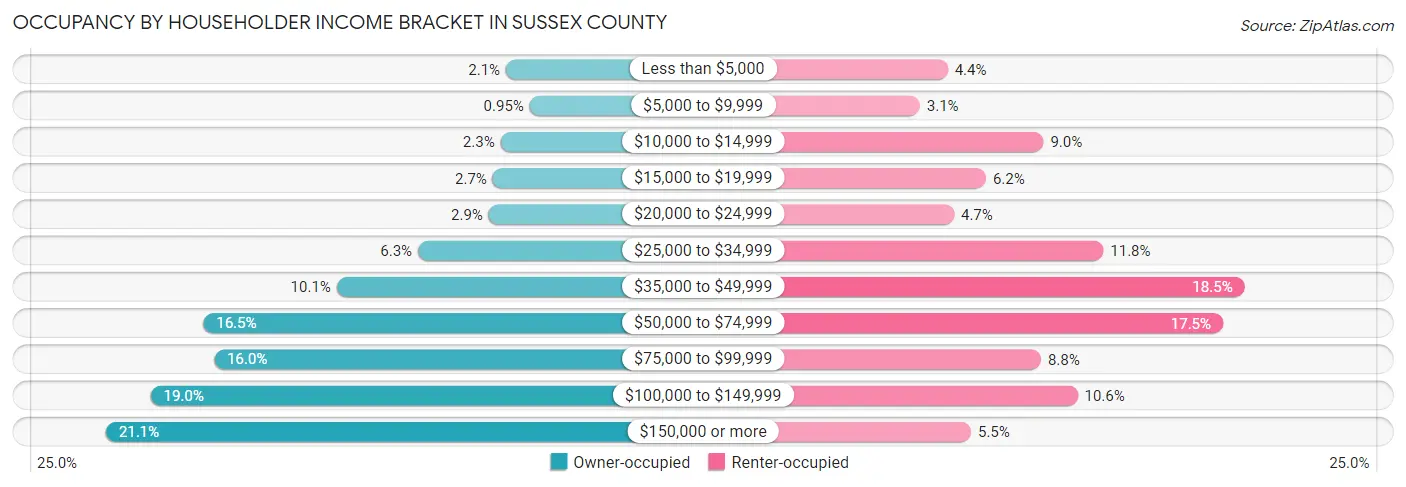
| Income Bracket | Owner-occupied | Renter-occupied |
| Less than $5,000 | 1,693 (2.1%) | 814 (4.4%) |
| $5,000 to $9,999 | 775 (0.9%) | 567 (3.1%) |
| $10,000 to $14,999 | 1,903 (2.3%) | 1,658 (8.9%) |
| $15,000 to $19,999 | 2,205 (2.7%) | 1,150 (6.2%) |
| $20,000 to $24,999 | 2,358 (2.9%) | 869 (4.7%) |
| $25,000 to $34,999 | 5,101 (6.3%) | 2,187 (11.8%) |
| $35,000 to $49,999 | 8,250 (10.1%) | 3,432 (18.5%) |
| $50,000 to $74,999 | 13,408 (16.5%) | 3,241 (17.5%) |
| $75,000 to $99,999 | 12,992 (16.0%) | 1,637 (8.8%) |
| $100,000 to $149,999 | 15,452 (19.0%) | 1,959 (10.6%) |
| $150,000 or more | 17,188 (21.1%) | 1,019 (5.5%) |
| Total | 81,325 (100.0%) | 18,533 (100.0%) |
Monthly Housing Cost Tiers in Sussex County
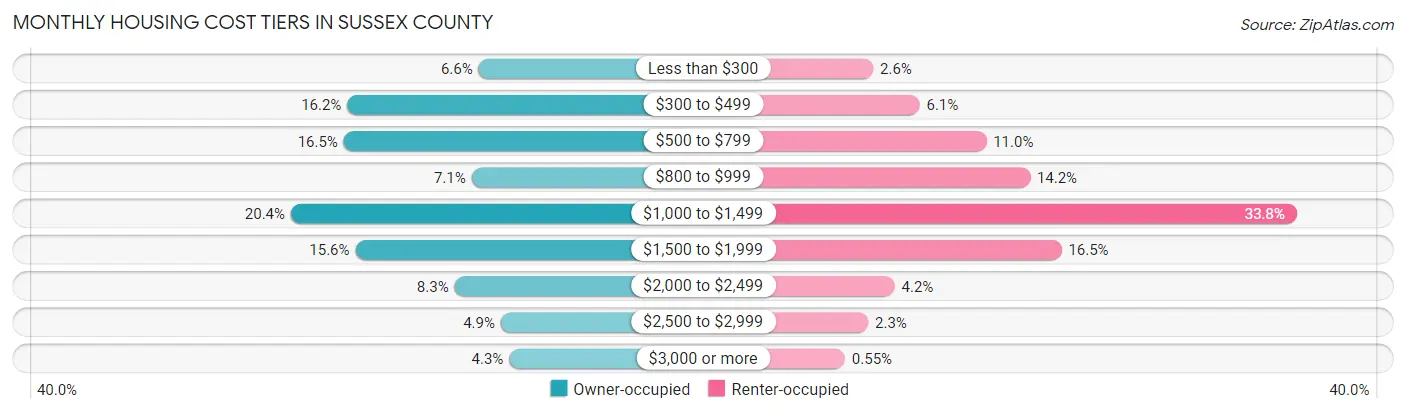
| Monthly Cost | Owner-occupied | Renter-occupied |
| Less than $300 | 5,344 (6.6%) | 488 (2.6%) |
| $300 to $499 | 13,209 (16.2%) | 1,122 (6.0%) |
| $500 to $799 | 13,416 (16.5%) | 2,031 (11.0%) |
| $800 to $999 | 5,756 (7.1%) | 2,628 (14.2%) |
| $1,000 to $1,499 | 16,583 (20.4%) | 6,270 (33.8%) |
| $1,500 to $1,999 | 12,722 (15.6%) | 3,058 (16.5%) |
| $2,000 to $2,499 | 6,786 (8.3%) | 780 (4.2%) |
| $2,500 to $2,999 | 4,007 (4.9%) | 418 (2.3%) |
| $3,000 or more | 3,502 (4.3%) | 102 (0.5%) |
| Total | 81,325 (100.0%) | 18,533 (100.0%) |
Physical Housing Characteristics in Sussex County
Housing Structures in Sussex County
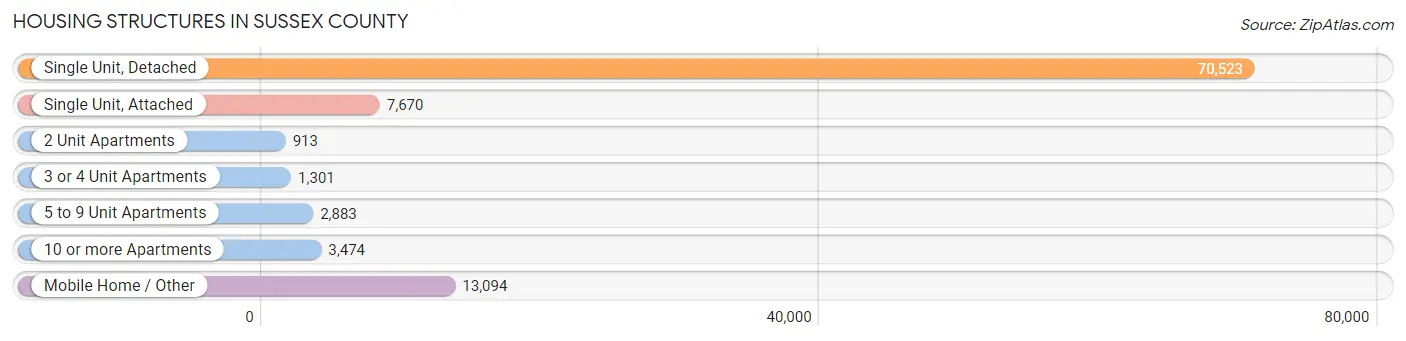
| Structure Type | # Housing Units | % Housing Units |
| Single Unit, Detached | 70,523 | 70.6% |
| Single Unit, Attached | 7,670 | 7.7% |
| 2 Unit Apartments | 913 | 0.9% |
| 3 or 4 Unit Apartments | 1,301 | 1.3% |
| 5 to 9 Unit Apartments | 2,883 | 2.9% |
| 10 or more Apartments | 3,474 | 3.5% |
| Mobile Home / Other | 13,094 | 13.1% |
| Total | 99,858 | 100.0% |
Housing Structures by Occupancy in Sussex County

| Structure Type | Owner-occupied | Renter-occupied |
| Single Unit, Detached | 63,242 (89.7%) | 7,281 (10.3%) |
| Single Unit, Attached | 5,923 (77.2%) | 1,747 (22.8%) |
| 2 Unit Apartments | 136 (14.9%) | 777 (85.1%) |
| 3 or 4 Unit Apartments | 323 (24.8%) | 978 (75.2%) |
| 5 to 9 Unit Apartments | 602 (20.9%) | 2,281 (79.1%) |
| 10 or more Apartments | 770 (22.2%) | 2,704 (77.8%) |
| Mobile Home / Other | 10,329 (78.9%) | 2,765 (21.1%) |
| Total | 81,325 (81.4%) | 18,533 (18.6%) |
Housing Structures by Number of Rooms in Sussex County
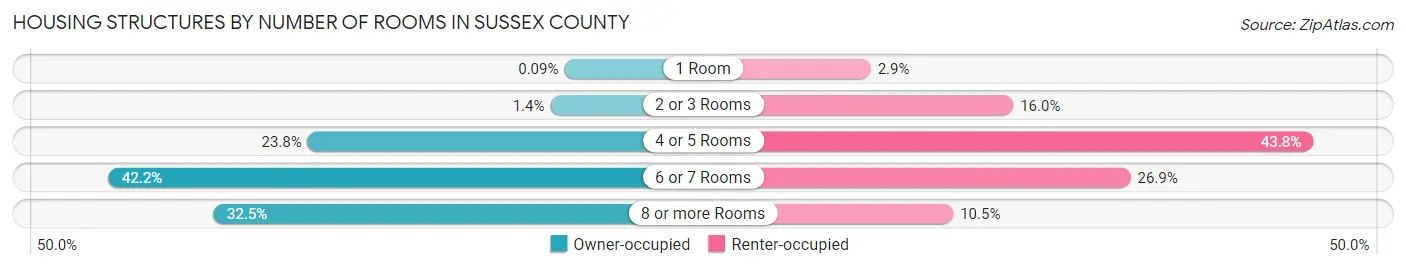
| Number of Rooms | Owner-occupied | Renter-occupied |
| 1 Room | 77 (0.1%) | 529 (2.9%) |
| 2 or 3 Rooms | 1,125 (1.4%) | 2,970 (16.0%) |
| 4 or 5 Rooms | 19,383 (23.8%) | 8,110 (43.8%) |
| 6 or 7 Rooms | 34,316 (42.2%) | 4,981 (26.9%) |
| 8 or more Rooms | 26,424 (32.5%) | 1,943 (10.5%) |
| Total | 81,325 (100.0%) | 18,533 (100.0%) |
Housing Structure by Heating Type in Sussex County
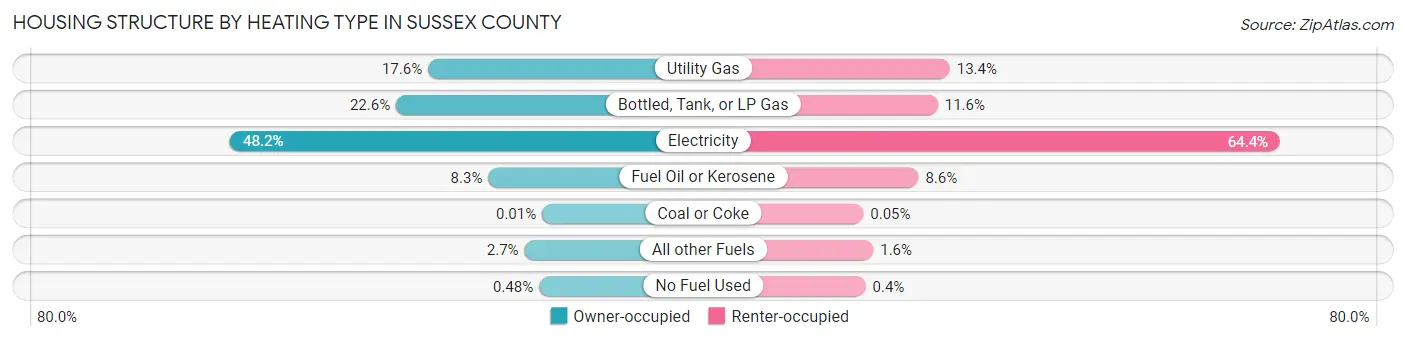
| Heating Type | Owner-occupied | Renter-occupied |
| Utility Gas | 14,342 (17.6%) | 2,486 (13.4%) |
| Bottled, Tank, or LP Gas | 18,374 (22.6%) | 2,140 (11.6%) |
| Electricity | 39,215 (48.2%) | 11,943 (64.4%) |
| Fuel Oil or Kerosene | 6,775 (8.3%) | 1,588 (8.6%) |
| Coal or Coke | 7 (0.0%) | 9 (0.1%) |
| All other Fuels | 2,221 (2.7%) | 293 (1.6%) |
| No Fuel Used | 391 (0.5%) | 74 (0.4%) |
| Total | 81,325 (100.0%) | 18,533 (100.0%) |
Household Vehicle Usage in Sussex County

| Vehicles per Household | Owner-occupied | Renter-occupied |
| No Vehicle | 1,642 (2.0%) | 1,992 (10.7%) |
| 1 Vehicle | 23,301 (28.6%) | 8,828 (47.6%) |
| 2 Vehicles | 35,792 (44.0%) | 5,279 (28.5%) |
| 3 or more Vehicles | 20,590 (25.3%) | 2,434 (13.1%) |
| Total | 81,325 (100.0%) | 18,533 (100.0%) |
Real Estate & Mortgages in Sussex County
Real Estate and Mortgage Overview in Sussex County
| Characteristic | Without Mortgage | With Mortgage |
| Housing Units | 35,746 | 45,579 |
| Median Property Value | $301,700 | $340,000 |
| Median Household Income | $65,890 | $11,648 |
| Monthly Housing Costs | $498 | $3,489 |
| Real Estate Taxes | $990 | $1,037 |
Property Value by Mortgage Status in Sussex County
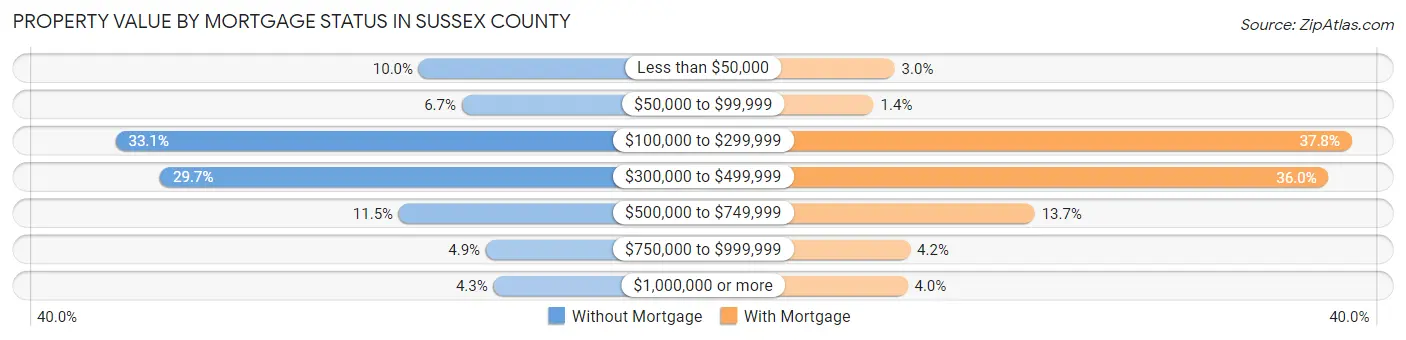
| Property Value | Without Mortgage | With Mortgage |
| Less than $50,000 | 3,561 (10.0%) | 1,358 (3.0%) |
| $50,000 to $99,999 | 2,390 (6.7%) | 631 (1.4%) |
| $100,000 to $299,999 | 11,820 (33.1%) | 17,235 (37.8%) |
| $300,000 to $499,999 | 10,611 (29.7%) | 16,428 (36.0%) |
| $500,000 to $749,999 | 4,103 (11.5%) | 6,222 (13.7%) |
| $750,000 to $999,999 | 1,735 (4.9%) | 1,898 (4.2%) |
| $1,000,000 or more | 1,526 (4.3%) | 1,807 (4.0%) |
| Total | 35,746 (100.0%) | 45,579 (100.0%) |
Household Income by Mortgage Status in Sussex County
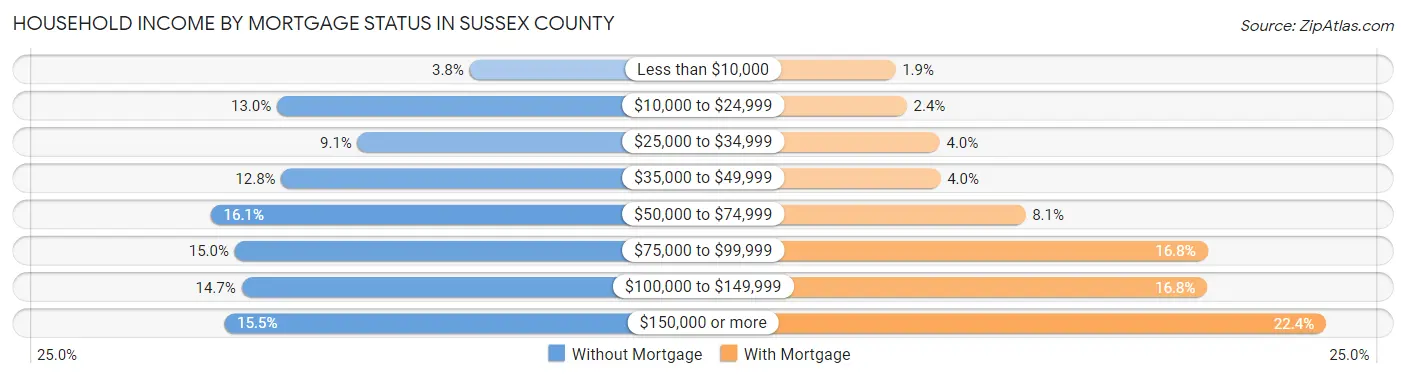
| Household Income | Without Mortgage | With Mortgage |
| Less than $10,000 | 1,361 (3.8%) | 861 (1.9%) |
| $10,000 to $24,999 | 4,641 (13.0%) | 1,107 (2.4%) |
| $25,000 to $34,999 | 3,266 (9.1%) | 1,825 (4.0%) |
| $35,000 to $49,999 | 4,565 (12.8%) | 1,835 (4.0%) |
| $50,000 to $74,999 | 5,770 (16.1%) | 3,685 (8.1%) |
| $75,000 to $99,999 | 5,359 (15.0%) | 7,638 (16.8%) |
| $100,000 to $149,999 | 5,244 (14.7%) | 7,633 (16.8%) |
| $150,000 or more | 5,540 (15.5%) | 10,208 (22.4%) |
| Total | 35,746 (100.0%) | 45,579 (100.0%) |
Property Value to Household Income Ratio in Sussex County
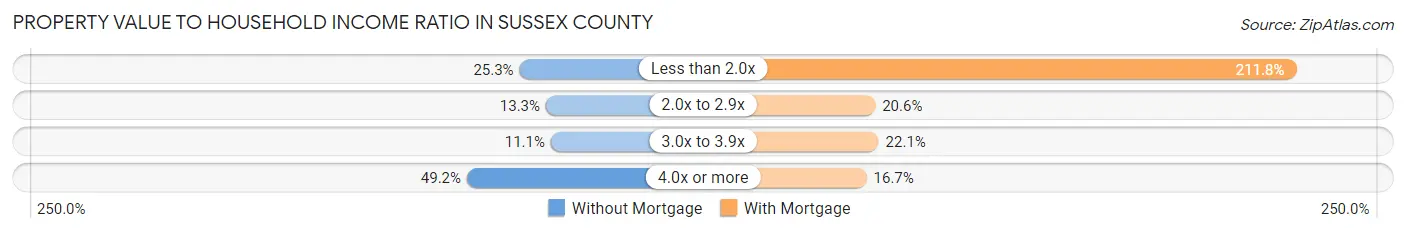
| Value-to-Income Ratio | Without Mortgage | With Mortgage |
| Less than 2.0x | 9,054 (25.3%) | 96,515 (211.8%) |
| 2.0x to 2.9x | 4,762 (13.3%) | 9,378 (20.6%) |
| 3.0x to 3.9x | 3,967 (11.1%) | 10,088 (22.1%) |
| 4.0x or more | 17,588 (49.2%) | 7,600 (16.7%) |
| Total | 35,746 (100.0%) | 45,579 (100.0%) |
Real Estate Taxes by Mortgage Status in Sussex County
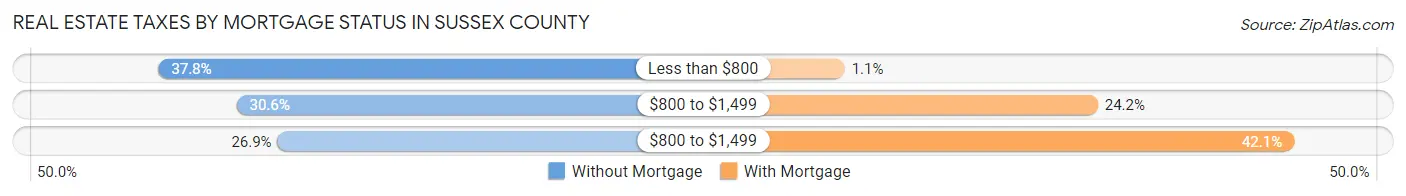
| Property Taxes | Without Mortgage | With Mortgage |
| Less than $800 | 13,504 (37.8%) | 486 (1.1%) |
| $800 to $1,499 | 10,953 (30.6%) | 11,023 (24.2%) |
| $800 to $1,499 | 9,619 (26.9%) | 19,186 (42.1%) |
| Total | 35,746 (100.0%) | 45,579 (100.0%) |
Health & Disability in Sussex County
Health Insurance Coverage by Age in Sussex County
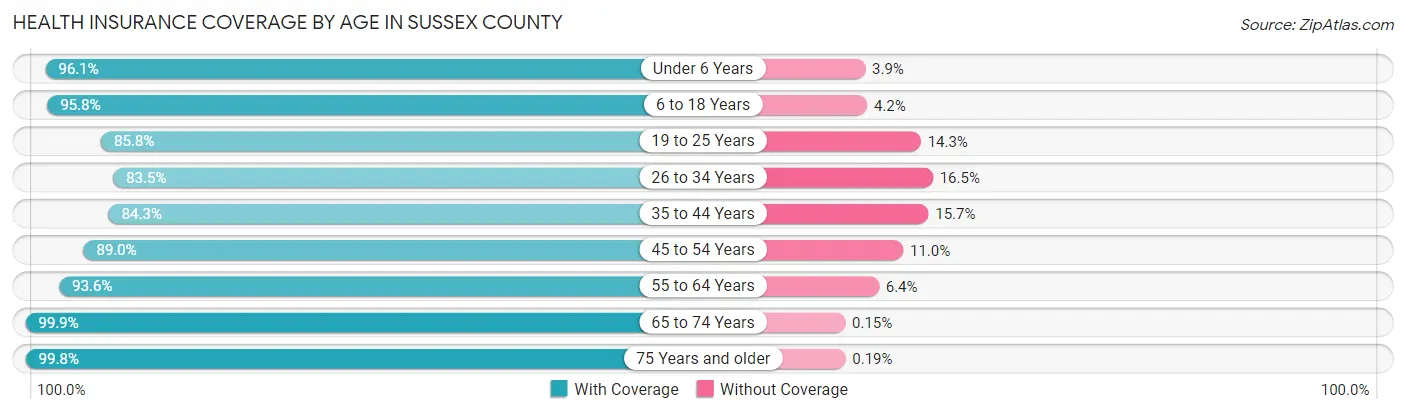
| Age Bracket | With Coverage | Without Coverage |
| Under 6 Years | 12,675 (96.1%) | 511 (3.9%) |
| 6 to 18 Years | 31,329 (95.8%) | 1,383 (4.2%) |
| 19 to 25 Years | 12,507 (85.8%) | 2,078 (14.2%) |
| 26 to 34 Years | 17,328 (83.5%) | 3,421 (16.5%) |
| 35 to 44 Years | 19,177 (84.3%) | 3,564 (15.7%) |
| 45 to 54 Years | 22,673 (89.0%) | 2,791 (11.0%) |
| 55 to 64 Years | 36,977 (93.6%) | 2,542 (6.4%) |
| 65 to 74 Years | 43,650 (99.9%) | 67 (0.2%) |
| 75 Years and older | 25,338 (99.8%) | 47 (0.2%) |
| Total | 221,654 (93.1%) | 16,404 (6.9%) |
Health Insurance Coverage by Citizenship Status in Sussex County
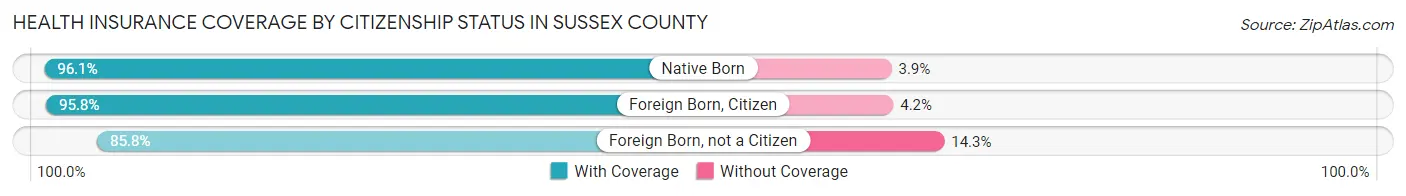
| Citizenship Status | With Coverage | Without Coverage |
| Native Born | 12,675 (96.1%) | 511 (3.9%) |
| Foreign Born, Citizen | 31,329 (95.8%) | 1,383 (4.2%) |
| Foreign Born, not a Citizen | 12,507 (85.8%) | 2,078 (14.2%) |
Health Insurance Coverage by Household Income in Sussex County
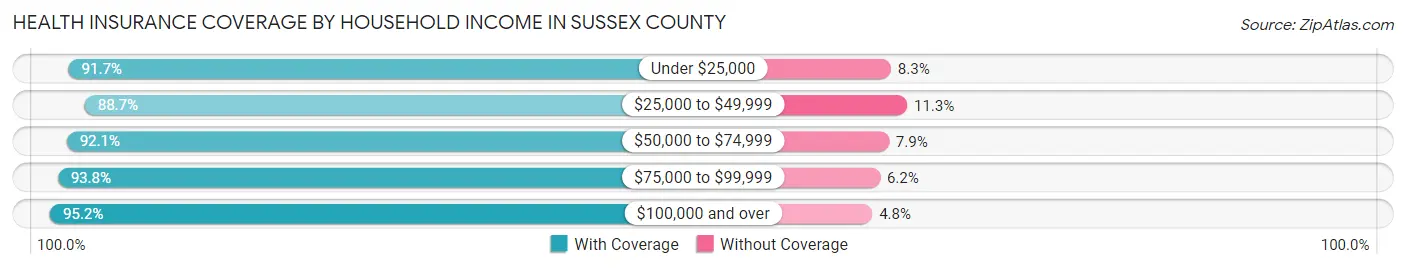
| Household Income | With Coverage | Without Coverage |
| Under $25,000 | 21,588 (91.7%) | 1,945 (8.3%) |
| $25,000 to $49,999 | 34,456 (88.7%) | 4,386 (11.3%) |
| $50,000 to $74,999 | 34,764 (92.1%) | 2,979 (7.9%) |
| $75,000 to $99,999 | 33,561 (93.8%) | 2,221 (6.2%) |
| $100,000 and over | 97,024 (95.2%) | 4,847 (4.8%) |
Public vs Private Health Insurance Coverage by Age in Sussex County
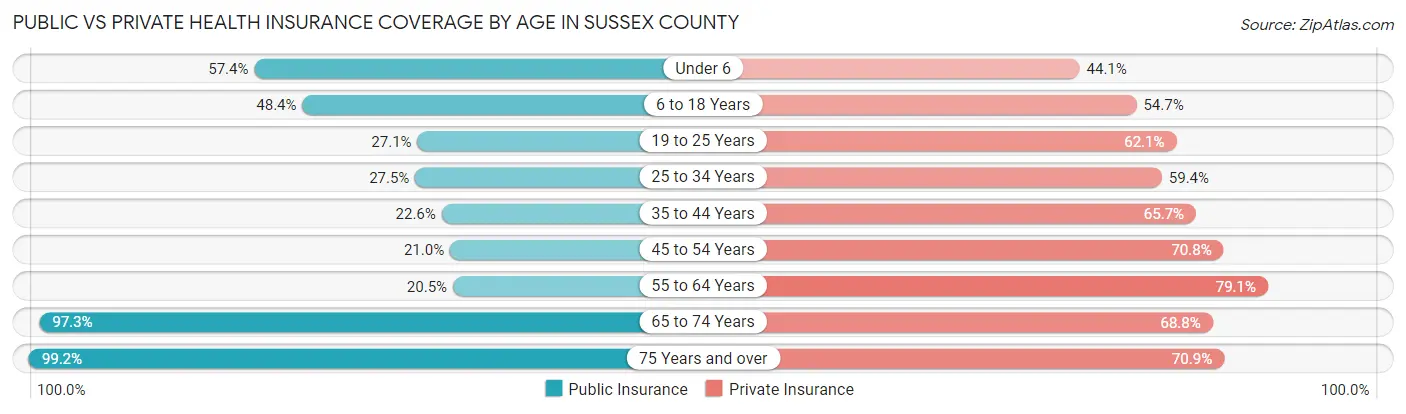
| Age Bracket | Public Insurance | Private Insurance |
| Under 6 | 7,564 (57.4%) | 5,820 (44.1%) |
| 6 to 18 Years | 15,845 (48.4%) | 17,893 (54.7%) |
| 19 to 25 Years | 3,951 (27.1%) | 9,056 (62.1%) |
| 25 to 34 Years | 5,705 (27.5%) | 12,326 (59.4%) |
| 35 to 44 Years | 5,140 (22.6%) | 14,945 (65.7%) |
| 45 to 54 Years | 5,358 (21.0%) | 18,038 (70.8%) |
| 55 to 64 Years | 8,103 (20.5%) | 31,242 (79.1%) |
| 65 to 74 Years | 42,518 (97.3%) | 30,083 (68.8%) |
| 75 Years and over | 25,182 (99.2%) | 18,006 (70.9%) |
| Total | 119,366 (50.1%) | 157,409 (66.1%) |
Disability Status by Sex by Age in Sussex County
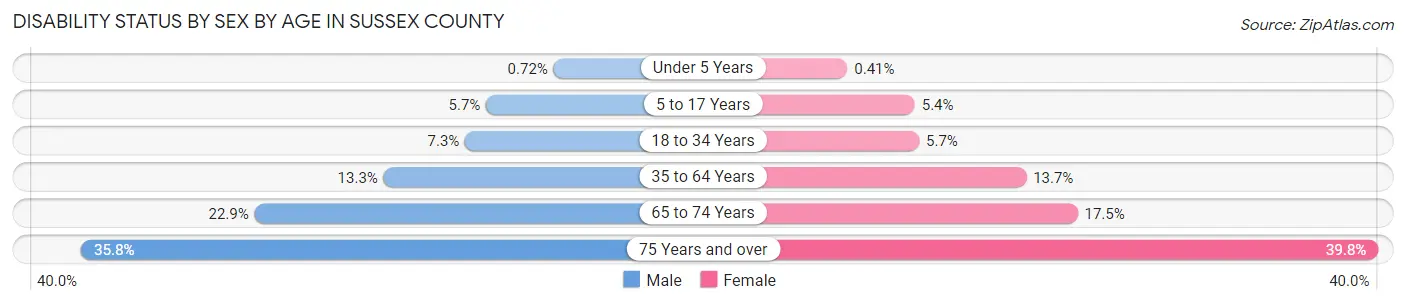
| Age Bracket | Male | Female |
| Under 5 Years | 42 (0.7%) | 23 (0.4%) |
| 5 to 17 Years | 934 (5.7%) | 851 (5.4%) |
| 18 to 34 Years | 1,389 (7.3%) | 1,070 (5.7%) |
| 35 to 64 Years | 5,561 (13.3%) | 6,299 (13.7%) |
| 65 to 74 Years | 4,730 (22.9%) | 4,040 (17.5%) |
| 75 Years and over | 4,211 (35.8%) | 5,424 (39.8%) |
Disability Class by Sex by Age in Sussex County
Disability Class: Hearing Difficulty
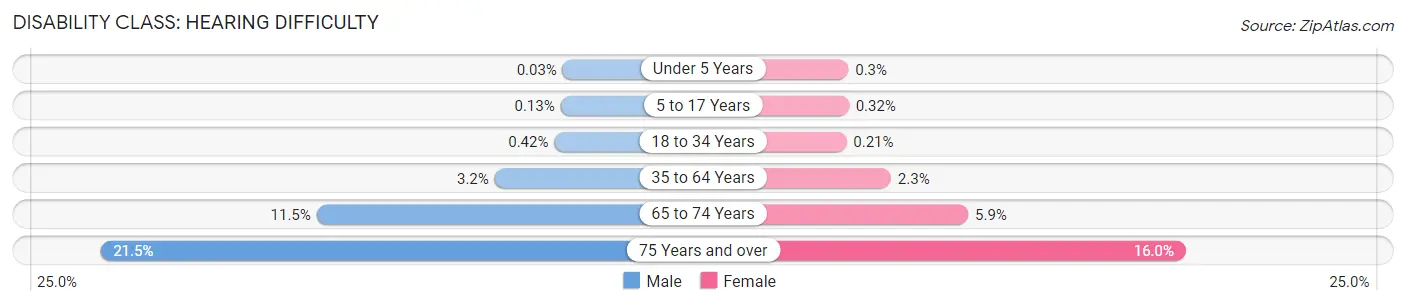
| Age Bracket | Male | Female |
| Under 5 Years | 2 (0.0%) | 17 (0.3%) |
| 5 to 17 Years | 22 (0.1%) | 51 (0.3%) |
| 18 to 34 Years | 81 (0.4%) | 40 (0.2%) |
| 35 to 64 Years | 1,331 (3.2%) | 1,049 (2.3%) |
| 65 to 74 Years | 2,362 (11.5%) | 1,354 (5.9%) |
| 75 Years and over | 2,528 (21.5%) | 2,174 (16.0%) |
Disability Class: Vision Difficulty
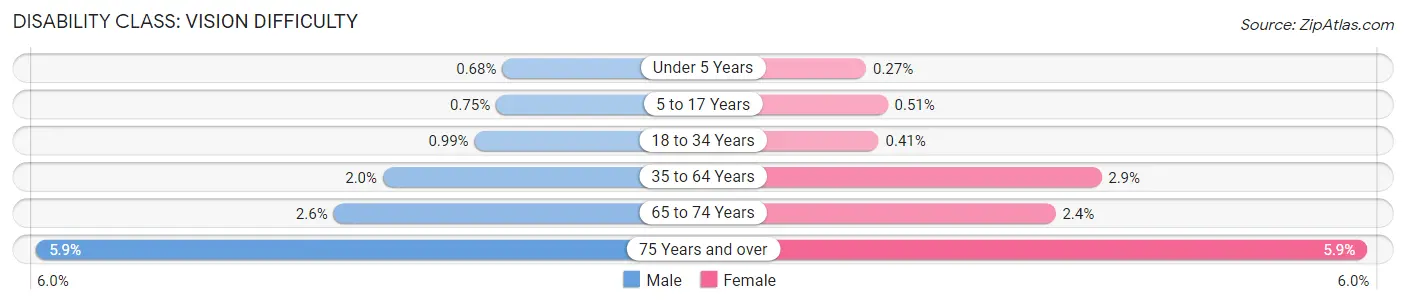
| Age Bracket | Male | Female |
| Under 5 Years | 40 (0.7%) | 15 (0.3%) |
| 5 to 17 Years | 123 (0.7%) | 80 (0.5%) |
| 18 to 34 Years | 189 (1.0%) | 76 (0.4%) |
| 35 to 64 Years | 838 (2.0%) | 1,330 (2.9%) |
| 65 to 74 Years | 529 (2.6%) | 550 (2.4%) |
| 75 Years and over | 691 (5.9%) | 797 (5.9%) |
Disability Class: Cognitive Difficulty
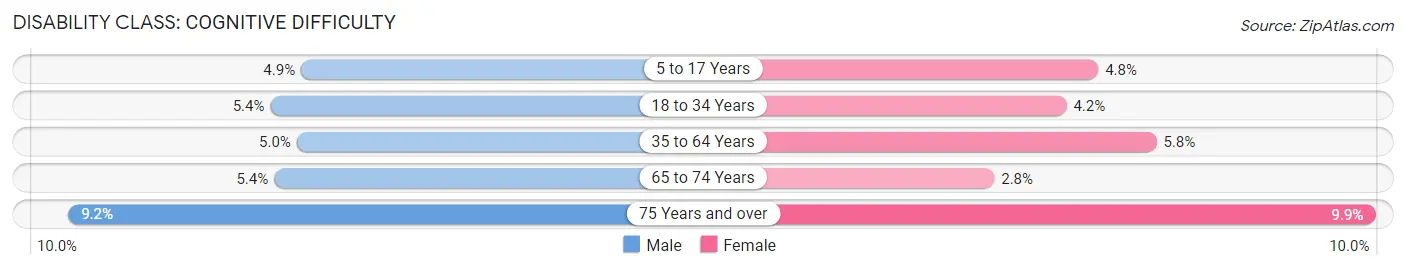
| Age Bracket | Male | Female |
| 5 to 17 Years | 795 (4.9%) | 747 (4.8%) |
| 18 to 34 Years | 1,038 (5.4%) | 778 (4.2%) |
| 35 to 64 Years | 2,066 (5.0%) | 2,686 (5.8%) |
| 65 to 74 Years | 1,107 (5.4%) | 654 (2.8%) |
| 75 Years and over | 1,081 (9.2%) | 1,348 (9.9%) |
Disability Class: Ambulatory Difficulty
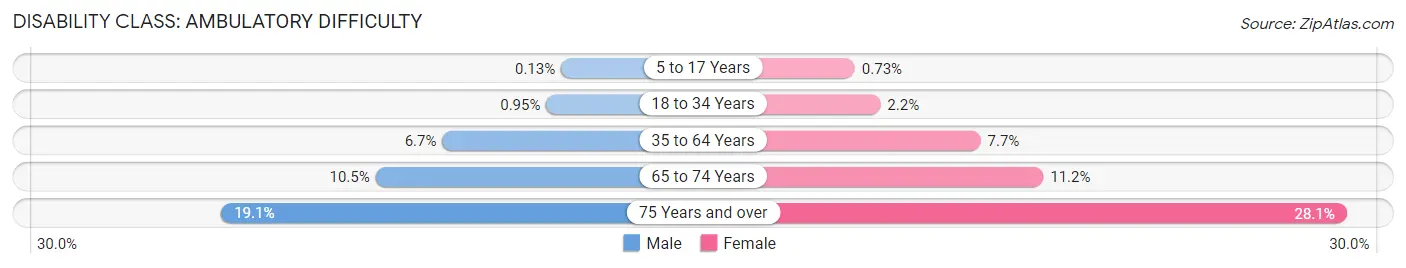
| Age Bracket | Male | Female |
| 5 to 17 Years | 21 (0.1%) | 114 (0.7%) |
| 18 to 34 Years | 181 (0.9%) | 402 (2.1%) |
| 35 to 64 Years | 2,809 (6.7%) | 3,556 (7.7%) |
| 65 to 74 Years | 2,158 (10.5%) | 2,591 (11.2%) |
| 75 Years and over | 2,241 (19.1%) | 3,829 (28.1%) |
Disability Class: Self-Care Difficulty
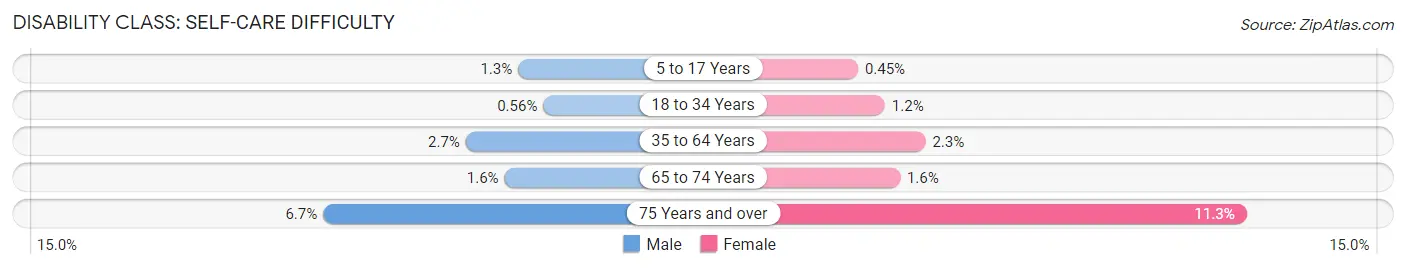
| Age Bracket | Male | Female |
| 5 to 17 Years | 206 (1.3%) | 71 (0.4%) |
| 18 to 34 Years | 107 (0.6%) | 224 (1.2%) |
| 35 to 64 Years | 1,133 (2.7%) | 1,074 (2.3%) |
| 65 to 74 Years | 339 (1.6%) | 374 (1.6%) |
| 75 Years and over | 787 (6.7%) | 1,535 (11.3%) |
Technology Access in Sussex County
Computing Device Access in Sussex County
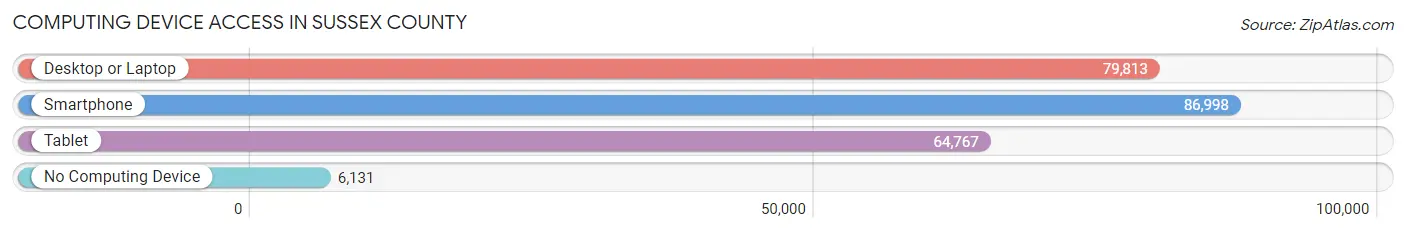
| Device Type | # Households | % Households |
| Desktop or Laptop | 79,813 | 79.9% |
| Smartphone | 86,998 | 87.1% |
| Tablet | 64,767 | 64.9% |
| No Computing Device | 6,131 | 6.1% |
| Total | 99,858 | 100.0% |
Internet Access in Sussex County
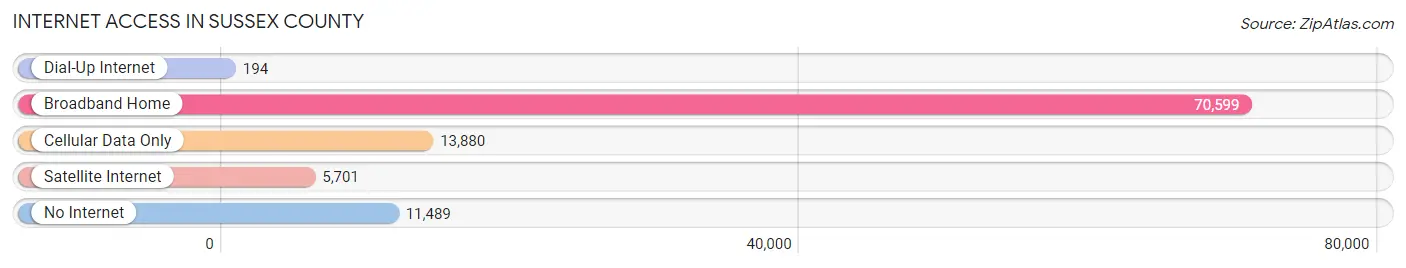
| Internet Type | # Households | % Households |
| Dial-Up Internet | 194 | 0.2% |
| Broadband Home | 70,599 | 70.7% |
| Cellular Data Only | 13,880 | 13.9% |
| Satellite Internet | 5,701 | 5.7% |
| No Internet | 11,489 | 11.5% |
| Total | 99,858 | 100.0% |
Sussex County Summary
Sussex County, Delaware is located in the southeastern corner of the state and is the second largest county in Delaware. It is bordered by Maryland to the north, the Atlantic Ocean to the east, and the Delaware Bay to the south. The county seat is Georgetown.
History
Sussex County was established in 1683 as part of the original three counties of Delaware. It was named after the English county of Sussex. The county was originally divided into two parts, the northern part being called the "Lower Counties on the Delaware" and the southern part being called the "Upper Counties on the Delaware". The two parts were reunited in 1701.
The county was home to several Native American tribes, including the Nanticoke, Assateague, and Lenape. The first European settlers arrived in the area in the 1630s. The county was an important agricultural center during the colonial period, and it was also a major center for the slave trade.
Geography
Sussex County covers an area of 1,190 square miles and is the second largest county in Delaware. It is located in the southeastern corner of the state and is bordered by Maryland to the north, the Atlantic Ocean to the east, and the Delaware Bay to the south. The county is divided into three distinct regions: the Coastal Plain, the Piedmont Plateau, and the Appalachian Mountains.
The Coastal Plain is the easternmost region of the county and is characterized by flat, sandy terrain. The Piedmont Plateau is located in the central part of the county and is characterized by rolling hills and valleys. The Appalachian Mountains are located in the western part of the county and are characterized by steep, rugged terrain.
Economy
The economy of Sussex County is largely based on agriculture, tourism, and manufacturing. Agriculture is the largest sector of the economy, with poultry, dairy, and crops being the main products. Tourism is also an important part of the economy, with the county being home to several popular beaches and resorts. Manufacturing is also an important part of the economy, with the county being home to several large manufacturing companies.
Demographics
As of the 2010 census, the population of Sussex County was 197,145. The population is predominantly white (87.3%), with African Americans (7.2%), Hispanics (3.2%), and Asians (1.3%) making up the remainder of the population. The median household income is $53,945, and the median age is 43.7.
Conclusion
Sussex County, Delaware is a large county located in the southeastern corner of the state. It has a rich history, diverse geography, and a strong economy. The population is predominantly white, with African Americans, Hispanics, and Asians making up the remainder of the population. The county is an important agricultural center, and it is also home to several popular beaches and resorts.
Common Questions
What is the Total Population of Sussex County?
Total Population of Sussex County is 240,668.
What is the Total Male Population of Sussex County?
Total Male Population of Sussex County is 117,079.
What is the Total Female Population of Sussex County?
Total Female Population of Sussex County is 123,589.
What is the Ratio of Males per 100 Females in Sussex County?
There are 94.73 Males per 100 Females in Sussex County.
What is the Ratio of Females per 100 Males in Sussex County?
There are 105.56 Females per 100 Males in Sussex County.
What is the Median Population Age in Sussex County?
Median Population Age in Sussex County is 51.3 Years.
What is the Average Family Size in Sussex County
Average Family Size in Sussex County is 2.8 People.
What is the Average Household Size in Sussex County
Average Household Size in Sussex County is 2.4 People.
What is Per Capita Income in Sussex County?
Per Capita income in Sussex County is $42,958.
What is the Median Family Income in Sussex County?
Median Family Income in Sussex County is $91,800.
What is the Median Household income in Sussex County?
Median Household Income in Sussex County is $75,406.
What is Income or Wage Gap in Sussex County?
Income or Wage Gap in Sussex County is 24.5%.
Women in Sussex County earn 75.5 cents for every dollar earned by a man.
What is Family Income Deficit in Sussex County?
Family Income Deficit in Sussex County is $10,130.
Families that are below poverty line in Sussex County earn $10,130 less on average than the poverty threshold level.
What is Inequality or Gini Index in Sussex County?
Inequality or Gini Index in Sussex County is 0.46.
How Large is the Labor Force in Sussex County?
There are 109,671 People in the Labor Forcein in Sussex County.
What is the Percentage of People in the Labor Force in Sussex County?
54.3% of People are in the Labor Force in Sussex County.
What is the Unemployment Rate in Sussex County?
Unemployment Rate in Sussex County is 5.0%.