New Castle County, DE
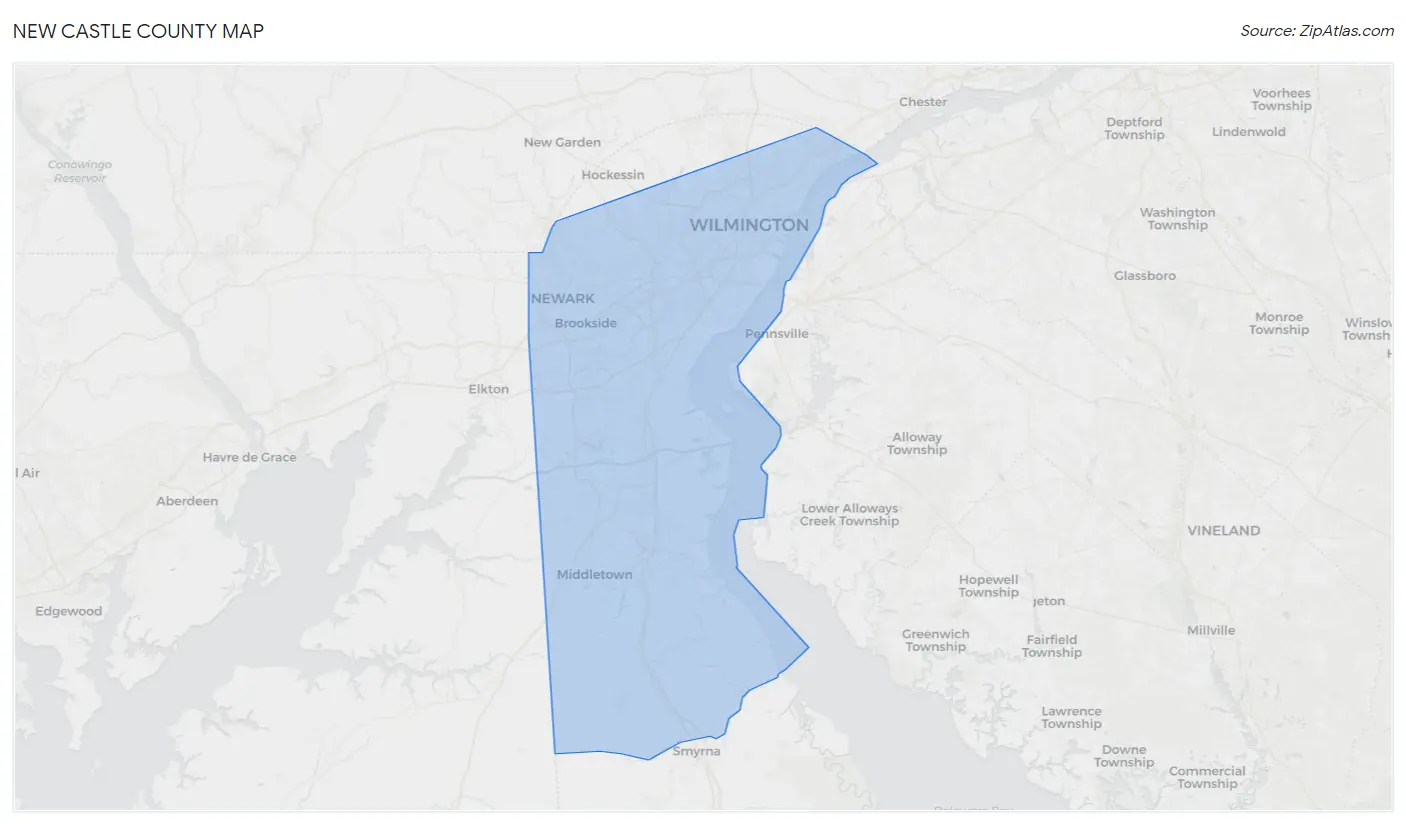
New Castle County Map
New Castle County Overview
570,567
TOTAL POPULATION
277,558
MALE POPULATION
293,009
FEMALE POPULATION
94.73
MALES / 100 FEMALES
105.57
FEMALES / 100 MALES
39.0
MEDIAN AGE
3.2
AVG FAMILY SIZE
2.5
AVG HOUSEHOLD SIZE
$44,725
PER CAPITA INCOME
$107,671
AVG FAMILY INCOME
$85,309
AVG HOUSEHOLD INCOME
24.8%
WAGE / INCOME GAP [ % ]
75.2¢/ $1
WAGE / INCOME GAP [ $ ]
$11,343
FAMILY INCOME DEFICIT
0.45
INEQUALITY / GINI INDEX
306,614
LABOR FORCE [ PEOPLE ]
66.1%
PERCENT IN LABOR FORCE
5.4%
UNEMPLOYMENT RATE
New Castle County Area Codes
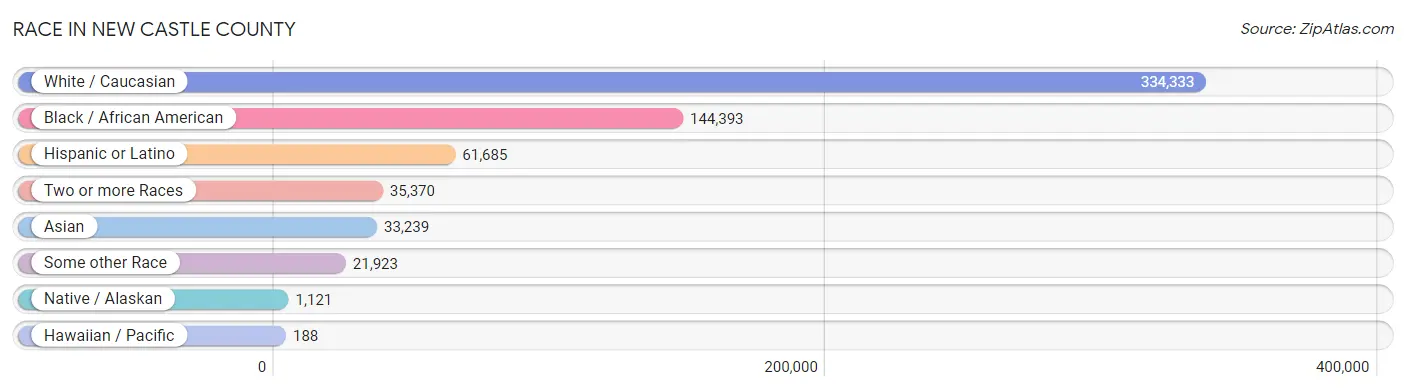
Race in New Castle County
The most populous races in New Castle County are White / Caucasian (334,333 | 58.6%), Black / African American (144,393 | 25.3%), and Hispanic or Latino (61,685 | 10.8%).
| Race | # Population | % Population |
| Asian | 33,239 | 5.8% |
| Black / African American | 144,393 | 25.3% |
| Hawaiian / Pacific | 188 | 0.0% |
| Hispanic or Latino | 61,685 | 10.8% |
| Native / Alaskan | 1,121 | 0.2% |
| White / Caucasian | 334,333 | 58.6% |
| Two or more Races | 35,370 | 6.2% |
| Some other Race | 21,923 | 3.8% |
| Total | 570,567 | 100.0% |
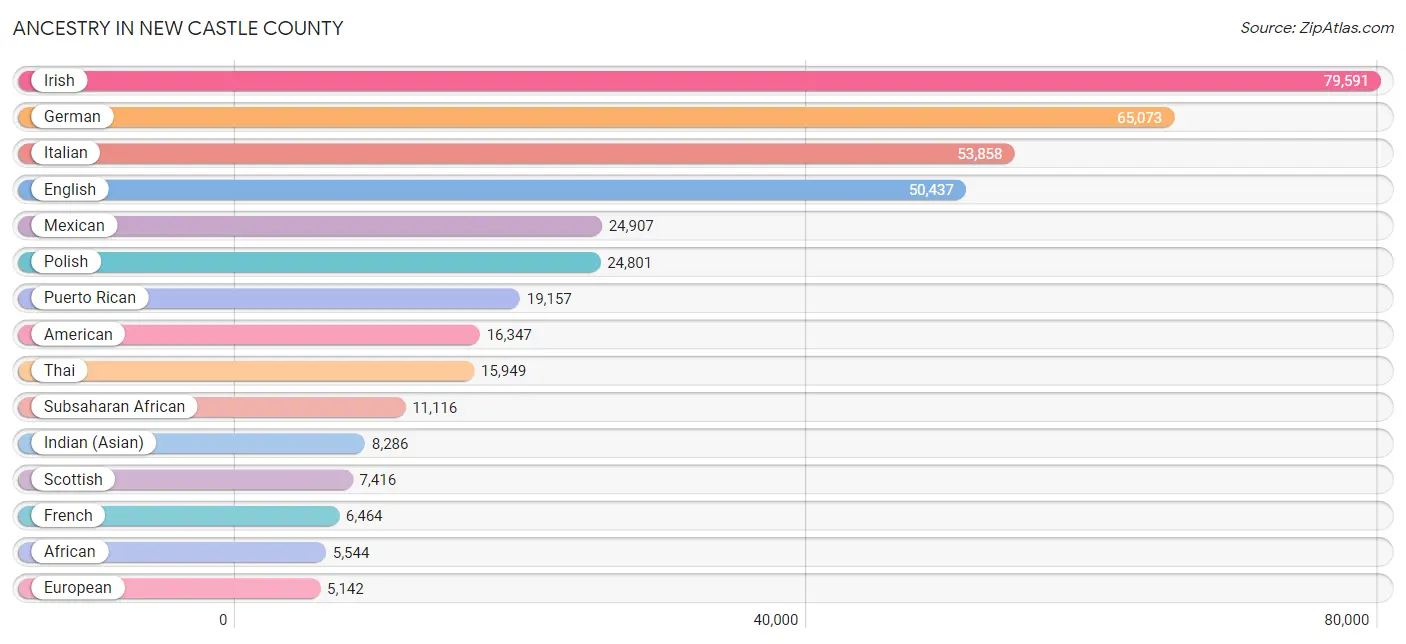
Ancestry in New Castle County
The most populous ancestries reported in New Castle County are Irish (79,591 | 14.0%), German (65,073 | 11.4%), Italian (53,858 | 9.4%), English (50,437 | 8.8%), and Mexican (24,907 | 4.4%), together accounting for 48.0% of all New Castle County residents.
| Ancestry | # Population | % Population |
| Afghan | 163 | 0.0% |
| African | 5,544 | 1.0% |
| Albanian | 150 | 0.0% |
| Alsatian | 18 | 0.0% |
| American | 16,347 | 2.9% |
| Apache | 51 | 0.0% |
| Arab | 3,386 | 0.6% |
| Argentinean | 764 | 0.1% |
| Armenian | 139 | 0.0% |
| Assyrian / Chaldean / Syriac | 34 | 0.0% |
| Australian | 110 | 0.0% |
| Austrian | 1,282 | 0.2% |
| Barbadian | 114 | 0.0% |
| Belgian | 169 | 0.0% |
| Belizean | 18 | 0.0% |
| Bermudan | 79 | 0.0% |
| Bhutanese | 1,170 | 0.2% |
| Blackfeet | 428 | 0.1% |
| Bolivian | 88 | 0.0% |
| Brazilian | 198 | 0.0% |
| British | 2,625 | 0.5% |
| British West Indian | 384 | 0.1% |
| Bulgarian | 472 | 0.1% |
| Burmese | 1,863 | 0.3% |
| Cajun | 15 | 0.0% |
| Cambodian | 37 | 0.0% |
| Canadian | 672 | 0.1% |
| Carpatho Rusyn | 28 | 0.0% |
| Celtic | 60 | 0.0% |
| Central American | 3,314 | 0.6% |
| Central American Indian | 520 | 0.1% |
| Cherokee | 1,261 | 0.2% |
| Chilean | 775 | 0.1% |
| Chippewa | 38 | 0.0% |
| Choctaw | 112 | 0.0% |
| Colombian | 1,817 | 0.3% |
| Costa Rican | 423 | 0.1% |
| Creek | 26 | 0.0% |
| Croatian | 301 | 0.1% |
| Crow | 2 | 0.0% |
| Cuban | 841 | 0.2% |
| Czech | 957 | 0.2% |
| Czechoslovakian | 279 | 0.1% |
| Danish | 767 | 0.1% |
| Delaware | 198 | 0.0% |
| Dominican | 4,582 | 0.8% |
| Dutch | 4,151 | 0.7% |
| Dutch West Indian | 33 | 0.0% |
| Eastern European | 1,632 | 0.3% |
| Ecuadorian | 647 | 0.1% |
| Egyptian | 497 | 0.1% |
| English | 50,437 | 8.8% |
| Estonian | 110 | 0.0% |
| Ethiopian | 480 | 0.1% |
| European | 5,142 | 0.9% |
| Filipino | 508 | 0.1% |
| Finnish | 372 | 0.1% |
| French | 6,464 | 1.1% |
| French American Indian | 9 | 0.0% |
| French Canadian | 1,269 | 0.2% |
| German | 65,073 | 11.4% |
| German Russian | 42 | 0.0% |
| Ghanaian | 789 | 0.1% |
| Greek | 2,492 | 0.4% |
| Guamanian / Chamorro | 25 | 0.0% |
| Guatemalan | 973 | 0.2% |
| Guyanese | 302 | 0.1% |
| Haitian | 1,020 | 0.2% |
| Honduran | 734 | 0.1% |
| Hungarian | 1,888 | 0.3% |
| Icelander | 28 | 0.0% |
| Indian (Asian) | 8,286 | 1.5% |
| Indonesian | 31 | 0.0% |
| Inupiat | 3 | 0.0% |
| Iranian | 329 | 0.1% |
| Irish | 79,591 | 14.0% |
| Iroquois | 41 | 0.0% |
| Israeli | 57 | 0.0% |
| Italian | 53,858 | 9.4% |
| Jamaican | 3,669 | 0.6% |
| Japanese | 101 | 0.0% |
| Jordanian | 51 | 0.0% |
| Kenyan | 965 | 0.2% |
| Korean | 4,292 | 0.7% |
| Laotian | 277 | 0.1% |
| Latvian | 91 | 0.0% |
| Lebanese | 620 | 0.1% |
| Liberian | 288 | 0.1% |
| Lithuanian | 1,379 | 0.2% |
| Lumbee | 13 | 0.0% |
| Luxembourger | 53 | 0.0% |
| Macedonian | 18 | 0.0% |
| Malaysian | 87 | 0.0% |
| Maltese | 28 | 0.0% |
| Mexican | 24,907 | 4.4% |
| Mexican American Indian | 305 | 0.1% |
| Mongolian | 63 | 0.0% |
| Moroccan | 290 | 0.1% |
| Native Hawaiian | 113 | 0.0% |
| Navajo | 73 | 0.0% |
| New Zealander | 3 | 0.0% |
| Nicaraguan | 191 | 0.0% |
| Nigerian | 1,965 | 0.3% |
| Northern European | 613 | 0.1% |
| Norwegian | 2,176 | 0.4% |
| Pakistani | 97 | 0.0% |
| Palestinian | 33 | 0.0% |
| Panamanian | 521 | 0.1% |
| Pennsylvania German | 870 | 0.2% |
| Peruvian | 580 | 0.1% |
| Polish | 24,801 | 4.3% |
| Portuguese | 613 | 0.1% |
| Puerto Rican | 19,157 | 3.4% |
| Romanian | 290 | 0.1% |
| Russian | 3,529 | 0.6% |
| Salvadoran | 460 | 0.1% |
| Samoan | 33 | 0.0% |
| Scandinavian | 857 | 0.2% |
| Scotch-Irish | 2,630 | 0.5% |
| Scottish | 7,416 | 1.3% |
| Seminole | 70 | 0.0% |
| Serbian | 118 | 0.0% |
| Sierra Leonean | 251 | 0.0% |
| Sioux | 127 | 0.0% |
| Slavic | 241 | 0.0% |
| Slovak | 1,193 | 0.2% |
| Slovene | 181 | 0.0% |
| South African | 181 | 0.0% |
| South American | 5,040 | 0.9% |
| South American Indian | 117 | 0.0% |
| Spaniard | 1,180 | 0.2% |
| Spanish | 1,036 | 0.2% |
| Spanish American | 53 | 0.0% |
| Spanish American Indian | 96 | 0.0% |
| Sri Lankan | 1,728 | 0.3% |
| Subsaharan African | 11,116 | 1.9% |
| Sudanese | 55 | 0.0% |
| Swedish | 3,510 | 0.6% |
| Swiss | 935 | 0.2% |
| Syrian | 142 | 0.0% |
| Thai | 15,949 | 2.8% |
| Tongan | 5 | 0.0% |
| Trinidadian and Tobagonian | 911 | 0.2% |
| Turkish | 1,193 | 0.2% |
| U.S. Virgin Islander | 7 | 0.0% |
| Ugandan | 35 | 0.0% |
| Ukrainian | 2,929 | 0.5% |
| Uruguayan | 40 | 0.0% |
| Venezuelan | 324 | 0.1% |
| Vietnamese | 1,024 | 0.2% |
| Welsh | 4,470 | 0.8% |
| West Indian | 893 | 0.2% |
| Yugoslavian | 91 | 0.0% | View All 153 Rows |
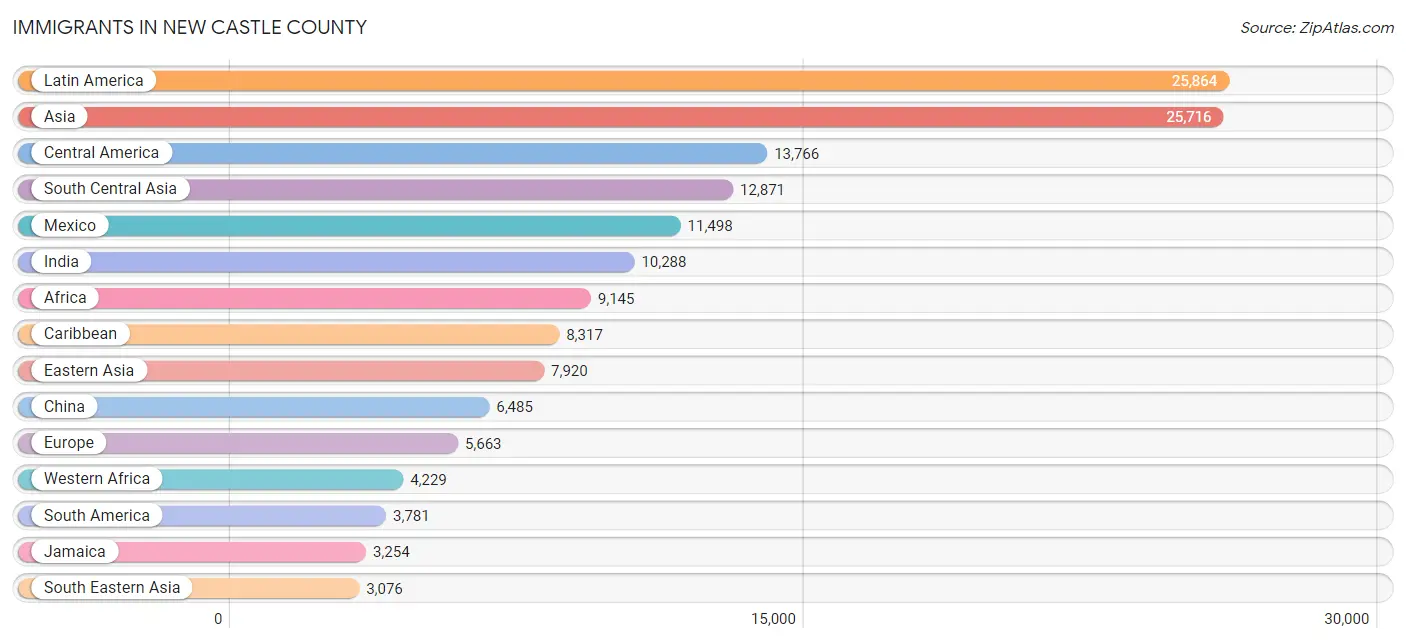
Immigrants in New Castle County
The most numerous immigrant groups reported in New Castle County came from Latin America (25,864 | 4.5%), Asia (25,716 | 4.5%), Central America (13,766 | 2.4%), South Central Asia (12,871 | 2.3%), and Mexico (11,498 | 2.0%), together accounting for 15.7% of all New Castle County residents.
| Immigration Origin | # Population | % Population |
| Afghanistan | 58 | 0.0% |
| Africa | 9,145 | 1.6% |
| Albania | 48 | 0.0% |
| Argentina | 423 | 0.1% |
| Armenia | 5 | 0.0% |
| Asia | 25,716 | 4.5% |
| Australia | 89 | 0.0% |
| Austria | 76 | 0.0% |
| Bahamas | 10 | 0.0% |
| Bangladesh | 768 | 0.1% |
| Barbados | 196 | 0.0% |
| Belarus | 28 | 0.0% |
| Belize | 10 | 0.0% |
| Bolivia | 42 | 0.0% |
| Brazil | 456 | 0.1% |
| Bulgaria | 319 | 0.1% |
| Cambodia | 13 | 0.0% |
| Cameroon | 673 | 0.1% |
| Canada | 616 | 0.1% |
| Caribbean | 8,317 | 1.5% |
| Central America | 13,766 | 2.4% |
| Chile | 363 | 0.1% |
| China | 6,485 | 1.1% |
| Colombia | 948 | 0.2% |
| Costa Rica | 232 | 0.0% |
| Croatia | 16 | 0.0% |
| Cuba | 353 | 0.1% |
| Czechoslovakia | 31 | 0.0% |
| Denmark | 3 | 0.0% |
| Dominican Republic | 2,323 | 0.4% |
| Eastern Africa | 2,225 | 0.4% |
| Eastern Asia | 7,920 | 1.4% |
| Eastern Europe | 1,927 | 0.3% |
| Ecuador | 314 | 0.1% |
| Egypt | 231 | 0.0% |
| El Salvador | 350 | 0.1% |
| England | 590 | 0.1% |
| Eritrea | 130 | 0.0% |
| Ethiopia | 268 | 0.1% |
| Europe | 5,663 | 1.0% |
| France | 112 | 0.0% |
| Germany | 1,049 | 0.2% |
| Ghana | 1,135 | 0.2% |
| Greece | 184 | 0.0% |
| Grenada | 139 | 0.0% |
| Guatemala | 751 | 0.1% |
| Guyana | 439 | 0.1% |
| Haiti | 496 | 0.1% |
| Honduras | 559 | 0.1% |
| Hong Kong | 724 | 0.1% |
| Hungary | 108 | 0.0% |
| India | 10,288 | 1.8% |
| Indonesia | 40 | 0.0% |
| Iran | 198 | 0.0% |
| Ireland | 101 | 0.0% |
| Israel | 51 | 0.0% |
| Italy | 526 | 0.1% |
| Jamaica | 3,254 | 0.6% |
| Japan | 372 | 0.1% |
| Jordan | 73 | 0.0% |
| Kazakhstan | 11 | 0.0% |
| Kenya | 1,574 | 0.3% |
| Korea | 1,063 | 0.2% |
| Kuwait | 18 | 0.0% |
| Laos | 35 | 0.0% |
| Latin America | 25,864 | 4.5% |
| Latvia | 49 | 0.0% |
| Lebanon | 253 | 0.0% |
| Liberia | 435 | 0.1% |
| Lithuania | 9 | 0.0% |
| Malaysia | 128 | 0.0% |
| Mexico | 11,498 | 2.0% |
| Middle Africa | 843 | 0.2% |
| Moldova | 20 | 0.0% |
| Morocco | 284 | 0.1% |
| Nepal | 180 | 0.0% |
| Netherlands | 341 | 0.1% |
| Nicaragua | 7 | 0.0% |
| Nigeria | 1,779 | 0.3% |
| Northern Africa | 639 | 0.1% |
| Northern Europe | 1,119 | 0.2% |
| Norway | 13 | 0.0% |
| Oceania | 92 | 0.0% |
| Pakistan | 1,041 | 0.2% |
| Panama | 359 | 0.1% |
| Peru | 358 | 0.1% |
| Philippines | 1,739 | 0.3% |
| Poland | 448 | 0.1% |
| Portugal | 81 | 0.0% |
| Romania | 57 | 0.0% |
| Russia | 478 | 0.1% |
| Saudi Arabia | 88 | 0.0% |
| Scotland | 147 | 0.0% |
| Serbia | 100 | 0.0% |
| Sierra Leone | 396 | 0.1% |
| Singapore | 12 | 0.0% |
| South Africa | 177 | 0.0% |
| South America | 3,781 | 0.7% |
| South Central Asia | 12,871 | 2.3% |
| South Eastern Asia | 3,076 | 0.5% |
| Southern Europe | 994 | 0.2% |
| Spain | 203 | 0.0% |
| Sri Lanka | 155 | 0.0% |
| St. Vincent and the Grenadines | 101 | 0.0% |
| Sudan | 63 | 0.0% |
| Sweden | 14 | 0.0% |
| Switzerland | 45 | 0.0% |
| Syria | 31 | 0.0% |
| Taiwan | 739 | 0.1% |
| Thailand | 130 | 0.0% |
| Trinidad and Tobago | 1,142 | 0.2% |
| Turkey | 699 | 0.1% |
| Uganda | 25 | 0.0% |
| Ukraine | 139 | 0.0% |
| Uruguay | 18 | 0.0% |
| Uzbekistan | 19 | 0.0% |
| Venezuela | 352 | 0.1% |
| Vietnam | 964 | 0.2% |
| West Indies | 40 | 0.0% |
| Western Africa | 4,229 | 0.7% |
| Western Asia | 1,849 | 0.3% |
| Western Europe | 1,623 | 0.3% |
| Yemen | 396 | 0.1% |
| Zaire | 170 | 0.0% |
| Zimbabwe | 91 | 0.0% | View All 125 Rows |
Sex and Age in New Castle County
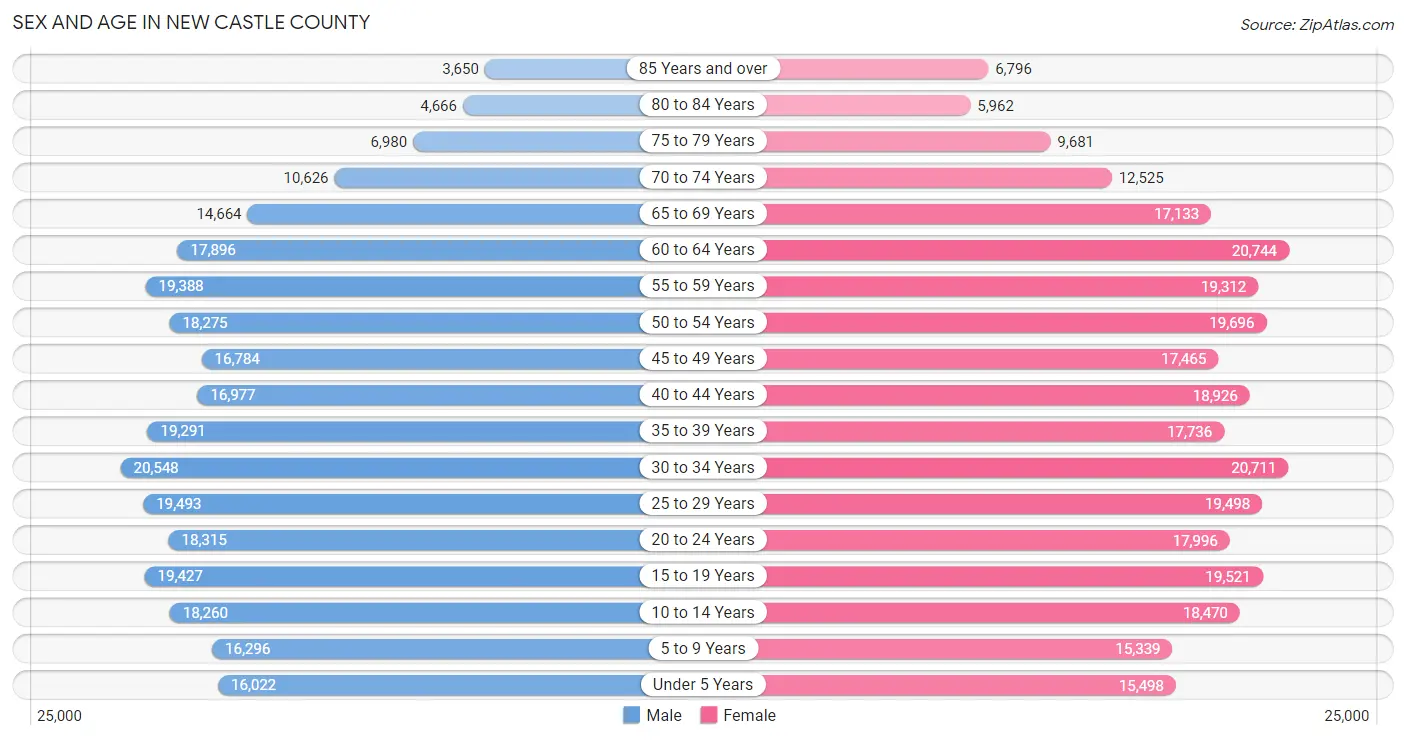
Sex and Age in New Castle County
The most populous age groups in New Castle County are 30 to 34 Years (20,548 | 7.4%) for men and 60 to 64 Years (20,744 | 7.1%) for women.
| Age Bracket | Male | Female |
| Under 5 Years | 16,022 (5.8%) | 15,498 (5.3%) |
| 5 to 9 Years | 16,296 (5.9%) | 15,339 (5.2%) |
| 10 to 14 Years | 18,260 (6.6%) | 18,470 (6.3%) |
| 15 to 19 Years | 19,427 (7.0%) | 19,521 (6.7%) |
| 20 to 24 Years | 18,315 (6.6%) | 17,996 (6.1%) |
| 25 to 29 Years | 19,493 (7.0%) | 19,498 (6.7%) |
| 30 to 34 Years | 20,548 (7.4%) | 20,711 (7.1%) |
| 35 to 39 Years | 19,291 (7.0%) | 17,736 (6.0%) |
| 40 to 44 Years | 16,977 (6.1%) | 18,926 (6.5%) |
| 45 to 49 Years | 16,784 (6.0%) | 17,465 (6.0%) |
| 50 to 54 Years | 18,275 (6.6%) | 19,696 (6.7%) |
| 55 to 59 Years | 19,388 (7.0%) | 19,312 (6.6%) |
| 60 to 64 Years | 17,896 (6.5%) | 20,744 (7.1%) |
| 65 to 69 Years | 14,664 (5.3%) | 17,133 (5.9%) |
| 70 to 74 Years | 10,626 (3.8%) | 12,525 (4.3%) |
| 75 to 79 Years | 6,980 (2.5%) | 9,681 (3.3%) |
| 80 to 84 Years | 4,666 (1.7%) | 5,962 (2.0%) |
| 85 Years and over | 3,650 (1.3%) | 6,796 (2.3%) |
| Total | 277,558 (100.0%) | 293,009 (100.0%) |
Families and Households in New Castle County
Median Family Size in New Castle County
The median family size in New Castle County is 3.17 persons per family, with single female/mother families (28,277 | 20.5%) accounting for the largest median family size of 3.31 persons per family. On the other hand, single male/father families (11,515 | 8.3%) represent the smallest median family size with 2.85 persons per family.
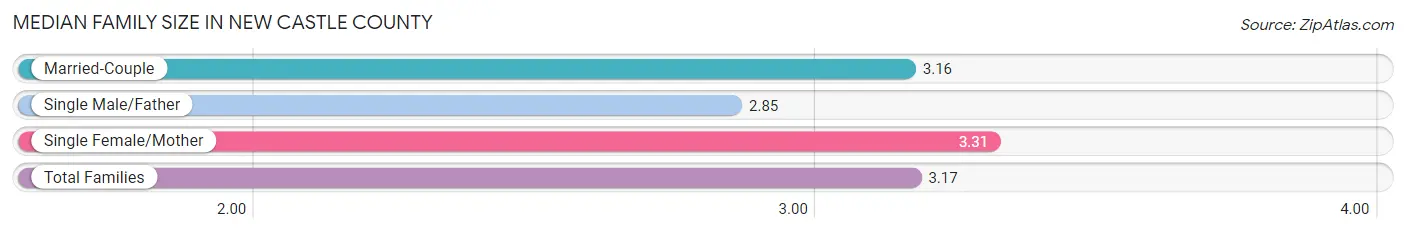
| Family Type | # Families | Family Size |
| Married-Couple | 98,195 (71.2%) | 3.16 |
| Single Male/Father | 11,515 (8.3%) | 2.85 |
| Single Female/Mother | 28,277 (20.5%) | 3.31 |
| Total Families | 137,987 (100.0%) | 3.17 |
Median Household Size in New Castle County
The median household size in New Castle County is 2.52 persons per household, with single female/mother households (28,277 | 12.8%) accounting for the largest median household size of 3.55 persons per household. non-family households (82,450 | 37.4%) represent the smallest median household size with 1.27 persons per household.

| Household Type | # Households | Household Size |
| Married-Couple | 98,195 (44.6%) | 3.18 |
| Single Male/Father | 11,515 (5.2%) | 3.28 |
| Single Female/Mother | 28,277 (12.8%) | 3.55 |
| Non-family | 82,450 (37.4%) | 1.27 |
| Total Households | 220,437 (100.0%) | 2.52 |
Household Size by Marriage Status in New Castle County
Out of a total of 220,437 households in New Castle County, 137,987 (62.6%) are family households, while 82,450 (37.4%) are nonfamily households. The most numerous type of family households are 2-person households, comprising 59,124, and the most common type of nonfamily households are 1-person households, comprising 67,219.
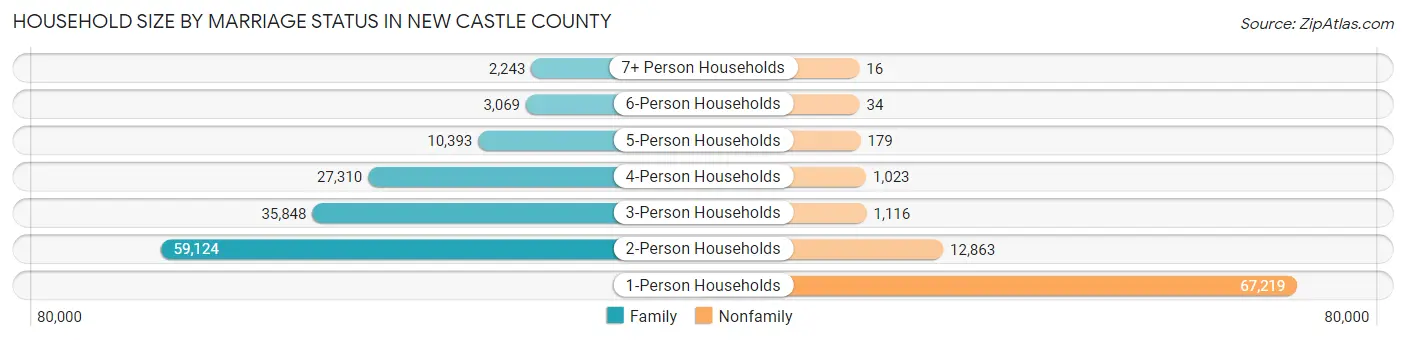
| Household Size | Family Households | Nonfamily Households |
| 1-Person Households | - | 67,219 (30.5%) |
| 2-Person Households | 59,124 (26.8%) | 12,863 (5.8%) |
| 3-Person Households | 35,848 (16.3%) | 1,116 (0.5%) |
| 4-Person Households | 27,310 (12.4%) | 1,023 (0.5%) |
| 5-Person Households | 10,393 (4.7%) | 179 (0.1%) |
| 6-Person Households | 3,069 (1.4%) | 34 (0.0%) |
| 7+ Person Households | 2,243 (1.0%) | 16 (0.0%) |
| Total | 137,987 (62.6%) | 82,450 (37.4%) |
Female Fertility in New Castle County
Fertility by Age in New Castle County
Average fertility rate in New Castle County is 43.0 births per 1,000 women. Women in the age bracket of 20 to 34 years have the highest fertility rate with 70.0 births per 1,000 women. Women in the age bracket of 20 to 34 years acount for 69.8% of all women with births.
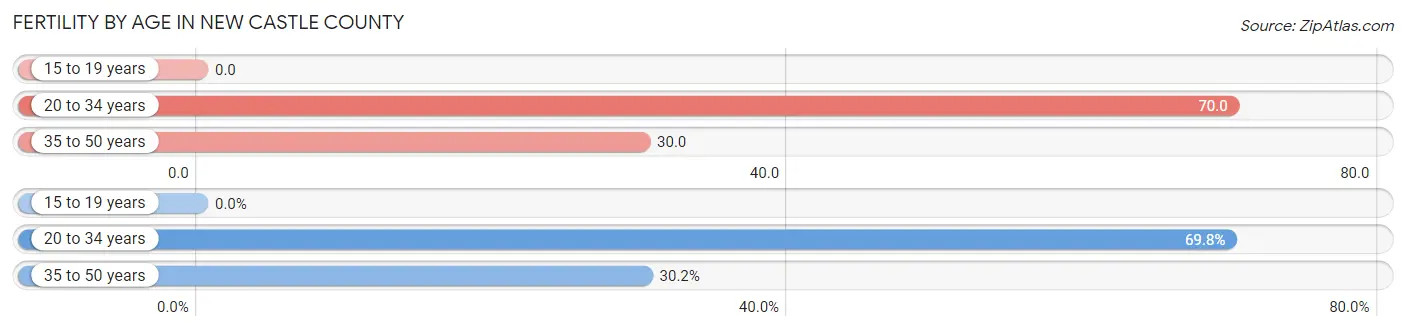
| Age Bracket | Women with Births | Births / 1,000 Women |
| 15 to 19 years | 0 (0.0%) | 0.0 |
| 20 to 34 years | 4,081 (69.8%) | 70.0 |
| 35 to 50 years | 1,763 (30.2%) | 30.0 |
| Total | 5,844 (100.0%) | 43.0 |
Fertility by Age by Marriage Status in New Castle County
65.6% of women with births (5,844) in New Castle County are married. The highest percentage of unmarried women with births falls into 20 to 34 years age bracket with 38.3% of them unmarried at the time of birth, while the lowest percentage of unmarried women with births belong to 35 to 50 years age bracket with 25.4% of them unmarried.
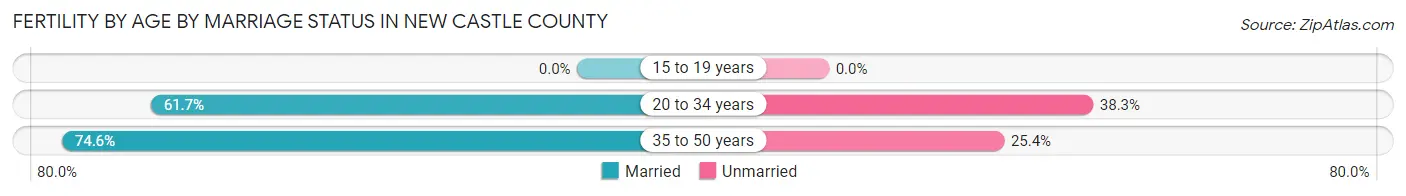
| Age Bracket | Married | Unmarried |
| 15 to 19 years | 0 (0.0%) | 0 (0.0%) |
| 20 to 34 years | 2,518 (61.7%) | 1,563 (38.3%) |
| 35 to 50 years | 1,315 (74.6%) | 448 (25.4%) |
| Total | 3,834 (65.6%) | 2,010 (34.4%) |
Fertility by Education in New Castle County
Average fertility rate in New Castle County is 43.0 births per 1,000 women. Women with the education attainment of graduate degree have the highest fertility rate of 53.0 births per 1,000 women, while women with the education attainment of less than high school have the lowest fertility at 22.0 births per 1,000 women. Women with the education attainment of college or associate's degree represent 34.0% of all women with births.
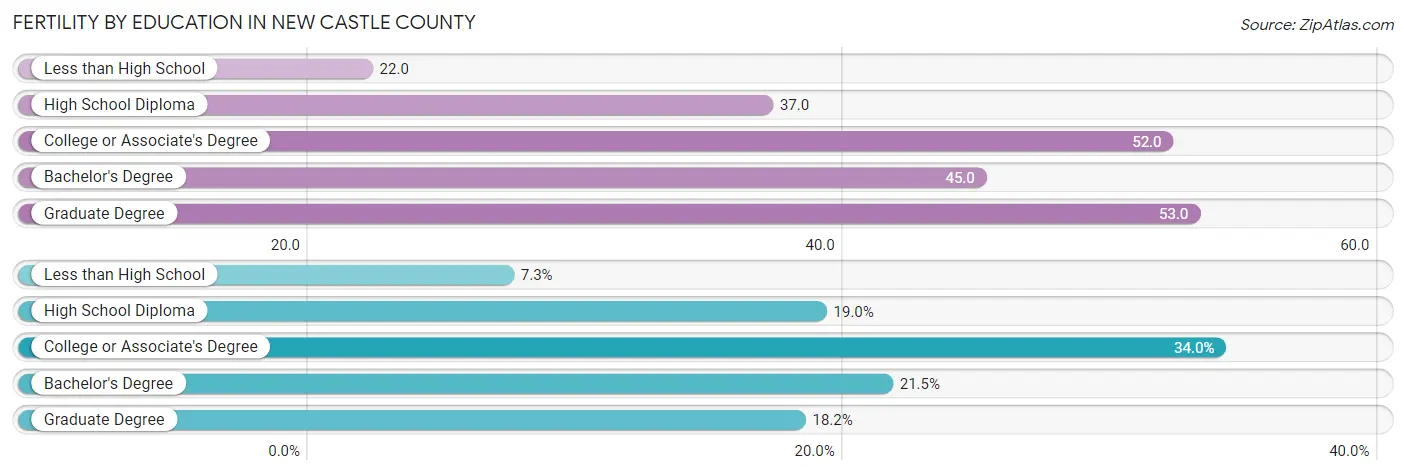
| Educational Attainment | Women with Births | Births / 1,000 Women |
| Less than High School | 426 (7.3%) | 22.0 |
| High School Diploma | 1,111 (19.0%) | 37.0 |
| College or Associate's Degree | 1,986 (34.0%) | 52.0 |
| Bachelor's Degree | 1,256 (21.5%) | 45.0 |
| Graduate Degree | 1,065 (18.2%) | 53.0 |
| Total | 5,844 (100.0%) | 43.0 |
Fertility by Education by Marriage Status in New Castle County
34.4% of women with births in New Castle County are unmarried. Women with the educational attainment of graduate degree are most likely to be married with 94.6% of them married at childbirth, while women with the educational attainment of college or associate's degree are least likely to be married with 52.0% of them unmarried at childbirth.
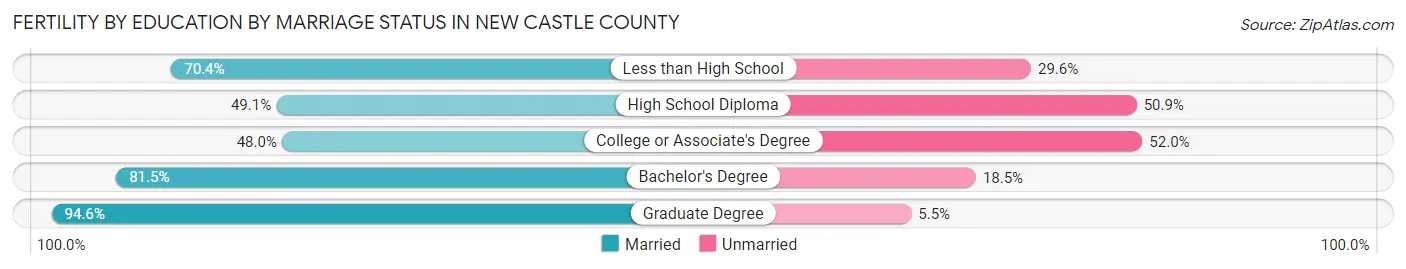
| Educational Attainment | Married | Unmarried |
| Less than High School | 300 (70.4%) | 126 (29.6%) |
| High School Diploma | 546 (49.1%) | 565 (50.9%) |
| College or Associate's Degree | 953 (48.0%) | 1,033 (52.0%) |
| Bachelor's Degree | 1,024 (81.5%) | 232 (18.5%) |
| Graduate Degree | 1,007 (94.6%) | 58 (5.4%) |
| Total | 3,834 (65.6%) | 2,010 (34.4%) |
Income in New Castle County
Income Overview in New Castle County
Per Capita Income in New Castle County is $44,725, while median incomes of families and households are $107,671 and $85,309 respectively.
| Characteristic | Number | Measure |
| Per Capita Income | 570,567 | $44,725 |
| Median Family Income | 137,987 | $107,671 |
| Mean Family Income | 137,987 | $133,240 |
| Median Household Income | 220,437 | $85,309 |
| Mean Household Income | 220,437 | $112,414 |
| Income Deficit | 137,987 | $11,343 |
| Wage / Income Gap (%) | 570,567 | 24.79% |
| Wage / Income Gap ($) | 570,567 | 75.21¢ per $1 |
| Gini / Inequality Index | 570,567 | 0.45 |
Earnings by Sex in New Castle County
Average Earnings in New Castle County are $46,811, $54,541 for men and $41,023 for women, a difference of 24.8%.
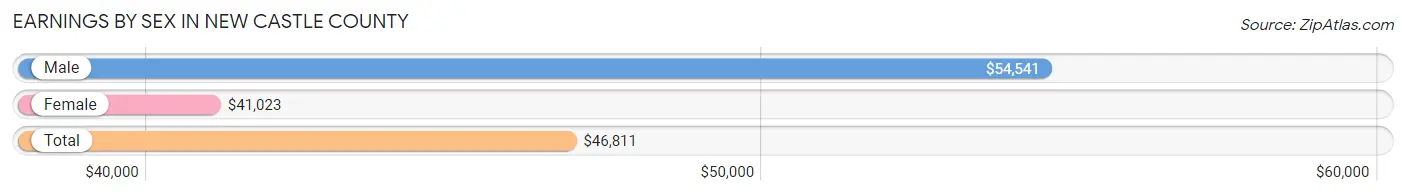
| Sex | Number | Average Earnings |
| Male | 161,280 (50.5%) | $54,541 |
| Female | 157,848 (49.5%) | $41,023 |
| Total | 319,128 (100.0%) | $46,811 |
Earnings by Sex by Income Bracket in New Castle County
The most common earnings brackets in New Castle County are $100,000+ for men (35,503 | 22.0%) and $100,000+ for women (18,352 | 11.6%).
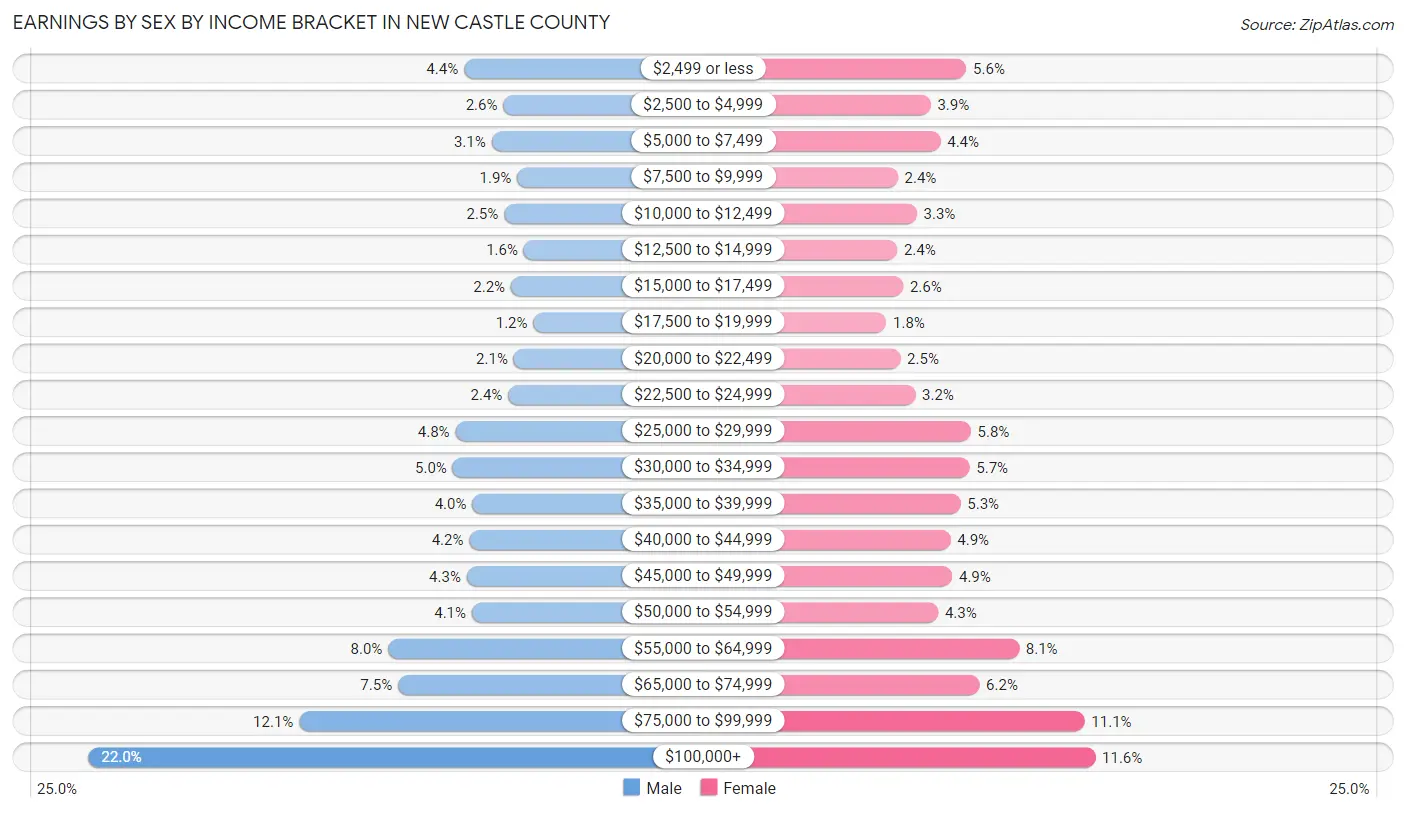
| Income | Male | Female |
| $2,499 or less | 7,132 (4.4%) | 8,829 (5.6%) |
| $2,500 to $4,999 | 4,157 (2.6%) | 6,183 (3.9%) |
| $5,000 to $7,499 | 5,052 (3.1%) | 6,915 (4.4%) |
| $7,500 to $9,999 | 3,116 (1.9%) | 3,759 (2.4%) |
| $10,000 to $12,499 | 4,089 (2.5%) | 5,164 (3.3%) |
| $12,500 to $14,999 | 2,609 (1.6%) | 3,704 (2.4%) |
| $15,000 to $17,499 | 3,588 (2.2%) | 4,159 (2.6%) |
| $17,500 to $19,999 | 1,890 (1.2%) | 2,902 (1.8%) |
| $20,000 to $22,499 | 3,364 (2.1%) | 3,954 (2.5%) |
| $22,500 to $24,999 | 3,794 (2.4%) | 5,056 (3.2%) |
| $25,000 to $29,999 | 7,776 (4.8%) | 9,163 (5.8%) |
| $30,000 to $34,999 | 7,980 (5.0%) | 9,061 (5.7%) |
| $35,000 to $39,999 | 6,504 (4.0%) | 8,393 (5.3%) |
| $40,000 to $44,999 | 6,727 (4.2%) | 7,653 (4.9%) |
| $45,000 to $49,999 | 6,911 (4.3%) | 7,784 (4.9%) |
| $50,000 to $54,999 | 6,536 (4.1%) | 6,740 (4.3%) |
| $55,000 to $64,999 | 12,848 (8.0%) | 12,728 (8.1%) |
| $65,000 to $74,999 | 12,117 (7.5%) | 9,779 (6.2%) |
| $75,000 to $99,999 | 19,587 (12.1%) | 17,570 (11.1%) |
| $100,000+ | 35,503 (22.0%) | 18,352 (11.6%) |
| Total | 161,280 (100.0%) | 157,848 (100.0%) |
Earnings by Sex by Educational Attainment in New Castle County
Average earnings in New Castle County are $61,366 for men and $47,867 for women, a difference of 22.0%. Men with an educational attainment of graduate degree enjoy the highest average annual earnings of $109,357, while those with less than high school education earn the least with $36,209. Women with an educational attainment of graduate degree earn the most with the average annual earnings of $77,651, while those with less than high school education have the smallest earnings of $21,652.
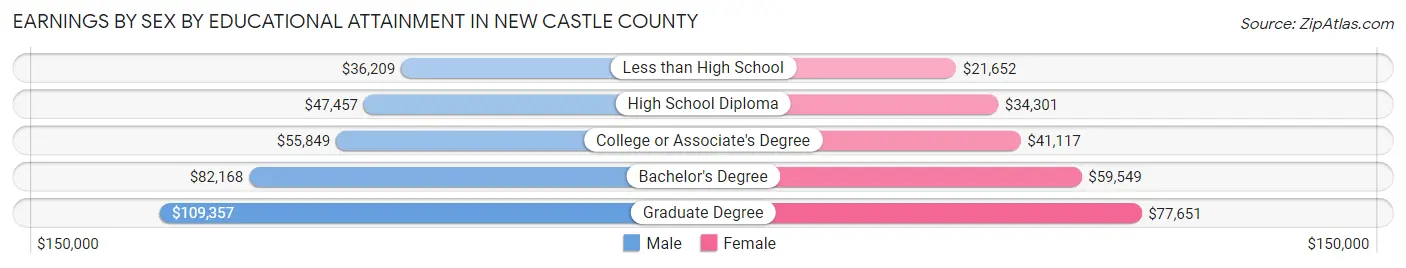
| Educational Attainment | Male Income | Female Income |
| Less than High School | $36,209 | $21,652 |
| High School Diploma | $47,457 | $34,301 |
| College or Associate's Degree | $55,849 | $41,117 |
| Bachelor's Degree | $82,168 | $59,549 |
| Graduate Degree | $109,357 | $77,651 |
| Total | $61,366 | $47,867 |
Family Income in New Castle County
Family Income Brackets in New Castle County
According to the New Castle County family income data, there are 31,185 families falling into the $100,000 to $149,999 income range, which is the most common income bracket and makes up 22.6% of all families. Conversely, the $10,000 to $14,999 income bracket is the least frequent group with only 1,794 families (1.3%) belonging to this category.
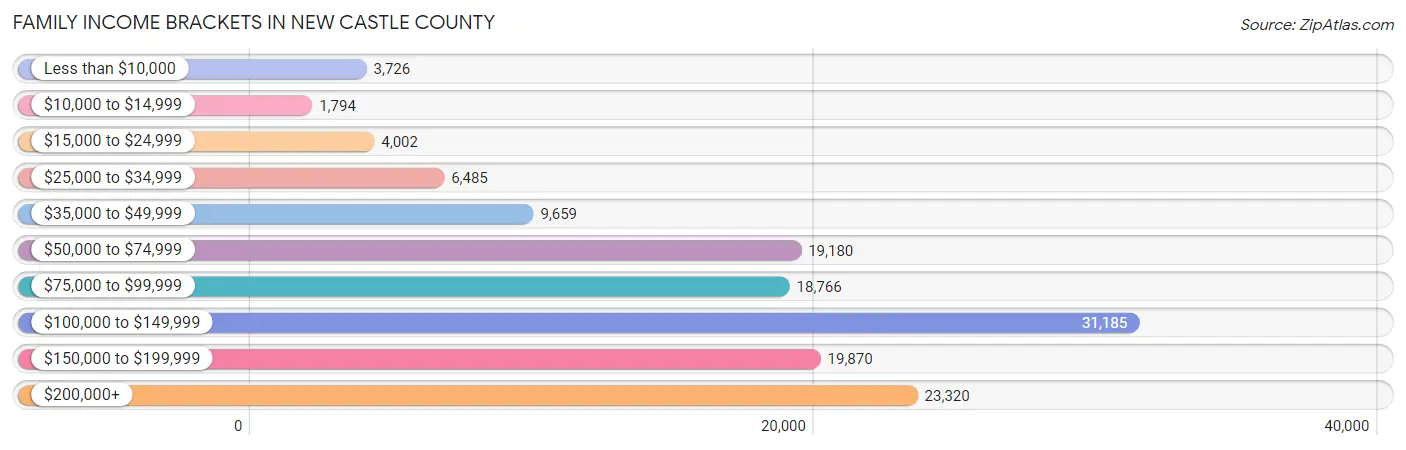
| Income Bracket | # Families | % Families |
| Less than $10,000 | 3,726 | 2.7% |
| $10,000 to $14,999 | 1,794 | 1.3% |
| $15,000 to $24,999 | 4,002 | 2.9% |
| $25,000 to $34,999 | 6,485 | 4.7% |
| $35,000 to $49,999 | 9,659 | 7.0% |
| $50,000 to $74,999 | 19,180 | 13.9% |
| $75,000 to $99,999 | 18,766 | 13.6% |
| $100,000 to $149,999 | 31,185 | 22.6% |
| $150,000 to $199,999 | 19,870 | 14.4% |
| $200,000+ | 23,320 | 16.9% |
Family Income by Famaliy Size in New Castle County
4-person families (25,212 | 18.3%) account for the highest median family income in New Castle County with $131,850 per family, while 2-person families (63,674 | 46.1%) have the highest median income of $46,998 per family member.
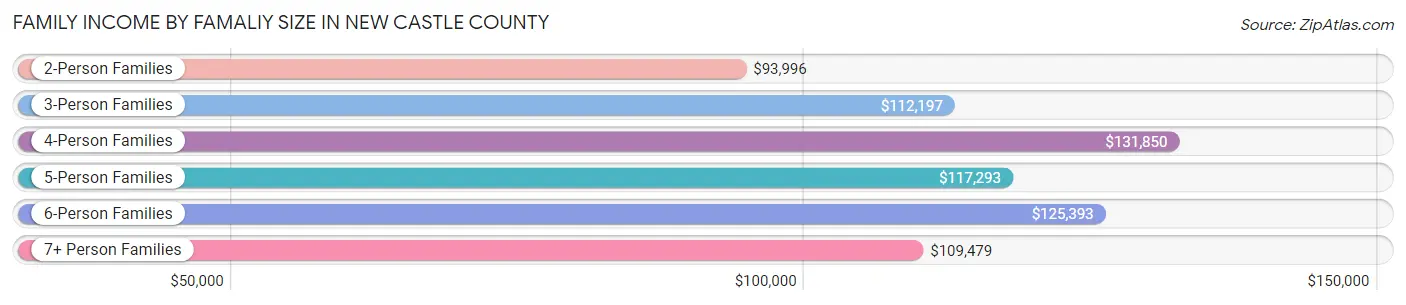
| Income Bracket | # Families | Median Income |
| 2-Person Families | 63,674 (46.1%) | $93,996 |
| 3-Person Families | 35,357 (25.6%) | $112,197 |
| 4-Person Families | 25,212 (18.3%) | $131,850 |
| 5-Person Families | 9,231 (6.7%) | $117,293 |
| 6-Person Families | 2,713 (2.0%) | $125,393 |
| 7+ Person Families | 1,800 (1.3%) | $109,479 |
| Total | 137,987 (100.0%) | $107,671 |
Family Income by Number of Earners in New Castle County
The median family income in New Castle County is $107,671, with families comprising 3+ earners (18,749) having the highest median family income of $157,230, while families with no earners (17,972) have the lowest median family income of $60,249, accounting for 13.6% and 13.0% of families, respectively.
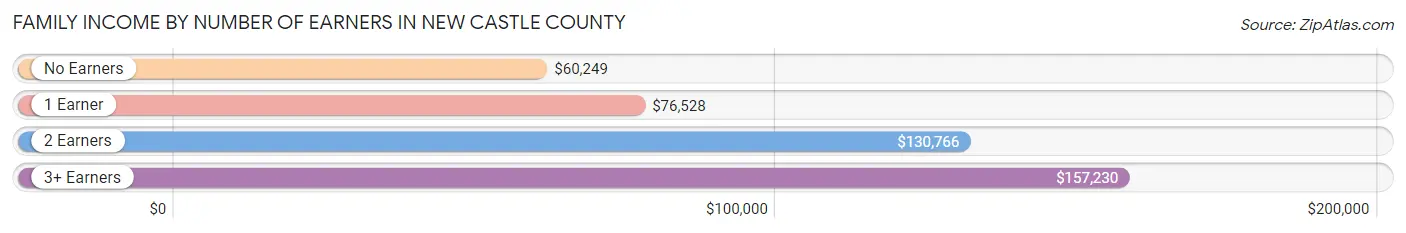
| Number of Earners | # Families | Median Income |
| No Earners | 17,972 (13.0%) | $60,249 |
| 1 Earner | 41,656 (30.2%) | $76,528 |
| 2 Earners | 59,610 (43.2%) | $130,766 |
| 3+ Earners | 18,749 (13.6%) | $157,230 |
| Total | 137,987 (100.0%) | $107,671 |
Household Income in New Castle County
Household Income Brackets in New Castle County
With 41,663 households falling in the category, the $100,000 to $149,999 income range is the most frequent in New Castle County, accounting for 18.9% of all households. In contrast, only 5,952 households (2.7%) fall into the $10,000 to $14,999 income bracket, making it the least populous group.
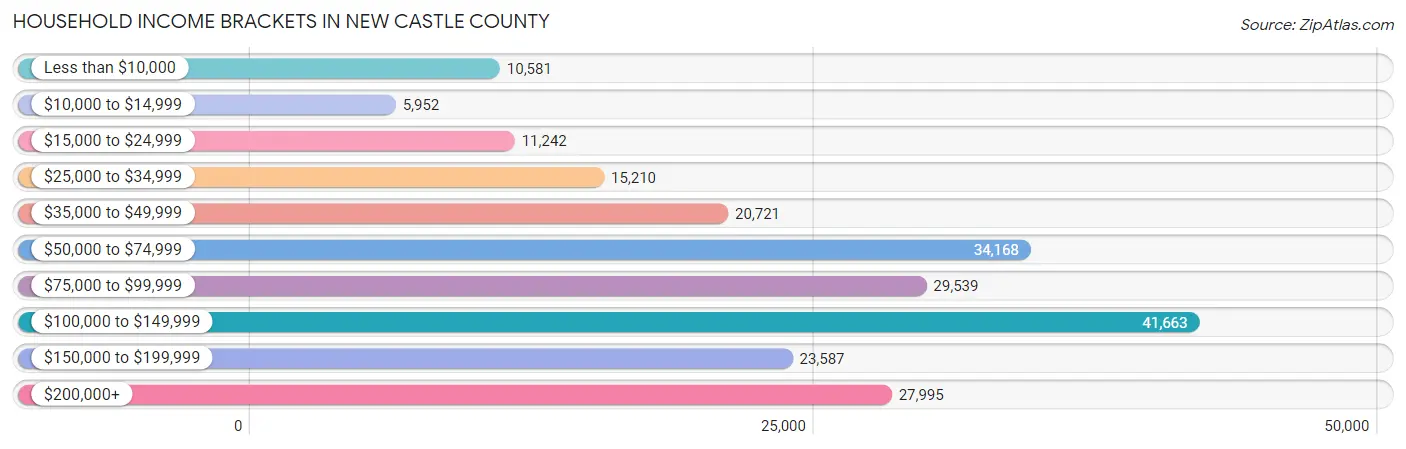
| Income Bracket | # Households | % Households |
| Less than $10,000 | 10,581 | 4.8% |
| $10,000 to $14,999 | 5,952 | 2.7% |
| $15,000 to $24,999 | 11,242 | 5.1% |
| $25,000 to $34,999 | 15,210 | 6.9% |
| $35,000 to $49,999 | 20,721 | 9.4% |
| $50,000 to $74,999 | 34,168 | 15.5% |
| $75,000 to $99,999 | 29,539 | 13.4% |
| $100,000 to $149,999 | 41,663 | 18.9% |
| $150,000 to $199,999 | 23,587 | 10.7% |
| $200,000+ | 27,995 | 12.7% |
Household Income by Householder Age in New Castle County
The median household income in New Castle County is $85,309, with the highest median household income of $100,531 found in the 45 to 64 years age bracket for the primary householder. A total of 85,858 households (39.0%) fall into this category. Meanwhile, the 15 to 24 years age bracket for the primary householder has the lowest median household income of $36,138, with 6,136 households (2.8%) in this group.
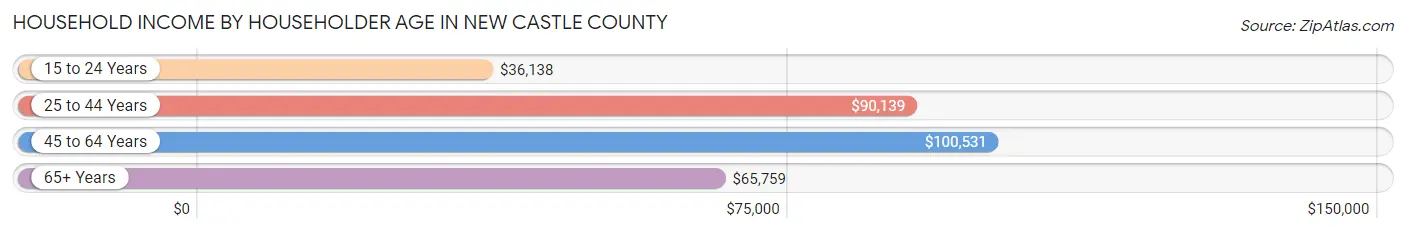
| Income Bracket | # Households | Median Income |
| 15 to 24 Years | 6,136 (2.8%) | $36,138 |
| 25 to 44 Years | 70,783 (32.1%) | $90,139 |
| 45 to 64 Years | 85,858 (39.0%) | $100,531 |
| 65+ Years | 57,660 (26.2%) | $65,759 |
| Total | 220,437 (100.0%) | $85,309 |
Poverty in New Castle County
Income Below Poverty by Sex and Age in New Castle County
With 9.5% poverty level for males and 11.5% for females among the residents of New Castle County, 15 year old males and 18 to 24 year old females are the most vulnerable to poverty, with 791 males (23.7%) and 4,881 females (21.8%) in their respective age groups living below the poverty level.
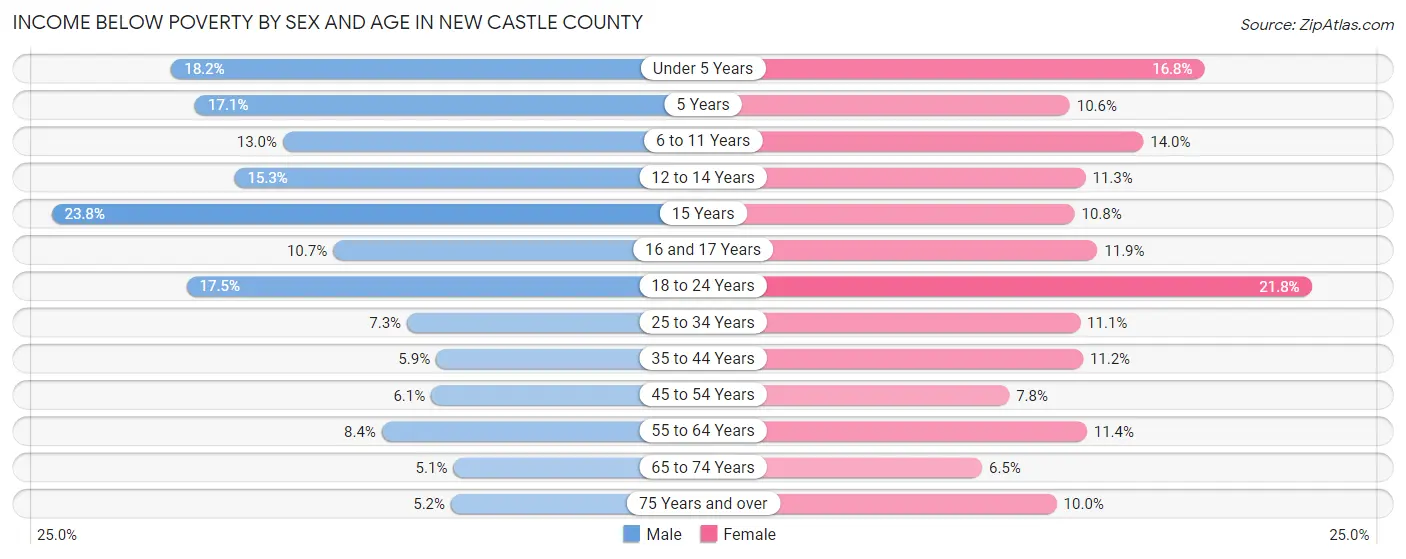
| Age Bracket | Male | Female |
| Under 5 Years | 2,821 (18.2%) | 2,554 (16.8%) |
| 5 Years | 583 (17.1%) | 301 (10.6%) |
| 6 to 11 Years | 2,546 (13.0%) | 2,712 (14.0%) |
| 12 to 14 Years | 1,705 (15.3%) | 1,238 (11.3%) |
| 15 Years | 791 (23.7%) | 376 (10.8%) |
| 16 and 17 Years | 805 (10.7%) | 837 (11.9%) |
| 18 to 24 Years | 4,061 (17.5%) | 4,881 (21.8%) |
| 25 to 34 Years | 2,819 (7.3%) | 4,421 (11.1%) |
| 35 to 44 Years | 2,091 (5.9%) | 4,093 (11.2%) |
| 45 to 54 Years | 2,121 (6.1%) | 2,878 (7.8%) |
| 55 to 64 Years | 3,097 (8.4%) | 4,532 (11.4%) |
| 65 to 74 Years | 1,273 (5.1%) | 1,900 (6.5%) |
| 75 Years and over | 781 (5.2%) | 2,138 (10.0%) |
| Total | 25,494 (9.5%) | 32,861 (11.5%) |
Income Above Poverty by Sex and Age in New Castle County
According to the poverty statistics in New Castle County, males aged 65 to 74 years and females aged 65 to 74 years are the age groups that are most secure financially, with 94.9% of males and 93.5% of females in these age groups living above the poverty line.
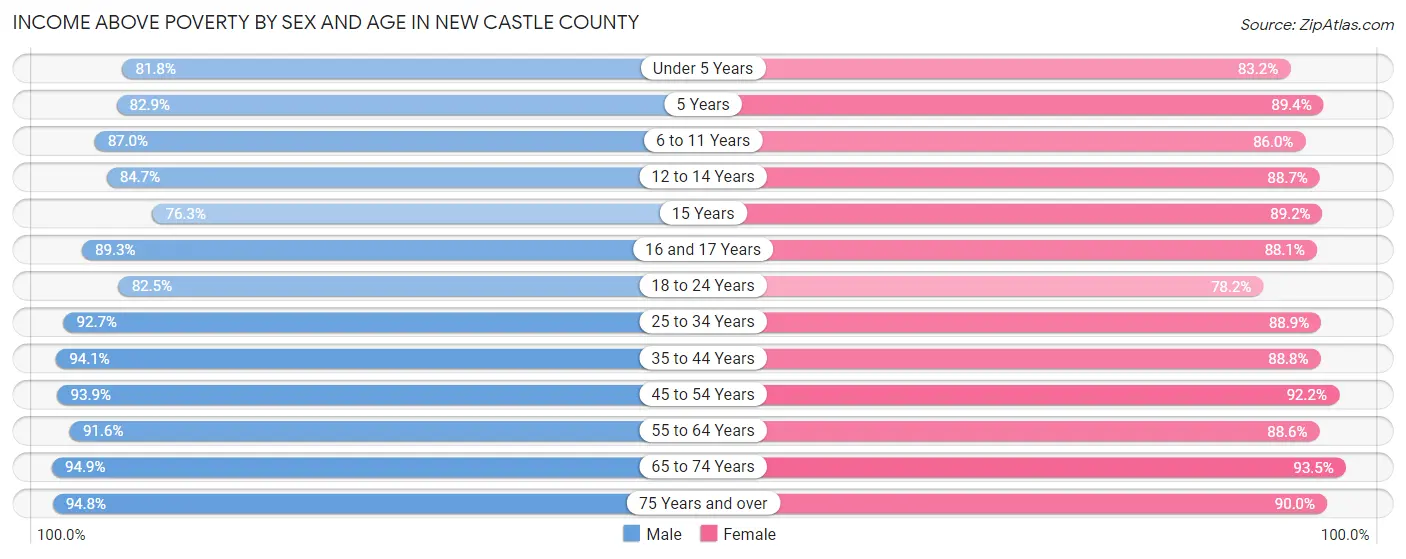
| Age Bracket | Male | Female |
| Under 5 Years | 12,688 (81.8%) | 12,627 (83.2%) |
| 5 Years | 2,829 (82.9%) | 2,545 (89.4%) |
| 6 to 11 Years | 17,013 (87.0%) | 16,672 (86.0%) |
| 12 to 14 Years | 9,471 (84.7%) | 9,710 (88.7%) |
| 15 Years | 2,540 (76.2%) | 3,104 (89.2%) |
| 16 and 17 Years | 6,725 (89.3%) | 6,220 (88.1%) |
| 18 to 24 Years | 19,168 (82.5%) | 17,519 (78.2%) |
| 25 to 34 Years | 36,005 (92.7%) | 35,541 (88.9%) |
| 35 to 44 Years | 33,306 (94.1%) | 32,496 (88.8%) |
| 45 to 54 Years | 32,416 (93.9%) | 34,169 (92.2%) |
| 55 to 64 Years | 33,651 (91.6%) | 35,317 (88.6%) |
| 65 to 74 Years | 23,655 (94.9%) | 27,300 (93.5%) |
| 75 Years and over | 14,175 (94.8%) | 19,317 (90.0%) |
| Total | 243,642 (90.5%) | 252,537 (88.5%) |
Income Below Poverty Among Married-Couple Families in New Castle County
The poverty statistics for married-couple families in New Castle County show that 3.1% or 3,048 of the total 98,195 families live below the poverty line. Families with 5 or more children have the highest poverty rate of 19.6%, comprising of 73 families. On the other hand, families with no children have the lowest poverty rate of 2.3%, which includes 1,374 families.
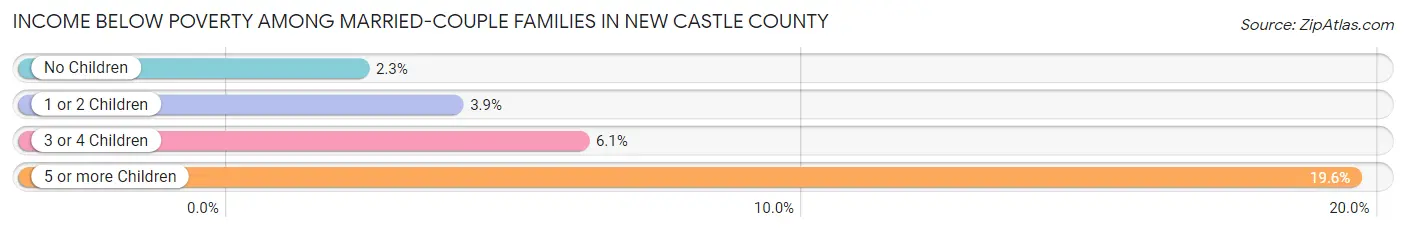
| Children | Above Poverty | Below Poverty |
| No Children | 58,787 (97.7%) | 1,374 (2.3%) |
| 1 or 2 Children | 30,739 (96.1%) | 1,255 (3.9%) |
| 3 or 4 Children | 5,321 (93.9%) | 346 (6.1%) |
| 5 or more Children | 300 (80.4%) | 73 (19.6%) |
| Total | 95,147 (96.9%) | 3,048 (3.1%) |
Income Below Poverty Among Single-Parent Households in New Castle County
According to the poverty data in New Castle County, 7.9% or 912 single-father households and 19.3% or 5,448 single-mother households are living below the poverty line. Among single-father households, those with 5 or more children have the highest poverty rate, with 38 households (44.2%) experiencing poverty. Likewise, among single-mother households, those with 5 or more children have the highest poverty rate, with 87 households (58.8%) falling below the poverty line.
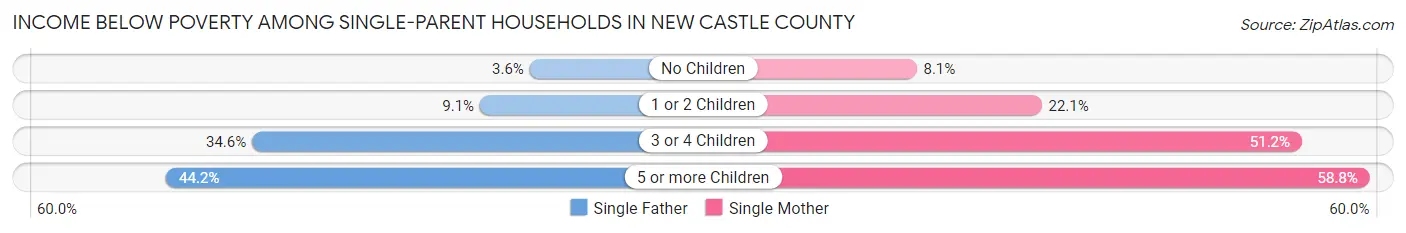
| Children | Single Father | Single Mother |
| No Children | 185 (3.5%) | 895 (8.1%) |
| 1 or 2 Children | 522 (9.1%) | 3,272 (22.1%) |
| 3 or 4 Children | 167 (34.6%) | 1,194 (51.2%) |
| 5 or more Children | 38 (44.2%) | 87 (58.8%) |
| Total | 912 (7.9%) | 5,448 (19.3%) |
Income Below Poverty Among Married-Couple vs Single-Parent Households in New Castle County
The poverty data for New Castle County shows that 3,048 of the married-couple family households (3.1%) and 6,360 of the single-parent households (16.0%) are living below the poverty level. Within the married-couple family households, those with 5 or more children have the highest poverty rate, with 73 households (19.6%) falling below the poverty line. Among the single-parent households, those with 5 or more children have the highest poverty rate, with 125 household (53.4%) living below poverty.
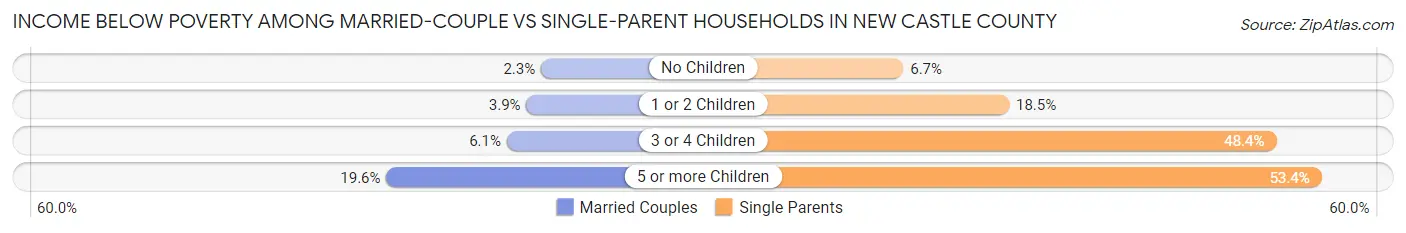
| Children | Married-Couple Families | Single-Parent Households |
| No Children | 1,374 (2.3%) | 1,080 (6.7%) |
| 1 or 2 Children | 1,255 (3.9%) | 3,794 (18.5%) |
| 3 or 4 Children | 346 (6.1%) | 1,361 (48.3%) |
| 5 or more Children | 73 (19.6%) | 125 (53.4%) |
| Total | 3,048 (3.1%) | 6,360 (16.0%) |
Employment Characteristics in New Castle County
Employment by Class of Employer in New Castle County
Among the 284,140 employed individuals in New Castle County, private company employees (192,210 | 67.6%), not-for-profit organizations (28,011 | 9.9%), and state government employees (21,810 | 7.7%) make up the most common classes of employment.
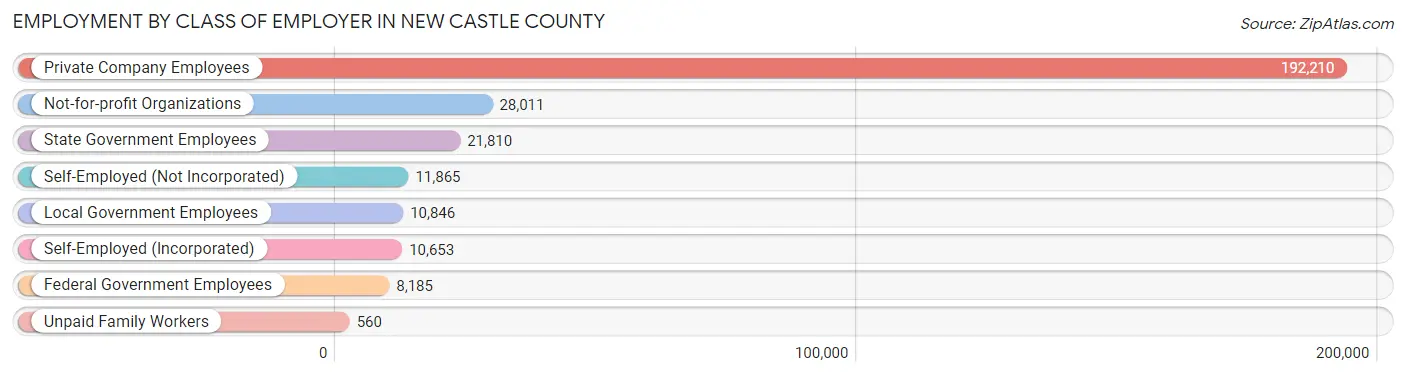
| Employer Class | # Employees | % Employees |
| Private Company Employees | 192,210 | 67.6% |
| Self-Employed (Incorporated) | 10,653 | 3.7% |
| Self-Employed (Not Incorporated) | 11,865 | 4.2% |
| Not-for-profit Organizations | 28,011 | 9.9% |
| Local Government Employees | 10,846 | 3.8% |
| State Government Employees | 21,810 | 7.7% |
| Federal Government Employees | 8,185 | 2.9% |
| Unpaid Family Workers | 560 | 0.2% |
| Total | 284,140 | 100.0% |
Employment Status by Age in New Castle County
According to the labor force statistics for New Castle County, out of the total population over 16 years of age (463,864), 66.1% or 306,614 individuals are in the labor force, with 5.4% or 16,557 of them unemployed. The age group with the highest labor force participation rate is 30 to 34 years, with 87.3% or 36,019 individuals in the labor force. Within the labor force, the 16 to 19 years age range has the highest percentage of unemployed individuals, with 12.8% or 1,748 of them being unemployed.
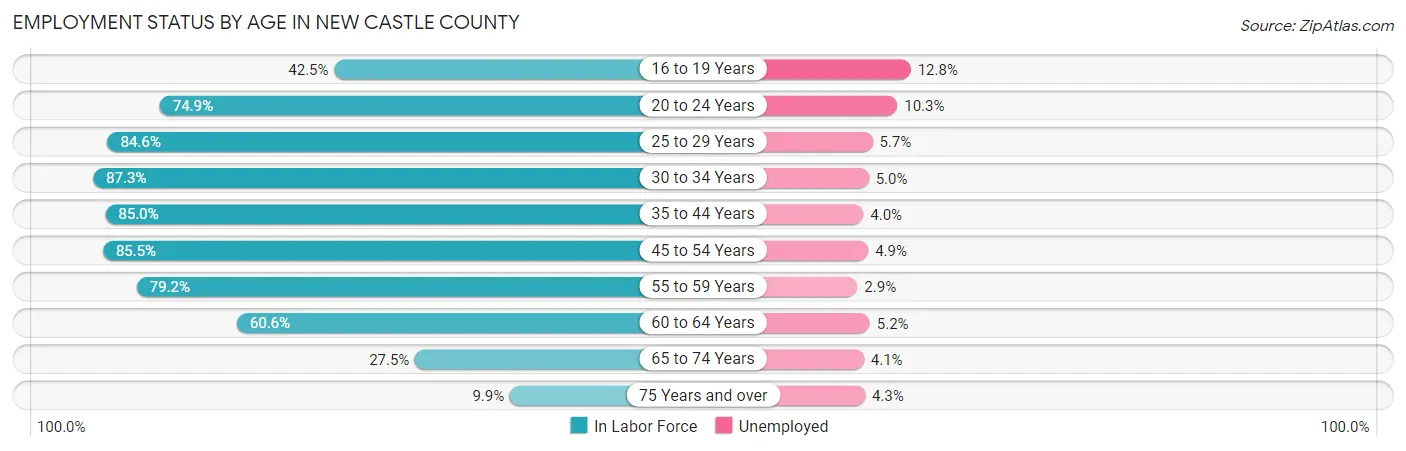
| Age Bracket | In Labor Force | Unemployed |
| 16 to 19 Years | 13,655 (42.5%) | 1,748 (12.8%) |
| 20 to 24 Years | 27,197 (74.9%) | 2,801 (10.3%) |
| 25 to 29 Years | 32,986 (84.6%) | 1,880 (5.7%) |
| 30 to 34 Years | 36,019 (87.3%) | 1,801 (5.0%) |
| 35 to 44 Years | 61,990 (85.0%) | 2,480 (4.0%) |
| 45 to 54 Years | 61,748 (85.5%) | 3,026 (4.9%) |
| 55 to 59 Years | 30,650 (79.2%) | 889 (2.9%) |
| 60 to 64 Years | 23,416 (60.6%) | 1,218 (5.2%) |
| 65 to 74 Years | 15,111 (27.5%) | 620 (4.1%) |
| 75 Years and over | 3,736 (9.9%) | 161 (4.3%) |
| Total | 306,614 (66.1%) | 16,557 (5.4%) |
Employment Status by Educational Attainment in New Castle County
According to labor force statistics for New Castle County, 81.5% of individuals (246,733) out of the total population between 25 and 64 years of age (302,740) are in the labor force, with 4.6% or 11,350 of them being unemployed. The group with the highest labor force participation rate are those with the educational attainment of bachelor's degree or higher, with 88.7% or 105,890 individuals in the labor force. Within the labor force, individuals with high school diploma education have the highest percentage of unemployment, with 7.3% or 4,498 of them being unemployed.
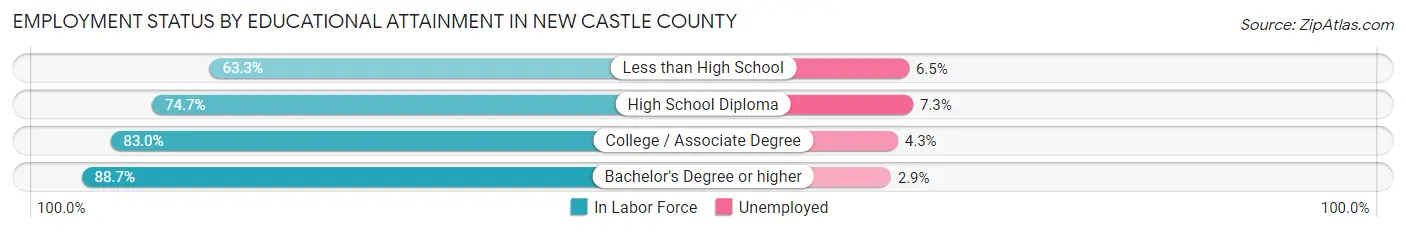
| Educational Attainment | In Labor Force | Unemployed |
| Less than High School | 14,162 (63.3%) | 1,454 (6.5%) |
| High School Diploma | 61,622 (74.7%) | 6,022 (7.3%) |
| College / Associate Degree | 65,151 (83.0%) | 3,375 (4.3%) |
| Bachelor's Degree or higher | 105,890 (88.7%) | 3,462 (2.9%) |
| Total | 246,733 (81.5%) | 13,926 (4.6%) |
Employment Occupations by Sex in New Castle County
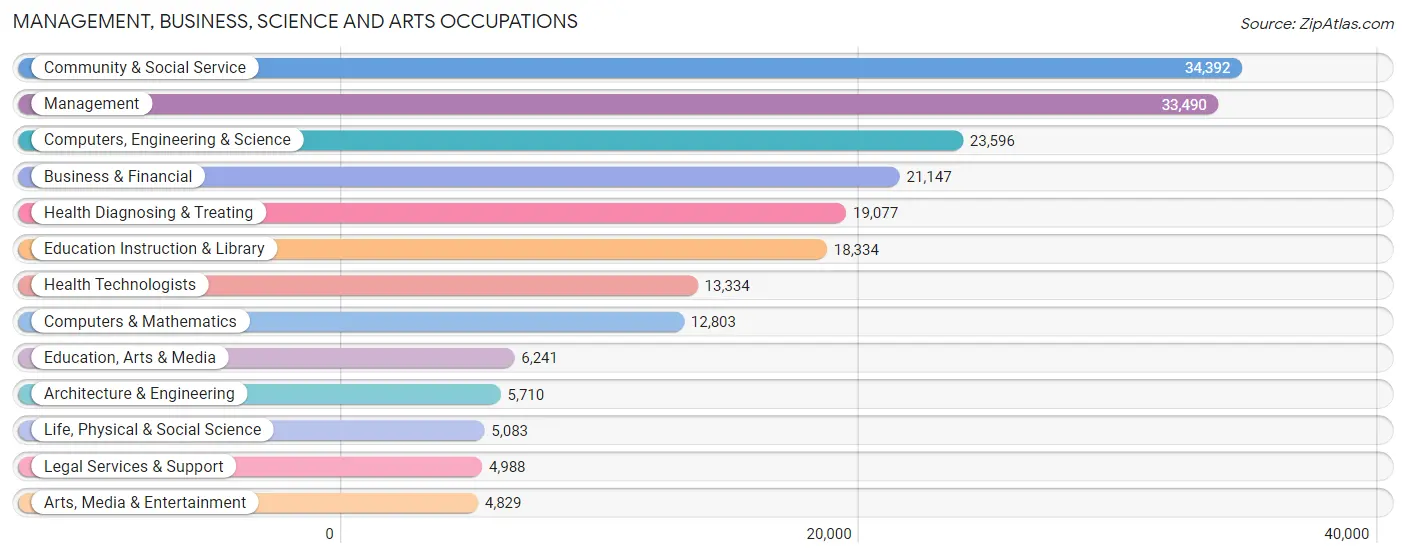
Management, Business, Science and Arts Occupations
The most common Management, Business, Science and Arts occupations in New Castle County are Community & Social Service (34,392 | 11.9%), Management (33,490 | 11.6%), Computers, Engineering & Science (23,596 | 8.2%), Business & Financial (21,147 | 7.3%), and Health Diagnosing & Treating (19,077 | 6.6%).
Management, Business, Science and Arts Occupations by Sex
Within the Management, Business, Science and Arts occupations in New Castle County, the most male-oriented occupations are Architecture & Engineering (85.3%), Computers & Mathematics (69.5%), and Computers, Engineering & Science (68.5%), while the most female-oriented occupations are Health Technologists (79.0%), Health Diagnosing & Treating (77.2%), and Education Instruction & Library (69.4%).
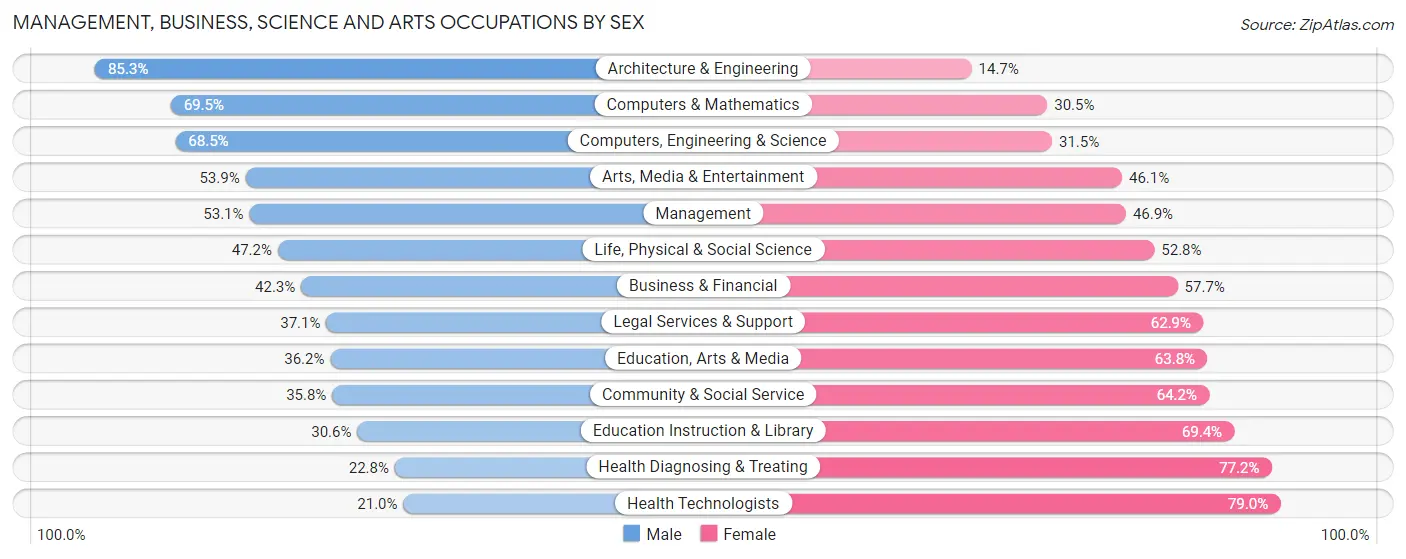
| Occupation | Male | Female |
| Management | 17,788 (53.1%) | 15,702 (46.9%) |
| Business & Financial | 8,950 (42.3%) | 12,197 (57.7%) |
| Computers, Engineering & Science | 16,170 (68.5%) | 7,426 (31.5%) |
| Computers & Mathematics | 8,901 (69.5%) | 3,902 (30.5%) |
| Architecture & Engineering | 4,871 (85.3%) | 839 (14.7%) |
| Life, Physical & Social Science | 2,398 (47.2%) | 2,685 (52.8%) |
| Community & Social Service | 12,323 (35.8%) | 22,069 (64.2%) |
| Education, Arts & Media | 2,261 (36.2%) | 3,980 (63.8%) |
| Legal Services & Support | 1,849 (37.1%) | 3,139 (62.9%) |
| Education Instruction & Library | 5,609 (30.6%) | 12,725 (69.4%) |
| Arts, Media & Entertainment | 2,604 (53.9%) | 2,225 (46.1%) |
| Health Diagnosing & Treating | 4,345 (22.8%) | 14,732 (77.2%) |
| Health Technologists | 2,799 (21.0%) | 10,535 (79.0%) |
| Total (Category) | 59,576 (45.2%) | 72,126 (54.8%) |
| Total (Overall) | 146,853 (50.8%) | 141,947 (49.1%) |
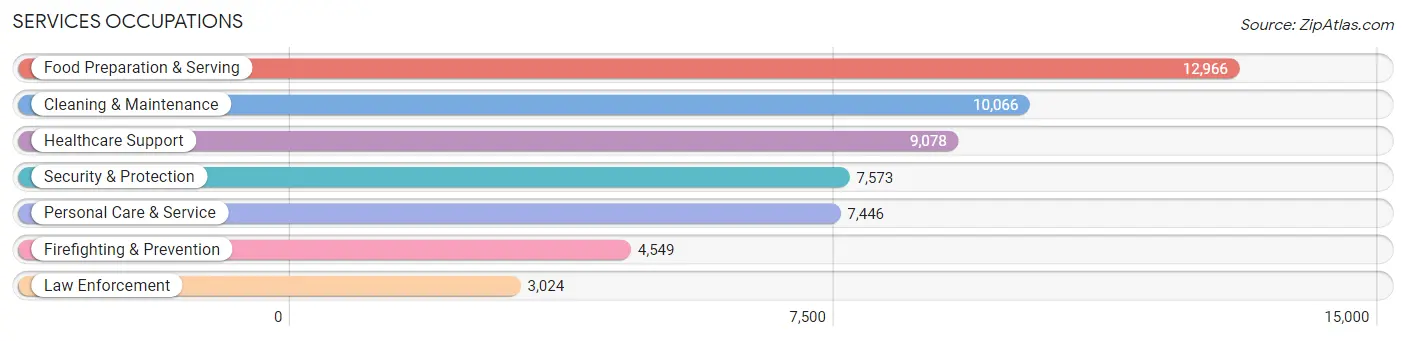
Services Occupations
The most common Services occupations in New Castle County are Food Preparation & Serving (12,966 | 4.5%), Cleaning & Maintenance (10,066 | 3.5%), Healthcare Support (9,078 | 3.1%), Security & Protection (7,573 | 2.6%), and Personal Care & Service (7,446 | 2.6%).
Services Occupations by Sex
Within the Services occupations in New Castle County, the most male-oriented occupations are Law Enforcement (78.5%), Security & Protection (70.7%), and Cleaning & Maintenance (66.5%), while the most female-oriented occupations are Healthcare Support (81.2%), Personal Care & Service (74.1%), and Food Preparation & Serving (57.9%).
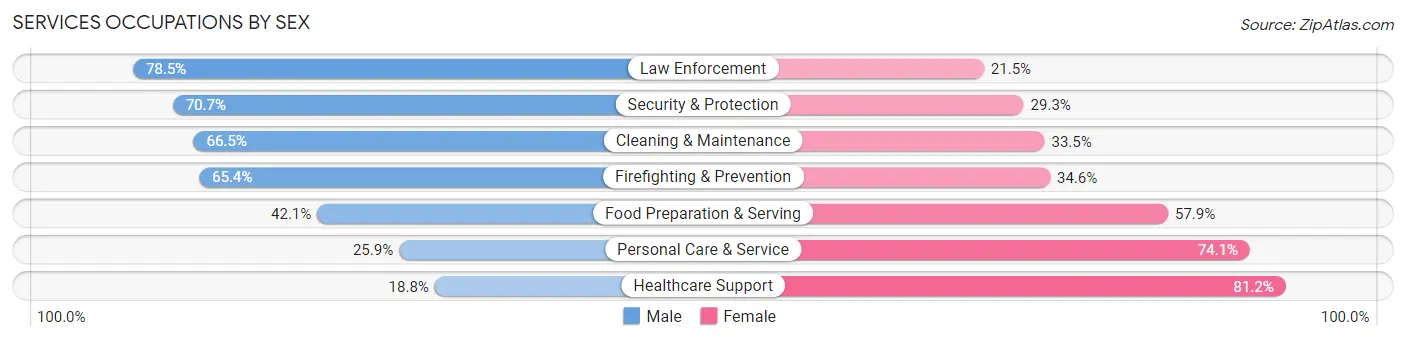
| Occupation | Male | Female |
| Healthcare Support | 1,707 (18.8%) | 7,371 (81.2%) |
| Security & Protection | 5,352 (70.7%) | 2,221 (29.3%) |
| Firefighting & Prevention | 2,977 (65.4%) | 1,572 (34.6%) |
| Law Enforcement | 2,375 (78.5%) | 649 (21.5%) |
| Food Preparation & Serving | 5,456 (42.1%) | 7,510 (57.9%) |
| Cleaning & Maintenance | 6,698 (66.5%) | 3,368 (33.5%) |
| Personal Care & Service | 1,926 (25.9%) | 5,520 (74.1%) |
| Total (Category) | 21,139 (44.9%) | 25,990 (55.1%) |
| Total (Overall) | 146,853 (50.8%) | 141,947 (49.1%) |
Sales and Office Occupations
The most common Sales and Office occupations in New Castle County are Office & Administration (32,154 | 11.1%), and Sales & Related (24,301 | 8.4%).

Sales and Office Occupations by Sex
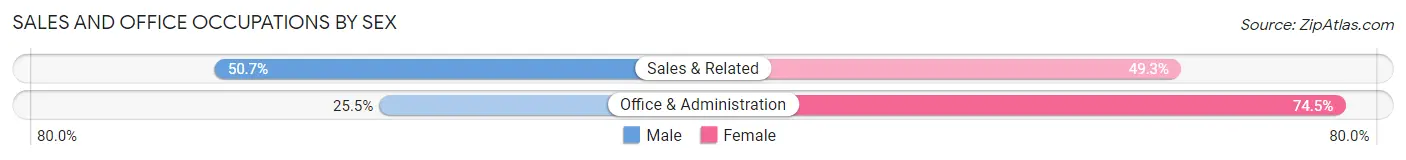
| Occupation | Male | Female |
| Sales & Related | 12,328 (50.7%) | 11,973 (49.3%) |
| Office & Administration | 8,187 (25.5%) | 23,967 (74.5%) |
| Total (Category) | 20,515 (36.3%) | 35,940 (63.7%) |
| Total (Overall) | 146,853 (50.8%) | 141,947 (49.1%) |
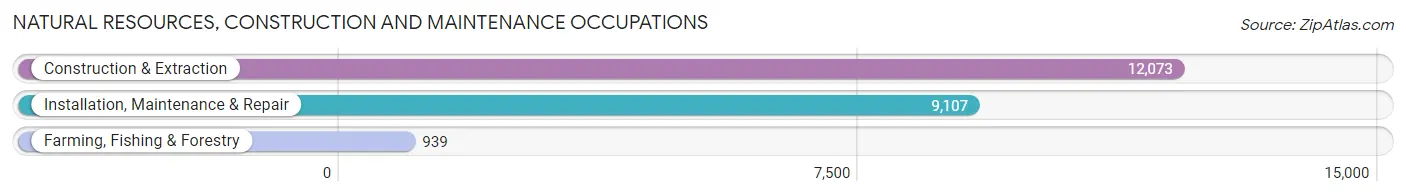
Natural Resources, Construction and Maintenance Occupations
The most common Natural Resources, Construction and Maintenance occupations in New Castle County are Construction & Extraction (12,073 | 4.2%), Installation, Maintenance & Repair (9,107 | 3.2%), and Farming, Fishing & Forestry (939 | 0.3%).
Natural Resources, Construction and Maintenance Occupations by Sex
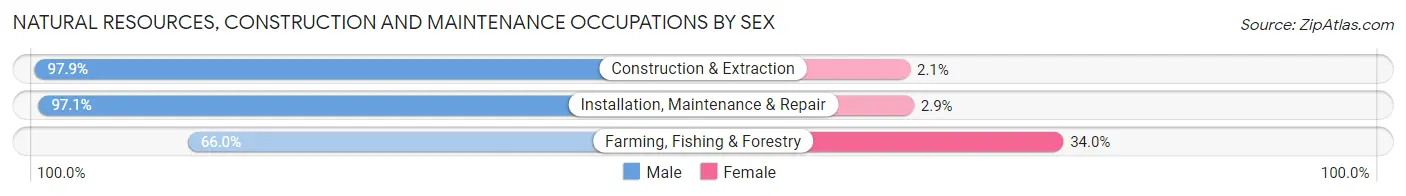
| Occupation | Male | Female |
| Farming, Fishing & Forestry | 620 (66.0%) | 319 (34.0%) |
| Construction & Extraction | 11,819 (97.9%) | 254 (2.1%) |
| Installation, Maintenance & Repair | 8,844 (97.1%) | 263 (2.9%) |
| Total (Category) | 21,283 (96.2%) | 836 (3.8%) |
| Total (Overall) | 146,853 (50.8%) | 141,947 (49.1%) |
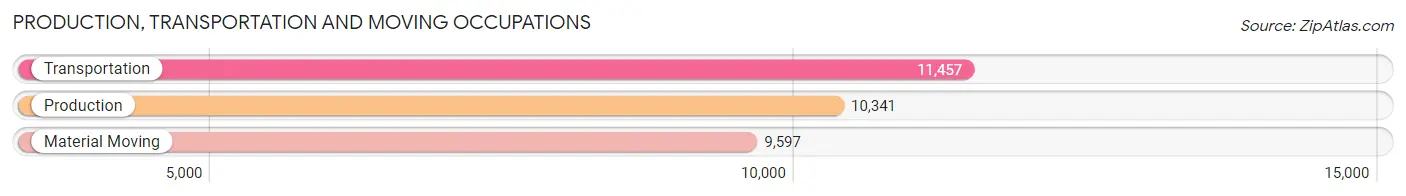
Production, Transportation and Moving Occupations
The most common Production, Transportation and Moving occupations in New Castle County are Transportation (11,457 | 4.0%), Production (10,341 | 3.6%), and Material Moving (9,597 | 3.3%).
Production, Transportation and Moving Occupations by Sex
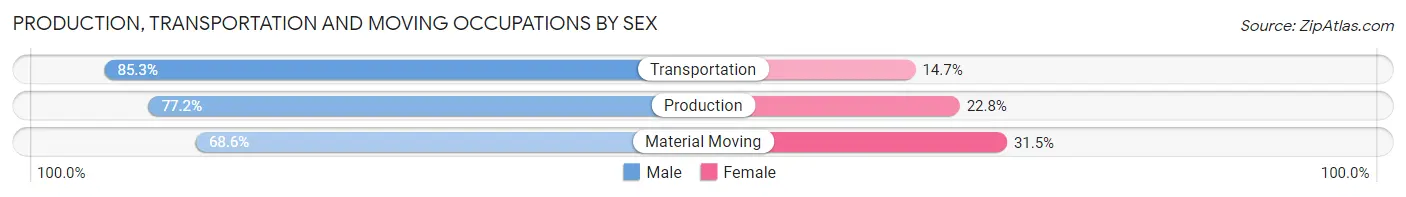
| Occupation | Male | Female |
| Production | 7,985 (77.2%) | 2,356 (22.8%) |
| Transportation | 9,776 (85.3%) | 1,681 (14.7%) |
| Material Moving | 6,579 (68.5%) | 3,018 (31.5%) |
| Total (Category) | 24,340 (77.5%) | 7,055 (22.5%) |
| Total (Overall) | 146,853 (50.8%) | 141,947 (49.1%) |
Employment Industries by Sex in New Castle County
Employment Industries in New Castle County
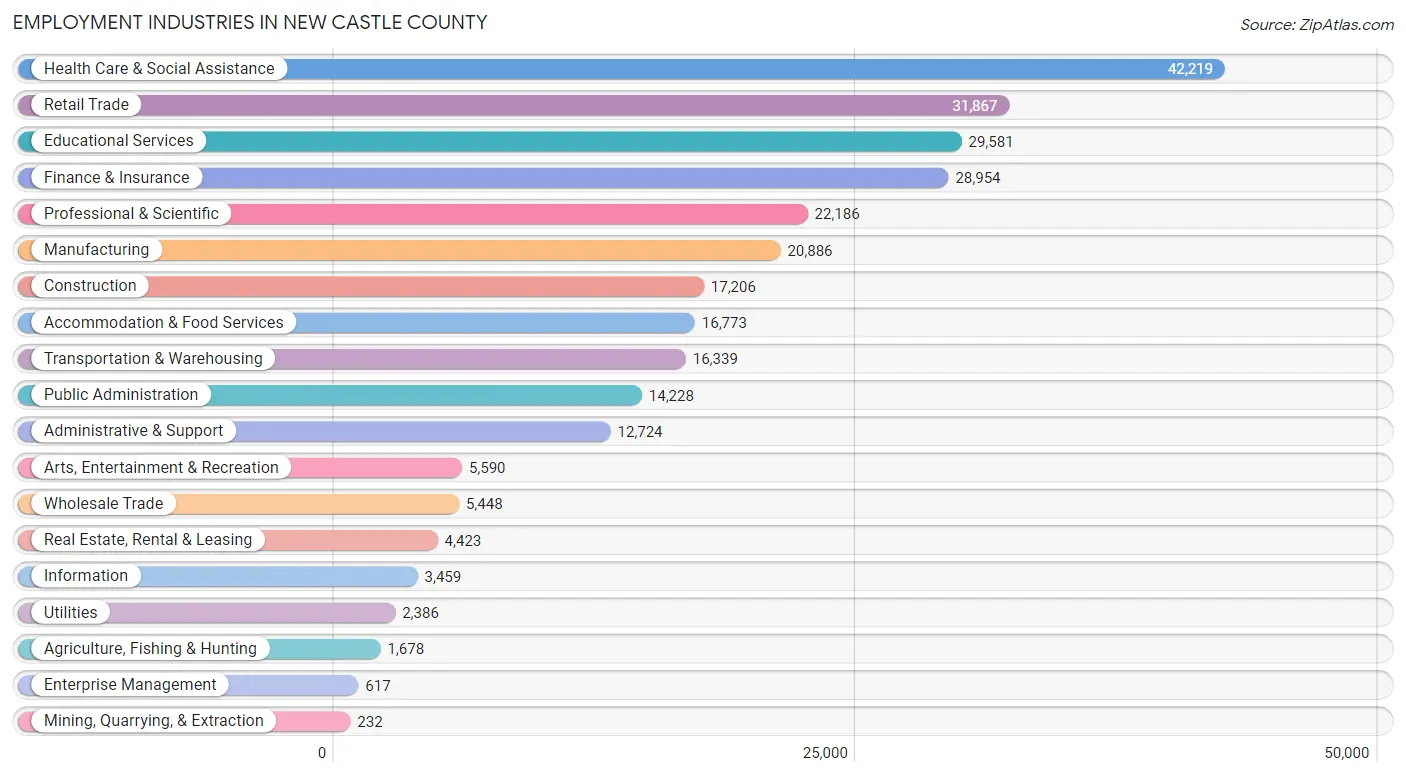
The major employment industries in New Castle County include Health Care & Social Assistance (42,219 | 14.6%), Retail Trade (31,867 | 11.0%), Educational Services (29,581 | 10.2%), Finance & Insurance (28,954 | 10.0%), and Professional & Scientific (22,186 | 7.7%).
Employment Industries by Sex in New Castle County
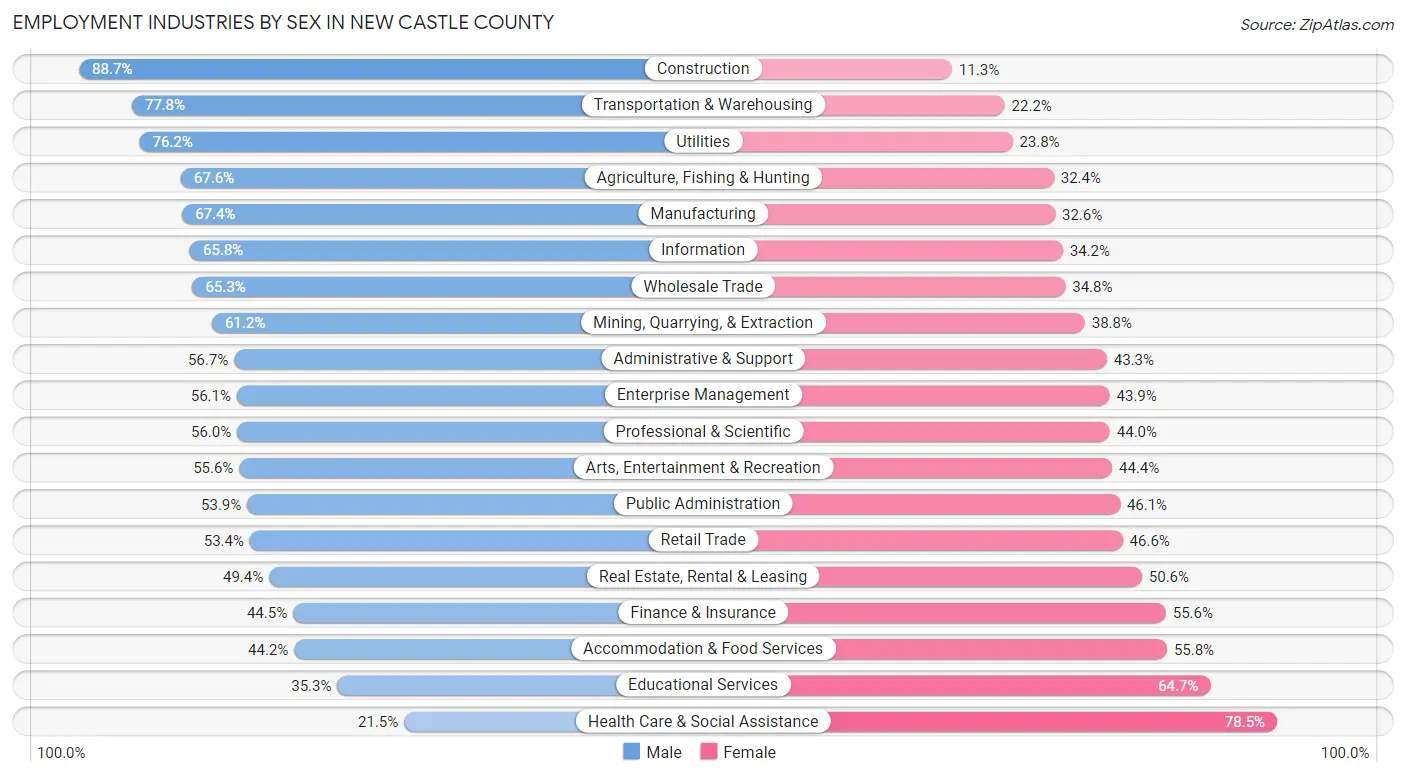
The New Castle County industries that see more men than women are Construction (88.7%), Transportation & Warehousing (77.8%), and Utilities (76.2%), whereas the industries that tend to have a higher number of women are Health Care & Social Assistance (78.5%), Educational Services (64.7%), and Accommodation & Food Services (55.8%).
| Industry | Male | Female |
| Agriculture, Fishing & Hunting | 1,135 (67.6%) | 543 (32.4%) |
| Mining, Quarrying, & Extraction | 142 (61.2%) | 90 (38.8%) |
| Construction | 15,262 (88.7%) | 1,944 (11.3%) |
| Manufacturing | 14,070 (67.4%) | 6,816 (32.6%) |
| Wholesale Trade | 3,555 (65.2%) | 1,893 (34.7%) |
| Retail Trade | 17,012 (53.4%) | 14,855 (46.6%) |
| Transportation & Warehousing | 12,711 (77.8%) | 3,628 (22.2%) |
| Utilities | 1,818 (76.2%) | 568 (23.8%) |
| Information | 2,275 (65.8%) | 1,184 (34.2%) |
| Finance & Insurance | 12,871 (44.5%) | 16,083 (55.5%) |
| Real Estate, Rental & Leasing | 2,185 (49.4%) | 2,238 (50.6%) |
| Professional & Scientific | 12,430 (56.0%) | 9,756 (44.0%) |
| Enterprise Management | 346 (56.1%) | 271 (43.9%) |
| Administrative & Support | 7,210 (56.7%) | 5,514 (43.3%) |
| Educational Services | 10,432 (35.3%) | 19,149 (64.7%) |
| Health Care & Social Assistance | 9,060 (21.5%) | 33,159 (78.5%) |
| Arts, Entertainment & Recreation | 3,107 (55.6%) | 2,483 (44.4%) |
| Accommodation & Food Services | 7,415 (44.2%) | 9,358 (55.8%) |
| Public Administration | 7,675 (53.9%) | 6,553 (46.1%) |
| Total | 146,853 (50.8%) | 141,947 (49.1%) |
Education in New Castle County
School Enrollment in New Castle County
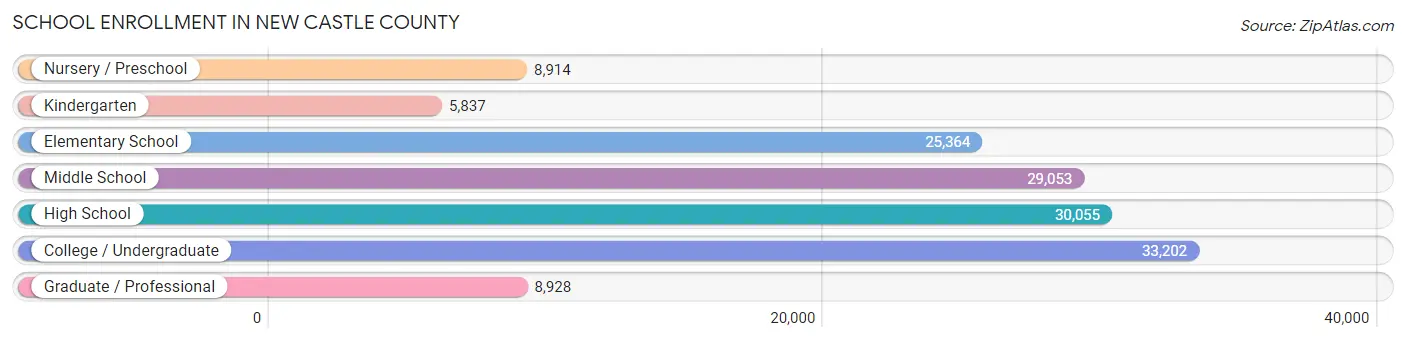
The most common levels of schooling among the 141,353 students in New Castle County are college / undergraduate (33,202 | 23.5%), high school (30,055 | 21.3%), and middle school (29,053 | 20.5%).
| School Level | # Students | % Students |
| Nursery / Preschool | 8,914 | 6.3% |
| Kindergarten | 5,837 | 4.1% |
| Elementary School | 25,364 | 17.9% |
| Middle School | 29,053 | 20.5% |
| High School | 30,055 | 21.3% |
| College / Undergraduate | 33,202 | 23.5% |
| Graduate / Professional | 8,928 | 6.3% |
| Total | 141,353 | 100.0% |
School Enrollment by Age by Funding Source in New Castle County
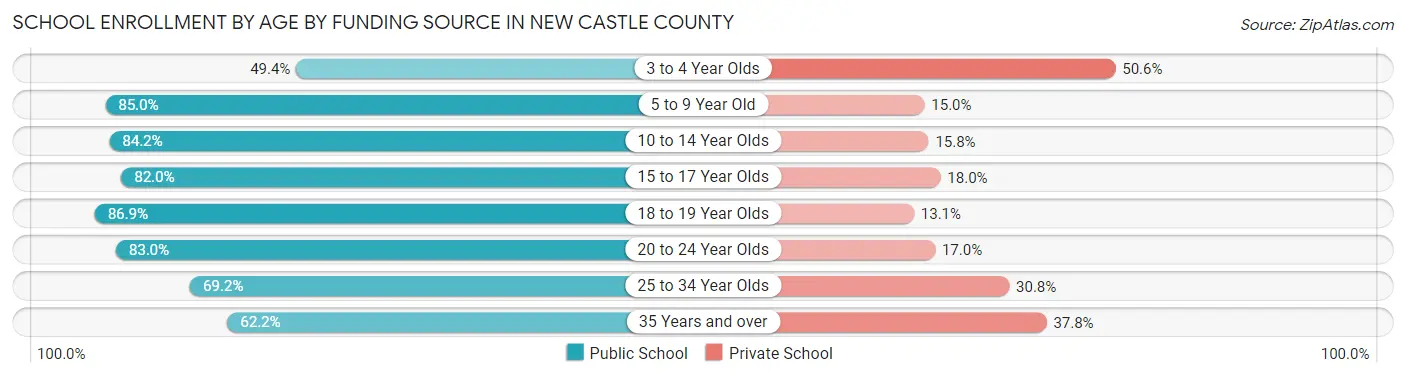
Out of a total of 141,353 students who are enrolled in schools in New Castle County, 28,129 (19.9%) attend a private institution, while the remaining 113,224 (80.1%) are enrolled in public schools. The age group of 3 to 4 year olds has the highest likelihood of being enrolled in private schools, with 3,564 (50.6% in the age bracket) enrolled. Conversely, the age group of 18 to 19 year olds has the lowest likelihood of being enrolled in a private school, with 12,177 (86.9% in the age bracket) attending a public institution.
| Age Bracket | Public School | Private School |
| 3 to 4 Year Olds | 3,481 (49.4%) | 3,564 (50.6%) |
| 5 to 9 Year Old | 25,301 (85.0%) | 4,474 (15.0%) |
| 10 to 14 Year Olds | 29,914 (84.2%) | 5,610 (15.8%) |
| 15 to 17 Year Olds | 17,069 (82.0%) | 3,752 (18.0%) |
| 18 to 19 Year Olds | 12,177 (86.9%) | 1,831 (13.1%) |
| 20 to 24 Year Olds | 13,642 (83.0%) | 2,797 (17.0%) |
| 25 to 34 Year Olds | 6,390 (69.2%) | 2,845 (30.8%) |
| 35 Years and over | 5,293 (62.2%) | 3,213 (37.8%) |
| Total | 113,224 (80.1%) | 28,129 (19.9%) |
Educational Attainment by Field of Study in New Castle County
Business (34,029 | 20.9%), education (17,033 | 10.5%), science & technology (15,346 | 9.4%), engineering (13,267 | 8.2%), and social sciences (11,642 | 7.1%) are the most common fields of study among 162,783 individuals in New Castle County who have obtained a bachelor's degree or higher.
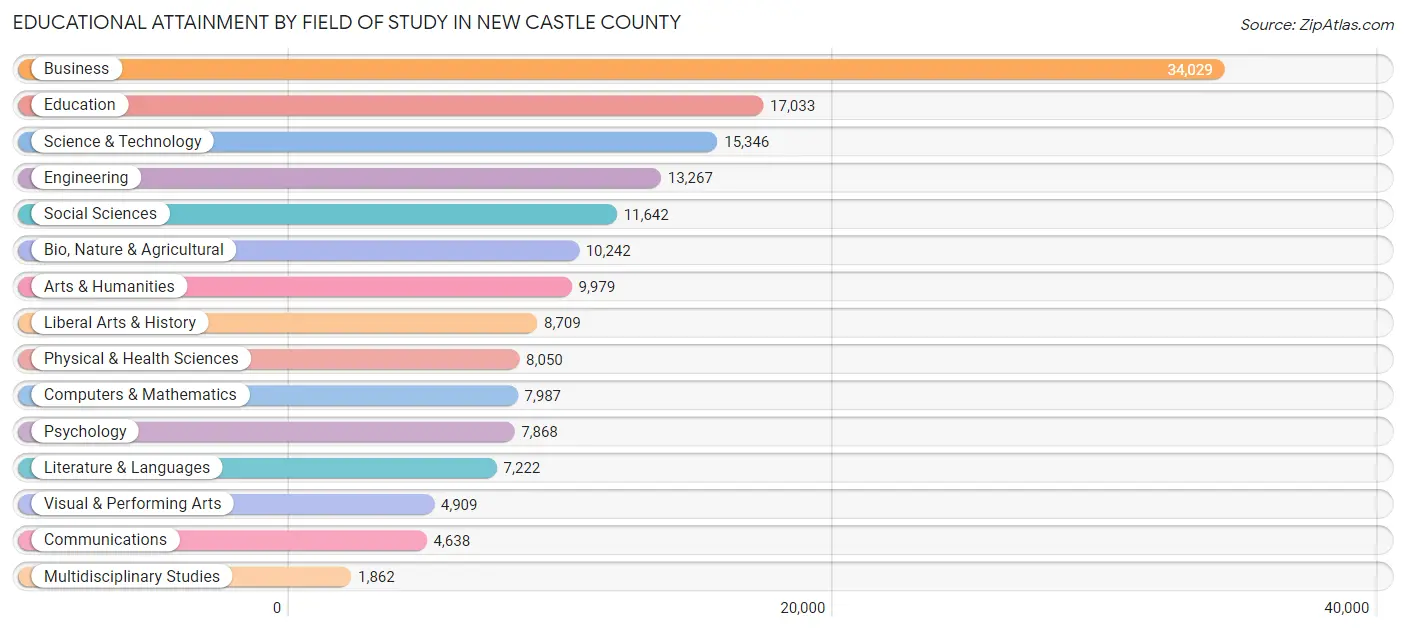
| Field of Study | # Graduates | % Graduates |
| Computers & Mathematics | 7,987 | 4.9% |
| Bio, Nature & Agricultural | 10,242 | 6.3% |
| Physical & Health Sciences | 8,050 | 5.0% |
| Psychology | 7,868 | 4.8% |
| Social Sciences | 11,642 | 7.1% |
| Engineering | 13,267 | 8.2% |
| Multidisciplinary Studies | 1,862 | 1.1% |
| Science & Technology | 15,346 | 9.4% |
| Business | 34,029 | 20.9% |
| Education | 17,033 | 10.5% |
| Literature & Languages | 7,222 | 4.4% |
| Liberal Arts & History | 8,709 | 5.3% |
| Visual & Performing Arts | 4,909 | 3.0% |
| Communications | 4,638 | 2.9% |
| Arts & Humanities | 9,979 | 6.1% |
| Total | 162,783 | 100.0% |
Transportation & Commute in New Castle County
Vehicle Availability by Sex in New Castle County
The most prevalent vehicle ownership categories in New Castle County are males with 2 vehicles (66,710, accounting for 46.3%) and females with 2 vehicles (57,859, making up 48.7%).
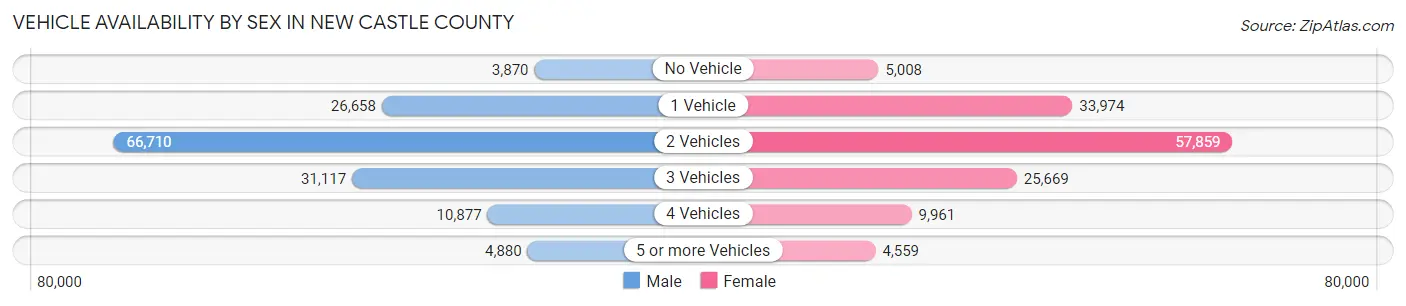
| Vehicles Available | Male | Female |
| No Vehicle | 3,870 (2.7%) | 5,008 (3.6%) |
| 1 Vehicle | 26,658 (18.5%) | 33,974 (24.8%) |
| 2 Vehicles | 66,710 (46.3%) | 57,859 (42.2%) |
| 3 Vehicles | 31,117 (21.6%) | 25,669 (18.7%) |
| 4 Vehicles | 10,877 (7.5%) | 9,961 (7.3%) |
| 5 or more Vehicles | 4,880 (3.4%) | 4,559 (3.3%) |
| Total | 144,112 (100.0%) | 137,030 (100.0%) |
Commute Time in New Castle County
The most frequently occuring commute durations in New Castle County are 15 to 19 minutes (44,413 commuters, 18.1%), 20 to 24 minutes (40,800 commuters, 16.6%), and 10 to 14 minutes (34,125 commuters, 13.9%).
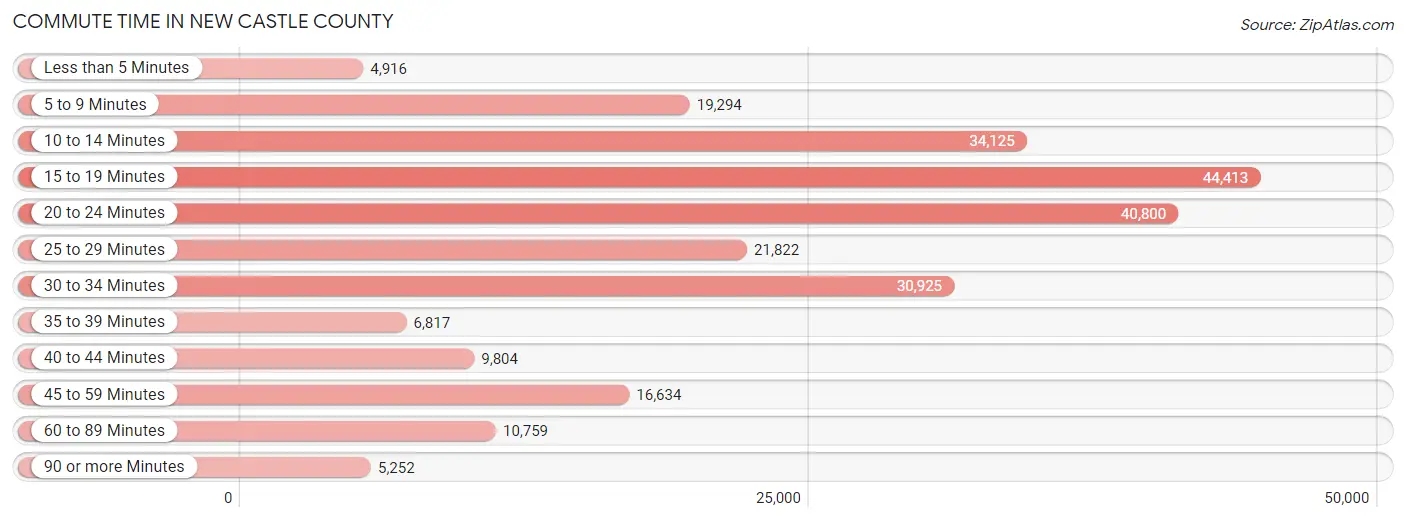
| Commute Time | # Commuters | % Commuters |
| Less than 5 Minutes | 4,916 | 2.0% |
| 5 to 9 Minutes | 19,294 | 7.9% |
| 10 to 14 Minutes | 34,125 | 13.9% |
| 15 to 19 Minutes | 44,413 | 18.1% |
| 20 to 24 Minutes | 40,800 | 16.6% |
| 25 to 29 Minutes | 21,822 | 8.9% |
| 30 to 34 Minutes | 30,925 | 12.6% |
| 35 to 39 Minutes | 6,817 | 2.8% |
| 40 to 44 Minutes | 9,804 | 4.0% |
| 45 to 59 Minutes | 16,634 | 6.8% |
| 60 to 89 Minutes | 10,759 | 4.4% |
| 90 or more Minutes | 5,252 | 2.1% |
Commute Time by Sex in New Castle County
The most common commute times in New Castle County are 15 to 19 minutes (21,880 commuters, 17.2%) for males and 15 to 19 minutes (22,533 commuters, 19.0%) for females.
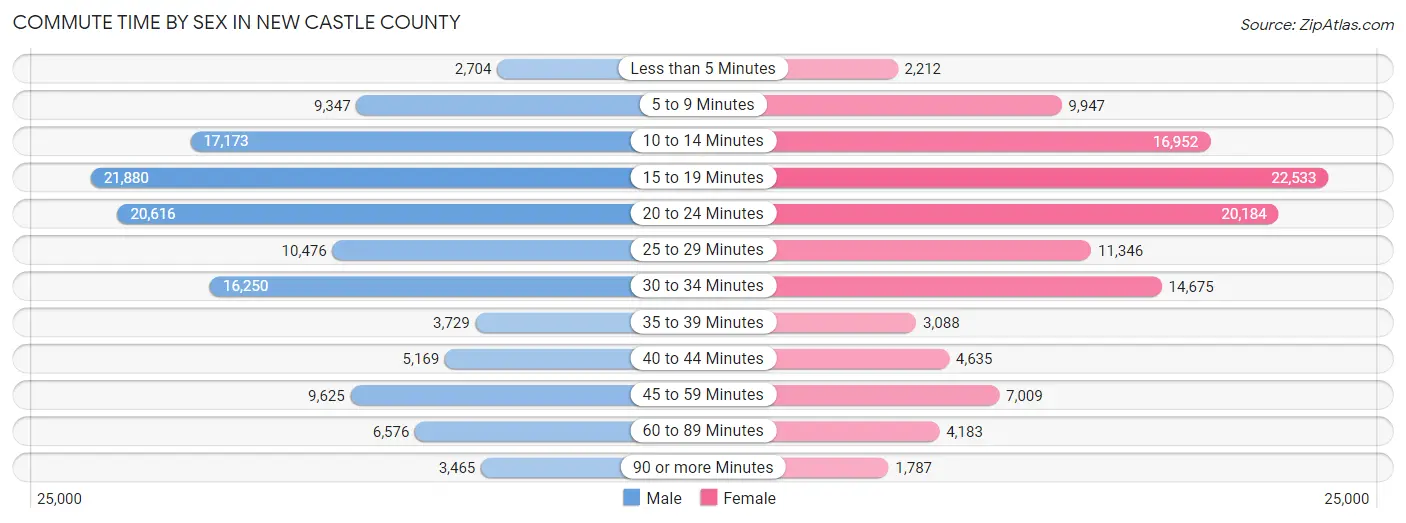
| Commute Time | Male | Female |
| Less than 5 Minutes | 2,704 (2.1%) | 2,212 (1.9%) |
| 5 to 9 Minutes | 9,347 (7.4%) | 9,947 (8.4%) |
| 10 to 14 Minutes | 17,173 (13.5%) | 16,952 (14.3%) |
| 15 to 19 Minutes | 21,880 (17.2%) | 22,533 (19.0%) |
| 20 to 24 Minutes | 20,616 (16.2%) | 20,184 (17.0%) |
| 25 to 29 Minutes | 10,476 (8.3%) | 11,346 (9.6%) |
| 30 to 34 Minutes | 16,250 (12.8%) | 14,675 (12.4%) |
| 35 to 39 Minutes | 3,729 (2.9%) | 3,088 (2.6%) |
| 40 to 44 Minutes | 5,169 (4.1%) | 4,635 (3.9%) |
| 45 to 59 Minutes | 9,625 (7.6%) | 7,009 (5.9%) |
| 60 to 89 Minutes | 6,576 (5.2%) | 4,183 (3.5%) |
| 90 or more Minutes | 3,465 (2.7%) | 1,787 (1.5%) |
Time of Departure to Work by Sex in New Castle County
The most frequent times of departure to work in New Castle County are 7:00 AM to 7:29 AM (18,408, 14.5%) for males and 7:00 AM to 7:29 AM (19,244, 16.2%) for females.
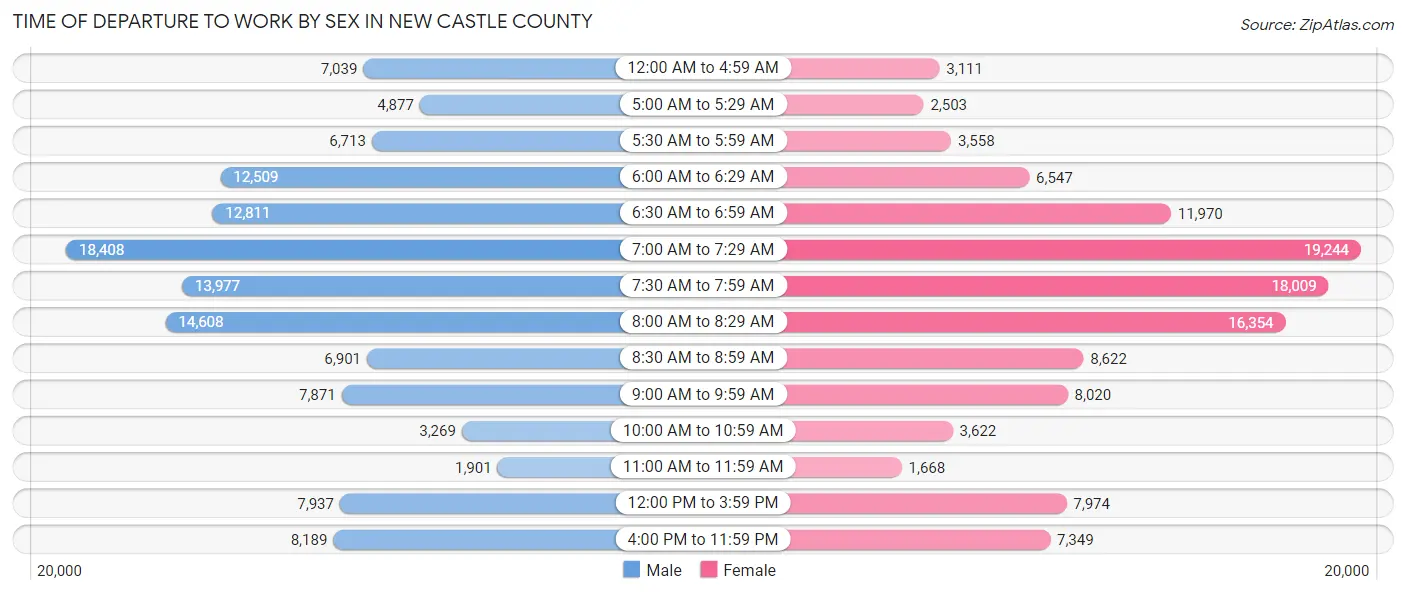
| Time of Departure | Male | Female |
| 12:00 AM to 4:59 AM | 7,039 (5.5%) | 3,111 (2.6%) |
| 5:00 AM to 5:29 AM | 4,877 (3.8%) | 2,503 (2.1%) |
| 5:30 AM to 5:59 AM | 6,713 (5.3%) | 3,558 (3.0%) |
| 6:00 AM to 6:29 AM | 12,509 (9.9%) | 6,547 (5.5%) |
| 6:30 AM to 6:59 AM | 12,811 (10.1%) | 11,970 (10.1%) |
| 7:00 AM to 7:29 AM | 18,408 (14.5%) | 19,244 (16.2%) |
| 7:30 AM to 7:59 AM | 13,977 (11.0%) | 18,009 (15.2%) |
| 8:00 AM to 8:29 AM | 14,608 (11.5%) | 16,354 (13.8%) |
| 8:30 AM to 8:59 AM | 6,901 (5.4%) | 8,622 (7.3%) |
| 9:00 AM to 9:59 AM | 7,871 (6.2%) | 8,020 (6.8%) |
| 10:00 AM to 10:59 AM | 3,269 (2.6%) | 3,622 (3.1%) |
| 11:00 AM to 11:59 AM | 1,901 (1.5%) | 1,668 (1.4%) |
| 12:00 PM to 3:59 PM | 7,937 (6.2%) | 7,974 (6.7%) |
| 4:00 PM to 11:59 PM | 8,189 (6.5%) | 7,349 (6.2%) |
| Total | 127,010 (100.0%) | 118,551 (100.0%) |
Housing Occupancy in New Castle County
Occupancy by Ownership in New Castle County
Of the total 220,437 dwellings in New Castle County, owner-occupied units account for 150,245 (68.2%), while renter-occupied units make up 70,192 (31.8%).
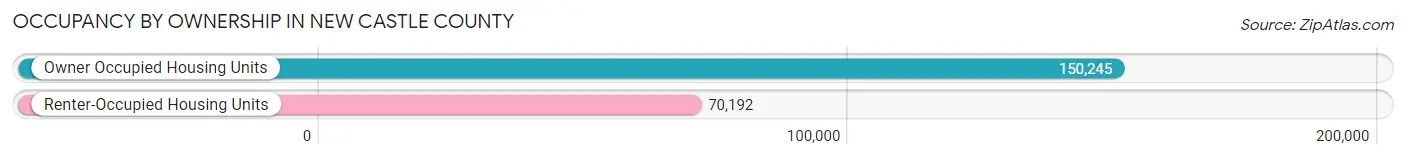
| Occupancy | # Housing Units | % Housing Units |
| Owner Occupied Housing Units | 150,245 | 68.2% |
| Renter-Occupied Housing Units | 70,192 | 31.8% |
| Total Occupied Housing Units | 220,437 | 100.0% |
Occupancy by Household Size in New Castle County
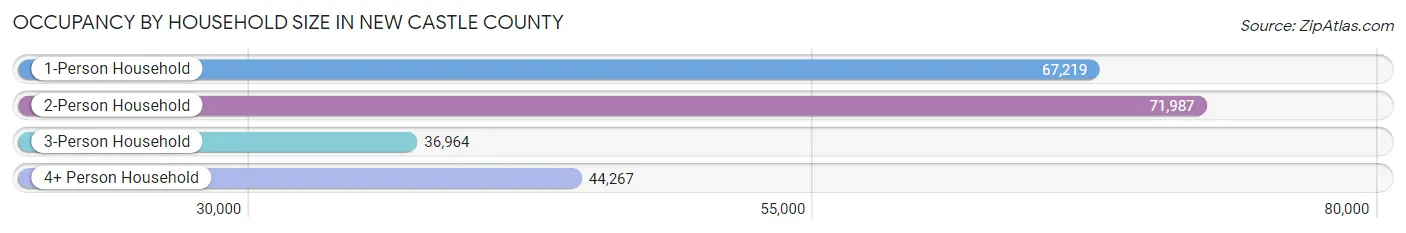
| Household Size | # Housing Units | % Housing Units |
| 1-Person Household | 67,219 | 30.5% |
| 2-Person Household | 71,987 | 32.7% |
| 3-Person Household | 36,964 | 16.8% |
| 4+ Person Household | 44,267 | 20.1% |
| Total Housing Units | 220,437 | 100.0% |
Occupancy by Ownership by Household Size in New Castle County
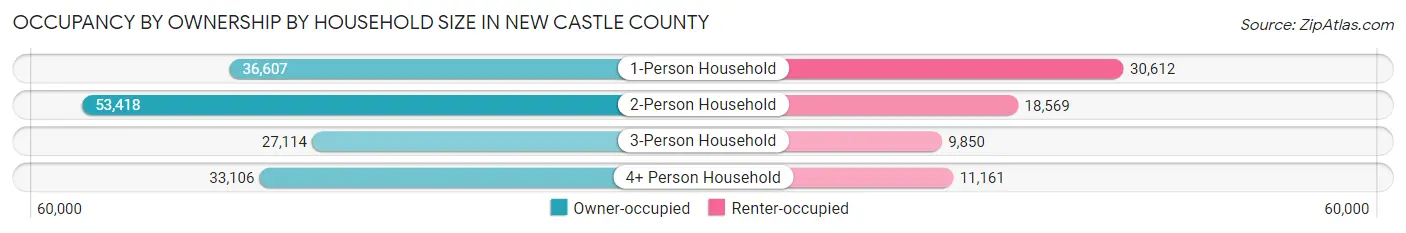
| Household Size | Owner-occupied | Renter-occupied |
| 1-Person Household | 36,607 (54.5%) | 30,612 (45.5%) |
| 2-Person Household | 53,418 (74.2%) | 18,569 (25.8%) |
| 3-Person Household | 27,114 (73.4%) | 9,850 (26.7%) |
| 4+ Person Household | 33,106 (74.8%) | 11,161 (25.2%) |
| Total Housing Units | 150,245 (68.2%) | 70,192 (31.8%) |
Occupancy by Educational Attainment in New Castle County
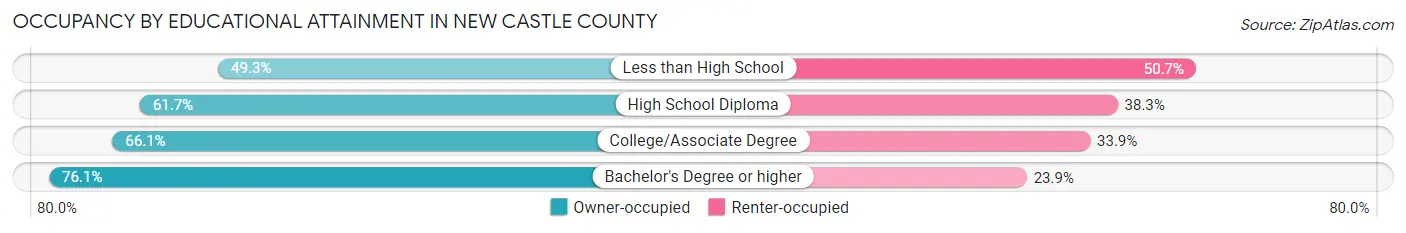
| Household Size | Owner-occupied | Renter-occupied |
| Less than High School | 6,409 (49.3%) | 6,592 (50.7%) |
| High School Diploma | 33,925 (61.7%) | 21,052 (38.3%) |
| College/Associate Degree | 40,363 (66.1%) | 20,726 (33.9%) |
| Bachelor's Degree or higher | 69,548 (76.1%) | 21,822 (23.9%) |
Occupancy by Age of Householder in New Castle County
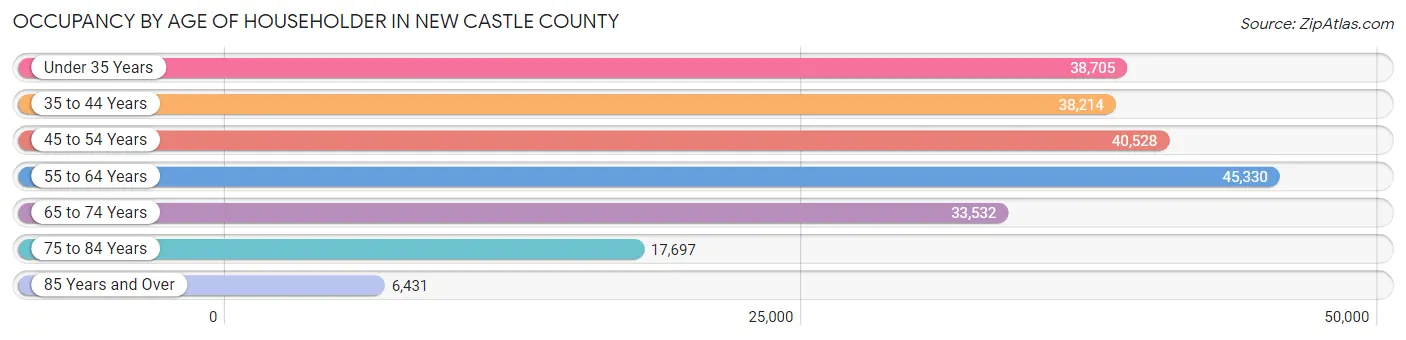
| Age Bracket | # Households | % Households |
| Under 35 Years | 38,705 | 17.6% |
| 35 to 44 Years | 38,214 | 17.3% |
| 45 to 54 Years | 40,528 | 18.4% |
| 55 to 64 Years | 45,330 | 20.6% |
| 65 to 74 Years | 33,532 | 15.2% |
| 75 to 84 Years | 17,697 | 8.0% |
| 85 Years and Over | 6,431 | 2.9% |
| Total | 220,437 | 100.0% |
Housing Finances in New Castle County
Median Income by Occupancy in New Castle County
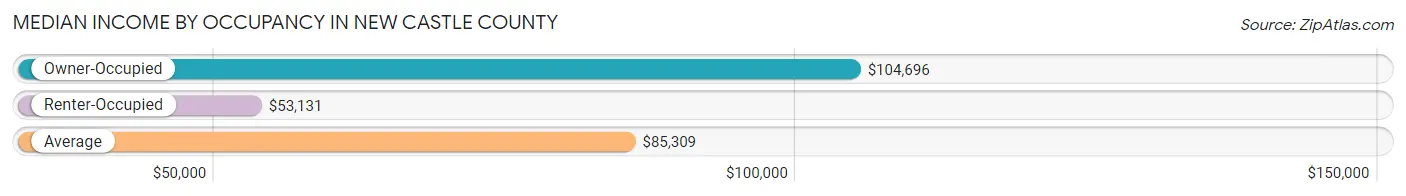
| Occupancy Type | # Households | Median Income |
| Owner-Occupied | 150,245 (68.2%) | $104,696 |
| Renter-Occupied | 70,192 (31.8%) | $53,131 |
| Average | 220,437 (100.0%) | $85,309 |
Occupancy by Householder Income Bracket in New Castle County
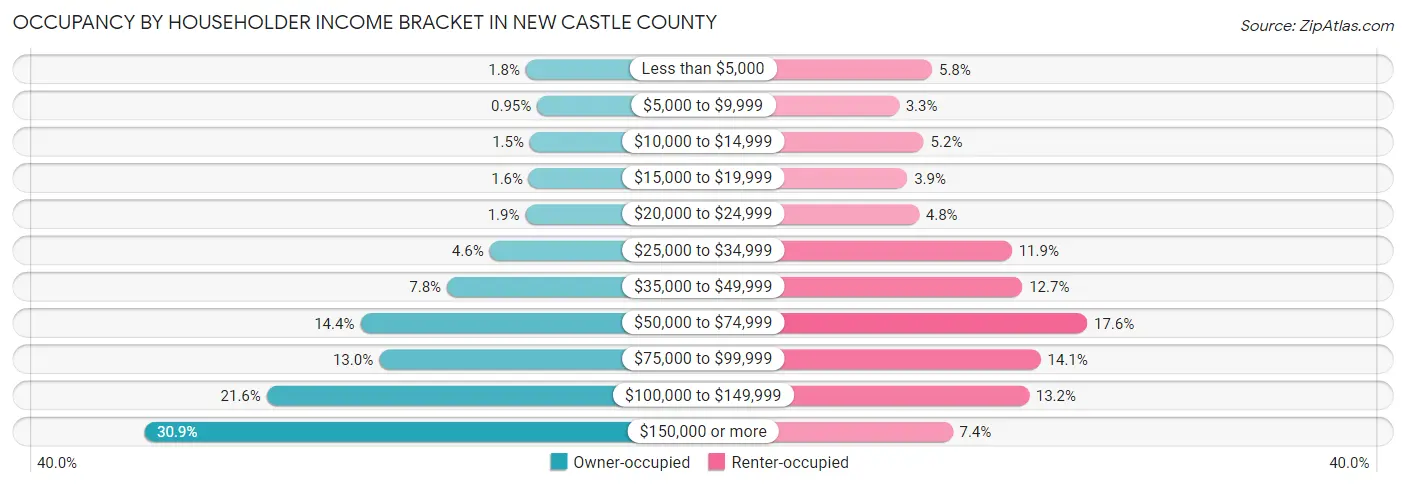
| Income Bracket | Owner-occupied | Renter-occupied |
| Less than $5,000 | 2,724 (1.8%) | 4,093 (5.8%) |
| $5,000 to $9,999 | 1,429 (0.9%) | 2,309 (3.3%) |
| $10,000 to $14,999 | 2,263 (1.5%) | 3,646 (5.2%) |
| $15,000 to $19,999 | 2,371 (1.6%) | 2,764 (3.9%) |
| $20,000 to $24,999 | 2,774 (1.8%) | 3,381 (4.8%) |
| $25,000 to $34,999 | 6,887 (4.6%) | 8,351 (11.9%) |
| $35,000 to $49,999 | 11,754 (7.8%) | 8,917 (12.7%) |
| $50,000 to $74,999 | 21,682 (14.4%) | 12,379 (17.6%) |
| $75,000 to $99,999 | 19,535 (13.0%) | 9,900 (14.1%) |
| $100,000 to $149,999 | 32,394 (21.6%) | 9,262 (13.2%) |
| $150,000 or more | 46,432 (30.9%) | 5,190 (7.4%) |
| Total | 150,245 (100.0%) | 70,192 (100.0%) |
Monthly Housing Cost Tiers in New Castle County
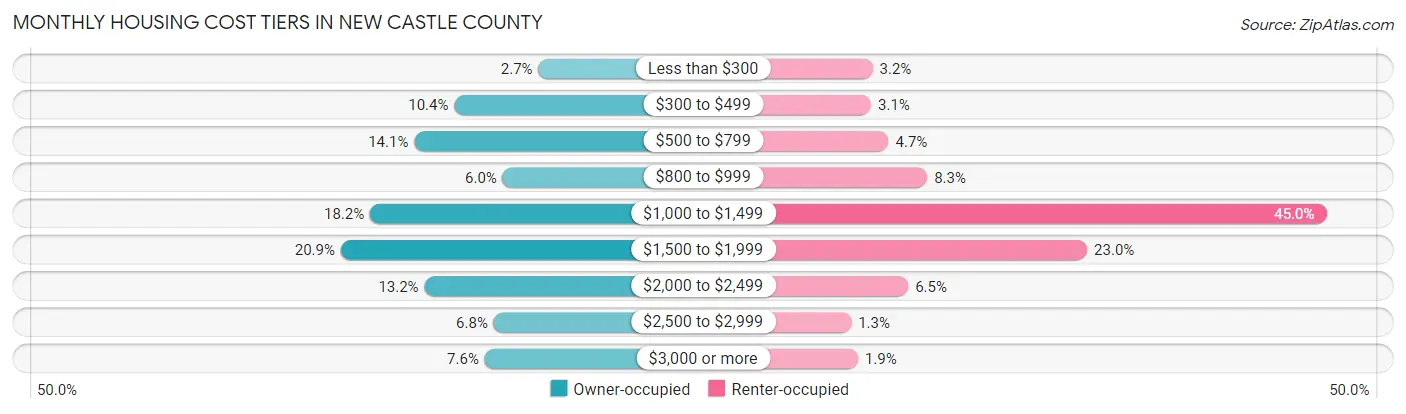
| Monthly Cost | Owner-occupied | Renter-occupied |
| Less than $300 | 4,060 (2.7%) | 2,271 (3.2%) |
| $300 to $499 | 15,683 (10.4%) | 2,177 (3.1%) |
| $500 to $799 | 21,230 (14.1%) | 3,308 (4.7%) |
| $800 to $999 | 9,007 (6.0%) | 5,805 (8.3%) |
| $1,000 to $1,499 | 27,345 (18.2%) | 31,584 (45.0%) |
| $1,500 to $1,999 | 31,383 (20.9%) | 16,139 (23.0%) |
| $2,000 to $2,499 | 19,821 (13.2%) | 4,579 (6.5%) |
| $2,500 to $2,999 | 10,230 (6.8%) | 894 (1.3%) |
| $3,000 or more | 11,486 (7.6%) | 1,327 (1.9%) |
| Total | 150,245 (100.0%) | 70,192 (100.0%) |
Physical Housing Characteristics in New Castle County
Housing Structures in New Castle County
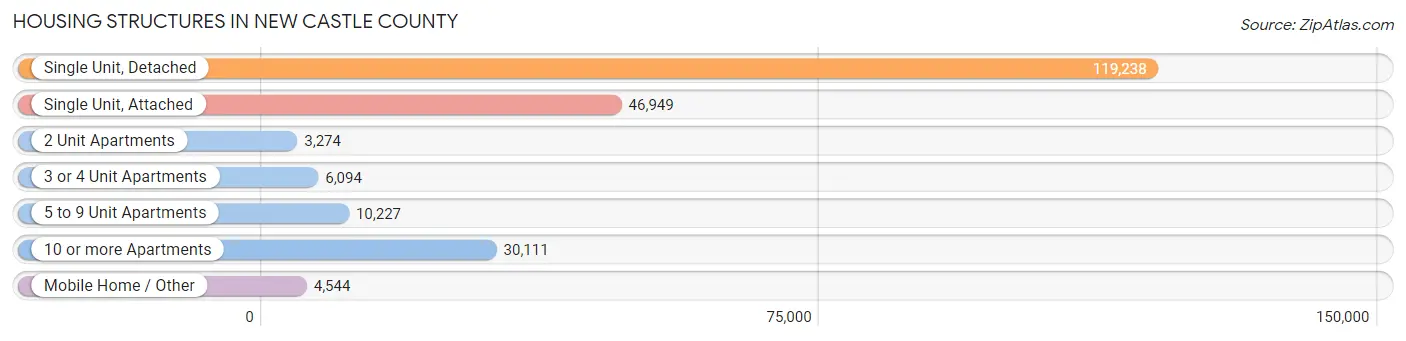
| Structure Type | # Housing Units | % Housing Units |
| Single Unit, Detached | 119,238 | 54.1% |
| Single Unit, Attached | 46,949 | 21.3% |
| 2 Unit Apartments | 3,274 | 1.5% |
| 3 or 4 Unit Apartments | 6,094 | 2.8% |
| 5 to 9 Unit Apartments | 10,227 | 4.6% |
| 10 or more Apartments | 30,111 | 13.7% |
| Mobile Home / Other | 4,544 | 2.1% |
| Total | 220,437 | 100.0% |
Housing Structures by Occupancy in New Castle County
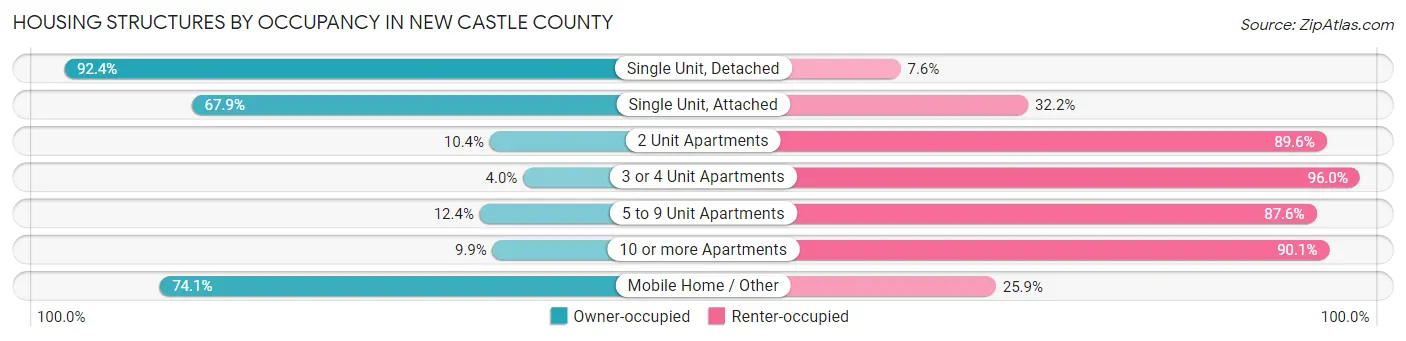
| Structure Type | Owner-occupied | Renter-occupied |
| Single Unit, Detached | 110,195 (92.4%) | 9,043 (7.6%) |
| Single Unit, Attached | 31,857 (67.8%) | 15,092 (32.2%) |
| 2 Unit Apartments | 341 (10.4%) | 2,933 (89.6%) |
| 3 or 4 Unit Apartments | 244 (4.0%) | 5,850 (96.0%) |
| 5 to 9 Unit Apartments | 1,265 (12.4%) | 8,962 (87.6%) |
| 10 or more Apartments | 2,977 (9.9%) | 27,134 (90.1%) |
| Mobile Home / Other | 3,366 (74.1%) | 1,178 (25.9%) |
| Total | 150,245 (68.2%) | 70,192 (31.8%) |
Housing Structures by Number of Rooms in New Castle County
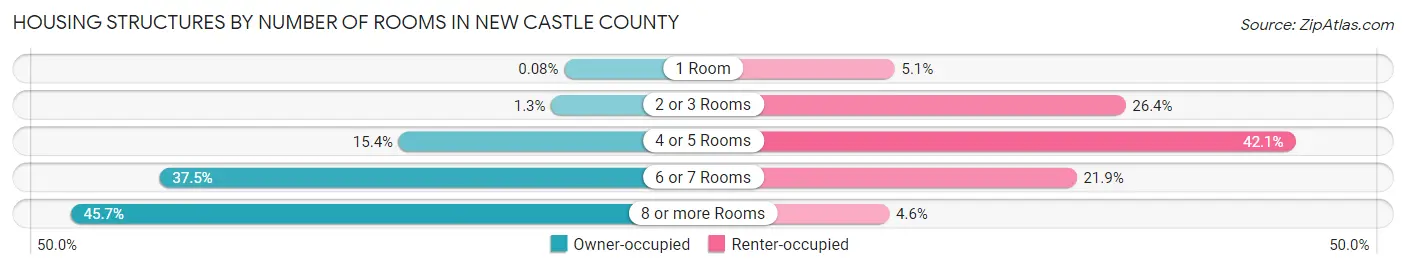
| Number of Rooms | Owner-occupied | Renter-occupied |
| 1 Room | 116 (0.1%) | 3,543 (5.1%) |
| 2 or 3 Rooms | 1,928 (1.3%) | 18,533 (26.4%) |
| 4 or 5 Rooms | 23,103 (15.4%) | 29,561 (42.1%) |
| 6 or 7 Rooms | 56,380 (37.5%) | 15,360 (21.9%) |
| 8 or more Rooms | 68,718 (45.7%) | 3,195 (4.5%) |
| Total | 150,245 (100.0%) | 70,192 (100.0%) |
Housing Structure by Heating Type in New Castle County
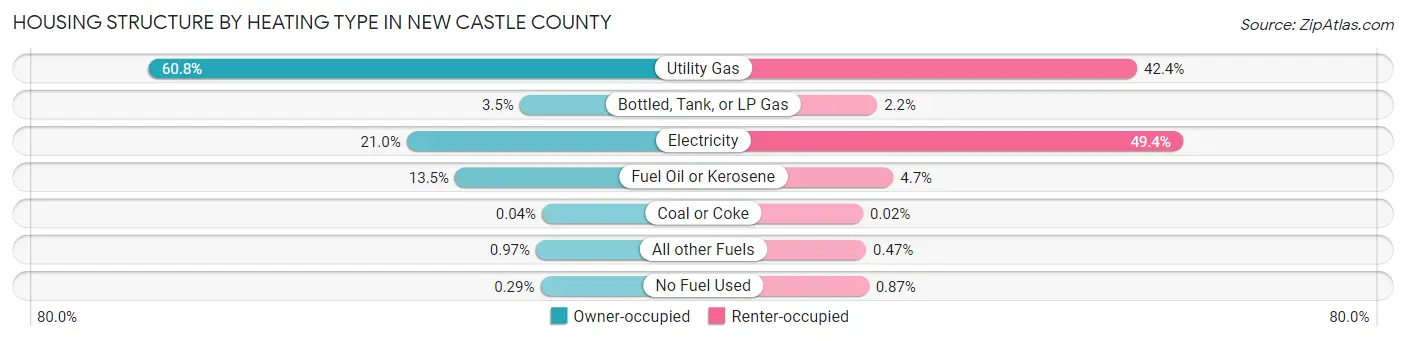
| Heating Type | Owner-occupied | Renter-occupied |
| Utility Gas | 91,326 (60.8%) | 29,743 (42.4%) |
| Bottled, Tank, or LP Gas | 5,216 (3.5%) | 1,535 (2.2%) |
| Electricity | 31,478 (20.9%) | 34,680 (49.4%) |
| Fuel Oil or Kerosene | 20,275 (13.5%) | 3,285 (4.7%) |
| Coal or Coke | 56 (0.0%) | 12 (0.0%) |
| All other Fuels | 1,453 (1.0%) | 327 (0.5%) |
| No Fuel Used | 441 (0.3%) | 610 (0.9%) |
| Total | 150,245 (100.0%) | 70,192 (100.0%) |
Household Vehicle Usage in New Castle County
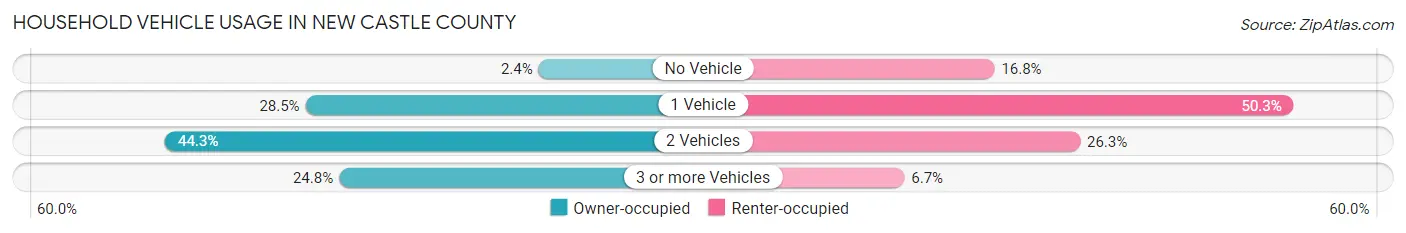
| Vehicles per Household | Owner-occupied | Renter-occupied |
| No Vehicle | 3,651 (2.4%) | 11,759 (16.8%) |
| 1 Vehicle | 42,875 (28.5%) | 35,270 (50.2%) |
| 2 Vehicles | 66,495 (44.3%) | 18,486 (26.3%) |
| 3 or more Vehicles | 37,224 (24.8%) | 4,677 (6.7%) |
| Total | 150,245 (100.0%) | 70,192 (100.0%) |
Real Estate & Mortgages in New Castle County
Real Estate and Mortgage Overview in New Castle County
| Characteristic | Without Mortgage | With Mortgage |
| Housing Units | 47,510 | 102,735 |
| Median Property Value | $298,800 | $317,300 |
| Median Household Income | $79,812 | $36,393 |
| Monthly Housing Costs | $559 | $11,356 |
| Real Estate Taxes | $2,222 | $2,720 |
Property Value by Mortgage Status in New Castle County
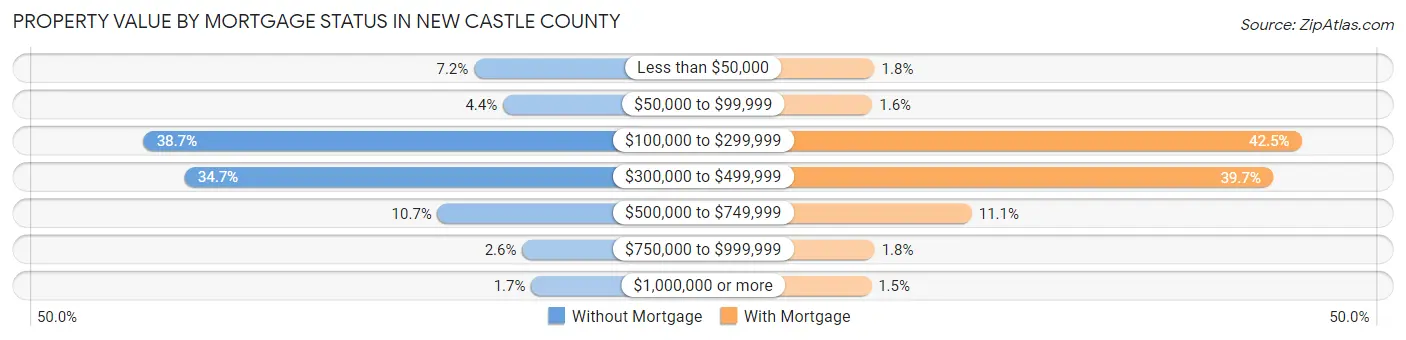
| Property Value | Without Mortgage | With Mortgage |
| Less than $50,000 | 3,414 (7.2%) | 1,874 (1.8%) |
| $50,000 to $99,999 | 2,105 (4.4%) | 1,644 (1.6%) |
| $100,000 to $299,999 | 18,364 (38.7%) | 43,622 (42.5%) |
| $300,000 to $499,999 | 16,499 (34.7%) | 40,819 (39.7%) |
| $500,000 to $749,999 | 5,066 (10.7%) | 11,372 (11.1%) |
| $750,000 to $999,999 | 1,237 (2.6%) | 1,877 (1.8%) |
| $1,000,000 or more | 825 (1.7%) | 1,527 (1.5%) |
| Total | 47,510 (100.0%) | 102,735 (100.0%) |
Household Income by Mortgage Status in New Castle County
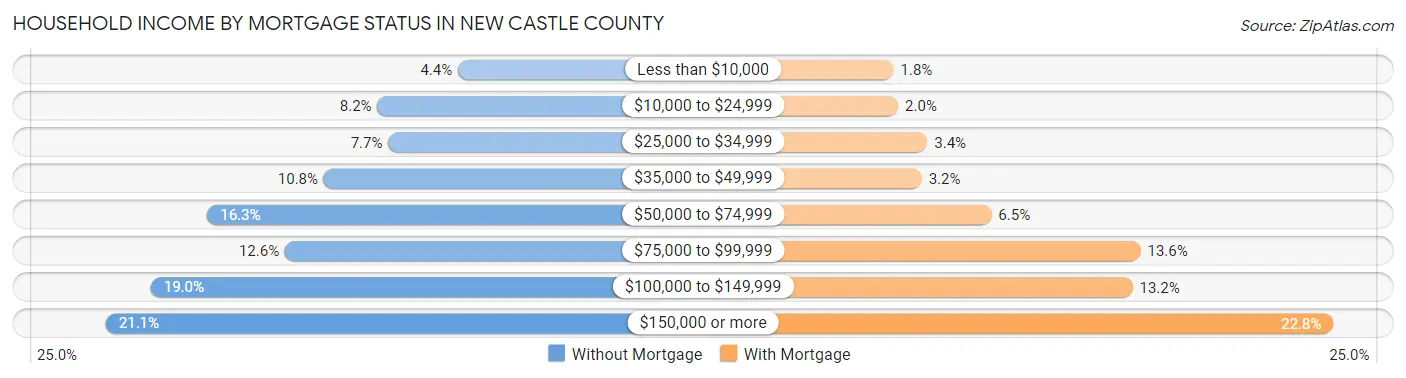
| Household Income | Without Mortgage | With Mortgage |
| Less than $10,000 | 2,070 (4.4%) | 1,859 (1.8%) |
| $10,000 to $24,999 | 3,894 (8.2%) | 2,083 (2.0%) |
| $25,000 to $34,999 | 3,647 (7.7%) | 3,514 (3.4%) |
| $35,000 to $49,999 | 5,107 (10.7%) | 3,240 (3.2%) |
| $50,000 to $74,999 | 7,745 (16.3%) | 6,647 (6.5%) |
| $75,000 to $99,999 | 5,986 (12.6%) | 13,937 (13.6%) |
| $100,000 to $149,999 | 9,022 (19.0%) | 13,549 (13.2%) |
| $150,000 or more | 10,039 (21.1%) | 23,372 (22.8%) |
| Total | 47,510 (100.0%) | 102,735 (100.0%) |
Property Value to Household Income Ratio in New Castle County
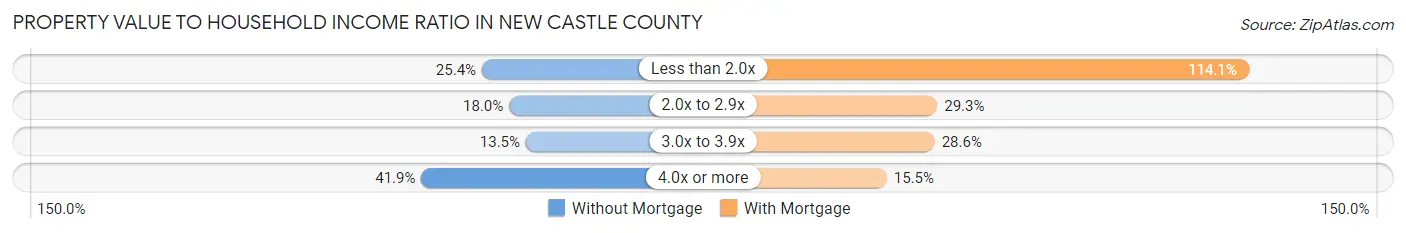
| Value-to-Income Ratio | Without Mortgage | With Mortgage |
| Less than 2.0x | 12,075 (25.4%) | 117,205 (114.1%) |
| 2.0x to 2.9x | 8,557 (18.0%) | 30,065 (29.3%) |
| 3.0x to 3.9x | 6,390 (13.5%) | 29,345 (28.6%) |
| 4.0x or more | 19,920 (41.9%) | 15,930 (15.5%) |
| Total | 47,510 (100.0%) | 102,735 (100.0%) |
Real Estate Taxes by Mortgage Status in New Castle County
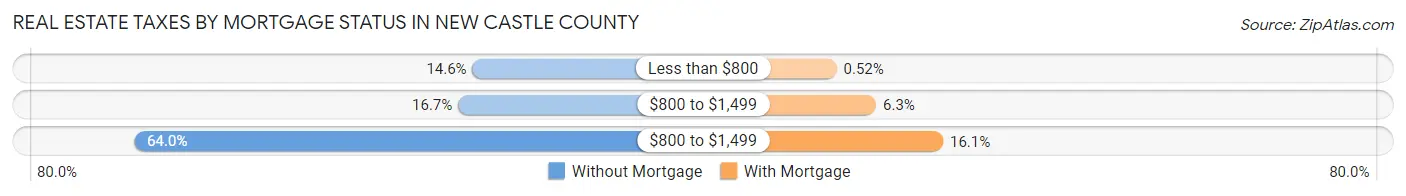
| Property Taxes | Without Mortgage | With Mortgage |
| Less than $800 | 6,917 (14.6%) | 537 (0.5%) |
| $800 to $1,499 | 7,914 (16.7%) | 6,466 (6.3%) |
| $800 to $1,499 | 30,412 (64.0%) | 16,505 (16.1%) |
| Total | 47,510 (100.0%) | 102,735 (100.0%) |
Health & Disability in New Castle County
Health Insurance Coverage by Age in New Castle County
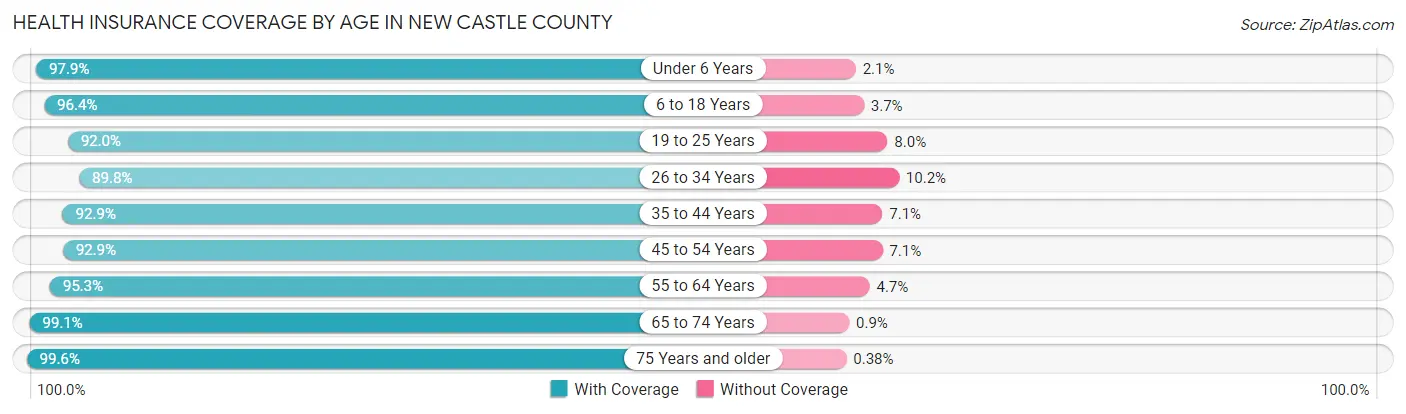
| Age Bracket | With Coverage | Without Coverage |
| Under 6 Years | 36,975 (97.9%) | 805 (2.1%) |
| 6 to 18 Years | 89,208 (96.4%) | 3,376 (3.6%) |
| 19 to 25 Years | 46,797 (92.0%) | 4,093 (8.0%) |
| 26 to 34 Years | 64,327 (89.8%) | 7,293 (10.2%) |
| 35 to 44 Years | 66,456 (92.9%) | 5,074 (7.1%) |
| 45 to 54 Years | 66,395 (92.9%) | 5,088 (7.1%) |
| 55 to 64 Years | 72,945 (95.3%) | 3,608 (4.7%) |
| 65 to 74 Years | 53,641 (99.1%) | 487 (0.9%) |
| 75 Years and older | 36,274 (99.6%) | 137 (0.4%) |
| Total | 533,018 (94.7%) | 29,961 (5.3%) |
Health Insurance Coverage by Citizenship Status in New Castle County
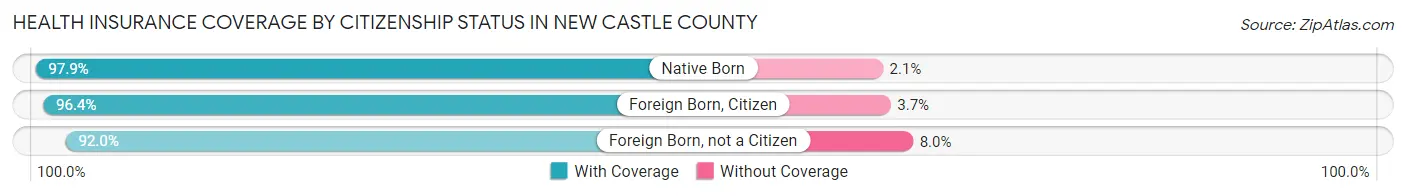
| Citizenship Status | With Coverage | Without Coverage |
| Native Born | 36,975 (97.9%) | 805 (2.1%) |
| Foreign Born, Citizen | 89,208 (96.4%) | 3,376 (3.6%) |
| Foreign Born, not a Citizen | 46,797 (92.0%) | 4,093 (8.0%) |
Health Insurance Coverage by Household Income in New Castle County
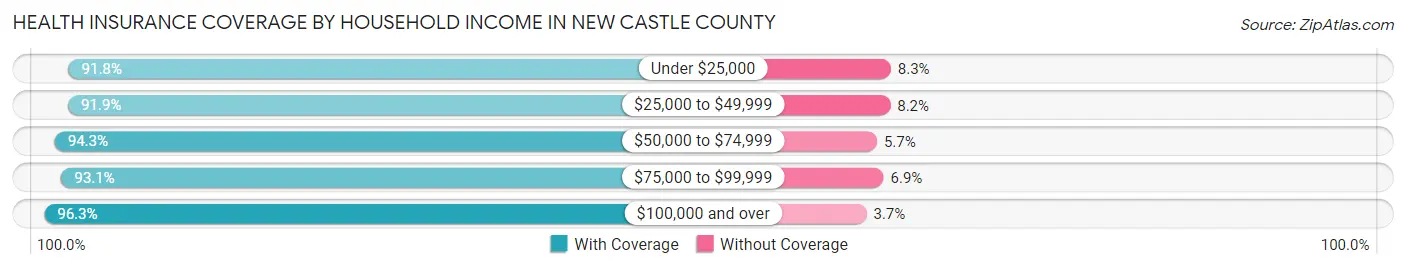
| Household Income | With Coverage | Without Coverage |
| Under $25,000 | 44,742 (91.7%) | 4,021 (8.3%) |
| $25,000 to $49,999 | 64,744 (91.8%) | 5,748 (8.2%) |
| $50,000 to $74,999 | 70,839 (94.3%) | 4,250 (5.7%) |
| $75,000 to $99,999 | 69,079 (93.1%) | 5,123 (6.9%) |
| $100,000 and over | 274,772 (96.3%) | 10,544 (3.7%) |
Public vs Private Health Insurance Coverage by Age in New Castle County
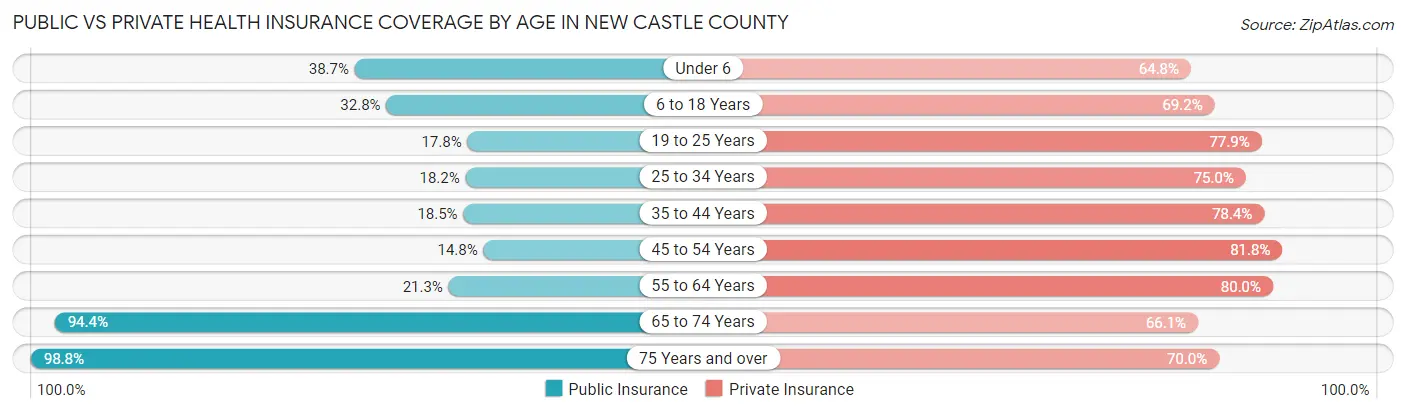
| Age Bracket | Public Insurance | Private Insurance |
| Under 6 | 14,625 (38.7%) | 24,478 (64.8%) |
| 6 to 18 Years | 30,405 (32.8%) | 64,041 (69.2%) |
| 19 to 25 Years | 9,052 (17.8%) | 39,651 (77.9%) |
| 25 to 34 Years | 13,008 (18.2%) | 53,690 (75.0%) |
| 35 to 44 Years | 13,261 (18.5%) | 56,079 (78.4%) |
| 45 to 54 Years | 10,585 (14.8%) | 58,436 (81.8%) |
| 55 to 64 Years | 16,289 (21.3%) | 61,240 (80.0%) |
| 65 to 74 Years | 51,097 (94.4%) | 35,776 (66.1%) |
| 75 Years and over | 35,990 (98.8%) | 25,495 (70.0%) |
| Total | 194,312 (34.5%) | 418,886 (74.4%) |
Disability Status by Sex by Age in New Castle County
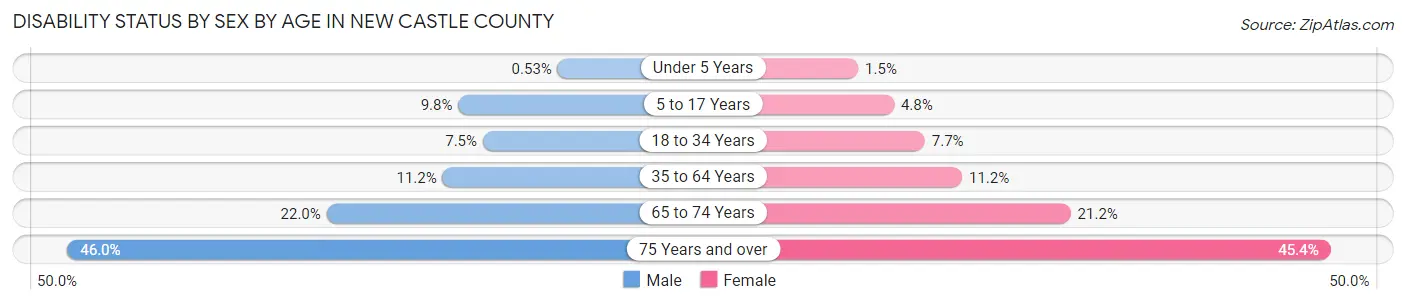
| Age Bracket | Male | Female |
| Under 5 Years | 85 (0.5%) | 236 (1.5%) |
| 5 to 17 Years | 4,430 (9.8%) | 2,149 (4.8%) |
| 18 to 34 Years | 4,836 (7.5%) | 5,148 (7.7%) |
| 35 to 64 Years | 11,905 (11.2%) | 12,654 (11.2%) |
| 65 to 74 Years | 5,477 (22.0%) | 6,201 (21.2%) |
| 75 Years and over | 6,884 (46.0%) | 9,729 (45.4%) |
Disability Class by Sex by Age in New Castle County
Disability Class: Hearing Difficulty
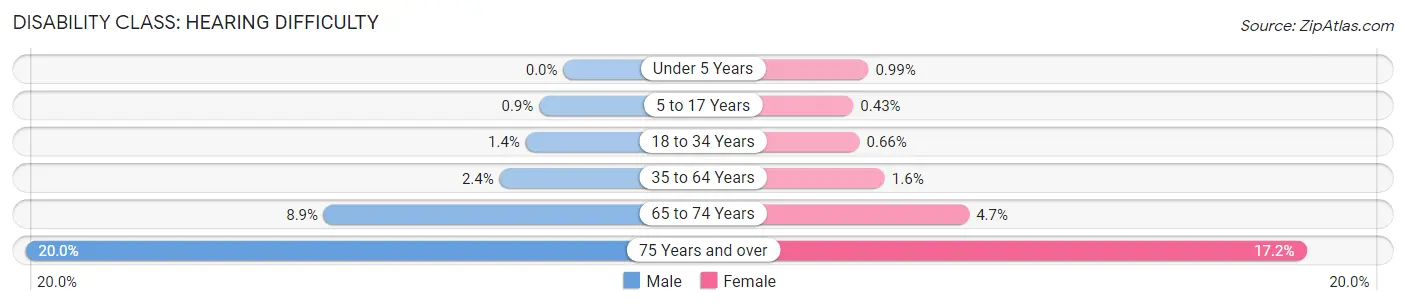
| Age Bracket | Male | Female |
| Under 5 Years | 0 (0.0%) | 154 (1.0%) |
| 5 to 17 Years | 409 (0.9%) | 189 (0.4%) |
| 18 to 34 Years | 906 (1.4%) | 443 (0.7%) |
| 35 to 64 Years | 2,519 (2.4%) | 1,812 (1.6%) |
| 65 to 74 Years | 2,216 (8.9%) | 1,380 (4.7%) |
| 75 Years and over | 2,986 (20.0%) | 3,699 (17.2%) |
Disability Class: Vision Difficulty
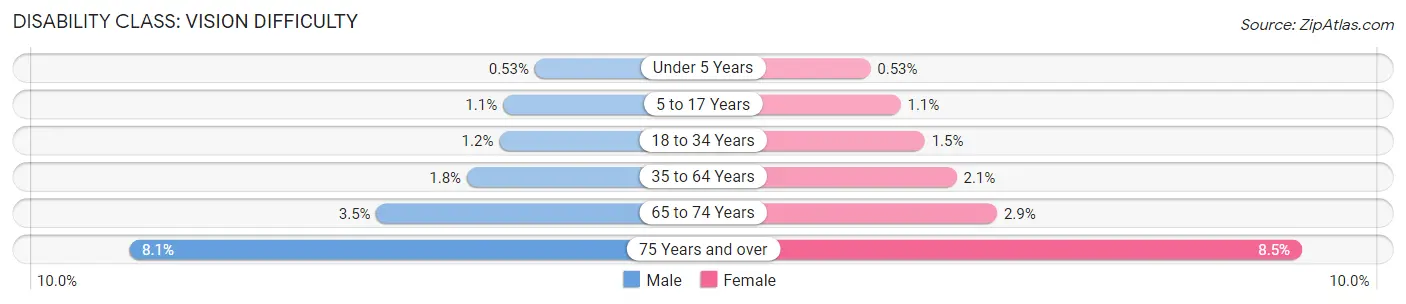
| Age Bracket | Male | Female |
| Under 5 Years | 85 (0.5%) | 82 (0.5%) |
| 5 to 17 Years | 510 (1.1%) | 483 (1.1%) |
| 18 to 34 Years | 773 (1.2%) | 1,029 (1.5%) |
| 35 to 64 Years | 1,896 (1.8%) | 2,416 (2.1%) |
| 65 to 74 Years | 864 (3.5%) | 841 (2.9%) |
| 75 Years and over | 1,206 (8.1%) | 1,832 (8.5%) |
Disability Class: Cognitive Difficulty
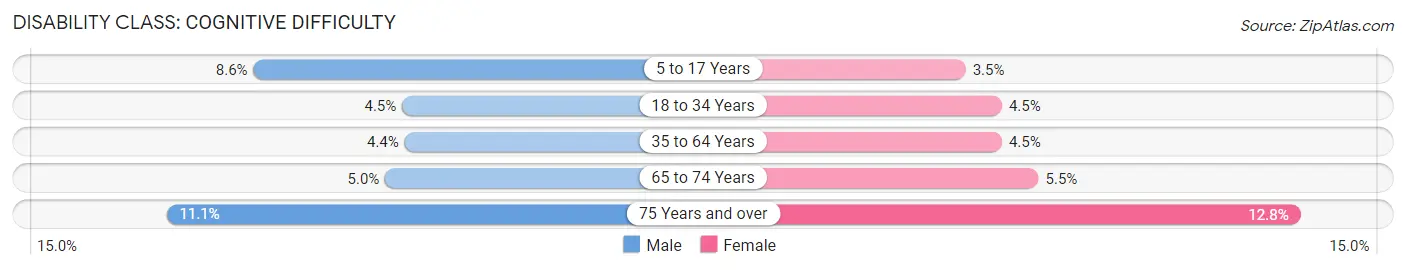
| Age Bracket | Male | Female |
| 5 to 17 Years | 3,920 (8.6%) | 1,531 (3.5%) |
| 18 to 34 Years | 2,908 (4.5%) | 2,977 (4.5%) |
| 35 to 64 Years | 4,696 (4.4%) | 5,053 (4.5%) |
| 65 to 74 Years | 1,237 (5.0%) | 1,600 (5.5%) |
| 75 Years and over | 1,652 (11.1%) | 2,740 (12.8%) |
Disability Class: Ambulatory Difficulty
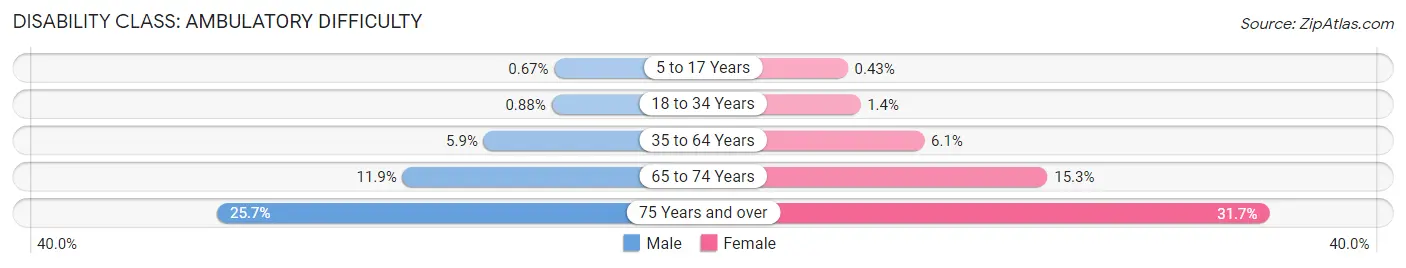
| Age Bracket | Male | Female |
| 5 to 17 Years | 304 (0.7%) | 190 (0.4%) |
| 18 to 34 Years | 567 (0.9%) | 913 (1.4%) |
| 35 to 64 Years | 6,281 (5.9%) | 6,929 (6.1%) |
| 65 to 74 Years | 2,976 (11.9%) | 4,457 (15.3%) |
| 75 Years and over | 3,845 (25.7%) | 6,809 (31.7%) |
Disability Class: Self-Care Difficulty
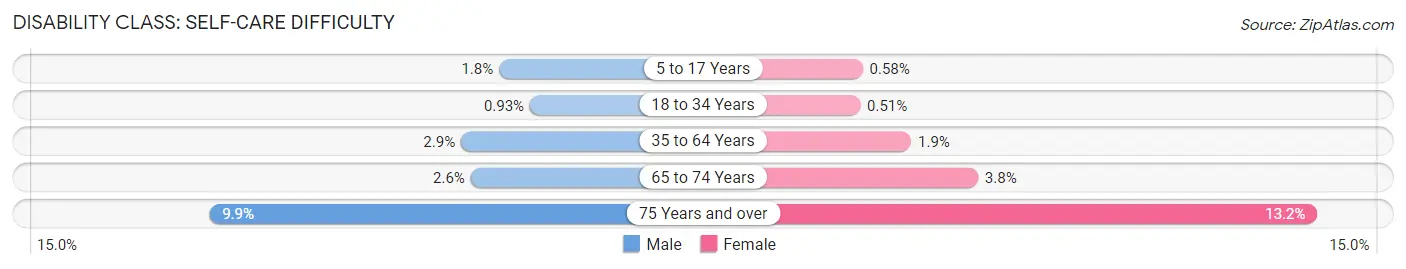
| Age Bracket | Male | Female |
| 5 to 17 Years | 814 (1.8%) | 258 (0.6%) |
| 18 to 34 Years | 601 (0.9%) | 342 (0.5%) |
| 35 to 64 Years | 3,027 (2.9%) | 2,183 (1.9%) |
| 65 to 74 Years | 643 (2.6%) | 1,106 (3.8%) |
| 75 Years and over | 1,475 (9.9%) | 2,840 (13.2%) |
Technology Access in New Castle County
Computing Device Access in New Castle County
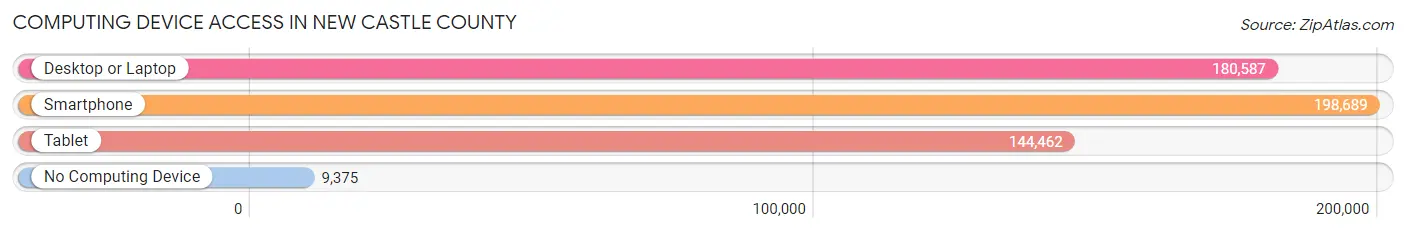
| Device Type | # Households | % Households |
| Desktop or Laptop | 180,587 | 81.9% |
| Smartphone | 198,689 | 90.1% |
| Tablet | 144,462 | 65.5% |
| No Computing Device | 9,375 | 4.3% |
| Total | 220,437 | 100.0% |
Internet Access in New Castle County
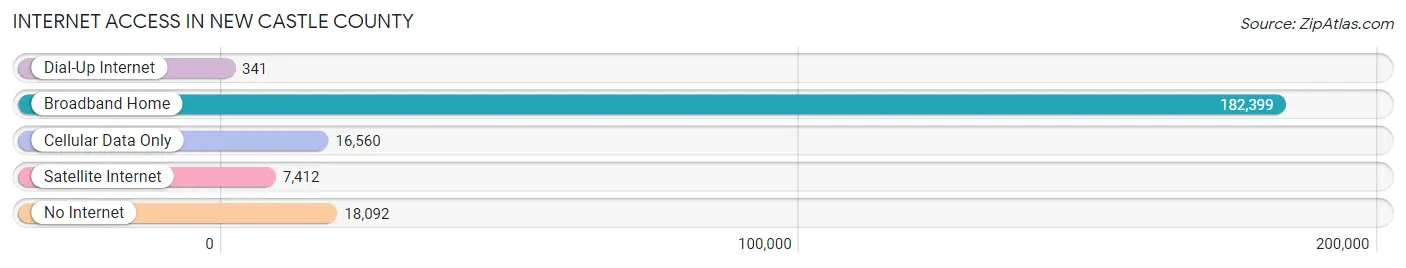
| Internet Type | # Households | % Households |
| Dial-Up Internet | 341 | 0.2% |
| Broadband Home | 182,399 | 82.7% |
| Cellular Data Only | 16,560 | 7.5% |
| Satellite Internet | 7,412 | 3.4% |
| No Internet | 18,092 | 8.2% |
| Total | 220,437 | 100.0% |
New Castle County Summary
New Castle County, Delaware is the most populous county in the state of Delaware and is located in the northern part of the state. It is bordered by Pennsylvania to the north, the Delaware River to the east, and the Chesapeake Bay to the south. The county seat is Wilmington, the largest city in the state.
History
New Castle County was established in 1673, when the Duke of York granted the area to William Penn. The county was named after the city of Newcastle upon Tyne in England. The county was originally part of the Pennsylvania Colony, but was transferred to the Colony of Delaware in 1704.
During the American Revolution, New Castle County was a major center of activity. The county was home to several important battles, including the Battle of Cooch's Bridge, which was the first battle of the war to be fought in the state of Delaware.
In the 19th century, New Castle County was an important center of industry and commerce. The county was home to several major industries, including shipbuilding, iron and steel production, and textiles. The county was also home to several important transportation routes, including the Delaware and Chesapeake Canal, which connected the Delaware River to the Chesapeake Bay.
Geography
New Castle County covers an area of 491 square miles and is located in the northern part of the state of Delaware. The county is bordered by Pennsylvania to the north, the Delaware River to the east, and the Chesapeake Bay to the south. The county is divided into three distinct regions: the Piedmont region in the north, the Coastal Plain in the south, and the Atlantic Coastal Plain in the east.
The Piedmont region is characterized by rolling hills and valleys, while the Coastal Plain is flat and marshy. The Atlantic Coastal Plain is home to several rivers, including the Christina River, the Brandywine River, and the Delaware River.
Economy
New Castle County is an important center of industry and commerce in the state of Delaware. The county is home to several major industries, including chemical production, pharmaceuticals, financial services, and tourism. The county is also home to several major transportation routes, including the Delaware and Chesapeake Canal, which connects the Delaware River to the Chesapeake Bay.
The county is home to several major employers, including DuPont, AstraZeneca, JPMorgan Chase, and Bank of America. The county is also home to several major universities, including the University of Delaware, Delaware State University, and Wilmington University.
Demographics
As of the 2010 census, New Castle County had a population of 538,479. The population is racially diverse, with the largest racial group being White (63.3%), followed by African American (21.2%), Hispanic or Latino (7.7%), and Asian (4.2%). The median household income in the county is $60,811, and the median age is 38.7 years.
New Castle County is home to several major cities, including Wilmington, the largest city in the state. Other major cities in the county include Newark, Bear, and Middletown. The county is also home to several smaller towns and villages, including Claymont, Elsmere, and Hockessin.
Common Questions
What is the Total Population of New Castle County?
Total Population of New Castle County is 570,567.
What is the Total Male Population of New Castle County?
Total Male Population of New Castle County is 277,558.
What is the Total Female Population of New Castle County?
Total Female Population of New Castle County is 293,009.
What is the Ratio of Males per 100 Females in New Castle County?
There are 94.73 Males per 100 Females in New Castle County.
What is the Ratio of Females per 100 Males in New Castle County?
There are 105.57 Females per 100 Males in New Castle County.
What is the Median Population Age in New Castle County?
Median Population Age in New Castle County is 39.0 Years.
What is the Average Family Size in New Castle County
Average Family Size in New Castle County is 3.2 People.
What is the Average Household Size in New Castle County
Average Household Size in New Castle County is 2.5 People.
What is Per Capita Income in New Castle County?
Per Capita income in New Castle County is $44,725.
What is the Median Family Income in New Castle County?
Median Family Income in New Castle County is $107,671.
What is the Median Household income in New Castle County?
Median Household Income in New Castle County is $85,309.
What is Income or Wage Gap in New Castle County?
Income or Wage Gap in New Castle County is 24.8%.
Women in New Castle County earn 75.2 cents for every dollar earned by a man.
What is Family Income Deficit in New Castle County?
Family Income Deficit in New Castle County is $11,343.
Families that are below poverty line in New Castle County earn $11,343 less on average than the poverty threshold level.
What is Inequality or Gini Index in New Castle County?
Inequality or Gini Index in New Castle County is 0.45.
How Large is the Labor Force in New Castle County?
There are 306,614 People in the Labor Forcein in New Castle County.
What is the Percentage of People in the Labor Force in New Castle County?
66.1% of People are in the Labor Force in New Castle County.
What is the Unemployment Rate in New Castle County?
Unemployment Rate in New Castle County is 5.4%.