Kent County, DE
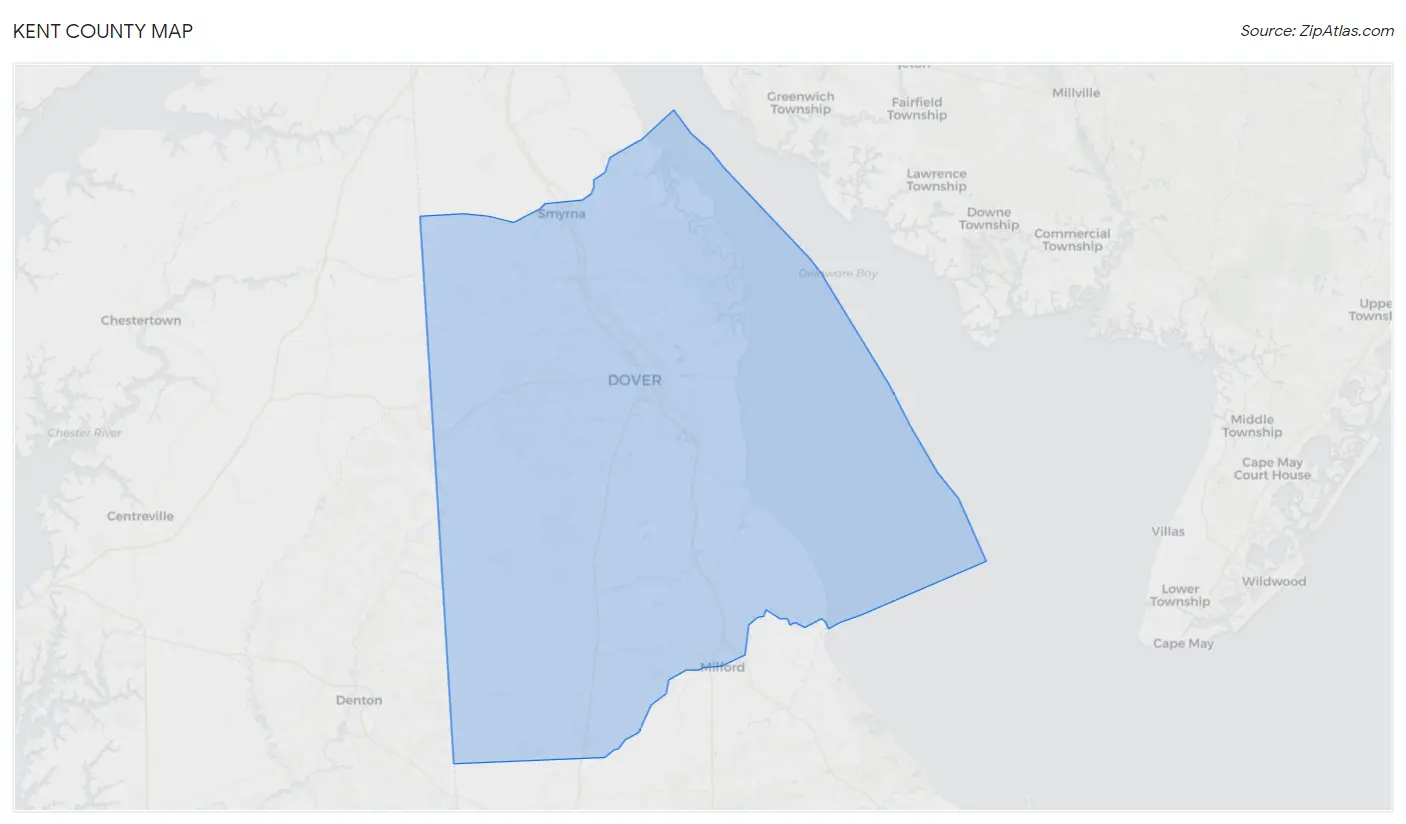
Kent County Map
Kent County Overview
182,400
TOTAL POPULATION
88,272
MALE POPULATION
94,128
FEMALE POPULATION
93.78
MALES / 100 FEMALES
106.63
FEMALES / 100 MALES
38.5
MEDIAN AGE
3.1
AVG FAMILY SIZE
2.6
AVG HOUSEHOLD SIZE
$33,191
PER CAPITA INCOME
$82,307
AVG FAMILY INCOME
$69,278
AVG HOUSEHOLD INCOME
24.4%
WAGE / INCOME GAP [ % ]
75.6¢/ $1
WAGE / INCOME GAP [ $ ]
$10,196
FAMILY INCOME DEFICIT
0.41
INEQUALITY / GINI INDEX
89,585
LABOR FORCE [ PEOPLE ]
61.6%
PERCENT IN LABOR FORCE
6.0%
UNEMPLOYMENT RATE
Kent County Area Codes
Race in Kent County
The most populous races in Kent County are White / Caucasian (112,081 | 61.5%), Black / African American (47,504 | 26.0%), and Two or more Races (14,348 | 7.9%).
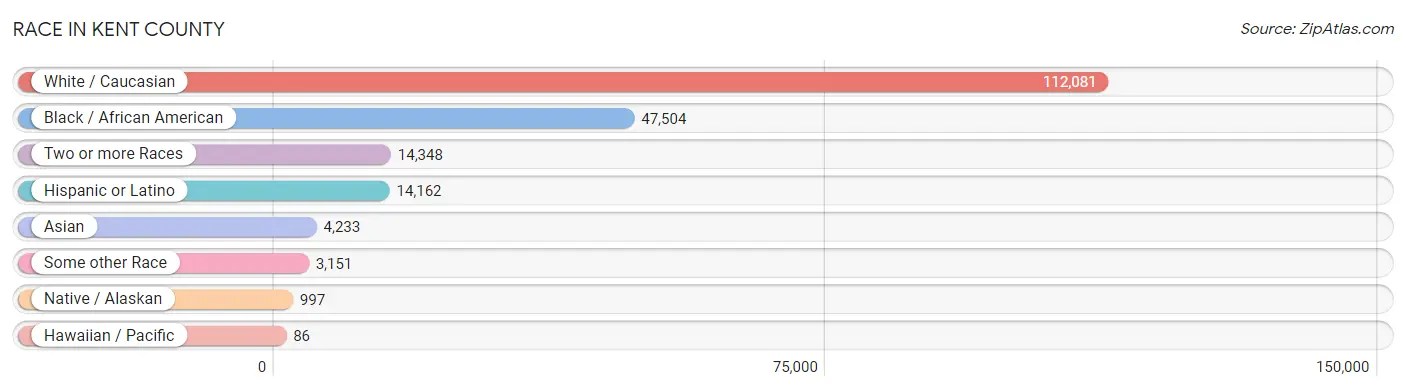
| Race | # Population | % Population |
| Asian | 4,233 | 2.3% |
| Black / African American | 47,504 | 26.0% |
| Hawaiian / Pacific | 86 | 0.1% |
| Hispanic or Latino | 14,162 | 7.8% |
| Native / Alaskan | 997 | 0.5% |
| White / Caucasian | 112,081 | 61.5% |
| Two or more Races | 14,348 | 7.9% |
| Some other Race | 3,151 | 1.7% |
| Total | 182,400 | 100.0% |
Ancestry in Kent County
The most populous ancestries reported in Kent County are Irish (23,141 | 12.7%), German (21,148 | 11.6%), English (17,505 | 9.6%), American (14,136 | 7.7%), and Italian (11,753 | 6.4%), together accounting for 48.1% of all Kent County residents.
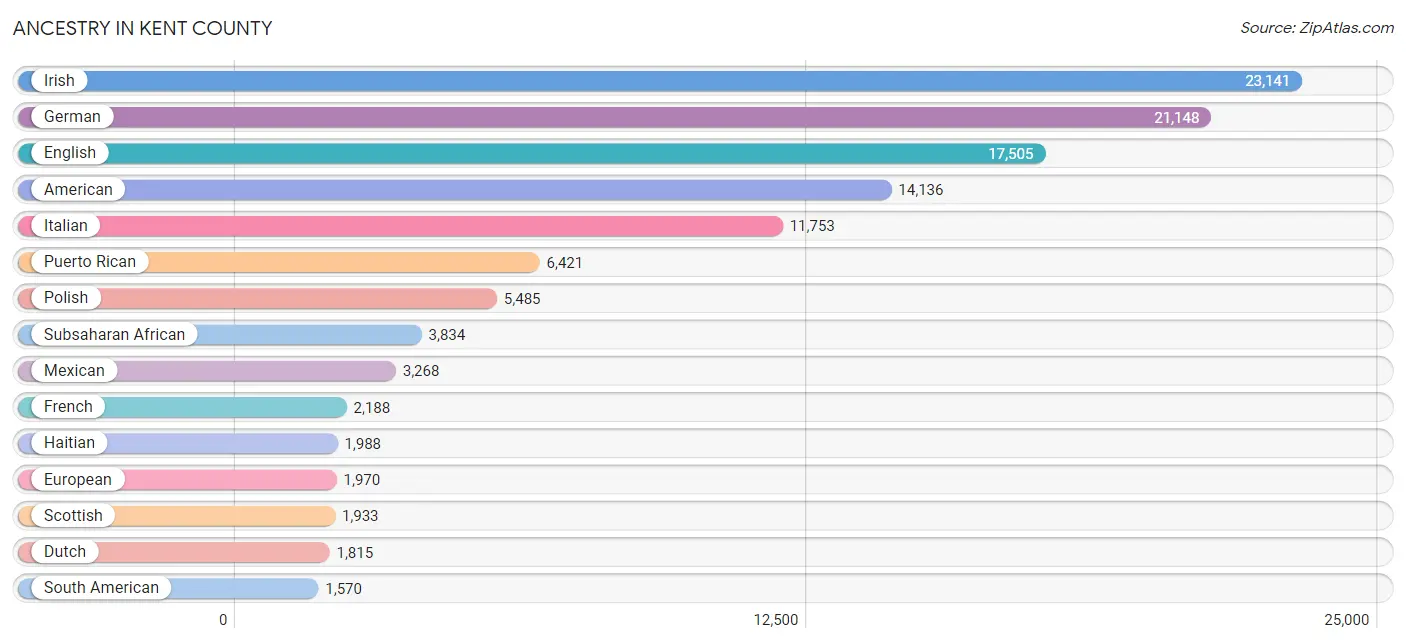
| Ancestry | # Population | % Population |
| Afghan | 74 | 0.0% |
| African | 1,336 | 0.7% |
| Albanian | 9 | 0.0% |
| Aleut | 3 | 0.0% |
| American | 14,136 | 7.7% |
| Apache | 77 | 0.0% |
| Arab | 192 | 0.1% |
| Argentinean | 282 | 0.2% |
| Armenian | 44 | 0.0% |
| Australian | 19 | 0.0% |
| Austrian | 441 | 0.2% |
| Bangladeshi | 60 | 0.0% |
| Barbadian | 32 | 0.0% |
| Belgian | 30 | 0.0% |
| Belizean | 4 | 0.0% |
| Bermudan | 125 | 0.1% |
| Bhutanese | 390 | 0.2% |
| Blackfeet | 189 | 0.1% |
| Bolivian | 66 | 0.0% |
| Brazilian | 60 | 0.0% |
| British | 915 | 0.5% |
| British West Indian | 1 | 0.0% |
| Burmese | 530 | 0.3% |
| Cajun | 60 | 0.0% |
| Canadian | 229 | 0.1% |
| Celtic | 8 | 0.0% |
| Central American | 1,357 | 0.7% |
| Central American Indian | 8 | 0.0% |
| Cherokee | 578 | 0.3% |
| Chickasaw | 113 | 0.1% |
| Chilean | 23 | 0.0% |
| Chippewa | 17 | 0.0% |
| Choctaw | 52 | 0.0% |
| Colombian | 225 | 0.1% |
| Colville | 1 | 0.0% |
| Costa Rican | 46 | 0.0% |
| Creek | 42 | 0.0% |
| Croatian | 48 | 0.0% |
| Cuban | 372 | 0.2% |
| Cypriot | 2 | 0.0% |
| Czech | 293 | 0.2% |
| Czechoslovakian | 124 | 0.1% |
| Danish | 65 | 0.0% |
| Delaware | 618 | 0.3% |
| Dominican | 395 | 0.2% |
| Dutch | 1,815 | 1.0% |
| Eastern European | 255 | 0.1% |
| Ecuadorian | 612 | 0.3% |
| Egyptian | 58 | 0.0% |
| English | 17,505 | 9.6% |
| Estonian | 33 | 0.0% |
| Ethiopian | 1 | 0.0% |
| European | 1,970 | 1.1% |
| Filipino | 17 | 0.0% |
| Finnish | 16 | 0.0% |
| French | 2,188 | 1.2% |
| French Canadian | 877 | 0.5% |
| German | 21,148 | 11.6% |
| German Russian | 7 | 0.0% |
| Ghanaian | 332 | 0.2% |
| Greek | 1,044 | 0.6% |
| Guamanian / Chamorro | 22 | 0.0% |
| Guatemalan | 446 | 0.2% |
| Guyanese | 77 | 0.0% |
| Haitian | 1,988 | 1.1% |
| Honduran | 66 | 0.0% |
| Hungarian | 603 | 0.3% |
| Indian (Asian) | 992 | 0.5% |
| Iranian | 51 | 0.0% |
| Irish | 23,141 | 12.7% |
| Iroquois | 114 | 0.1% |
| Israeli | 13 | 0.0% |
| Italian | 11,753 | 6.4% |
| Jamaican | 1,382 | 0.8% |
| Japanese | 14 | 0.0% |
| Jordanian | 1 | 0.0% |
| Kenyan | 1 | 0.0% |
| Korean | 1,506 | 0.8% |
| Laotian | 14 | 0.0% |
| Latvian | 11 | 0.0% |
| Lebanese | 45 | 0.0% |
| Liberian | 721 | 0.4% |
| Lithuanian | 559 | 0.3% |
| Macedonian | 23 | 0.0% |
| Malaysian | 25 | 0.0% |
| Maltese | 19 | 0.0% |
| Mexican | 3,268 | 1.8% |
| Mongolian | 2 | 0.0% |
| Moroccan | 55 | 0.0% |
| Native Hawaiian | 249 | 0.1% |
| Navajo | 1 | 0.0% |
| Nicaraguan | 42 | 0.0% |
| Nigerian | 1,196 | 0.7% |
| Northern European | 182 | 0.1% |
| Norwegian | 875 | 0.5% |
| Osage | 9 | 0.0% |
| Ottawa | 4 | 0.0% |
| Pakistani | 324 | 0.2% |
| Palestinian | 22 | 0.0% |
| Panamanian | 343 | 0.2% |
| Pennsylvania German | 888 | 0.5% |
| Peruvian | 362 | 0.2% |
| Polish | 5,485 | 3.0% |
| Portuguese | 211 | 0.1% |
| Puerto Rican | 6,421 | 3.5% |
| Romanian | 55 | 0.0% |
| Russian | 1,240 | 0.7% |
| Salvadoran | 414 | 0.2% |
| Samoan | 64 | 0.0% |
| Scandinavian | 192 | 0.1% |
| Scotch-Irish | 1,102 | 0.6% |
| Scottish | 1,933 | 1.1% |
| Seminole | 23 | 0.0% |
| Serbian | 71 | 0.0% |
| Sioux | 7 | 0.0% |
| Slavic | 3 | 0.0% |
| Slovak | 153 | 0.1% |
| South African | 96 | 0.1% |
| South American | 1,570 | 0.9% |
| South American Indian | 200 | 0.1% |
| Spaniard | 456 | 0.3% |
| Spanish | 76 | 0.0% |
| Sri Lankan | 323 | 0.2% |
| Subsaharan African | 3,834 | 2.1% |
| Swedish | 1,169 | 0.6% |
| Swiss | 345 | 0.2% |
| Syrian | 2 | 0.0% |
| Thai | 1,425 | 0.8% |
| Tongan | 20 | 0.0% |
| Trinidadian and Tobagonian | 207 | 0.1% |
| Turkish | 276 | 0.2% |
| U.S. Virgin Islander | 48 | 0.0% |
| Ugandan | 16 | 0.0% |
| Ukrainian | 591 | 0.3% |
| Vietnamese | 67 | 0.0% |
| Welsh | 873 | 0.5% |
| West Indian | 92 | 0.1% |
| Yugoslavian | 108 | 0.1% | View All 138 Rows |
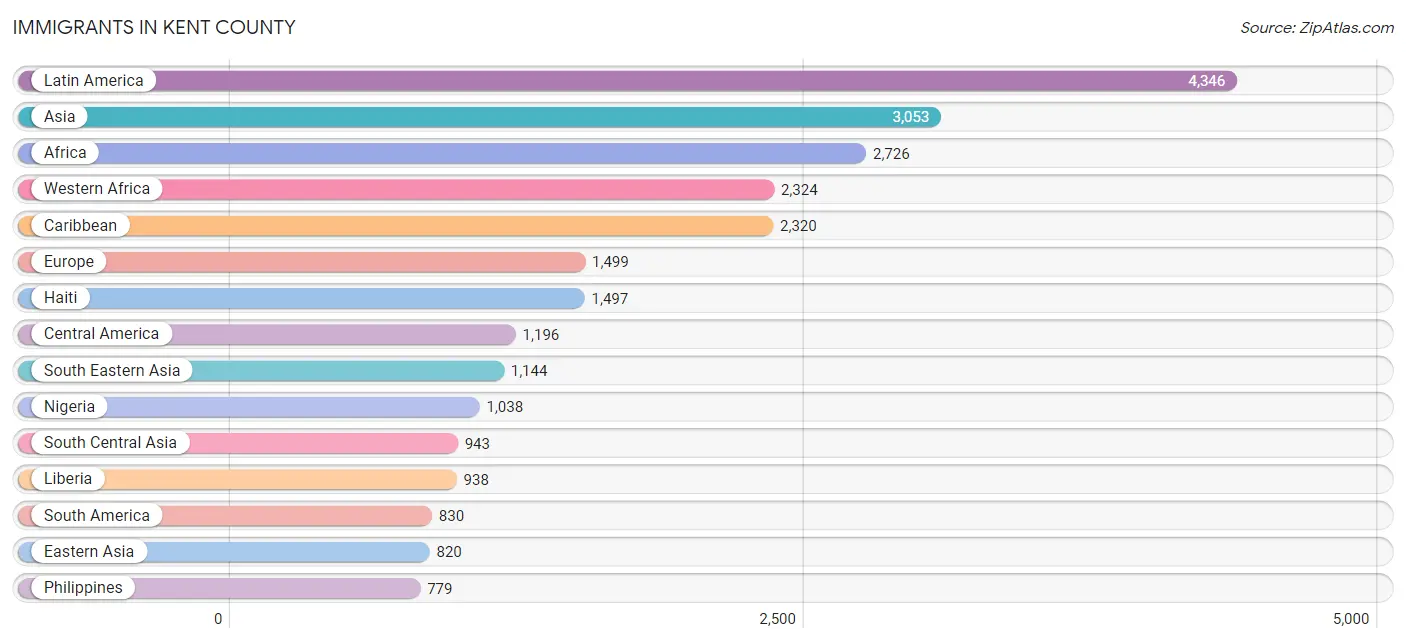
Immigrants in Kent County
The most numerous immigrant groups reported in Kent County came from Latin America (4,346 | 2.4%), Asia (3,053 | 1.7%), Africa (2,726 | 1.5%), Western Africa (2,324 | 1.3%), and Caribbean (2,320 | 1.3%), together accounting for 8.1% of all Kent County residents.
| Immigration Origin | # Population | % Population |
| Afghanistan | 116 | 0.1% |
| Africa | 2,726 | 1.5% |
| Argentina | 113 | 0.1% |
| Asia | 3,053 | 1.7% |
| Australia | 31 | 0.0% |
| Azores | 4 | 0.0% |
| Barbados | 20 | 0.0% |
| Bolivia | 58 | 0.0% |
| Brazil | 22 | 0.0% |
| Cameroon | 40 | 0.0% |
| Canada | 278 | 0.2% |
| Caribbean | 2,320 | 1.3% |
| Central America | 1,196 | 0.7% |
| Chile | 91 | 0.1% |
| China | 441 | 0.2% |
| Colombia | 202 | 0.1% |
| Costa Rica | 45 | 0.0% |
| Cuba | 108 | 0.1% |
| Dominican Republic | 266 | 0.2% |
| Eastern Africa | 168 | 0.1% |
| Eastern Asia | 820 | 0.4% |
| Eastern Europe | 401 | 0.2% |
| Ecuador | 25 | 0.0% |
| Egypt | 74 | 0.0% |
| El Salvador | 146 | 0.1% |
| England | 358 | 0.2% |
| Ethiopia | 1 | 0.0% |
| Europe | 1,499 | 0.8% |
| France | 24 | 0.0% |
| Germany | 232 | 0.1% |
| Ghana | 348 | 0.2% |
| Greece | 187 | 0.1% |
| Guatemala | 242 | 0.1% |
| Guyana | 136 | 0.1% |
| Haiti | 1,497 | 0.8% |
| Honduras | 60 | 0.0% |
| Hong Kong | 29 | 0.0% |
| Hungary | 32 | 0.0% |
| India | 613 | 0.3% |
| Iran | 5 | 0.0% |
| Ireland | 47 | 0.0% |
| Israel | 5 | 0.0% |
| Italy | 35 | 0.0% |
| Jamaica | 224 | 0.1% |
| Japan | 106 | 0.1% |
| Jordan | 1 | 0.0% |
| Kenya | 119 | 0.1% |
| Korea | 273 | 0.2% |
| Kuwait | 8 | 0.0% |
| Laos | 17 | 0.0% |
| Latin America | 4,346 | 2.4% |
| Latvia | 11 | 0.0% |
| Liberia | 938 | 0.5% |
| Malaysia | 34 | 0.0% |
| Mexico | 669 | 0.4% |
| Middle Africa | 40 | 0.0% |
| Morocco | 21 | 0.0% |
| Netherlands | 18 | 0.0% |
| Nigeria | 1,038 | 0.6% |
| Northern Africa | 95 | 0.1% |
| Northern Europe | 506 | 0.3% |
| Oceania | 31 | 0.0% |
| Pakistan | 209 | 0.1% |
| Panama | 34 | 0.0% |
| Peru | 183 | 0.1% |
| Philippines | 779 | 0.4% |
| Poland | 81 | 0.0% |
| Portugal | 14 | 0.0% |
| Russia | 228 | 0.1% |
| Scotland | 11 | 0.0% |
| Singapore | 18 | 0.0% |
| South Africa | 96 | 0.1% |
| South America | 830 | 0.5% |
| South Central Asia | 943 | 0.5% |
| South Eastern Asia | 1,144 | 0.6% |
| Southern Europe | 304 | 0.2% |
| Spain | 68 | 0.0% |
| Sweden | 8 | 0.0% |
| Switzerland | 14 | 0.0% |
| Syria | 2 | 0.0% |
| Taiwan | 38 | 0.0% |
| Thailand | 41 | 0.0% |
| Trinidad and Tobago | 205 | 0.1% |
| Turkey | 119 | 0.1% |
| Uganda | 16 | 0.0% |
| Ukraine | 19 | 0.0% |
| Vietnam | 255 | 0.1% |
| Western Africa | 2,324 | 1.3% |
| Western Asia | 146 | 0.1% |
| Western Europe | 288 | 0.2% |
| Yemen | 11 | 0.0% | View All 91 Rows |
Sex and Age in Kent County
Sex and Age in Kent County
The most populous age groups in Kent County are 20 to 24 Years (6,378 | 7.2%) for men and 40 to 44 Years (6,444 | 6.9%) for women.
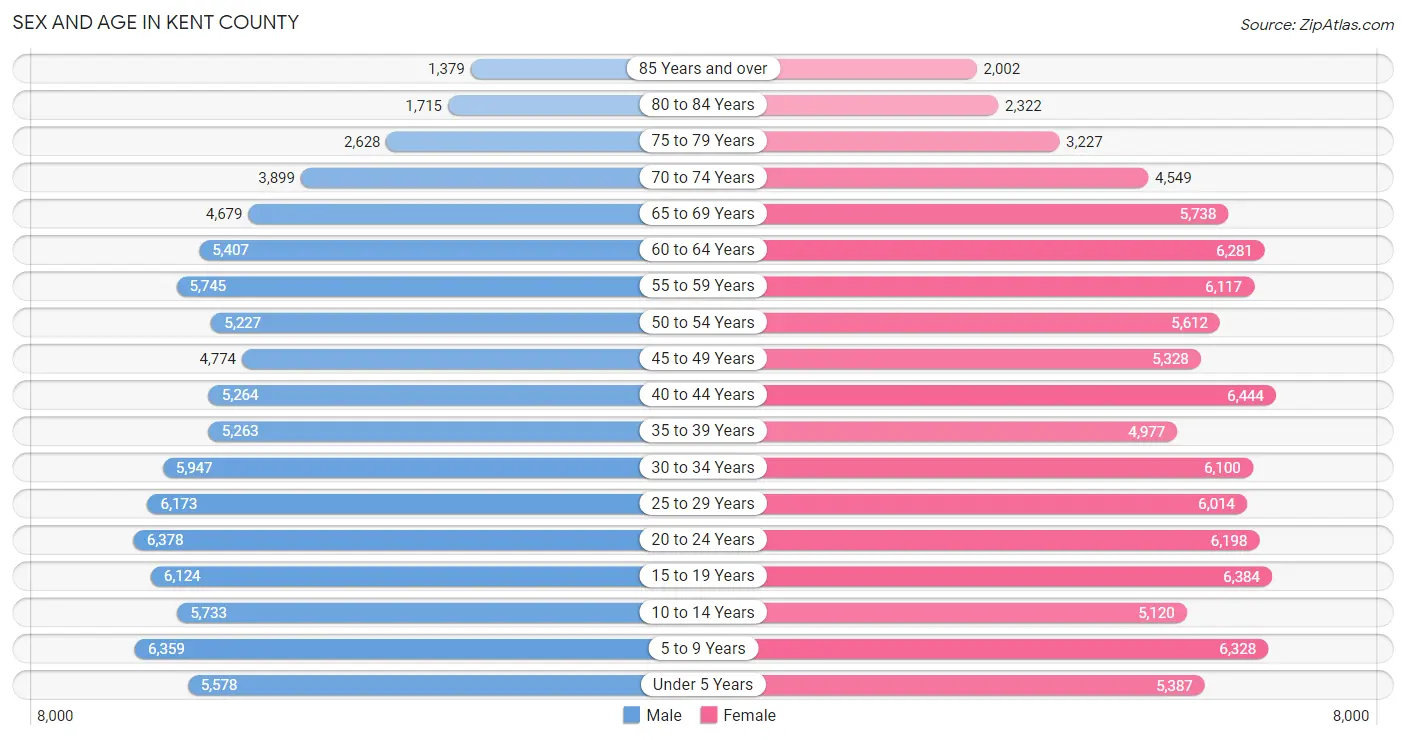
| Age Bracket | Male | Female |
| Under 5 Years | 5,578 (6.3%) | 5,387 (5.7%) |
| 5 to 9 Years | 6,359 (7.2%) | 6,328 (6.7%) |
| 10 to 14 Years | 5,733 (6.5%) | 5,120 (5.4%) |
| 15 to 19 Years | 6,124 (6.9%) | 6,384 (6.8%) |
| 20 to 24 Years | 6,378 (7.2%) | 6,198 (6.6%) |
| 25 to 29 Years | 6,173 (7.0%) | 6,014 (6.4%) |
| 30 to 34 Years | 5,947 (6.7%) | 6,100 (6.5%) |
| 35 to 39 Years | 5,263 (6.0%) | 4,977 (5.3%) |
| 40 to 44 Years | 5,264 (6.0%) | 6,444 (6.9%) |
| 45 to 49 Years | 4,774 (5.4%) | 5,328 (5.7%) |
| 50 to 54 Years | 5,227 (5.9%) | 5,612 (6.0%) |
| 55 to 59 Years | 5,745 (6.5%) | 6,117 (6.5%) |
| 60 to 64 Years | 5,407 (6.1%) | 6,281 (6.7%) |
| 65 to 69 Years | 4,679 (5.3%) | 5,738 (6.1%) |
| 70 to 74 Years | 3,899 (4.4%) | 4,549 (4.8%) |
| 75 to 79 Years | 2,628 (3.0%) | 3,227 (3.4%) |
| 80 to 84 Years | 1,715 (1.9%) | 2,322 (2.5%) |
| 85 Years and over | 1,379 (1.6%) | 2,002 (2.1%) |
| Total | 88,272 (100.0%) | 94,128 (100.0%) |
Families and Households in Kent County
Median Family Size in Kent County
The median family size in Kent County is 3.09 persons per family, with single female/mother families (9,691 | 20.8%) accounting for the largest median family size of 3.22 persons per family. On the other hand, single male/father families (3,627 | 7.8%) represent the smallest median family size with 2.58 persons per family.
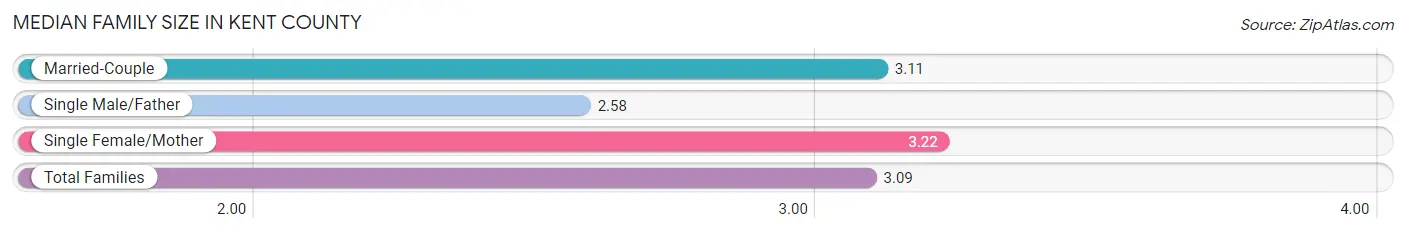
| Family Type | # Families | Family Size |
| Married-Couple | 33,276 (71.4%) | 3.11 |
| Single Male/Father | 3,627 (7.8%) | 2.58 |
| Single Female/Mother | 9,691 (20.8%) | 3.22 |
| Total Families | 46,594 (100.0%) | 3.09 |
Median Household Size in Kent County
The median household size in Kent County is 2.59 persons per household, with single female/mother households (9,691 | 14.1%) accounting for the largest median household size of 3.43 persons per household. non-family households (22,111 | 32.2%) represent the smallest median household size with 1.29 persons per household.
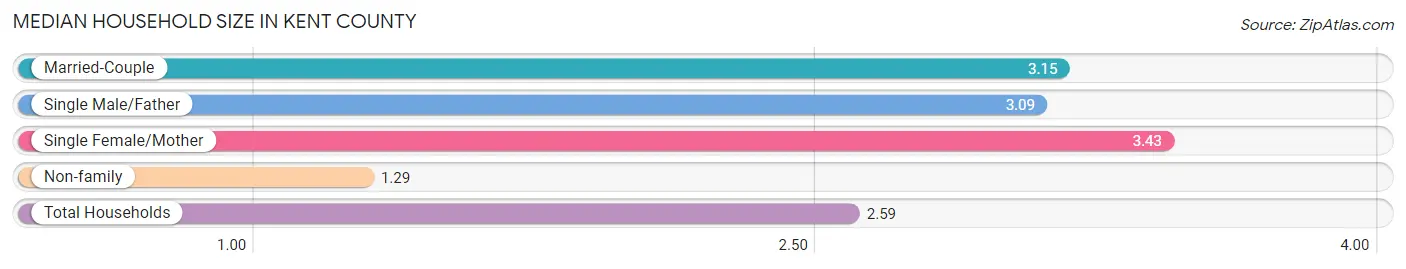
| Household Type | # Households | Household Size |
| Married-Couple | 33,276 (48.4%) | 3.15 |
| Single Male/Father | 3,627 (5.3%) | 3.09 |
| Single Female/Mother | 9,691 (14.1%) | 3.43 |
| Non-family | 22,111 (32.2%) | 1.29 |
| Total Households | 68,705 (100.0%) | 2.59 |
Household Size by Marriage Status in Kent County
Out of a total of 68,705 households in Kent County, 46,594 (67.8%) are family households, while 22,111 (32.2%) are nonfamily households. The most numerous type of family households are 2-person households, comprising 20,947, and the most common type of nonfamily households are 1-person households, comprising 17,783.
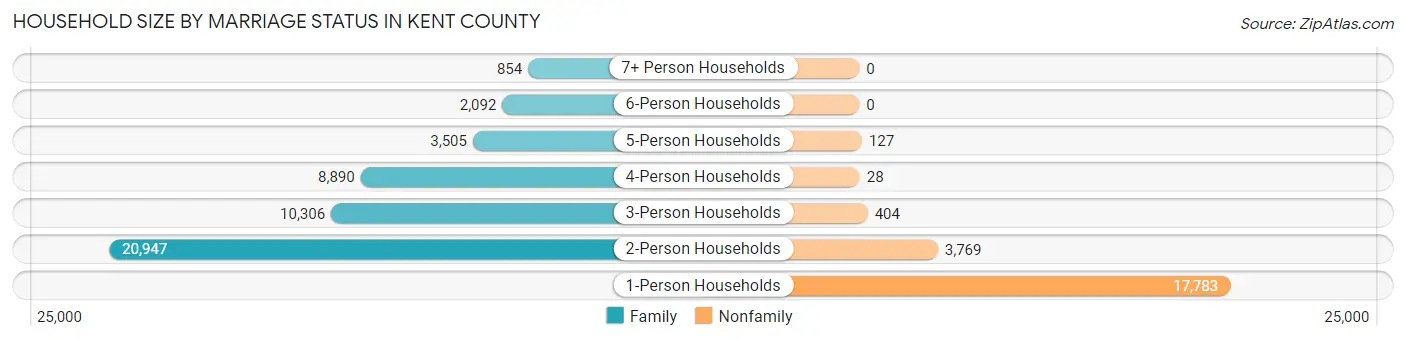
| Household Size | Family Households | Nonfamily Households |
| 1-Person Households | - | 17,783 (25.9%) |
| 2-Person Households | 20,947 (30.5%) | 3,769 (5.5%) |
| 3-Person Households | 10,306 (15.0%) | 404 (0.6%) |
| 4-Person Households | 8,890 (12.9%) | 28 (0.0%) |
| 5-Person Households | 3,505 (5.1%) | 127 (0.2%) |
| 6-Person Households | 2,092 (3.0%) | 0 (0.0%) |
| 7+ Person Households | 854 (1.2%) | 0 (0.0%) |
| Total | 46,594 (67.8%) | 22,111 (32.2%) |
Female Fertility in Kent County
Fertility by Age in Kent County
Average fertility rate in Kent County is 50.0 births per 1,000 women. Women in the age bracket of 20 to 34 years have the highest fertility rate with 82.0 births per 1,000 women. Women in the age bracket of 20 to 34 years acount for 71.2% of all women with births.
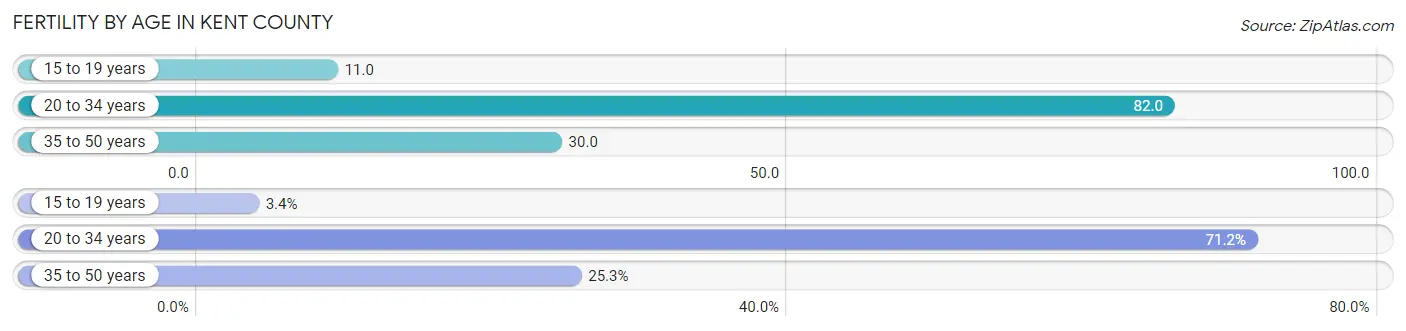
| Age Bracket | Women with Births | Births / 1,000 Women |
| 15 to 19 years | 73 (3.4%) | 11.0 |
| 20 to 34 years | 1,510 (71.2%) | 82.0 |
| 35 to 50 years | 537 (25.3%) | 30.0 |
| Total | 2,120 (100.0%) | 50.0 |
Fertility by Age by Marriage Status in Kent County
64.9% of women with births (2,120) in Kent County are married. The highest percentage of unmarried women with births falls into 15 to 19 years age bracket with 100.0% of them unmarried at the time of birth, while the lowest percentage of unmarried women with births belong to 35 to 50 years age bracket with 28.5% of them unmarried.
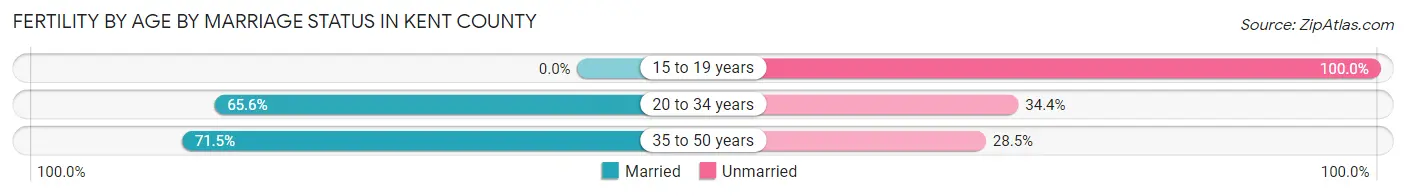
| Age Bracket | Married | Unmarried |
| 15 to 19 years | 0 (0.0%) | 73 (100.0%) |
| 20 to 34 years | 991 (65.6%) | 519 (34.4%) |
| 35 to 50 years | 384 (71.5%) | 153 (28.5%) |
| Total | 1,376 (64.9%) | 744 (35.1%) |
Fertility by Education in Kent County
Average fertility rate in Kent County is 50.0 births per 1,000 women. Women with the education attainment of graduate degree have the highest fertility rate of 103.0 births per 1,000 women, while women with the education attainment of less than high school have the lowest fertility at 27.0 births per 1,000 women. Women with the education attainment of college or associate's degree represent 30.9% of all women with births.
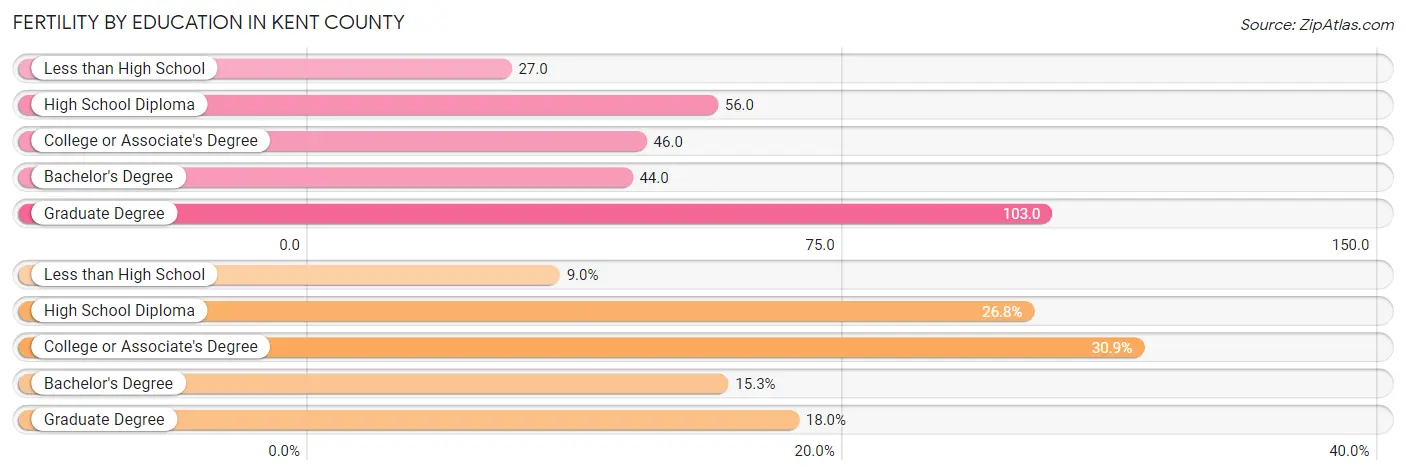
| Educational Attainment | Women with Births | Births / 1,000 Women |
| Less than High School | 191 (9.0%) | 27.0 |
| High School Diploma | 568 (26.8%) | 56.0 |
| College or Associate's Degree | 655 (30.9%) | 46.0 |
| Bachelor's Degree | 325 (15.3%) | 44.0 |
| Graduate Degree | 381 (18.0%) | 103.0 |
| Total | 2,120 (100.0%) | 50.0 |
Fertility by Education by Marriage Status in Kent County
35.1% of women with births in Kent County are unmarried. Women with the educational attainment of bachelor's degree are most likely to be married with 80.0% of them married at childbirth, while women with the educational attainment of college or associate's degree are least likely to be married with 46.9% of them unmarried at childbirth.
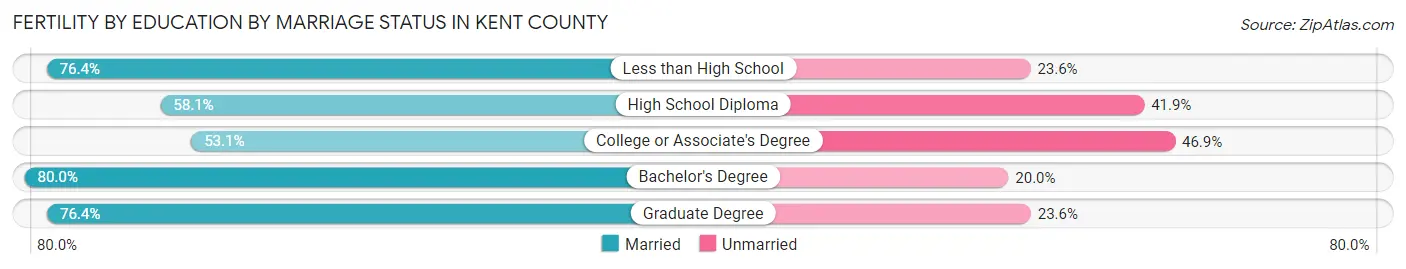
| Educational Attainment | Married | Unmarried |
| Less than High School | 146 (76.4%) | 45 (23.6%) |
| High School Diploma | 330 (58.1%) | 238 (41.9%) |
| College or Associate's Degree | 348 (53.1%) | 307 (46.9%) |
| Bachelor's Degree | 260 (80.0%) | 65 (20.0%) |
| Graduate Degree | 291 (76.4%) | 90 (23.6%) |
| Total | 1,376 (64.9%) | 744 (35.1%) |
Income in Kent County
Income Overview in Kent County
Per Capita Income in Kent County is $33,191, while median incomes of families and households are $82,307 and $69,278 respectively.
| Characteristic | Number | Measure |
| Per Capita Income | 182,400 | $33,191 |
| Median Family Income | 46,594 | $82,307 |
| Mean Family Income | 46,594 | $97,353 |
| Median Household Income | 68,705 | $69,278 |
| Mean Household Income | 68,705 | $85,275 |
| Income Deficit | 46,594 | $10,196 |
| Wage / Income Gap (%) | 182,400 | 24.39% |
| Wage / Income Gap ($) | 182,400 | 75.61¢ per $1 |
| Gini / Inequality Index | 182,400 | 0.41 |
Earnings by Sex in Kent County
Average Earnings in Kent County are $39,186, $44,838 for men and $33,901 for women, a difference of 24.4%.
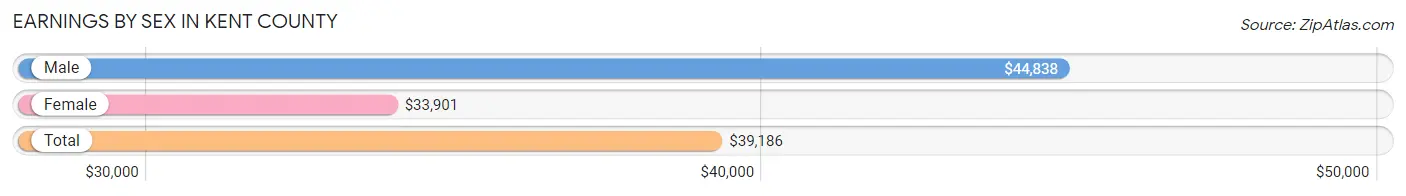
| Sex | Number | Average Earnings |
| Male | 47,800 (50.8%) | $44,838 |
| Female | 46,265 (49.2%) | $33,901 |
| Total | 94,065 (100.0%) | $39,186 |
Earnings by Sex by Income Bracket in Kent County
The most common earnings brackets in Kent County are $100,000+ for men (5,651 | 11.8%) and $55,000 to $64,999 for women (4,070 | 8.8%).
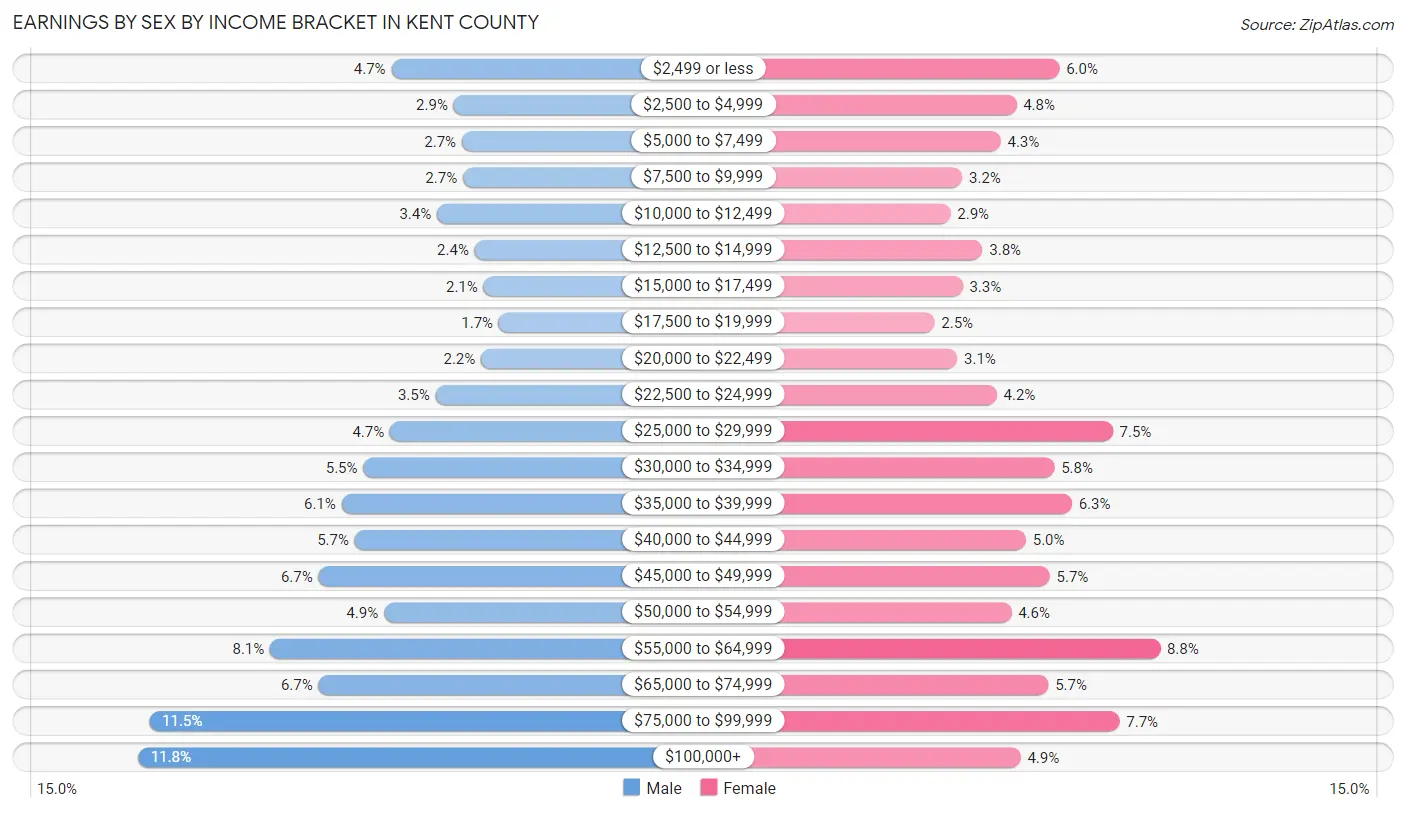
| Income | Male | Female |
| $2,499 or less | 2,243 (4.7%) | 2,762 (6.0%) |
| $2,500 to $4,999 | 1,407 (2.9%) | 2,201 (4.8%) |
| $5,000 to $7,499 | 1,296 (2.7%) | 1,999 (4.3%) |
| $7,500 to $9,999 | 1,279 (2.7%) | 1,499 (3.2%) |
| $10,000 to $12,499 | 1,632 (3.4%) | 1,348 (2.9%) |
| $12,500 to $14,999 | 1,121 (2.4%) | 1,763 (3.8%) |
| $15,000 to $17,499 | 1,003 (2.1%) | 1,505 (3.3%) |
| $17,500 to $19,999 | 797 (1.7%) | 1,136 (2.5%) |
| $20,000 to $22,499 | 1,039 (2.2%) | 1,432 (3.1%) |
| $22,500 to $24,999 | 1,648 (3.5%) | 1,948 (4.2%) |
| $25,000 to $29,999 | 2,261 (4.7%) | 3,455 (7.5%) |
| $30,000 to $34,999 | 2,620 (5.5%) | 2,698 (5.8%) |
| $35,000 to $39,999 | 2,912 (6.1%) | 2,925 (6.3%) |
| $40,000 to $44,999 | 2,735 (5.7%) | 2,327 (5.0%) |
| $45,000 to $49,999 | 3,222 (6.7%) | 2,636 (5.7%) |
| $50,000 to $54,999 | 2,342 (4.9%) | 2,138 (4.6%) |
| $55,000 to $64,999 | 3,874 (8.1%) | 4,070 (8.8%) |
| $65,000 to $74,999 | 3,221 (6.7%) | 2,618 (5.7%) |
| $75,000 to $99,999 | 5,497 (11.5%) | 3,545 (7.7%) |
| $100,000+ | 5,651 (11.8%) | 2,260 (4.9%) |
| Total | 47,800 (100.0%) | 46,265 (100.0%) |
Earnings by Sex by Educational Attainment in Kent County
Average earnings in Kent County are $50,074 for men and $39,812 for women, a difference of 20.5%. Men with an educational attainment of graduate degree enjoy the highest average annual earnings of $87,105, while those with less than high school education earn the least with $43,982. Women with an educational attainment of graduate degree earn the most with the average annual earnings of $70,380, while those with less than high school education have the smallest earnings of $25,813.
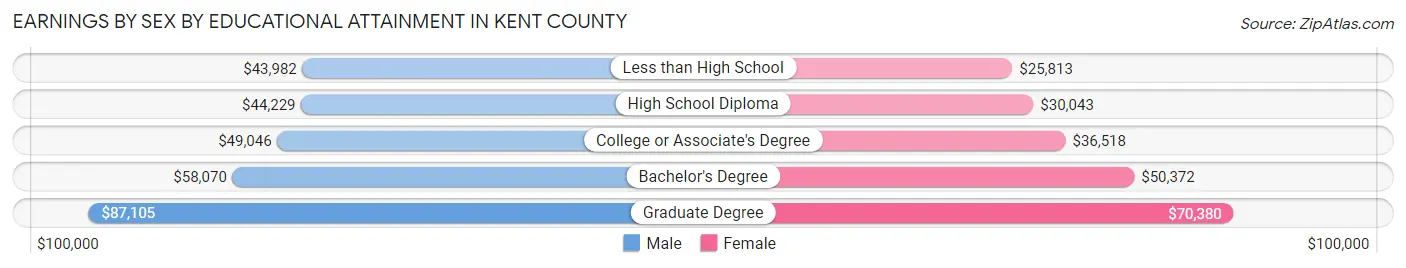
| Educational Attainment | Male Income | Female Income |
| Less than High School | $43,982 | $25,813 |
| High School Diploma | $44,229 | $30,043 |
| College or Associate's Degree | $49,046 | $36,518 |
| Bachelor's Degree | $58,070 | $50,372 |
| Graduate Degree | $87,105 | $70,380 |
| Total | $50,074 | $39,812 |
Family Income in Kent County
Family Income Brackets in Kent County
According to the Kent County family income data, there are 10,064 families falling into the $100,000 to $149,999 income range, which is the most common income bracket and makes up 21.6% of all families. Conversely, the less than $10,000 income bracket is the least frequent group with only 1,118 families (2.4%) belonging to this category.
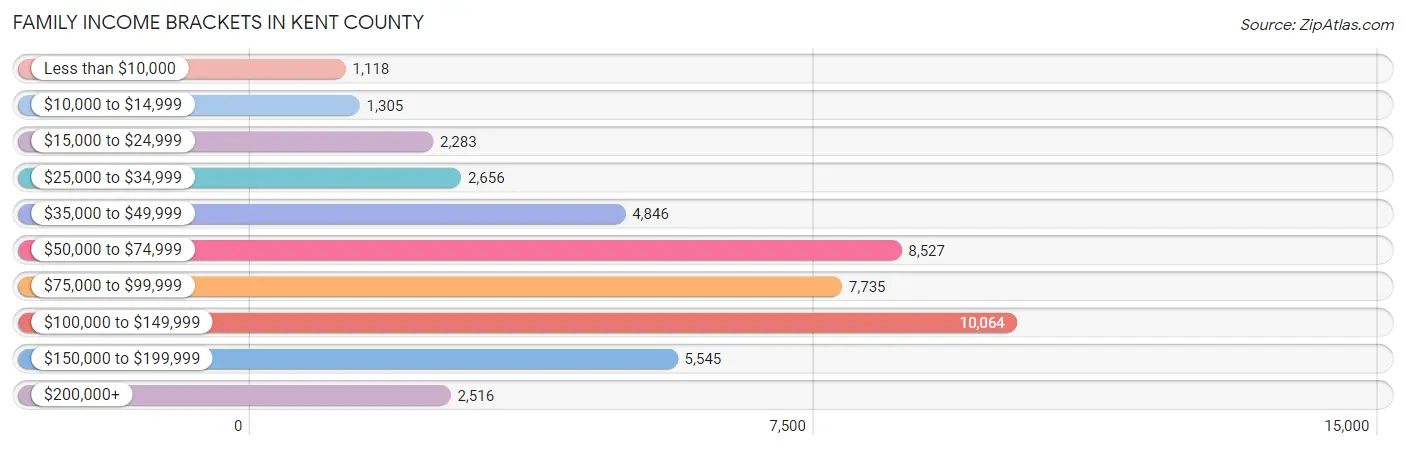
| Income Bracket | # Families | % Families |
| Less than $10,000 | 1,118 | 2.4% |
| $10,000 to $14,999 | 1,305 | 2.8% |
| $15,000 to $24,999 | 2,283 | 4.9% |
| $25,000 to $34,999 | 2,656 | 5.7% |
| $35,000 to $49,999 | 4,846 | 10.4% |
| $50,000 to $74,999 | 8,527 | 18.3% |
| $75,000 to $99,999 | 7,735 | 16.6% |
| $100,000 to $149,999 | 10,064 | 21.6% |
| $150,000 to $199,999 | 5,545 | 11.9% |
| $200,000+ | 2,516 | 5.4% |
Family Income by Famaliy Size in Kent County
7+ person families (718 | 1.5%) account for the highest median family income in Kent County with $116,792 per family, while 2-person families (22,597 | 48.5%) have the highest median income of $36,160 per family member.
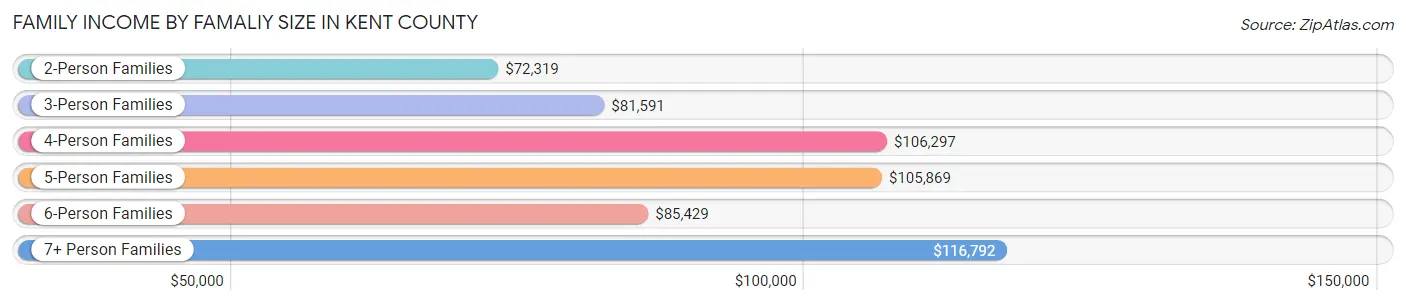
| Income Bracket | # Families | Median Income |
| 2-Person Families | 22,597 (48.5%) | $72,319 |
| 3-Person Families | 10,128 (21.7%) | $81,591 |
| 4-Person Families | 8,336 (17.9%) | $106,297 |
| 5-Person Families | 2,957 (6.4%) | $105,869 |
| 6-Person Families | 1,858 (4.0%) | $85,429 |
| 7+ Person Families | 718 (1.5%) | $116,792 |
| Total | 46,594 (100.0%) | $82,307 |
Family Income by Number of Earners in Kent County
The median family income in Kent County is $82,307, with families comprising 3+ earners (5,065) having the highest median family income of $138,177, while families with no earners (8,225) have the lowest median family income of $54,545, accounting for 10.9% and 17.6% of families, respectively.
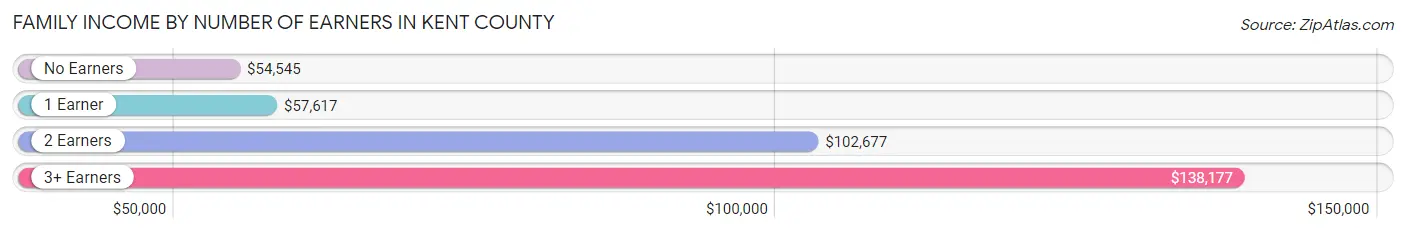
| Number of Earners | # Families | Median Income |
| No Earners | 8,225 (17.6%) | $54,545 |
| 1 Earner | 15,627 (33.5%) | $57,617 |
| 2 Earners | 17,677 (37.9%) | $102,677 |
| 3+ Earners | 5,065 (10.9%) | $138,177 |
| Total | 46,594 (100.0%) | $82,307 |
Household Income in Kent County
Household Income Brackets in Kent County
With 12,642 households falling in the category, the $50,000 to $74,999 income range is the most frequent in Kent County, accounting for 18.4% of all households. In contrast, only 2,336 households (3.4%) fall into the less than $10,000 income bracket, making it the least populous group.
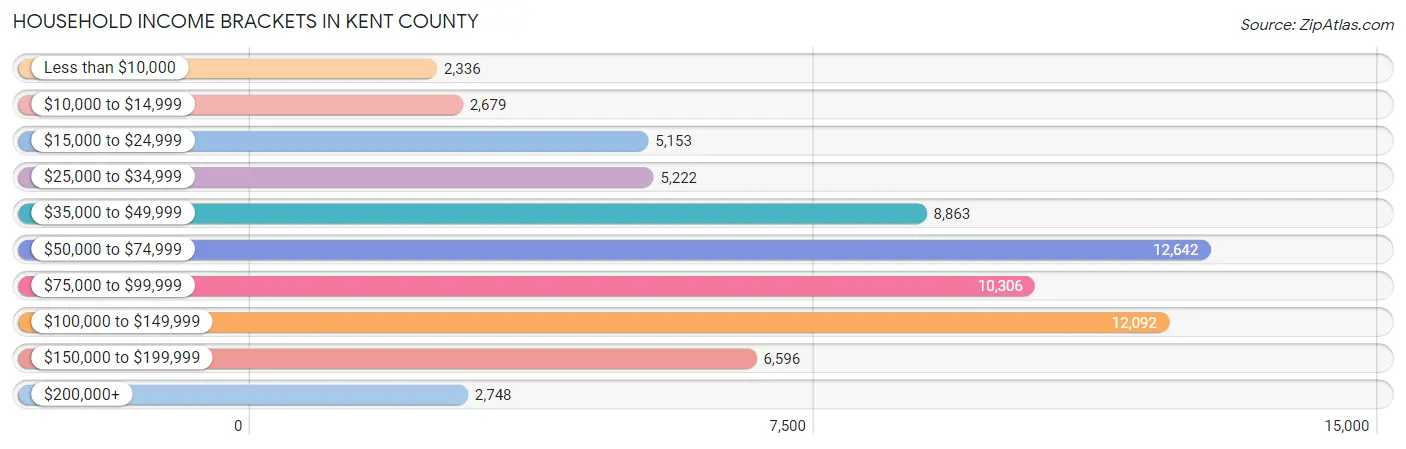
| Income Bracket | # Households | % Households |
| Less than $10,000 | 2,336 | 3.4% |
| $10,000 to $14,999 | 2,679 | 3.9% |
| $15,000 to $24,999 | 5,153 | 7.5% |
| $25,000 to $34,999 | 5,222 | 7.6% |
| $35,000 to $49,999 | 8,863 | 12.9% |
| $50,000 to $74,999 | 12,642 | 18.4% |
| $75,000 to $99,999 | 10,306 | 15.0% |
| $100,000 to $149,999 | 12,092 | 17.6% |
| $150,000 to $199,999 | 6,596 | 9.6% |
| $200,000+ | 2,748 | 4.0% |
Household Income by Householder Age in Kent County
The median household income in Kent County is $69,278, with the highest median household income of $79,737 found in the 45 to 64 years age bracket for the primary householder. A total of 24,333 households (35.4%) fall into this category. Meanwhile, the 15 to 24 years age bracket for the primary householder has the lowest median household income of $40,527, with 2,283 households (3.3%) in this group.
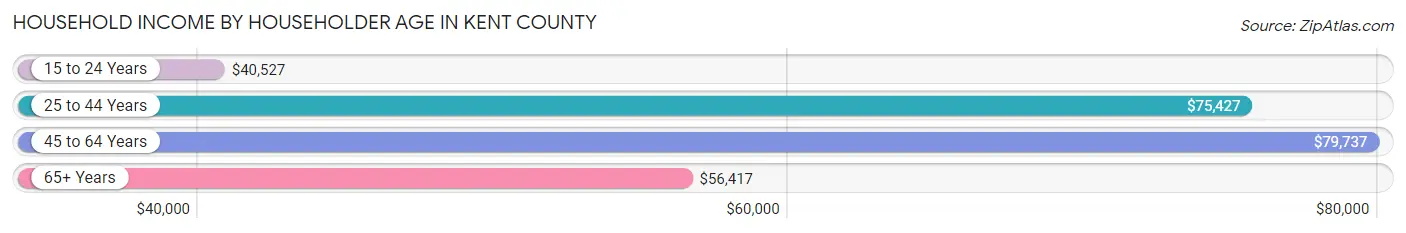
| Income Bracket | # Households | Median Income |
| 15 to 24 Years | 2,283 (3.3%) | $40,527 |
| 25 to 44 Years | 22,297 (32.5%) | $75,427 |
| 45 to 64 Years | 24,333 (35.4%) | $79,737 |
| 65+ Years | 19,792 (28.8%) | $56,417 |
| Total | 68,705 (100.0%) | $69,278 |
Poverty in Kent County
Income Below Poverty by Sex and Age in Kent County
With 10.8% poverty level for males and 13.7% for females among the residents of Kent County, 5 year old males and 16 and 17 year old females are the most vulnerable to poverty, with 443 males (30.5%) and 643 females (26.2%) in their respective age groups living below the poverty level.
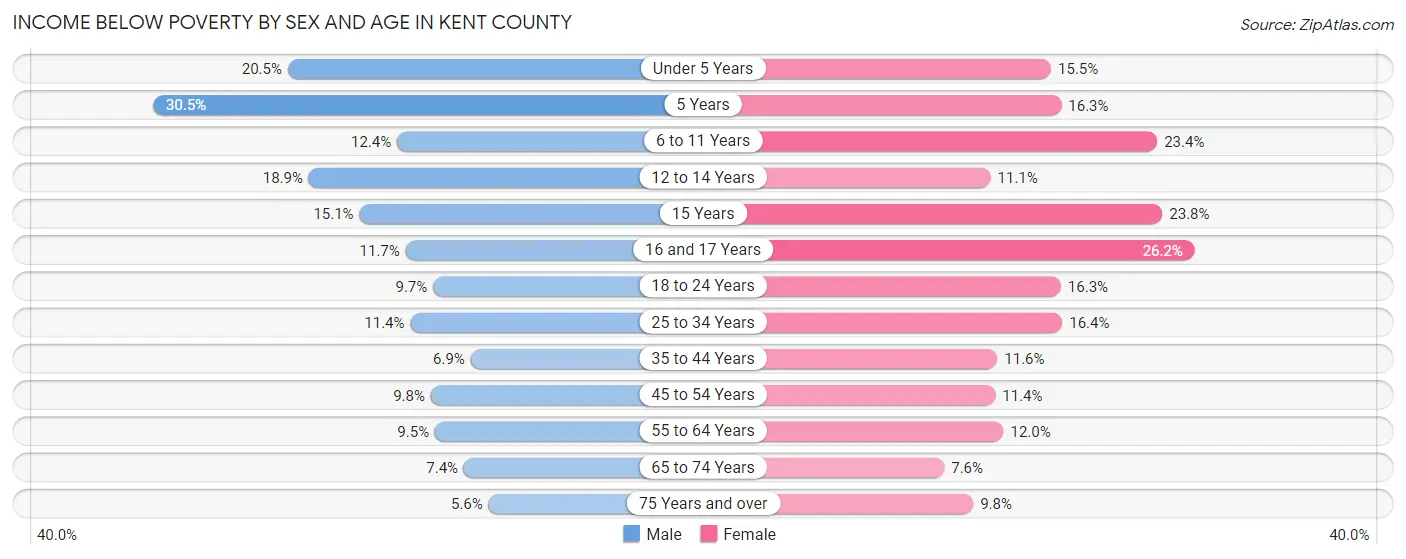
| Age Bracket | Male | Female |
| Under 5 Years | 1,128 (20.5%) | 822 (15.5%) |
| 5 Years | 443 (30.5%) | 192 (16.3%) |
| 6 to 11 Years | 828 (12.3%) | 1,616 (23.4%) |
| 12 to 14 Years | 669 (18.9%) | 335 (11.1%) |
| 15 Years | 193 (15.1%) | 283 (23.8%) |
| 16 and 17 Years | 264 (11.7%) | 643 (26.2%) |
| 18 to 24 Years | 749 (9.7%) | 1,111 (16.3%) |
| 25 to 34 Years | 1,372 (11.4%) | 1,978 (16.4%) |
| 35 to 44 Years | 722 (6.9%) | 1,319 (11.6%) |
| 45 to 54 Years | 983 (9.8%) | 1,246 (11.4%) |
| 55 to 64 Years | 1,057 (9.5%) | 1,484 (12.0%) |
| 65 to 74 Years | 626 (7.4%) | 776 (7.6%) |
| 75 Years and over | 310 (5.6%) | 701 (9.8%) |
| Total | 9,344 (10.8%) | 12,506 (13.7%) |
Income Above Poverty by Sex and Age in Kent County
According to the poverty statistics in Kent County, males aged 75 years and over and females aged 65 to 74 years are the age groups that are most secure financially, with 94.5% of males and 92.4% of females in these age groups living above the poverty line.

| Age Bracket | Male | Female |
| Under 5 Years | 4,386 (79.5%) | 4,466 (84.5%) |
| 5 Years | 1,011 (69.5%) | 986 (83.7%) |
| 6 to 11 Years | 5,875 (87.6%) | 5,284 (76.6%) |
| 12 to 14 Years | 2,870 (81.1%) | 2,696 (88.9%) |
| 15 Years | 1,082 (84.9%) | 906 (76.2%) |
| 16 and 17 Years | 1,990 (88.3%) | 1,811 (73.8%) |
| 18 to 24 Years | 6,997 (90.3%) | 5,716 (83.7%) |
| 25 to 34 Years | 10,708 (88.6%) | 10,108 (83.6%) |
| 35 to 44 Years | 9,769 (93.1%) | 10,099 (88.4%) |
| 45 to 54 Years | 9,002 (90.2%) | 9,686 (88.6%) |
| 55 to 64 Years | 10,033 (90.5%) | 10,868 (88.0%) |
| 65 to 74 Years | 7,851 (92.6%) | 9,418 (92.4%) |
| 75 Years and over | 5,276 (94.5%) | 6,482 (90.2%) |
| Total | 76,850 (89.2%) | 78,526 (86.3%) |
Income Below Poverty Among Married-Couple Families in Kent County
The poverty statistics for married-couple families in Kent County show that 4.5% or 1,507 of the total 33,276 families live below the poverty line. Families with 3 or 4 children have the highest poverty rate of 7.1%, comprising of 200 families. On the other hand, families with no children have the lowest poverty rate of 3.7%, which includes 769 families.
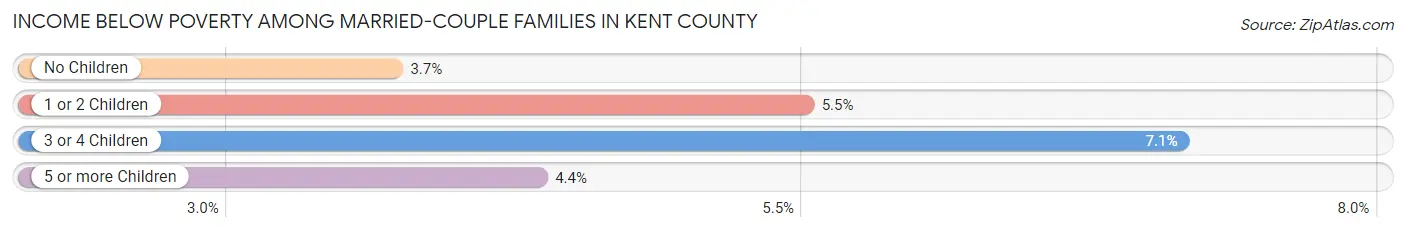
| Children | Above Poverty | Below Poverty |
| No Children | 19,891 (96.3%) | 769 (3.7%) |
| 1 or 2 Children | 9,035 (94.5%) | 527 (5.5%) |
| 3 or 4 Children | 2,601 (92.9%) | 200 (7.1%) |
| 5 or more Children | 242 (95.7%) | 11 (4.3%) |
| Total | 31,769 (95.5%) | 1,507 (4.5%) |
Income Below Poverty Among Single-Parent Households in Kent County
According to the poverty data in Kent County, 13.8% or 500 single-father households and 24.3% or 2,359 single-mother households are living below the poverty line. Among single-father households, those with 3 or 4 children have the highest poverty rate, with 77 households (40.5%) experiencing poverty. Likewise, among single-mother households, those with 3 or 4 children have the highest poverty rate, with 874 households (64.1%) falling below the poverty line.
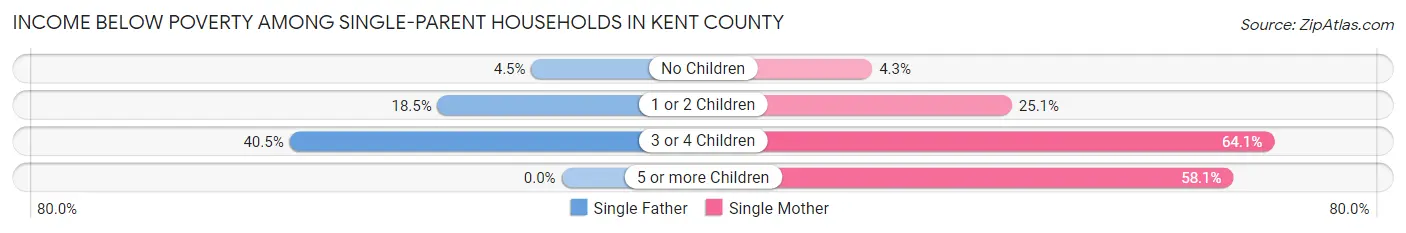
| Children | Single Father | Single Mother |
| No Children | 68 (4.5%) | 135 (4.3%) |
| 1 or 2 Children | 355 (18.5%) | 1,249 (25.1%) |
| 3 or 4 Children | 77 (40.5%) | 874 (64.1%) |
| 5 or more Children | 0 (0.0%) | 101 (58.1%) |
| Total | 500 (13.8%) | 2,359 (24.3%) |
Income Below Poverty Among Married-Couple vs Single-Parent Households in Kent County
The poverty data for Kent County shows that 1,507 of the married-couple family households (4.5%) and 2,859 of the single-parent households (21.5%) are living below the poverty level. Within the married-couple family households, those with 3 or 4 children have the highest poverty rate, with 200 households (7.1%) falling below the poverty line. Among the single-parent households, those with 3 or 4 children have the highest poverty rate, with 951 household (61.2%) living below poverty.
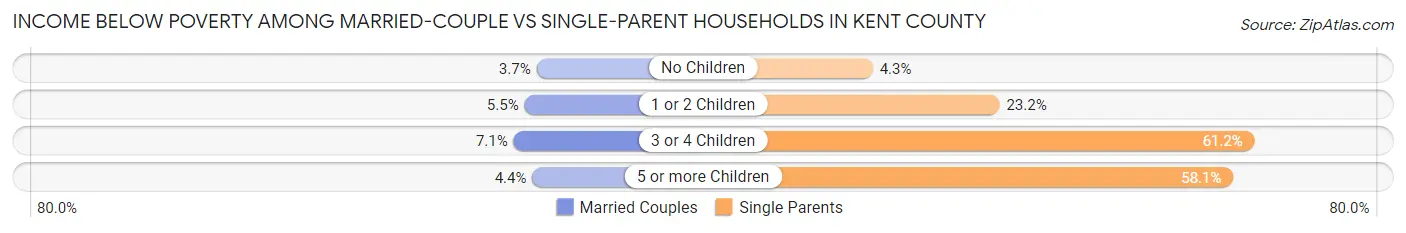
| Children | Married-Couple Families | Single-Parent Households |
| No Children | 769 (3.7%) | 203 (4.3%) |
| 1 or 2 Children | 527 (5.5%) | 1,604 (23.2%) |
| 3 or 4 Children | 200 (7.1%) | 951 (61.2%) |
| 5 or more Children | 11 (4.3%) | 101 (58.1%) |
| Total | 1,507 (4.5%) | 2,859 (21.5%) |
Employment Characteristics in Kent County
Employment by Class of Employer in Kent County
Among the 82,419 employed individuals in Kent County, private company employees (50,815 | 61.7%), state government employees (10,381 | 12.6%), and not-for-profit organizations (5,950 | 7.2%) make up the most common classes of employment.
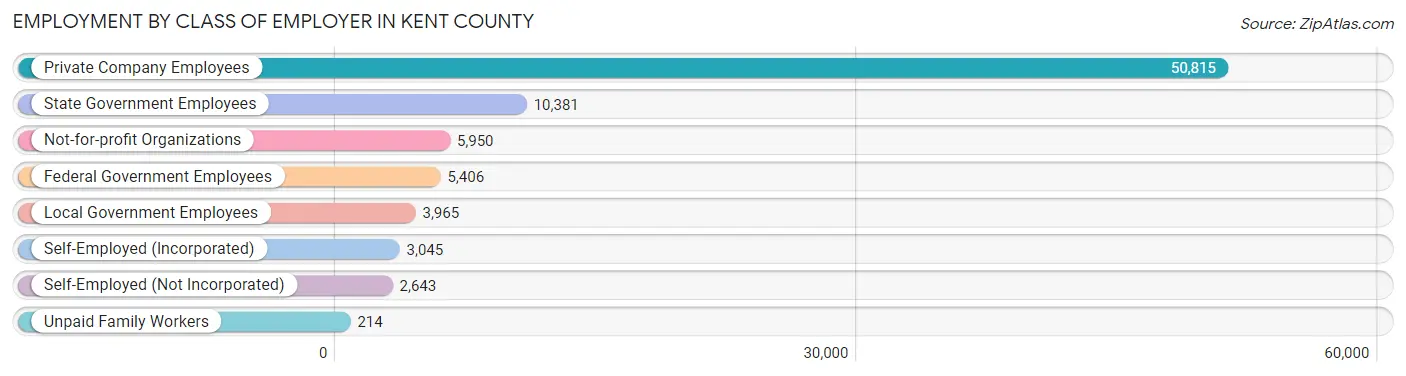
| Employer Class | # Employees | % Employees |
| Private Company Employees | 50,815 | 61.7% |
| Self-Employed (Incorporated) | 3,045 | 3.7% |
| Self-Employed (Not Incorporated) | 2,643 | 3.2% |
| Not-for-profit Organizations | 5,950 | 7.2% |
| Local Government Employees | 3,965 | 4.8% |
| State Government Employees | 10,381 | 12.6% |
| Federal Government Employees | 5,406 | 6.6% |
| Unpaid Family Workers | 214 | 0.3% |
| Total | 82,419 | 100.0% |
Employment Status by Age in Kent County
According to the labor force statistics for Kent County, out of the total population over 16 years of age (145,431), 61.6% or 89,585 individuals are in the labor force, with 6.0% or 5,375 of them unemployed. The age group with the highest labor force participation rate is 35 to 44 years, with 87.3% or 19,161 individuals in the labor force. Within the labor force, the 75 years and over age range has the highest percentage of unemployed individuals, with 22.1% or 200 of them being unemployed.

| Age Bracket | In Labor Force | Unemployed |
| 16 to 19 Years | 4,168 (41.5%) | 559 (13.4%) |
| 20 to 24 Years | 9,319 (74.1%) | 1,016 (10.9%) |
| 25 to 29 Years | 10,627 (87.2%) | 574 (5.4%) |
| 30 to 34 Years | 9,939 (82.5%) | 805 (8.1%) |
| 35 to 44 Years | 19,161 (87.3%) | 786 (4.1%) |
| 45 to 54 Years | 17,318 (82.7%) | 658 (3.8%) |
| 55 to 59 Years | 8,031 (67.7%) | 241 (3.0%) |
| 60 to 64 Years | 5,809 (49.7%) | 279 (4.8%) |
| 65 to 74 Years | 4,377 (23.2%) | 289 (6.6%) |
| 75 Years and over | 903 (6.8%) | 200 (22.1%) |
| Total | 89,585 (61.6%) | 5,375 (6.0%) |
Employment Status by Educational Attainment in Kent County
According to labor force statistics for Kent County, 78.2% of individuals (70,906) out of the total population between 25 and 64 years of age (90,673) are in the labor force, with 4.7% or 3,333 of them being unemployed. The group with the highest labor force participation rate are those with the educational attainment of bachelor's degree or higher, with 87.2% or 22,090 individuals in the labor force. Within the labor force, individuals with less than high school education have the highest percentage of unemployment, with 6.7% or 392 of them being unemployed.
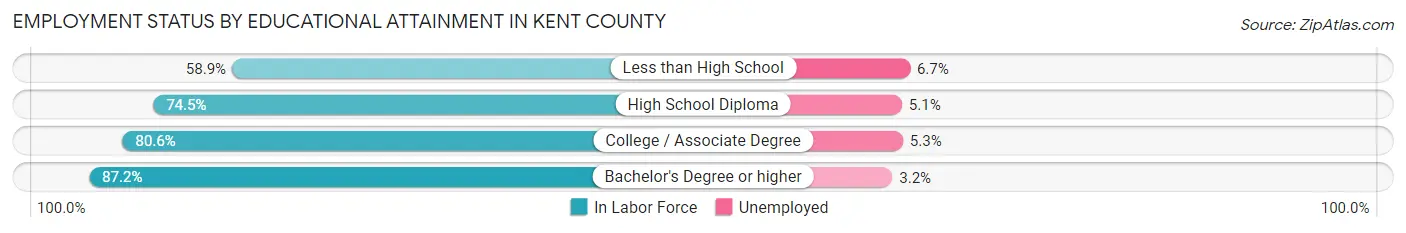
| Educational Attainment | In Labor Force | Unemployed |
| Less than High School | 5,849 (58.9%) | 665 (6.7%) |
| High School Diploma | 20,944 (74.5%) | 1,434 (5.1%) |
| College / Associate Degree | 22,001 (80.6%) | 1,447 (5.3%) |
| Bachelor's Degree or higher | 22,090 (87.2%) | 811 (3.2%) |
| Total | 70,906 (78.2%) | 4,262 (4.7%) |
Employment Occupations by Sex in Kent County
Management, Business, Science and Arts Occupations
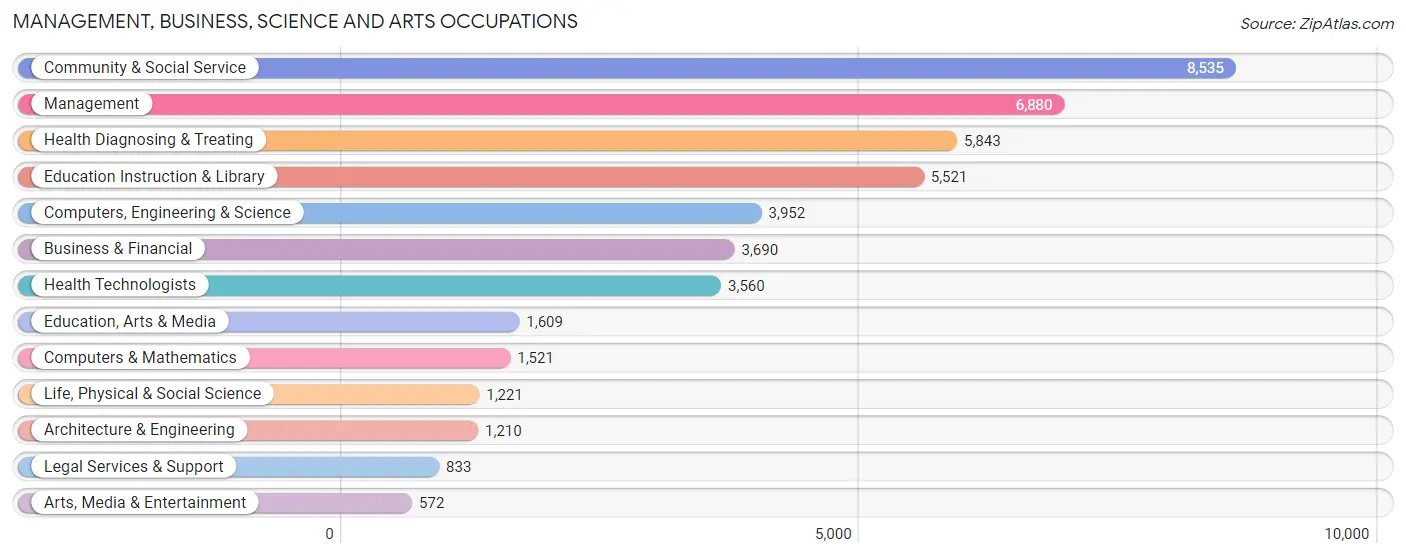
The most common Management, Business, Science and Arts occupations in Kent County are Community & Social Service (8,535 | 10.4%), Management (6,880 | 8.4%), Health Diagnosing & Treating (5,843 | 7.1%), Education Instruction & Library (5,521 | 6.8%), and Computers, Engineering & Science (3,952 | 4.8%).
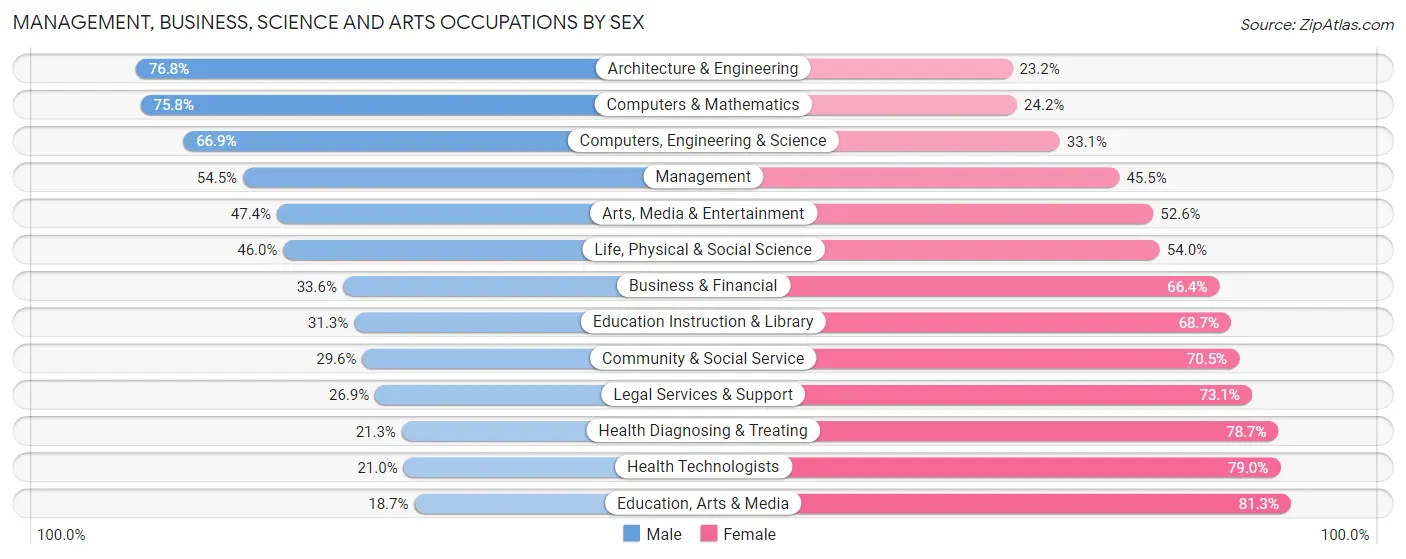
Management, Business, Science and Arts Occupations by Sex
Within the Management, Business, Science and Arts occupations in Kent County, the most male-oriented occupations are Architecture & Engineering (76.8%), Computers & Mathematics (75.8%), and Computers, Engineering & Science (66.9%), while the most female-oriented occupations are Education, Arts & Media (81.3%), Health Technologists (79.0%), and Health Diagnosing & Treating (78.7%).
| Occupation | Male | Female |
| Management | 3,747 (54.5%) | 3,133 (45.5%) |
| Business & Financial | 1,241 (33.6%) | 2,449 (66.4%) |
| Computers, Engineering & Science | 2,644 (66.9%) | 1,308 (33.1%) |
| Computers & Mathematics | 1,153 (75.8%) | 368 (24.2%) |
| Architecture & Engineering | 929 (76.8%) | 281 (23.2%) |
| Life, Physical & Social Science | 562 (46.0%) | 659 (54.0%) |
| Community & Social Service | 2,522 (29.5%) | 6,013 (70.5%) |
| Education, Arts & Media | 301 (18.7%) | 1,308 (81.3%) |
| Legal Services & Support | 224 (26.9%) | 609 (73.1%) |
| Education Instruction & Library | 1,726 (31.3%) | 3,795 (68.7%) |
| Arts, Media & Entertainment | 271 (47.4%) | 301 (52.6%) |
| Health Diagnosing & Treating | 1,247 (21.3%) | 4,596 (78.7%) |
| Health Technologists | 746 (21.0%) | 2,814 (79.0%) |
| Total (Category) | 11,401 (39.5%) | 17,499 (60.6%) |
| Total (Overall) | 41,143 (50.3%) | 40,651 (49.7%) |
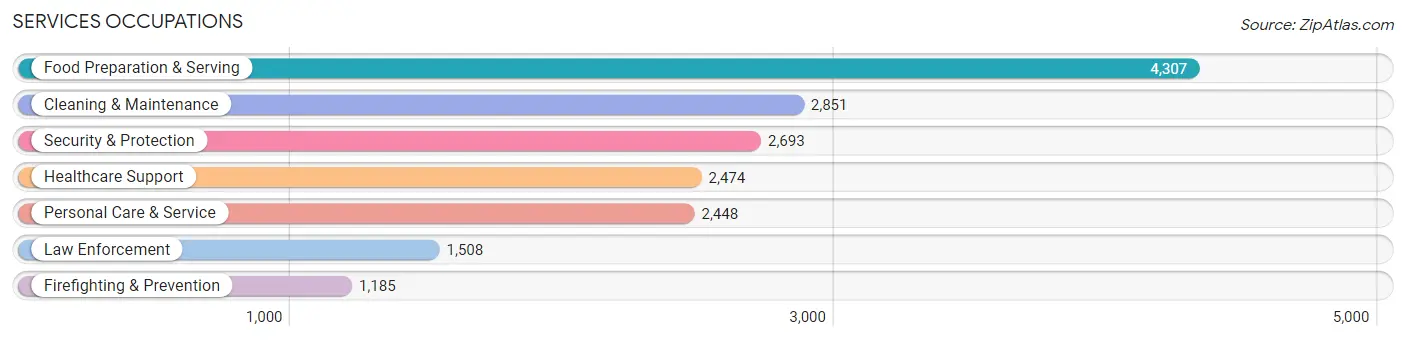
Services Occupations
The most common Services occupations in Kent County are Food Preparation & Serving (4,307 | 5.3%), Cleaning & Maintenance (2,851 | 3.5%), Security & Protection (2,693 | 3.3%), Healthcare Support (2,474 | 3.0%), and Personal Care & Service (2,448 | 3.0%).
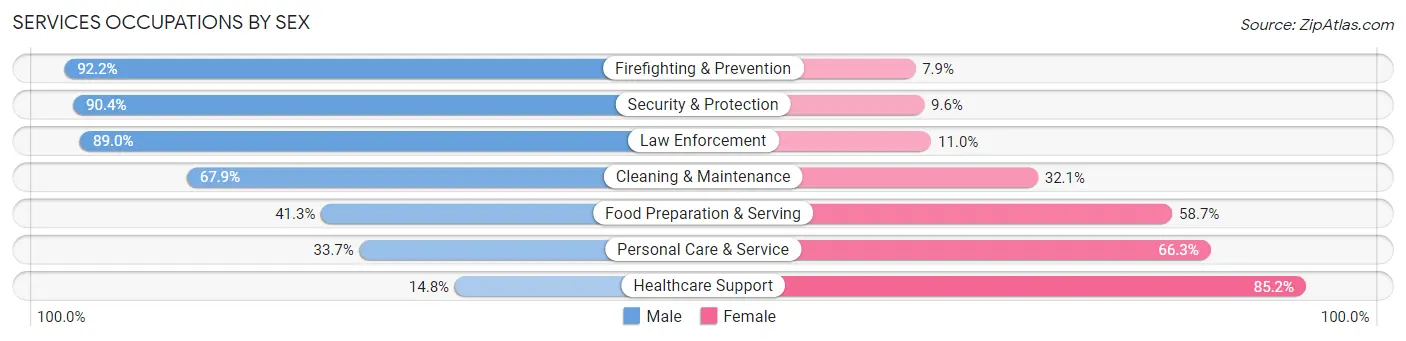
Services Occupations by Sex
Within the Services occupations in Kent County, the most male-oriented occupations are Firefighting & Prevention (92.1%), Security & Protection (90.4%), and Law Enforcement (89.0%), while the most female-oriented occupations are Healthcare Support (85.2%), Personal Care & Service (66.3%), and Food Preparation & Serving (58.7%).
| Occupation | Male | Female |
| Healthcare Support | 366 (14.8%) | 2,108 (85.2%) |
| Security & Protection | 2,434 (90.4%) | 259 (9.6%) |
| Firefighting & Prevention | 1,092 (92.1%) | 93 (7.9%) |
| Law Enforcement | 1,342 (89.0%) | 166 (11.0%) |
| Food Preparation & Serving | 1,777 (41.3%) | 2,530 (58.7%) |
| Cleaning & Maintenance | 1,935 (67.9%) | 916 (32.1%) |
| Personal Care & Service | 824 (33.7%) | 1,624 (66.3%) |
| Total (Category) | 7,336 (49.7%) | 7,437 (50.3%) |
| Total (Overall) | 41,143 (50.3%) | 40,651 (49.7%) |
Sales and Office Occupations
The most common Sales and Office occupations in Kent County are Office & Administration (10,781 | 13.2%), and Sales & Related (7,171 | 8.8%).

Sales and Office Occupations by Sex
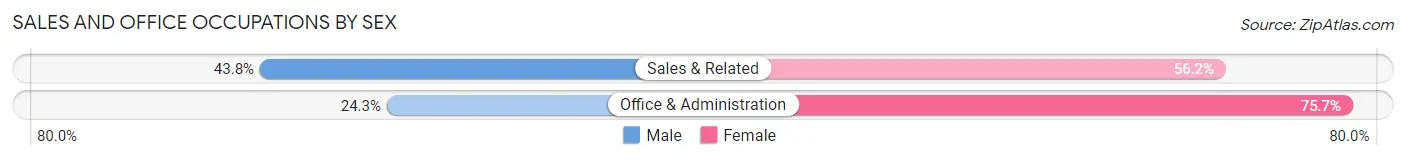
| Occupation | Male | Female |
| Sales & Related | 3,141 (43.8%) | 4,030 (56.2%) |
| Office & Administration | 2,618 (24.3%) | 8,163 (75.7%) |
| Total (Category) | 5,759 (32.1%) | 12,193 (67.9%) |
| Total (Overall) | 41,143 (50.3%) | 40,651 (49.7%) |
Natural Resources, Construction and Maintenance Occupations
The most common Natural Resources, Construction and Maintenance occupations in Kent County are Construction & Extraction (3,960 | 4.8%), Installation, Maintenance & Repair (3,339 | 4.1%), and Farming, Fishing & Forestry (463 | 0.6%).

Natural Resources, Construction and Maintenance Occupations by Sex
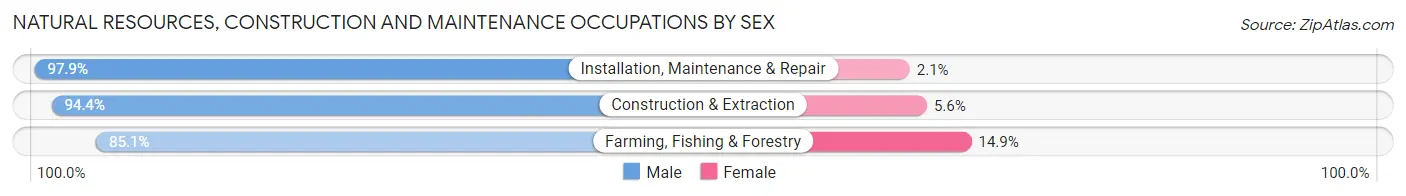
| Occupation | Male | Female |
| Farming, Fishing & Forestry | 394 (85.1%) | 69 (14.9%) |
| Construction & Extraction | 3,737 (94.4%) | 223 (5.6%) |
| Installation, Maintenance & Repair | 3,270 (97.9%) | 69 (2.1%) |
| Total (Category) | 7,401 (95.4%) | 361 (4.6%) |
| Total (Overall) | 41,143 (50.3%) | 40,651 (49.7%) |
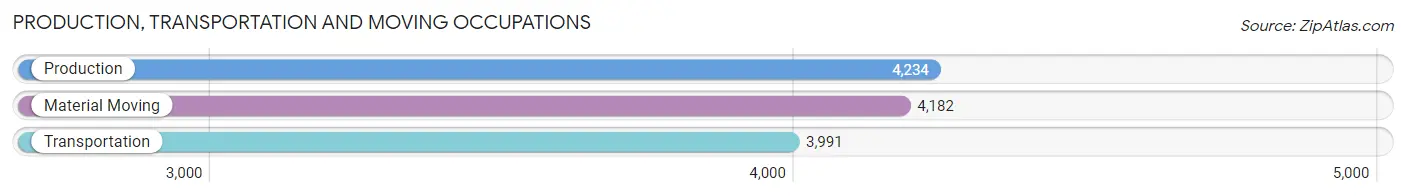
Production, Transportation and Moving Occupations
The most common Production, Transportation and Moving occupations in Kent County are Production (4,234 | 5.2%), Material Moving (4,182 | 5.1%), and Transportation (3,991 | 4.9%).
Production, Transportation and Moving Occupations by Sex
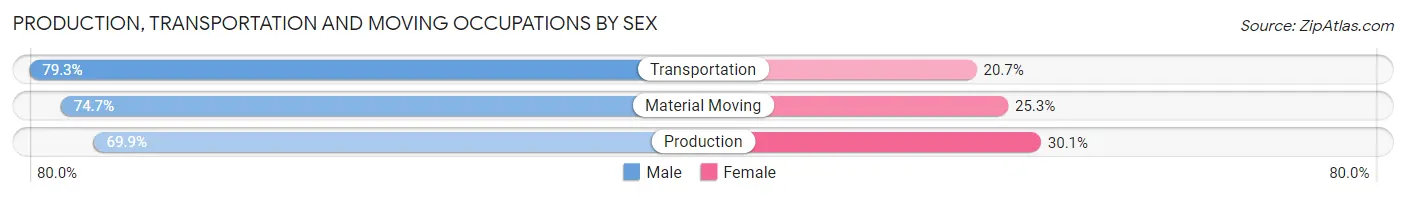
| Occupation | Male | Female |
| Production | 2,958 (69.9%) | 1,276 (30.1%) |
| Transportation | 3,165 (79.3%) | 826 (20.7%) |
| Material Moving | 3,123 (74.7%) | 1,059 (25.3%) |
| Total (Category) | 9,246 (74.5%) | 3,161 (25.5%) |
| Total (Overall) | 41,143 (50.3%) | 40,651 (49.7%) |
Employment Industries by Sex in Kent County
Employment Industries in Kent County
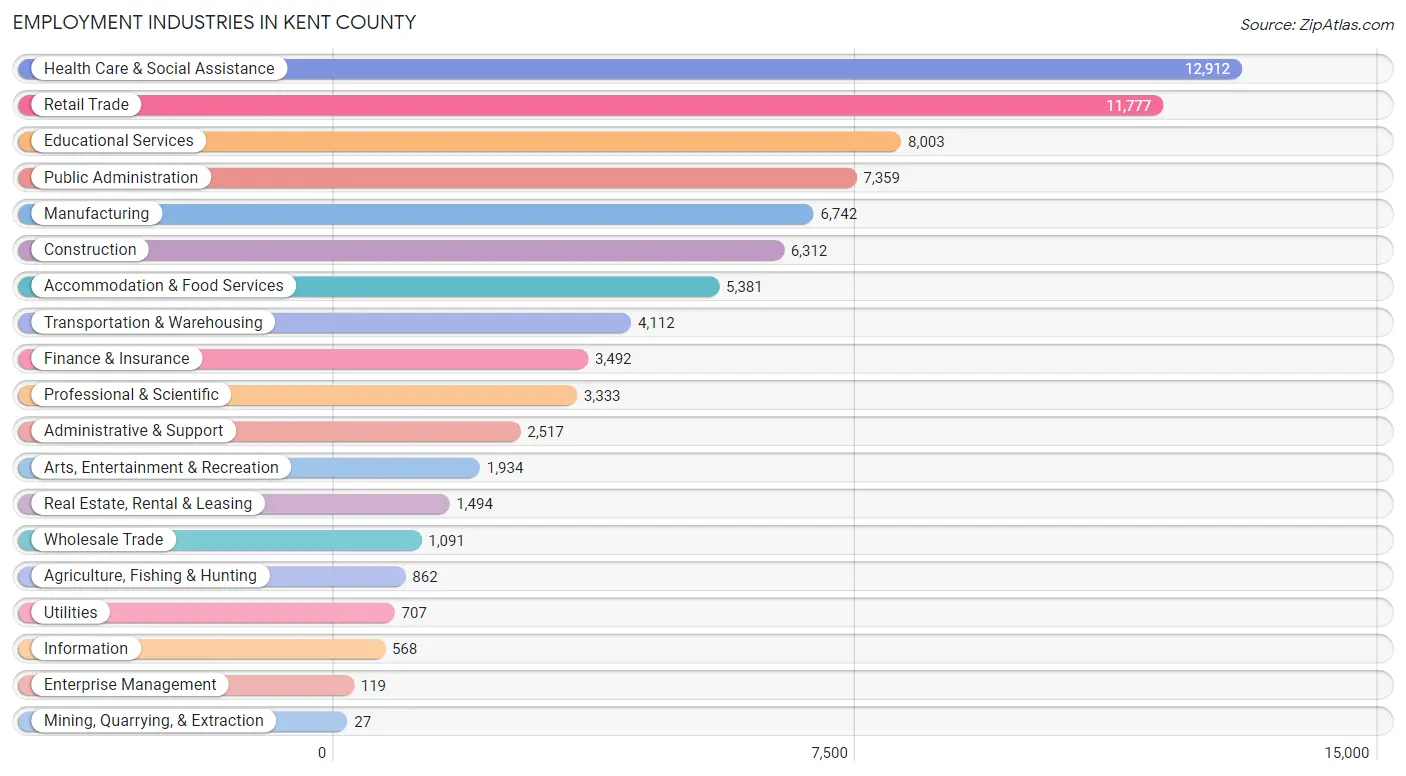
The major employment industries in Kent County include Health Care & Social Assistance (12,912 | 15.8%), Retail Trade (11,777 | 14.4%), Educational Services (8,003 | 9.8%), Public Administration (7,359 | 9.0%), and Manufacturing (6,742 | 8.2%).
Employment Industries by Sex in Kent County
The Kent County industries that see more men than women are Mining, Quarrying, & Extraction (100.0%), Construction (84.3%), and Wholesale Trade (78.7%), whereas the industries that tend to have a higher number of women are Health Care & Social Assistance (81.7%), Enterprise Management (73.1%), and Finance & Insurance (64.3%).

| Industry | Male | Female |
| Agriculture, Fishing & Hunting | 636 (73.8%) | 226 (26.2%) |
| Mining, Quarrying, & Extraction | 27 (100.0%) | 0 (0.0%) |
| Construction | 5,321 (84.3%) | 991 (15.7%) |
| Manufacturing | 4,872 (72.3%) | 1,870 (27.7%) |
| Wholesale Trade | 859 (78.7%) | 232 (21.3%) |
| Retail Trade | 6,200 (52.6%) | 5,577 (47.4%) |
| Transportation & Warehousing | 3,139 (76.3%) | 973 (23.7%) |
| Utilities | 462 (65.3%) | 245 (34.6%) |
| Information | 354 (62.3%) | 214 (37.7%) |
| Finance & Insurance | 1,246 (35.7%) | 2,246 (64.3%) |
| Real Estate, Rental & Leasing | 703 (47.0%) | 791 (52.9%) |
| Professional & Scientific | 1,707 (51.2%) | 1,626 (48.8%) |
| Enterprise Management | 32 (26.9%) | 87 (73.1%) |
| Administrative & Support | 1,265 (50.3%) | 1,252 (49.7%) |
| Educational Services | 2,908 (36.3%) | 5,095 (63.7%) |
| Health Care & Social Assistance | 2,360 (18.3%) | 10,552 (81.7%) |
| Arts, Entertainment & Recreation | 1,132 (58.5%) | 802 (41.5%) |
| Accommodation & Food Services | 2,299 (42.7%) | 3,082 (57.3%) |
| Public Administration | 3,869 (52.6%) | 3,490 (47.4%) |
| Total | 41,143 (50.3%) | 40,651 (49.7%) |
Education in Kent County
School Enrollment in Kent County
The most common levels of schooling among the 44,589 students in Kent County are college / undergraduate (10,635 | 23.8%), high school (9,145 | 20.5%), and elementary school (9,114 | 20.4%).
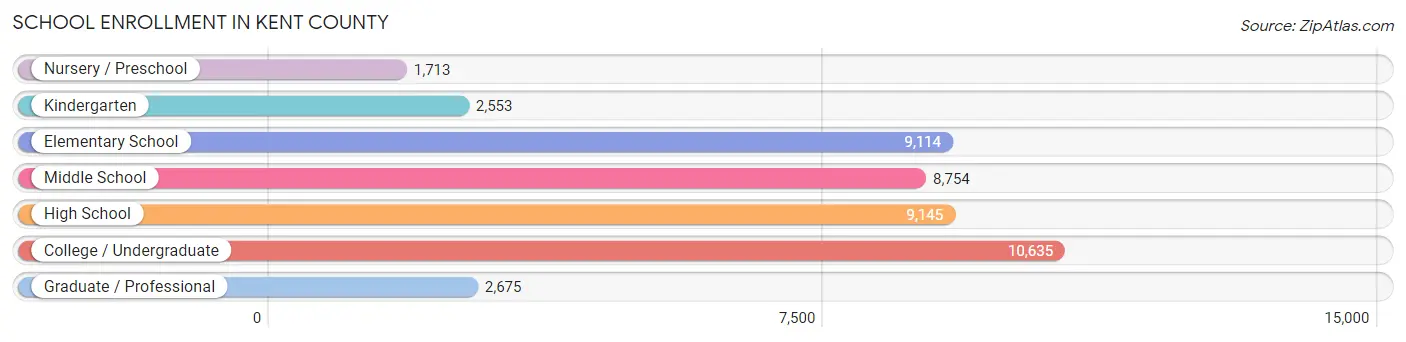
| School Level | # Students | % Students |
| Nursery / Preschool | 1,713 | 3.8% |
| Kindergarten | 2,553 | 5.7% |
| Elementary School | 9,114 | 20.4% |
| Middle School | 8,754 | 19.6% |
| High School | 9,145 | 20.5% |
| College / Undergraduate | 10,635 | 23.8% |
| Graduate / Professional | 2,675 | 6.0% |
| Total | 44,589 | 100.0% |
School Enrollment by Age by Funding Source in Kent County
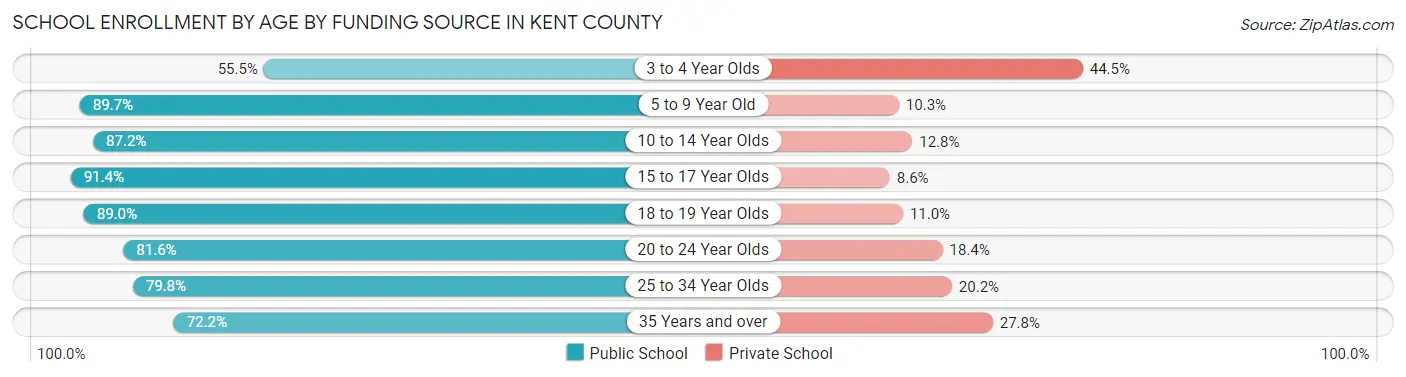
Out of a total of 44,589 students who are enrolled in schools in Kent County, 6,465 (14.5%) attend a private institution, while the remaining 38,124 (85.5%) are enrolled in public schools. The age group of 3 to 4 year olds has the highest likelihood of being enrolled in private schools, with 620 (44.5% in the age bracket) enrolled. Conversely, the age group of 15 to 17 year olds has the lowest likelihood of being enrolled in a private school, with 6,151 (91.4% in the age bracket) attending a public institution.
| Age Bracket | Public School | Private School |
| 3 to 4 Year Olds | 772 (55.5%) | 620 (44.5%) |
| 5 to 9 Year Old | 9,949 (89.7%) | 1,141 (10.3%) |
| 10 to 14 Year Olds | 9,086 (87.2%) | 1,331 (12.8%) |
| 15 to 17 Year Olds | 6,151 (91.4%) | 579 (8.6%) |
| 18 to 19 Year Olds | 3,262 (89.0%) | 405 (11.0%) |
| 20 to 24 Year Olds | 4,729 (81.6%) | 1,067 (18.4%) |
| 25 to 34 Year Olds | 2,210 (79.8%) | 558 (20.2%) |
| 35 Years and over | 1,971 (72.2%) | 758 (27.8%) |
| Total | 38,124 (85.5%) | 6,465 (14.5%) |
Educational Attainment by Field of Study in Kent County
Business (7,160 | 20.7%), education (5,275 | 15.2%), science & technology (3,790 | 11.0%), arts & humanities (3,581 | 10.4%), and bio, nature & agricultural (2,288 | 6.6%) are the most common fields of study among 34,579 individuals in Kent County who have obtained a bachelor's degree or higher.
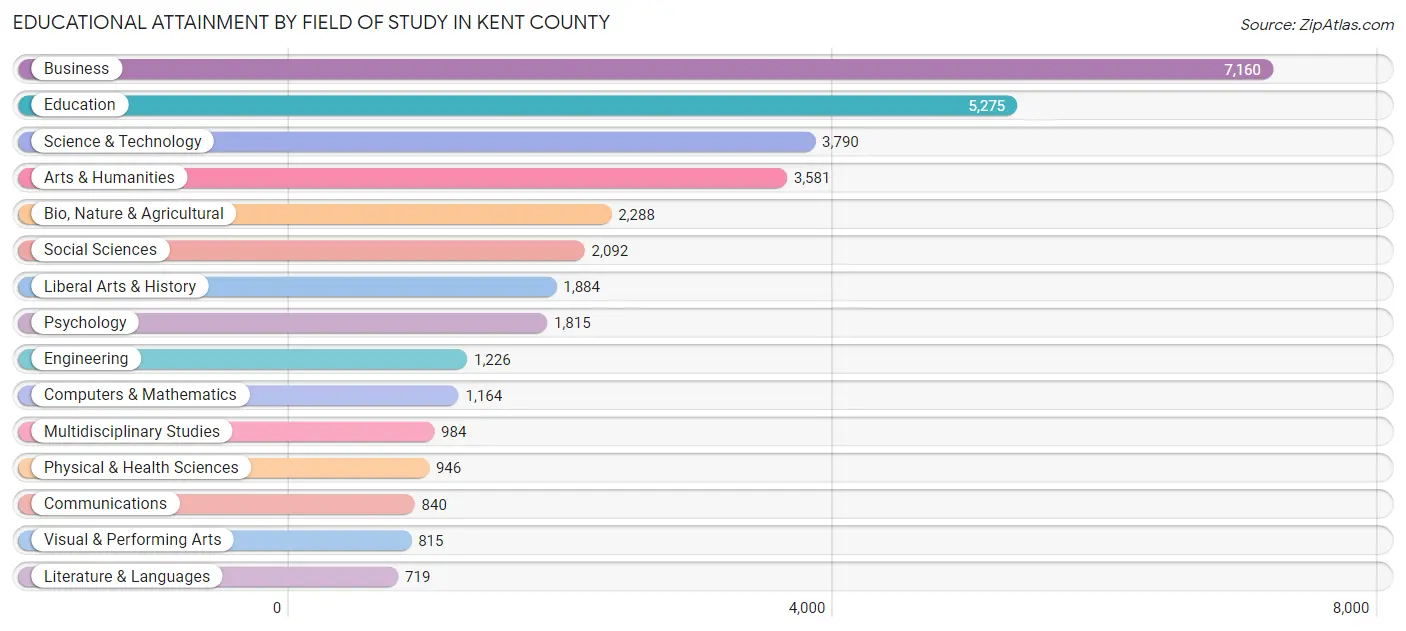
| Field of Study | # Graduates | % Graduates |
| Computers & Mathematics | 1,164 | 3.4% |
| Bio, Nature & Agricultural | 2,288 | 6.6% |
| Physical & Health Sciences | 946 | 2.7% |
| Psychology | 1,815 | 5.2% |
| Social Sciences | 2,092 | 6.0% |
| Engineering | 1,226 | 3.5% |
| Multidisciplinary Studies | 984 | 2.9% |
| Science & Technology | 3,790 | 11.0% |
| Business | 7,160 | 20.7% |
| Education | 5,275 | 15.2% |
| Literature & Languages | 719 | 2.1% |
| Liberal Arts & History | 1,884 | 5.4% |
| Visual & Performing Arts | 815 | 2.4% |
| Communications | 840 | 2.4% |
| Arts & Humanities | 3,581 | 10.4% |
| Total | 34,579 | 100.0% |
Transportation & Commute in Kent County
Vehicle Availability by Sex in Kent County
The most prevalent vehicle ownership categories in Kent County are males with 2 vehicles (17,693, accounting for 41.7%) and females with 2 vehicles (15,237, making up 45.7%).
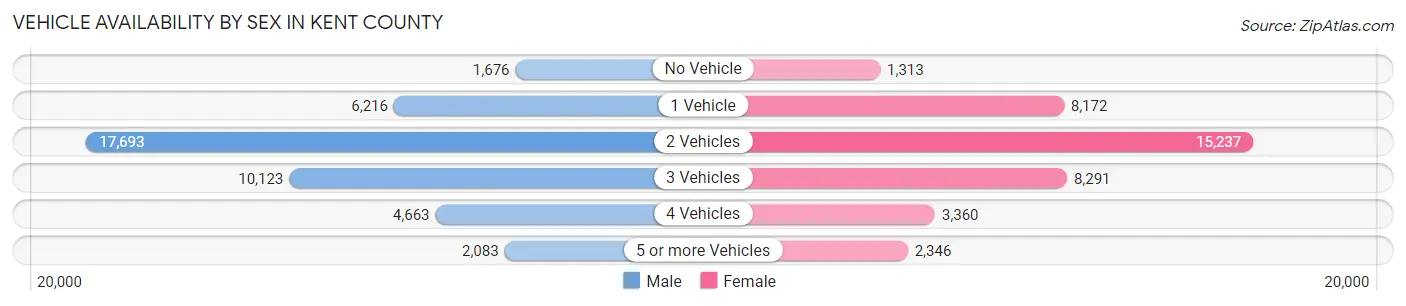
| Vehicles Available | Male | Female |
| No Vehicle | 1,676 (4.0%) | 1,313 (3.4%) |
| 1 Vehicle | 6,216 (14.6%) | 8,172 (21.1%) |
| 2 Vehicles | 17,693 (41.7%) | 15,237 (39.4%) |
| 3 Vehicles | 10,123 (23.8%) | 8,291 (21.4%) |
| 4 Vehicles | 4,663 (11.0%) | 3,360 (8.7%) |
| 5 or more Vehicles | 2,083 (4.9%) | 2,346 (6.1%) |
| Total | 42,454 (100.0%) | 38,719 (100.0%) |
Commute Time in Kent County
The most frequently occuring commute durations in Kent County are 15 to 19 minutes (12,357 commuters, 16.0%), 10 to 14 minutes (11,640 commuters, 15.1%), and 20 to 24 minutes (11,410 commuters, 14.8%).
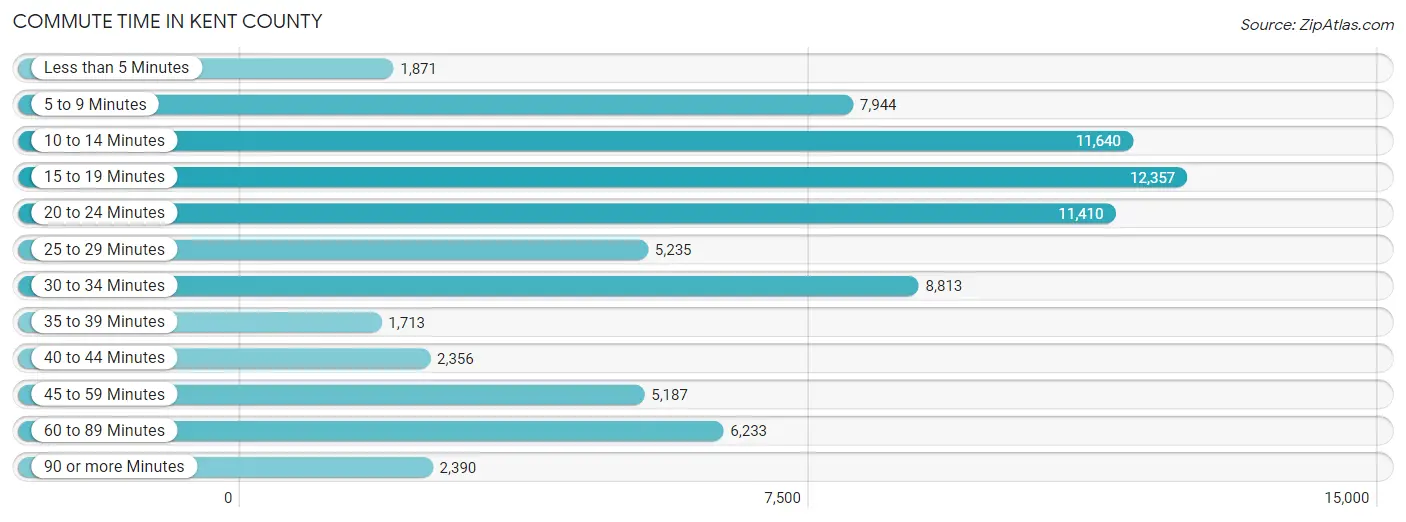
| Commute Time | # Commuters | % Commuters |
| Less than 5 Minutes | 1,871 | 2.4% |
| 5 to 9 Minutes | 7,944 | 10.3% |
| 10 to 14 Minutes | 11,640 | 15.1% |
| 15 to 19 Minutes | 12,357 | 16.0% |
| 20 to 24 Minutes | 11,410 | 14.8% |
| 25 to 29 Minutes | 5,235 | 6.8% |
| 30 to 34 Minutes | 8,813 | 11.4% |
| 35 to 39 Minutes | 1,713 | 2.2% |
| 40 to 44 Minutes | 2,356 | 3.0% |
| 45 to 59 Minutes | 5,187 | 6.7% |
| 60 to 89 Minutes | 6,233 | 8.1% |
| 90 or more Minutes | 2,390 | 3.1% |
Commute Time by Sex in Kent County
The most common commute times in Kent County are 15 to 19 minutes (6,587 commuters, 16.4%) for males and 10 to 14 minutes (6,458 commuters, 17.5%) for females.
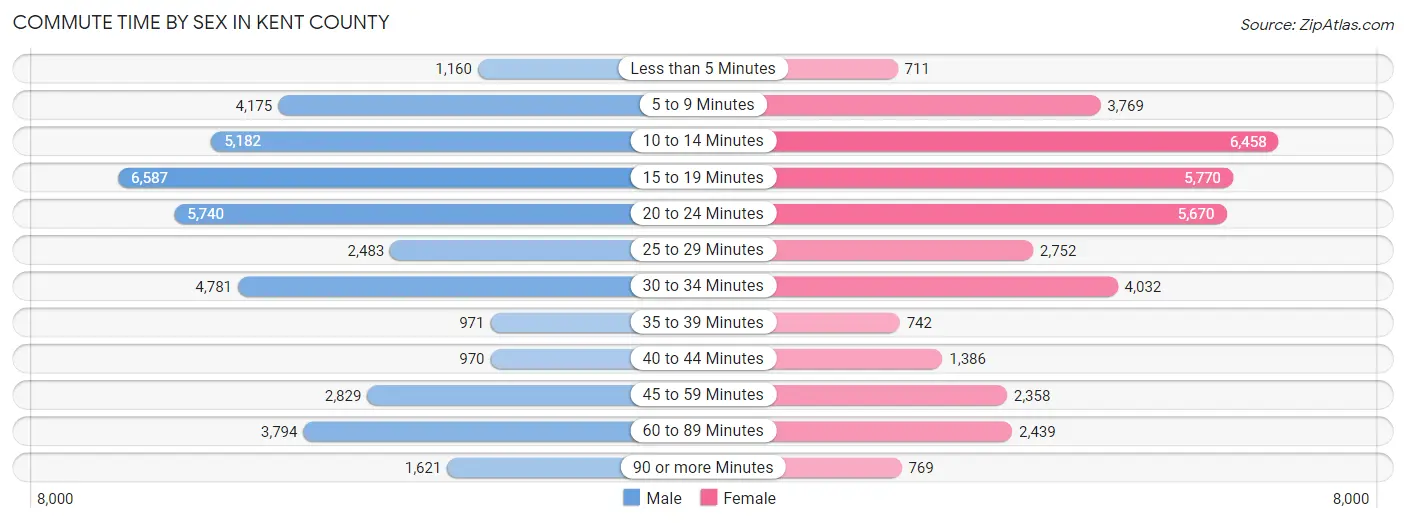
| Commute Time | Male | Female |
| Less than 5 Minutes | 1,160 (2.9%) | 711 (1.9%) |
| 5 to 9 Minutes | 4,175 (10.4%) | 3,769 (10.2%) |
| 10 to 14 Minutes | 5,182 (12.9%) | 6,458 (17.5%) |
| 15 to 19 Minutes | 6,587 (16.4%) | 5,770 (15.7%) |
| 20 to 24 Minutes | 5,740 (14.2%) | 5,670 (15.4%) |
| 25 to 29 Minutes | 2,483 (6.2%) | 2,752 (7.5%) |
| 30 to 34 Minutes | 4,781 (11.9%) | 4,032 (10.9%) |
| 35 to 39 Minutes | 971 (2.4%) | 742 (2.0%) |
| 40 to 44 Minutes | 970 (2.4%) | 1,386 (3.8%) |
| 45 to 59 Minutes | 2,829 (7.0%) | 2,358 (6.4%) |
| 60 to 89 Minutes | 3,794 (9.4%) | 2,439 (6.6%) |
| 90 or more Minutes | 1,621 (4.0%) | 769 (2.1%) |
Time of Departure to Work by Sex in Kent County
The most frequent times of departure to work in Kent County are 7:00 AM to 7:29 AM (6,579, 16.3%) for males and 7:00 AM to 7:29 AM (5,801, 15.7%) for females.
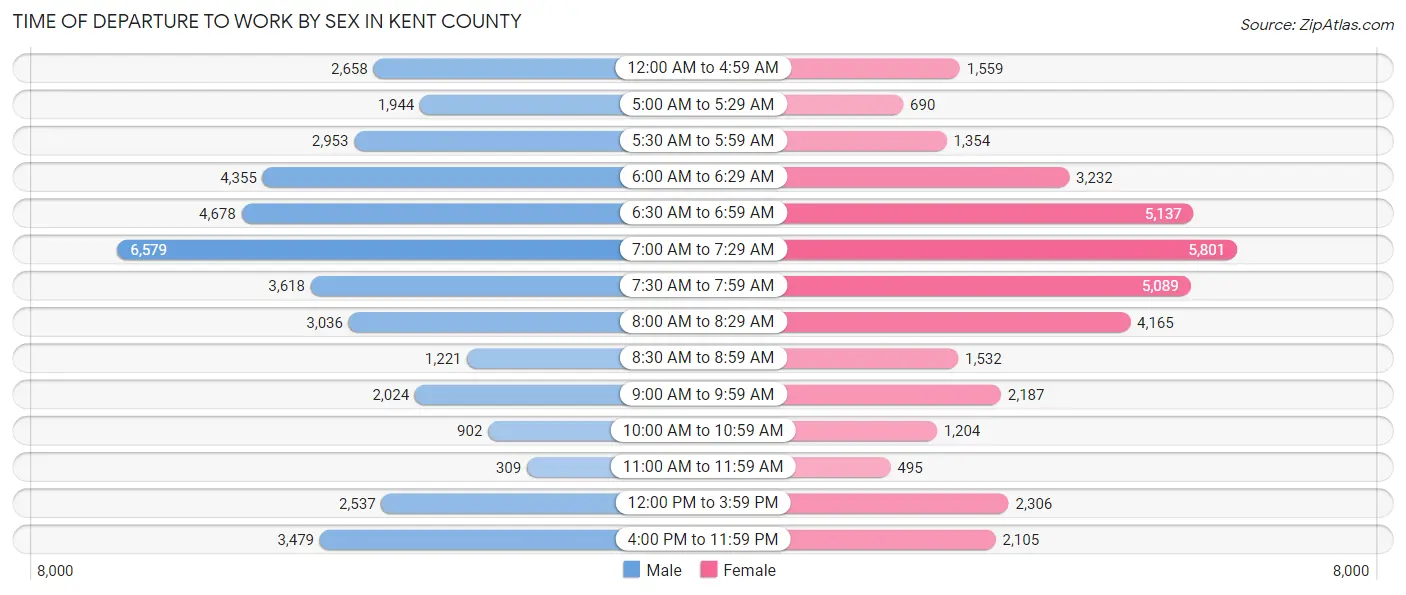
| Time of Departure | Male | Female |
| 12:00 AM to 4:59 AM | 2,658 (6.6%) | 1,559 (4.2%) |
| 5:00 AM to 5:29 AM | 1,944 (4.8%) | 690 (1.9%) |
| 5:30 AM to 5:59 AM | 2,953 (7.3%) | 1,354 (3.7%) |
| 6:00 AM to 6:29 AM | 4,355 (10.8%) | 3,232 (8.8%) |
| 6:30 AM to 6:59 AM | 4,678 (11.6%) | 5,137 (13.9%) |
| 7:00 AM to 7:29 AM | 6,579 (16.3%) | 5,801 (15.7%) |
| 7:30 AM to 7:59 AM | 3,618 (9.0%) | 5,089 (13.8%) |
| 8:00 AM to 8:29 AM | 3,036 (7.5%) | 4,165 (11.3%) |
| 8:30 AM to 8:59 AM | 1,221 (3.0%) | 1,532 (4.2%) |
| 9:00 AM to 9:59 AM | 2,024 (5.0%) | 2,187 (5.9%) |
| 10:00 AM to 10:59 AM | 902 (2.2%) | 1,204 (3.3%) |
| 11:00 AM to 11:59 AM | 309 (0.8%) | 495 (1.3%) |
| 12:00 PM to 3:59 PM | 2,537 (6.3%) | 2,306 (6.3%) |
| 4:00 PM to 11:59 PM | 3,479 (8.6%) | 2,105 (5.7%) |
| Total | 40,293 (100.0%) | 36,856 (100.0%) |
Housing Occupancy in Kent County
Occupancy by Ownership in Kent County
Of the total 68,705 dwellings in Kent County, owner-occupied units account for 48,353 (70.4%), while renter-occupied units make up 20,352 (29.6%).
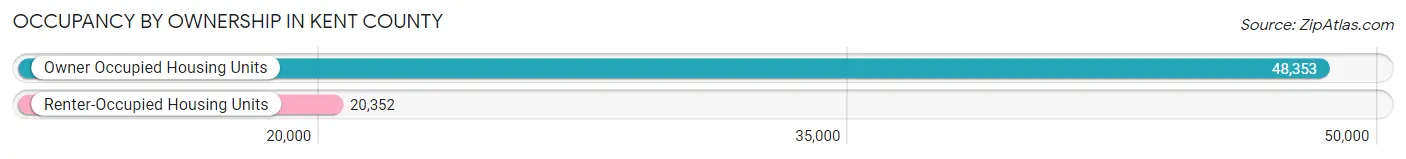
| Occupancy | # Housing Units | % Housing Units |
| Owner Occupied Housing Units | 48,353 | 70.4% |
| Renter-Occupied Housing Units | 20,352 | 29.6% |
| Total Occupied Housing Units | 68,705 | 100.0% |
Occupancy by Household Size in Kent County
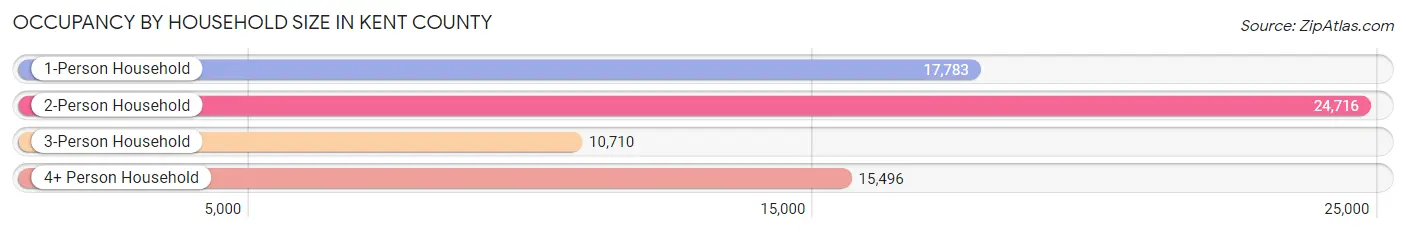
| Household Size | # Housing Units | % Housing Units |
| 1-Person Household | 17,783 | 25.9% |
| 2-Person Household | 24,716 | 36.0% |
| 3-Person Household | 10,710 | 15.6% |
| 4+ Person Household | 15,496 | 22.6% |
| Total Housing Units | 68,705 | 100.0% |
Occupancy by Ownership by Household Size in Kent County
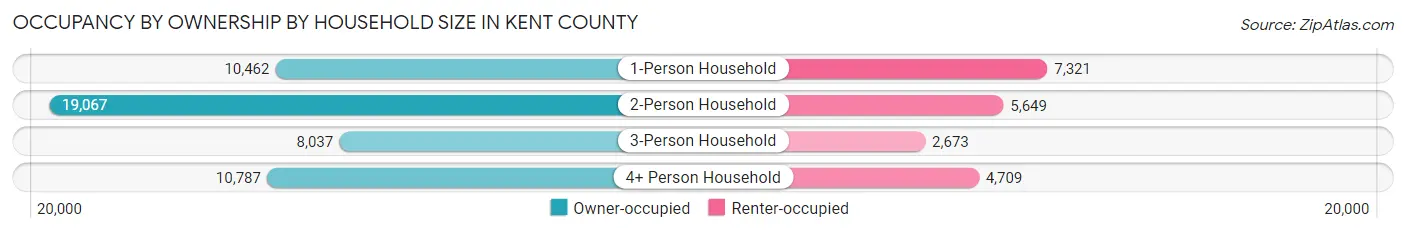
| Household Size | Owner-occupied | Renter-occupied |
| 1-Person Household | 10,462 (58.8%) | 7,321 (41.2%) |
| 2-Person Household | 19,067 (77.1%) | 5,649 (22.9%) |
| 3-Person Household | 8,037 (75.0%) | 2,673 (25.0%) |
| 4+ Person Household | 10,787 (69.6%) | 4,709 (30.4%) |
| Total Housing Units | 48,353 (70.4%) | 20,352 (29.6%) |
Occupancy by Educational Attainment in Kent County
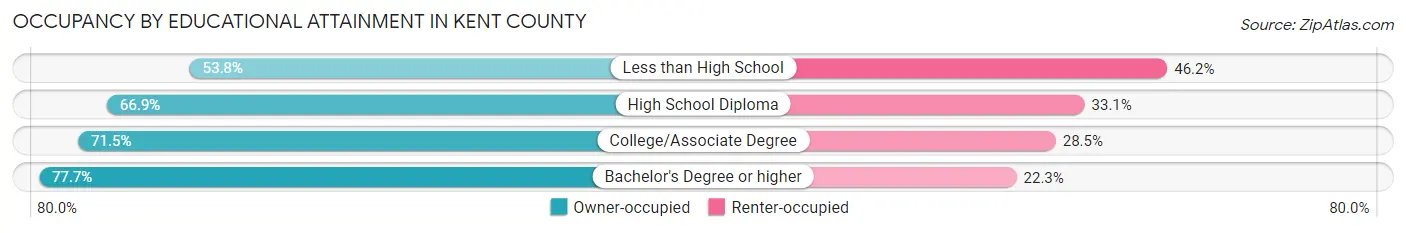
| Household Size | Owner-occupied | Renter-occupied |
| Less than High School | 3,505 (53.8%) | 3,007 (46.2%) |
| High School Diploma | 12,851 (66.9%) | 6,348 (33.1%) |
| College/Associate Degree | 16,324 (71.5%) | 6,504 (28.5%) |
| Bachelor's Degree or higher | 15,673 (77.7%) | 4,493 (22.3%) |
Occupancy by Age of Householder in Kent County
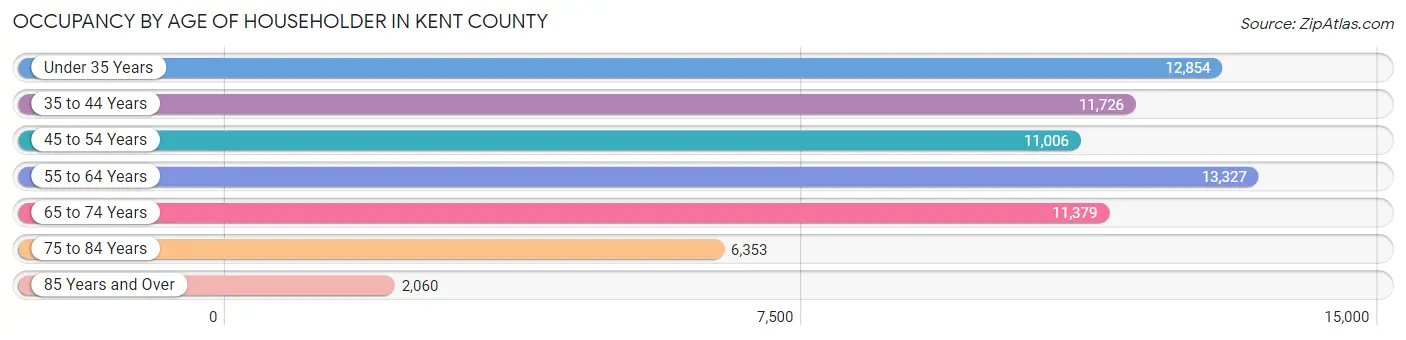
| Age Bracket | # Households | % Households |
| Under 35 Years | 12,854 | 18.7% |
| 35 to 44 Years | 11,726 | 17.1% |
| 45 to 54 Years | 11,006 | 16.0% |
| 55 to 64 Years | 13,327 | 19.4% |
| 65 to 74 Years | 11,379 | 16.6% |
| 75 to 84 Years | 6,353 | 9.2% |
| 85 Years and Over | 2,060 | 3.0% |
| Total | 68,705 | 100.0% |
Housing Finances in Kent County
Median Income by Occupancy in Kent County
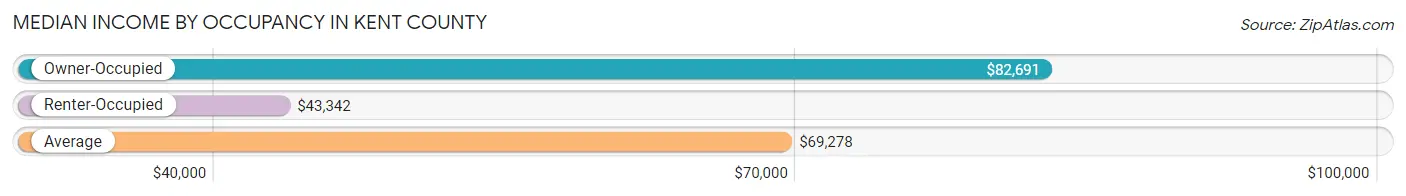
| Occupancy Type | # Households | Median Income |
| Owner-Occupied | 48,353 (70.4%) | $82,691 |
| Renter-Occupied | 20,352 (29.6%) | $43,342 |
| Average | 68,705 (100.0%) | $69,278 |
Occupancy by Householder Income Bracket in Kent County
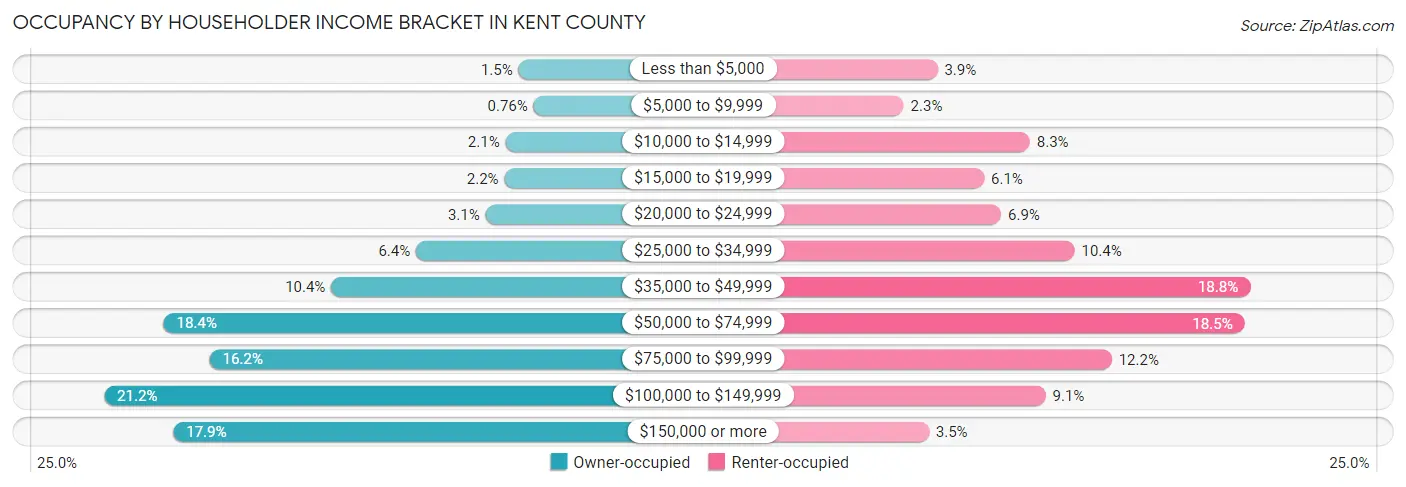
| Income Bracket | Owner-occupied | Renter-occupied |
| Less than $5,000 | 717 (1.5%) | 793 (3.9%) |
| $5,000 to $9,999 | 368 (0.8%) | 467 (2.3%) |
| $10,000 to $14,999 | 1,014 (2.1%) | 1,689 (8.3%) |
| $15,000 to $19,999 | 1,040 (2.1%) | 1,245 (6.1%) |
| $20,000 to $24,999 | 1,475 (3.0%) | 1,410 (6.9%) |
| $25,000 to $34,999 | 3,075 (6.4%) | 2,122 (10.4%) |
| $35,000 to $49,999 | 5,028 (10.4%) | 3,823 (18.8%) |
| $50,000 to $74,999 | 8,888 (18.4%) | 3,769 (18.5%) |
| $75,000 to $99,999 | 7,828 (16.2%) | 2,482 (12.2%) |
| $100,000 to $149,999 | 10,257 (21.2%) | 1,841 (9.0%) |
| $150,000 or more | 8,663 (17.9%) | 711 (3.5%) |
| Total | 48,353 (100.0%) | 20,352 (100.0%) |
Monthly Housing Cost Tiers in Kent County
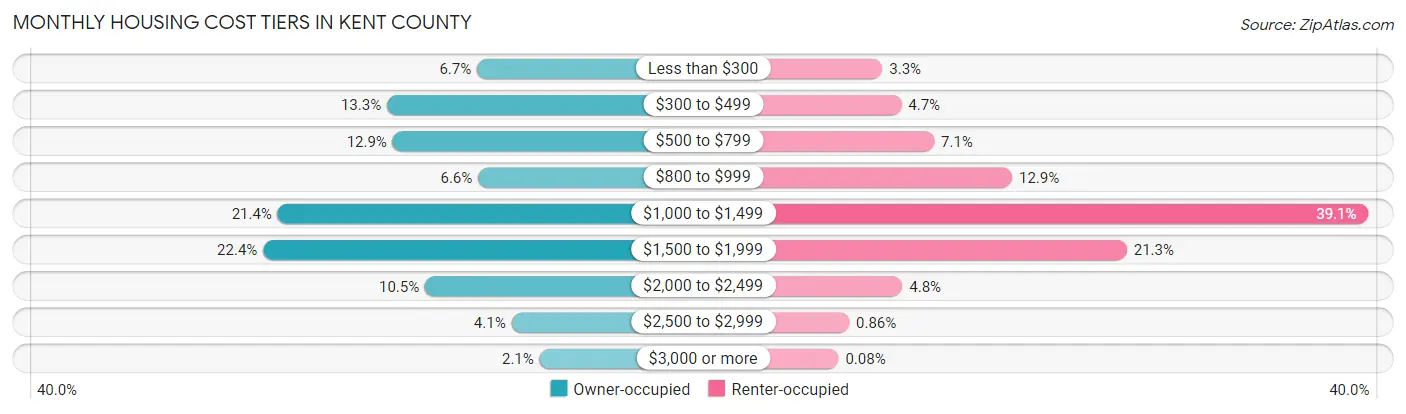
| Monthly Cost | Owner-occupied | Renter-occupied |
| Less than $300 | 3,232 (6.7%) | 673 (3.3%) |
| $300 to $499 | 6,436 (13.3%) | 959 (4.7%) |
| $500 to $799 | 6,234 (12.9%) | 1,449 (7.1%) |
| $800 to $999 | 3,190 (6.6%) | 2,617 (12.9%) |
| $1,000 to $1,499 | 10,329 (21.4%) | 7,958 (39.1%) |
| $1,500 to $1,999 | 10,844 (22.4%) | 4,336 (21.3%) |
| $2,000 to $2,499 | 5,083 (10.5%) | 972 (4.8%) |
| $2,500 to $2,999 | 2,003 (4.1%) | 176 (0.9%) |
| $3,000 or more | 1,002 (2.1%) | 16 (0.1%) |
| Total | 48,353 (100.0%) | 20,352 (100.0%) |
Physical Housing Characteristics in Kent County
Housing Structures in Kent County

| Structure Type | # Housing Units | % Housing Units |
| Single Unit, Detached | 45,613 | 66.4% |
| Single Unit, Attached | 6,245 | 9.1% |
| 2 Unit Apartments | 1,162 | 1.7% |
| 3 or 4 Unit Apartments | 1,107 | 1.6% |
| 5 to 9 Unit Apartments | 1,983 | 2.9% |
| 10 or more Apartments | 5,169 | 7.5% |
| Mobile Home / Other | 7,426 | 10.8% |
| Total | 68,705 | 100.0% |
Housing Structures by Occupancy in Kent County
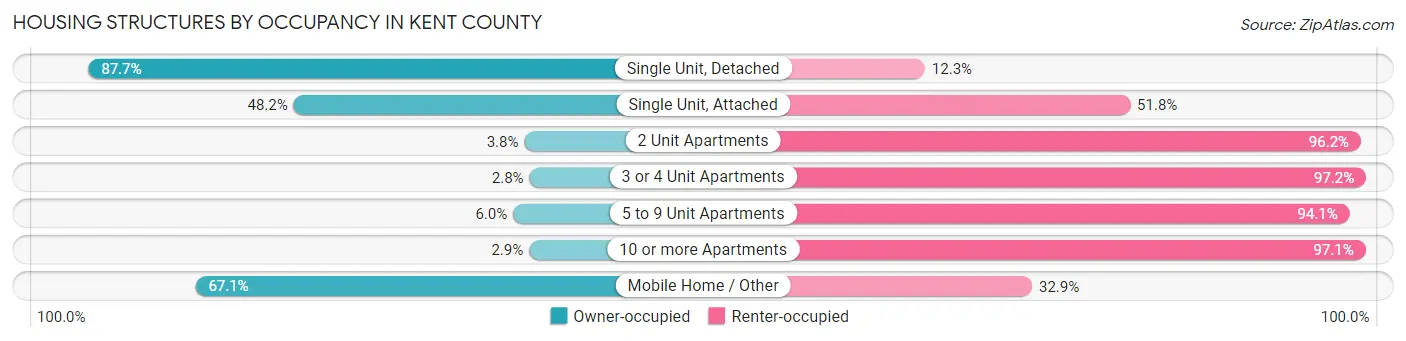
| Structure Type | Owner-occupied | Renter-occupied |
| Single Unit, Detached | 40,017 (87.7%) | 5,596 (12.3%) |
| Single Unit, Attached | 3,011 (48.2%) | 3,234 (51.8%) |
| 2 Unit Apartments | 44 (3.8%) | 1,118 (96.2%) |
| 3 or 4 Unit Apartments | 31 (2.8%) | 1,076 (97.2%) |
| 5 to 9 Unit Apartments | 118 (5.9%) | 1,865 (94.1%) |
| 10 or more Apartments | 149 (2.9%) | 5,020 (97.1%) |
| Mobile Home / Other | 4,983 (67.1%) | 2,443 (32.9%) |
| Total | 48,353 (70.4%) | 20,352 (29.6%) |
Housing Structures by Number of Rooms in Kent County
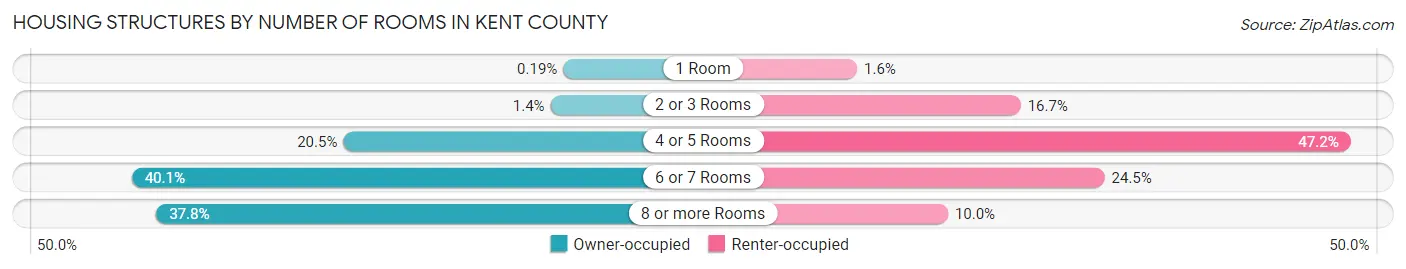
| Number of Rooms | Owner-occupied | Renter-occupied |
| 1 Room | 90 (0.2%) | 324 (1.6%) |
| 2 or 3 Rooms | 661 (1.4%) | 3,402 (16.7%) |
| 4 or 5 Rooms | 9,929 (20.5%) | 9,610 (47.2%) |
| 6 or 7 Rooms | 19,387 (40.1%) | 4,982 (24.5%) |
| 8 or more Rooms | 18,286 (37.8%) | 2,034 (10.0%) |
| Total | 48,353 (100.0%) | 20,352 (100.0%) |
Housing Structure by Heating Type in Kent County
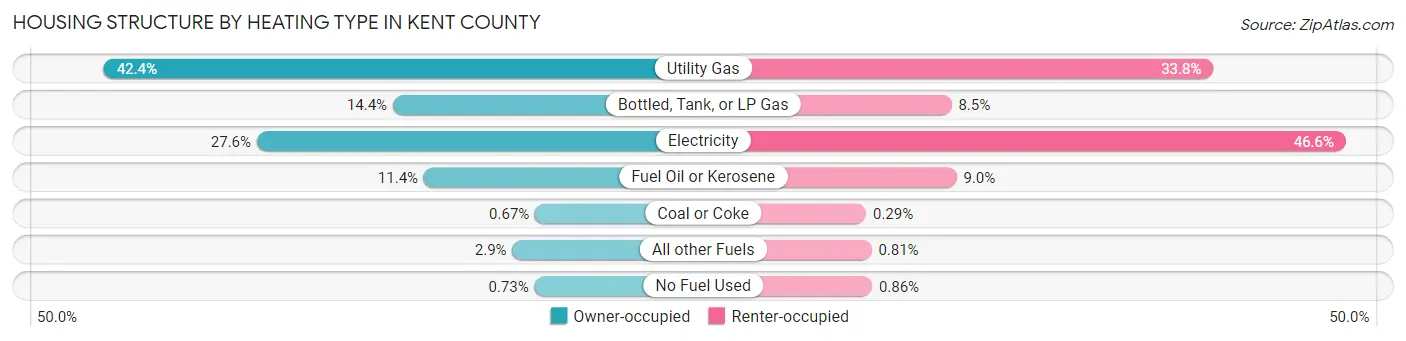
| Heating Type | Owner-occupied | Renter-occupied |
| Utility Gas | 20,477 (42.3%) | 6,885 (33.8%) |
| Bottled, Tank, or LP Gas | 6,967 (14.4%) | 1,739 (8.5%) |
| Electricity | 13,326 (27.6%) | 9,492 (46.6%) |
| Fuel Oil or Kerosene | 5,520 (11.4%) | 1,837 (9.0%) |
| Coal or Coke | 324 (0.7%) | 59 (0.3%) |
| All other Fuels | 1,387 (2.9%) | 164 (0.8%) |
| No Fuel Used | 352 (0.7%) | 176 (0.9%) |
| Total | 48,353 (100.0%) | 20,352 (100.0%) |
Household Vehicle Usage in Kent County
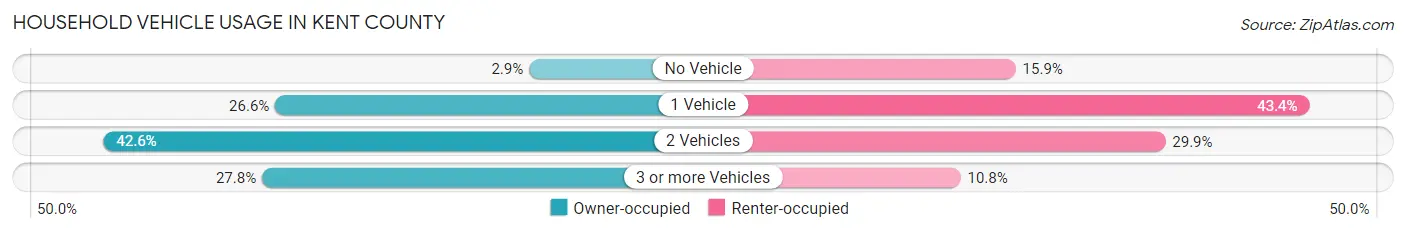
| Vehicles per Household | Owner-occupied | Renter-occupied |
| No Vehicle | 1,407 (2.9%) | 3,245 (15.9%) |
| 1 Vehicle | 12,869 (26.6%) | 8,823 (43.3%) |
| 2 Vehicles | 20,616 (42.6%) | 6,088 (29.9%) |
| 3 or more Vehicles | 13,461 (27.8%) | 2,196 (10.8%) |
| Total | 48,353 (100.0%) | 20,352 (100.0%) |
Real Estate & Mortgages in Kent County
Real Estate and Mortgage Overview in Kent County
| Characteristic | Without Mortgage | With Mortgage |
| Housing Units | 16,570 | 31,783 |
| Median Property Value | $241,100 | $284,000 |
| Median Household Income | $60,490 | $6,786 |
| Monthly Housing Costs | $462 | $968 |
| Real Estate Taxes | $1,057 | $1,251 |
Property Value by Mortgage Status in Kent County
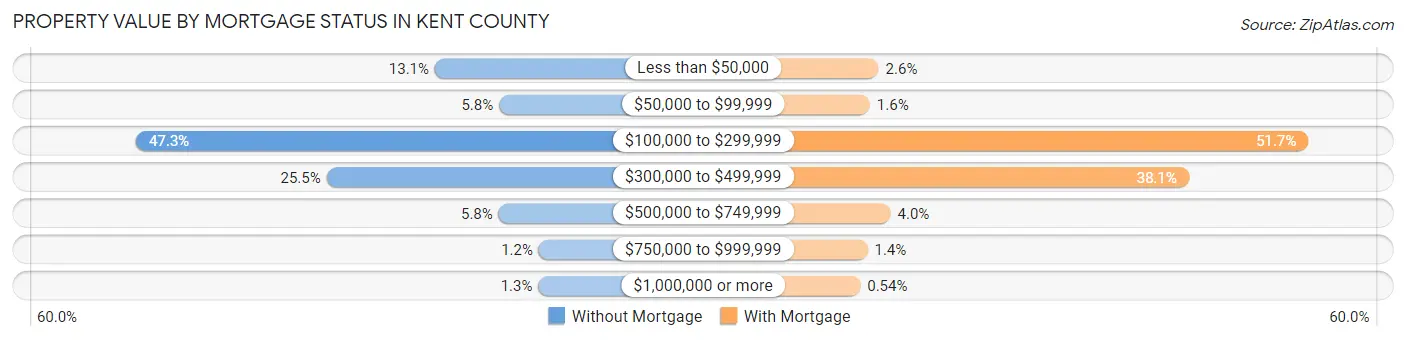
| Property Value | Without Mortgage | With Mortgage |
| Less than $50,000 | 2,172 (13.1%) | 838 (2.6%) |
| $50,000 to $99,999 | 958 (5.8%) | 521 (1.6%) |
| $100,000 to $299,999 | 7,833 (47.3%) | 16,441 (51.7%) |
| $300,000 to $499,999 | 4,223 (25.5%) | 12,104 (38.1%) |
| $500,000 to $749,999 | 966 (5.8%) | 1,273 (4.0%) |
| $750,000 to $999,999 | 204 (1.2%) | 434 (1.4%) |
| $1,000,000 or more | 214 (1.3%) | 172 (0.5%) |
| Total | 16,570 (100.0%) | 31,783 (100.0%) |
Household Income by Mortgage Status in Kent County
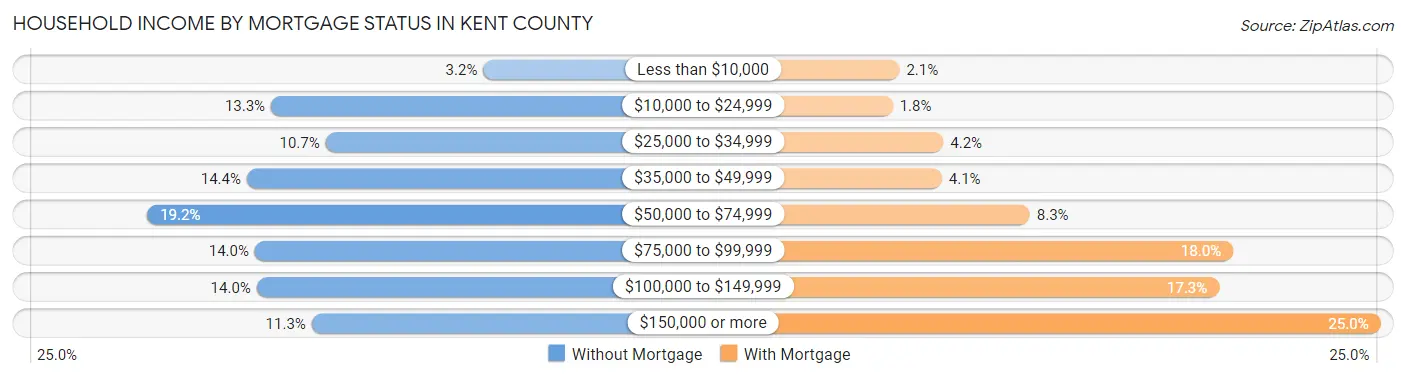
| Household Income | Without Mortgage | With Mortgage |
| Less than $10,000 | 524 (3.2%) | 665 (2.1%) |
| $10,000 to $24,999 | 2,199 (13.3%) | 561 (1.8%) |
| $25,000 to $34,999 | 1,768 (10.7%) | 1,330 (4.2%) |
| $35,000 to $49,999 | 2,389 (14.4%) | 1,307 (4.1%) |
| $50,000 to $74,999 | 3,175 (19.2%) | 2,639 (8.3%) |
| $75,000 to $99,999 | 2,327 (14.0%) | 5,713 (18.0%) |
| $100,000 to $149,999 | 2,311 (14.0%) | 5,501 (17.3%) |
| $150,000 or more | 1,877 (11.3%) | 7,946 (25.0%) |
| Total | 16,570 (100.0%) | 31,783 (100.0%) |
Property Value to Household Income Ratio in Kent County
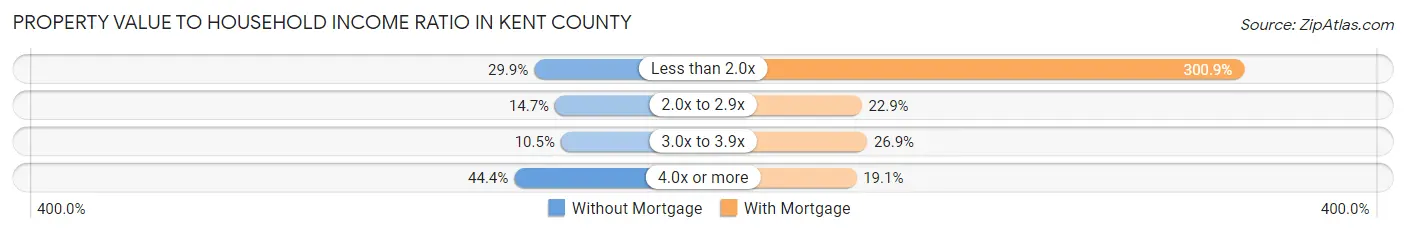
| Value-to-Income Ratio | Without Mortgage | With Mortgage |
| Less than 2.0x | 4,959 (29.9%) | 95,642 (300.9%) |
| 2.0x to 2.9x | 2,441 (14.7%) | 7,274 (22.9%) |
| 3.0x to 3.9x | 1,747 (10.5%) | 8,547 (26.9%) |
| 4.0x or more | 7,356 (44.4%) | 6,073 (19.1%) |
| Total | 16,570 (100.0%) | 31,783 (100.0%) |
Real Estate Taxes by Mortgage Status in Kent County
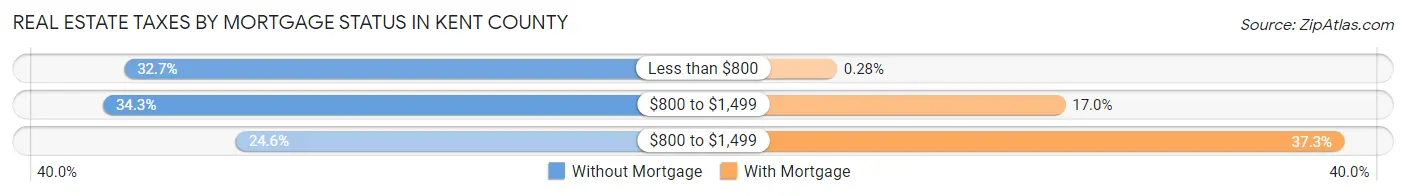
| Property Taxes | Without Mortgage | With Mortgage |
| Less than $800 | 5,421 (32.7%) | 90 (0.3%) |
| $800 to $1,499 | 5,678 (34.3%) | 5,393 (17.0%) |
| $800 to $1,499 | 4,071 (24.6%) | 11,861 (37.3%) |
| Total | 16,570 (100.0%) | 31,783 (100.0%) |
Health & Disability in Kent County
Health Insurance Coverage by Age in Kent County
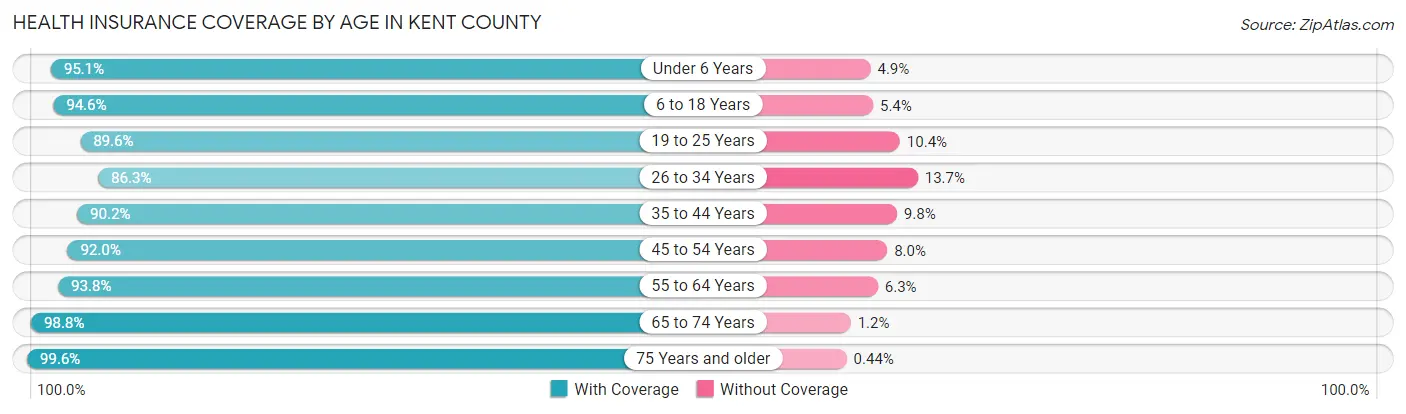
| Age Bracket | With Coverage | Without Coverage |
| Under 6 Years | 13,024 (95.1%) | 669 (4.9%) |
| 6 to 18 Years | 29,458 (94.6%) | 1,669 (5.4%) |
| 19 to 25 Years | 14,706 (89.6%) | 1,701 (10.4%) |
| 26 to 34 Years | 17,912 (86.3%) | 2,846 (13.7%) |
| 35 to 44 Years | 19,015 (90.2%) | 2,069 (9.8%) |
| 45 to 54 Years | 19,195 (92.0%) | 1,670 (8.0%) |
| 55 to 64 Years | 21,976 (93.8%) | 1,466 (6.2%) |
| 65 to 74 Years | 18,447 (98.8%) | 224 (1.2%) |
| 75 Years and older | 12,713 (99.6%) | 56 (0.4%) |
| Total | 166,446 (93.1%) | 12,370 (6.9%) |
Health Insurance Coverage by Citizenship Status in Kent County

| Citizenship Status | With Coverage | Without Coverage |
| Native Born | 13,024 (95.1%) | 669 (4.9%) |
| Foreign Born, Citizen | 29,458 (94.6%) | 1,669 (5.4%) |
| Foreign Born, not a Citizen | 14,706 (89.6%) | 1,701 (10.4%) |
Health Insurance Coverage by Household Income in Kent County
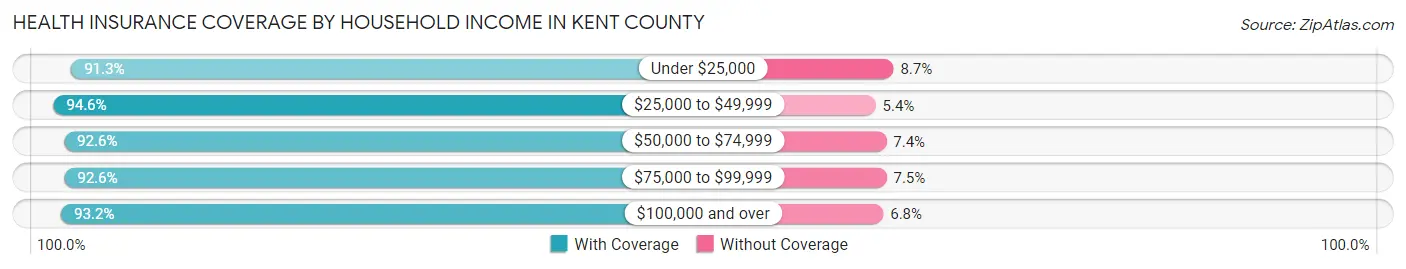
| Household Income | With Coverage | Without Coverage |
| Under $25,000 | 17,537 (91.3%) | 1,680 (8.7%) |
| $25,000 to $49,999 | 26,811 (94.6%) | 1,529 (5.4%) |
| $50,000 to $74,999 | 27,232 (92.6%) | 2,179 (7.4%) |
| $75,000 to $99,999 | 25,678 (92.5%) | 2,068 (7.4%) |
| $100,000 and over | 65,767 (93.2%) | 4,832 (6.8%) |
Public vs Private Health Insurance Coverage by Age in Kent County
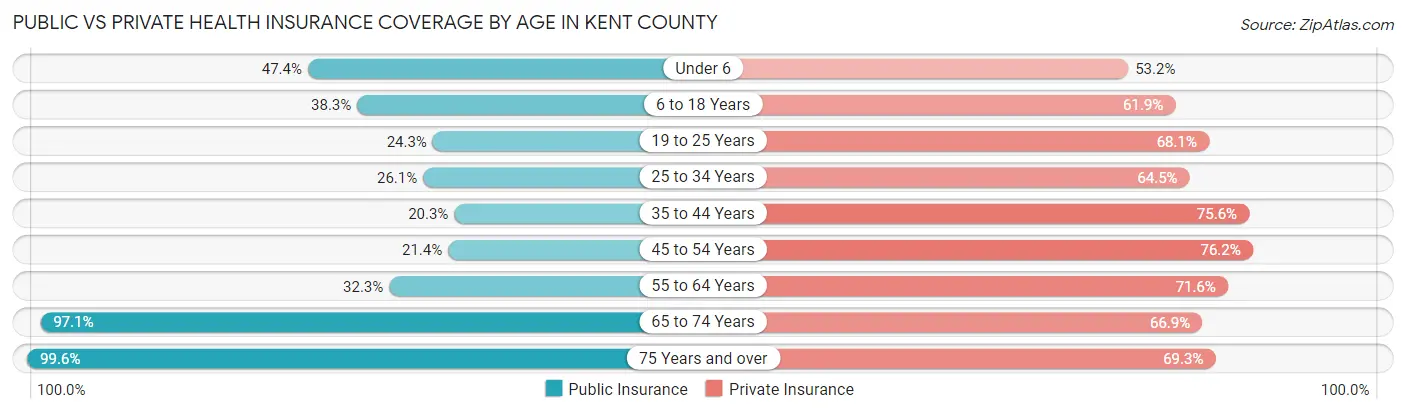
| Age Bracket | Public Insurance | Private Insurance |
| Under 6 | 6,494 (47.4%) | 7,281 (53.2%) |
| 6 to 18 Years | 11,914 (38.3%) | 19,259 (61.9%) |
| 19 to 25 Years | 3,979 (24.2%) | 11,173 (68.1%) |
| 25 to 34 Years | 5,408 (26.1%) | 13,393 (64.5%) |
| 35 to 44 Years | 4,272 (20.3%) | 15,932 (75.6%) |
| 45 to 54 Years | 4,468 (21.4%) | 15,906 (76.2%) |
| 55 to 64 Years | 7,580 (32.3%) | 16,788 (71.6%) |
| 65 to 74 Years | 18,128 (97.1%) | 12,484 (66.9%) |
| 75 Years and over | 12,712 (99.6%) | 8,850 (69.3%) |
| Total | 74,955 (41.9%) | 121,066 (67.7%) |
Disability Status by Sex by Age in Kent County
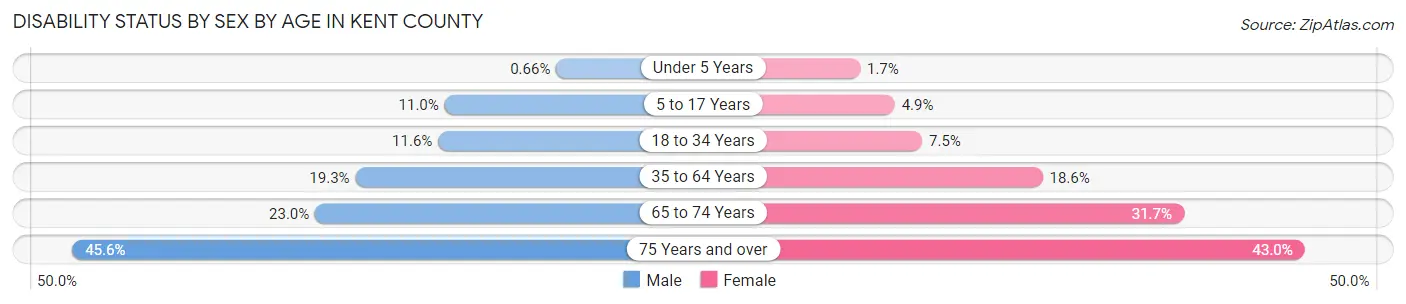
| Age Bracket | Male | Female |
| Under 5 Years | 37 (0.7%) | 91 (1.7%) |
| 5 to 17 Years | 1,722 (11.0%) | 741 (4.9%) |
| 18 to 34 Years | 2,264 (11.6%) | 1,550 (7.4%) |
| 35 to 64 Years | 5,936 (19.3%) | 6,455 (18.6%) |
| 65 to 74 Years | 1,953 (23.0%) | 3,236 (31.7%) |
| 75 Years and over | 2,546 (45.6%) | 3,085 (42.9%) |
Disability Class by Sex by Age in Kent County
Disability Class: Hearing Difficulty
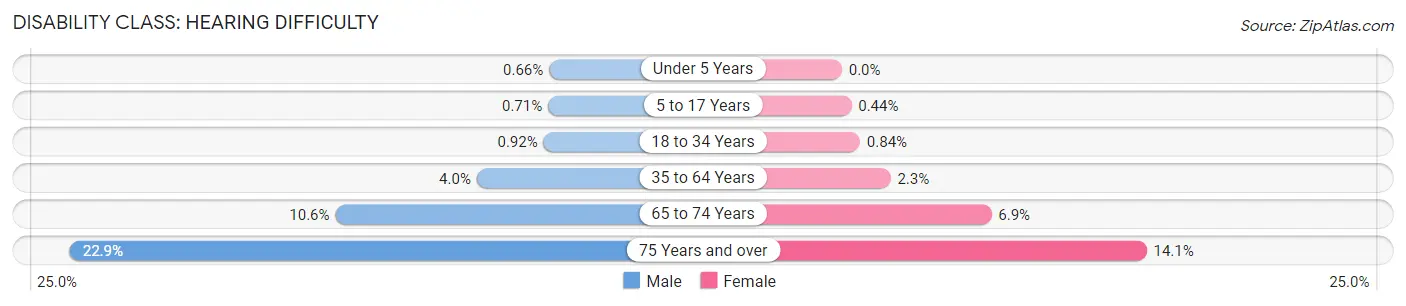
| Age Bracket | Male | Female |
| Under 5 Years | 37 (0.7%) | 0 (0.0%) |
| 5 to 17 Years | 111 (0.7%) | 66 (0.4%) |
| 18 to 34 Years | 179 (0.9%) | 175 (0.8%) |
| 35 to 64 Years | 1,235 (4.0%) | 782 (2.3%) |
| 65 to 74 Years | 897 (10.6%) | 707 (6.9%) |
| 75 Years and over | 1,279 (22.9%) | 1,016 (14.1%) |
Disability Class: Vision Difficulty
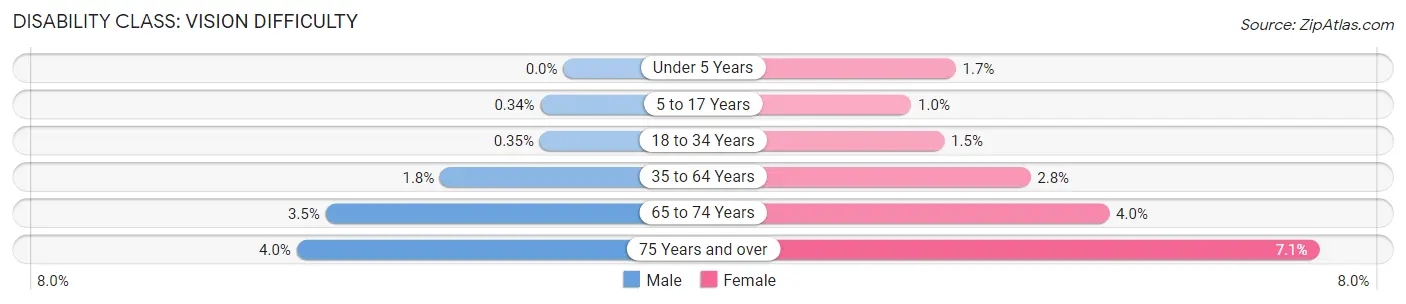
| Age Bracket | Male | Female |
| Under 5 Years | 0 (0.0%) | 91 (1.7%) |
| 5 to 17 Years | 53 (0.3%) | 156 (1.0%) |
| 18 to 34 Years | 69 (0.4%) | 317 (1.5%) |
| 35 to 64 Years | 562 (1.8%) | 971 (2.8%) |
| 65 to 74 Years | 299 (3.5%) | 405 (4.0%) |
| 75 Years and over | 221 (4.0%) | 509 (7.1%) |
Disability Class: Cognitive Difficulty
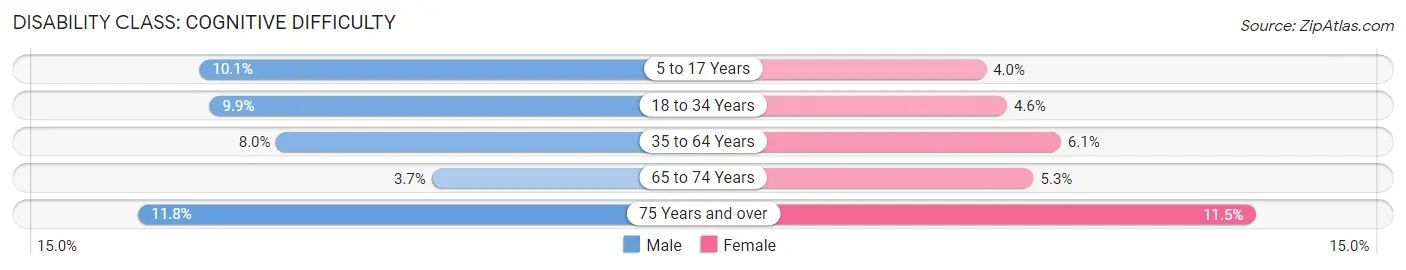
| Age Bracket | Male | Female |
| 5 to 17 Years | 1,583 (10.1%) | 607 (4.0%) |
| 18 to 34 Years | 1,919 (9.9%) | 958 (4.6%) |
| 35 to 64 Years | 2,456 (8.0%) | 2,112 (6.1%) |
| 65 to 74 Years | 311 (3.7%) | 544 (5.3%) |
| 75 Years and over | 661 (11.8%) | 827 (11.5%) |
Disability Class: Ambulatory Difficulty
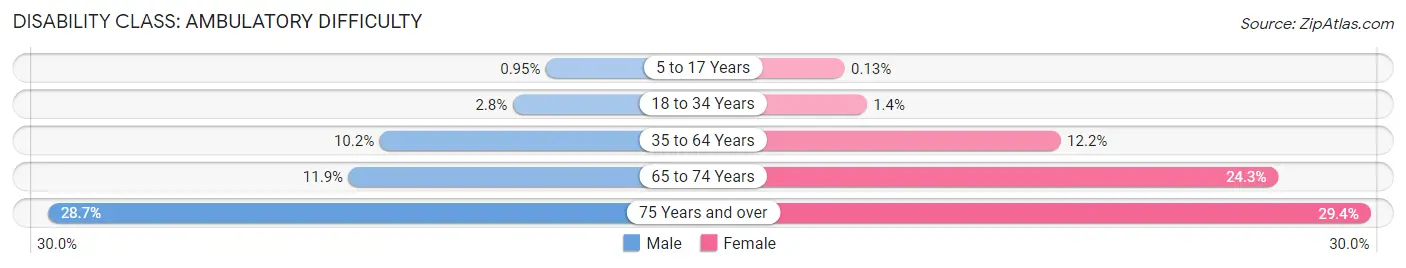
| Age Bracket | Male | Female |
| 5 to 17 Years | 149 (0.9%) | 19 (0.1%) |
| 18 to 34 Years | 546 (2.8%) | 283 (1.4%) |
| 35 to 64 Years | 3,139 (10.2%) | 4,213 (12.2%) |
| 65 to 74 Years | 1,012 (11.9%) | 2,477 (24.3%) |
| 75 Years and over | 1,604 (28.7%) | 2,115 (29.4%) |
Disability Class: Self-Care Difficulty
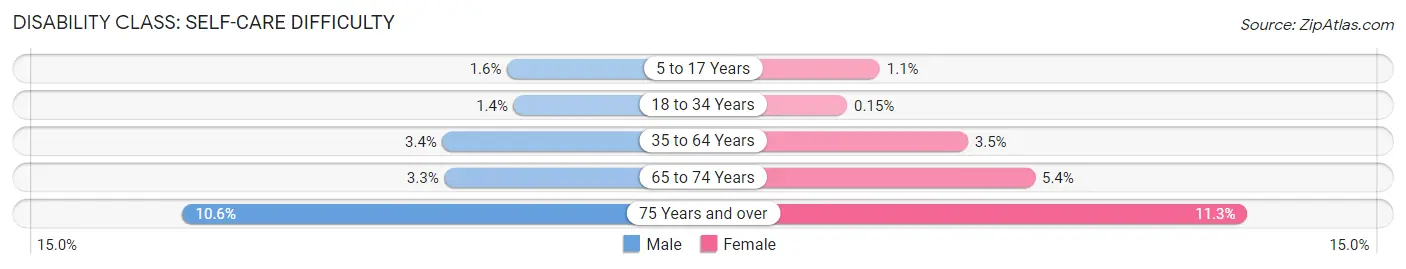
| Age Bracket | Male | Female |
| 5 to 17 Years | 243 (1.6%) | 160 (1.1%) |
| 18 to 34 Years | 269 (1.4%) | 31 (0.2%) |
| 35 to 64 Years | 1,033 (3.4%) | 1,217 (3.5%) |
| 65 to 74 Years | 281 (3.3%) | 548 (5.4%) |
| 75 Years and over | 592 (10.6%) | 811 (11.3%) |
Technology Access in Kent County
Computing Device Access in Kent County
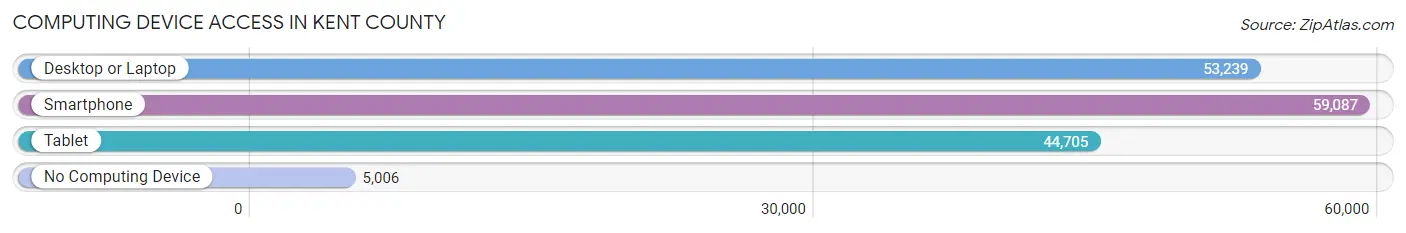
| Device Type | # Households | % Households |
| Desktop or Laptop | 53,239 | 77.5% |
| Smartphone | 59,087 | 86.0% |
| Tablet | 44,705 | 65.1% |
| No Computing Device | 5,006 | 7.3% |
| Total | 68,705 | 100.0% |
Internet Access in Kent County

| Internet Type | # Households | % Households |
| Dial-Up Internet | 138 | 0.2% |
| Broadband Home | 49,260 | 71.7% |
| Cellular Data Only | 9,370 | 13.6% |
| Satellite Internet | 4,290 | 6.2% |
| No Internet | 7,314 | 10.6% |
| Total | 68,705 | 100.0% |
Kent County Summary
Kent County, Delaware is located in the central part of the state and is the second most populous county in Delaware. It is bordered by New Castle County to the north, Sussex County to the south, and the Delaware Bay to the east. The county seat is Dover, the state capital.
History
The area that is now Kent County was originally inhabited by the Nanticoke Indians. The first European settlers arrived in the area in 1631, and the county was officially established in 1682. The county was named after the county of Kent in England.
During the American Revolution, Kent County was a major center of activity. The county was the site of the Battle of Cooch's Bridge, the only Revolutionary War battle fought in Delaware.
In the 19th century, Kent County was an important agricultural center. The county was home to many large farms, and the area was known for its production of wheat, corn, and other crops.
Geography
Kent County covers an area of 843 square miles and is located in the central part of the state. The county is bordered by New Castle County to the north, Sussex County to the south, and the Delaware Bay to the east. The county is mostly flat, with some rolling hills in the northern part of the county. The county is drained by the St. Jones River and its tributaries.
The county is home to several state parks, including Killens Pond State Park, Lums Pond State Park, and Trap Pond State Park.
Economy
The economy of Kent County is largely based on agriculture and manufacturing. The county is home to several large farms, and the area is known for its production of wheat, corn, and other crops. The county is also home to several manufacturing companies, including the Dover Air Force Base, which is the largest employer in the county.
The county is also home to several large retail stores including Walmart Target and Home Depot
Demographics
As of the 2010 census, the population of Kent County was 162,310. The population is made up of a diverse mix of races and ethnicities. The largest racial group is White (77.3%), followed by African American (14.2%), Hispanic or Latino (4.7%), and Asian (2.3%).
The median household income in Kent County is $60,945, and the median home value is $219,400. The county has a poverty rate of 11.2%.
Conclusion
Kent County, Delaware is a diverse and vibrant county located in the central part of the state. The county is home to a large agricultural industry, as well as several manufacturing companies and retail stores. The population of the county is made up of a diverse mix of races and ethnicities, and the median household income is above the national average. Kent County is an important part of the state of Delaware and is an important contributor to the state's economy.
Common Questions
What is the Total Population of Kent County?
Total Population of Kent County is 182,400.
What is the Total Male Population of Kent County?
Total Male Population of Kent County is 88,272.
What is the Total Female Population of Kent County?
Total Female Population of Kent County is 94,128.
What is the Ratio of Males per 100 Females in Kent County?
There are 93.78 Males per 100 Females in Kent County.
What is the Ratio of Females per 100 Males in Kent County?
There are 106.63 Females per 100 Males in Kent County.
What is the Median Population Age in Kent County?
Median Population Age in Kent County is 38.5 Years.
What is the Average Family Size in Kent County
Average Family Size in Kent County is 3.1 People.
What is the Average Household Size in Kent County
Average Household Size in Kent County is 2.6 People.
What is Per Capita Income in Kent County?
Per Capita income in Kent County is $33,191.
What is the Median Family Income in Kent County?
Median Family Income in Kent County is $82,307.
What is the Median Household income in Kent County?
Median Household Income in Kent County is $69,278.
What is Income or Wage Gap in Kent County?
Income or Wage Gap in Kent County is 24.4%.
Women in Kent County earn 75.6 cents for every dollar earned by a man.
What is Family Income Deficit in Kent County?
Family Income Deficit in Kent County is $10,196.
Families that are below poverty line in Kent County earn $10,196 less on average than the poverty threshold level.
What is Inequality or Gini Index in Kent County?
Inequality or Gini Index in Kent County is 0.41.
How Large is the Labor Force in Kent County?
There are 89,585 People in the Labor Forcein in Kent County.
What is the Percentage of People in the Labor Force in Kent County?
61.6% of People are in the Labor Force in Kent County.
What is the Unemployment Rate in Kent County?
Unemployment Rate in Kent County is 6.0%.