Zip Codes with the Highest Percentage of Population Employed in Food Preparation & Serving in Grand Junction, CO
RELATED REPORTS & OPTIONS
Food Preparation & Serving
Grand Junction
Compare Zip Codes
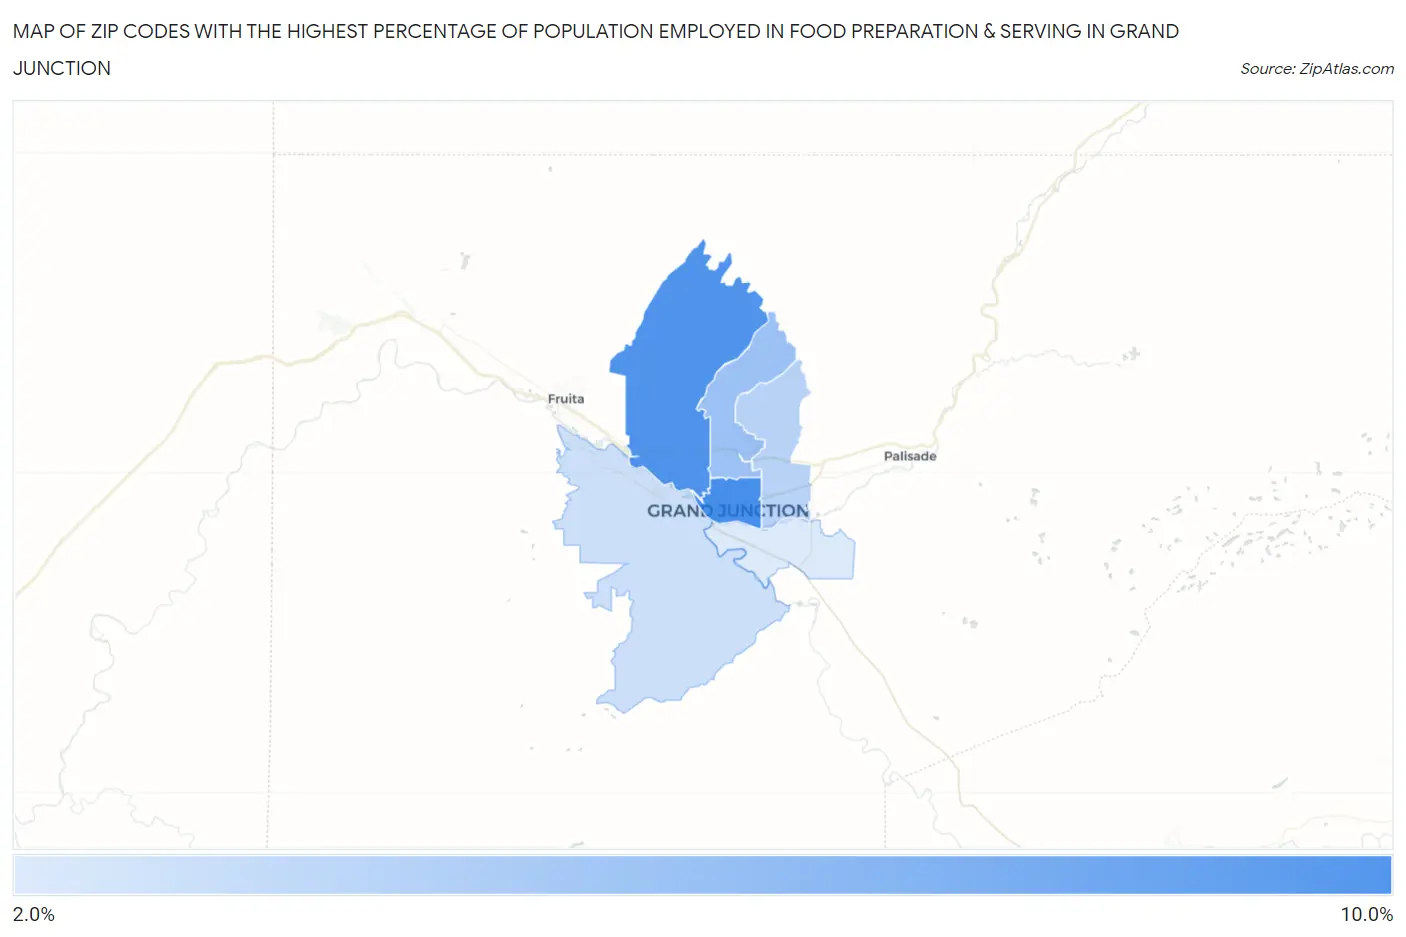
Map of Zip Codes with the Highest Percentage of Population Employed in Food Preparation & Serving in Grand Junction
0.0%
10.0%
Zip Codes with the Highest Percentage of Population Employed in Food Preparation & Serving in Grand Junction, CO
| Zip Code | % Employed | vs State | vs National | |
| 1. | 81501 | 8.3% | 5.2%(+3.10)#63 | 5.3%(+3.00)#4,336 |
| 2. | 81505 | 7.9% | 5.2%(+2.72)#75 | 5.3%(+2.62)#4,886 |
| 3. | 81506 | 4.9% | 5.2%(-0.273)#200 | 5.3%(-0.378)#13,310 |
| 4. | 81504 | 3.9% | 5.2%(-1.31)#270 | 5.3%(-1.42)#17,664 |
| 5. | 81507 | 3.1% | 5.2%(-2.08)#314 | 5.3%(-2.19)#20,862 |
| 6. | 81503 | 2.5% | 5.2%(-2.71)#351 | 5.3%(-2.82)#23,264 |
1
Common Questions
What are the Top 5 Zip Codes with the Highest Percentage of Population Employed in Food Preparation & Serving in Grand Junction, CO?
Top 5 Zip Codes with the Highest Percentage of Population Employed in Food Preparation & Serving in Grand Junction, CO are:
What zip code has the Highest Percentage of Population Employed in Food Preparation & Serving in Grand Junction, CO?
81501 has the Highest Percentage of Population Employed in Food Preparation & Serving in Grand Junction, CO with 8.3%.
What is the Percentage of Population Employed in Food Preparation & Serving in Grand Junction, CO?
Percentage of Population Employed in Food Preparation & Serving in Grand Junction is 6.2%.
What is the Percentage of Population Employed in Food Preparation & Serving in Colorado?
Percentage of Population Employed in Food Preparation & Serving in Colorado is 5.2%.
What is the Percentage of Population Employed in Food Preparation & Serving in the United States?
Percentage of Population Employed in Food Preparation & Serving in the United States is 5.3%.