Zip Codes with the Highest Percentage of Population Employed in Food Preparation & Serving in Aurora, CO
RELATED REPORTS & OPTIONS
Food Preparation & Serving
Aurora
Compare Zip Codes
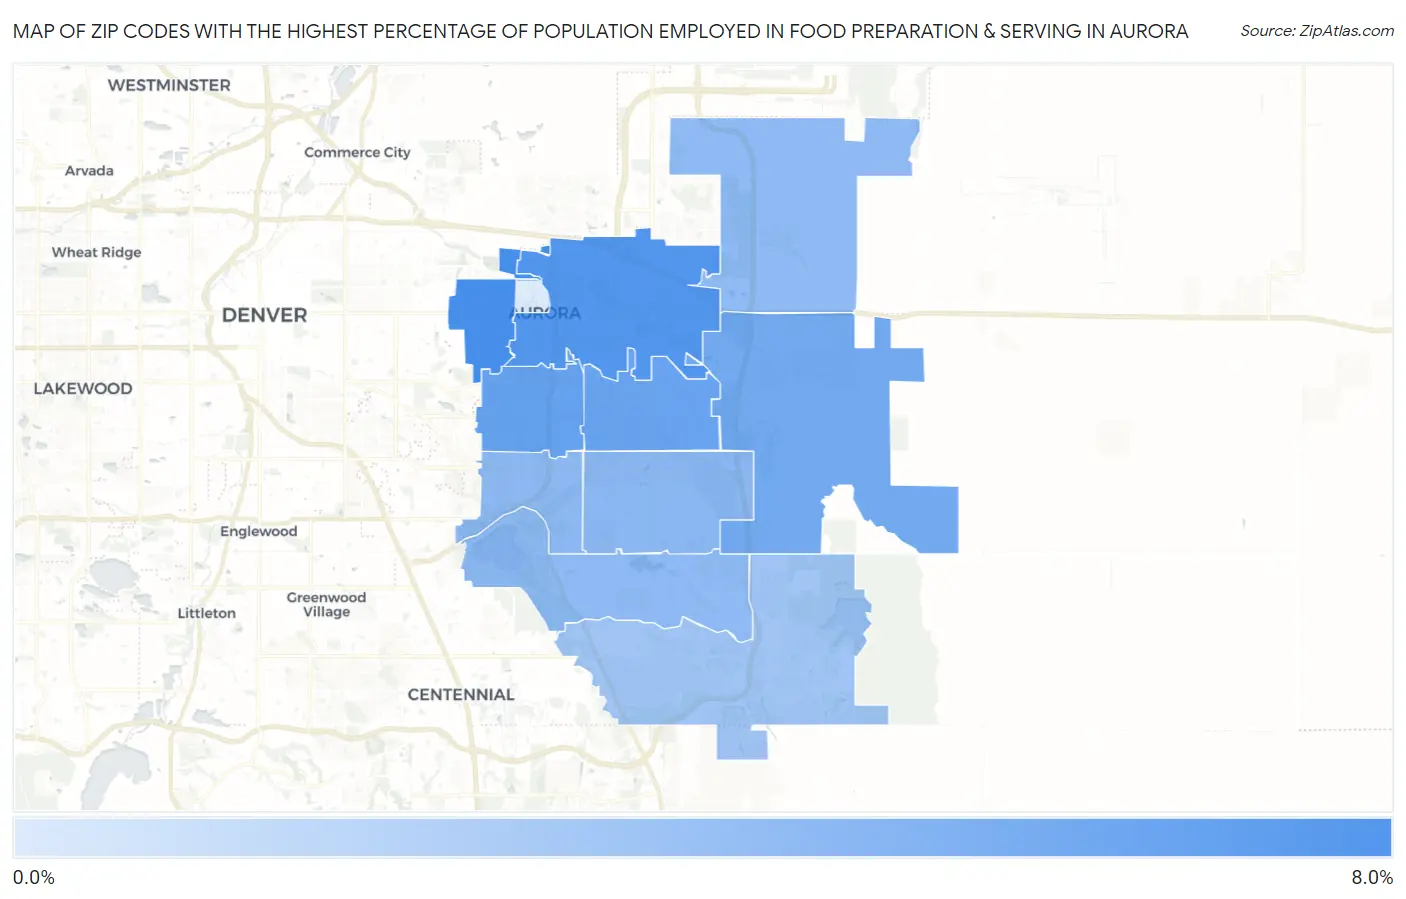
Map of Zip Codes with the Highest Percentage of Population Employed in Food Preparation & Serving in Aurora
0.0%
8.0%
Zip Codes with the Highest Percentage of Population Employed in Food Preparation & Serving in Aurora, CO
| Zip Code | % Employed | vs State | vs National | |
| 1. | 80010 | 7.6% | 5.2%(+2.43)#84 | 5.3%(+2.32)#5,362 |
| 2. | 80011 | 7.2% | 5.2%(+1.99)#93 | 5.3%(+1.88)#6,191 |
| 3. | 80012 | 6.4% | 5.2%(+1.24)#120 | 5.3%(+1.13)#8,091 |
| 4. | 80017 | 6.2% | 5.2%(+0.974)#128 | 5.3%(+0.870)#8,858 |
| 5. | 80018 | 5.9% | 5.2%(+0.679)#145 | 5.3%(+0.574)#9,819 |
| 6. | 80013 | 4.9% | 5.2%(-0.325)#206 | 5.3%(-0.430)#13,530 |
| 7. | 80014 | 4.8% | 5.2%(-0.374)#208 | 5.3%(-0.478)#13,729 |
| 8. | 80015 | 4.7% | 5.2%(-0.462)#215 | 5.3%(-0.566)#14,085 |
| 9. | 80019 | 4.7% | 5.2%(-0.474)#216 | 5.3%(-0.579)#14,128 |
| 10. | 80016 | 4.0% | 5.2%(-1.22)#262 | 5.3%(-1.32)#17,268 |
| 11. | 80045 | 1.6% | 5.2%(-3.59)#393 | 5.3%(-3.69)#25,772 |
1
Common Questions
What are the Top 10 Zip Codes with the Highest Percentage of Population Employed in Food Preparation & Serving in Aurora, CO?
Top 10 Zip Codes with the Highest Percentage of Population Employed in Food Preparation & Serving in Aurora, CO are:
What zip code has the Highest Percentage of Population Employed in Food Preparation & Serving in Aurora, CO?
80010 has the Highest Percentage of Population Employed in Food Preparation & Serving in Aurora, CO with 7.6%.
What is the Percentage of Population Employed in Food Preparation & Serving in Aurora, CO?
Percentage of Population Employed in Food Preparation & Serving in Aurora is 5.8%.
What is the Percentage of Population Employed in Food Preparation & Serving in Colorado?
Percentage of Population Employed in Food Preparation & Serving in Colorado is 5.2%.
What is the Percentage of Population Employed in Food Preparation & Serving in the United States?
Percentage of Population Employed in Food Preparation & Serving in the United States is 5.3%.