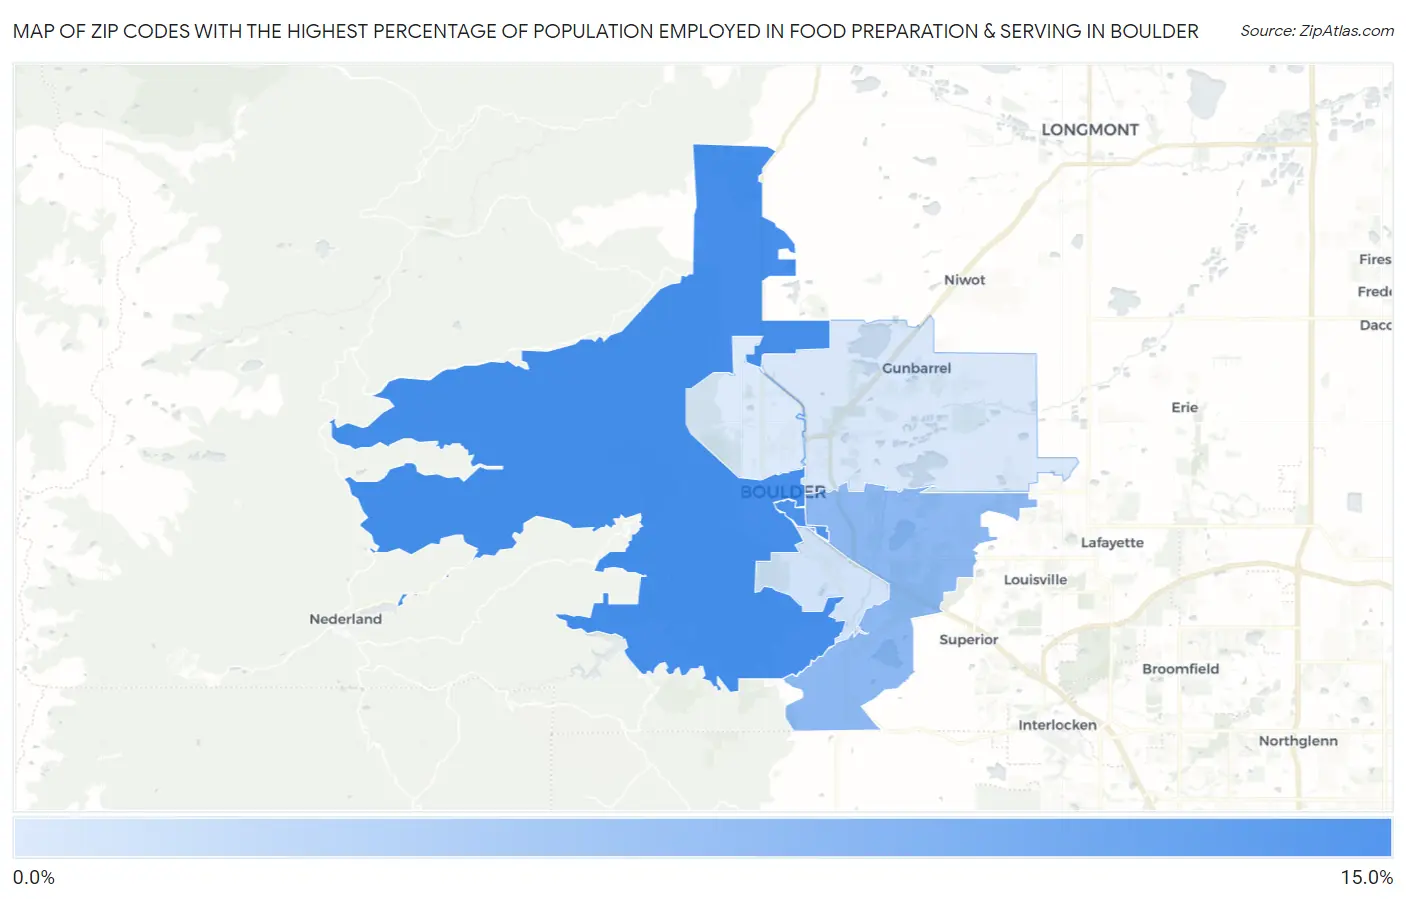
Zip Codes with the Highest Percentage of Population Employed in Food Preparation & Serving in Boulder, CO
RELATED REPORTS & OPTIONS
Food Preparation & Serving
Boulder
Compare Zip Codes
Map of Zip Codes with the Highest Percentage of Population Employed in Food Preparation & Serving in Boulder
0.0%
15.0%
Zip Codes with the Highest Percentage of Population Employed in Food Preparation & Serving in Boulder, CO
| Zip Code | % Employed | vs State | vs National | |
| 1. | 80302 | 14.8% | 5.2%(+9.58)#11 | 5.3%(+9.47)#1,016 |
| 2. | 80310 | 14.3% | 5.2%(+9.14)#13 | 5.3%(+9.03)#1,091 |
| 3. | 80303 | 9.7% | 5.2%(+4.56)#43 | 5.3%(+4.46)#2,845 |
| 4. | 80305 | 5.1% | 5.2%(-0.092)#185 | 5.3%(-0.196)#12,582 |
| 5. | 80301 | 4.6% | 5.2%(-0.579)#220 | 5.3%(-0.684)#14,584 |
| 6. | 80304 | 4.3% | 5.2%(-0.916)#241 | 5.3%(-1.02)#16,034 |
1
Common Questions
What are the Top 5 Zip Codes with the Highest Percentage of Population Employed in Food Preparation & Serving in Boulder, CO?
Top 5 Zip Codes with the Highest Percentage of Population Employed in Food Preparation & Serving in Boulder, CO are:
What zip code has the Highest Percentage of Population Employed in Food Preparation & Serving in Boulder, CO?
80302 has the Highest Percentage of Population Employed in Food Preparation & Serving in Boulder, CO with 14.8%.
What is the Percentage of Population Employed in Food Preparation & Serving in Boulder, CO?
Percentage of Population Employed in Food Preparation & Serving in Boulder is 9.5%.
What is the Percentage of Population Employed in Food Preparation & Serving in Colorado?
Percentage of Population Employed in Food Preparation & Serving in Colorado is 5.2%.
What is the Percentage of Population Employed in Food Preparation & Serving in the United States?
Percentage of Population Employed in Food Preparation & Serving in the United States is 5.3%.