Zip Codes with the Highest Percentage of Population Employed in Food Preparation & Serving in Brighton, CO
RELATED REPORTS & OPTIONS
Food Preparation & Serving
Brighton
Compare Zip Codes
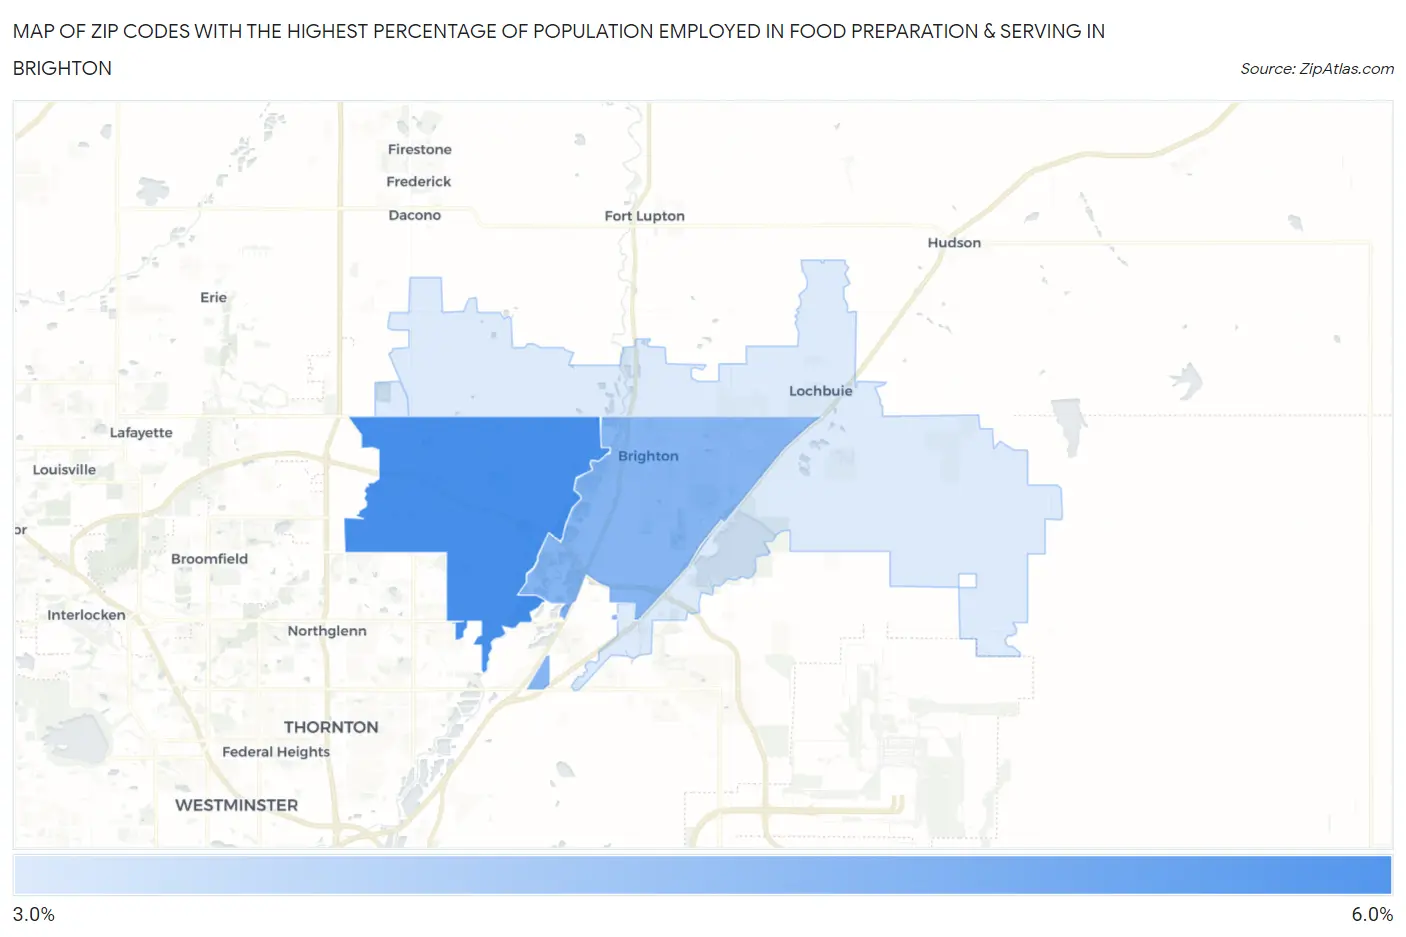
Map of Zip Codes with the Highest Percentage of Population Employed in Food Preparation & Serving in Brighton
0.0%
6.0%
Zip Codes with the Highest Percentage of Population Employed in Food Preparation & Serving in Brighton, CO
| Zip Code | % Employed | vs State | vs National | |
| 1. | 80602 | 5.1% | 5.2%(-0.108)#187 | 5.3%(-0.212)#12,637 |
| 2. | 80601 | 4.2% | 5.2%(-0.959)#244 | 5.3%(-1.06)#16,230 |
| 3. | 80603 | 3.0% | 5.2%(-2.18)#320 | 5.3%(-2.28)#21,237 |
1
Common Questions
What are the Top Zip Codes with the Highest Percentage of Population Employed in Food Preparation & Serving in Brighton, CO?
Top Zip Codes with the Highest Percentage of Population Employed in Food Preparation & Serving in Brighton, CO are:
What zip code has the Highest Percentage of Population Employed in Food Preparation & Serving in Brighton, CO?
80602 has the Highest Percentage of Population Employed in Food Preparation & Serving in Brighton, CO with 5.1%.
What is the Percentage of Population Employed in Food Preparation & Serving in Brighton, CO?
Percentage of Population Employed in Food Preparation & Serving in Brighton is 4.3%.
What is the Percentage of Population Employed in Food Preparation & Serving in Colorado?
Percentage of Population Employed in Food Preparation & Serving in Colorado is 5.2%.
What is the Percentage of Population Employed in Food Preparation & Serving in the United States?
Percentage of Population Employed in Food Preparation & Serving in the United States is 5.3%.