Zip Codes with the Highest Percentage of Population Employed in Administrative & Support Services in Grand Junction, CO
RELATED REPORTS & OPTIONS
Administrative & Support Services
Grand Junction
Compare Zip Codes
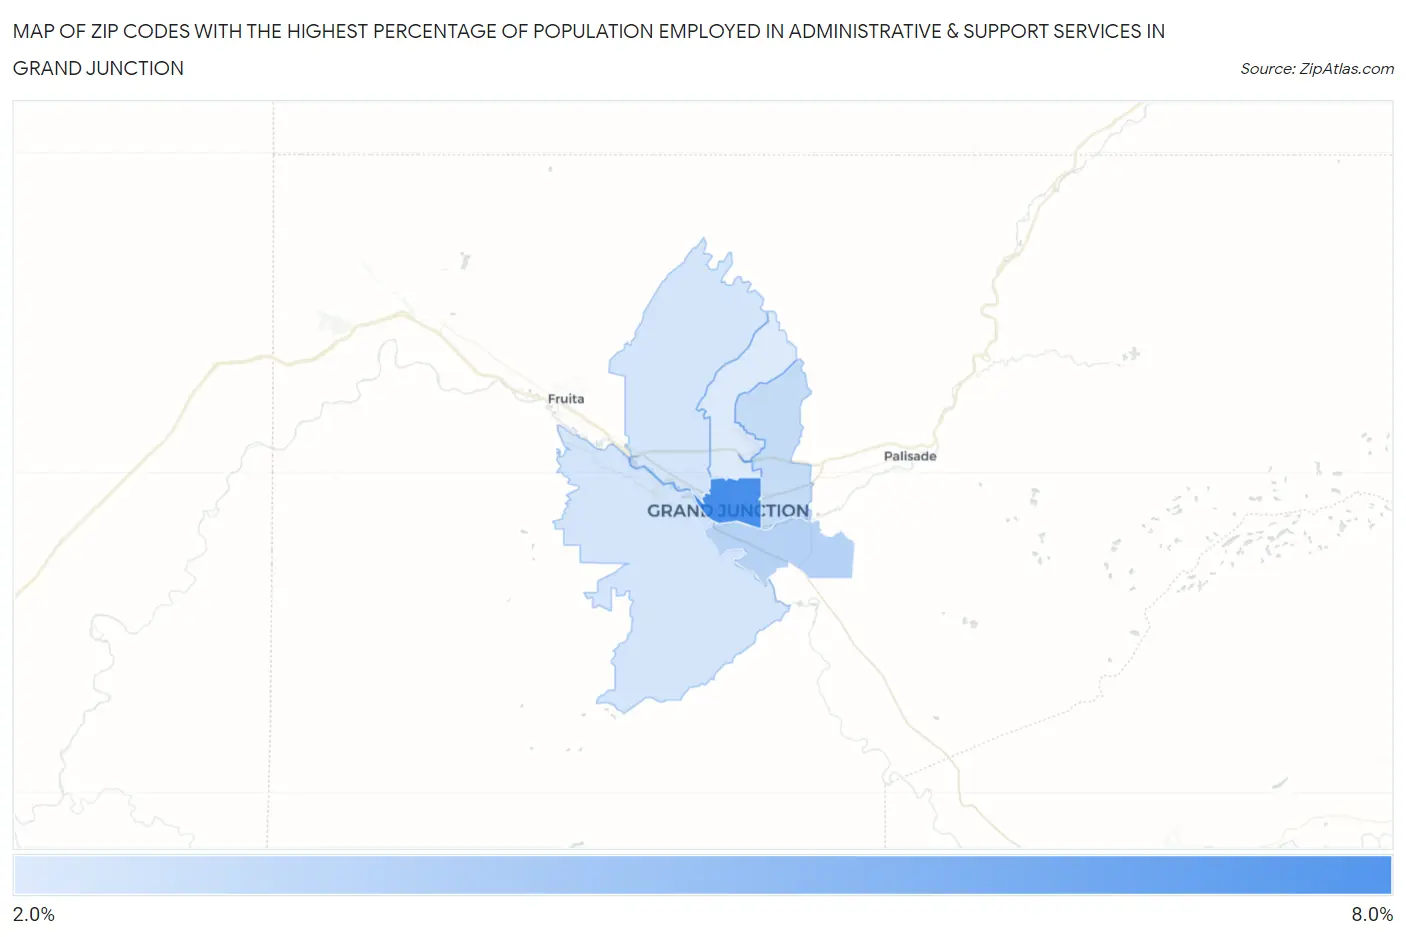
Map of Zip Codes with the Highest Percentage of Population Employed in Administrative & Support Services in Grand Junction
0.0%
8.0%
Zip Codes with the Highest Percentage of Population Employed in Administrative & Support Services in Grand Junction, CO
| Zip Code | % Employed | vs State | vs National | |
| 1. | 81501 | 6.4% | 4.1%(+2.36)#60 | 4.1%(+2.30)#3,999 |
| 2. | 81503 | 3.4% | 4.1%(-0.717)#208 | 4.1%(-0.776)#13,568 |
| 3. | 81504 | 3.0% | 4.1%(-1.11)#246 | 4.1%(-1.17)#15,589 |
| 4. | 81505 | 2.6% | 4.1%(-1.48)#277 | 4.1%(-1.54)#17,567 |
| 5. | 81507 | 2.6% | 4.1%(-1.53)#284 | 4.1%(-1.59)#17,819 |
| 6. | 81506 | 2.3% | 4.1%(-1.75)#301 | 4.1%(-1.81)#18,985 |
1
Common Questions
What are the Top 5 Zip Codes with the Highest Percentage of Population Employed in Administrative & Support Services in Grand Junction, CO?
Top 5 Zip Codes with the Highest Percentage of Population Employed in Administrative & Support Services in Grand Junction, CO are:
What zip code has the Highest Percentage of Population Employed in Administrative & Support Services in Grand Junction, CO?
81501 has the Highest Percentage of Population Employed in Administrative & Support Services in Grand Junction, CO with 6.4%.
What is the Percentage of Population Employed in Administrative & Support Services in Grand Junction, CO?
Percentage of Population Employed in Administrative & Support Services in Grand Junction is 3.8%.
What is the Percentage of Population Employed in Administrative & Support Services in Colorado?
Percentage of Population Employed in Administrative & Support Services in Colorado is 4.1%.
What is the Percentage of Population Employed in Administrative & Support Services in the United States?
Percentage of Population Employed in Administrative & Support Services in the United States is 4.1%.