Zip Codes with the Highest Percentage of Population Employed in Food Preparation & Serving in Crested Butte, CO
RELATED REPORTS & OPTIONS
Food Preparation & Serving
Crested Butte
Compare Zip Codes
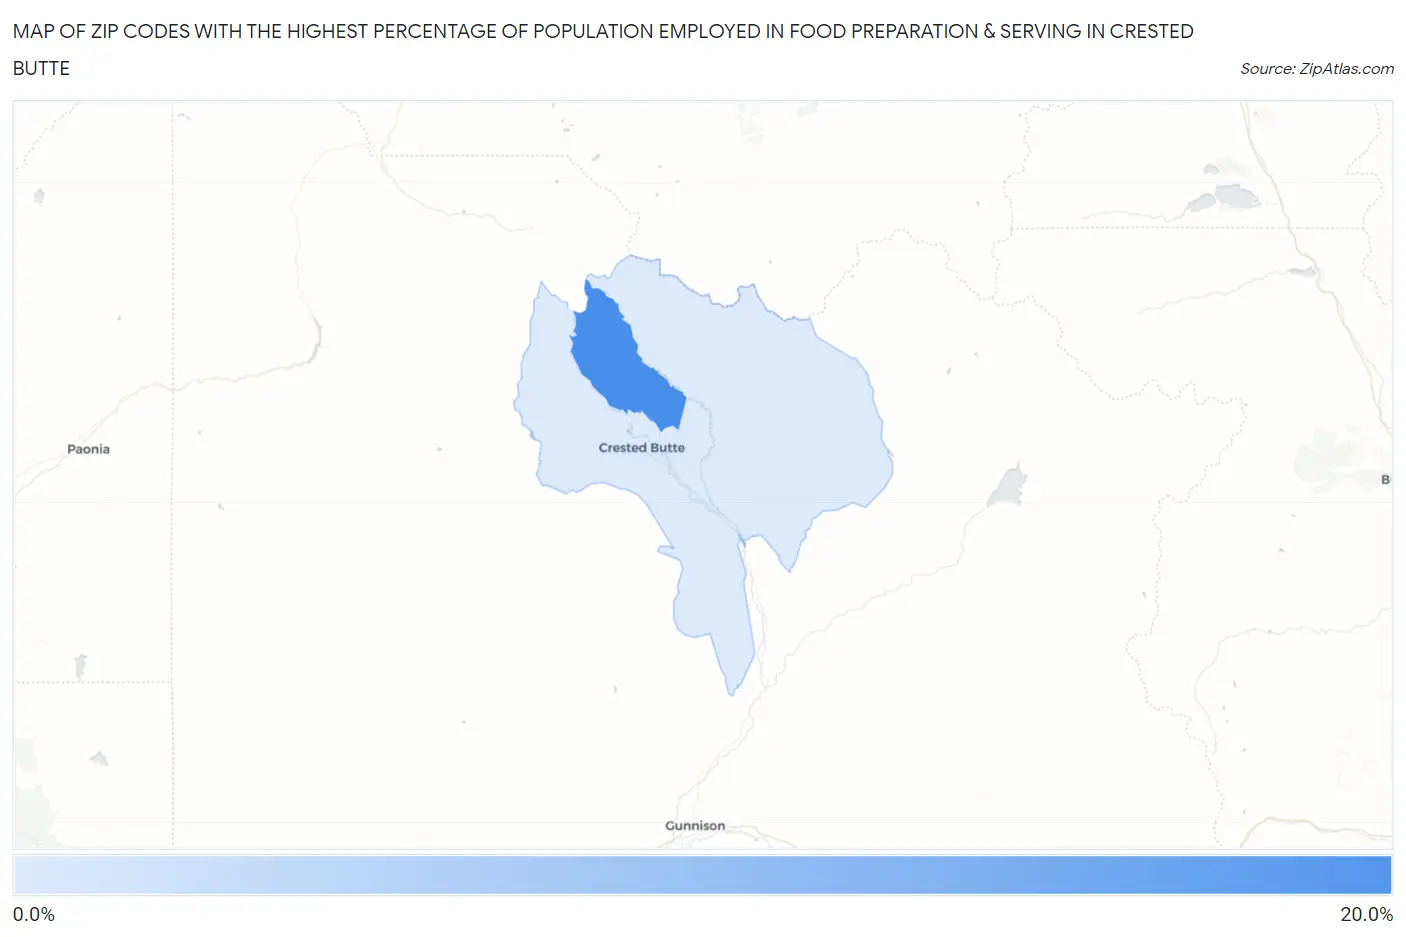
Map of Zip Codes with the Highest Percentage of Population Employed in Food Preparation & Serving in Crested Butte
0.0%
20.0%
Zip Codes with the Highest Percentage of Population Employed in Food Preparation & Serving in Crested Butte, CO
| Zip Code | % Employed | vs State | vs National | |
| 1. | 81225 | 16.2% | 5.2%(+11.0)#5 | 5.3%(+10.9)#839 |
| 2. | 81224 | 8.4% | 5.2%(+3.22)#60 | 5.3%(+3.11)#4,177 |
1
Common Questions
What are the Top Zip Codes with the Highest Percentage of Population Employed in Food Preparation & Serving in Crested Butte, CO?
Top Zip Codes with the Highest Percentage of Population Employed in Food Preparation & Serving in Crested Butte, CO are:
What zip code has the Highest Percentage of Population Employed in Food Preparation & Serving in Crested Butte, CO?
81225 has the Highest Percentage of Population Employed in Food Preparation & Serving in Crested Butte, CO with 16.2%.
What is the Percentage of Population Employed in Food Preparation & Serving in Crested Butte, CO?
Percentage of Population Employed in Food Preparation & Serving in Crested Butte is 11.0%.
What is the Percentage of Population Employed in Food Preparation & Serving in Colorado?
Percentage of Population Employed in Food Preparation & Serving in Colorado is 5.2%.
What is the Percentage of Population Employed in Food Preparation & Serving in the United States?
Percentage of Population Employed in Food Preparation & Serving in the United States is 5.3%.