Zip Codes with the Highest Percentage of Population Employed in Food Preparation & Serving in Montrose, CO
RELATED REPORTS & OPTIONS
Food Preparation & Serving
Montrose
Compare Zip Codes
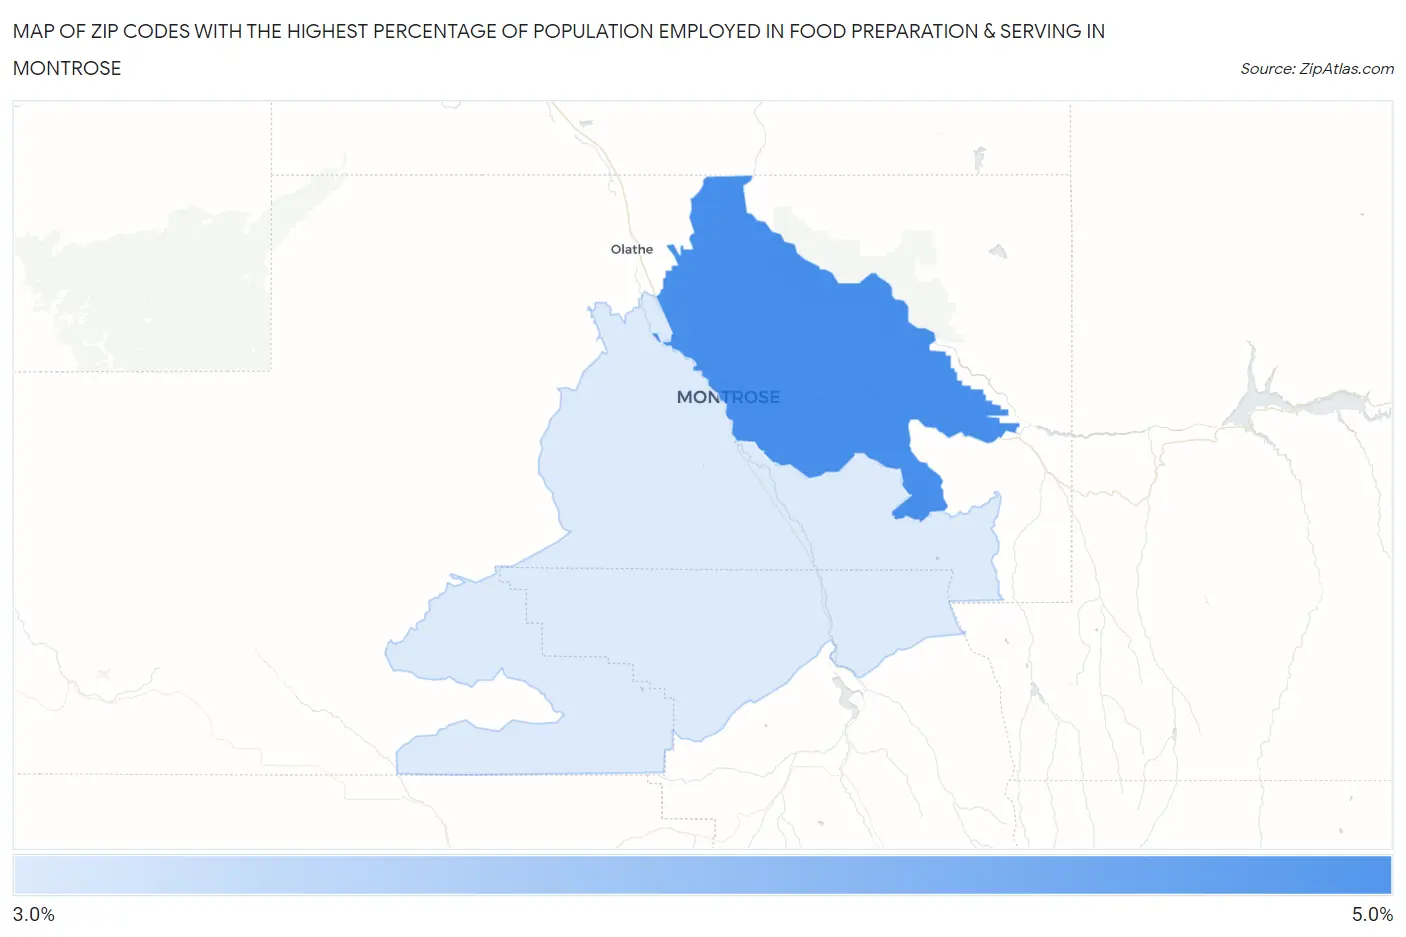
Map of Zip Codes with the Highest Percentage of Population Employed in Food Preparation & Serving in Montrose
0.0%
5.0%
Zip Codes with the Highest Percentage of Population Employed in Food Preparation & Serving in Montrose, CO
| Zip Code | % Employed | vs State | vs National | |
| 1. | 81401 | 4.1% | 5.2%(-1.04)#249 | 5.3%(-1.14)#16,521 |
| 2. | 81403 | 3.1% | 5.2%(-2.08)#315 | 5.3%(-2.19)#20,863 |
1
Common Questions
What are the Top Zip Codes with the Highest Percentage of Population Employed in Food Preparation & Serving in Montrose, CO?
Top Zip Codes with the Highest Percentage of Population Employed in Food Preparation & Serving in Montrose, CO are:
What zip code has the Highest Percentage of Population Employed in Food Preparation & Serving in Montrose, CO?
81401 has the Highest Percentage of Population Employed in Food Preparation & Serving in Montrose, CO with 4.1%.
What is the Percentage of Population Employed in Food Preparation & Serving in Montrose, CO?
Percentage of Population Employed in Food Preparation & Serving in Montrose is 3.6%.
What is the Percentage of Population Employed in Food Preparation & Serving in Colorado?
Percentage of Population Employed in Food Preparation & Serving in Colorado is 5.2%.
What is the Percentage of Population Employed in Food Preparation & Serving in the United States?
Percentage of Population Employed in Food Preparation & Serving in the United States is 5.3%.